
ARTICLE IN PRESS
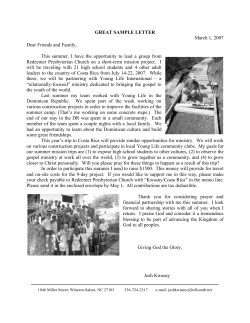
ECOLEC-03007; No of Pages 12
ARTICLE IN PRESS
EC OLOG IC AL ECONOM ICS XX ( 2008) XXX–X XX
a v a i l a b l e a t w w w. s c i e n c e d i r e c t . c o m
w w w. e l s e v i e r. c o m / l o c a t e / e c o l e c o n
Spatial targeting of payments for environmental services:
A tool for boosting conservation benefits
Tobias Wünscher a,⁎, Stefanie Engel b , Sven Wunder c
a
Center for Development Research (ZEF B), Walter-Flex-Str. 3, 53113 Bonn, Germany
Chair of Environmental Policy and Economics, Institute for Environmental Decisions, ETH Zurich,
Universitätstrasse 22, CHN K 76.3, CH-8092 Zurich, Switzerland
c
Centre for International Forestry Research (CIFOR), Brasil. Embrapa Amazônia Oriental,
Trav. Enéas Pinheiro s/n. CEP 66.095 — 780, Belém - Pará — Brazil
b
AR TIC LE I N FO
ABS TR ACT
Article history:
Payments for environmental services (PES) have become an increasingly popular market-
Received 15 December 2006
based instrument to translate external, non-market environmental services into financial
Accepted 12 November 2007
incentives for landowners to preserve the ecosystems that provide the services. However,
lack of spatial differentiation in the targeting mechanism may lead to efficiency losses.
Addressing this challenge, we construct an applied site selection tool, which takes into
Keywords:
account three variables that vary in space: environmental services provided, risks of losing
Conservation
those services, and participation costs. Using data from Costa Rica's Nicoya Peninsula, we
Spatial Analysis
empirically test the tool's potential to increase the financial efficiency of the forest-focused
Environmental Services
PES program in place. Results show that, given a fixed budget, efficiency increases radically
Targeting
if per hectare payments are aligned to landowners' heterogeneity in participation costs,
Costa Rica
involving opportunity, transaction and direct costs of protection, respectively. Selecting
sites based on environmental service potential also moderately increases efficiency. Overall
additionality could in the best case be doubled, but remains generally limited due to current
low deforestation risks prevailing in Costa Rica. To take advantage of the high efficiency
potentials of flexible payments, we propose inverse auction systems as a cost-effective
approach for the determination of micro-level participation costs.
© 2007 Elsevier B.V. All rights reserved.
1.
Introduction
Payments for environmental services (PES) have become an
increasingly popular market-based instrument to translate
external, non-market environmental services into financial
incentives for landowners to preserve the ecosystems that provide the services. We follow Wunder (2005) in defining PES as
a voluntary transaction where a well-defined environmental
service (or a land-use likely to secure that service) is being
bought by a minimum of one buyer from a minimum of one
provider if and only if the provider secures environmental
service provision. However, the self-selecting nature of volun-
tary participation in PES programs may result in contract allocations that add relatively little to service provision levels.
When the number of applications to participate in the PES
program exceeds available financing, the service buyer can select among applicant sites to maximize the program's financial
efficiency. We argue that conservation service buyers should
ideally distinguish the spatially variable level of (i) environmental service provision (benefits), (ii) risk of environmental
service loss (e.g. through deforestation), and (iii) landowner's
participation cost (sum of opportunity, transaction, and protection costs, which jointly determine the minimum payment
required for the landowner to participate).
⁎ Corresponding author. Fax: +49 228 731869.
E-mail addresses: [email protected] (T. Wünscher), [email protected] (S. Engel), [email protected] (S. Wunder).
0921-8009/$ – see front matter © 2007 Elsevier B.V. All rights reserved.
doi:10.1016/j.ecolecon.2007.11.014
Please cite this article as: Wünscher, T., et al., Spatial targeting of payments for environmental services: A tool for boosting
conservation benefits, Ecological Economics (2008), doi:10.1016/j.ecolecon.2007.11.014
ARTICLE IN PRESS
2
EC OLOG ICA L ECO N O M I CS XX ( 2008) X XX–X XX
While benefits and costs are widely acknowledged targeting criteria (e.g. Babcock et al., 1997; Ferraro, 2004; Barton et al.,
2003; Claassen et al., 2008-this issue), they are not fully
considered in most current PES schemes. Moreover, the risk
of service loss, here due to deforestation, deserves additional
attention. As Hartshorn et al. (2005, p.12) state, “paying for
forest protection on land that requires no protective measures
is an inefficient use of scarce conservation funds”. Wunder
(2005) argues that the future of PES largely depends on the
programs' ability to demonstrate clear additionality. Yet,
additionality is only provided if environmental services are
secured that otherwise would have been lost. Preliminary
evidence on Costa Rica's nationwide PSA 1 program, which is
the focus of our study, suggests that the program's additionality is low.2 Additionality is not a selection criterion in the
PSA program; it would pay all plots that provide environmental services if financial resources were available, irrespective of additionality (Pagiola, 2008-this issue). Accordingly,
Ortiz et al. (2003) find that 76.8% of the forest area under PSA
contracts would likely have been conserved or managed with
limited forest interventions in the absence of PSA. Hartshorn
et al. (2005) also find more than 70% of PSA forest protection
contracts to be on land with production capacities that only
allow forest management/protection (51%), or severely limited
agriculture (20%).3 Pfaff et al. (unpublished) find that annually
only 0.08% of the PSA contracted forest would have been
cleared in the absence of payments.4 Sierra and Russman
(2006) conclude that PSA has limited immediate effects on
forest conservation on the Osa Peninsula. Finally, at the
micro-scale Sills et al. (2006) detected statistically significant
but very small effects on land-use patterns between PSA and
non-PSA land.
Costa Rica's PSA program is implemented by the National
Fund for Forest Financing (FONAFIFO). It currently recognizes
four different activities as delivering forest environmental
services: (i) forest protection, (ii) timber-plantation establishment, (iii) natural forest regeneration, and (iv) agroforestry
system establishment. Between 1997 and 2005, most funds
(80.7%) were spent on forest protection which, because of its
dominance in the PSA program, is the focus of this study.
Forest protection payments (approx. US$40/ha/year until 2005,
and US$64/ha/year since 2006) are identical across the entire
country and attract applications for a land area much larger
than the program budget can pay for. For example, in 2006,
FONAFIFO's regional office in Nicoya received applications for
about 12,000 hectares (ha), but only had funds available for
2000 ha (J.A. Jiménez Fajardo, pers. comm., 2007).5 PSA
implementers currently base the selection of plots primarily
1
PSA (Pagos por Servicios Ambientales) refers to Costa Rica's
PES program.
2
For other examples of national PES programs which only
partially consider spatial differences see Muñoz-Piña et al. (2008this issue) on Mexico and Bennett (2008-this issue) on China.
3
Note that Hartshorn et al. (2005) refer to the number of
contracts while the more important unit would be area.
4
We assume here that deforestation is the only land-use
change factor affecting service provision. We discuss this
restrictive assumption in Section 7.
5
See Pagiola (2008-this issue) for a detailed description of the
Costa Rican PSA program.
on predefined priority areas. Site differentiation, therefore, is
limited to “inside” versus “outside” these areas. Although the
program aims to generate carbon, biodiversity, hydrologic and
scenic beauty services, no attempt is made to quantify the
delivery of these services. In summary, it appears that the
Costa Rican scheme could benefit significantly from improved
spatial targeting.
Babcock et al. (1997) classify targeting approaches for conservation programs into those that target (i) benefits, (ii) costs,
or (iii) benefit-to-cost ratios. Examples of benefit targeting
approaches are Powell et al. (2000) and Rodrigues et al. (2003),
conducting gap analyses to identify high-benefit priority areas
for biodiversity conservation, and Imbach (2005), targeting
multiple environmental service objectives and deforestation
probabilities. Chomitz et al. (2006) is an example of cost targeting where negative correlation between costs and biodiversity leads to low-cost/high-benefit solutions. Examples
of approaches targeting benefit-to-cost ratios are presented
in Ferraro (2003) and Barton et al. (2003). There are also approaches that target benefits and costs but not their ratio, e.g.
linear scoring functions that include costs as an element of
the scoring equation (Claassen et al., 2008-this issue) and nonparametric, multi-objective approaches like distance function
rankings (Ferraro, 2004).
We contribute to the targeting literature by presenting a
tool that targets benefit-to-cost ratios incorporating multiple
objectives and explicitly considering the risk of environmental
service loss as a spatial variable to determine benefit additionality. We build our approach on Imbach (2005), but employ
different assumptions for environmental service distribution,
partially different data (e.g. on deforestation probabilities)
and, most important, integrate micro-level participation costs.
Our approach comes closest to a recent study by Alix-Garcia
et al. (2005) on Mexico, who also examine cost–benefit targeting under consideration of deforestation risks.
Using data from Costa Rica's Nicoya Peninsula, we empirically test the potential of the targeting tool to boost the financial efficiency of the PSA program in terms of expected
additional environmental services (benefits) per dollar spent.
In addition, we also compare the results to those obtained
from partial consideration of targeting criteria. We use simple
targeting criteria with somewhat crude assumptions to
illustrate the general usefulness of the tool. For real-world
application, the data would need to be refined and complemented, for example by including available information on
species to elaborate biodiversity service estimates.
The tool addresses three kinds of possible inefficiencies in a
PES program, as described by Pagiola (in press): (i) the desired
land-use activity would be adopted even in the absence of payments; (ii) the payment is not high enough to lead to the socially
desirable land use; (iii) the payment encourages a land use with
positive externalities that are worth less than the cost. We address (i) by applying deforestation probabilities: a forest at low
risk of deforestation would provide less additionality if enrolled,
so the tool gives it a lower likelihood of being selected. We
address (ii) through flexible payments, aligned to landowner
participation costs. While we cannot guarantee that the additional service value is larger than its provision cost, we reduce
the likelihood of type (iii) inefficiency by selecting first the sites
with the largest service–cost ratio. To fully address (iii) would
Please cite this article as: Wünscher, T., et al., Spatial targeting of payments for environmental services: A tool for boosting
conservation benefits, Ecological Economics (2008), doi:10.1016/j.ecolecon.2007.11.014
ARTICLE IN PRESS
EC OLOG IC AL ECONOM ICS XX ( 2008) XXX–X XX
require a monetary valuation of site additionality. Because of
the difficulty of transferring existing benefit estimates to new
sites (e.g., Kirchhoff et al., 1997), we refrain from monetarization,
and apply instead a scoring technique. However, type (iii) inefficiency would be avoided if PES was allocated directly by a
service buyer with a defined marginal willingness to pay (expressed in dollars per score unit).
The remainder of the article proceeds as follows. In Section 2,
we describe the general concepts behind the site-selection
mechanism. We then present the study area and data (Section 3)
and define the simulated targeting approaches (Section 4). The
corresponding empirical results are presented in Section 5. In a
sensitivity analysis (Section 6), we test the stability of results.
Section 7 discusses the findings, while Section 8 gives overall
conclusions.
2.
Concept and definitions
The three principal variables (services, costs, and deforestation
risk) are represented by six main spatial data sets. Four of them
are used to estimate the levels of environmental services (hydrological services, biodiversity conservation, carbon sequestration, and landscape beauty services), while the others are used
to estimate deforestation probabilities and participation costs.
Each of the four services is measured in service-specific units
and so cannot be compared directly (see Section 3). Therefore, a
z-normalization was applied, yielding comparable scores with a
mean equal to zero and standard deviation and variance equal
to one (Hogg and Craig, 1978).6 The z-value normalization for
data sets where higher values are given priority over lower
values (e.g. slope) has the following formula:
zi ¼
xi meanðxÞ
S:D:ðxÞ
ð1Þ
with xi being the observed value of the ith pixel (30 meters). For
data sets where lower values are given priority over higher
values (e.g. distance of plots to existing or proposed protected
areas) the z-normalization has the following formula:
zi ¼
meanðxÞ xi
S:D:ðxÞ
ð2Þ
Additionality (e) is defined to be the product of environmental service provision (u), which equals the sum of z-values
for environmental services, and deforestation probability (r):
e ¼ u⁎r
ð3Þ
We assume that property owners are always willing to
participate if the per hectare PES payment (Cpayment ) exceeds
the sum of their per hectare opportunity (Copp), protection (Cp)
and transaction costs (Ct ).7 We define γi ∈ {0,1} as an indicator
variable reflecting participation:
gi ¼ 1 if
6
7
Copp þ Cp þ Ct bCpayment ; gi ¼ 0 otherwise
3
Opportunity costs refer to the difference in income between the most profitable land use (before PES) and forest
conservation. Protection costs relate to active forest-protection efforts (e.g. firebreaks, fencing off cattle). The landowners'
transaction costs are all residual PES-related landowner
expenses for contract establishment and maintenance (e.g.
travel expenses, information gathering, and external monitoring). We define the sum of these three cost elements as the
participation cost. If payment levels are flexible and aligned to
participation costs, we can establish individual site-specific
benefit–cost ratios.
3.
Study area and data
The PSA program is well established on the Nicoya Peninsula
in northwestern Costa Rica. During 2004 alone, FONAFIFO enrolled 181 plots with an area of 12,244 ha in the Tempisque
Conservation Area, an administrative unit which consists
mainly of the Nicoya Peninsula (FONAFIFO, 2004). Of these,
96.3% were enrolled for forest protection and the remaining
3.7% for the establishment of timber plantations.
A field survey with random sampling, interviewing 107
forest owners from a frame population of 4266 ranchers on
Nicoya Peninsula, was used to estimate opportunity, transaction, and protection costs (Wünscher, in press). Levels of environmental services and deforestation risks were determined
for the forests on these 107 sample sites, which contain 3736 ha
of forest. Fig. 1 shows the location of the sample sites. Ideal
estimation of environmental service delivery requires exceptionally complex and detailed data. We use simplifying assumptions to adapt estimates to demand and available data.
Our service estimates are presented below. Alternative simplified approaches for Costa Rica can be found, for example, in
Imbach (2005), Barton et al. (2003), and Tattenbach et al. (2006).
3.1.
Biodiversity services
We define biodiversity services here as contributions towards
the conservation of species communities in their natural
forest habitat. Forest conversion to other land uses destroys
natural habitat, causing the decline and, ultimately, extinction of forest-dwelling species. Forest biodiversity services
would ideally be estimated considering, among others,
species distribution, representation, minimum sustainable
population size and area requirements8 (e.g. Rodrigues et al.,
2003; Sanderson et al., 2003; Faith et al., 2001; Powell et al.,
2000).
Although biodiversity data has improved significantly in
recent years (Rodrigues et al., 2003), adequate data is still unavailable for many parts of the world. In our simplified estimation approach, we thus use habitat types (life zones) from
Holdridge (1967) as a surrogate for biodiversity. We measure
their current representation in the protected areas of Nicoya
ð4Þ
See Ferraro (2004) for alternative standardization techniques.
See Antle and Valdivia (2006) for a similar approach.
8
Other factors include irreplaceability, endemism and risk of
extinction, habitat quality, connectivity and protection status as
well as present and future threats including environmental,
demographic, and genetic stochasticity.
Please cite this article as: Wünscher, T., et al., Spatial targeting of payments for environmental services: A tool for boosting
conservation benefits, Ecological Economics (2008), doi:10.1016/j.ecolecon.2007.11.014
ARTICLE IN PRESS
4
EC OLOG ICA L ECO N O M I CS XX ( 2008) X XX–X XX
Fig. 1 – Additionality and location of interviewed properties on Nicoya Peninsula. Source: own data.
Peninsula, and set a target of protecting at least 20% of the area
of each life zone. Thus, the least represented life zones
received the highest conservation priority. The mean representation deficit within our sample sites is 12.8% (Table 1).9
Furthermore, we use connectivity as a selection criterion. We
measure the distance (in meters) to already existing protected
areas and conservation corridors on private land that were
proposed by the so-called GRUAS project (García, 1996). Plots
close to these areas are given priority, in order to increase
connectivity. The mean connectivity distance in the sample
sites is 3005 m (Table 1). The z-values for representation and
connectivity are combined to compute an aggregate mean zvalue for total biodiversity–service provision, giving equal
weight to the two sub-criteria.10
3.2.
Carbon services
We define carbon services of forest conservation as the
mitigation of carbon releases (carbon storage) through avoided
deforestation, which is not recognized by the Kyoto framework but is currently traded on voluntary carbon markets.
Ideal estimation of mitigation services would require information on the amount of stored carbon before and after land-use
change and the risk of land-use change occurring. For the
latter, we use the deforestation rate estimates by Pfaff and
9
Due to limited computing capacity our approach is static and
not iterative as, for example, the approach by Barton et al. (2003)
who consider the change of targeting parameters with every
selected parcel.
10
Weights could also be distributed differently, but for lack of a
clear weight preference we set them equal.
Sanchez-Azofeifa (2004). Lacking data on site specific forest
maturity, we assign each Holdridge lifezone a primary forest
per hectare amount of stored carbon, which overestimates
carbon storage in secondary forest. Life zone specific carbon
storage quantities are derived from data on biomass per
hectare (Imbach et al., 2005) assuming a carbon content of 50%
Table 1 – Descriptive statistics of variables in the Nicoya
Peninsula sample plots
Mean
Representation deficit
Holdridge Lifezone (%)
Distance to existing or
proposed PA (m)
Carbon storage (t)
Slope (%)
Water consumption
(liters/hour/ha)
Visibility (number
viewpoints)
Opportunity cost
(US$/ha/year)
Protection cost
(US$/ha/year)
5 year deforestation
probability (%)
Additionality
(service scores/ha)
Score (service score/ha)
WaterScore
(service score/ha)
Min.
Max.
S.D.
12.8
0.0
19.3
4.9
3005
0
9191
2154
126.2
3.8
16.2
94.0
0
0.0
135.8
68.5
208.4
9.4
8.7
45.0
9.0
0.0
30.0
7.4
56.09
−210.80
624.56
127.16
3.56
0.11
23.07
3.66
3.86
2.09
6.81
1.24
2.47
0.40
7.72
1.18
61.76
7.080
18.16
0.003
131.86
79.736
18.47
11.753
Note: n = 107.
Source: Own computations.
Please cite this article as: Wünscher, T., et al., Spatial targeting of payments for environmental services: A tool for boosting
conservation benefits, Ecological Economics (2008), doi:10.1016/j.ecolecon.2007.11.014
ARTICLE IN PRESS
EC OLOG IC AL ECONOM ICS XX ( 2008) XXX–X XX
(IPCC, 1996). We assume that, if deforested, land-use converts
to pasture with a biomass carbon storage of 5 tons of carbon
per hectare (tC/ha)11 (Rojas Molina, 2005). The crudely
estimated mean carbon storage potential of our sites is
126.2 tC/ha (Table 1).
3.3.
Hydrological services
We define hydrological services as the contribution of
conserved forests to the natural supply of freshwater.
Vegetation cover and soil management influence the interception, infiltration, storage, runoff, and evapotranspiration of
water. These properties, in turn, have different effects on the
three hydrological services: (i) total surface and groundwater
yields, (ii) seasonal distribution, and (iii) water quality (e.g.
sedimentation). The exact relation between forest cover and
these services is highly site-specific, and sometimes contested. Bruijnzeel (2004) concludes from a wide range of
available scientific evidence that (a) total annual yield
increases with the percentage of biomass removed, (b)
infiltration is reduced by deforestation and subsequent soil
degradation, thus often reducing dry-season flows; and (c) tree
cover may prevent surface erosion and shallow landslides.
Since total annual yield is of less concern in Costa Rica, we
focus on (b) and (c) as prospective hydrological benefits from
forest conservation. Our approach represents the interests of
groundwater users, who hold 36% of water concessions and
account for approximately 10% of total water volume used;
and it represents the interests of those who seek low silt
concentrations, including hydroelectric power stations, which
account for 70% of total utilized water volume (Fallas, 2006).12
Ideally, hydrological service estimation would require
information on site-specific soil characteristics, vegetation
cover, slope, distribution and intensity of precipitation, as
well as variable demand for different hydrological services. In
our simplified estimation, we use slope as a proxy for erosion
and sedimentation potential. Slope (%) was derived from an
elevation model, drawing on contour lines from the Digital
Atlas of Costa Rica 2004 (ITCR, 2004). Mean slope within the
sample sites is 3.8% (Table 1). Sites with steep slopes thus
receive higher forest conservation priority. Second, groundwater demand is determined using data by Imbach (2005)
which aggregates water consumption (private, agricultural,
and industrial) from all registered wells. Using an aquifer
map from the same study, we can calculate per hectare water
consumption for each aquifer. Water consumption from the
sample sites has a mean of 16.2 l/h/ha (Table 1). Sites with
high water use intensity will receive higher forest conservation priority. The z-values for slope and intensity of water use
are combined to compute an aggregate mean z-value for
hydrological services, giving equal weight to the two subcriteria.10
11
Carbon quantities vary depending on type and management of
pastures, including the number of trees. However, to ease the
analysis we work with a single average only.
12
Groundwater volume was estimated using data from Fallas
(2006).
3.4.
5
Scenic beauty
We define scenic beauty services as the contribution of
conserved forests to an aesthetically appreciated landscape.
Deforestation often deteriorates the landscape vista, and thus its
scenic beauty. Ideally, scenic beauty services would be measured
as a function of the composition of various landscape elements.
Thus, a specific plot's marginal contribution would depend on its
spatial relation to other landscape elements. Moreover, service
values would depend on the number of people who view the
landscape, and their individual level of appreciation. In our
simplified approach, we assume that (i) any loss of forest cover
reduces scenic beauty services, and that (ii) a plot's degree of
scenic contribution depends on its visibility. We calculated the
visibility of forest from hypothetical lookout points spaced in
equal distances along the national road network. The calculation
was based on a triangulated irregular network (TIN) elevation file
derived from ITCR (2004). Pixels within the 107 sample sites can
be seen from a mean of 9.0 viewpoints (Table 1).
3.5.
PES participation costs
As mentioned, participation costs consist of opportunity,
transaction, and protection costs. We calculated opportunity
costs focusing on pastures as the most likely alternative to
natural forest. Natural forest itself, we assume, produces no
commercial income. This is because logging and timber sales
from natural forests are prohibited by law, unless a management plan has been certified by Costa Rican authorities —
which in recent years has almost never occurred. Illegal
logging and timber transport are risky, and very few rule
violations seem to occur in the study area. Our data also show
that commercial benefits other than from timber commercialization are close to zero. Though prohibited, gradual land-use
change through the elimination of forest undergrowth and
smaller trees towards pasture with scattered shading trees is
locally somewhat more frequent. Thus, the opportunity cost
of maintaining forest is equal to the foregone optional net
income from pastures. This is likely to be a slight overestimation of opportunity costs for several reasons. First, we
are not considering the cost of land conversion. Second, we
calculate opportunity costs from average pasture profitability,
ignoring that forests are generally found on economically
marginal areas with lower potential pasture productivity.
Third, family labor is not deducted from opportunity costs,
assuming there is no readily available income alternative.
Fourth, even plots with negative net returns are still paid the
sum of their transaction and protection cost. Factors (i) to (iv)
thus increase participation cost estimates and weaken the
potential of flexible payments to increase PES program
efficiency. The mean per hectare net return of all properties
was found to be US$56.09 annually (Table 1).
On the Nicoya Peninsula, the great majority of PES
applications for small and medium sized land plots (b100 ha)
is processed by intermediaries (J.A. Jiménez Fajardo, pers.
comm., 2007), who handle all transactions such as paperwork,
consultancy, preparing technical studies, and supervision. For
these services, the intermediaries charge a maximum of 18%
of the current payment, i.e. US$7.20/ha (FONAFIFO, 2005),
which we use as an approximation for transaction costs.
Please cite this article as: Wünscher, T., et al., Spatial targeting of payments for environmental services: A tool for boosting
conservation benefits, Ecological Economics (2008), doi:10.1016/j.ecolecon.2007.11.014
ARTICLE IN PRESS
6
EC OLOG ICA L ECO N O M I CS XX ( 2008) X XX–X XX
Applications for large land plots (N100 ha) are normally given
to private forest engineers (regentes) who may offer lower per
hectare prices. For these land plots, we calculate a transaction
cost of 12%, i.e. US$4.80/ha.13 Finally, protection costs mainly
consist of establishing firebreaks, fencing off cattle and public
PES signposting. We estimate protection costs for every individual plot, based on our survey data.14 The mean protection
cost is US$3.56/ha/yr (Table 1).
water score is 26,432 (mean 7.1/ha). If the 107 sites were to be
compensated with their individual cost of PES participation,
total expenditure would amount to US$264,263, implying an
additionality efficiency of 34.9/US$1,000. The sample contains 57
sites (1309 ha) with per hectare participation costs smaller than
the fixed payment of US$40/ha.
4.
3.6.
We use an index for deforestation pressures estimated by Pfaff
and Sanchez-Azofeifa (2004). They econometrically calculated
an average annual deforestation rate (r) for different Holdridge
life zones within each district, based on forest clearing data
over time (1963, 1979, 1986, 1997, and 2000).15 We used r to
calculate deforestation probabilities for a period of 5 years (r5),
the usual duration of PES contracts in Costa Rica:16
r5 ¼ 1 ð1 rÞ5
ð5Þ
The mean of r5 of the 107 forest sites is 3.86% (Table 1).
Combining the five-year deforestation risk (r5) of pixel i with
its service score for biodiversity (bi), hydrology (wi), carbon (ci)
and scenic beauty (si), the pixel's additionality ei can be
estimated using Eq. (3), giving:
ei ¼ r5i ðbi þ wi þ ci þ li Þ
ð6Þ
As a neutral point of departure, Eq. (6) gives equal weight to all
four services. This could be changed. For instance, in the wake of
coming water user conservation fees (Pagiola, 2008-this issue),
increased weight might be given to water services in relevant
watersheds. An alternative approach could be to adjust weights
to the relative importance of different funding sources and the
services they are most interested in. Fig. 1 shows additionality on
Nicoya Peninsula. The conservation of lighter-shaded areas
provides less additionality than the conservation of darker areas.
The 107 sample sites deliver an overall environmental service
score of 230,563 (mean 61.8/ha) and, if put under PES protection,
would provide an additionality score of 9212 (4.0%) with a mean
additionality of 2.5 score units per hectare (Table 1). Their total
13
Targeting approaches
Deforestation risks
We maintain the absolute per hectare transaction costs
(instead of percentages) also for the flexible payment approach
giving “cheap” sites a comparable disadvantage in competing for
program entry.
14
Firebreak costs were taken directly from survey data. Fencing
costs were calculated multiplying per hectare fencing costs on
pasture with the factor 0.1818. Signposting costs were estimated
at US$5 every 50 hectares.
15
Note that Pfaff and Sanchez-Azofeifa (2004) do not differentiate between PES and non-PES sites. In theory, this may lead to an
underestimation of deforestation. We believe that this effect will
be small because (i) forest cover data goes back to well before the
implementation of PES in 1997 (thus PES may only have had a
risk-decreasing effect on the forest-cover data from 2000); (ii) the
ratio of PES forest (256,521 ha in 2000 (Ortiz, 2002)) to total forest
cover (2,557,370 ha in 1996/97 (Calvo et al., 1999) is relatively small
and high risk areas were not systematically targeted.
16
We tested the correlation of hazard rates by Pfaff and SanchezAzofeifa (2004) and our field data opportunity costs. Correlation
coefficients are not significant (Pearson 0.90, Spearman 0.76).
We compare eight different targeting approaches for choosing
among the group of 107 forest sites. Given an equal budget, the
results will show which of the approaches delivers most
additionality. An overview of the eight targeting approaches
and their main differences is given in the upper part of Table 2.
In the ‘Baseline’ approach, we follow the selection procedure currently employed by FONAFIFO. This means we select
all forest sites that (i) have a cost of participation smaller than
the fixed payment of US$40/ha, and (ii) lie within priority
areas.17 For comparability, the total computed expenditure in
the Baseline approach will also serve as the budget limit
(Cbudget ) in all other approaches.
The ‘FlexAdd’ approach is our main and most complete
targeting approach. It employs flexible payments and utilizes
information on service score and deforestation risk to compute additionality. Forest sites (j) with the highest ratio of total
additionality (ej) to total cost (Cj) are selected and total
additionality is maximized using:
Max
бi
n
X
бi ej
ð7Þ
i¼1
where бj ∈ {0,1} is an indicator variable which takes the value
of one if site j is selected and zero otherwise. The maximization is subject to the budget constraint:18
n
X
бj Cj VCbudget
ð8Þ
j¼1
Given our assumption that landowners participate as long
as they receive at least their participation cost, with flexible
payments it would be optimal for the implementing agency to
choose a level of payment just equal to (or marginally above)
participation costs. Thus, flexible payment levels are set equal
to participation costs here.
The ‘FlexScore’ approach is similar to the ‘FlexAdd’ approach
in that it employs flexible payments equal to participation costs.
But it only utilizes information on service score (ignoring deforestation threat) and selects sites with the highest ratio of total
score (uj) to Cj subject to budget constraint (8).
Max
бj
n
X
б j uj
ð9Þ
j¼1
17
As we determine farm location with a point, it may occur that
parts of it lie outside priority areas.
18
In all approaches (except Baseline) we maximize by manually
ranking plots from highest to lowest values of the selection
criterion (e.g. additionality/cost in FlexAdd approach) and selecting plots until budget is depleted.
Please cite this article as: Wünscher, T., et al., Spatial targeting of payments for environmental services: A tool for boosting
conservation benefits, Ecological Economics (2008), doi:10.1016/j.ecolecon.2007.11.014
ARTICLE IN PRESS
7
EC OLOG IC AL ECONOM ICS XX ( 2008) XXX–X XX
Table 2 – Results of targeting approaches (percentages of values compared to Baseline selection in brackets)
Payment
Budget limit
Selection
Criteria
Total cost (US$)
No. of sites
Area (ha)
Mean site size (ha)
Total WaterScore
Total Env. Service
Score
Total Additionality
Additionality/
1000$
Baseline
FlexAdd
FlexScore
FlexWater
Flex
FixAdd
FixScore
Fixed
No
Priority
Area
30,028 (100.00)
20 (100)
750.7 (100.0)
37.5 (100.0)
6,900 (100.0)
52,148 (100.0)
Flexible
Yes
Additionality/
cost
30,014 (99.95)
56 (280)
1350.2 (179.0)
24.1 (64.3)
10,301 (149.3)
94,829 (181.8)
Flexible
Yes
Score/cost
Flexible
Yes
Mean cost
30,000 (99.91)
68 (340)
1441.7 (192.0)
21.2 (56.5)
10,952 (158.7)
96,421 (184.9)
Fixed
Yes
Mean
additionality
30,016 (99.96)
37 (185)
750.4 (100.0)
20.3 (54.1)
8,591 (124.5)
57,156 (109.6)
Fixed
Yes
Mean score
29,997 (99.90)
62 (310)
1423.3 (189.6)
23.0 (61.3)
11,194 (162.2)
98,259 (188.4)
Flexible
Yes
Water
score/cost
30,016 (99.96)
44 (220)
1178.7 (157.0)
26.8 (71.5)
15,931 (230.9)
82,289 (157.8)
1969 (100.0)
65.6 (100.0)
4033 (204.8)
134.3 (204.7)
3909 (198.5)
130.3 (198.6)
3211 (163.1)
107.0 (163.1)
3798 (192.9)
126.6 (193.0)
2294 (116.5)
76.4 (116.5)
2253 (114.4)
75.1 (114.5)
FixWater
Fixed
Yes
Mean water
score
30,012 (99.95) 30,024 (99.99)
36 (180)
25 (125)
750.3 (99.0)
750.6 (100.0)
20.8 (55.5)
30.0 (80.0)
8,267 (119.8)
9,618 (139.4)
57,770 (110.8) 52,444 (100.6)
2088 (106.0)
69.5 (105.9)
Source: Own computations.
The ‘FlexWater’ approach is similar to the ‘FlexScore’
approach in that it employs flexible payments and utilizes
service scores, but it only uses scores for water services. It
selects the sites with the highest ratio of water score (uwj) to Cj
(10) and budget constraint (8) applies. The ‘FlexWater’
approach simulates a funding situation for water services
only. Other services are delivered as by-products.
Max
бj
n
X
бj ðuwi Þ
ð10Þ
j¼1
The ‘Flex’ approach employs flexible payments and simply
targets the “cheapest” sites with the lowest per hectare
participation costs (regardless of environmental services provided) until the budget is depleted (constraint 8 applies).
In the ‘FixAdd’ approach, a fixed payment of US$40/ha (Cfix)
is used. It uses information on service score and deforestation
risk to compute additionality. We select among the land plots
with Cj/ajbCfix (where aj is the size of plot j in hectares) those
with the highest mean additionality values (ēi) and maximize
total additionality (7) subject to the budget constraint:
n
X
бj aj Cfix VCbudget
ð11Þ
j¼1
In the ‘FixScore’ approach we proceed as in the ‘FixAdd’
approach, but ignore deforestation threats. Payments are
fixed, but we target the highest mean scores (ūj) subject to
budget constraint (11) and maximize using (9).
The ‘FixWater’ approach is similar to the ‘FixScore’ approach.
Payments are fixed but the sites with the highest mean water
scores (ūwj) are selected. Like the ‘FlexWater’ approach, the
‘FixWater’ approach simulates a funding situation for water
services only, with other services delivered as ‘by-products’.
5.
Results
Table 2 presents the principal results from the eight targeting
approaches. In the Baseline approach, 20 sites with a total area
of 750.7 ha are selected. Total payments equal US$30,028,
which also determines the budget for all other approaches.
The Baseline approach yields a total overall score of 52,148
and a total additionality of 1969, which translates into an
additionality efficiency of 65.6 per US$1000. The total water
score is 6900.
In each of the other approaches, total payments are almost
identical, but always slightly below those of the Baseline
because only entire sites can be selected, and hence small
parts of the budget remain unspent. Similarly, the contracted
area in the fixed payment approaches is almost identical.
However, in the flexible payment approaches it rises sharply,
by up to 192%. This is because average per hectare payments
are lower, although individual payments go up to US$61.95 in
the FlexScore approach, US$68.32 in the FlexAdd approach
and US$183.30 in the FlexWater approach.
All approaches achieve higher efficiencies (i.e., additionality per US$1000 spent) than the Baseline approach, independent of whether additionality, overall score, or water score was
targeted, but the degree to which efficiency increases differs. In
general, increases in the fixed payment approaches (by 6 to
17%) are not as high as in the flexible payment approaches
(increases of 63–105%) reflecting the dominance of cost-wise
payment differentiation. The main reason for this is the
considerable increase of contracted area in the flexible payment approaches. However, in some cases benefits increase
more than area. For example, in the FlexAdd approach area
increases by 79% while efficiency more than doubles, increasing by 105%). Therefore, the efficiency increase must have two
causes: (i) targeting low-cost sites and thus increasing area,
and (ii) targeting high additionality sites. To see how big the
latter effect is, we compare results of the FlexAdd and Flex
approach. We find that efficiency in the Flex approach, which
simply maximizes total area by allowing for flexible payments,
increased by 93%, compared to an increase of 105% in the
FlexAdd approach. The remaining 12% may thus be attributed
to targeting high additionality sites. Whether this relatively
small incremental efficiency gain justifies the more complex
targeting procedure of the FlexAdd approach is a subject that
requires debate. In general, whether a policy of simply
targeting the cheapest sites as in the Flex scenario leads to
desired outcomes depends on the variability and correlation of
Please cite this article as: Wünscher, T., et al., Spatial targeting of payments for environmental services: A tool for boosting
conservation benefits, Ecological Economics (2008), doi:10.1016/j.ecolecon.2007.11.014
ARTICLE IN PRESS
8
EC OLOG ICA L ECO N O M I CS XX ( 2008) X XX–X XX
the desired services and the costs of providing them. For
example, if only water services are of interest, the Flex
approach increases water score efficiency by 59% compared
to the Baseline approach, while targeting water services explicitly (in the FlexWater approach) yields an increase of 131%.
Even though efficiency is highest in the FlexAdd approach, it
can also be seen that efficiencies in the FixAdd (76.4) and
FlexAdd (134.3) approaches are only slightly superior to those in
the FixScore (75.1) and FlexScore (130.3) approaches, by 1.7% and
3.1%, respectively. The reason for this is the low variability of
deforestation rates (r5) within the sample sites, causing almost
identical selection results between the score and additionality
approaches. Additionality in the targeting approaches ranges
from 3.8% of total service score in the Baseline to 4.3% in the
FlexAdd. For example, the FixAdd selection has a total score of
57,156 and an additionality of only 2294, or 4.0%.
Compared to the Baseline approach, the FixWater and
FlexWater approaches are particularly successful in increasing
the water score, by 39% and 131%, respectively. While water
service acts here as an “umbrella service” which provides other
services as mere by-products19, the overall score and additionality for all four services also increase, though to a lesser degree
than in their counterpart multiple service targeting approaches.
This makes the water-based approaches interesting alternatives particularly when funding is obtained predominantly for
one service. In 2005, for example, Costa Rica added an earmarked watershed conservation fee to the existing water tariff.
Once fully implemented, this fee will generate an estimated US
$19 million annually, of which 25% would be channelled
through the PSA program (Pagiola, 2008-this issue).
We also observe that the Baseline approach contracts sites
with a mean size (37.5 ha) higher than any other approach (20.3–
30.0 ha).20-21 The selection tool's bias towards smaller parcels
thus made us ask whether this could imply increased participation of poorer households with less land available for program
enrolment. Using monthly household consumption data from
our survey as a proxy for wealth, we find that mean household
consumption in the Baseline is higher (index 2.7), though not
significantly, than in the other scenarios (index 2.4–2.5). This
rough indicator thus may suggests that the targeting tool tends
to select more lands belonging to poorer households. Higher
opportunity costs, tenure insecurity, lack of land titles, technical
constraints and transaction costs may be prime obstacles
obstructing poorer landowners' access to PES programs (Pagiola
et al., 2005). Our results suggest that some poorer landowners
can actually be more competitive service providers, providing
higher environmental benefits per monetary unit spent. Policy
19
See Turpie and Blignaut (2008-this issue) for an example of
how using water as an “umbrella service” can help achieve
conservation goals in South Africa.
20
The selection procedure of only allowing entire sites into the
program results in somewhat smaller means, compared to a
procedure allowing for the splitting of sites. However, we checked
the splitting procedure and found that average site sizes (22.7,
23.5, 31.3, 24.5, 25.2, 26.8 ha) also stay well below the Baseline
(37.5 ha).
21
Note that we did not consider per-contract transaction costs to
service buyers in the selection procedure. As these are likely to be
independent of land size, their consideration in the selection
procedure might discourage the inclusion of smaller sites.
measures to reduce obstacles like the ones mentioned above are
therefore justified not only on grounds of equity but also of
program efficiency. However, note that in the case of flexible
payments as presented here in the “Flex” approaches, payments
only just compensate participation costs, implying that
increased participation would not lead to increased welfare
and poverty alleviation.
6.
Sensitivity analysis
This analysis necessarily had to rely on relatively crude data
and sometimes arbitrary assumptions. To what extent do the
results remain stable if these assumptions were changed? To
answer this question, we conduct a sensitivity analysis, in
which we test how the selected sets of sites from the various
targeting approaches perform if spatial service distribution
differed due to alternative assumptions and scoring techniques. Imagine, for example, a situation where new data
change the previous assumptions about service distribution.
Our sensitivity analysis examines to what extent the
originally selected sites' service potential changes in terms
of total score and additional score (additionality). We change
our originally assumed multiple service distribution to four
alternative distribution scenarios (i–iv), in which (i) a zero
value for scenic beauty services is assumed for all sites,
(ii) biodiversity scores depend exclusively on the representativity criterion and not on connectivity, (iii) the distribution of
water services depends only on water use intensity and not
on slope, and (iv) in which all three of these variations are
combined. Moreover, for the single-service case, we examine
how the parcel selections of the water approaches perform in
terms of water score if assumptions about water distribution
change: in addition to the original water service distribution,
we now introduce distribution scenarios where only water
use intensity or slope are considered.
We also examine the impact of using different scoring
techniques. Instead of the z-normalization, we use an interval
normalization (Ferraro, 2004) returning values from zero to
one for each service and test how the originally selected sites
score if multiple services were measured in interval-normalized scores. For large values preferred to low values, the interval score (k) is computed as
ki ¼
xi minðxÞ
max ðxÞ min ðxÞ
ð12Þ
where x i is the observed value of a specific variable of pixel i,
min is the minimum and max the maximum value observed
within the sample. For small values preferred to large values
the normalization takes the form
ki ¼
xi maxðxÞ
min ðxÞ maxðxÞ
ð13Þ
The results of the sensitivity analysis are presented in
Table 3. There is no direct comparability between the
scenarios, because in each the entire scoring dimension
changes. We therefore compare the results of the Baseline
site selection in one service distribution scenario with the
results of other targeting approaches in the same scenario.
Please cite this article as: Wünscher, T., et al., Spatial targeting of payments for environmental services: A tool for boosting
conservation benefits, Ecological Economics (2008), doi:10.1016/j.ecolecon.2007.11.014
ARTICLE IN PRESS
9
EC OLOG IC AL ECONOM ICS XX ( 2008) XXX–X XX
For ease of comparison, the first column of Table 3 repeats
the results from Table 2 (only those for interval normalization
are new). In the results using z-normalized scores, a general
pattern can be observed throughout the alternative service
distribution scenarios: there is a low-to-moderate increase of
total score from the Baseline to the FixScore approach; total
score almost doubles in the FlexScore and stays slightly below
FlexScore levels in the Flex approach. When additionality is
derived by multiplying z-scores by deforestation risk, the
same pattern can be observed for the Baseline, FixAdd,
FlexAdd, and Flex approaches under all the alternative service
distribution scenarios. When interval-normalized scores are
used, the results also broadly follow this pattern, except that
some of the total scores in the Flex selections are slightly
higher than those in the FlexScore selection. We can conclude
from these observations that any of the proposed targeting
mechanisms increases bundled services also under changing
assumptions and scoring techniques. However, for the fixed
payment approaches the increases under some alternative
assumptions may be too low to justify the use of a complex
targeting system. Flexible payment approaches, on the other
hand, are found to be clearly dominant even under alternative
service distributions.
The water scores do not quite follow the above pattern.
Drastic water score differences between the Baseline and
FixWater approaches, as well as between the Flex and FlexWater approaches show the importance of well-defined
targets in the presence of high service variability as is the
case for water services. The bundling of service scores, on the
other hand, leads to spatially more evenly distributed services
with less variability and therefore have more robust results.
7.
Discussion
The flexible payment schemes were shown to yield the most
significant increase in environmental service delivery and
efficiency. In order to implement flexible payments in a PES
program, precise estimates of participation costs are required.
This study examined these costs in personal one-to-one
interviews, but this is costly, and could cause landowners to
answer strategically, thus producing biased estimates. One
possible, less costly approach is to use easily observable
spatial data as proxies for participation costs. The extent to
which such an approach is cost-effective depends largely on
how precisely it can estimate participation costs. Even if there
was a cost-effective method to determine monetary costs,
restricting the analysis to monetary values, as was done in
this study, fails to include the non-monetary attitudes of the
landowners, e.g. risk behaviour, mistrust, or conservation
preferences. These attitudes could influence the level of the
landowner's real willingness to accept (WTA).
Inverse auctions present an alternative that could take
such subjective attitudes into account. In principle, inverse
auctions aim to induce property owners to reveal their real
WTA. However, in practice this is not always achieved (see
Ferraro, 2008-this issue, for a detailed discussion). There are
examples of the successful use of auction systems in
Table 3 – Scoring results in the sensitivity analysis (percentages of values compared to Baseline selection in brackets)
Targeting approaches
Alternative service distribution scenarios
Initial
assumption
z-normalized scores
Baseline
FixScore
FlexScore
Flex
Basing biodiversity only
on representativity
Basing water only
on groundwater
Combing all
three changes
(100.0)
(110.8)
(188.4)
(184.9)
48,477
49,414
86,490
84,508
(100.0)
(101.9)
(178.4)
(174.3)
38,147
43,602
74,460
72,600
(100.0)
(114.3)
(195.2)
(190.3)
45,553
51,734
90,416
88,851
(100.0)
(113.6)
(198.5)
(195.0)
27,823
29,151
54,736
53,003
(100.0)
(104.8)
(197.7)
(190.5)
z-normalized additional scores (additionality)
Baseline
1969 (100.0)
FixAdd
2294 (116.5)
FlexAdd
4033 (204.8)
Flex
3798 (192.9)
1827
1928
3511
3317
(100.0)
(105.5)
(192.2)
(181.6)
1440
1762
3050
2873
(100.0)
(122.4)
(211.8)
(199.5)
1718
2074
3748
3514
(100.0)
(120.7)
(218.2)
(204.5)
1044
1173
2237
2104
(100.0)
(112.4)
(214.3)
(201.5)
14,412
14,470
26,448
26,251
(100.0)
(100.4)
(183.5)
(182.1)
13,197
14,280
25,927
26,002
(100.0)
(108.2)
(196.5)
(197.0)
14,859
16,039
28,715
28,566
(100.0)
(107.9)
(193.2)
(192.2)
12,104
12,421
23,358
23,419
(100.0)
(102.6)
(193.0)
(193.5)
Interval normalized-scores
Baseline
FixScore
FlexScore
Flex
Water-only scenarios
52,148
57,770
98,259
96,421
Omitting scenic
beauty
15,182
16,185
28,866
28,700
(100.0)
(106.6)
(190.1)
(189.0)
Initial assumption
z-normalized scores for water services only
Baseline
6900
FixWater
9618
FlexWater
15,931
Flex
10,952
(100.0)
(139.4)
(230.9)
(158.7)
Basing water only on groundwater
331
2312
9190
3430
(100.0)
(698.5)
(2776.4)
(1036.3)
Basing water only on slope
9648
12,223
13,909
13,020
(100.0)
(126.7)
(144.2)
(135.0)
Source: Own computations.
Please cite this article as: Wünscher, T., et al., Spatial targeting of payments for environmental services: A tool for boosting
conservation benefits, Ecological Economics (2008), doi:10.1016/j.ecolecon.2007.11.014
ARTICLE IN PRESS
10
EC OLOG ICA L ECO N O M I CS XX ( 2008) X XX–X XX
developed countries such as the United States (e.g. Claassen et
al., 2008-this issue), but no such examples exist for developing
countries. Technically, it appears that an auction system could
easily be integrated into most currently practiced PES programs.
If landowners have to apply formally for program participation
(as is the case in Costa Rica's PSA Program), their bid could be
part of the application process. Auction systems might also be a
powerful way of making payment differentiation politically
acceptable, because service sellers suggest the price themselves. The applicability, impediments, and challenges of
auction systems for PES programs in developing countries
certainly deserve further attention in future research (Ferraro,
2008-this issue).
Our proposed targeting mechanism would increase the
service buyer's transaction costs — a factor not considered in
the above. In Costa Rica, FONAFIFO's transaction costs are
limited by law, implying that increasing transaction costs
would require savings elsewhere. There are two main sources
of incremental transaction costs associated with our suggested targeting approach: (i) changes in administrative
processes; and (ii) the cost of creating and maintaining the
targeting tool itself. For (i), we identify two significant changes:
First, site coordinates of all applicant sites have to be fed into
the selection tool. As digitization is already undertaken for all
approved sites (755 in 2005, FONAFIFO, 2006), this only
imposes additional costs for rejected sites — about 1510,
assuming there are about three times more applications than
signed contracts (E. Ortiz, pers. comm., 2004). At a labor cost of
US$50/day, we estimate the additional costs to be about US
$2,400/year. Second, the new targeting approach would
change the seasonal workload distribution, because applications can only be fully processed after the site selection is
completed. Theoretically, this should not impose additional
costs, and is thus not specifically considered here.22 Regarding
(ii), we estimate that tool creation, maintenance, data update,
and continued data improvement could be realized by a fulltime GIS expert with an annual gross salary of about US$30,000
and overhead and equipment costs of around US$10,000.23
Total additional transaction costs should therefore be less
than US$42,500/yr. For 2006, the program's total budget was
US$15.22 million, including a politically determined administrative budget of US$1.12 million (MINAE, 2006). Thus the
estimated cost for the proposed targeting mechanism would
represent 0.28% of the total budget and 3.8% of the administrative budget. If we assume that actual environmental service
payments budgeted for 2006 (US$ 14.1 million) reflect a
minimum valuation of the services delivered, an efficiency
increase of e.g. 14.4% in the FixScore approach would
correspond to an increase of services of US$2.0 m (relative to
Baseline efficiency). The cost-effectiveness of using the new
tool therefore seems to stand beyond any doubt.
Since 2006, the PSA program also includes payments for the
retirement of agriculturally used land for natural forest regrowth. The tool could also help target regeneration contracts.
To do so, it would need probability estimates on the likelihood
of land retirement in the absence of PES. This retirement
process can be observed in areas with decreasing productivity,
increasing input prices, or decreasing product prices. In the
presence of land abandonment, the additionality of a PES
program then does not only depend on avoided deforestation
through PES, but also on induced land retirement through
PES.
8.
Conclusions
Using data from the Nicoya Peninsula, we showed that the
financial efficiency of PES programs like Costa Rica's PSA
program could potentially be substantially increased by using
a targeting process that integrates spatial data rather than a
targeting system based solely on priority areas. All the
targeting approaches considered led to higher efficiency
outcomes, compared to the Baseline approach. However, the
spatial attributes (benefits, risks, and costs) contribute very
differently to the efficiency increase: While the integration of
environmental service scores led to moderate efficiency
increases, the integration of participation costs boosted
efficiency significantly, largely due to lower average payments
and, consequently, greater total contracted area. The use of
deforestation probabilities, on the other hand, barely
improved efficiency in this case, as this attribute shows little
variation between sites in the study region. Nevertheless, in
each country or region the potential efficiency impact of each
spatial attribute depends largely on its variation in space and
its correlation to other attributes, which may differ across
regions and also with scale. Deforestation rates, for example,
might be the key criterion in countries or regions with higher
and regionally more variable deforestation threats than
observed in Costa Rica.
Watershed protection is often the only fund-generating
environmental service and may therefore, in practice, often
function as an ‘umbrella service’. Focusing selection on water
services only, gave water services a sharp increase and the
overall environmental service efficiency considerably
increased in the flexible payment approaches — though to a
far lesser extent than in the multiple service approaches.
Hence, if multiple service provision is the goal, the water-only
selection cannot compete with the integrated service-selection approaches. However, if water users are the only service
buyers, a single-service focus is a legitimate option that still
offers some side benefits.
Acknowledgments
22
FONAFIFO used to process all applications at once, but
switched to a rolling process which more evenly distributes
workloads. We acknowledge that FONAFIFO might not agree with
our view on cost neutrality.
23
The initial costs of tool creation might be much higher, but
this cost could probably be supported by a donor, and so is
possibly less of a constraint than the increase in annual operating
costs.
We thank the Robert-Bosch-Foundation for project funding,
the Center for Agricultural Tropical Research and Education
(CATIE) in Costa Rica for an excellent working base, Pablo
Imbach for kindly providing selected GIS data and his valuable
support in data processing, Alexander Pfaff for the kind provision of deforestation data and regression results. We also wish
Please cite this article as: Wünscher, T., et al., Spatial targeting of payments for environmental services: A tool for boosting
conservation benefits, Ecological Economics (2008), doi:10.1016/j.ecolecon.2007.11.014
ARTICLE IN PRESS
EC OLOG IC AL ECONOM ICS XX ( 2008) XXX–X XX
to thank Stefano Pagiola and two anonymous reviewers for
their comments which have contributed significantly to improving the paper.
REFERENCES
Alix-Garcia, J., de Janvry, A., Sadoulet, E., 2005. The role of risk in
targeting payments for environmental services. Social Science
Research Network (SSRN). Available September 2007 at http://
ssrn.com/abstract=836144.
Antle, J.M., Valdivia, R.O., 2006. Modelling the supply of
ecosystem services from agriculture: a minimum-data
approach. Australian Journal of Agricultural and Resource
Economics 50 (1), 1–15.
Babcock, B.A., Lakshminarayan, P.G., Wu, J., Zilberman, D., 1997.
Targeting tools for the purchase of environmental amenities.
Land Economics 73 (3), 325–339.
Barton, D.N., Faith, D., Rusch, G., Gjershaug, J.O., Castro, M., Vega, M.,
Vega, E., 2003. Spatial prioritisation of environmental service
payments for biodiversity protection. Report SNR 4746/2003.
NIVA (Norwegian Institute for Water Research), Norway. 64 pp.
Bennett, M., 2008-this issue. China's sloping land conversion
program: institutional innovation or business as usual?
Ecological Economics. doi:10.1016/j.ecolecon.2007.09.017.
Bruijnzeel, L.A., 2004. Hydrological functions of tropical forests, not
seeing the soil for the trees? In: Tomich, T.P., van Noordwijk, M.,
Thomas, D.E. (Eds.), Environmental Services and Land Use
Change: Bridging the Gap between Policy and Research in
Southeast Asia. Agriculture, Ecosystems & Environment, 104(1),
pp. 185–228.
Calvo, J.C., Watson, V., Bolaños, R., Quesada, C., Sánchez, A.,
González, P., Ramírez, M., 1999. Estudio de Cobertura Forestal
de Costa Rica Empleando Imágenes Lansat 1986/87 y 1996/97.
Presented at: XI Congreso Nacional Agronómico, Costa Rica.
Chomitz, K.M., Da Fonseca, G.A.B., Alger, K., Stoms, D.M., Honzák,
M., Landau, E.C., Thomas, T.S., Wayt Thomas, W., Davis, F.,
2006. Viable reserve networks arise from individual
landholder responses to conservation incentives. Ecology and
Society 11 (2), 40.
Claassen, R., Cattaneo, A., Johansson, R., 2008-this issue.
Cost-effective design of agri-environmental payment programs:
U.S. experience in theory and practice. Ecological Economics.
doi:10.1016/j.ecolecon.2007.07.032.
Faith, D.P., Margules, C.R., Walker, P.A., Stein, J., Natera, G., 2001.
Practical application of biodiversity surrogates and percentage
targets for conservation in Papua New Guinea. Pacific
Conservation Biology 6, 289–303.
Fallas, J., 2006. Identificación de Zonas de Importancia Hídrica y
Estimación de Ingresos por Cantón de Aguas para Cada Zona.
FONAFIFO, San Jose, Costa Rica.
Ferraro, P.J., 2003. Conservation contracting in heterogenous
landscapes: an application to watershed protection with
threshold constraints. Agricultural and Resource Economics
Review 32 (1), 53–64.
Ferraro, P.J., 2004. Targeting conservation investments in
heterogeneous landscapes — a distance function approach and
application to watershed management. American Journal of
Agricultural Economics 86 (4), 905–918.
Ferraro, P.J., 2008-this issue. Asymmetric information and contract
design for payments for environmental services. Ecological
Economics. doi:10.1016/j.ecolecon.2007.07.029.
FONAFIFO (Fondo Nacional de Financiamiento Forestal), 2004.
Letter from Ing. Jose Angel Jiménez Fajardo, director of the
regional FONAFIFO office in Nicoya, Costa Rica, to the director
of the Tempisque Conservation Area, Emel Rodriguez Paniagua. Written 12/13/2004, received 12/13/2004.
11
FONAFIFO (Fondo Nacional de Financiamiento Forestal), 2005.
Manual de Procedimiento para el Pago de Servicios Ambientales
2005. FONAFIFO, Costa Rica. 68 pp.
FONAFIFO (Fondo Nacional de Financiamiento Forestal), 2006.
Distribución de las Hectáreas y Árboles Contratadas en Pago de
Servicios Ambiéntales, por Año y por Modalidad, en el Periodo
1997–2006. FONAFIFO. Available September 2007 at: http://
www.fonafifo.com/text_files/servicios_ambientales/
distrib_ha_Contratadas.pdf.
García, R., 1996. Propuesta Técnica de Ordenamiento Territorial
con Fines de Conservación de Biodiversidad: Proyecto GRUAS.
Ministerio del Ambiente y Energía (MINAE) and Sistema
Nacional de Áreas de Conservación (SINAC). Ministerio del
Ambiente y Energia (MINAE) and Sistema Nacional de Áreas de
Conservación (SINAC), Costa Rica. 110 pp.
Hartshorn, G., Ferraro, F., Spergel, B., 2005. Evaluation of the World
Bank — GEF Ecomarkets Project in Costa Rica. Worldbank,
Washington DC.
Hogg, R., Craig, A.T., 1978. Introduction to Mathematical Statistics.
MacMillan Publishing Co, New York.
Holdridge, L.R., 1967. Life Zone Ecology. Tropical Science Center,
San Jose, Costa Rica.
Imbach, P., 2005. Priority Areas for Payment for Environmental
Services (PES) in Costa Rica. Centro Agronómico Tropical de
Investigación y Enseñanza (CATIE), Turrialba, Costa Rica.
Imbach, P., Coto, O., Salinas, Z., 2005. Valoración de los Residuos
Biomásicos en Costa Rica Usando Sistemas de Información
Geográfica. Centro Agronómico Tropical de Investigación y
Enseñanza (CATIE), Turrialba, Costa Rica.
IPCC (Intergovernmental Panel on Climate Change), 1996. Guidelines
for National Greenhouse Gas Inventories: Workbook (Volume 2),
Revised Version 1996. UNEP, WMO.
Kirchhoff, E., Colby, B.G., LaFrance, J.T., 1997. Evaluating the
performance of benefit transfer: an empirical inquiry.
Journal of Environmental Economics and Management
33 (1), 75–93.
MINAE (Ministerio de Medio Ambiente y Energía), 2006. Decreto
33226. La Gaceta N° 141, July 21st 2006. MINAE, Costa Rica.
Muñoz-Piña, C., Guevara, A., Torres, J.M., Braña, J., 2008-this issue.
Paying for hydrological services of mexico's forests: analysis,
negotiations and results. Ecological Economics. doi:10.1016/
j.ecolecon.2007.07.031.
Ortiz, E., 2002. Sistema de Cobro y Pago por Servicios Ambientales en
Costa Rica. Serie de Apoyo Académico 34. Escuela de Ingeniería
Forestal. Instituto Tecnológico de Costa Rica (ITCR), Costa Rica.
Ortiz, E., Sage Mora, L.F., Borge Carvajal, C., 2003. Impacto del
Programa de Pago por Servicios Ambientales en Costa Rica
como Medio de Reducción de la Pobreza en los Medios Rurales.
RUTA, San José, Costa Rica.
ITCR (Instituto Tecnológico de Costa Rica), 2004. Atlas Digital de
Costa Rica. Escuela de Ingeniería Forestal. ITCR, Costa Rica.
Pagiola, S., 2008-this issue. Payments for environmental services in
Costa Rica. Ecological Economics. doi:10.1016/j.ecolecon.2007.07.033.
Pagiola, S., in press. Assessing the efficiency of payments for
environmental services programs. World Bank, Washington.
Pagiola, S., Arcenas, A., Platais, G., 2005. Can payments for
environmental services help reduce poverty? An exploration of
the issues and the evidence to date from Latin America. World
Development 33 (2), 237–253.
Pfaff, A., Sanchez-Azofeifa, G.A., 2004. Deforestation pressure and
biological reserve planning: a conceptual approach and an
illustrative application for Costa Rica. Resource and Energy
Economics 26, 237–254.
Pfaff, A., Robalino, J.A., Sánchez-Azofeifa, G.A., unpublished.
Payments for Environmental Services: Empirical Analysis for
Costa Rica. Working paper presented on January 5th 2007 at
Swiss Federal Institute of Technology, Switzerland.
Powell, G.V.N., Barborak, J., Rodriguez, M., 2000. Assessing
representativeness of protected natural areas in Costa Rica for
Please cite this article as: Wünscher, T., et al., Spatial targeting of payments for environmental services: A tool for boosting
conservation benefits, Ecological Economics (2008), doi:10.1016/j.ecolecon.2007.11.014
ARTICLE IN PRESS
12
EC OLOG ICA L ECO N O M I CS XX ( 2008) X XX–X XX
protecting biodiversity: a preliminary gab analysis. Biological
Conservation 93, 35–41.
Rodrigues, A.S.L., Andelman, S.J., Bakarr, M.I., Boitani, L., Brooks,
T.M., Cowling, R.M., Fishpool, L.D.C., Fonseca, G.A.B., Gaston,
K.J., Hoffman, M., Long, J., Marquet, P.A., Pilgrim, J.D., Pressey,
R.L., Schipper, J., Sechrest, W., Stuart, S.N., Underhill, L.G.,
Waller, R.W., Watts, M.E.J., Xie, Y., 2003. Global gap analysis:
towards a representative network of protected areas. Advances
in Applied Biodiversity Science 5. Conservation International,
Washington DC.
Rojas Molina, J., 2005. Secuestro de Carbono y Uso de Agua en
Sistemas Silvopastoriles con Especies Maderables Nativas en el
Trópico Seco de Costa Rica. Tesis de maestría. Centro
Agronómico Tropical de Investigación y Enseñanza (CATIE),
Turrialba, Costa Rica.
Sanderson, J., Alger, K., Fonseca, G.A.B., Galindo-Leal, C.,
Inchausty, V.H., Morrison, K., 2003. Biodiversity Conservation
Corridors: Planning, Implementing and Monitoring Sustainable
Landscapes. Conservation International, Washington DC.
Sierra, R., Russman, E., 2006. On the efficiency of environmental
service payments: a forest conservation assessment in the Osa
Peninsula, Costa Rica. Ecological Economics 59, 131–141.
Sills, E., Arriagada, R., Pattanayak, S., Ferraro, F., Carrasco, L., Ortiz,
E., Cordero, S., 2006. Impact of the PSA program on land use.
Paper presented at the Workshop on Costa Rica's Experience
with Payments for Environmental Services. San José, 25–26
September 2006.
Tattenbach, F., Obando, G., Rodríguez, J., 2006. Mejora del Excedente
Nacional del Pago por Servicios Ambientales. Paper presented at
the Workshop on Costa Rica's Experience with Payments for
Environmental Services. San José, 25–26 September 2006.
Turpie, J.K., Blignaut, J.N., 2008-this issue. Payments for ecosystem
services in South Africa: the evolution of a novel mechanism
for achieving biodiversity conservation, water security and
poverty relief in a semi-arid developing country. Ecological
Economics. doi:10.1016/j.ecolecon.2007.12.024.
Wunder, S., 2005. Payments for Environmental Services: Some
Nuts and Bolts. CIFOR occasional paper No. 42. CIFOR, Jakarta,
Indonesia.
Wünscher, T., in press. Spatial Targeting of Payments for
Environmental Services in Costa Rica: A Site Selection Tool for
Increasing Conservation Benefits. Doctoral Thesis. Center for
Development Research (ZEF), University of Bonn, Germany.
Please cite this article as: Wünscher, T., et al., Spatial targeting of payments for environmental services: A tool for boosting
conservation benefits, Ecological Economics (2008), doi:10.1016/j.ecolecon.2007.11.014


© Copyright 2026