
Hot Issues - Risk Information
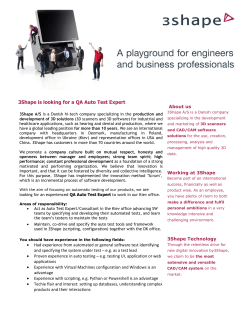
Reprinted With Permission Of The Publisher
AUTO INSURANCE REPORT
The Authority on Insuring Personal and Commercial Vehicles
Vol. 22#23/1031
March 16, 2015
INSIDE
Google partners with carriers and
comparison sites. Page 3
Google’s prefill works well, but some
questions will stump shoppers. Page 4
Google Compare’s starting lineup of
insurers. Pages 4-5
Georgia personal auto premiums, market
share and loss ratios. Page 6
THE GRAPEVINE
USAA May Have Passed
Farmers in Market Share
Though working with preliminary data from SNL Financial,
we’re confident enough in the
numbers to report that thanks to a
7.8% rise in personal auto premium written in 2014, USAA, with
$9.8 billion, has surpassed shrinking Farmers Insurance, down
1.2% to $9.7 billion, to become
the fifth-largest auto insurer in the
United States. What’s more, Liberty Mutual grew 5.1% to $9.5
billion and is now hot on Farmers’
heels. Unless something dramatic
happens, Farmers will drop yet
another spot to seventh in 2015.
Farmers was the third-largest auto
insurer as recently as 2003. Passed
by Progressive in 2004, it fell to
fourth, and then to fifth in 2007,
when it was passed by Geico. AIR
Google Comes to Market As
Biggest Disrupter Since Geico
Google wants to revolutionize auto insurance shopping,
and the Internet search giant has taken its first steps this
month by offering California consumers a price quote service with 14 insurers and promises of more to come.
The launch answered a wide range of questions that
have been rolling around since Google’s plans to enter the
U.S. auto insurance business became the worst-kept secret
in the market.
Google’s service is not materially different than existing
online price comparison sites in the United States, such as
Coverhound, Compare.com, The Zebra, Goji and AutoInsurance.com. In fact, a few of those sites are working
with Google to provide the prices from insurers that are
presented to consumers.
What makes Google’s entrance into the marketplace
unique is the company’s enormous scale and reach.
Please see GOOGLE on Page 2
All Trends Are Heading Higher In
Georgia Auto, Except for Profits
The top 10 personal auto insurance groups in Georgia
raised rates an average 8.6% last year, the highest in the
country, according to preliminary data. In 2013, Georgia’s
average rate increase of 4.9% was second highest, after
Michigan.
The preliminary data comes from Perr & Knight,
whose RateWatch product tracks rate changes for top 10
insurance groups by line and by state (except Wyoming
and the District of Columbia). The Georgia Department
of Insurance reports that the average of all personal auto
insurance rate requests totaled 5% last year.
The difference in methodology produces different figures, but this fact remains: Georgia auto insurers are raising
rates more than insurers in most other states, and the reason
is apparent. In 2013, Georgia’s 71.5% personal auto loss
Please see GEORGIA on Page 7
33765 Magellan Isle • Dana Point, CA • 92629 • (949) 443-0330 • www.riskinformation.com
Reprinted With Permission Of The Publisher
Page 2
GOOGLE Continued from Page 1
AUTO INSURANCE REPORT
Most auto insurance shopping experiences
today begin online, and the vast majority of online searches take place on Google’s search engine. Thus, every one of those shoppers will be
presented with the opportunity to shop through
Google. That power is exponentially greater than
anything generated by the sites that currently
share prices online with consumers or the online
lead-generating shopping sites, such as Bankrate’s Autoinsurance.com.
In the near term, Google’s ability to raise
awareness of Internet price shopping will benefit
all online shopping sites. Though it is reasonable
to fear that Google will overwhelm the other
sites, European experience suggests that is not
likely to happen. Confused.com, a cousin of
Compare.com, for example, continues to thrive
after Google Compare UK launched in 2012.
But the weak won’t survive the more robust marketplace Google’s presence will create.
This entry is a nightmare for carriers that fear
price transparency in auto insurance. We don’t
believe greater price transparency will make auto
insurance a commodity. There is already ample
evidence on shopping sites that many consumers
will buy a higher-priced policy to get the brand
March 16, 2015
they want, even in online comparison marketplaces that lack State Farm, Geico, Allstate and
other top brands. But make no mistake, quality
online price comparisons will make price much
more important than it is today.
Insurance executives we speak with agree
that online price comparisons benefit small insurers more than large insurers. While Geico
shows up on almost every shopper’s set of potential insurers, small insurers are not always part of
the consideration set, especially if they sell only
through agents. But online comparison shopping
brings big and small together on the same page.
Big brands still reap benefits from their advertising, but not as much as they enjoy today.
For agents, Google Compare’s arrival is not
a death knell, but it is an ominous warning: If
you don’t provide service commensurate with
your cost, you’ll be going out of business. The
defining characteristic of a successful agent in
the future will be excellent advice, not the quality service that is the benchmark today. Quality
service will be table stakes.
The Opening Game
It makes sense for Google to start in CalPlease see GOOGLE on Page 3
Warning: Auto Insurance Report is a confidential, copyrighted newsletter for subscribers only.
No part of this publication may be reproduced by any form or means, including photocopying, scanning, fax or email, without prior permission of the Publisher. For information call (949) 443-0330.
Reprinted With Permission Of The Publisher
March 16, 2015
AUTO INSURANCE REPORT
Page 3
After entering name, address and selected coverages for a clean risk, Google Compare returned six prices and reported
that seven insurers chose not to offer a price. Some insurers are working directly with Google, such as Mercury Insurance, which in this shopping session had the lowest rate. Click on Mercury and you are taken directly to Mercury’s
website to buy online “and get your own agent, too!” 21st Century, a subsidiary of Farmers Insurance Group, prefers to
work through online insurance agency Coverhound, and clicking on the Google result for 21st Century directs you to the
Coverhound website, rather than directly to 21st Century. Insurers using Compare.com will have the same pattern.
GOOGLE Continued from Page 2
ifornia, the nation’s largest market, because
both Coverhound and Compare.com are deeply
penetrated there, and key insurers on Google
Compare are active in the state online. Google
said it will roll out to other states as the company
becomes more comfortable with its operations.
Google is partnering directly with insurers,
such as Mercury and MetLife, as well as with
online price comparison/agencies, such as Coverhound and Compare.com.
It stands to reason that Google, wanting to
get into the market quickly, would work with online shopping companies that might otherwise be
considered competitors. For one thing, many in-
surers are not capable of delivering a rate quickly and directly to Google. The price comparison
sites have done the heavy lifting of connecting
with insurers, and many have built valuable analytic engines that can tell insurers when they
should bother to offer a quote.
How It Works
Google Compare (which can be reached
directly at www.google.com/compare) includes
a very impressive prefill function. If consumers
opt in, Google can look at the customer’s entered
name and address and pull information about
vehicles and drivers in that household. Google
Please see GOOGLE on Page 4
Warning: Auto Insurance Report is a confidential, copyrighted newsletter for subscribers only.
No part of this publication may be reproduced by any form or means, including photocopying, scanning, fax or email, without prior permission of the Publisher. For information call (949) 443-0330.
Reprinted With Permission Of The Publisher
Page 4
GOOGLE Continued from Page 3
AUTO INSURANCE REPORT
buys this from an outside source, so time will tell
if it is cost-effective. But it certainly goes a long
way toward speeding the quote and ensuring that
a real person is filling out the form.
In tests conducted by us and others, the data
was almost always accurate. It is a far better experience than the one you find on sites where the
questions about the insured vehicle are very specific and take significant time to figure out.
Despite the prefill at the front end, the questions that come later on can be pretty stiff. If the
consumer reports an at-fault accident, Google
asks several questions that are difficult to answer, such as has much your insurer paid to the
person you hit. We doubt many people will be
able to answer that question, and you can’t continue without an answer. These are the kinds of
kinks Google must work out before expanding.
Can Google pull data from claims databases,
such as LexisNexis’ CLUE or Verisk’s A-Plus,
on behalf of insurers who are eligible to use
them? The short-term answer is no. The longterm answer is maybe, but there’s a ton of work
to be done before that.
Google executives believe that their service can ask more questions than single-carrier
websites because users who want a multitude of
quotes will be willing to do the additional work
to get them. Time will tell if that is true.
After Google collects the user’s data, it
doesn’t use its own rating system to generate prices. Google follows the model of most,
though not all, price comparison sites in reaching out to insurers directly. It also reaches out to
partner comparison sites for rates.
The prices presented to consumers are estimates because insurers don’t want to pay for the
data on credit, driving history, etc., that is necessary to create a bindable quote for every query.
That is no different than every other site on the
Internet, including individual company sites.
(Stay tuned for more on this in a future issue.)
Once consumers select an insurer, they are
March 16, 2015
directed to the carrier’s website or to a partner
price comparison site for closing.
The quotes Google Compare generates are
ranked in an unbiased way: by price.
We suspect there will at least be a conversation about insurers paying to be pushed up in the
ranking, though that might bring out many insurers (and possibly consumer groups) to march
with pitch forks and torches on the Googleplex
in Mountainview, California. Nevertheless, the
conversation has to take place, right?
When we searched for auto insurance prices
in Google’s search engine, the Google Compare
site came up after three advertisers in every case.
(Compare.com and lead generators, such as
NetQuote and QuoteWizard, were regulars.) So
the early fear that Google would favor itself over
all others is unfounded, at least so far. Google
lives and dies by advertising, and it will be careful not to disrupt that business in the name of a
fledgling auto insurance marketplace.
This isn’t a unique behavior: search “air travel,” and Kayak, Orbitz and Hipmunk all appear
before Google’s flight search (which, in our
opinion, is the best of all).
The Lineup
The list of insurers participating on Google
Compare today is sure to grow. Here is the initial
list, in no particular order (with the parent company in parentheses):
• Mercury Insurance
• Workmen’s (Mercury)
• MetLife Auto & Home
• The General (American Family)
• 21st Century (Farmers)
• Foremost (Farmers)
• Infinity Auto Insurance
• Titan Insurance (Nationwide)
• Dairyland Auto (Sentry)
• Stillwater Insurance Group
• CSE Insurance Group
• Kemper Specialty
Please see GOOGLE on Page 5
Warning: Auto Insurance Report is a confidential, copyrighted newsletter for subscribers only.
No part of this publication may be reproduced by any form or means, including photocopying, scanning, fax or email, without prior permission of the Publisher. For information call (949) 443-0330.
Reprinted With Permission Of The Publisher
March 16, 2015
AUTO INSURANCE REPORT
Google Still Has Work to Do
GOOGLE Continued from Page 4
• Safeway
• Arrowhead General Agency, writing
through Everest National, which is part of Everest Re.
The system does seems to have some kinks.
When we entered a clean risk with a long-insured tenure, a garaged late-model sedan and
a mature male driver, MetLife didn’t return a
quote. Since that risk is right in MetLife’s target
wheelhouse, we have to assume the company
either couldn’t return a quote quickly enough,
or it needs to work the bugs out of the system.
We didn’t run a hundred quotes, but the tests we
tried last week didn’t yield any MetLife quotes.
We also didn’t see any Compare.com quotes.
It is early.
Dispelling the Rumors
We never believed the rumors that Google
was buying or investing in Coverhound, and it
turns out we were right.
Coverhound is an agency that takes responsibility for customer service with hundreds of licensed agents in a call center. Google has shown
little inclination to get involved in such a handson way. Google is better structured to be Ebay,
which takes a piece of the transaction between
two unrelated parties, rather than Amazon,
which makes much of its living selling products
stocked in its own warehouses.
From Coverhound’s perspective, a Google
investment isn’t necessary, at least not right now.
Just two days after Google Compare started,
Coverhound announced the closing of another
Page 5
During one test shopping session, we reported an at-fault accident. This brought up
a set of questions that included a required
entry of the total amount the insurer paid to
the other party. Few, if any, drivers would
have access to that information, and without giving an answer, it was not possible to
continue the quote. We made something up
and continued, not the best outcome.
round of investments by venture capital firms,
this time for $14 million. Existing investors
RRE Ventures, Blumberg Capital and Bullpen
Capital participated in the latest round, as did
new investors Core Innovation Capital, Thomas Lehrman, Tugboat Ventures, Route 66 Ventures and American Family Ventures, the venture capital arm of American Family Insurance.
American Family’s investment in Coverhound continues an interesting expansion from
its captive agency roots. In recent years the company has purchased direct response home insurer
Homesite and direct response nonstandard auto
insurer The General. American Family also has
taken a major stake in the online direct commercial insurance broker AssureStart.
We worried about the wisdom of allowing
Google to invest in Coverhound without buying
the whole thing. Google lacks insurance agency
experience in the United States. For what would
amount to pocket change, Google could invest in
Coverhound, go to school on years of research
and development, and then improve its own performance to the detriment of Coverhound. While
that would undermine Google’s investment, it
would be a small price to pay. Maybe we have a
Machiavellian turn of mind, but we’d keep Google at arm’s length for now. (There is, of course,
a price for everything.)
Kudos to Ellen Carney of Forrester Research, whose sleuthing identified Google’s
activity and predicted its imminent arrival. Her
suggestion that Google might buy Coverhound
has not come true, but that doesn’t mean it won’t
happen some day. AIR
Warning: Auto Insurance Report is a confidential, copyrighted newsletter for subscribers only.
No part of this publication may be reproduced by any form or means, including photocopying, scanning, fax or email, without prior permission of the Publisher. For information call (949) 443-0330.
Reprinted With Permission Of The Publisher
AUTO INSURANCE REPORT
Page 6
Georgia
Personal Auto Insurers
March 16, 2015
Groups Ranked by Total 2013 Direct Premium Written (000)
Group Name
Mkt Loss
2013
share Ratio
Premium 2013 2013
Mkt Loss
2012
share Ratio
Premium 2012 2012
State Farm Mutual
$1,325,167
22.8%
77.1%
$1,226,165
22.4%
65.8%
$1,175,168
22.1%
64.9%
Progressive Corp.
$701,666
12.1%
65.6%
$680,767
12.4%
63.9%
$663,801
12.5%
61.7%
Allstate Corp.
$676,707
11.6%
64.7%
$655,640
12.0%
58.1%
$655,556
12.3%
57.7%
Berkshire Hathaway/Geico
$580,892
10.0%
74.2%
$543,687
9.9%
69.3%
$531,777
10.0%
73.2%
USAA Insurance Group
$440,825
7.6%
83.8%
$402,872
7.4%
78.7%
$373,774
7.0%
79.2%
Liberty Mutual
$299,832
5.2%
75.2%
$268,492
4.9%
60.0%
$250,423
4.7%
62.5%
Nationwide Mutual Group
$205,154
3.5%
72.4%
$182,694
3.3%
71.1%
$166,270
3.1%
69.5%
Georgia Farm Bureau Mutual Ins Co.
$187,599
3.2%
59.0%
$170,489
3.1%
59.2%
$180,703
3.4%
61.6%
Travelers Companies
$141,277
2.4%
62.6%
$151,086
2.8%
61.6%
$160,191
3.0%
63.7%
Auto-Owners Insurance Co.
$112,522
1.9%
71.3%
$106,881
2.0%
71.6%
$101,086
1.9%
71.9%
Country Financial
$104,546
1.8%
71.3%
$96,739
1.8%
69.4%
$94,640
1.8%
63.3%
American Family Mutual
$69,287
1.2%
96.2%
$54,980
1.0%
91.9%
$38,588
0.7%
79.5%
MetLife Inc.
$58,365
1.0%
69.2%
$57,102
1.0%
59.5%
$56,741
1.1%
54.9%
Alfa Mutual Group
$52,301
0.9%
79.6%
$42,967
0.8%
76.0%
$39,660
0.8%
73.0%
Safeway Financial Holding Co.
$50,494
0.9%
71.1%
$51,213
0.9%
65.8%
$37,670
0.7%
57.7%
Hartford Financial Services
$39,452
0.7%
72.2%
$36,123
0.7%
59.9%
$34,359
0.7%
55.1%
Farmers Insurance Group
$39,395
0.7%
74.0%
$36,075
0.7%
64.7%
$29,189
0.6%
69.3%
Infinity Property and Casualty Corp.
$38,684
0.7%
64.4%
$54,334
1.0%
70.7%
$49,711
0.9%
68.1%
First Acceptance Corp.
$37,624
0.7%
63.8%
$38,528
0.7%
73.0%
$35,730
0.7%
62.2%
Cincinnati Financial Corp.
$36,905
0.6%
66.8%
$34,871
0.6%
59.9%
$33,416
0.6%
64.8%
Grange Mutual Casualty Co.
$34,906
0.6%
57.5%
$30,698
0.6%
47.4%
$32,145
0.6%
56.8%
Fortegra Financial Corp.
$34,647
0.6%
6.3%
$27,645
0.5%
4.7%
$26,140
0.5%
5.4%
Mercury General Corp.
$31,696
0.5%
68.4%
$35,903
0.7%
66.3%
$34,026
0.6%
67.2%
ACCC Insurance Co.
$31,633
0.5%
64.4%
$19,449
0.4%
59.6%
$18,159
0.3%
59.3%
Assurant Inc.
$30,346
0.5%
25.4%
$30,986
0.6%
24.3%
$31,663
0.6%
25.6%
Everest Re Group Ltd.
$27,706
0.5%
67.5%
$21,464
0.4%
64.0%
$20,953
0.4%
58.2%
Amica Mutual Insurance Co.
$26,564
0.5%
63.4%
$26,138
0.5%
57.0%
$26,520
0.5%
65.3%
Southern General Insurance Co.
$24,552
0.4%
70.3%
$21,998
0.4%
64.1%
$23,300
0.4%
52.5%
United Automobile Insurance Group
$23,020
0.4%
78.9%
$18,648
0.3%
54.7%
$20,940
0.4%
49.3%
Safe Auto Insurance Co.
$20,135
0.4%
62.1%
$20,343
0.4%
57.7%
$23,158
0.4%
52.4%
Hanover Insurance Group Inc.
$18,790
0.3%
71.8%
$22,592
0.4%
64.5%
$22,501
0.4%
58.8%
Direct General Group
$18,741
0.3%
63.0%
$17,523
0.3%
58.0%
$21,014
0.4%
74.6%
State Auto Insurance Companies
$18,426
0.3%
91.6%
$17,034
0.3%
76.0%
$15,209
0.3%
77.0%
Central Mutual Insurance Co.
$18,342
0.3%
60.5%
$17,751
0.3%
64.9%
$17,779
0.3%
51.0%
Kemper Corp.
$17,558
0.3%
67.7%
$20,103
0.4%
77.1%
$22,145
0.4%
67.9%
American Independent Companies
$17,304
0.3%
69.3%
$10,367
0.2%
81.1%
$8,469
0.2%
50.7%
Donegal Insurance Group
$17,287
0.3%
60.8%
$17,315
0.3%
66.5%
$17,238
0.3%
70.3%
71.5%
$5,476,596
65.4%
$5,314,932
Statewide Totals
$5,823,461
Mkt Loss
2011
share Ratio
Premium 2011 2011
64.7%
Source: SNL Financial, by permission, and the Auto Insurance Report database.
Loss ratio is incurred losses as a percentage of direct premium earned. The ratio does not include dividends or loss
adjustment expense. Single year data can be skewed by reserve adjustments.
Warning: Auto Insurance Report is a confidential, copyrighted newsletter for subscribers only.
No part of this publication may be reproduced by any form or means, including photocopying, scanning, fax or email, without prior permission of the Publisher. For information call (949) 443-0330.
Reprinted With Permission Of The Publisher
AUTO INSURANCE REPORT
March 16, 2015
Page 7
State Market Focus: GEORGIA
Continued from Page 1
ratio was seventh highest in the country, but
worst among the 10 largest states. (We discount
Michigan because the reporting of reinsured catastrophic claims makes it look worse than it is.)
Insurers are clearly responding to a problem
with liability losses, though physical damage
losses jumped in 2013 – due largely to severe
thunderstorms, hail and tornadoes – to produce
a 62.3% loss ratio. But looking back to 1999,
Georgia’s physical damage loss ratio has never
exceeded the national average. The liability loss
ratio, on the other hand, has been steadily rising
since 2009. In 2013, it was second highest in the
country at 77.8% compared with the 67.9% national average. The last time Georgia’s liability
loss ratio was higher was 82.2% in 2001.
Traffic congestion in the fast-growing metro Atlanta area is a major factor driving up the
number of accidents, said Steve Manders, the
Insurance Department’s director of insurance
products review. The state House recently passed
a bill that would provide nearly $1 billion to
fund transportation improvements. At press time,
the bill was pending in the Senate. The transportation research group TRIP has found that 10%
of Georgia’s major locally and state-maintained
urban roads and highways have pavements in
poor condition, while an additional 39% of the
state’s major urban roads are rated as mediocre
or fair.
After-tax profit margins show the profitability challenge is not a short-term issue. For the
decade that ended in 2013, Georgia personal auto
insurers recorded an average annual profit margin of 4.3%, compared with the national average
of 6.3%. Georgia ranked 45th in the country.
Even as insurers struggle with profitability in
Georgia, it’s a competitive market and it has an
especially vibrant nonstandard market. Manders
said there are no policies in the residual market.
The appeal is size and growth. Georgia is the
nation’s ninth-largest market with $5.8 billion
in 2013 written premium, a 6.3% increase over
2012. Nationwide personal auto premium grew
Please see GEORGIA on Page 8
Georgia
Auto Insurance Profit Margins
Ten-Year Summary, Percent of Direct Premiums Earned
Line of Business
Personal Auto Liab
2013 2012 2011 2010 2009
Total Total Total Total Total
Profit Profit Profit Profit Profit
-5.8
-3.9
-2.9
-1.2
-2.6
2008
Total
Profit
-0.8
2007
Total
Profit
0.7
2006
Total
Profit
2.2
2005
Total
Profit
1.9
2004 Avg
Total Total
Profit Profit
0.0 -0.2
14.3 12.1
Personal Auto Phys
3.1
11.1
9.3
14.4
9.7
10.0
13.4
14.0
12.5
Personal Auto Total
-2.2
2.4
2.4
5.6
3.0
4.3
6.7
7.7
6.8
6.8
5.5
5.6
1.9
8.6
7.8
1.1
11.0
11.1
10.0
8.6
12.4
7.2
Comm. Auto Phys
-5.2
6.1
1.5
6.8
5.5
6.9
10.3
8.0
6.2
14.1
7.7
Comm. Auto Total
3.4
2.8
7.1
7.6
2.1
10.0
10.8
9.6
8.0
12.9
7.3
Total All Lines*
6.4
10.4
4.3
8.6
-7.3
-1.5
9.6
13.0
9.6
7.0
5.5
Comm. Auto Liab
*Auto; Home, Farm & Commercial Multiperil; Fire; Allied; Inland Marine; Med Malpractice; Other Liability; Workers Comp; All Other
Note: Profit calculations are by Auto Insurance Report using data from the National Association of Insurance
Commissioners. Calculations are estimates, some based on national averages.
Warning: Auto Insurance Report is a confidential, copyrighted newsletter for subscribers only.
No part of this publication may be reproduced by any form or means, including photocopying, scanning, fax or email, without prior permission of the Publisher. For information call (949) 443-0330.
Reprinted With Permission Of The Publisher
Page 8
AUTO INSURANCE REPORT
Georgia
Commercial Auto Insurers
March 16, 2015
State Market Focus: GEORGIA
Continued from Page 7
policies.Written (000)
Groups Ranked by Total 2013 low-limits
Direct Premium
4.6%. Among top 20 markets, only Texas, MichInsurers hope that a bill passed in 2014 will
Mkt Loss
Mkt Loss
Mkt Loss
igan and Colorado grew faster. The
population
stem some
of the
abuse in2011
auto insurance
2013
share Ratio help 2012
share
Ratio
share Ratio
Group Name
Premium
Premium
2013 2013 claims.
2012law
2012
2011 2011
surpassed
10 million last year,Premium
having grown
The new
prohibits
paid intermediProgressive
7.9aver% 60.4%aries$65,838
61.9% cappers
$64,405
9.1% 65.4%
4.2%
sinceCorp.
2010 compared with$60,375
a national
– known9.4
as%runners,
or steerers
Travelers
Companies
Inc.
$57,618
7.6
%
70.4
%
$61,493
8.8
%
81.7
%
$58,761
8.3% 86.8%
age of 3.3%, and more than 53% since 1990.
– from soliciting accident victims and prohibits
Auto-Owners Insurance Co.
$43,638
5.7% 64.5%
$40,037
5.7% 51.8%
$39,548
5.6% 47.2%
Some blame Georgia’s problems on an inhealth care providers and attorneys from
using
Nationwide Mutual Group
$35,950
4.7% 80.5%
$31,677
4.5% 84.9%
$28,545
4.0% 78.2%
crease in fraud, especially after no-fault reforms them to do so. “Often times, unscrupulous lawAmerican International Group
$33,036
4.3%
8.7%
$21,301
3.1% 50.6%
$53,956
7.6% 42.6%
in neighboring Florida eroded the potential
yers $14,142
and medical
providers are$7,999
involved1.1in
using
Berkshire Hathaway/National Indemnity $29,707
3.9% 63.2%
2.0% 47.8%
%
3.2%
profits
of
unscrupulous
lawyers
and
health
care
runners
to
solicit
accident
victims
and
assist
Zurich Insurance Group
$27,954
3.7% 93.8%
$36,421
5.2% 59.4%
$35,256
5.0% in
37.5%
providers
who abused the system.
Georgia3.5is% not
bogus insurance
Haskins5.2said.
Liberty Mutual
$26,617
43.9%filing$27,704
4.0% 58.4claims,”
%
$36,667
% 62.6%
aWestfield
no-fault
state,
but
as
Alan
Haskins,
governInsurers
have
responded
to
adverse
conGroup
$24,286
3.2% 74.0%
$21,957
3.1% 60.7%
$21,166
3.0% 53.0%
ment
affairs
director
Cincinnati
Financial
Corp. for the National
$24,130Insurance
3.2% 58.1%ditions
$19,768
2.8% 64.2
% and reunderwriting,
$17,297
2.4% 59.6%
with higher
rates
GA Farm Bureau,
Bureau Mutual
3.0% 43.7%Manders
$24,945
3.6
%
53.6
%
$27,310
3.9% 57.9%
Crime
putIns
it:Co.
“Frankly,$22,909
the criminals
said.
Selective
Insurance
Group
Inc.
$19,291
2.5
%
49.7
%
$15,722
2.3
%
54.7
%
$13,597
% 46.7%
don’t care what you call the insurance coverage.
Georgia was one of several states in1.9which
Old Republic International Corp.
$18,103
2.4% 76.4%
$18,012
2.6% 59.8%
$15,366
2.2% 81.1%
They still bill for services that aren’t warranted.” State Auto implemented a remediation effort
State Farm Mutual
$16,625
2.2% 71.8%
$17,093
2.5% 59.5%
$17,891
2.5% 58.1%
The NICB documented a 14%
increase
in
including
“pricing
and agency$11,567
management
acCanal Insurance Co.
$13,652
1.8% 46.9%
$12,051
1.7% 67.7%
1.6% 76.9%
suspicious
claims in Georgia between
2011
and
tion”$11,803
in 2013 1.7
because
of poor$11,503
profitability.
In its
FCCI Mutual Ins Hldg Co.
$12,566
1.7% 53.2%
% 74.6%
1.6% 72.4%
2012
and
another
6%
increase
to
4,359
in
2013.
report 1.4
for%2014,
the%
Grange Mutual Casualty Co.
$11,241
1.5% 57.8%annual
$9,887
61.5%the company
$10,353 reported
1.5% 63.9
A
fear
of
bad
faith
awards
also
drives
inremediation
actions
reversed
unfavorable
loss
ra-%
Hartford Financial Services
$11,227
1.5% 49.3%
$10,840
1.6% 88.1%
$10,337
1.5% 61.5
surers
toInsurance
offer larger
especially
on 93.3%
Columbia
Groupsettlements,$10,523
1.4%
$11,398
1.6% 93.0
% see $12,666
93.4%
Please
GEORGIA1.8
on%Page
9
Allstate Corp.
$10,392
1.4%
72.8%
$8,737
$10,343
1.4%
61.4%
$10,895
Employers Mutual Casualty Co.
$10,169
1.3%
67.2%
$8,872
1.3%
American Financial Group Inc.
$9,118
1.2%
48.9%
$8,172
1.2%
Sentry Insurance Mutual
1.3%
44.9%
$7,927
1.1%
43.6%
1.6% 100.1%
$10,323
1.5%
63.4%
52.8%
$6,339
0.9%
53.5%
74.9%
$9,122
1.3%
63.4%
1.2%
83.6%
Georgia
Commercial Auto Insurers
Hanover InsuranceGroups
Group Inc.
ACE Ltd.
1.2%2013
53.0%Direct
$9,833
1.4% Written
57.7%
Ranked$9,073
by Total
Premium
W. R. Berkley Corp.
Tokio Marine
Group
NameGroup
CNA Financial
Corp.
Progressive
Corp.
Markel
Corp.
Travelers Companies Inc.
$8,284
1.1% 212.6%
Mkt
$7,049
0.9%
2013
share
$6,834 2013
0.9%
Premium
$6,357
$60,375
$6,308
$57,618
0.8%
%
7.9
0.8
%
7.6%
Utica National
Insurance
Group
$5,478
American
International
Group
$33,036
Infinity
P&C
Corp.
$5,392
Berkshire Hathaway/National Indemnity $29,707
Atlantic
American
/
Delta
Grp
$5,326
Zurich Insurance Group
$27,954
0.7%
%
4.3
0.7
%
3.9%
QBE Insurance
(Gen Cas/Unigard)
Auto-Owners
Insurance
Co.
White Mountains
Nationwide
MutualInsurance
Group
OOIDAMutual
RRG Inc.
Liberty
FederatedGroup
Mutual Insurance Co.
Westfield
IAT Reinsurance
(U.S.)
Cincinnati
Financial
Corp.
Arch
Capital
Group
Ltd. Ins Co.
GA Farm Bureau Mutual
SPARTA Insurance
Insurance Group
Holdings
Selective
Inc.Inc.
Old Republic
International
Statewide
Totals Corp.
$6,040
$43,638
$5,658
$35,950
$5,084
$26,617
$5,019
$24,286
$4,928
$24,130
$4,876
$22,909
0.8%
%
5.7
0.7%
%
4.7
0.7%
%
3.7
0.7%
%
3.5
0.7%
%
3.2
0.7
%
3.2%
$4,440
$19,291
0.6%
%
3.0
0.6%
%
2.5
$18,103
$763,226
2.4%
Loss
73.8%
Ratio
31.6%
2013
99.7%
%
60.4
48.6
%
70.4%
71.7%
%
64.5
39.1%
%
80.5
38.0
%
8.7%
67.1
%
63.2%
71.3%
%
93.8
72.2%
%
43.9
38.8%
%
74.0
28.7
%
58.1%
83.3%
%
43.7
76.7%
%
49.7
76.4
64.6%
%
$7,361
1.1%
$7,672
$65,838
$2,178
$61,493
1.1%
%
9.4
0.3
%
8.8%
$4,597
$21,301
$4,867
$14,142
0.7%
%
3.1
0.7
%
2.0%
Mkt
$7,157
1.0%
2012
share
$6,120 2012
0.9%
Premium
$5,904
$40,037
$3,248
$31,677
$5,250
$36,421
$2,815
$27,704
$4,091
$21,957
$4,453
$19,768
$3,954
$24,945
$3,408
$15,722
$18,012
$698,695
0.8%
%
5.7
0.5%
%
4.5
0.8%
%
5.2
0.4%
%
4.0
41.9%
Loss
90.6%
Ratio
60.5%
2012
64.8%
%
61.9
20.6
%
81.7%
83.6%
%
51.8
42.3%
%
84.9
65.8%
%
50.6
60.9
%
47.8%
53.9%
%
59.4
98.5%
%
58.4
0.6%
% 60.7
61.0%
%
3.1
0.6
%
105.6
%
2.8% 64.2%
0.6
%
33.2
%
3.6% 53.6%
$8,760
(000)
$7,293
1.0%
$9,892
$64,405
$1,223
$58,761
1.4%
%
9.1
0.2
%
8.3%
$5,266
$53,956
$4,089
$7,999
0.7%
%
7.6
0.6
%
1.1%
Mkt
$5,531
0.8%
2011
share
$4,967 2011
0.7%
Premium
$7,672
$39,548
$2,431
$28,545
$5,601
$35,256
$1,582
$36,667
$3,655
$21,166
$4,118
$17,297
1.1%
%
5.6
0.3%
%
4.0
0.8%
%
5.0
0.2%
%
5.2
0.5%
%
3.0
0.6
%
2.4%
0.5%
%
2.3
44.1%
%
54.7
$2,530
$27,310
$1,385
$13,597
0.4%
%
3.9
0.2%
%
1.9
2.6%
59.8
64.8%
%
$15,366
$708,478
2.2%
74.6%
$11,503
1.6%
56.3%
Loss
44.3%
Ratio
34.6%
2011
33.6%
%
65.4
57.7
%
86.8%
30.2%
%
47.2
37.1%
%
78.2
28.0%
%
42.6
60.0
%
3.2%
52.3%
%
37.5
5.0%
%
62.6
30.0%
%
53.0
63.7
%
59.6%
12.2%
%
57.9
63.6%
%
46.7
81.1
60.8%
%
State
FarmSNL
Mutual
$16,625
% Insurance
71.8%
$17,093
2.5% 59.5%
$17,891
2.5% 58.1%
Source:
Financial, by permission,
and the 2.2
Auto
Report
database.
Loss ratio
is incurred
losses as a percentage
direct
earned.
The 1.7
ratio
dividends
or loss
Canal
Insurance
Co.
$13,652 of 1.8
% premium
46.9%
$12,051
% does
67.7not
% include
$11,567
1.6%
76.9%
adjustment expense. Single year data can be skewed by reserve adjustments.
FCCI Mutual Ins Hldg Co.
$12,566
1.7%
53.2%
$11,803
1.7%
72.4%
Grange Mutual Casualty Co.
$11,241
1.5% 57.8%
$9,887
1.4% 61.5%
$10,353
1.5% 63.9%
Warning: Auto Insurance Report is a confidential, copyrighted newsletter for subscribers only.
Hartford
Financial
Services
$11,227
1.5
%
49.3
%
$10,840
1.6
%
88.1
%
$10,337
1.5%scan61.5%
No part of this publication may be reproduced by any form or means, including photocopying,
ning,
fax
or
email,
without
prior
permission
of
the
Publisher.
For
information
call
(949)
443-0330.
Columbia Insurance Group
$10,523
1.4% 93.3%
$11,398
1.6% 93.0%
$12,666
1.8% 93.4%
Allstate Corp.
$10,392
1.4%
72.8%
$8,737
Sentry Insurance Mutual
$10,343
1.4%
61.4%
$10,895
1.3%
44.9%
$7,927
1.1%
43.6%
1.6% 100.1%
$10,323
1.5%
Employers Mutual Casualty Co.
$10,169
1.3%
67.2%
$8,872
1.3%
63.4%
52.8%
$6,339
0.9%
53.5%
American Financial Group Inc.
$9,118
1.2%
48.9%
$8,172
1.2%
74.9%
$9,122
1.3%
63.4%
Reprinted With Permission Of The Publisher
AUTO INSURANCE REPORT
March 16, 2015
Page 9
State Market Focus: GEORGIA
Continued from Page 8
tio trends and will continue in 2015. State Auto,
ranked 33rd in Georgia in 2013, saw its loss ratio
rise from 53.5% in 2010 and into the 70s in 2011
and 2012 before spiking at 91.6% in 2013.
The nonstandard insurer Infinity, the
15th-largest personal auto group in Georgia,
stopped writing new business in the state on
Jan. 1. Chairman and CEO James Gober said
in an earnings conference call that the company
looked at three criteria in deciding whether to
continue writing, among them a large market, a
significant Hispanic population in large urban
zones and a manageable regulatory and legal
environment. Georgia, along with Nevada and
Pennsylvania, didn’t make the cut.
Adverse loss experience in Georgia was one
of the factors that A.M. Best cited in downgrading its rating of Peachtree Casualty, a small
nonstandard writer.
The regulatory environment under Insurance
and Fire Safety Commissioner Ralph Hudgens
allows insurers to change rates in response to
challenging conditions, though regulators do not
always approve increases as large as insurers
request. “We turn some of them back,” Manders
said. “But I guess we are trying to be a little
more flexible with them.”
When TV and newspaper reporters shined
a spotlight on rising home and auto insurance
rates, Hudgens noted that the rate actions were
a response to rising claim costs. He also pointed out that if he denied rate increases, insurers
would leave the state, leaving consumers fewer
choices. Hudgens, who was first elected in 2010,
was re-elected in November.
In 2012, Georgians spent on average $768
for auto insurance, the 20th highest in the country. On our PAIN Index, which compares premium to income as an indicator of affordability,
Georgia ranked 19th.
Please see GEORGIA on Page 10
Georgia Snapshot
Regulator: Commissioner Ralph Hudgens
Rate regulation: prior approval for minimum
liability limits; file and use for all others
Size of personal auto market: $5.82 billion (2013
DPW) Rank: 9th
Average policy expenditure: $768 (2012)
Rank: 20th
Auto Insurance Report PAIN Index rank:
19th (2012)
Property Insurance Report HURT Index rank:
17th (2012)
Auto registrations: 3.44 million (2013)
Truck registrations: 4.1 million (2013)
Vehicle miles traveled (VMT): 108.45 billion
(2013)
Traffic fatalities: 1.09 per 100 million VMT; U.S.:
1.11 (2013)
Vehicle thefts: 268.5 per 100,000 residents;
Region: 190 per 100,000 residents (2013)
Liability defense: modified comparative fault,
50% bar
Minimum Insurance Requirements:
BI: $25,000/$50,000 • PD: $25,000
Safety Laws
Safety Laws
Graduated licensing
Primary safety belt law
Motorcycle helmets required for all riders
Cellphone ban for young drivers; all driver texting
ban
Demographics
Population: 10.1 million (2014 est.)
Change from 2010: +4.2%, U.S.: +3.3%
Median household income: $49,179;
U.S.: $53,046 (avg 2009-13)
Population density: 168.4 per square mile;
U.S: 87.4 per square mile (2010)
Sources: SNL Securities, NAIC, U.S. Dept. of
Transportation, PCIAA, NAMIC, U.S. Census
Bureau, Insurance Institute for Highway Safety,
FBI
Warning: Auto Insurance Report is a confidential, copyrighted newsletter for subscribers only.
No part of this publication may be reproduced by any form or means, including photocopying, scanning, fax or email, without prior permission of the Publisher. For information call (949) 443-0330.
Reprinted With Permission Of The Publisher
AUTO INSURANCE REPORT
Page 10
Focus: GEORGIA
Continued from Page 9
State Farm, which wrote almost 23% of the
statewide personal auto direct premium in 2013,
took the largest increases on a groupwide basis,
raising rates 16.2% in 2014 after recording a loss
ratio of 71.5% in 2013, according to RateWatch.
Liberty Mutual raised rates 15% last year after
generating a 2013 loss ratio of 75.2%. From the
start of 2010 through Feb. 26 of this year, Liberty Mutual raised rates 56.2%. Travelers raised
rates 44.2% and Nationwide raised rates 42.9%
on a groupwide basis over the same period.
USAA, which experienced the highest loss ratio
in 2013 of the top 10 groups, at 83.8%, raised
rates just 5.1% rate over that period, the lowest
of all top 10 insurance groups.
The rate increases may help insurers’ performance, but the trends driving the rate increases
don’t seem to be improving much. Our sources
tell us that frequency and severity for bodily
injury jumped in recent months after experiencing a slight improvement in severity in the early
part of last year. Property damage and collision
frequency also continue to increase, none of it
helped by the accidents and stranded vehicles
after last year’s snow and ice storms walloped
the Atlanta area. Medical payments coverage has
also seen some deterioration.
Uninsured motorists claim costs could also
become more problematic if the legislature passes HB 303. That bill would increase the penalty
for bad faith in uninsured motorists claims to the
greater of $25,000 or 25% of damages. Currently
the penalty is just 25% of damages, but those
supporting the bill believe that on small claims
25% is not a sufficient penalty. Insurers oppose
the bill, but they also view the current version
as a much better alternative than previous drafts,
which would have raised the percentage to 100%
of damages.
Perhaps the most significant legislation for
auto insurers this session are competing bills re-
March 16, 2015
AUTO INSURANCE REPORT
Established 1993
Brian P. Sullivan, Editor
Telephone: (949) 443-0330
Email: [email protected]
Leslie Werstein Hann, Managing Editor
Telephone: (908) 574-5041
Email: [email protected]
Patrick Sullivan, Associate Editor
Telephone: (949) 412-5851
Email: [email protected]
Subscription Information: (800) 633-4931
On the Web: www.riskinformation.com
Auto Insurance Report, © 2015, published weekly, 48 times
a year, by Risk Information Inc., 33765 Magellan Isle, Dana
Point, CA 92629. It is a violation of federal law to photocopy
or reproduce any part of this publication without first obtaining
permission from the Publisher. ISSN: 1084-2950
Subscription Rates: $1,087 per year in U.S. and
Canada. Elsewhere $1,127 per year.
lating to transportation network companies. The
House passed HB 190, which was supported by
the insurance industry because it makes plain
that personal auto insurance policies provide no
coverage for livery and because it would require
the TNC or drivers to have primary commercial insurance coverage with limits of at least
$100,000/$300,000/$50,000 for incidents that
occur when the smartphone app is turned on but
a fare has not yet been arranged. From the time
the ride is arranged until the passenger departs,
the bill requires primary TNC coverage limits of
at least $1 million.
Another provision, promoted by lenders that
finance car purchases, would require first-party
coverage to mirror the driver’s personal insurance policy.
Senate Bill 196, which is supported by Uber,
would provide commercial coverage from the
time the fare is arranged until the passenger
departs, but it would make TNC coverage of
$25,000/$50,000/$25,000 for the period before a
fare is arranged contingent on denial by the driver’s personal insurance. At press time, the fate of
both bills was uncertain. AIR
Warning: Auto Insurance Report is a confidential, copyrighted newsletter for subscribers only.
No part of this publication may be reproduced by any form or means, including photocopying, scanning, fax or email, without prior permission of the Publisher. For information call (949) 443-0330.


© Copyright 2026