
The Public Cost of Low Wages in the Full
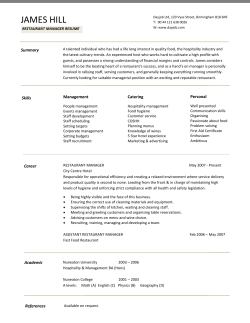
Picking up the NRA’s Tab
The Public Cost
of Low Wages
in the Full-Service
Restaurant Industry
1 Executive Summary
2Introduction
2 Data Sources and Methods
3Findings
4
the big five in full service:
Darden
5 Full-Service Restaurants
5 Who is the NRA?
6
the big five in full service:
Dine Equity and Bloomin’ Brands
7 Tipped Sub-Minimum Wage
8
the big five in full service:
Brinker International and Cracker Barrel
9 Recommendations for Policymakers, Employers, and the Public
10Appendix
12Endnotes
This report was inspired by: Allegretto SA, Doussard M, Graham-Squire D, Jacobs K, Thompson D,
and Thompson J. Fast Food, Poverty Wages: The Public Cost of Low-Wage Jobs in the Fast-Food Industry.
Berkeley, CA. UC Berkeley Center for Labor Research and Education, October 2013.
The primary research and writing was by Mike Rodriguez and Teófilo Reyes, with support from Ariel
Jacobson. The profiles of major full-service companies were prepared by Philip Mattera at Good Jobs First.
We gratefully acknowledge the support of Sarah Anderson and Philip Matera. This report should be cited as:
Restaurant Opportunities Centers United. April 15, 2015. Picking Up the NRA’s Tab: The Public Cost of Low
Wages in the Full-Service Restaurant Industry. New York, NY: Restaurant Opportunities Centers United.
Design by Quanci Design
© 2015 Restaurant Opportunities Centers United
Executive Summary
The full-service restaurant industry currently employs over 4 million people and employment is expected to grow
by nearly 10% by 2022.1,2 Despite the industry’s growth, restaurant workers occupy eight of the ten lowest-paid
occupations reported by the Bureau of Labor Statistics; at least five of these are in full-service.3 Many of these
full-service restaurant workers receive wages far below what is needed to provide basic necessities for themselves and
their families. As a result, these workers must rely on taxpayer-funded programs in order to meet their basic needs.
Of late there has been much public attention on fast food workers and the way that taxpayers subsidize fast
food companies because so many of their workers rely on public assistance.4 What has been less publicized is
the fact that the fast food segment of the restaurant industry works hand in hand with full-service restaurants
through the National Restaurant Association, the trade group and lobby for the entire industry. The full-service
restaurant industry, which employs the majority of restaurant workers, receives a double subsidy from the public:
through extraordinary levels of full-service restaurant workers being on public assistance; and through the sub
minimum wage, which requires customers to pay these workers’ wages directly through tips.
This report estimates the public cost of low-wage jobs in the full-service
restaurant industry. We focus our analysis on major means-tested public programs that operate as income supplements for working families. These vital
figure 1 Participation in public programs12
public benefit programs include health insurance (Medicaid and Children’s
Health Insurance Program, or CHIP, coverage), the federal earned income tax
50%
credit (EITC), food stamps (the Supplemental Nutrition Assistance Program,
Full-service
workers
40%
or SNAP), basic household income assistance (Temporary Assistance for Needy
Families, or TANF), the national school lunch program, childcare assistance,
All workers
30%
low income home energy assistance program, section 8 housing, and housing
20%
choice vouchers.5 We analyze public program utilization and cost data to estimate annual benefit expenditures on the families of full-service restaurant
10%
workers for the years 2009-2013.
Main Findings
• Nearly half of the families of full-service restaurant workers are enrolled in one or more public-assistance programs.6
• The cost of public assistance to families of workers in the full-service
restaurant industry is $9,434,067,497 per year.7
• Tipped restaurant workers live in poverty at 2.5 times the rate of the
overall workforce.8
• Restaurant workers as a whole experience poverty at a rate over twice
that of the overall workforce – 20.9%.9
• Large full-service restaurant companies like Darden and DineEquity
pay their workers so little that many of the employees of these companies rely on taxpayer-funded programs.10
• The taxpayer cost of a single Olive Garden is $196,970 annually.11
Estimated annual cost of public assistance at the
five largest full-service restaurant companies13
table 1
CompanyEstimated Annual Average Cost of
Public Assistance Provided to Employees
DineEquity
$449,569,135
Darden
$339,772,942
Brinker International
$237,432,503
Bloomin’ Brands
$233,711,874
Cracker Barrel $166,870,371
1
Introduction
table 2
Median wages for full-service restaurant occupations14
Occupation
2014 Median Wage
Chefs and head cooks
$18.77
First-line supervisors/managers
of food preparation and serving workers
$14.80
Cooks$10.58
Food preparation workers
$9.61
Bartenders$9.27
Waiters and waitresses
$8.98
Dining room and cafeteria attendants,
bartender helpers, and miscellaneous food
preparation and serving related workers
$8.92
Dishwashers$8.97
Hosts and hostesses, restaurant,
lounge, and coffee shop workers
$8.96
Food preparation and serving
related workers, all other
$9.52
Every year on tax day, when American taxpayers pay their fair share to sustain
crucial public services, they also get stuck with a multi-billion dollar tax bill to
cover outsized subsidies and tax breaks that benefit the country’s largest companies. With many high-growth industries paying their employees too little
to meet basic needs for their families, a growing number of working families
must supplement their income with publicly funded programs. Full-service
restaurant workers are at the core of America’s growing low-wage economy;
many of these workers’ earnings are far below what’s needed to meet their
subsistence needs.
This report estimates the cost to the public as a result of low wages and
scarce benefits in the full-service restaurant industry. To measure these costs,
we draw upon publicly available administrative and survey data on major
means-tested benefit programs. We estimate that the cost of these programs
for families of full-service restaurant workers averaged nearly $9.5 billion per
year from 2009-2013.
While the full-service restaurant industry thrives, the workers who cook,
clean, prepare, and serve food in the nation’s restaurants struggle with poverty
wages. Over 21% of tipped restaurant workers live in poverty — that’s 2.5
times the rate of the overall workforce.15
Conditions for full-service restaurant workers closely reflect those experienced within the industry as a whole. Nearly half of the families of full-service
restaurant workers are enrolled in one or more public programs.16
Data Sources and Methods
This section provides an overview of our data sources and methods; for a detailed explanation of our
methodology see Appendix.
Our estimate of the public cost of low-wage work for full-service restaurant workers is based on
combining data on employment and public program participation with administrative data on participation levels and costs for relevant programs. This estimate draws upon an analysis of major means-tested
public benefit programs that function as income supplements for low-income families. Public benefit
programs analyzed include: health insurance (Medicaid and Children’s Health Insurance Program, or
Chip, coverage), the federal earned income tax credit (EITC), food stamps (the Supplemental Nutrition
Assistance Program, or SNAP), basic household income assistance (Temporary Assistance for Needy
Families, or TANF), the national school lunch program, childcare assistance, low income home energy
assistance program, section 8 housing, and housing choice vouchers. Our analysis of public benefits
to employed workers covers benefits directly provided to full-service restaurant workers as well as their
family as a whole. This includes restaurant workers with children enrolled in the CHIP program and
other benefits provided at the family level such as SNAP and EITC.
2
Data Sources
To carry out our analysis we combined government administrative data containing enrollment
and cost data for major public support programs with information available in the Current
Population Survey (CPS). Together, these sources allow us to estimate the total amount of
public benefits paid to full-service restaurant workers. In cases where government administrative program data is underrepresented in the CPS, we adjusted the CPS data to match the government
data and correct a well-documented undercount of certain program enrollment.17 In combining the CPS
and administrative data, we selected a multiyear period (2009-2013) that minimized the impact of annual
fluctuations in program costs and enrollment.
Findings
As a foundation for our estimate of the pubic cost of
low-wage jobs in the full-service restaurant industry
we analyzed enrollment and expenditure data for major public programs in order to generate an average
cost per family for the benefits analyzed. From 2009
through 2013, total support for major public assistance
programs averaged $631.64 billion annually. Medicaid
and CHIP account for about 70 percent of the total
costs. The Earned Income Tax Credit and Food Stamps
are the next most costly benefits, amounting to 20 percent of the remaining expenditures.
After determining the average costs per family for
the relevant benefit programs, we then proceeded to
estimate the number of people participating in the
programs who are full-service restaurant workers. We
identified full-service restaurant workers in the Current Population Survey (CPS) dataset by drawing upon
Occupational Employment Statistics (OES) from the
Bureau of Labor Statistics (BLS). Using OES data,
we modeled full-service restaurant workers within the
broader food service restaurant occupations defined
in the CPS. Combining government administrative
data with figures drawn from the CPS allowed us to
generate an estimate of the cost-per-worker of major
public programs for full-service restaurant employees.
We find that the total cost of public programs for
table 3
Enrollment and costs of public support programs | annual average 2009-201318
Federal ProgramEnrollmentExpenditureAverage Annual Cost per Recipient
EITC
27,680,000$62,620,000,000
$2,278
Medicaid and CHIP
59,893,116
$448,120,295,408
$7,482
Food Stamps
42,549,200
$67,355,383,600
$1,583
TANF
4,143,722$10,773,783,605
School Lunch
31,480,248
$14,260,200,000
$454
Energy Assistance
7,393,204
$4,173,838,690
$563
Childcare Assistance
934,920
$8,734,616,280 $9,360
Housing Assistance
2,265,571
$15,598,456,335
$6,885
$2,599
Sources: 2009-2013 March CPS & ACS, program administrative data.
table 4
Public program enrollment and costs19
Full-Service (FS)
Restaurant Program Enrollment
Federal Program
Program Costs
AverageFS Restaurant
Annual Cost
Workers’ Families
per RecipientEnrolled
Cost of Program provision
for FS Restaurant
Workers’ Families
EITC
$2,278
1,346,827
$3,068,610,822
Medicaid or Chip
$7,482
509,310
$3,810,596,867
Food Stamps
$1,583
562,274
$889,872,172
TANF
$2,599
66,700
$173,342,050
School Lunch $454
679,062
$307,983,214
Energy Assistance
$563
118,184
$66,509,774
Childcare Assistance
$9,360
25,967
$243,064,999
Housing Assistance $6,885
126,947
$874,087,599
Total cost of benefits to full-service restaurant workers’ families: $9,434,067,497
Sources: 2009-2013 March CPS & ACS, program administrative data.
3
the Big Five
in Full Service
rd
Da
e n R e s ta u r a n
1
ts
D
arden is the dominant presence in the full-service restaurant sector, with more than
1,500 locations that serve more than 320 million meals per year. Along with its Olive
Garden restaurants, which can be found throughout the United States, the company
owns six smaller chains: LongHorn Steakhouse, Capital Grille, Bahama Breeze, Seasons 52, Eddie
V’s and Yard House. Darden recently sold the Red Lobster chain of seafood restaurants.
Darden, which has more than 150,000 employees, has been embroiled in numerous controversies
over its labor practices and is a leading opponent of workplace reforms such as paid sick days. It
has paid out several million dollars to settle lawsuits concerning the failure to pay overtime and
requiring off-the-clock work, and additional class actions are pending.
Through its leadership in the National Restaurant Association, Darden has fought against improvements in the minimum wage, especially for tipped employees. In states such as Florida, Darden
officials are reported to have pressed legislators to pass laws pre-empting local efforts to improve
wages and working conditions.
There have also been allegations that Capital Grille has engaged in a pattern of racial discrimination, including the denial of better-paid server and bartender jobs to non-white workers. In 2009,
the U.S. Equal Employment Opportunity Commission announced that Darden’s Bahama Breeze chain
would pay $1.3 million to settle allegations that managers at its restaurant in Beachwood, Ohio
had subjected 37 black workers to repeated overt racial harassment. In addition to the monetary
relief, the chain signed a three-year consent decree requiring it to improve its anti-discrimination
practices throughout the country.
With its board now controlled by New York-based hedge fund Starboard Value, Darden seems more
intent than ever to drive down working standards in order to realize gains for Wall Street.
CEO Pay
In fiscal year 2014 then-chief executive Clarence Otis, Jr. received annual compensation totaling $7
million and realized $2.6 million in value on the exercise of previously awarded stock options. In February
2015 Eugene Lee, Jr. took over as CEO.
Political Influence
In the last two election cycles (since 2011-2012) the Darden political action committee has made
$951,000 in contributions to federal candidates. Darden has also greatly increased its lobbying
expenditures in recent years, spending more than $1 million a year to influence federal policy.
Big Five profiles prepared by Good Jobs First.
Who is the NRA?
families of workers in the full-service restaurant industry averaged over $9.4 billion per
year between 2009 and 2013. More than 1.3 million families of full-service restaurant
workers receive the Earned Income Tax Credit, about double the number enrolled in
any other program. 679,062 children of full-service restaurant workers receive a free
or subsidized school lunch. 562,274 families of full-service restaurant workers depend
on food stamps to meet their basic needs. 509,310 families of full-service restaurant
workers receive a form of public healthcare assistance. These programs provide a vital
lifeline for poverty-wage full-service restaurant workers and their families. However,
through these programs taxpayers also subsidize America’s largest and most successful
restaurant employers.
Full-Service Restaurants
The full-service restaurant industry is defined by large iconic brands whose household
names generate billions in earnings each year. However, while industry chief executives
enjoy abundant compensation packages and shareholders receive generous rewards
through dividends and share buybacks, the workers who make these restaurants successful are among the lowest paid in the workforce. Finding themselves left out from
the rewards generated through their labor, millions of full-service restaurant workers
must rely on public assistance in order to meet their basic needs.
Low wages and lack of benefits at the five largest full-service restaurant companies in
the U.S. cost taxpayers an estimated $1.4 billion per year. These large corporations benefit
from paying their workers tax-payer-subsidized low wages, while shifting huge rewards
towards chief executives and shareholders. Just last year these companies collectively:
• Earned $704,746,000 in profits;
• Paid $27,173,422 to their chief executives;
• Distributed $750,549,000 in dividends and buybacks.
table 5
Five largest full-service restaurant companies by size of U.S.–based restaurant workforce26
CompanyEstimated Total U.S.Total U.S. RestaurantsEstimated Average Employees
Restaurant Workforce
Per U.S. Restaurant
DineEquity 182,5943,449
53
Darden
138,0001,501
92
Brinker International
96,434
1,615
60
Bloomin’ Brands
94,923
1,288
74
Cracker Barrel 67,775
633
107
Payroll data for individual full-service restaurant companies is not publicly available,
so we estimate the cost of public assistance attributable to a particular company by
applying the average public cost per employee for participation in public benefit programs generated above to the number of employees working under a particular brand.
The National Restaurant Association (NRA) is the
trade lobby for the $700 billion restaurant industry. With annual revenues of over $91 million, 750
staff, and nearly 40 congressional lobbyists, the
NRA is one of the most powerful business lobbies
in Congress and state legislatures.20
The NRA’s legislative agenda centers on opposing policies that improve working conditions and
public health such as minimum wage increases,
paid sick days, nutritional menu labeling, and
regulation of sodium, trans fats, and sugars.21
The NRA has been one of the fiercest and most
effective opponents against initiatives to raise the
minimum wage around the country.22
Opposing raises for tipped workers – more than
two-thirds of whom are women- through minimum
wage increases is a particular priority for the NRA.
As the leading force keeping the federal tipped
minimum wage at $2.13, the NRA bears special
responsibility for the gender inequities produced
by maintaining subminimum wages for tipped
workers which result in the restaurant industry
being the single largest source of sexual harassment claims to the Equal Employment Opportunity
Commission.23
Taking cues from the American Legislative Exchange Council (ALEC), the NRA has lobbied
successfully to pass legislation that prevents
localities from getting to vote on paid sick days,
strips states of their right to enact nutrition labeling requirements, and obstructs the advancement
of women’s equality by opposing the Paycheck
Fairness Act, the Pregnancy Discrimination Act,
and the Family Medical Leave Act.24
The most recognizable members of the NRA include
brand-name industry giants like McDonalds, Yum!
Brands (the owner of Taco Bell and KFC), Disney,
and Darden Restaurants (the owner of Olive Garden, Longhorn Steakhouse, and Capital Grille).25
5
the Big Five
in Full Service
D I N E e qu i t y
2
F
ormerly known as IHOP Corporation, DineEquity
is the parent company of the IHOP chain of pancake-focused restaurants that began in 1958,
as well as the Applebee’s chain of full-service grill and bar
casual dining restaurants. The latter was acquired in 2007,
and the DineEquity name was adopted the following year.
DineEquity operates throughout the United States and in
more than a dozen foreign countries, with nearly 2,000 Applebee’s and 1,600 IHOP locations employing a total of about
200,000 workers. Nearly all of the restaurants are franchise
operations. In 2014 the company had $36 million in profit on
revenues of $655 million.
Applebee’s is among the restaurant chains accused of not
paying minimum-wage rates for untipped work. In 2014 a
group of former employees of one of the chain’s franchise
operators received a $2.7 million settlement over the issue.
Other class action lawsuits involving Applebee’s workers are
pending. Some IHOP franchisees are facing legal actions
concerning overtime and minimum wage issues.
Some Applebee’s franchisees have also faced charges of
sexual harassment. In 2011 one operator in North Dakota
paid $1 million to settle allegations of this kind brought by
the U.S. Equal Employment Opportunity Commission.
CEO Pay
In 2014 chief executive Julia Stewart received annual
compensation totaling $6.6 million as well as realizing more
than $6.9 million in value from the exercise of stock options
and vesting of stock awards granted in previous years.
Political Influence
In the last two election cycles (since 2011-2012) the DineEquity political action committee has contributed $16,000
to federal candidates. During the same period the company
spent $930,000 on federal lobbying activities.
blo
omin’ brands
3
B
loomin’ Brands is one of the largest full-service restaurant companies, with four chains:
Outback Steakhouse, Carraba’s Italian Grill,
Bonefish Grill, and Fleming’s Prime Steakhouse and Wine
Bar. Its 1,510 locations, which are mostly company-owned,
can be found in 48 states and 21 other countries. In 2014
Bloomin’ had net income of $95 million on revenues of $4.4
billion.
Formerly known as OSI Restaurant Partners, the company
was acquired in 2007 by a private equity group led by Bain
Capital. The owners staged an initial public offering in 2012,
and Bain sold the last of its holdings in March 2015.
In 2014 a federal court conditionally certified a class action
lawsuit alleging that Outback Steakhouse improperly
required unpaid off-the-clock work by employees. The case
reportedly covers some 100,000 workers. Other cases are
also pending.
In 2009 the company had to pay $19 million to settle a
class action lawsuit brought by the U.S. Equal Employment
Opportunity Commission alleging sex discrimination against
thousands of woman employed at its corporate-owned
restaurants nationwide with regard to terms and conditions
of employment as well as opportunities for advancement. In
2013 the company had to pay $65,000 to settle a disability
discrimination lawsuit filed by the EEOC on behalf of employees of an Outback Steakhouse in Phoenix.
CEO Pay
In 2014 chief executive Elizabeth Smith received annual
compensation totaling $6.2 million and realized $8.5 million
in value upon the exercise of previously awarded stock
options.
Political Influence
In the last two election cycles (since 2011-2012) the Bloomin’ Brands political action committee contributed more than
$1 million to federal candidates. During the same period
Bloomin’ spent $570,000 on federal lobbying activities.
Big Five profiles prepared by Good Jobs First.
DineEquity, the largest full-service restaurant franchiser, accounts for the largest expenditures on public benefits
at nearly $450 million annually.28 Next in line is Darden
Restaurants, the largest full-service restaurant company that
directly employees its workers, and the largest in terms of
revenue.29 Darden’s workforce collects an estimated $340
million annually.30 Broken down to the restaurant level,
this translates into a taxpayer cost of $196,970 to support
employees at an average-sized Olive Garden.31 The strong
financial condition of these full-service restaurant companies, while not reflected in workers’ wages, is evident in the
generous executive compensation packages, dividends, and
stock buybacks that characterize their operations.
Not only do the largest full-service restaurant companies
generously reward executives and shareholders while maintaining tax-payer-subsidized low-wages for their workforce,
but they also aggressively lobby to cement this imbalance between those at the top of the restaurant industry and those
at the bottom. The legislative priorities of full-service restaurant companies and their industry trade group, the National
Restaurant Association, center on protecting an unfair system
that allows certain employers to pay workers subminimum
wages and targeting other worker-friendly policies such as paid
sick leave and fair scheduling laws.34 The five largest full-service
restaurant companies collectively spent $10,954,988 on federal
lobbying and contributions since 2011.
As leaders in the nation’s restaurant industry, these companies could pursue a policy agenda of improving restaurant
industry standards. Instead, they drive an agenda that diminishes public health and working conditions. While full-service
restaurant industry chief executives and stockholders enjoy
hundreds of millions in rewards, the workers whose labor is
the foundation of this success are forced on the public dole.
Taxpayers are left to bridge the gap between poverty wages
and subsistence for millions of full-service restaurant workers.
Tipped
Sub-Minimum
Wage
Estimated annual cost of public assistance to employees
at the top five largest full-service restaurant companies27
figure 2
DineEquity
Darden
Brinker International
Bloomin’ Brands
Cracker Barrel
$
$300 Million
$150 Million
$450 Million
Financial condition of the largest full-service
restaurant companies in the U.S. in FY 201432
table 6
Company
CEOTotal CEO
Profits
Compensation DineEquity
Julia A. Stewart
Darden
$5,773,422
$36,453,000
Dividends and
Stock Buybacks
$74,800,000
Clarence Otis Jr.33$7,000,000 $286,200,000$288,800,000
Brinker International Wyman Roberts
$3,600,000
$154,039,000
$302,992,000
Bloomin’ Brands
Elizabeth Smith
$6,200,000
$95,926,000
$0
Cracker Barrel
Sandra Cochran
$5,600,000
$132,128,000
$83,957,000
Federal lobbying and contributions
from top five full-service restaurant companies39
table 7
CompanyFederal Political Spending since 2011
Darden$6,829,409
Bloomin’ Brands
$1,968,374
DineEquity$950,990
Brinker International
$680,608
Cracker Barrel
$525,607
Since 1991, the federal tipped sub-minimum wage has been
set at $2.13 per hour. States may establish a minimum wage
that is higher than the federal government’s. This has resulted
in a patchwork of state policies in which, effectively, restaurant
workers in 22 states receive the federal sub-minimum wage
of $2.13 per hour, restaurant workers in 20 states receive a
slightly higher state sub-minimum wage of between $2.13 and
$5.00 per hour, and restaurant workers in eight states receive
the full minimum wage because those states have chosen to
pay an equal wage to both tipped and non-tipped workers.35
Poverty rates for tipped workers – particularly for women, who
make up 66% of all tipped workers, and for people of color,
who make up 40% of the total — are higher in states that
pay a $2.13 sub-minimum wage than in states that pay one
minimum wage for tipped and non-tipped workers.36,37
In 2013, Darden Restaurants reported that it pays 20% of its
hourly workforce the tipped subminimum wage of $2.13.38
7
the Big Five
in Full Service
b
k
rin
er in te r nati o n
4
al
B
rinker International is the parent company
of the Chili’s Grill & Bar casual dining chain
(founded in 1975) as well as the smaller Maggiano’s Little Italy chain. A bit over half of the 1,500 Chili’s
locations are company-owned, as are all of the four dozen
Maggiano’s locations. In fiscal year 2014 the company, which
sold its majority interest in Romano’s Macaroni Grill in 2008,
had profits of $154 million on revenue of $2.9 billion.
Like other older casual dining chains, Chili’s has been
struggling with the tendency of consumers to opt either for
cheaper, faster options such as Chipotle or more sophisticated, upscale choices.
In a class action case brought against Brinker, the California
Supreme Court ruled in 2012 that employers in the state
had to provide uninterrupted meal and rest breaks. The case
was later settled for about $44 million. Other overtime suits
against the company are pending.
In 2011 a federal appeals court upheld a lower court ruling
that Chili’s had unlawfully required its servers to share their
tips with expediters.
In 2004 Chili’s was faced with a spate of lawsuits stemming
from a salmonella outbreak at one of its suburban Chicago
locations.
CEO Pay
In fiscal year 2014 chief executive Wyman Roberts received
annual compensation totaling $3.6 million as well as realizing $3.5 million in value from the exercise of stock options
and vesting of stock awards granted in previous years.
Political Influence
In the last two election cycles (since 2011-2012) the Brinker
political action committee contributed $208,000 to federal
candidates. During the same period Brinker spent $320,000
on federal lobbying activities.
crac
ker barrel
5
C
racker Barrel Old Country Store, Inc. is the
parent company of about 630 Cracker Barrel
full-service restaurants in 42 states, with the
largest concentration in the Southeast. The locations, all
company-owned, serve “home-style country food” and sell
food, apparel, and houseware items through their gift shops.
In fiscal year 2014 the company (also known as CBRL Group)
had profits of $132 million on $2.7 billion in revenue.
In the early 1990s the chain was at the center of a controversy over employment policies that were said to discriminate
against gay and lesbian workers. The company announced
that it would eliminate discriminatory policies but continued
to score low in ratings compiled by groups such as the Human Rights Campaign. The company later faced charges of
discriminating against African-American customers. In 2004
it settled a lawsuit brought by the U.S. Justice Department
by signing a consent decree requiring it to adopt extensive
non-discrimination policies.
In recent years Cracker Barrel has also faced lawsuits
alleging that it improperly denies overtime pay to employees
such as associate managers who perform non-exempt work.
Several proposed class action and collective action suits are
currently pending.
CEO Pay
In fiscal year 2014 chief executive Sandra Cochran received
annual compensation totaling $5.6 million as well as realizing $8.8 million in value from the exercise of stock options
granted in previous years.
Political Influence
In the last two election cycles (since 2011-2012) the Cracker
Barrel political action committee contributed $106,000 to
federal candidates. During the same period Cracker Barrel
spent $400,000 on federal lobbying activities.
Big Five profiles prepared by Good Jobs First.
Recommendations for Policymakers,
EMPLOYERS, AND the PUBLIC
Our analysis of the public cost of low wages in the full-service restaurant industry indicates
that both workers and taxpayers would benefit from improved pay and benefits provided to
restaurant workers. Retail and fast food industry leaders have slowly begun to raise wages
for their lowest paid workers, recognizing the value of retaining skilled workers as well as responding to
increasing public concern and worker mobilization around poverty wages. Major full-service restaurant
employers like Darden would benefit from taking these lessons on board. Moreover, polling conducted
by Americans for Tax Fairness indicates that Americans desire a tax system that requires large corporations
and the wealthy to pay their fair share.40
Policymakers should:
• Enact, without delay, One Fair Wage, eliminating the tipped sub-minimum wage and
raising the minimum wage.
• Enact a legislative requirement that places special emphasis on raising wages at large
companies that place outsized burdens on public spending.
• Ensure robust funding for vital programs that provide a lifeline for working families.
• Publicly support collective organizing among restaurant workers to help them improve
conditions in their workplace.
Employers should:
• Invest in their workforces by increasing wages and benefits.
• Respect workers’ rights to organize collectively to improve conditions in their workplace.
• Create career ladders in the restaurant industry that provide opportunity for people of color,
immigrants, and women to move into higher paying positions in the industry.
The public should:
• Demand that legislators listen to workers, not a trade lobby like the NRA.
• Speak up every time you eat out by using the ROC National Diners Guide app.
Our app gives diners a voice and an opportunity to express to restaurant owners that fair wages,
access to paid sick days, and internal advancement opportunities are important to customers:
www.rocunited.org/dinersguide.
• Taxpayers should demand that their dollars go where they are needed most, not to subsidize
low wages at large corporations.
9
Appendix
Our estimate of the public cost of low-wage work for full-service
restaurant workers is based on combining data on employment
and public program participation with administrative data on
participation levels and costs for relevant programs.
Public Programs Analyzed
Our estimate of the public cost of low wages in the full-service restaurant industry
is based on an analysis of major means-tested public benefit programs that function
as income supplements for low-income families. Public benefit programs analyzed
include: Health insurance (Medicaid and Children’s Health Insurance Program, or
Chip, coverage), the Federal Earned Income Tax Credit (EITC), food stamps (the
Supplemental Nutrition Assistance Program, or SNAP), basic household income assistance (Temporary Assistance for Needy Families, or TANF), The National School
Lunch Program, Childcare Assistance, Low Income Home Energy Assistance Program,
Section 8 Housing and Housing Choice Vouchers. Our analysis of public benefits to
employed workers covers benefits directly provided to full-service restaurant workers
as well as their family as a whole, including restaurant workers with children enrolled
in the CHIP program and other benefits provided at the family level such as SNAP
and EITC.
Data Sources
To carry out our analysis we combined government administrative data containing
enrollment and cost data for major public support programs with information available
in the Current Population Survey (CPS). Together these sources allowed us to estimate
the total amount of public benefits paid to full-service restaurant workers. In cases
where government administrative program data were underrepresented in the CPS,
we adjusted the CPS data to match the government data & correct a well-documented
undercount of certain program enrollment.
In combining the CPS and administrative data, we selected a multiyear period
(2009-2013) that minimized the impact of annual fluctuations in program costs and
enrollment.41
10
Identifying Full-Service Restaurant
Workers in the Census Data
We identified full-service restaurant workers by using 2011 OES data to model
full-service restaurant workers in our CPS sample. Using 2011 OES breakdowns we
determined the representation of full-service restaurant workers within OCC codes
that were used to determine benefit usage in other datasets.42
OCC
Code
Occupation
4000
Chefs and head cooks
49%
4010
First-line supervisors/managers
of food preparation and serving workers
26%
2011 OES % Full-Service43
4020Cooks
47%
4030
27%
Food preparation workers
4040Bartenders
41%
4110
Waiters and waitresses
77%
4130
Dining room and cafeteria attendants, bartender helpers,
and miscellaneous food preparation and serving related worker
59%
4140Dishwashers
65%
4150
Hosts and hostesses, restaurant, lounge, and coffee shop
85%
4160
Food preparation and serving related workers, all other
28%
Estimating public cost of low wages
by Full-Service Restaurant Company 44
The estimated total U.S. restaurant workforce for each company was calculated by
multiplying the estimated average employees per restaurant by the total U.S. restaurant
locations for each company. Estimated total U.S. restaurant workforce refers only to
restaurant employees, and excludes corporate staff, supply chain employees, and other
non-restaurant workers.
Total US restaurants included corporate-owned and franchised locations. Analysis
of employees per restaurant was based on analysis of data contained in public filings
for each company. Restaurant workforce estimates for franchised brands are based on
average employees per restaurant at company-owned stores.
Total public cost for each company was estimated by multiplying the average public
cost per employee in the full-service restaurant industry by the number of restaurant
workers at each company.
11
Endnotes
1 Current Population Survey (CPS), 2013. Calculations by the Restaurant Opportunities Centers
United (ROC United) based on Ruggles et al., Integrated Public Use Microdata Series: Version
5.0 [Machine-readable database]. Minneapolis: Minnesota Population Center, 2010.
2 Employment projections. Bureau of Labor Statistics (BLS). Retrieved March 4, 2015, from
http://data.bls.gov/projections/occupationProj.
3 ROC United analysis of BLS, Occupational Employment Statistics (OES), 2014. National
Cross-Industry Estimates sorted by median hourly wage for all Standard Occupational
classifications.
4 “McDonald’s Minimum Raise.” The Editorial Board, New York Times, April 3, 2015, The
Opinion Pages sec.
5 We focused on this set of public benefits for our analysis due to the availability of data that
links administrative costs and program enrollment.
6 CPS, 2013. Calculations by ROC United based on Ruggles et al., Integrated Public Use Microdata Series: Version 5.0 [Machine-readable database]. Minneapolis: Minnesota Population
Center, 2010.
7 ROC United analysis of 2009-2013 March CPS & ACS, program administrative data.
8 American Community Survey (ACS), 2013. Calculations by ROC United based on Ruggles
et al., Integrated Public Use Microdata Series: Version 5.0 [Machine-readable database].
Minneapolis: Minnesota Population Center, 2010.
9 ACS, 2013. Calculations by ROC United based on Ruggles et al., Integrated Public Use Microdata Series: Version 5.0 [Machine-readable database]. Minneapolis: Minnesota Population
Center, 2010.
10 Total cost for each company is estimated by multiplying the average public cost per
employee in the full-service restaurant industry by the total number of restaurant workers
at each company.
11 Ibid.
12 CPS, 2013. Calculations by ROC United based on Ruggles et al., Integrated Public Use
Microdata Series: Version 5.0 [Machine-readable database]. Minneapolis: Minnesota
Population Center, 2010.
13 Total cost for each company is estimated by multiplying the average public cost per
employee in the full-service restaurant industry by the total number of restaurant workers
at each company.
14 Occupation Profiles. May 14. BLS. Retrieved April 4, 2015, from http://www.bls.gov/oes/
current/oes_stru.htm#35-0000.
15 ACS, 2013. Calculations by ROC United based on Ruggles et al., Integrated Public Use
Microdata Series: Version 5.0 [Machine-readable database]. Minneapolis: Minnesota
Population Center, 2010.
16 CPS, 2013. Calculations by ROC United based on Ruggles et al., Integrated Public Use
Microdata Series: Version 5.0 [Machine-readable database]. Minneapolis: Minnesota
Population Center, 2010.
17 See Davern, Michael, Jacob Alex Klerman, David K. Baugh, Kathleen Thiede Call, and George
K. Greenberg. 2009. “An Examination of the Medicaid Undercount in the Current Population
Survey: Preliminary Results from Record Linking.” Health Services Research 44 (3): 965987; Wheaton, Laura. 2008. “Under-Reporting of Means-Tested Transfer Programs in the
CPS and SIPP.” Washington, D.C.: The Urban Institute.
18 CPS, 2009-2013. Calculations by ROC United based on Ruggles et al., Integrated Public
Use Microdata Series: Version 5.0 [Machine-readable database]. Minneapolis: Minnesota
Population Center, 2010. Program administrative data containing cost & enrollment figures
accessed from the following sources: EITC data from http://www.acf.hhseitc.irs.gov/sites/
default/files/ofa/, and http://www.eitc.irs.gov/EITC-Central/eitcstats; Medicaid data from
http://medicaid.gov/medicaid-chip-program-information/by-topics/data-and-systems/
mbes/cms-64-quarterly-expense-report.html; Food stamps: CHIP data from http://
medicaid.gov/medicaid-chip-program-information/by-topics/data-and-systems/mbes/
cms-21-chip-expenditures-report-page.html, and http://medicaid.gov/chip/downloads/
fy-2013-childrens-ever-enrolled-report.pdf, SNAP data from http://www.fns.usda.gov/pd/
supplemental-nutrition-assistance-program-snap; TANF data from http://www.acf.hhs.
gov/sites/default/files/ofa/fy_2013_expenditures.pdf, and https://www.acf.hhs.gov/sites/
default/files/ofa/2013_recipient_tan.pdf; School Lunch data from http://www.fns.usda.gov/
pd/child-nutrition-tables; Energy Assistance data from http://www.acf.hhs.gov/programs/
ocs/resource/fy-2012-allocation-of-liheap-block-grant-funds; Childcare Assistance data
12
from http://www.acf.hhs.gov/programs/occ/resource/ccdf-expenditure-data-all-years; and
Housing Assistance data from: gao.gov.data and http://www.cbpp.org/files/4-13-11housUS.pdf. All data were accessed on March 1st, 2015.
19 Ibid.
20 R OC United, et al. April 28, 2014. The Other NRA: Unmasking the Agenda of the National
Restaurant Association. New York, NY: Restaurant Opportunities Centers United.
21 Ibid.
22 Ibid.
23 Ibid.
24 Ibid.
25 Ibid.
26 E stimated total U.S. restaurant workforce for each company is calculated by multiplying the
average employees per restaurant by the total U.S. restaurant locations for each company.
Estimated total U.S. restaurant workforce refers only to restaurant employees, and excludes
corporate staff, administrative personnel, supply chain employees, and other non-restaurant workers. Restaurant workforce estimates for franchised brands are based on average
employees per restaurant at company-owned stores. Employee number data accessed
through Company Annual Reports. Accessed via SEC Edgar on April 4, 2015.
27 T otal cost for each company is estimated by multiplying the average public cost per
employee in the full-service restaurant industry by the total number of restaurant workers
at each company.
28 Ibid.
29 C ompany Annual Reports. Accessed via SEC Edgar on April 4, 2015.
30 Ibid.
31 Ibid.
32 Company Annual Reports. Accessed via SEC Edgar on April 4, 2015.
33 E ffective July 2014, Eugene Lee replaced Clarence Otis as Interim CEO of Darden and took
on the role permanently in February 2015. Total compensation refers to the most recent
Darden 10-K filing (March 4 2015).
34 R OC United, et al. April 28, 2014. The Other NRA. New York, NY: Restaurant Opportunities
Centers United.
35 S even states have no subminimum wage. In addition, Hawaii currently pays tipped workers
a quarter less than the full minimum wage. However, by January 2018 the tipped minimum
wage in Hawaii will increase to $10.10 for all tipped workers who earn less than $17.10/
hour including tips.
36 R obbins, K. G., Vogtman, J., Entmacher, J. (2014). States with Equal Minimum Wages for
Tipped Workers Have Smaller Wage Gaps for Women Overall and Lower Poverty Rates for
Tipped Workers Washington DC: National Women’s Law Center.
37 R OC United, National State of Tipped Workers, 2014.
38 J ennings, L. (2013, Sep 25). Nation’s Restaurant News. “Darden defends pay practices.”
Retrieved April 6, 2015.
39 F ederal Lobbying and Federal Campaign Contributions accessed at OpenSecrets.org.
40 P olling on Tax Fairness Issues. March 2015. Americans for Tax Fairness. Retrieved April 4,
2015, from http://www.americansfortaxfairness.org/files/3.19.15-ATF-Polling-Questionson-Tax-Fairness-Issues-Final.pdf.
41 S ee Davern, Michael, Jacob Alex Klerman, David K. Baugh, Kathleen Thiede Call and George
K. Greenberg. 2009. “An Examination of the Medicaid Undercount in the Current Population
Survey: Preliminary Results from Record Linking.” Health Services Research 44 (3): 965987; Wheaton, Laura. 2008. “Under-Reporting of Means-Tested Transfer Programs in the
CPS and SIPP.” Washington, D.C.: The Urban Institute.
42 A lthough OES full service data are not available for 2012 and 2013, the data for 2011 fall
squarely in the center of our combined range of 2009-2013. Full Service employees were a
combined 54% of all restaurant employees in 2011, and 53% of all restaurant employees
in 2014.
43 N ational Occupational Employment and Wage Estimates. May 2011. BLS. Retrieved April 4,
2015 from http://www.bls.gov/oes/2011/may/oes_nat.htm.
44 C ompany Annual Reports. Accessed via SEC Edgar on April 4, 2015.
Picking up the NRA’s Tab
The Public Cost of Low Wages in
the Full-Service Restaurant Industry
Restaurant Opportunities Centers United
275 Seventh Avenue, Ste 1703
New York, NY 10001
212.343.1771
[email protected]
www.rocunited.org


© Copyright 2026