
Yogurt Shop Business Plan by SBPHawaii
Yogurt Shop Business Plan by SBPHawaii Yogurt Shop Confidentiality Agreement This agreement is to acknowledge that the information provided by Xxxxxxxxand/ or Yogurt Shop Inc., (herein also referred to or as “The Company”) in this business plan is unique to this business plan and confidential; therefore, anyone reading this plan agrees not to disclose any of the information in this business plan without the expressed written permission of Yogurt Shop Inc. It is also acknowledged by the reader that unauthorized dissemination of the information furnished in this business plan other than information that is in the public domain may cause serious harm or damage to The Company and will be kept in the strictest confidence. Upon request, this document is to be immediately returned to Yogurt Shop Inc. Signature ____________________ Name (typed or printed) ________________________ Date ___________________________ This is the business plan for Yogurt Shop Inc. The presentation of this business plan does not imply an offering of securities. TABLE OF CONTENTS 7.7 Sales Strategy 7.8 Sales Forecast 7.9 Explained Timelines and Milestones 22 22 23 8.0 Management & Personnel 8.1 Management commitments 8.2 Organizational Structure 8.3 Management 8.4 Workforce Gaps 8.5 Professional Advisors 8.6 Staffing and Payroll 24 24 24 25 25 25 26 9.0 Budget: Financial Plan 9.1 Important Assumptions 9.2 Key Financial Indicators 9.3 Explanation of Balance Sheet 9.4 Explanation of Profit and Loss 9.5 Explanation of Cash Flow 9.6 Breakeven Analysis 9.7 Business Ratios 9.8 Financial Highlights 27 27 27 28 28 29 29 30 31 10.0 Balance Sheet 32 11.0 Profit and Loss Statement 33 12.0 Cash Flow Statement 34 16 16 16 17 17 13.0 Monthly Details 13.1 Revenue Projections 13.2 Staffing & Payroll 13.3 Profit and Loss Statements 13.4 Cash Flow Statements 35 35 38 39 42 17 18 18 14.0 References 45 2.0 Table of Contents 2 3.0 Executive Summary 3.1 Introduction 3.1.1 Unique Selling Proposition 3.1.2 Barriers to Entry 3.2 Objectives 3.3 Mission Statement 3.4 Keys to Success 3 3 3 4 5 6 6 4.0 Company Summary 4.1 Current Status 4.2 Company Ownership 4.3 Start-Up Summary 4.4 Location and Premises 4.5 Competitive Comparison 4.6 Demographics 7 7 7 7 9 9 10 5.0 The Business 5.1 Top Five Priorities 5.1.1 Quality of Product 5.1.2 Professionalism 5.1.3 Training 5.1.4 Customer Retention 5.1.5 Maximizing Profit 5.2 Customer Relations 5.3 Owner/Employee Relations 5.4 Business Model 11 11 12 13 13 14 14 14 15 15 6.0 Market Analysis Summary 6.1 Industry Analysis 6.2 Industry Participants 6.3 Competitive Efficiency 6.4 Market Segmentation 6.5 Target Market and Segmentation Strategy 6.6 Market Trends/Growth 6.7 Company Growth 7.0 Strategy and Implementation 7.1 Strategy Pyramid 7.2 Value Proposition 7.3 Marketing Strategy 7.4 Positioning Statement 7.5 Strategic Alliances 7.6 Pricing Strategy 19 19 19 20 20 20 21 2 3.0 EXECUTIVE SUMMARY 3.1 INTRODUCTION Xxxxxxxx has identified a need in the Sarasota, Florida market that he is committed to fill by launching an enterprise to be branded as Yogurt Shop. The purpose of the Company, Yogurt Shop Inc. is to bring delicious, specialty ice creams, custards, frozen desserts, and other refreshing treats plus Philadelphia-style, renowned food items and beverages to the Sarasota, Florida area. The Company will serve its unique blend of products at its brick and mortar ice cream shop as well as by route and delivery and vehicle (s). Although not new in concept, the quality of the ice cream and the variety of the specialty items will separate it from all other competitors in the South. The purpose of this business plan is to: • Outline the development strategy and sustainable growth of the Company; • Create a guideline for management; • Establish goals against which to measure The Company’s performance; • Leverage the Founder’s initial investment with a line of credit (loan) of $140,000 to launch the enterprise. The funds will be used primarily as startup investment for the purchase of equipment, inventory, storefront rental, utility costs, initial marketing and payroll as well as working capital until the breakeven point is achieved. Xxxxxxxx is the sole owner of Yogurt Shop, Inc. at this time. The primary objectives for the first year of business will be to establish the first shop in the Sarasota area; establish its first delivery/route vehicle, generate brand recognition among local residents; create a loyal following of repeat customers; achieve or surpass financial goals as outlined in the projections; and, reach the breakeven point producing a profit for The Company. 3.1.1 Unique Value Proposition Yogurt Shop will differentiate itself by offering: • Superior quality ice creams and custards; • A friendly, fun location for families to enjoy dessert and other unique Philadelphiastyle food and beverages; • Philadelphia motif and feel 3 Yogurt Shop • More variety than any of the closest competitors; • Sales of frozen novelties and beverages; • Convenience - the Yogurt Shop truck will come to many neighborhoods; • Delivery; • Creamiest, smoothest, Philly-style ice cream and custard in the South; • Appropriate and ample hours of operation; Ultimately, The Company’s value proposition will deliver tangible results to the Customer in terms of: • • • • Quality that is otherwise unavailable in the Sarasota area Greater convenience for the customers Competitive pricing with a “just a buck cone” Greater value for the cost of the product $1 And, to the Company in terms of: • Steadily improving operational efficiency • Steadily increasing market share • Steadily increasing revenues and profits • An ability to meet to grow as a multi-location corporate entity or through franchising 3.1.2 Barriers to Entry Financial Barrier-Moderate The financial barrier is only moderate at $140,000. The anticipated line of credit will overcome this barrier and permit The Company to meet all of its objectives. Technology Barrier-Low The Company will use existing proven technology for production and dispensing its products. It will also install basic Customer Relationship Management (CRM) and Enterprise Resource Planning (ERP) systems assist the sales/customer service staff, control inventories, etc. The system will be accessible buy any Internet connected device to permit the owner to control the business from any location. Competition-Moderate There is general competition from all purveyors of frozen dessert/treat projects, but there is no direct competition. The Company is totally unique in bringing a taste of Philadelphia to the South; and in bringing it in both a brick and mortar location and a vending/delivery vehicle. Competitive Response-Low 4 Yogurt Shop The products offered by Yogurt Shop will include a variety of products hand selected by the Founder and are not available elsewhere in the market. The products are proven to appeal to a cross-section of the community including all ages and they are non-ethnic specific. As a new concept and a new business, the launch will require adequate marketing and advertising in order to introduce the idea to the area. With the anticipated line of credit providing the funding necessary to spread the message and the uniqueness of the concept, The Company will immediately capture market share and build a loyal customer base capable of withstanding any competitive push back. The Founder’s industry and business experience, his familiarity with the Philadelphia culture, the quality and uniqueness of the Company’s products and the innovativeness of the concept combine to create a business model that not only surmounts any barriers to entry, but also serves as the foundation for significant success for Mr. Vindick and Yogurt Shop, Inc. 3.2 OBJECTIVES The Founder of Yogurt Shop Inc. has definite objectives in order to fulfill its desire to participate and achieve a growing market share in the industry. What follows is a brief summary of some of the key objectives of The Company. Yogurt Shop plans to achieve sustainable expansion and market penetration through: 1. Maintaining high visibility in the community through involvement in organizations and sponsorships 2. Listening to what the customers want 3. Hiring and training qualified and friendly personnel 4. Concentrating on and prioritizing customer service 5. Consistently offering the highest quality products (10% butter fat content) 6. Consistently providing a variety of products unique to the market 7. Maintaining a clean, orderly and appealing appearance at the location, as well as the vending, and delivery vehicles. 8. Opening new locations and add vehicles as opportunities arise after “proof of concept” over the next three years 5 Yogurt Shop 3.3 MISSION STATEMENTS Product Mission At Yogurt Shop, the ultimate goal is to formulate and provide to customers, the highest quality soft serve ice cream available as well as Philadelphia-style specialty foods and beverages. By exposing the customer to the highest quality and most unique products, we will raise the customers’ expectations to a level that can only be met by Yogurt Shop. Social/Economic Mission At Yogurt Shop our philosophy is first to allow customers’ to indulge their desires without regret, and secondly to return a portion of the fruits of our labors to the communities in which we operate making them a better place for this and future generations. Yogurt Shop 3.4 KEYS TO SUCCESS The Company is confident that the following attributes will provide the keys to its continued success: Ownership and Management • Mr. Vindick has over a decade of management experience in the food service industry. • Mr. Vindick is an instructor and speaker for the National Restaurant Association. • He will help guide the Company through launch and growth acceleration. • Other employees will be hired based on strict criteria of customer service, product knowledge and willingness to work. Products • Looks good, tastes good, creamiest soft serve available; all food and beverages are of the highest quality • Traditional product yet novel Philly-style concept for the region • Competitive pricing, including $1 cones • Value for product and service offered • Convenient location, mobile service and delivery. Corporate Foundation • Corporation established • Suppliers contacted and relationships forged • Market research conducted • Search for exact location underway • Design layout of store and façade established 6 Yogurt Shop 4.0 COMPANY SUMMARY 4.1 Current Status Yogurt Shop will commence operations as soon as possible after funding is received. The Company recognizes the importance of branding and visually communicating its message. It will establish repetition and continuity of design (and logo usage) on all its marketing, advertising and signage as well on in-store displays, staff apparel and vehicles. The Company set up Twitter, Face book, and MySpace pages for social networking. To increase traffic to these social networking pages, coupons and specials will be extended only through these sites. Further, Yogurt Shop will also develop a website with promotions and opt-in email blasts for additional promotions, birthday specials, etc. Yogurt Shop’s brand recognition will also increase is it sells its prepackaged ice cream and custard products in grocery stores and other retail food outlets. Over the next three years, and as The Company expands, it will modify and increase its product line in response to trends, findings, and demand. While the current focus is on establishing the first location and having the first vehicle in operation Yogurt Shop will simultaneously have its eyes on long-term expansion. This includes more locations, additional vehicles, and increasing the area that The Company serves. 4.2 COMPANY OWNERSHIP Yogurt Shop, Inc. is incorporated under the laws of the State of Florida. The Company is to be owned entirely by Mr. Brian Vindick. Mr. Vindick also operates as Hubert Mitz Flynn Productions, a sole-proprietorship. No other investors or owners are a part of the organization at this time. 4.3 START-UP SUMMARY Yogurt Shop, Inc. is requesting a line of credit of $140,000 to compliment the $5,000 invested by the Founder to initiate a successful launch. The distribution of funds by percentage is reflected in the chart below and the details are explained in the table that follows: 7 Yogurt Shop Use of Funds Advertising 4% Operating Expenses and Working Capital 10% Initial Inventory 14% Capital Expenditures 72% Sources and Uses of Funds SOURCE Owner Equity Line of Credit TOTAL AMOUNT $ 5,000 $ 140,000 $ 145,000 WHERE CAPTURED Cash Flow USES Capital Expenditures Lease Hold Improvements (Construction) Equipment Vehicle Total Capital Expenditures $ 10,000 $ 70,000 $ 25,000 $ 105,000 Cash Flow Cash Flow Initial Product Development Initial Inventory (3 Mos. Supply) Total Initial Product Development $ 20,000 $ 20,000 Cash Flow Cash Flow First Year Operating Expenses and Working Capital Advertising (first 3 months) Working Capital Total First Year Operating Expenses and Working Capital $ 5,000 $ 15,000 $ 20,000 P&L Cash Flow TOTAL $ 145,000 Cash Flow Cash Flow 8 Yogurt Shop 4.4 LOCATIONS AND PREMISES The initial location of Yogurt Shop Inc. will be in one of the number of high-traffic malls in Sarasota. Mr. Vindick is compiling the needed information to make this very important decision. It is expected that the mall will draw 12,000-15,000 patrons daily. The Founder is examining the following factors: • • • • • Visibility Ease of access Parking Cost/lease agreement Proximity to like or compatible businesses The Founder has chosen the Sarasota are as he is committed to the total success of this endeavor, and sees this area as the most favorable to immediately gain market share and a loyal customer base. 4.5 COMPETITIVE ANALYSIS Essentially, any shop selling frozen desserts, or driving an ice cream truck in the Sarasota area could be considered competition for Yogurt Shop. There is a Ben & Jerry’s, a Dairy Queen, a Cold Stone Creamery, and a number of smaller independent ice cream shops. However, there are a number of tangible differences that exclude these companies from being direct competitors with Yogurt Shop. First and foremost will be the Yogurt Shop motif and feel. In Mr. Vindick’s work in this industry, he noted that it was apparent that in Florida, “Customers wanted food from up North.” This stems from the number of tourists and the large number of residents of the state that are implants from the Northeast. Mr. Vindick took these suggestions to heart and realized that Sarasota was the ideal market place for a Philly-Style eatery. Another thing that differentiates Yogurt Shop from the area’s other dessert providers is door-to-door delivery and made-to-order ice cream products. This is a unique service that is otherwise not offered in the area. Additionally, unlike Ben & Jerry’s, Coldstone, or the other chains, Yogurt Shop will also have a mobile ice cream truck. This increases visibility and offers convenience to the customer. In a city the size of Sarasota, it is not unusual to see an ice cream shop close to a campus, downtown area of near a high traffic public park. However, having an ice cream truck that comes to the consumer is a proven successful business model. A model in existence since the mid- 1930’s when these trucks gained dynamic popularity in the United States. It is also interesting to note that at that time the nation, 9 Yogurt Shop and the world was undergoing economic hardships and engulfed in the Great Depression. At that time, none-the-less, ice cream trucks were a very viable and profitable business venture. Also, Yogurt Shop will offer a variety of products that will not be available elsewhere in Sarasota or the surrounding areas (identified in Section 5). Further, the dairy mix of The Company’s ice cream and custard will be the Northeast’s standard, which is far superior to the standard creamery mixes found at malls in the South. Other ice cream providers will offer similar products but none will provide the variety, the depth of service, or the level of quality and creaminess; a mixture that will only be found at Yogurt Shop. The competitive advantage of Yogurt Shop Inc. is that they will be: • A great family location to enjoy a specialty dessert • Something new and different in the area • A place to get authentic Philly-style specialty food and beverages • The highest quality product available in the industry • Indulgence without regret • Door-to-door delivery • Mail order purchasing 4.6 DEMOGRAPHICS Background The demographic appeal of Yogurt Shop will be across the board as an ice cream/creamery is one of the consistently sustaining industries in the developed world. According to the United States Department of Agriculture (USDA) the average consumption of ice cream annually in the US is about 21 quarts per person. The Food Channel claims that the United States is the world’s largest ice cream consumer. Though there is no break down of consumption by state, Florida is the fourth most populous state, and has the second highest average, annual temperature, behind only Hawaii (Source: Associates Content). Thus, it makes sense that Florida would be a “hotbed” for frozen dessert and beverage consumption. Sarasota County is home to 369,765 residents, according to the 2009 Census data. The region has grown 13.4% since 2000. Sarasota’s median household income, per capita money income, homeownership rate, median value of housing, and percentage of residents having earned a Bachelor’s degree or higher are all higher than the Florida state averages (These will be looked at in depth in Section 6). These factors indicate that the area is home to a population base that has income for discretionary spending. 10 Yogurt Shop Trends In a state with an overall population of over 18 million people, and 67 counties, Sarasota County is ranked 14th in population and hosts over one-third of a million residents. Of those 67 counties Sarasota is ranked in the top third when it comes to growth. Affordability and weather are two of the main draws for the area, which has not been affected by economic downturns, and this makes it one of the grandparent capitals of the southeast with 57 active adult communities in the city of Sarasota. Perhaps the most meaningful trend comes form the USDA that shows that premium or super premium ice cream outsells regular ice cream, light ice cream, low and nonfat ice creams. Sarasota is an ideal location for an enterprise such as Yogurt Shop. 11 Yogurt Shop 5.0 THE BUSINESS 5.1 TOP FIVE PRIORITIES The Company will be entering a sustainable market. It will be built on a solid foundation. Yogurt Shop has a substantial opportunity for growth through name and brand recognition, as well as offering a specialized, premium product line, individual ordering, door-to-door delivery and other superior services. The positioning and timing is ideal to launch this venture and implement its growth phase. Of particular importance to the operation will be the Companies Top 5 priorities. It will foster a strong commitment to these priorities as building blocks for success: 1) Quality of the Product Yogurt Shop is committed to producing the highest quality dessert items and specialty food and beverage items. To that end The Company will be buying its super premium soft-serve mixes, and custards from A. Panza & Sons, Ltd. A company that began in Brooklyn, NY in 1955 and today serves the northeast primarily, but has customers internationally. What will make the super premium soft serve and custard differentiate from other vendors is that these creamery mixes will be double the standard amount of fat content. This is what will make Yogurt Shop a Philly-style establishment. By having the increased fat content (10% as opposed to 5%), the ice creams and custards will have a creaminess and smoothness that other vendors will lack. To supply the frugal customers The Company will also purchase the traditional, 5% fat content mixes and sell these cones for $1.00. This is the standard mix for vendors in the area. However, most vendors purchase their mixes from Saint Petersburg’s “Dairy Mix.” There is nothing particularly wrong with this mix, it is the standard fare and patrons in this region unknowingly have grown acclimated to it. However, Yogurt Shop will also purchase their 5% mix from A. Panza & Sons. The cost is more expensive but the reason, as Mr. Vindick states, “It is a higher cost because…well, it tastes awesome!” The Company wants to provide its customer with only the best. By growing accustomed to the best they will become loyal customers. Yogurt Shop also intends to create dairy-free, lactose free, and sugar free mixes, so as to offer a selection acceptable for diabetic, lactose intolerant, lactose allergic, or dieting customers. 12 Yogurt Shop Other Philly-style foods and beverages that The Company will provide, will include but not be limited to; 1) Stroehmann Bread 2) Slush Puppie 3) Leo's Yum Yum ,South Jersey Water Ice 4) Roxy Bagels, a bagel shop in Philadelphia voted best in Philadelphia 5) 8th and Washington Pretzels, the Original Philadelphia Pretzels 6) Taylor Ham Pork Roll 7) Stewarts Root Beer on tap 8) Delaware Punch 9) Moxie soda, a hard to find New England treat 10) Champ Cherry soda, a Philadelphia staple 11) Boost + Boost Slushie 12) Hires Root Beer, a Philadelphia's own root beer and one of the oldest in the country 13) Big Red soda 15) Frank's Black Cherry Wishniak, another Philadelphia specialty soda 16) Hanks Root Beer, a high quality root beer that is new (only a few years old). Mr. Vindick intends to provide only the freshest and widest variety of toppings by using the highest quality ingredients and purchasing only from the best suppliers in the industry. 2) Professional and Friendly Customer Service The Founder of Yogurt Shop understands the importance of professional relationships with both suppliers and customers. He will establish a set of procedures and an atmosphere, which will convey the philosophy of The Company. Further, he intends to hire former Philadelphia natives to give the business a Philly sound and feel. 3) Well-Trained Customer Service Personnel The Company believes in a customer centric approach to business. Employees will be trained (and required) to exude a cheerful, energetic, and helpful attitude. They will be well versed in the products and the features and benefits that differentiate Yogurt Shop from the competition. 13 Yogurt Shop 4) Customer Retention The Company will focus on customer retention and the generation of a large base of returning clientele. Each employee will be equipped with a complete package of appreciation concepts to make each customer feel like they are a “regular” and special. Through the use of coupons, birthday specials, social networking discounts, customer loyalty promotions and similar marketing techniques, Yogurt Shop will be first in the minds of the consumers. 5) Maximizing Profit The Company believes that there is no such thing in business as treading water or standing still. The Company’s growth goals are aggressive, but attainable. It will control expenses in order to maximize profits. Profits will be used to satisfy lender obligations and fund future growth. 5.2 CUSTOMER RELATIONS In addition to attributes of the product, some of the strengths and capabilities of The Company’s core services pertain to availability, response time to orders and of service, quality of packaging mail order goods, depth of delivery route, and overall convenience. Performance with respect to these core services depends on well-trained employees and a well-organized stock management and order fulfillment operation. Perhaps the single greatest service strength is the ethic of service itself. The following comprises The Company’s commitment to ensuring the ethic and always exceeding the customers’ expectation. Ensuring Proper Employee and Affiliate Communications Establish an ongoing program of training in the use of the CRM system Maintain a system of employee and recognition awards to internalize the attitude The Company wishes to impart to its customers. Present an Attractive, Successful Image to Generate Customer Confidence Maintain consistent color and logos on all marketing and advertising materials to generate brand awareness. Maintain the web site in an uncluttered, easily navigated condition with current content and information to engender an impression of “success” in the eyes of customers. Attire sales personnel in attractive branded attire displaying the Company logo Participate in community and industry events. 14 Yogurt Shop 5.3 OWNER/EMPLOYEE RELATIONS Yogurt Shop is committed to preparing a staff to highlight all of the most important features and benefits The Company offers. The owner understands that his ethics and management style will shape everything that happens in the business. In order to manage the business in the most positive direction, the owner will make and employ the following commitments and actions: Presentation Commit to train all associates to perform in customer centric environment. Balance the work force to assist customers in a timely fashion. Provide employees with complete knowledge of all products of The Company. Train employees to work and perform within a “box”, but think outside the “box.” Address customer requests and concerns with great respect. Acceptance of Risk Accept the financial responsibilities that come with ownership. Accept the financial responsibilities that come with accepting loans. Never assume that others have trained the employees to The Company’s standard of excellence. Belief Not only sell the product but be a customer as well Lead by example in order to demonstrate the acceptable level of customer service expected Never offer a product that is not fresh and/or of the highest quality Commit to “An On Going Process of Improvement” Commit resources to continue to develop new products Commit resources to expand according to business model Commit to continually improve efficiency in order processing and fulfillment Commit to constantly look for new opportunities that fit The Company’s business model 5.4 BUSINESS MODEL Production: The business model for Yogurt Shop includes the on premises serving of food items and beverages. Many of these items will be Yogurt Shop brand items that have been manufactured /made elsewhere. In addition, The Company will offer other company’s specialty products and beverages. All products purchased from an FDA/USDA compliant contract food manufacturer under proprietary agreements will be tested repeatedly for freshness and appeal to customer. Sales and Marketing: The business model for Yogurt Shop as it relates to sales and marketing will encompass advertising in local venues such as school papers, campus handouts, campus and commercial radio, social networking sites, promotions on special occasions, direct mail, in-store coupons, and loyal customer recognition, among others. 15 Yogurt Shop 6.0 MARKET ANALYSIS SUMMARY 6.1 INDUSTRY ANALYSIS The Frozen Dessert market is expected to rise to $27.9B by the year 2012 showing a $4B increase over the next three years. Ice cream accounts for 59.2% of industry sales. , According to the International Ice Cream Association, over $8 billion a year spent, in the US on products that are consumed “at home.” Over $13 billion is spent annually on “away from home” frozen desserts. According to the USDA’s last report on ice cream consumption, the total U.S. production of ice cream and related frozen desserts amounted to approximately 1.58 billion gallons. This equates to roughly 21 quarts per person, per year. Sales records show that when it comes to buying ice cream, the trend is clearly towards “indulgence.” Supermarket Guru states that premium and super premium quality ice creams have and continue to outsell regular ice cream as well as the light. The disparity in number is 41.4% of the total dollar sales for premium or super premium, light ice cream selling 7% of overall sales, reduced fat at 0.7% of sales, low fat, earning 3%, and nonfat at 2% of overall sales. In the just published, July 2010 edition of Sunset magazine, there is a section on the “Top Five” hot summer trends that included an article, “Trend 3 Soft-serve.” Under the title “Swirly Cone, the Sequel” it states, “That’s right, the classic summer twist in back.” Speaking of the continued popularity of this summer treat they say “… It’s way better than you remember it.” 6.2 INDUSTRY PARTICIPANTS Several franchises exist in frozen dessert industry each with a twist of its own. There are many regional as well as nationally recognized names including: Ben & Jerry’s, Dairy Queen, Cold Stone Creamery, Haagen Daz, Baskin Robbins, etc. These however do not deliver in a Philadelphia retail atmosphere; they do not provide the breadth of products, and they do not have ice cream trucks that come to the customers. 16 Yogurt Shop 6.3 COMPETITIVE EFFICIENCY The customer buying decisions in the industry are influenced by key motivators: Taste Quality of products Atmosphere Convenience Competitive pricing (more specifically, value received for price paid) Yogurt Shop is the clear leader when it comes to these differentiators. 6.4 MARKET SEGMENTATION The market is truly universal. The customer base includes men, women, children and all ethnic groups. Yogurt Shop products will be sought by each demographic equally. Unlike other food service venues where certain products or beverages are meant to cater to a certain section of the market, every age group, gender, and background will have the opportunity to try and gain a taste for each item. That said, some of the segments will be targeted to individually by advertising, 6.5 TARGET MARKET AND SEGMENT STRATEGY In order to best attract future customers, The Company wants to know which of the motivators attracted the existing/initial customers. The company considers information gathered directly from the customer to be the most important knowledge it can have. To this end, it will always place a prime value on knowledge gained from such sources as existing customers and blend it with information from suppliers, industry advisors, industry trade groups, industry trade journals, and other professionals. 17 Yogurt Shop 6.6 MARKET TRENDS AND GROWTH As stated the market is a sizable one. It has been steadily growing for the last twenty years (and well before that), and projections show that this growth can be expected moving forward. Further, history shows that ice cream sales have sustained growth even during economically unstable times. 6.7 COMPANY GROWTH The Company is poised to grow with the market and, in fact, exceed the market growth through capture of market share. With this growth and carefully controlled expenses, The Company’s profit margin will also increase. The following charts provide a glimpse of the projected growth line and the resulting profits. Revenue and Operating Profit $1,200,000 $1,000,512 $1,000,000 $800,000 $778,548 $551,508 $600,000 $400,000 $251,564 $132,488 $200,000 $3,134 $Year 1 Year 2 Year 3 18 Yogurt Shop 7.0 STRATEGY AND IMPLEMENTATION Yogurt Shop Inc. will center its strategy on the premise that The Company resonates with the consumer because it offers a place earmarked by convenience, high quality service, premium quality specialty food items, and a truly professional, yet fun, atmosphere. Always keeping that in mind, The Company will maintain a focus on creating positive customer relationships, while keeping expenses modest. The Owner will be diligent in dissecting every aspect of the business to ensure that each component remains productive and contributive to the goal of a highly profitable enterprise. The Company will be managed strategically and proactively to ensure all business actions are geared toward providing needed services for target customers, resulting in increased revenue. 7.1 STRATEGY PYRAMID The Company will operate in accordance with a strategy pyramid comprised of three levels of focus and flow for its activities. At the top level is the delivery of the unique value proposition to the individual customer. At the middle level is the preparation of key personnel, internal and external customer service and sales staff, product production staff and order fulfillment staff, all of whom must complete their functions in a timely and efficient manner. At the base of the pyramid lies management’s organization of company operations including financials, assets, marketing, and workspace such that middle and top levels of the pyramid are fulfilled in a streamlined and economical fashion. The management team will partition and manage the Company according to these three distinct but intertwined aspects of the operation. The Strategy Pyramid 1. The delivery of Yogurt Shop’s unique value proposition to the customer 2. The preparation of key personnel, employees, and associates for the delivery of products and services in a timely, friendly, and efficient manner 3. Management’s organization of company operations including financials, assets, marketing, and work space 7.2 VALUE PROPOSITION Simply put the value proposition is that the products of Yogurt Shop, Inc. will be among the highest quality frozen dessert items, food items and beverages in the County of Sarasota, FL. They are competitively priced to provide the customer with the best value for the dollars exchanged. They provide the customer with “a moment of indulgence without regret.” 19 Yogurt Shop 7.3 MARKETING STRATEGY The sales and marketing strategy will be built on the buying proposition listed above and the, quality of the services. The first line of marketing will begin with the in-store service of the employees and wait personnel who will be trained for courtesy, friendliness, and knowledge of the products. Many of the employees will be former Philadelphia area residents to create a true “Philly” experience. All store logos, color schemes, displays, décor, uniforms and other marketing materials will be repetitive and consistent in order to generate brand awareness. A steady stream of targeted advertising will support brand recognition, and the message that the product is of the highest quality, creaminess, and smoothness available. 7.4 POSITIONING STATEMENT Our primary role in the marketplace is to be recognized by our Value Proposition“Yogurt Shop is the only place to go for a moment of indulgence without regret.” 7.5 STRATEGIC ALLIANCES Contract Ingredient Manufacturers: The Company will contract with A Panza & Sons Limited of Edison New Jersey and Dairy Mix of Saint Petersburg Florida; both well established FDA and USDA compliant, contract ingredient food producers. Food and Drink Manufacturers: Stroehmann Bread (Philadelphia and South Jersey Bread Products) Leo's Yum Yum (South Jersey Water Ice) Roxy Bagels (A bagel shop in Philadelphia voted best in Philly) 8th and Washington Pretzels (The Original Philadelphia Pretzels) Pork Roll (Taylor Ham) (This is a product known locally and will be sold in packages) Stewarts Root Beer (a Northeastern favorite will be sold, on tap from a Keg) Delaware Punch (A very hard to find soda, now sold in Louisiana and Texas) Moxie (A hard to find soda sold in New England) Champ Cherry (Currently a Philadelphia Only soda) Boost + Boost Slushie (A South Jersey product) Hires Root Beer (Philadelphia's Root Beer and one of the oldest in the country-not currently available outside of the Northeast) Cheerwine (A hard-to-find soda from North Carolina) Big Red (Another hard to find soda, but is available in Florida) Frank's Black Cherry Wishniak (A Philadelphia soda) Hanks Root Beer (A high quality root beer born in Philadelphia by locals) As one can see from the above list, these products are unique and have a distinct Philadelphia flavor. Coupled with service by former Philadelphia residents, Yogurt Shop will provide a true “Philly” experience. 20 Yogurt Shop 7.5 PRICING STRATEGY Yogurt Shop has determined that in order to remain competitive it must maintain a pricing schedule in line with other similar ice cream and frozen yogurt shops in the greater Sarasota region, but also be profitable. From research into the cost of goods and the Founders knowledge of the industry, the following Revenue Metric was created using information from Yo Cream. Revenue Metric (Example) YO CREAM Yogurt Sales Price per Ounce Price per Gallon* Weight of one (1) gallon of mix in ounces Yogurt Cost per Ounce Yogurt Cost of a eight (8)) ounce serving Fruit / Candy Topping Costs per eight (8) ounce serving Cups / Spoons / Paper Costs per six (6) ounce serving TOTAL COST per eight (8) oz. serving incl. topping $ $ 0.39 8.98 $ $ $ $ $ 0.06 0.48 0.24 0.07 0.79 AVEARGE SALES PRICE per 8 oz. serving incl. topping Less Total Cost: TOTAL PROFIT per eight (8) oz. serving incl. topping $ $ $ 3.12 0.79 2.33 144 From the above as well as other research, the following revenue assumptions and average per unit sales prices have been extrapolated. Revenue Assumptions Store Hours/Day/Store Customers/Hour/Store Avg. Customers/Month/Store % Purchasing Ice Cream % Purchasing Other Food % Purchasing Ice Cream Avg. Customer Spend Ice Cream Avg. Customer Spend Ice Cream Avg. Customer Spend Ice Cream Year 1 12 20 7,300 70% 15% 15% $3.12 $4.00 $2.50 Year 2 12 30 10,950 65% 20% 15% $3.25 $4.15 $2.65 Year 3 12 40 14,600 65% 20% 15% $3.30 $4.25 $2.75 Vehicle Hours/Day/Store Customers/Hour/Store Avg. Customers/Month/Store % Purchasing Ice Cream % Purchasing Other Food % Purchasing Ice Cream Avg. Customer Spend Ice Cream Avg. Customer Spend Ice Cream Avg. Customer Spend Ice Cream 10 25 7604 80% 10% 10% $2.50 $4.00 $2.50 10 30 9125 80% 10% 10% $2.65 $4.15 $2.65 10 35 10646 80% 10% 10% $2.75 $4.25 $2.75 21 Yogurt Shop 7.6 SALES STRATEGY The sales strategy will revolve around the customer first, customer centric attitude of the business. The sales approach will be to convey to the customer the fact that they are the boss. The customer chooses the product and the amount; they are the MOST important part of the transaction and of the business. They will be made to feel as such. The favorable impressions created that will transfer to a repeat visit will be created by: Quick response to customers’ entry into the shop Friendly, energetic attitude of customer service associates Professionalism of staff Quality and benefits of the product 7.7 SALES FORECAST Yogurt Shop Inc. has developed a projected sales forecast for the next three years of operations. The company has determined that based on its target market usage patterns, its competitive advantages, and sound financial analysis, it can reasonably expect to reach the goals reflected in the table below. Revenue Forecast - Three Year Annual Revenue Streams Stores Avg. Customers/Month/Store % Purchasing Ice Cream % Purchasing Other Food % Purchasing Ice Cream Avg. Customer Spend Ice Cream Avg. Customer Spend Ice Cream Avg. Customer Spend Ice Cream Vehicle Avg. Customers/Month/Store % Purchasing Ice Cream % Purchasing Other Food % Purchasing Ice Cream Avg. Customer Spend Ice Cream Avg. Customer Spend Ice Cream Avg. Customer Spend Ice Cream Year 1 Year 2 Year 3 87,600 61,320 13,140 13,140 3 4 3 131,400 85,416 26,280 19,716 3 4 3 175,200 113,880 35,040 26,280 3 4 3 91,248 72,996 9,120 9,120 3 4 3 109,500 87,600 10,956 10,956 3 4 3 127,752 102,204 12,780 12,780 3 4 3 Revenue Ice Cream Other Food Beverage Other Branded Products Total Revenue $ $ $ $ $ 373,812 89,040 55,656 33,000 551,508 $ $ $ $ $ 509,748 154,524 81,276 33,000 778,548 $ 656,868 $ 203,232 $ 107,412 $ 33,000 $ 1,000,512 Cost of Goods Ice Cream (25%) Other Food (45%) Beverage (35%) Other Branded Products (50%) Total Cost of Goods $ $ $ $ $ 93,456 40,068 19,476 16,500 169,500 $ $ $ $ $ 127,440 69,540 28,452 16,500 241,932 $ $ $ $ $ 164,220 91,452 37,596 16,500 309,768 Gross Profit $ 382,008 $ 536,616 $ 690,744 22 Yogurt Shop 7.9 EXPLAINED MILESTONES AND TIMELINES Yogurt Shop is in the business of selling ice cream, frozen desserts and other unique products and beverages with a distinct Philadelphia atmosphere and flavor. It intends to prove itself to be a unique, growth oriented, profitable company. The completion of this business plan is a major step in moving forward with this venture. The balance of the milestones and the timeline for completing them appears below Milestones and Time Line-Before Funding Actions Before Funding Select Vendors Select Equipment Select Accountant Select Attorney Select Location Business Plan Obtain Funding Projected Completion Date Responsibility for Action Percent Completed Comments 6/30/2010 6/30/2010 6/30/2010 6/30/2010 6/30/2010 7/15/2010 8/15/2010 Owners Owners Owners Owners Owners Owners Owners 100% 100% 100% 100% 100% 100% 50% Ingredients List Complete Equipment List Complete Engaged Engaged Complete Complete In Process Milestones and Time Line-After Funding Actions After Funding Leasehold Improvements Order & Install Equipment Order Initial Inventory Hire Staff Soft Opening Grand Opening Reach $500,00 in Annual Sales Reach $750,000 in Annual Sales Reach $1,000,000 in Annual Sales Months After Funding 1.5 2 2 2 2.5 3 12 24 36 Responsibility for Action Percent Completed Comments Owners Owners Owners Owners All All All All All 0% 0% 0% 0% 0% 0% 0% 0% 0% In Process In Process In Process In Process In Process In Process $551,508 Projected $778,548 Projected $1,000,512 Projected 23 Yogurt Shop 8.0 MANAGEMENT AND PERSONEL 8.1 MANAGEMENT COMMITMENTS Management is the core and nucleus of any organization. Mr. Vindick has substantial management experience, he will: [1] Never ask or train anybody to do something that they have not already done and know how to do. [2] Never assume that new employees or associates are properly trained or doing what is expected of them. Always provide on-going training for all. [3] Always be firm and clear regarding guidelines and expectations – maintain accurate and complete records. [4] Have clear enthusiastic policies for rewarding and recognizing great work and service in order to maintain a sense of pride and honor among strategic partners at all times. [5] Be transparent in policies and actions and have an “open door policy” at all times. 8.2 ORGANIZATIONAL STRUCTURE Each position within the organization will have a detailed job description indicating levels of authority to make decisions – the “box”. All employees will be encouraged to perform their duties within the “box”, but think outside the “box”. Owner and CEO Brian Vindick Asst. Store Manager Sales and Customer Service Drivers Bookkeeper 24 Yogurt Shop 8.3 MANAGEMENT Founder and CEO: Brian Vindick Mr. Vindick has over 10 years of restaurant management and ice cream industry experience. He possesses the skills and knowledge to execute all of the strategies of this business plan. He currently also serves as an instructor for the National Restaurant Association. (Space reserved for one paragraph bio) 8.4 WORKFORCE GAPS In any small company, management personnel may have to wear more than one hat. As a result, a gap or gaps may exist until the staff is fully developed. Management will know each and every aspect of the business and be willing to perform any task when required. Yogurt Shop will hire and train a sufficient number of employees to fill the necessary gaps so that customers are not kept waiting and the shop is kept clean and attractive at all times while the stock is replenished on a scheduled basis or as needed. Management will evaluate the number of employees against the cost so as to maintain a profitable level of service. 8.5 Professional Advisors Accountant: (Space reserved for name and address) Attorney: (Space reserved for name and address) 25 Yogurt Shop 8.6 EMPLOYEE STAFFING AND PAYROLL The total work force will be managed to protect the success projected in this business plan. All aspects of the business have been sufficiently analyzed to determine each position required to run a fully functioning operation that can complete all of the strategies and programs to be undertaken. Best practices in staffing and scheduling will be implemented. The table below reflects current staffing and compensation levels. Staffing and Payroll Matrix POSITION MONTHLY PAYROLL Employee Owner Asst. Store Mgr. Store Staff Truck Staff Bookkeeper Outsourced Accountant Attorney Initial START DATE Year COMMENTS Month $ $ $ $ $ 5,000 3,500 5,120 3,200 400 1 1 1 1 1 1 1 1 1 1 $ $ 300 - 1 1 Captured as Payroll Increases Appropriately 40 to 50 Hours per week 4 FT Equivalents @ $8/Hr 2 FT Equivalents @ $10/Hr PT 20Hrs/Month @ $20r Captured as Professional Service As Needed Staffing and Payroll - Annual Employee Owner Asst. Store Mgr. Store Staff Truck Staff Bookkeeper Total Year 1 Year 2 Year 3 $ 60,000 $ 42,000 $ 61,440 $ 38,400 $ 4,800 $206,640 $ 78,000 $ 44,100 $ 64,512 $ 40,320 $ 5,040 $231,972 $ 84,000 $ 46,308 $ 67,740 $ 42,336 $ 5,292 $245,676 26 Yogurt Shop 9.0 BUDGET: FINANCIAL PLAN Mr. Vindick has personally developed, or overseen the development of, all aspects of the business from the identification of product and dairy mixes, to the development and packaging of the product, to the branding. This plan has been developed [1] to cover the next three years at a monthly detail level, and [2] to spotlight the business sales and revenue during this period. The purpose of the financial plan is to solidify solid growth through our exciting business model punctuated by a healthy relation between continually increasing revenues, and diligent cost containment. The projections in this business are based on the experience of the founders plus the growth projected as a result of the financing requested and results contemplated. 9.1 IMPORTANT ASSUMPTIONS General Assumptions 1. Founder will invest $5,000 for research and initial operating costs. 2. The Company will request a $140,000 line of credit (interest projected at 7%) 3. Expenses Payroll: In accordance with Staffing-Payroll Matrix Payroll Burden: Projected at 12% to include Company portion of payroll taxes, workers compensation Bank/Merchant Fees: 20% will use credit/debit cards. Fee projected @ 1.5% Depreciation: $105,000 of Capital Expenditures over 60 months ($1750 per month) Rent (Lease): $3,800 per month 4. Tax burden: Projections include a distribution of 28% operating profits to owners to cover taxes. In addition to the bulleted assumptions above, the following assumptions were used to establish a foundation upon which to base the financial projections. Founder is experienced in the industry with extensive management expertise. The ice cream, frozen dessert, & beverage industries will continue to grow The population of the target geographic region will continue to grow. 9.2 KEY FINANCIAL INDICATORS The most important financial indicators are cash and bottom line. The Company will constantly monitor the flow of revenue to the company, as well as, the expense requirements to generate the revenue. The chart below reflects the growth of the bottom line (net profits) and cash. Cash in year three is after the return of the line of credit principal. 27 Yogurt Shop Net Profits and Cash Reserves $250,000 $204,297 $200,000 $153,698 $181,127 $150,000 $100,000 $50,000 $- $95,394 $43,256 $2,256 Year 1 Year 2 Net Profit Year 3 Cash 9.3 EXPLANATION OF PROJECTED BALANCE SHEET The projected Balance Sheet for Yogurt Shop, Inc. highlights total assets, total liabilities, and owner’s equity. The salient feature of our projected Balance Sheet is that it demonstrates the relationship between The Company’s assets and liabilities (see 9.7 Business Ratios) and the owner’s equity. The graph below represents the projected improvement in the owner’s equity over the next three years. Shareholder Equity $300,000 $283,777 $250,000 $200,000 $150,000 $102,650 $100,000 $50,000 $7,256 $Year 1 Year 2 Year 3 28 Yogurt Shop 9.4 EXPLANATION OF PROJECTED PROFIT & LOSS The projected Profit & Loss Statement for Yogurt Shop Inc. highlights the relation between the sales forecast and the operating expenses. These figures are based on the experience of The Company and the industry knowledge of the owner. The net operating profit increases each year. Revenue Compared to Operating Profit $1,200,000 $1,000,000 $800,000 $600,000 $400,000 0.6% $200,000 $- 25.1% 17.0% Year 1 Revenue Year 2 Operating Expenses Year 3 Operating Profit 9.5 EXPLANATION OF PROJECTED CASH FLOW The projected Cash Flow Statement for Yogurt Shop, Inc. represents the cash balance remaining at the end of each month or year after deducting the expenses from the gross profit (revenue minus direct costs) and taxes. Cash flow is crucial to business survival. With the equity financing requested, The Company is confident that it will have the resources to handle contingencies, take advantage of new opportunities, service debt in a timely manner, and make capital improvements as needed. The chart below compares revenues to the cash balance at the end of the next three years after investments for capital expenditures (new store) and repayment of the loan. Gross Revenue Compared to Cash Balances $1,500,000 $1,000,000 $551,508 $500,000 $- $1,000,512 $778,548 $43,256 Year 1 Year 2 Gross Revenue $204,297 $153,698 Year 3 Cash End of Year 29 Yogurt Shop 9.6 EXPLANATION OF BREAK-EVEN ANALYSIS The break-even analysis for this company calculates at what point The Company is profitable, and what level of revenue keeps it above the break-even (profitable) level. The graph below reflects the increasing “delta” between break-even and revenue projected. This then becomes a visual indicator of the increasing profitability of The Company and evidences its ability to return the principal of the line of credit and fund future growth from income from operations. Break-Even Analysis $70,000 $60,000 $50,000 $40,000 $30,000 $20,000 $10,000 Break Even Revenue Mth 24 Mth 23 Mth 22 Mth 21 Mth 20 Mth 19 Mth 18 Mth 17 Mth 16 Mth 15 Mth 14 Mth 13 Mth 12 Mth 11 Mth 10 Mth 9 Mth 8 Mth 7 Mth 6 Mth 5 Mth 4 Mth 3 Mth 2 Mth 1 $- Projected Revenue 9.7 BUSINESS RATIOS At the very least, The Company will utilize the following ratios as quantitative measures of its financial health. These numbers derive from our three-year projections for Current Assets, Total Assets, Current Liabilities, Net Profit, and Gross Sales. Among many of the management tools that will be utilized, [1] the Current Ratio, [2] the Net Profit Margin Ratio, and [3] the Return on Investment Ratio, will be evaluated and included in the Company’s financial reports. Business Ratios Year1 63,256 140,000 0.45 $ $ Year 2 179,650 140,000 1.28 $ $ Year 3 241,777 - Current Assets Current Liabilities Current Ratio $ $ Net Profit Gross Sales Operating Profit Margin Ratio $ $ 3,134 551,508 1% $ $ 132,488 778,548 17% $ $ 251,564 1,000,512 25% Net Profit Total Assets Return on Investment Ratio $ $ 2,256 147,256 2% $ $ 95,394 242,650 39% $ $ 181,127 283,777 64% 30 Yogurt Shop 9.8 CONCLUSION: LONG-TERM PLAN AND FINANCIAL HIGHLIGHTS The Company believes that our long-term prospects for growing a successful business are excellent. The Company has developed the products, formed the necessary strategic relationships, and is prepared to begin generating revenue by November 1, 2010 or sooner. Under the leadership of Mr. Vindick and the staff implementing the new customer centric model, The Company expects to clearly differentiate itself from the competition and reach its growth goals. The projected impact of the additional advertising, inventory and other operational improvements permitted by the requested financing is reflected below. Financial Highlights $1,200,000 $1,000,000 $800,000 $600,000 $400,000 $200,000 $Revenue Year 1 $551,508 Year 2 $778,548 Year 3 $1,000,512 Cost of Goods $169,500 $241,932 $309,768 Gross Margin $382,008 $536,616 $690,744 Total Operating Expenses $378,874 $404,128 $439,180 Operating Profit $3,134 $132,488 $251,564 Net Profit $2,256 $95,394 $181,127 31 Yogurt Shop 10.0 BALANCE SHEET Balance Sheet Projection ASSETS Current Assets Cash Accounts Receivable Inventory Total Current Year 1 Year 2 $ $ $ $ 43,256 20,000 63,256 $ $ $ $ 153,698 25,952 179,650 $ $ $ $ 204,297 37,480 241,777 Fixed Assets Leasehold Improvements Equipment Vehicle Accumulated Depreciation Total Fixed $ $ $ $ $ 10,000 70,000 25,000 (21,000) 84,000 $ $ $ $ $ 10,000 70,000 25,000 (42,000) 63,000 $ $ $ $ $ 10,000 70,000 25,000 (63,000) 42,000 Other Goodwill Intellectual Property Total Other $ $ $ TOTAL ASSETS $ 147,256 $ 242,650 $ LIABILITIES Current Liabilities Accounts Payable Loan Payment (Current Portion) Short Term Borrowing Total Current $ $ $ $ 140,000 140,000 $ $ $ $ 140,000 140,000 $ $ $ $ - Long Term Liabilities Mortgage and Loan Other Total Long Term $ $ $ $ $ $ - Total Liabilities $ 140,000 $ 140,000 $ - Shareholder Equity Paid in Capital Retained Earnings Current Year Income/Loss Total Owner Equity $ $ $ $ 5,000 2,256 2,256 7,256 $ $ $ $ 5,000 97,650 95,394 102,650 $ $ $ $ 5,000 278,777 181,127 283,777 TOTAL LIABILITIES AND EQUITY $ 147,256 $ 242,650 $ 283,777 - - $ $ $ $ $ $ Year 3 - - $ $ $ 283,777 32 Yogurt Shop 11.0 PROFIT AND LOSS PROJECTIONS Income Statement - Three Year Annual Revenue Direct Costs Gross Margin $ $ $ Year 1 551,508 169,500 382,008 $ $ $ Year 2 778,548 241,932 536,616 $ $ $ Year 3 1,000,512 309,768 690,744 Operating Expenses Payroll Payroll Expense (12%) Advertising/Marketing Bank/Merchant Fees Depreciation Insurance-General Insurance-Health Interest Office Supplies & Postage Professional Fees-Acct. Professional Fees-Atty. Rent Telephone Travel & Entertainment Utilities URL (Server)-Website Vehicle Expense Miscellaneous Total Operating Expenses $ $ $ $ $ $ $ $ $ $ $ $ $ $ $ $ $ $ $ 206,640 24,792 28,500 1,658 21,000 6,000 9,804 600 3,600 2,000 45,600 2,700 1,200 13,680 900 7,200 3,000 378,874 $ $ $ $ $ $ $ $ $ $ $ $ $ $ $ $ $ $ $ 231,972 27,840 18,000 2,332 21,000 7,200 9,804 1,200 3,600 45,600 3,000 3,000 13,680 900 9,000 6,000 404,128 $ $ $ $ $ $ $ $ $ $ $ $ $ $ $ $ $ $ $ 245,676 24,974 24,000 3,002 21,000 12,000 9,804 2,100 4,800 47,880 4,800 6,000 14,364 780 12,000 6,000 439,180 Operating Profit $ 3,134 $ 132,488 $ 251,564 Tax Burden (35%) Net Profit $ $ 878 2,256 $ $ 37,094 95,394 $ $ 70,437 181,127 33 Yogurt Shop 12.0 CASH FLOW STATEMENTS Cash Flow - Three Year Annual Year 1 Operating Activities Net Income (after taxes) Adjustments to Reconcile Depreciation & Amortization Change In: Accounts Receivable Inventories* Accounts Payable Other Cash From Operating Activities Year 2 Year 3 $ 2,256 $ 95,394 $ 181,127 $ 21,000 $ 21,000 $ $ $ $ $ $ (20,000) 3,256 $ $ $ $ $ (5,952) 110,442 $ $ (11,528) $ $ $ 190,599 Investing Activities Capital Expenditures** Other Non-Expensed Expenditures*** Cash Used in Investing $ $ $ (105,000) (105,000) $ $ $ - $ $ $ Financing Activities Equity Infusion Increase (Decrease) Long Term Debt Increase (Decrease) Short Term Debt Dividends Paid Other Cash (Used In)From Financing $ $ $ $ $ $ 5,000 140,000 145,000 $ $ $ $ $ $ - $ $ $ (140,000) $ $ $ (140,000) Increase (Decrease) in Cash $ 43,256 $ 110,442 $ Cash, Beginning of Year Cash , End of Year $ $ 43,256 $ $ 43,256 153,698 $ 153,698 $ 204,297 21,000 - 50,599 34 Yogurt Shop 13.0 MONTHLY DETAIL 13.1 REVENUE PROJECTIONS Revenue Forecast-Year One MTH 1 Revenue Streams Stores Avg. Customers/Month/Store % Purchasing Ice Cream % Purchasing Other Food % Purchasing Ice Cream Avg. Customer Spend Ice Cream Avg. Customer Spend Ice Cream Avg. Customer Spend Ice Cream Vehicle Avg. Customers/Month/Store % Purchasing Ice Cream % Purchasing Other Food % Purchasing Ice Cream Avg. Customer Spend Ice Cream Avg. Customer Spend Ice Cream Avg. Customer Spend Ice Cream $ $ $ 7,300 5,110 1,095 1,095 3.12 4.00 2.50 $ $ $ 7,604 6,083 760 760 2.50 4.00 2.50 $ $ $ $ $ Other Food (45%) Beverage (35%) Other Branded Products (50%) Total Cost of Goods Gross Profit Revenue Ice Cream Other Food Beverage Other Branded Products Total Revenue $ $ $ 7,300 5,110 1,095 1,095 3.12 4.00 2.50 MTH 2 MTH 3 $ $ $ 7,300 5,110 1,095 1,095 3.12 4.00 2.50 $ $ $ 7,604 6,083 760 760 2.50 4.00 2.50 31,152 7,422 4,639 1,500 44,712 $ $ $ $ $ $ $ $ $ $ 7,788 3,340 1,623 750 13,501 $ 31,211 MTH 4 $ $ $ 7,300 5,110 1,095 1,095 3.12 4.00 2.50 $ $ $ 7,604 6,083 760 760 2.50 4.00 2.50 31,152 7,422 4,639 2,000 45,212 $ $ $ $ $ $ $ $ $ $ 7,788 3,340 1,623 1,000 13,751 $ 31,461 MTH 5 $ $ $ 7,300 5,110 1,095 1,095 3.12 4.00 2.50 $ $ $ 7,604 6,083 760 760 2.50 4.00 2.50 31,152 7,422 4,639 2,500 45,712 $ $ $ $ $ $ $ $ $ $ 7,788 3,340 1,623 1,250 14,001 $ 31,711 MTH 6 $ $ $ 7,300 5,110 1,095 1,095 3.12 4.00 2.50 $ $ $ 7,604 6,083 760 760 2.50 4.00 2.50 31,152 7,422 4,639 3,000 46,212 $ $ $ $ $ $ $ $ $ $ 7,788 3,340 1,623 1,500 14,251 $ 31,961 MTH 7 $ $ $ 7,300 5,110 1,095 1,095 3.12 4.00 2.50 $ $ $ 7,604 6,083 760 760 2.50 4.00 2.50 31,152 7,422 4,639 3,000 46,212 $ $ $ $ $ $ $ $ $ $ 7,788 3,340 1,623 1,500 14,251 $ 31,961 MTH 8 $ $ $ 7,300 5,110 1,095 1,095 3.12 4.00 2.50 $ $ $ 7,604 6,083 760 760 2.50 4.00 2.50 31,152 7,422 4,639 3,000 46,212 $ $ $ $ $ $ $ $ $ $ 7,788 3,340 1,623 1,500 14,251 $ 31,961 MTH 9 $ $ $ 7,300 5,110 1,095 1,095 3.12 4.00 2.50 $ $ $ 7,604 6,083 760 760 2.50 4.00 2.50 31,152 7,422 4,639 3,000 46,212 $ $ $ $ $ $ $ $ $ $ 7,788 3,340 1,623 1,500 14,251 $ 31,961 MTH 10 $ $ $ 7,300 5,110 1,095 1,095 3.12 4.00 2.50 $ $ $ 7,604 6,083 760 760 2.50 4.00 2.50 31,152 7,422 4,639 3,000 46,212 $ $ $ $ $ $ $ $ $ $ 7,788 3,340 1,623 1,500 14,251 $ 31,961 MTH 11 $ $ $ 7,300 5,110 1,095 1,095 3.12 4.00 2.50 $ $ $ 7,604 6,083 760 760 2.50 4.00 2.50 31,152 7,422 4,639 3,000 46,212 $ $ $ $ $ $ $ $ $ $ 7,788 3,340 1,623 1,500 14,251 $ 31,961 MTH 12 $ $ $ 7,300 5,110 1,095 1,095 3.12 4.00 2.50 $ $ $ 7,604 6,083 760 760 2.50 4.00 2.50 31,152 7,422 4,639 3,000 46,212 $ $ $ $ $ $ $ $ $ $ 7,788 3,340 1,623 1,500 14,251 $ 31,961 TOTAL $ $ $ 87,600 61,320 13,140 13,140 3.12 4.00 2.50 $ $ $ 7,604 6,083 760 760 2.50 4.00 2.50 $ $ $ 91,250 73,000 9,125 9,125 2.50 4.00 2.50 31,152 7,422 4,639 3,000 46,212 $ $ $ $ $ 31,152 7,422 4,639 3,000 46,212 $ $ $ $ $ 373,818 89,060 55,663 33,000 551,541 $ $ $ $ $ 7,788 3,340 1,623 1,500 14,251 $ $ $ $ $ 7,788 3,340 1,623 1,500 14,251 $ $ $ $ $ 93,455 40,077 19,482 16,500 169,513 $ 31,961 $ 31,961 $ 382,027 Cost of Goods Ice Cream (25%) 35 Revenue Forecast-Year Two MTH 1 Revenue Streams Stores Avg. Customers/Month/Store % Purchasing Ice Cream % Purchasing Other Food % Purchasing Ice Cream Avg. Customer Spend Ice Cream Avg. Customer Spend Ice Cream Avg. Customer Spend Ice Cream Vehicle Avg. Customers/Month/Store % Purchasing Ice Cream % Purchasing Other Food % Purchasing Ice Cream Avg. Customer Spend Ice Cream Avg. Customer Spend Ice Cream Avg. Customer Spend Ice Cream $ $ $ 10,950 7,118 2,190 1,643 3.25 4.15 2.65 MTH 2 $ $ $ 9,125 7,300 913 10,950 7,118 2,190 1,643 3.25 4.15 2.65 MTH 3 $ $ $ 9,125 7,300 913 913 10,950 7,118 2,190 1,643 3.25 4.15 2.65 MTH 4 $ $ $ 9,125 7,300 913 913 10,950 7,118 2,190 1,643 3.25 4.15 2.65 MTH 5 $ $ $ 9,125 7,300 913 913 10,950 7,118 2,190 1,643 3.25 4.15 2.65 MTH 6 $ $ $ 9,125 7,300 913 913 10,950 7,118 2,190 1,643 3.25 4.15 2.65 MTH 7 $ $ $ 9,125 7,300 913 913 10,950 7,118 2,190 1,643 3.25 4.15 2.65 MTH 8 $ $ $ 9,125 7,300 913 913 10,950 7,118 2,190 1,643 3.25 4.15 2.65 MTH 9 $ $ $ 9,125 7,300 913 913 10,950 7,118 2,190 1,643 3.25 4.15 2.65 MTH 10 $ $ $ 9,125 7,300 913 913 10,950 7,118 2,190 1,643 3.25 4.15 2.65 MTH 11 $ $ $ 9,125 7,300 913 913 10,950 7,118 2,190 1,643 3.25 4.15 2.65 MTH 12 $ $ $ 9,125 7,300 913 913 10,950 7,118 2,190 1,643 3.25 4.15 2.65 TOTAL $ $ $ 9,125 7,300 913 913 131,400 85,410 26,280 19,710 3.25 4.15 2.65 109,500 87,600 10,950 913 10,950 $ $ $ 2.65 4.15 2.65 $ $ $ 2.65 4.15 2.65 $ $ $ 2.65 4.15 2.65 $ $ $ 2.65 4.15 2.65 $ $ $ 2.65 4.15 2.65 $ $ $ 2.65 4.15 2.65 $ $ $ 2.65 4.15 2.65 $ $ $ 2.65 4.15 2.65 $ $ $ 2.65 4.15 2.65 $ $ $ 2.65 4.15 2.65 $ $ $ 2.65 4.15 2.65 $ $ $ 2.65 4.15 2.65 $ $ $ 2.65 4.15 2.65 $ $ $ $ $ 42,477 12,875 6,771 1,500 63,623 $ $ $ $ $ 42,477 12,875 6,771 2,000 64,123 $ $ $ $ $ 42,477 12,875 6,771 2,500 64,623 $ $ $ $ $ 42,477 12,875 6,771 3,000 65,123 $ $ $ $ $ 42,477 12,875 6,771 3,000 65,123 $ $ $ $ $ 42,477 12,875 6,771 3,000 65,123 $ $ $ $ $ 42,477 12,875 6,771 3,000 65,123 $ $ $ $ $ 42,477 12,875 6,771 3,000 65,123 $ $ $ $ $ 42,477 12,875 6,771 3,000 65,123 $ $ $ $ $ 42,477 12,875 6,771 3,000 65,123 $ $ $ $ $ 42,477 12,875 6,771 3,000 65,123 $ $ $ $ $ 42,477 12,875 6,771 3,000 65,123 $ $ $ $ $ 509,723 154,505 81,249 33,000 778,476 Other Food (45%) Beverage (35%) Other Branded Products (50%) Total Cost of Goods $ $ $ $ $ 10,619 5,794 2,370 750 19,533 $ $ $ $ $ 10,619 5,794 2,370 1,000 19,783 $ $ $ $ $ 10,619 5,794 2,370 1,250 20,033 $ $ $ $ $ 10,619 5,794 2,370 1,500 20,283 $ $ $ $ $ 10,619 5,794 2,370 1,500 20,283 $ $ $ $ $ 10,619 5,794 2,370 1,500 20,283 $ $ $ $ $ 10,619 5,794 2,370 1,500 20,283 $ $ $ $ $ 10,619 5,794 2,370 1,500 20,283 $ $ $ $ $ 10,619 5,794 2,370 1,500 20,283 $ $ $ $ $ 10,619 5,794 2,370 1,500 20,283 $ $ $ $ $ 10,619 5,794 2,370 1,500 20,283 $ $ $ $ $ 10,619 5,794 2,370 1,500 20,283 $ $ $ $ $ 127,431 69,527 28,437 16,500 241,895 Gross Profit $ 44,090 $ 44,340 $ 44,590 $ 44,840 $ 44,840 $ 44,840 $ 44,840 $ 44,840 $ 44,840 $ 44,840 $ 44,840 $ 44,840 $ 536,581 Revenue Ice Cream Other Food Beverage Other Branded Products Total Revenue Cost of Goods Ice Cream (25%) 36 Revenue Forecast-Year Three MTH 1 Revenue Streams Stores Avg. Customers/Month/Store % Purchasing Ice Cream % Purchasing Other Food % Purchasing Ice Cream Avg. Customer Spend Ice Cream Avg. Customer Spend Ice Cream Avg. Customer Spend Ice Cream Vehicle Avg. Customers/Month/Store % Purchasing Ice Cream % Purchasing Other Food % Purchasing Ice Cream Avg. Customer Spend Ice Cream Avg. Customer Spend Ice Cream Avg. Customer Spend Ice Cream $ $ $ 14,600 9,490 2,920 2,190 3.30 4.25 2.75 $ $ $ 10,646 8,517 1,065 1,065 2.75 4.25 2.75 $ $ $ $ $ Other Food (45%) Beverage (35%) Other Branded Products (50%) Total Cost of Goods Gross Profit Revenue Ice Cream Other Food Beverage Other Branded Products Total Revenue $ $ $ 14,600 9,490 2,920 2,190 3.30 4.25 2.75 MTH 2 MTH 3 $ $ $ 14,600 9,490 2,920 2,190 3.30 4.25 2.75 $ $ $ 10,646 8,517 1,065 1,065 2.75 4.25 2.75 54,738 16,934 8,950 1,500 82,122 $ $ $ $ $ $ $ $ $ $ 13,684 7,621 3,133 750 25,188 $ 56,935 MTH 4 $ $ $ 14,600 9,490 2,920 2,190 3.30 4.25 2.75 $ $ $ 10,646 8,517 1,065 1,065 2.75 4.25 2.75 54,738 16,934 8,950 2,000 82,622 $ $ $ $ $ $ $ $ $ $ 13,684 7,621 3,133 1,000 25,438 $ 57,185 MTH 5 $ $ $ 14,600 9,490 2,920 2,190 3.30 4.25 2.75 $ $ $ 10,646 8,517 1,065 1,065 2.75 4.25 2.75 54,738 16,934 8,950 2,500 83,122 $ $ $ $ $ $ $ $ $ $ 13,684 7,621 3,133 1,250 25,688 $ 57,435 MTH 6 $ $ $ 14,600 9,490 2,920 2,190 3.30 4.25 2.75 $ $ $ 10,646 8,517 1,065 1,065 2.75 4.25 2.75 54,738 16,934 8,950 3,000 83,622 $ $ $ $ $ $ $ $ $ $ 13,684 7,621 3,133 1,500 25,938 $ 57,685 MTH 7 $ $ $ 14,600 9,490 2,920 2,190 3.30 4.25 2.75 $ $ $ 10,646 8,517 1,065 1,065 2.75 4.25 2.75 54,738 16,934 8,950 3,000 83,622 $ $ $ $ $ $ $ $ $ $ 13,684 7,621 3,133 1,500 25,938 $ 57,685 MTH 8 $ $ $ 14,600 9,490 2,920 2,190 3.30 4.25 2.75 $ $ $ 10,646 8,517 1,065 1,065 2.75 4.25 2.75 54,738 16,934 8,950 3,000 83,622 $ $ $ $ $ $ $ $ $ $ 13,684 7,621 3,133 1,500 25,938 $ 57,685 MTH 9 $ $ $ 14,600 9,490 2,920 2,190 3.30 4.25 2.75 $ $ $ 10,646 8,517 1,065 1,065 2.75 4.25 2.75 54,738 16,934 8,950 3,000 83,622 $ $ $ $ $ $ $ $ $ $ 13,684 7,621 3,133 1,500 25,938 $ 57,685 MTH 10 $ $ $ 14,600 9,490 2,920 2,190 3.30 4.25 2.75 $ $ $ 10,646 8,517 1,065 1,065 2.75 4.25 2.75 54,738 16,934 8,950 3,000 83,622 $ $ $ $ $ $ $ $ $ $ 13,684 7,621 3,133 1,500 25,938 $ 57,685 MTH 11 $ $ $ 14,600 9,490 2,920 2,190 3.30 4.25 2.75 $ $ $ 10,646 8,517 1,065 1,065 2.75 4.25 2.75 54,738 16,934 8,950 3,000 83,622 $ $ $ $ $ $ $ $ $ $ 13,684 7,621 3,133 1,500 25,938 $ 57,685 MTH 12 $ $ $ 14,600 9,490 2,920 2,190 3.30 4.25 2.75 $ $ $ 10,646 8,517 1,065 1,065 2.75 4.25 2.75 54,738 16,934 8,950 3,000 83,622 $ $ $ $ $ $ $ $ $ $ 13,684 7,621 3,133 1,500 25,938 $ 57,685 TOTAL $ $ $ 175,200 113,880 35,040 26,280 3.30 4.25 2.75 $ $ $ 10,646 8,517 1,065 1,065 2.75 4.25 2.75 $ $ $ 127,750 102,200 12,775 12,775 2.75 4.25 2.75 54,738 16,934 8,950 3,000 83,622 $ $ $ $ $ 54,738 16,934 8,950 3,000 83,622 $ 656,854 $ 203,214 $ 107,401 $ 33,000 $ 1,000,469 $ $ $ $ $ 13,684 7,621 3,133 1,500 25,938 $ $ $ $ $ 13,684 7,621 3,133 1,500 25,938 $ $ $ $ $ 164,214 91,446 37,590 16,500 309,750 $ 57,685 $ 57,685 $ 690,719 Cost of Goods Ice Cream (25%) 37 13.2 STAFFING AND PAYROLL Staffing and Payroll - Year One Mth 1 Employee Owner Asst. Store Mgr. Store Staff Truck Staff Bookkeeper Total $ $ $ $ $ $ 5,000 3,500 5,120 3,200 400 17,220 Mth 2 $ $ $ $ $ $ 5,000 3,500 5,120 3,200 400 17,220 Mth 3 $ $ $ $ $ $ 5,000 3,500 5,120 3,200 400 17,220 Mth 4 $ $ $ $ $ $ Mth 5 5,000 3,500 5,120 3,200 400 17,220 $ $ $ $ $ $ 5,000 3,500 5,120 3,200 400 17,220 Mth 6 $ $ $ $ $ $ 5,000 3,500 5,120 3,200 400 17,220 Mth 7 $ $ $ $ $ $ 5,000 3,500 5,120 3,200 400 17,220 Mth 8 $ $ $ $ $ $ 5,000 3,500 5,120 3,200 400 17,220 Mth 9 $ $ $ $ $ $ 5,000 3,500 5,120 3,200 400 17,220 Mth 10 $ $ $ $ $ $ 5,000 3,500 5,120 3,200 400 17,220 Mth 11 $ $ $ $ $ $ 5,000 3,500 5,120 3,200 400 17,220 Mth 12 $ $ $ $ $ $ 5,000 3,500 5,120 3,200 400 17,220 Total $ $ $ $ $ $ 60,000 42,000 61,440 38,400 4,800 206,640 Staffing and Payroll - Year Two Mth 1 Employee Owner Asst. Store Mgr. Store Staff Truck Staff Bookkeeper Total $ $ $ $ $ $ 6,500 3,675 5,376 3,360 420 19,331 Mth 2 $ $ $ $ $ $ 6,500 3,675 5,376 3,360 420 19,331 Mth 3 $ $ $ $ $ $ 6,500 3,675 5,376 3,360 420 19,331 Mth 4 $ $ $ $ $ $ 6,500 3,675 5,376 3,360 420 19,331 Mth 5 $ $ $ $ $ $ 6,500 3,675 5,376 3,360 420 19,331 Mth 6 $ $ $ $ $ $ 6,500 3,675 5,376 3,360 420 19,331 Mth 7 $ $ $ $ $ $ 6,500 3,675 5,376 3,360 420 19,331 Mth 8 $ $ $ $ $ $ 6,500 3,675 5,376 3,360 420 19,331 Mth 9 $ $ $ $ $ $ 6,500 3,675 5,376 3,360 420 19,331 Mth 10 $ $ $ $ $ $ 6,500 3,675 5,376 3,360 420 19,331 Mth 11 $ $ $ $ $ $ 6,500 3,675 5,376 3,360 420 19,331 Mth 12 $ $ $ $ $ $ 6,500 3,675 5,376 3,360 420 19,331 Total $ $ $ $ $ $ 78,000 44,100 64,512 40,320 5,040 231,972 Staffing and Payroll - Year Three Mth 1 Employee Owner Asst. Store Mgr. Store Staff Truck Staff Bookkeeper Total $ $ $ $ $ $ 7,000 3,859 5,645 3,528 441 20,473 Mth 2 $ $ $ $ $ $ 7,000 3,859 5,645 3,528 441 20,473 Mth 3 $ $ $ $ $ $ 7,000 3,859 5,645 3,528 441 20,473 Mth 4 $ $ $ $ $ $ 7,000 3,859 5,645 3,528 441 20,473 Mth 5 $ $ $ $ $ $ 7,000 3,859 5,645 3,528 441 20,473 Mth 6 $ $ $ $ $ $ 7,000 3,859 5,645 3,528 441 20,473 Mth 7 $ $ $ $ $ $ 7,000 3,859 5,645 3,528 441 20,473 Mth 8 $ $ $ $ $ $ 7,000 3,859 5,645 3,528 441 20,473 Mth 9 $ $ $ $ $ $ 7,000 3,859 5,645 3,528 441 20,473 Mth 10 $ $ $ $ $ $ 7,000 3,859 5,645 3,528 441 20,473 Mth 11 $ $ $ $ $ $ 7,000 3,859 5,645 3,528 441 20,473 Mth 12 $ $ $ $ $ $ 7,000 3,859 5,645 3,528 441 20,473 Total $ $ $ $ $ $ 84,000 46,305 67,738 42,336 5,292 245,671 38 13.3 PROFIT AND LOSS STATEMENTS Income Statement - Year One Revenue Cost of Goods Gross Margin MTH 1 $ 44,712 $ 13,501 $ 31,211 MTH 2 $ 45,212 $ 13,751 $ 31,461 MTH 3 $ 45,712 $ 14,001 $ 31,711 MTH 4 $ 46,212 $ 14,251 $ 31,961 MTH 5 $ 46,212 $ 14,251 $ 31,961 MTH 6 $ 46,212 $ 14,251 $ 31,961 MTH 7 $ 46,212 $ 14,251 $ 31,961 MTH 8 $ 46,212 $ 14,251 $ 31,961 MTH 9 $ 46,212 $ 14,251 $ 31,961 MTH 10 $ 46,212 $ 14,251 $ 31,961 MTH 11 $ 46,212 $ 14,251 $ 31,961 MTH 12 $ 46,212 $ 14,251 $ 31,961 TOTAL $ 551,541 $ 169,513 $ 382,027 Operating Expenses Payroll Payroll Expense (12%) Advertising/Marketing Bank/Merchant Fees Depreciation Insurance-General Insurance-Health Interest Office Supplies & Postage Professional Fees-Acct. Professional Fees-Atty. Rent Telephone Travel & Entertainment Utilities URL (Server)-Website Vehicle Expense Miscellaneous Total Operating Expenses $ 17,220 $ 2,066 $ 5,000 $ 134 $ 1,750 $ 500 $ $ 817 $ 50 $ 300 $ 2,000 $ 3,800 $ 200 $ 100 $ 1,140 $ 50 $ 600 $ 250 $ 35,977 $ 17,220 $ 2,066 $ 5,000 $ 136 $ 1,750 $ 500 $ $ 817 $ 50 $ 300 $ $ 3,800 $ 200 $ 100 $ 1,140 $ 50 $ 600 $ 250 $ 33,979 $ 17,220 $ 2,066 $ 5,000 $ 137 $ 1,750 $ 500 $ $ 817 $ 50 $ 300 $ $ 3,800 $ 200 $ 100 $ 1,140 $ 50 $ 600 $ 250 $ 33,980 $ 17,220 $ 2,066 $ 1,500 $ 139 $ 1,750 $ 500 $ $ 817 $ 50 $ 300 $ $ 3,800 $ 200 $ 100 $ 1,140 $ 50 $ 600 $ 250 $ 30,482 $ 17,220 $ 2,066 $ 1,500 $ 139 $ 1,750 $ 500 $ $ 817 $ 50 $ 300 $ $ 3,800 $ 200 $ 100 $ 1,140 $ 50 $ 600 $ 250 $ 30,482 $ 17,220 $ 2,066 $ 1,500 $ 139 $ 1,750 $ 500 $ $ 817 $ 50 $ 300 $ $ 3,800 $ 200 $ 100 $ 1,140 $ 50 $ 600 $ 250 $ 30,482 $ 17,220 $ 2,066 $ 1,500 $ 139 $ 1,750 $ 500 $ $ 817 $ 50 $ 300 $ $ 3,800 $ 250 $ 100 $ 1,140 $ 100 $ 600 $ 250 $ 30,582 $ 17,220 $ 2,066 $ 1,500 $ 139 $ 1,750 $ 500 $ $ 817 $ 50 $ 300 $ $ 3,800 $ 250 $ 100 $ 1,140 $ 100 $ 600 $ 250 $ 30,582 $ 17,220 $ 2,066 $ 1,500 $ 139 $ 1,750 $ 500 $ $ 817 $ 50 $ 300 $ $ 3,800 $ 250 $ 100 $ 1,140 $ 100 $ 600 $ 250 $ 30,582 $ 17,220 $ 2,066 $ 1,500 $ 139 $ 1,750 $ 500 $ $ 817 $ 50 $ 300 $ $ 3,800 $ 250 $ 100 $ 1,140 $ 100 $ 600 $ 250 $ 30,582 $ 17,220 $ 2,066 $ 1,500 $ 139 $ 1,750 $ 500 $ $ 817 $ 50 $ 300 $ $ 3,800 $ 250 $ 100 $ 1,140 $ 100 $ 600 $ 250 $ 30,582 $ 17,220 $ 2,066 $ 1,500 $ 139 $ 1,750 $ 500 $ $ 817 $ 50 $ 300 $ $ 3,800 $ 250 $ 100 $ 1,140 $ 100 $ 600 $ 250 $ 30,582 $ 206,640 $ 24,797 $ 28,500 $ 1,655 $ 21,000 $ 6,000 $ $ 9,800 $ 600 $ 3,600 $ 2,000 $ 45,600 $ 2,700 $ 1,200 $ 13,680 $ 900 $ 7,200 $ 3,000 $ 378,871 Operating Profit $ (4,767) $ (2,518) $ (2,270) $ 1,479 $ 1,479 $ 1,479 $ 1,379 $ 1,379 $ 1,379 $ 1,379 $ 1,379 $ 1,379 $ 3,156 Tax Burden (28%) Net Profit $ $ $ (4,767) $ $ (2,518) $ $ (2,270) $ 1,479 $ $ 1,479 $ $ 1,479 $ $ 1,379 $ $ 1,379 $ $ 1,379 $ $ 1,379 $ $ 1,379 $ $ 884 495 $ $ 884 2,272 39 Income Statement - Year Two Revenue Cost of Goods Gross Margin MTH 1 $ 63,623 $ 19,533 $ 44,090 MTH 2 $ 64,123 $ 19,783 $ 44,340 MTH 3 $ 64,623 $ 20,033 $ 44,590 MTH 4 $ 65,123 $ 20,283 $ 44,840 $ $ $ MTH 5 65,123 20,283 44,840 $ $ $ MTH 6 65,123 20,283 44,840 $ $ $ MTH 7 65,123 20,283 44,840 $ $ $ MTH 8 65,123 20,283 44,840 $ $ $ MTH 9 65,123 20,283 44,840 $ $ $ MTH 10 65,123 20,283 44,840 $ $ $ MTH 11 65,123 20,283 44,840 $ $ $ MTH 12 65,123 20,283 44,840 $ $ $ TOTAL 778,476 241,895 536,581 Operating Expenses Payroll Payroll Expense (12%) Advertising/Marketing Bank/Merchant Fees Depreciation Insurance-General Insurance-Health Interest Office Supplies & Postage Professional Fees-Acct. Professional Fees-Atty. Rent Telephone Travel & Entertainment Utilities URL (Server)-Website Vehicle Expense Miscellaneous Total Operating Expenses $ 19,331 $ 2,320 $ 1,500 $ 191 $ 1,750 $ 600 $ $ 817 $ 100 $ 300 $ $ 3,800 $ 250 $ 250 $ 1,140 $ 50 $ 750 $ 500 $ 33,648 $ 19,331 $ 2,320 $ 1,500 $ 192 $ 1,750 $ 600 $ $ 817 $ 100 $ 300 $ $ 3,800 $ 250 $ 250 $ 1,140 $ 50 $ 750 $ 500 $ 33,650 $ 19,331 $ 2,320 $ 1,500 $ 194 $ 1,750 $ 600 $ $ 817 $ 100 $ 300 $ $ 3,800 $ 250 $ 250 $ 1,140 $ 50 $ 750 $ 500 $ 33,651 $ 19,331 $ 2,320 $ 1,500 $ 195 $ 1,750 $ 600 $ $ 817 $ 100 $ 300 $ $ 3,800 $ 250 $ 250 $ 1,140 $ 50 $ 750 $ 500 $ 33,653 $ $ $ $ $ $ $ $ $ $ $ $ $ $ $ $ $ $ $ 19,331 2,320 1,500 195 1,750 600 817 100 300 3,800 250 250 1,140 50 750 500 33,653 $ $ $ $ $ $ $ $ $ $ $ $ $ $ $ $ $ $ $ 19,331 2,320 1,500 195 1,750 600 817 100 300 3,800 250 250 1,140 50 750 500 33,653 $ $ $ $ $ $ $ $ $ $ $ $ $ $ $ $ $ $ $ 19,331 2,320 1,500 195 1,750 600 817 100 300 3,800 250 250 1,140 100 750 500 33,703 $ $ $ $ $ $ $ $ $ $ $ $ $ $ $ $ $ $ $ 19,331 2,320 1,500 195 1,750 600 817 100 300 3,800 250 250 1,140 100 750 500 33,703 $ $ $ $ $ $ $ $ $ $ $ $ $ $ $ $ $ $ $ 19,331 2,320 1,500 195 1,750 600 817 100 300 3,800 250 250 1,140 100 750 500 33,703 $ $ $ $ $ $ $ $ $ $ $ $ $ $ $ $ $ $ $ 19,331 2,320 1,500 195 1,750 600 817 100 300 3,800 250 250 1,140 100 750 500 33,703 $ $ $ $ $ $ $ $ $ $ $ $ $ $ $ $ $ $ $ 19,331 2,320 1,500 195 1,750 600 817 100 300 3,800 250 250 1,140 100 750 500 33,703 $ $ $ $ $ $ $ $ $ $ $ $ $ $ $ $ $ $ $ 19,331 2,320 1,500 195 1,750 600 817 100 300 3,800 250 250 1,140 100 750 500 33,703 $ $ $ $ $ $ $ $ $ $ $ $ $ $ $ $ $ $ $ 231,972 27,837 18,000 2,335 21,000 7,200 9,800 1,200 3,600 45,600 3,000 3,000 13,680 900 9,000 6,000 404,124 Operating Profit $ 10,442 $ 10,690 $ 10,939 $ 11,187 $ 11,187 $ 11,187 $ 11,137 $ 11,137 $ 11,137 $ 11,137 $ 11,137 $ 11,137 $ 132,457 Tax Burden (28%) Net Profit $ $ $ $ $ $ $ $ $ $ 3,132 8,055 $ $ 3,132 8,055 $ $ 3,118 8,019 $ $ 3,118 8,019 $ $ 3,118 8,019 $ $ 3,118 8,019 $ $ 3,118 8,019 $ $ 3,118 8,019 $ $ 37,088 95,369 2,924 7,518 2,993 7,697 3,063 7,876 3,132 8,055 40 Income Statement - Year Three Revenue Cost of Goods Gross Margin MTH 1 $ 82,122 $ 25,188 $ 56,935 MTH 2 $ 82,622 $ 25,438 $ 57,185 MTH 3 $ 83,122 $ 25,688 $ 57,435 $ $ $ MTH 4 83,622 25,938 57,685 $ $ $ MTH 5 83,622 25,938 57,685 $ $ $ MTH 6 83,622 25,938 57,685 $ $ $ MTH 7 83,622 25,938 57,685 $ $ $ MTH 8 83,622 25,938 57,685 $ $ $ MTH 9 83,622 25,938 57,685 $ $ $ MTH 10 83,622 25,938 57,685 $ $ $ MTH 11 83,622 25,938 57,685 $ $ $ MTH 12 83,622 25,938 57,685 TOTAL $ 1,000,469 $ 309,750 $ 690,719 Operating Expenses Payroll Payroll Expense (12%) Advertising/Marketing Bank/Merchant Fees Depreciation Insurance-General Insurance-Health Interest Office Supplies & Postage Professional Fees-Acct. Professional Fees-Atty. Rent Telephone Travel & Entertainment Utilities URL (Server)-Website Vehicle Expense Miscellaneous Total Operating Expenses $ $ $ $ $ $ $ $ $ $ $ $ $ $ $ $ $ $ $ 20,473 2,457 2,000 246 1,750 1,000 817 150 400 3,990 400 500 1,197 65 1,000 500 36,944 $ $ $ $ $ $ $ $ $ $ $ $ $ $ $ $ $ $ $ 20,473 2,047 2,000 248 1,750 1,000 817 150 400 3,990 400 500 1,197 65 1,000 500 36,536 $ $ $ $ $ $ $ $ $ $ $ $ $ $ $ $ $ $ $ 20,473 2,047 2,000 249 1,750 1,000 817 150 400 3,990 400 500 1,197 65 1,000 500 36,538 $ $ $ $ $ $ $ $ $ $ $ $ $ $ $ $ $ $ $ 20,473 2,047 2,000 251 1,750 1,000 817 150 400 3,990 400 500 1,197 65 1,000 500 36,539 $ $ $ $ $ $ $ $ $ $ $ $ $ $ $ $ $ $ $ 20,473 2,047 2,000 251 1,750 1,000 817 150 400 3,990 400 500 1,197 65 1,000 500 36,539 $ $ $ $ $ $ $ $ $ $ $ $ $ $ $ $ $ $ $ 20,473 2,047 2,000 251 1,750 1,000 817 150 400 3,990 400 500 1,197 65 1,000 500 36,539 $ $ $ $ $ $ $ $ $ $ $ $ $ $ $ $ $ $ $ 20,473 2,047 2,000 251 1,750 1,000 817 200 400 3,990 400 500 1,197 65 1,000 500 36,589 $ $ $ $ $ $ $ $ $ $ $ $ $ $ $ $ $ $ $ 20,473 2,047 2,000 251 1,750 1,000 817 200 400 3,990 400 500 1,197 65 1,000 500 36,589 $ $ $ $ $ $ $ $ $ $ $ $ $ $ $ $ $ $ $ 20,473 2,047 2,000 251 1,750 1,000 817 200 400 3,990 400 500 1,197 65 1,000 500 36,589 $ $ $ $ $ $ $ $ $ $ $ $ $ $ $ $ $ $ $ 20,473 2,047 2,000 251 1,750 1,000 817 200 400 3,990 400 500 1,197 65 1,000 500 36,589 $ $ $ $ $ $ $ $ $ $ $ $ $ $ $ $ $ $ $ 20,473 2,047 2,000 251 1,750 1,000 817 200 400 3,990 400 500 1,197 65 1,000 500 36,589 $ $ $ $ $ $ $ $ $ $ $ $ $ $ $ $ $ $ $ 20,473 2,047 2,000 251 1,750 1,000 817 200 400 3,990 400 500 1,197 65 1,000 500 36,589 $ $ $ $ $ $ $ $ $ $ $ $ $ $ $ $ $ $ $ 245,671 24,977 24,000 3,001 21,000 12,000 9,800 2,100 4,800 47,880 4,800 6,000 14,364 780 12,000 6,000 439,173 Operating Profit $ 19,991 $ 20,649 $ 20,897 $ 21,146 $ 21,146 $ 21,146 $ 21,096 $ 21,096 $ 21,096 $ 21,096 $ 21,096 $ 21,096 $ 251,546 Tax Burden (28%) Net Profit $ $ 5,597 14,393 $ $ 5,782 14,867 $ $ 5,851 15,046 $ $ 5,921 15,225 $ $ 5,921 15,225 $ $ 5,921 15,225 $ $ 5,907 15,189 $ $ 5,907 15,189 $ $ 5,907 15,189 $ $ 5,907 15,189 $ $ 5,907 15,189 $ $ 5,907 15,189 $ $ 70,433 181,113 41 13.4 CASH FLOW STATEMENTS Cash Flow - Year One MTH 1 Operating Activities Net Income (after taxes) Adjustments to Reconcile Depreciation & Amortization Change In: Accounts Receivable Inventories* Accounts Payable Other Cash From Operating Activities Investing Activities Capital Expenditures** Other Non-Expensed Expenditures*** Cash Used in Investing Financing Activities Equity Infusion Increase (Decrease) Long Term Debt Increase (Decrease) Short Term Debt Dividends Paid Other Cash (Used In)From Financing $ $ $ $ MTH 2 (4,767) $ MTH 3 (2,518) $ 1,750 $ MTH 4 (2,270) $ 1,750 $ MTH 5 MTH 6 MTH 7 MTH 8 MTH 9 MTH 10 MTH 11 MTH 12 TOTAL 1,479 $ 1,479 $ 1,479 $ 1,379 $ 1,379 $ 1,379 $ 1,379 $ 1,379 $ 495 $ 2,272 1,750 $ 1,750 $ 1,750 $ 1,750 $ 1,750 $ 1,750 $ 1,750 $ 1,750 $ 1,750 $ 21,000 1,750 $ - $ - $ - $ - $ - $ - $ - $ - $ - $ - $ - $ - $ - (20,000) $ - $ - $ - $ - $ - $ - $ - $ - $ - $ - $ - $ (20,000) - $ - $ - $ - $ - $ - $ - $ - $ - $ - $ - $ - $ - $ $ - $ - $ - $ - $ - $ - $ - $ - $ - $ - $ - $ - $ - 3,229 $ 3,229 $ 3,229 $ 3,129 $ 3,129 $ 3,129 $ 3,129 $ 3,129 $ 2,245 $ 3,272 $ (23,017) $ (768) $ (520) $ $ (105,000) $ - $ - $ - $ - $ - $ - $ - $ - $ - $ - $ - $ $ - $ - $ - $ - $ - $ - $ - $ - $ - $ - $ - $ - $ $ (105,000) $ - $ - $ - $ - $ - $ - $ - $ - $ - $ - $ - $ $ 5,000 $ - $ - $ - $ - $ - $ - $ - $ - $ - $ - $ - $ $ - $ - $ - $ - $ - $ - $ - $ - $ - $ - $ - $ - $ $ - $ - $ - $ - $ - $ - $ - $ - $ - $ - $ - $ $ 140,000 (105,000) (105,000) 5,000 140,000 $ - $ - $ - $ - $ - $ - $ - $ - $ - $ - $ - $ - $ $ - $ - $ - $ - $ - $ - $ - $ - $ - $ - $ - $ - $ - - $ - $ - $ - $ - $ - $ - $ - $ - $ - $ - $ 145,000 3,229 $ 3,229 $ 3,229 $ 3,129 $ 3,129 $ 3,129 $ 3,129 $ 3,129 $ 2,245 $ 43,272 - $ 145,000 $ $ 16,983 $ Cash, Beginning of Month $ Cash , End of Month $ *Initial inventory **In accordance with Use of Funds - $ 16,983 $ 16,215 $ 15,696 $ 18,925 $ 22,154 $ 25,383 $ 28,511 $ 31,640 $ 34,769 $ 37,898 $ 41,027 $ - 16,983 $ 16,215 $ 15,696 $ 18,925 $ 22,154 $ 25,383 $ 28,511 $ 31,640 $ 34,769 $ 37,898 $ 41,027 $ 43,272 $ 43,272 Increase (Decrease) in Cash (768) $ (520) $ 42 Cash Flow - Year Two MTH 1 Operating Activities Net Income (after taxes) Adjustments to Reconcile Depreciation & Amortization Change In: Accounts Receivable Inventories* Accounts Payable Other Cash From Operating Activities Investing Activities Capital Expenditures** Other Non-Expensed Expenditures*** Cash Used in Investing Financing Activities Equity Infusion Increase (Decrease) Long Term Debt Increase (Decrease) Short Term Debt Dividends Paid Other Cash (Used In)From Financing MTH 2 MTH 3 MTH 4 MTH 5 MTH 6 MTH 7 MTH 8 MTH 9 MTH 10 MTH 11 MTH 12 TOTAL $ 7,518 $ 7,697 $ 7,876 $ 8,055 $ 8,055 $ 8,055 $ 8,019 $ 8,019 $ 8,019 $ 8,019 $ 8,019 $ 8,019 $ 95,369 $ 1,750 $ 1,750 $ 1,750 $ 1,750 $ 1,750 $ 1,750 $ 1,750 $ 1,750 $ 1,750 $ 1,750 $ 1,750 $ 1,750 $ 21,000 $ - $ - $ $ - $ - $ $ - $ - $ - $ - $ - $ - $ 9,268 $ 9,447 $ $ - $ - $ (1,488) $ - - $ - $ $ - $ - $ - $ - $ - $ - 8,138 $ 9,805 $ 9,805 $ $ - $ - $ (1,488) $ - - $ - $ $ - $ - $ - $ - $ - $ - 8,317 $ 9,769 $ 9,769 $ $ - $ - $ (1,488) $ - - $ - $ $ - $ - $ - $ $ - $ - $ - $ 8,281 $ 9,769 $ 9,769 $ - $ (1,488) $ 8,281 $ (5,952) 110,417 $ - $ - $ - $ - $ - $ - $ - $ - $ - $ - $ - $ - $ - $ - $ - $ - $ - $ - $ - $ - $ - $ - $ - $ - $ - $ - $ - $ - $ - $ - $ - $ - $ - $ - $ - $ - $ - $ - $ - $ - $ - $ - $ - $ - $ - $ - $ - $ - $ - $ - $ - $ - $ - $ - $ - $ - $ - $ - $ - $ - $ - $ - $ - $ - $ - $ - $ - $ - $ - $ - $ - $ - $ - $ - $ - $ - $ - $ - $ - $ - $ - $ - $ - $ - $ - $ - $ - $ - $ - $ - $ - $ - $ - $ - $ - $ - $ - $ - $ - $ - $ - $ - $ - $ - $ - $ - $ - $ - $ - $ - $ - $ - $ - $ - $ - $ - $ - Increase (Decrease) in Cash $ 9,268 $ 9,447 $ 8,138 $ 9,805 $ 9,805 $ 8,317 $ Cash, Beginning of Month Cash , End of Month *Increases in inventory $ 43,272 $ 52,540 $ 61,987 $ 70,125 $ 79,930 $ $ 52,540 $ 61,987 $ 70,125 $ 79,930 $ 89,735 $ 9,769 $ 9,769 $ 8,281 $ 9,769 $ 9,769 $ 8,281 $ 110,417 89,735 $ 98,052 $ 107,821 $ 117,590 $ 125,871 $ 135,640 $ 145,409 $ 43,272 98,052 $ 107,821 $ 117,590 $ 125,871 $ 135,640 $ 145,409 $ 153,689 $ 153,689 43 Cash Flow - Year Three MTH 1 Operating Activities Net Income (after taxes) Adjustments to Reconcile Depreciation & Amortization Change In: Accounts Receivable Inventories* Accounts Payable Other Cash From Operating Activities Investing Activities Capital Expenditures** Other Non-Expensed Expenditures**8 Cash Used in Investing Financing Activities Equity Infusion Increase (Decrease) Long Term Debt Increase (Decrease) Short Term Debt Dividends Paid Other Cash (Used In)From Financing MTH 2 MTH 3 MTH 4 MTH 5 MTH 6 MTH 7 MTH 8 MTH 9 MTH 10 MTH 11 MTH 12 TOTAL $ 14,393 $ 14,867 $ 15,046 $ 15,225 $ 15,225 $ 15,225 $ 15,189 $ 15,189 $ 15,189 $ 15,189 $ 15,189 $ 15,189 $ 181,113 $ 1,750 $ 1,750 $ 1,750 $ 1,750 $ 1,750 $ 1,750 $ 1,750 $ 1,750 $ 1,750 $ 1,750 $ 1,750 $ 1,750 $ 21,000 $ - $ - $ $ - $ - $ $ - $ - $ - $ - $ - $ - $ 16,143 $ 16,617 $ $ - $ - $ (2,882) $ - - $ - $ $ - $ - $ - $ - $ - $ - 13,914 $ 16,975 $ 16,975 $ $ - $ - $ (2,882) $ - - $ - $ $ - $ - $ - $ - $ - $ - 14,093 $ 16,939 $ 16,939 $ $ - $ - $ (2,882) $ - - $ - $ $ - $ - $ - $ $ - $ - $ - $ 14,057 $ 16,939 $ 16,939 $ - $ (2,882) $ 14,057 $ (11,528) 190,585 $ - $ - $ - $ - $ - $ - $ - $ - $ - $ - $ - $ - $ - $ - $ - $ - $ - $ - $ - $ - $ - $ - $ - $ - $ - $ - $ - $ - $ - $ - $ - $ - $ - $ - $ - $ - $ - $ - $ - $ - $ - $ - $ - $ - $ - $ - $ - $ - $ - $ - $ - $ - $ - $ - $ - $ - $ - $ - $ - $ - $ - $ - $ - $ - $ $ - $ - $ - $ - $ - $ - $ - $ - $ - $ - $ - $ (140,000) $ $ - $ - $ - $ - $ - $ - $ - $ - $ - $ - $ - $ - $ $ - $ - $ - $ - $ - $ - $ - $ - $ - $ - $ - $ - $ $ - $ - $ - $ - $ - $ - $ - $ - $ - $ - $ - $ (140,000) $ (140,000) (140,000) - Increase (Decrease) in Cash $ 16,143 $ 16,617 $ 13,914 $ 16,975 $ 16,975 $ 14,093 $ 16,939 $ 16,939 $ 14,057 $ 16,939 $ 16,939 $ (125,943) $ 50,585 Cash, Beginning of Month Cash , End of Month *Increases in inventory $ 153,689 $ 169,833 $ 186,450 $ 200,364 $ 217,338 $ 234,313 $ 248,406 $ 265,345 $ 282,284 $ 296,340 $ 313,279 $ 330,218 $ 153,689 $ 169,833 $ 186,450 $ 200,364 $ 217,338 $ 234,313 $ 248,406 $ 265,345 $ 282,284 $ 296,340 $ 313,279 $ 330,218 $ 204,275 $ 204,275 44 16.0 REFERENCES 2004 “Screaming for Ice Cream” Food Industry, bNet http://findarticles.com/p/articles/mi_m3289/is_4_173/ai_115490578/ 2005 “America’s favorite Ice Cream” Summer Money, CNN/Money, http://money.cnn.com/2005/07/25/pf/goodlife/summer_ice_cream/ 2007 “Ice Cream Industry Overview” Cold Stone Creamery, http://www.coldstonecreamery.com/assets/pdf/news/Industry_Overview_04_07.pdf 2007 “Population Growth of Counties, Florida” EpoDunk.com, http://www.epodunk.com/top10/countyPop/coPop10.html 2008 “As Florida’s Fastest-Growing Counties Grow, So Grows Polk” The Ledger, http://www.theledger.com/article/20080320/NEWS/803200454?tc=ar 2010 “Florida Quick Facts” StateofFlorida.com, http://www.stateofflorida.com/Portal/DesktopDefault.aspx?tabid=95 2010 “Ice Creams and Frozen Desserts, US Industry Profile” Answers.com, http://www.answers.com/topic/ice-cream-and-frozen-desserts 2010 “Sarasota (City),” Florida, U.S. Census Bureau, State & County QuickFacts, http://quickfacts.census.gov/qfd/states/12/1264175.html 45 2010 “Sarasota County,” Florida, U.S. Census Bureau, State & County QuickFacts, http://quickfacts.census.gov/qfd/states/12/12115.html 2010 “Sarasota, Florida Retirement Communities” American Homeguides., http://www.americanhomeguides.com/homes/active_adult/florida/sarasota.html 2010 “The Hottest States in the U.S., Ranked by Average Monthly Temperature” Associated Content., http://www.associatedcontent.com/article/2615983/the_hottest_states_in_the_us.html?cat=16 2010 “Top Ten List: Leading Ice Cream Consuming Nations” Food Channel, http://www.foodchannel.com/stories/679-top-ten-list-leading-ice-cream-consuming-nations 46
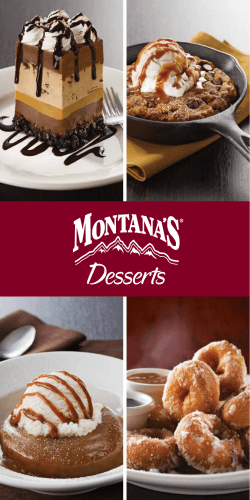


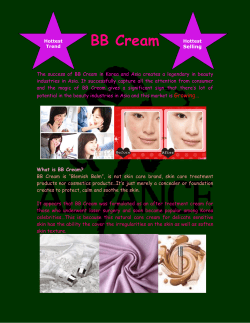

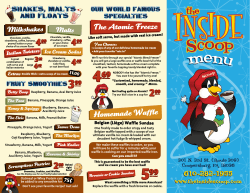


© Copyright 2026