
Research Note Magnetic Daily Variations Compared Between the
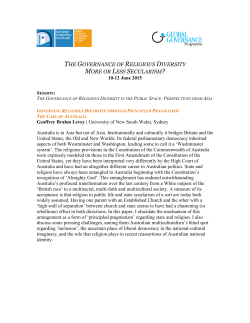
Geophys. J. R. astr. SOC.(1976) 44, 719-724.
Research Note
Magnetic Daily Variations Compared Between the
East and West Coasts of Australia
F. E. M. Lilley and R. L. Parker
(Received 1975 August 11)
Summary
A study of magnetic daily variations shows their vertical component to be
enhanced at the west coast of Australia, just as previous work had showed
it to be reduced at the east coast. The anomalous contributions appear
most likely to be due to induction by the onshore horizontal component of
the daily variation field. The Australian data may also indicate regional
differences in the structure of the continent.
1. Introduction
The coast effect in geomagnetic fluctuations of periods about one hour has been
recognized since the work of Parkinson (1959). The evident correlation of vertical
fluctuations near coast lines with fluctuations in the onshore horizontal magnetic field
component has led to interpretations that the latter induce the former, (Schmucker
1964; Hyndman & Cochrane 1971; Lilley & Bennett 1973).
At the longer periods of the daily variation the position has been less clear. Less
data have been published than for fluctuations of period about 1 hr, and at any given
station daily variations tend to be repetitive, so that the range of horizontal field
changes upon which the determination of a Parkinson vector depends is not easily
observed. Furthermore, at the longer periods of the daily variation a substantial
regional (or ‘ normal ’) contribution is present in the vertical component of magnetic
field; this must be known and subtracted from fluctuations observed at a coastal
station, before an estimate of the coast effect can be obtained.
There are then several possible contributions to the coast effect at daily variation
periods. Two of these are (i) induction by the onshore horizontal component at the
ocean-continent interface, as for the coast effect at periods of about 1 hr, and (ii)
induction by the regional vertical component of fluctuations, especially in the oceans.
This latter effect has been estimated by Bullard & Parker (1970) and Richards (1970).
A third possibility is that of induction by oceanic tides moving in the Earth’s steady
magnetic field. Where such an effect has been detected, (Larsen 1968), it has been
small; however it must be remembered as a possible mechanism.
Bennett & Lilley (1973) examined the coast effect for south-east Australia at long
periods, and found the anomalous vertical fields to correlate more consistently with
the onshore horizontal components than with Richards’ anomalous field estimates,
implying that induction by the onshore horizontal field at the ocean-continent
719
720
F. E.M. Lilley and R. L. Parker
interface might be the dominant effect. They examined also the coast effect at long
periods evident in Schmucker's (1970) data for the Californian coast, with a similar
result.
It is of interest to augment Bennett and Lilley's East Australia-California comparison with data from either an east coast in the Northern Hemisphere, or a west coast
in the Southern Hemisphere, as there is the possibility that the ' mirror-imaging ' of
the daily-variation source current systems between the two hemispheres (Matsushita
1967) still allows the anomalous vertical components of east Australia and California
to correlate with the normal vertical fields of the Southern and Northern Hemispheres
respectively. One such station, on a west coast in the Southern Hemisphere, is the
Gnangara observatory near Perth, Australia, operated by the Bureau of Mineral
Resources.
This note reports an analysis of a quiet day at Gnangara, and its comparison with
the coast effects of east Australia and California.
2. The west Australian data
The position of the Gnangara observatory is shown in Fig. 1. To obtain data from
an inland control station, a single quiet day has been chosen for analysis (1970
October 9, local time), when an array of variometers was operating across South
FIG.1. Map of Australia~showing
positions of relevant observingsites. Geographic
co-ordinates are: Cnangara, (31"47'S, 115"57' E); Emu, (28"39'S, 132'04' E);
Yelta, (31"56'S, 143O39'E); Moruya, (35"54'S, 150'08'E).
72 1
Research note
Australia (Gough, McEllhinny & Lilley 1974). Of the 25 stations of the array, two in
particular (Emu and Yelta, the western and eastern extremes also shown in Fig. l), are
used in this analysis. Emu is closer to Gnangara, but Yelta is more nearly on the same
geomagnetic latitude. These stations are not as satisfactory a control as would be a full
simultaneous coastal array, but they should be reasonable on a quiet day during which
the ionospheric current systems change little as the Earth rotates beneath them, from
Emu to Gnangara.
For the Gnangara data hourly means were supplied by the observatory, and these
are plotted in Fig. 2. For Yelta and Emu the records digitized at half-hour intervals
were taken, (Lilley 1975), and these are also plotted in Fig. 2. Simple 24 hr, 12 hr, 8 hr
and 6 hr Fourier harmonic amplitudes and phases for these records were then computed. While the analysis of one day may not give a reasonable estimate of the
average daily variation at a single station, it may nevertheless be used to compare the
response at two different stations.
Data thus obtained for the various periods at the different stations are plotted in
polar form in Fig. 3 (left-hand column). The phase convention used is that an increase
in the lead of a signal corresponds to the signal occurring at an earlier time. The
estimates of anomalous vertical field (2,) at Gnangara have been obtained by subtracting from the observed vertical variation (2,) the mean of the vertical variation
observed at Yelta (2,) and Emu (&), taking local solar time at all stations.
The diagrams in Fig. 3 for west Australia also show estimates of anomalous
vertical field for Gnangara made from Richards' maps (1 970), (&), after the method of
Bennett & Lilley (1973). The central and right-hand columns of Fig. 3 present the east
Australia and California data of Bennett and Lilley, for the purposes of comparison of
west Australia with these other two coasts.
L
f
b
&.
U
14
L
0
A
-
1
'2
I
,
I
23
0
Id
hi
FIG.2. Observations for the quiet day o f lY70 October 9, taken from local solar
midnight to midnight in each case.
J
4
i
722
F. E. M. Lilley and R. L. Parker
West Australia
(Gnangara 1
East Australia
(Mor u yo )
California
(Carnbria)
24 h r
12 hr
8 hr
6 hr
FIG.3. Amplitude and phase polar diagrams for the various field componenls
relevant to analysis of the coast effect. Zo: observed vertical field; ZN:regional
vertical field: Za:anomalous vertical field; ZR:vertical field estimate from Richards
(1970); ZE: vertical field at Emu; Zy:vertical field a t Yelta; D:magnetic east
horizontal field component; Y: geographic east horizontal field component;
Y’: onshore horizontal field component. Za can be seen to be the result of subtracting ZNfrom &, (for Gnaiigara ZNis taken as the mean of ZEand Z y ) . Phase
lead is zero at the top of each diagram, and increases clockwise. The radius of
each circle represents an amplitude scale of 9 nT.
Note that in most cases the position taken by Z , is such that it leads Y’ in phase by
/I Y’I ratios are 0.8 for Gnangara, 0 . 5 for
about half a quadrant. Mean [ZAl
Moruya, and 0.6 for Cambria.
Research note
723
3. Interpretation
(i) The basic result of the polar plots is that for Gnangara, as for the coasts of East
Australia and California, 2, is evidently correlated with Y’, rather than with 2, or Y.
This correlation carries the implication that of the mechanisms yet envisaged, ZA is
most likely induced by the onshore horizontal field. Such knowledge is essential to the
interpretation of coast effects in terms of electrical conductivity structure at oceancontinent boundaries.
It should be of interest to know whether the relationship holds also at other
oceanic coasts, such as the Atlantic coast of North America, for which several results
have been published at shorter periods, but none yet including daily variations.
(ii) The estimates of coastal anomalous vertical magnetic fields made from
Richards’ maps are crude, especially in amplitude. Even allowing for their approximate nature, however, they do not appear to account for a major part of the
observations.
Induction in the oceans by the vertical component of the source field thus appears
inadequate to account for the coast effect at Gnangara, as for East Australia and
California. The possibility remains, however, that Richards’ results would be different
and might account more fully for the observations if a grossIy different sub-oceanic
conductivity structure were assumed.
(iii) The curious effects in the vertical component of the daily variation, especially
its abnormal strength, noted for the west Australian observatory Watheroo (some
190 km north of Gnangara) by Malin &Winch (1968) and Green & Malin (1971), may
well be accounted for as being a coast effect, like that here demonstrated for Gnangara.
(iv) Inspection of the Gnangara and Moruya data shows that the ratio ]Z,l /I Y J is
consistently greater for the former than for the latter. Assuming the structures of the
two offshore oceans to be similar, this contrast may reflect differences in the continental structure between west Australia, which is stable shield, and east Australia,
which is younger and more tectonically active. Such an interpretation was also given
by Everett & Hyndman (1967) when comparing shorter period magnetic fluctuation
data between east and west Australia. The differences between east and west Australia
may indeed be evident simply in the contrast between the vertical fields recorded at
Yelta and Emu.
(v) Fig. 2 also shows differences in the amplitude of the X component at the three
stations. The amplitude at Emu may be expected to be slightly less than that at Yelta
as Emu is a more northerly station; but then Gnangara is more southerly so that the
X amplitude should increase again. The Gnangara Y amplitude is also slightly reduced
relative to the other two stations. Such westward reduction in the amplitude of the
horizontal components may also reflect varying conductivity structure beneath east
and west Australia.
Acknowledgments
The Observatory Section of the Bureau of Mineral Resources is thanked for
supplying the Gnangara data. Mrs M. N. Sloane assisted in the computations, and in
the preparation of Fig. 2. The paper was written while one of us (FtLP) was on
sabbatical leave at the Australian National University.
F. E. M. Lilley:
Research School of Earth Sciences
Australian National University
Canberra, ACT, 2601
Australia
F. E. h.1. Lilley and R. L. Parker
724
R. I
.
. Parker-.
Institirte for Geophysics and Planetary physics
Scripps Institution of Oceanography
University of Calijornia, San Diego
La Jolla, California 92093
USA
References
Bennett, D. J. & Lilley, F. E. M., 1973. An array study of daily magnetic variations in
southeast Australia, J. Geomagn. Geoelectr., 25, 39-62.
Bullard, E. C . &Parker, R. L., 1970. Electromagnetic induction in the ocean, The Sea,
Vol. 4, pp. 695-730, ed. A. E. Maxwell, Wiley-Interscience, New York.
Everett, J. E. & Hyndman, R. D., 1967. Geomagnetic variations and electrical
conductivity structure in south-western Australia, Phys. Earth planer. Znt., 1,
24-34.
Gough, D. I., McElhinny, M. W. & Lilley, F. E. M., 1974. A magnetometer array
study in southern Australia, Geophys. J. R. astr. Soc., 36, 345-362.
Green, P. & Malin, S. R. C., 1971. Lunar and solar daily variations of the geomagnetic
field at Watheroo, Western Australia, J. afmos. terrest. Phys., 33, 305-318.
Hyndman, R. D. & Cochrane, N. A., 1971. Electrical conductivity structure by
geomagnetic induction at the continental margin of Atlantic Canada, Geophys.
J. R. astr. SOC.,25, 425-446.
Larsen, J. C., 1968. Electric and magnetic fields induced by deep sea tides, Geophys.
J . R . astr. SOC.,
16, 47-70.
Lilley, F. E. M., 1975. The analysis of daily variations recorded by magnetometer
arrays, Geophys. J . R. astr. SOC.,43, 1.
Lilley, F. E. M. & Bennett, D. J., 1973. Linear relationships in geomagnetic variation
studies, Phys. Earth planet. Int., 7, 9-14.
Malin, S. R. C . & Winch, D. E., 1968. Anomalous Iuni-solar daily variation in the
geomagnetic field at Watheroo, Western Australia, Nature, 218, 941-942.
Matsushila, S., 1967. Solar quiet and lunar daily variation fields,Physics ofgeomagnetic
phenomena, pp. 301-424, eds S. Matsushita and W. H. Campbell, Academic
Press, New York.
Parkinson, W. D., 1959. Direction of rapid geomagnetic fluctuations, Geophys. J. R .
astr. Soc., 2, 1-14.
Richards, M. L., 1970. A study of electrical conductivity in the earth near Peru,
unpublished PhD thesis, University of California, San Diego.
Schmucker, U., 1964. Anomalies of geomagnetic variations in the south-western
United States, J. Geomagn. Geoelectr., 15, 193-221.
Schmucker, U., 1970. Anomalies of geomagnetic variations in the south-western
United States, Bull. Scripps Inst. Oceanography, Univ. Calif, 13.


© Copyright 2026