
Document 168106
Health Insurance in the Small Business
Market: Availability, Coverage, and the
Effect of Tax Incentives
by
Quantria Strategies, LLC
Cheverly, MD 20785
for
Under Contract Number SBAHQ-09-Q-0018
Release Date: September 2011
This report was developed under a contract with the Small Business Administration, Office of
Advocacy, and contains information and analysis that was reviewed by officials of the Office of
Advocacy. However, the final conclusions of the report do not necessarily reflect the views of the
Office of Advocacy.
CONTENTS
EXECUTIVE SUMMARY ........................................................................................................... 1
I.
INTRODUCTION ............................................................................................................. 7
II.
HEALTH INSURANCE COVERAGE AND EMPLOYMENT-BASED HEALTH
INSURANCE IN THE UNITED STATES ....................................................................... 9
A.
B.
III.
HEALTH INSURANCE IN THE SMALL BUSINESS MARKET ............................... 18
A.
B.
C.
IV.
Sources of Health Insurance Coverage .................................................................. 9
Advantages of Employer-Provided Health Insurance.......................................... 12
1.
Employer-Provided Health Insurance is a Compensation Cost for
Employers ................................................................................................ 12
2.
Tax Advantages Create Incentives for Employees to Prefer EmployerProvided Health Insurance ....................................................................... 14
3.
Nontax Advantages Create Additional Incentives ................................... 16
Access to Health Insurance in the Small Business Sector ................................... 18
1.
Small Business Health Insurance Access Rate by Establishment Size.... 18
2.
Take-Up Rates ......................................................................................... 20
3.
Cost and Quality of Health Insurance ...................................................... 23
Barriers to Offering Health Insurance in Small Businesses................................. 27
1.
Small Business Employees are Lower Paid than Employees of Large
Businesses ............................................................................................................ 27
2.
Risk Group Too Small/Potential for Adverse Risk Selection .................. 30
3.
Higher Administrative Costs.................................................................... 31
4.
Unpredictable Costs ................................................................................. 31
Effects of the Recession on the Availability of Employer-Provided Health
Insurance .............................................................................................................. 31
ANALYZING THE OFFERING OF HEALTH INSURANCE BY SMALL
BUSINESSES AT THE STATE LEVEL ............................................................ 40
A.
B.
C.
Overview .............................................................................................................. 40
The Role of Special Tax Incentives at the State Level in the Offering of Small
Business Health Insurance ................................................................................... 43
1.
Kansas ...................................................................................................... 45
2.
Montana ................................................................................................... 46
Relationship between State Tax Rates and Health Insurance Offer Rates .......... 48
Page |i
V.
USE OF EXISTING FEDERAL TAX INCENTIVES BY SMALL BUSINESSES AND
THE IMPLICATIONS OF HEALTH CARE REFORM ................................... 52
A.
Small Corporation Use of Federal Incentives ...................................................... 55
B.
Self-Employed Use of Federal Incentives ........................................................... 55
C.
Health Care Reform ............................................................................................. 57
1.
Overview .................................................................................................. 57
2.
Small Business Health Insurance Tax Credit........................................... 58
VI.
CONCLUSIONS.............................................................................................................. 63
APPENDIX A – Data on Health Insurance Offered by Small Businesses .................................. 65
APPENDIX B – Current Federal Tax Incentives for Health Insurance ..................................... 76
A.
B.
Overview .............................................................................................................. 76
Tax Provisions Relating to Individuals Who Purchase Health Insurance On
Their Own ............................................................................................................ 77
1.
Itemized Deduction for Out-of-Pocket Medical Expenses ...................... 77
2.
Tax Credits for the Purchase of Health Insurance ................................... 77
3.
Health Care Tax Credit ............................................................................ 77
C.
Exclusion From Income of Employee Health Benefits ....................................... 78
D.
Deduction for Health Insurance Premiums of Self-Employed Individuals ......... 78
E.
Flexible Spending Accounts (FSA’s) and Health Reimbursement
Arrangements ....................................................................................................... 79
F.
Health Savings Accounts (HSA’s) and Archer Medical Savings
Accounts (MSAs)................................................................................................. 79
G.
Retiree Medical Benefits...................................................................................... 80
H.
Welfare benefit funds and VEBAs ...................................................................... 80
I. Small Business Simple Cafeteria Plan (IRC sec. 125(j)) ............................................ 81
APPENDIX C – Summary of State Provisions Relating to Health Insurance ............................ 83
APPENDIX D – Sources of Data Relating to Health Insurance Access and Coverage in the
United States ...................................................................................................... 104
APPENDIX E – Maps Depicting Private Sector Establishments that Offer Health Insurance, by
Firm Size ............................................................................................................ 109
BIBLIOGRAPHY ...................................................................................................................... 114
P a g e | ii
LIST OF TABLES
Table 1 – Access, Take-Up, and Participation Rates, by Establishment Size ............................. 5
Table 2 – Examples of the Value of Federal Tax Benefits to Employees for EmployerProvided Health Insurance ......................................................................................... 15
Table 3 – Percentage of Private Sector Establishments Offering Health Insurance to
Employees, 2009, by firm size and other selected characteristics ............................. 18
Table 4 – Percentage of Private Sector Establishments Offering Health Insurance to Employees,
2009 by firm size and industry group ........................................................................ 19
Table 5 – Access, Take-Up , and Participation Rates, by Establishment Size .......................... 21
Table 6 – Private Sector Employer Compensation Costs in the United States, by
Establishment Size, March 2010................................................................................ 28
Table 7 – 2009 Access Rates for Employer-Provided Health Insurance percent of
Establishments, by Firm Size and by State ................................................................ 41
Table 8 – State Tax Incentives for Small Businesses to Offer Health Insurance to
Employees, 2009 ........................................................................................................ 44
Table 9 – Access Rates for Employer-Provided Health Insurance in Kansas, 2000-2009,
Percent of Establishments, by Firm Size ................................................................... 47
Table 10 – Access Rates for Employer-Provided Health Insurance in Montana, 2000-2009,
Percent of Establishments, by Firm Size ................................................................... 49
Table 12 – Estimated Number of Small Businesses With Less Than 25 Employees and
Average Wages of Less Than $50,000, 2010 ...........................................................59
Table 13 – Access, Take-Up, and Participation Rates, by Establishment Size ..........................63
Table A1 – Percent of Individual Income Tax Returns that Claim the Self-Employed Health
Insurance Deduction, 1998 to 2008 .........................................................................65
Table A2 – Percent of Private-Sector Establishments That Offer Health Insurance by State,
1998 to 2009, Firms with fewer than 10 employees ...............................................66
Table A3 – Percent of Private-Sector Establishments That Offer Health Insurance by State,
1998 to 2009, Firms 10 to 24 employees ................................................................68
P a g e | iii
Table A4 – Percent of private-sector establishments that offer health insurance by State, 1998
to 2009, Firms with 25 to 99 employees .................................................................70
Table A5 – Percent of private-sector establishments that offer health insurance by State, 1998
to 2009, Firms with 100 to 999 employees .............................................................72
Table A6 – Percent of Private-Sector Establishments That Offer Health Insurance by State,
1998 to 2009, Firms with 1,000 or more employees ...............................................74
Table B1 – Maximum Small Business Health Insurance Tax Credit (Percentage of Employer
Contribution to Premiums) 2010 -2013...................................................................81
Table B2 – Small Business Health Insurance Tax Credit (Percentage of Employer
Contribution to Premiums) 2014 and Subsequent Years ........................................82
Table D1 – States with Smaller Populations for Which MEPS-IC Estimates are Not
Available, 1996–2002 ...........................................................................................106
P a g e | iv
LIST OF GRAPHS
Graph 1
Sources of Health Insurance Coverage in the United States, 2009............................ 10
Graph 2
Employer Costs for Private Group Health Benefits in the United States, Average
Costs for selected Decades......................................................................................... 11
Graph 3
Average Health and Nonhealth Benefits as a Share of Total Compensation in the
United States, Selected Time Periods 1960's to 2000's ............................................. 12
Graph 4
Percent of Private-Sector U.S. Establishments that Offer Health Insurance, Firm
Size by Employment, 2009 ........................................................................................ 20
Graph 5
Percent of Returns with Self-Employment Income Claiming the Self-Employed
Health Insurance Deduction Tax Years 1998 and 2008, Distributed by AGI .......... 23
Graph 6
Average Single Premium of Private-Sector Employees Enrolled in an EmployerSponsored Health Insurance Plan, by Firm Size, 2009 .............................................. 24
Graph 7
Average Family Premium of Private-Sector Employees Enrolled in an EmployerSponsored Health Insurance Plan, by Firm Size, 2009 .............................................. 25
Graph 8
Average Single Deductible of Private-Sector Employees Enrolled in an EmployerSponsored Health Insurance Plan, by Firm Size, 2009 .............................................. 26
Graph 9
Average Family Deductible of Private-Sector Employees Enrolled in an EmployerSponsored Health Insurance Plan, by Firm Size, 2009 .............................................. 26
Graph 10 Mean Hourly Earnings of Workers in Private Industry Establishments, by
Employment Size of Establishment ........................................................................... 29
Graph 11 Percent Decline in Employment-Based Health Insurance Coverage, Establishment
Size by Employment, September 2007 to April 2009 ............................................... 33
Graph 12 Percent of Private-Sector Establishments that offer Health Insurance,
Establishments by Employment Size of Firm, 1998 – 2009 ...................................... 34
Graph 13 Establishment Offer Rates for Health Insurance, by Employment Size of Firm,
1998-2009 .................................................................................................................. 40
Graph 14 Small Business Health Insurance Establishment Access Rates, by Firm Size States
with State Corporate Tax Rates of 9 percent or higher .............................................. 50
Graph 15 Small Business Health Insurance Establishment Access Rates, by Firm Size States
with No State Corporate Tax .................................................................................... 51
Page |v
Graph 16 Estimated Small Corporation Deduction for Employer Health Insurance Benefits,
Tax Years 2003 to 2007 ............................................................................................53
Graph 17 Total Tax Savings for the Exclusion of Health Insurance Benefits Provided by an
Employer, Distributed by AGI, Tax Year 2007 ........................................................54
Graph 18 Amount of Self-Employed Health Deduction for Returns Claiming a Deduction, Tax
Years 1998 to 2008 ...................................................................................................55
Graph 19 Average Amount of Self-Employed Health Deduction for Returns Claiming a
Deduction, Tax Year 2008 ........................................................................................56
Graph 20 Self-Employed Deduction for Health Insurance, Returns and Deduction Amount,
Distributed by AGI, Tax Year 2008 .........................................................................57
LIST OF MAPS
Map 1
Change in the Percent of Private-Sector Establishments that Offered Health
Insurance, Firm Size of Fewer than 10 Employees, 2006 – 2009 ............................. 36
Map 2
Change in the Percent of Private-Sector Establishments that Offered Health
Insurance, Firm Size of 10 to 24 Employees, 2006 – 2009 ....................................... 37
Map 3
Change in the Percent of Private-Sector Establishments that Offered Health
Insurance, Firm Size of 25 to 99 Employees, 2006 – 2009 ....................................... 38
Map 4
Change in the Percent of Private-Sector Establishments that Offered Health
Insurance, Firm Size of 100 to 499 Employees, 2006 – 2009 ................................... 39
Map E1
Percent of Private-Sector Establishments that Offered Health Insurance, Firm Size
of Fewer than 10 Employees, 2009.......................................................................... 107
Map E2
Percent of Private-Sector Establishments that Offered .... Health Insurance, Firm Size
of 10 to 24 Employees, 2006 – 2009 ....................................................................... 108
Map E3
Percent of Private-Sector Establishments that Offered .... Health Insurance, Firm Size
of 25 to 99 Employees, 2006 – 2009 ....................................................................... 109
Map E4
Percent of Private-Sector Establishments that Offered .... Health Insurance, Firm Size
of 100 to 499 Employees, 2006 – 2009 ................................................................... 110
P a g e | vi
EXECUTIVE SUMMARY
Sources of Health Insurance Coverage
In the United States, most people get health insurance either through their employer or through a
spouse’s or parent’s employer. According to the most recent estimates of the Current Population
Survey (CPS), March 2010 Supplement, 55.8 percent of the U.S. population have access to
health insurance through an employer, 30.6 percent have access to health insurance through a
government program (such as Medicare, Medicaid, or SCHIP), 8.9 percent privately purchase
health insurance on their own, and 16.7 percent are uninsured.
Historically, there have been distinct advantages to obtaining health insurance coverage through
an employer. Individuals who receive health insurance coverage through an employer often have
the advantages of group rates, risk pooling, and cost sharing that are not available to individuals
who purchase health insurance on their own. One distinct advantage to employer-provided
health insurance is the Federal, and sometimes state, tax advantages that accrue to employees.
The value of employer-sponsored health insurance is excludable from an employee’s income for
Federal income tax and employment tax purposes, which has the effect of reducing the net cost
of health insurance for the employee. In addition, there are other Federal tax advantages, such as
the benefits for cafeteria plans, flexible spending arrangements, and health savings arrangements
that increase the incentives for employees to prefer to receive health insurance through an
employer.
On the other hand, employers generally are indifferent from a Federal tax perspective about
whether to pay compensation in cash or in the form of health insurance. This is because the
employer is entitled to deduct the costs of health insurance in the same way that the employer
deducts other compensation costs. Thus, there is no specific Federal tax advantage to the
employer to providing health insurance to employees. 1
Small Businesses and Health Insurance Coverage 2
Access to employer-sponsored health insurance correlates positively with business size. The
smallest businesses are the least likely and the largest businesses are the most likely to make
1
See the discussion below concerning economic theory concerning whether the employer or employee bears the
burden of the employer share of payroll taxes.
2
The Small Business Administration generally defines small businesses, for SBA financial assistance and other
programs and for Federal government procurement programs, as those firms with no more than 500 employees or
receipts no greater than $7 million, although the size standards vary by industry and can be larger or smaller than the
general standards depending upon the industry. See U.S. Small Business Administration, Table of Size Standards
Matched to North American Industry Classification System Codes. The IRS uses a general classification of assets
less than $10 million to distinguish small businesses. This study generally uses a size standard of less than 500
employees as a definition of a small business because most of the reliable survey data are collected based on
establishment or firm size, except that the study uses the IRS definition of assets of less than $10 million to identify
small corporations. In certain circumstances, when imputation was not possible, the analysis in this paper may
present data that relies on slightly different business size classifications.
Page |1
health insurance available to their employees. In 2009, 55 percent of U.S. private sector
establishments offered health insurance to their employees. For firms with 100-999 employees,
94.3 percent of establishments offered health insurance to their employees and for firms with
1,000 or more employees, 99.2 percent of establishments offered health insurance to their
employees. By contrast, for firms with fewer than 10 employees, only 33.1 percent of
establishments offered health insurance to employees and for firms with 10 to 24 employees, the
establishment access rate was 62.5 percent. Access rates are even lower for establishments with
predominantly low wage employees, with access rates as low as 17.9 percent of establishments
(for firms with fewer than 10 employees).
On the other hand, when employers offer health insurance, employees tend to accept the
coverage at about the same rate, irrespective of the size of the business – referred to as the takeup rate. In March 2010, the health insurance take-up rate was 71 percent by employees at firms
with 1 to 49 employees, 73 percent by employees at firms with 50 to 99 employees, 74 percent
by employees at firms with 100 to 499 employees, and 79 percent by employees at firms with
500 or more employees.
Many small businesses organize as sole proprietorships, partnerships, and S corporations; for
Federal tax purposes; this means that these types of businesses are not subject to the Federal
corporate income tax, but instead are subject to tax on the individual income tax returns of the
business owners. The owner of a corporation who works for the corporation is treated as an
employee for Federal tax purposes and the corporation can deduct the costs of health insurance
purchased for the owner. However, the owner of a sole proprietorship, partnership, or S
corporation generally is not treated as an employee under the Federal tax laws. As a result, the
deduction for employer contributions to a health plan does not apply to these so-called selfemployed individuals. Instead, they are entitled to claim the self-employed health insurance
deduction. This self-employed health insurance deduction is only allowed for income tax
purposes; it is not allowed for employment tax purposes. 3
Many small businesses in the United States do not have any employees other than the business
owner. In 2008, there were 21.4 million small businesses without employees in the United
States. 4 Unless they have health insurance coverage available through other employment or
through a spouse’s employment, these self-employed individuals must obtain their health
insurance coverage in the individual insurance market.
In 2008, 17 percent of Federal income tax returns reporting no income from self-employment
also reported the self-employed health insurance deduction. The use of the self-employed health
insurance deduction correlates positively with income – the likelihood of claiming the deduction
increases with income. In 2008, 84 percent of self-employed returns with adjusted gross income
of $500,000 or more claimed the self-employed health insurance deduction, whereas only 9
3
Section 162(l) of the Internal Revenue Code of 1986.
The Census Bureau publishes this data using administrative records from the Internal Revenue Service. Most of
the nonemployee firms are sole proprietorships, but there are also some partnerships and corporations that report no
employees included in this number. In order to identify legitimate operating businesses, the BLS only includes
businesses than have at least $1,000 of annual receipts.
4
Page |2
percent of self-employed returns with adjusted gross income between $10,000 and $20,000
claimed the deduction. 5
Access to health insurance coverage among employees of small businesses is one of the most
intractable problems facing the U.S. health care system. Small businesses face a variety of
barriers to offering health insurance coverage to their employees. The costs of health insurance
are typically much higher for employees of small businesses. In addition, small businesses face
significantly higher administrative costs per employee to offer health insurance and their overall
costs are less predictable than the costs of large businesses. Employees of small businesses tend
to receive lower wages compared to employees of large businesses, making low-wage employees
less likely to prefer health insurance benefits to higher wages.
Effects of the Recession on the Availability of Employer Health Insurance
The recession that began in December 2007 adversely affected access to employer health
insurance. A recent Employee Benefits Research Institute study found that employer-based
health insurance coverage declined by 4.3 percent between September of 2007 and April of
2009. The largest decline in coverage occurred among employees of firms with less than 25
employees (10.7 percent decline). The decline among employees of firms with 100 or more
employees was 3.5 percent.
However, employer access rates for health insurance have generally declined over time among
small business employers. For firms with fewer than 10 employees, establishment access rates
have declined from a high of 39.3 percent in 1999 to 33.6 percent in 2009. For firms with 10 to
24 employees, establishment access rates have declined from 69.9 percent (1999) to 62.5 percent
(2009). For firms with 25 to 99 employees, establishment access rates have declined from 85.3
percent (1999) to 81.6 percent (2009). For firms with 100 to 499 employees, establishment
access rates have shown less volatility, fluctuating between 93 percent to slightly less than 95
percent.
Geographic Difference in Health Insurance Offer Rates
Employer health insurance access rates also vary geographically. Offer rates tend to be higher in
the Northeast and lower in the Southwest. These differences are likely to reflect a variety of
factors, including: (1) employers in geographic areas compete for the same employees and,
therefore, are likely to offer similar benefit packages and (2) there may be higher concentrations
of employers that are less likely to offer health insurance in certain geographic areas, such as
those areas that are less urban.
One question is whether the geographic disparities in health insurance access rates might be
attributable to state mandates and/or state tax incentives designed to require or encourage
5
It is difficult to determine the employment status of the tax returns reporting incomes between $10,000 and
$20,000; some taxpayers may, in fact, have full-time employment with an employer and earn self-employment
income on a part-time basis. In other cases, however, self-employment may be the primary source of income and
those taxpayers may have low net incomes (either low income and/or high self-employed deductions).
Page |3
employers to offer health insurance to their employees. For example, in Hawaii, an employer
mandate requires employers to offer health insurance and the access rates reflect this state law
requirement.
Eleven states have adopted special tax incentives designed to encourage small businesses to offer
health insurance to their employees. However, in most cases, these tax incentives apply to a very
narrow class of small businesses (typically the smallest businesses) or are relatively narrow
incentives. There is no evidence that any of the tax incentives adopted at the state level have had
any positive effect on employer health insurance access rates.
Federal Tax Incentives
Given the size of Federal tax benefits relative to the tax incentives offered by the states, it is
relevant to examine what effect the Federal tax benefits might have on employer health
insurance. We estimate that small corporations (those with less than $10 million in assets)
claimed deductions for employer health insurance of $18.8 billion in 2007 (the most recent data
available). In 2007, self-employed taxpayers claimed $21.2 billion for the self-employed health
insurance deduction; the average amount claimed per return was $5,544. Approximately half of
the tax benefits of the self-employed health insurance deduction accrue to taxpayers with
adjusted gross income of at least $100,000.
The exclusion from employee income for employer health insurance cost approximately $246
billion in 2007, according to estimates of the Joint Committee on Taxation. This tax savings
included income taxes ($145.3 billion) and payroll taxes ($100.7 billion).
Small Business Health Insurance Tax Credit
The Patient Protection and Affordable Care Act of 2010 (hereinafter “Health Care Reform Act”)
adopted comprehensive changes to the U.S. health insurance system. In 2014, the Act will set up
state health exchanges that will offer individuals and small businesses access to health insurance,
provide greater regulation of health insurance, and provide tax credits for individuals and small
businesses to help offset the cost of health insurance.
The Health Care Reform Act affects small businesses in a variety of ways. Small businesses
with 50 or more employees are assessed a $2,000 per worker fee if they do not provide health
insurance to their employees and if any of their employees receive subsidized health insurance
coverage through a health insurance exchange. Beginning in 2014, small businesses with less
than 100 employees will have access to health insurance through the state exchanges and,
starting in 2017, the states will have the option of expanding the states’ exchanges to businesses
with more than 100 employees.
One of the most significant aspects of health care reform for small businesses is the adoption of a
generous tax credit to help subsidize the cost of small business health insurance. The credit is
Page |4
nonrefundable and is available only to offset current Federal income tax. 6 Thus, employers who
do not have sufficient current Federal income tax and Medicare tax liability cannot fully utilize
the credit; employers may carry back one year and carry forward 20 years the unused credits.
A recent analysis by the Lewin Group for Families USA and Small Business Majority estimated
that approximately 4 million small businesses will be eligible for the small business health
insurance tax credit nationwide and that approximately 1.2 million of these businesses will be
eligible for the full small business health insurance tax credit. It is important to distinguish
between eligibility for the credit and ability to apply the credit to current tax liabilities.
Eligibility means that by virtue of the firm characteristics, the small business is eligible to claim
the credit. Because the credit is nonrefundable, an employer can only use the credit if the
employer has positive Federal tax liability that the credit can offset.
Conclusions
Individuals who lack health insurance coverage in the United States are more likely to work for a
small employer compared to a large employer. The participation rates (access rate multiplied by
take-up rate) in employer-provided health insurance are shown in the following table. The table
shows that the participation rate in employer-provided health insurance correlates positively with
employer size.
Table 1 – Access, Take-Up, and Participation Rates, by Establishment Size
(Numbers are Percentages)
Establishment Size, by
Employment
1 to 49
50 to 99
100 to 499
500 or more
Total All Firms
Access
Take-up Rates
55
70
82
88
71
Participation
70
72
72
78
73
39
50
59
68
51
Source: U.S. Bureau of Labor Statistics, National Compensation Survey, March 2010
States have tried a variety of approaches to improve health insurance coverage and, particularly,
to improve the offering of health insurance by small businesses. However, we found that most
existing state-tax incentive programs apply to very narrow classes of employers (typically the
smallest of employers) and provide relatively narrow tax benefits. We found no correlation
between any of these tax incentives and employee access rates for health insurance.
The new Federal tax credit for small employer health insurance, effective beginning in 2010,
offers a more generous incentive to encourage small businesses to offer health insurance to their
6
Tax-exempt employers (i.e., organizations described in section 501(c) of the Internal Revenue Code) can use the
credit to offset the amounts withheld for income tax for employees and the employer and employee share of
Medicare taxes.
Page |5
employees. However, because the credit is nonrefundable, many employers will not be able to
take full advantage of it. In addition, the credit is most likely to benefit those small businesses
that currently offer health insurance to their employees. Other small businesses are likely to wait
to see how Federal healthcare reform affects overall health care costs in the United States before
adopting a plan to offer health insurance to their employees.
Page |6
I.
INTRODUCTION
Since the 1940’s, most Americans have obtained their health insurance coverage through
employer-sponsored health insurance. Employer-sponsored health insurance offers distinct
advantages over private purchases of health insurance, including favorable tax treatment for
Federal tax purposes and, in many cases, state income tax.
In addition to the favorable tax treatment, individuals who have access to health insurance
through an employer typically have the advantages of scale economies and risk distribution that
make employer-sponsored health insurance significantly cheaper than comparable privately
purchased health insurance coverage. However, these advantages disappear for small employers
who face high per employee costs to offer health insurance. The smaller the employer, the more
likely the per-employee costs will be similar to the costs of privately purchased health
insurance. 7 Further, the high administrative costs that small employers face to offer health
insurance coverage to employees often drives small employers out of this market.
A goal of the favorable tax treatment of employer-sponsored health insurance was to lead
employees to prefer health insurance coverage in lieu of cash wages. However, the Federal tax
system does not provide a specific tax advantage to employers to encourage them to provide
employer-sponsored health insurance instead of wages or other benefits and, the smaller the
employer, the more likely that the costs of employer-sponsored health insurance creates a
deterrent to providing this coverage. In addition, the specific demographics of small business
employees make them more likely to prefer cash wages to benefits.
As a result, employee access to health insurance correlates positively with firm size. In 2009,
33.6 percent of establishments with fewer than 10 employees offered employer-sponsored health
insurance, while nearly 100 percent of establishments of firms with 1,000 or more employees
offered health insurance to their employees. 8
The lack of access to affordable health insurance for employees of small businesses has been one
of the most intractable problems facing the U.S. health care system. States have experimented
with a variety of approaches to address this problem, including the adoption of specific reforms
to make is easier for small businesses to obtain affordable health insurance for their employees
and, in some limited cases, state tax incentives to encourage small employers to offer employersponsored health insurance to their employees.
Federal health care reform enacted in 2010 will have wide-ranging impacts on the availability of
health insurance in the United States. However, because this legislation does not require
employers to offer health insurance to their employees, the issues about access to employersponsored health insurance will remain important. Federal health care reform should make it
easier for small businesses to offer health insurance to their employees because reform will
7
In some cases, surveys show costs of health insurance at the small business level that are comparable to the costs
of large businesses, but this often reflects the fact that the health insurance offered to employees at the small
business level is less generous than health insurance offered by large businesses.
8
Medical Expenditure Panel Survey, 2009.
Page |7
permit small businesses to participate in the health insurance exchanges at the state level. In
addition, the reform legislation adopts a small business health insurance tax credit to help small
businesses offset the costs of employer-sponsored health insurance for their employees.
This paper offers an overview of the issues and status of small business health insurance in the
United States. Utilizing data from the Medical Expenditure Panel Survey (MEPS), the Current
Population Survey (CPS), the Survey of Income and Program Participation (SIPP), the Kaiser
Family Foundation Annual Survey of Employer Health Benefits, and tax return data from the
Internal Revenue Service, the paper examines trends in access to employer-sponsored health
insurance by small businesses.
This paper also specifically examines the question of whether existing tax incentives at the
Federal and state level provide sufficient inducement to small businesses to adopt health
insurance plans for their employees. Using data from the MEPS that allows a look at
establishment health insurance access rates by firm size on a state-by-state basis, the paper
examines employer tax incentives adopted by Kansas and Montana to examine whether the tax
incentives have had a measurable effect on the rate at which small businesses offer health
insurance to their employees in these states. We found that state tax incentives have generally
not led to measurable increases in the percentage of small businesses offering health insurance to
employees, primarily because the level of the tax incentives provided have been relatively small.
In addition, we examine the small business health insurance tax credit adopted as part of the
Federal health care reform legislation. Based on our research of the firms eligible for this credit
and IRS Statistics of Income (SOI) data, we estimate the number of small businesses that may be
able to benefit from the small business tax credit.
Page |8
II.
HEALTH INSURANCE COVERAGE AND EMPLOYMENTBASED HEALTH INSURANCE IN THE UNITED STATES
A.
Sources of Health Insurance Coverage
Historically, the predominant source of health insurance coverage in the United States has been
employer-provided health insurance. Employers began offering health insurance as an employee
benefit during the 1940’s, when wage controls limited pay and employers sought to compete for
scarce workers. 9 In 1943, the National War Labor Board ruled that employer contributions to
insurance did not count as wages and employers could offer insurance in addition to wages and
salaries. 10 Because of this ruling, employers began offering health insurance to circumvent wage
controls and compete for workers in the labor market, marking the beginning of the trend toward
employment-based health insurance coverage for workers. By negotiating benefits on behalf of
broad groups of workers, unions also contributed to the trend toward employment-based health
insurance.
According to the 2010 Current Population Survey (CPS) March Supplement, 55.8 percent of the
U.S. population (approximately 170 million people) had employment-based health insurance,
30.6 percent (approximately 93 million people) utilized such government health insurance
programs as Medicare, Medicaid, military health care, and SCHIP; 8.9 percent (approximately
27 million people) purchased individual health insurance plans; and 16.7 percent (approximately
51 million people) were uninsured. 11 Graph 1 shows this breakdown of sources of health
insurance. 12
The sources of health insurance coverage vary somewhat from year-to-year. However, 2009
marked the first year since 1987 that the number of people with health insurance declined. The
percent of individuals who were uninsured increased significantly from 2008 to 2009 (15.4
compared to 16.7, respectively). In addition, for those individuals with insurance coverage, the
composition of coverage also changed. 13 For instance, the availability of employment-based
health insurance declined in 2009 (55.8 percent in 2009 compared to 58.5 percent in 2008).
Coverage by a government health insurance plan increased from 29.0 to 30.6 percent from 2008
9
For an excellent overview of the origins of health insurance (and particularly employer-sponsored health
insurance) in the United States, see Blumenthal, David. Employer-Sponsored Health Insurance in the United States
– Origins and Implications. New England Journal of Medicine, 355;1, July 6, 2006. Also see Fronstin, Paul.
Capping the Tax Exclusion for Employment-Based Health Coverage: Implications for Employers and Workers.
Employee Benefits Research Institute Issue Brief No. 325, January 2009.
10
Fronstin, supra.
11
Income, Poverty, and Health Insurance Coverage in the United States: 2009, March 2010 Supplement to the
Current Population Survey, issued September 2010, and Blakeley, Stephen. Employers, Workers, and the Future of
Employment-Based Health Insurance. Employee Benefit Research Institute, Issue Brief No. 339, February 2010.
See Appendix D for an overview of the data sources available relating to health insurance coverage in the United
States.
12
The CPS survey considers a household to have access to health insurance if they have access to such insurance at
any point during the calendar year. Thus, a household could have access to health insurance through more than one
source during any calendar year.
13
Current Population Survey, March 2008 and 2009 Supplements.
Page |9
to 2009. Purchases of individually purchased health insurance remained unchanged at
approximately 8.9 percent. 14
Graph 1 Sources of Health Insurance Coverage
in the United States, 2009
(Percent of Total Population with Coverage)
60
55.8
50
40
30.6
30
20
16.7
8.9
10
0
Employment Based
Government
Uninsured
Individual
Source: 2010 Current Population Survey, March 2010 Supplement
Over time, the cost of health insurance has increased significantly. The growing cost of
providing employer-sponsored health insurance increases total compensation costs for
employers. Since the 1960’s, employment-based health insurance has become a larger and larger
share of total compensation costs. For example, U.S. employers spent $25 billion on health
insurance in 1960 (expressed in 2008 dollars). This figure grew to $545 billion in 2008. 15 Thus,
in constant dollar terms, employer health insurance costs grew twenty-two fold during this
period. Graph 2 displays the averages by decade for the total amount that U.S. employers spent
on health insurance. As shown in Graph 2, the cost of this health insurance coverage increased
significantly with each period.
14
Graph 1 displays the sources of health insurance coverage in the United States for 2009. It is important to note
that some individuals may have coverage from more than one source. For instance, some individuals that receive
their primary health insurance coverage from Medicare may also receive secondary coverage from an employer
plan.
15
Snapshots: Health Care Costs. Wages and Benefits: A Long-Term View. The Kaiser Family Foundation,
November 2009. Accessed at: www.kff.org/insurance/snapshot/chcm012808oth.cfm.
P a g e | 10
Further, employer health insurance costs have become a larger percentage of total compensation
costs. 16 Graph 3 shows health insurance and non-health employee benefits as a percentage of
total compensation since the 1960’s. Health insurance benefits were 1.4 percent of total
compensation during the 1960’s and increased to 6.6 percent in 2008. 17 On the other hand, the
costs for non-health related benefits rose from 7.7 percent in the 1960’s to 13.0 percent in the
1980’s and have declined to 11.8 percent in the 2000’s. 18
Graph 2 Employer Costs for Private Group Health Benefits in the
United States, Average Costs for selected Decades
$600
(Amounts in Billions of 2008 Dollars)
$506
$500
$400
$339
$300
$214
$200
$107
$100
$39
$0
1960's
1970's
1980's
1990's
2000's
Source: Snapshots: Health Care Costs. Wages and Benefits: A Long-Term View. The Kaiser
Family Foundation, November 2009.
16
Total compensation includes workers compensation and unemployment insurance. These mandated benefits play
an important role in the increase in health costs as these costs have increased steadily over time.
17
Id.
18
The decline in the percentage of compensation costs related to non-health benefits corresponds with the rise in the
use of 401(k) plans by employers in lieu of traditional defined benefit pension plans.
P a g e | 11
Graph 3 Average Health and Nonhealth Benefits as a Share of Total
Compensation in the United States,
Selected Time Periods 1960's to 2000's
(Percent of Total Compensation)
14.0
13.0
12.1
12.0
11.8
11.0
Percent
10.0
7.7
8.0
6.6
5.7
6.0
4.5
4.0
2.7
1.4
2.0
-
1960's
1970's
1980's
1990's
Health Benefits
Nonhealth Benefits
Source: Snapshots: Health Care Costs. Wages and Benefits: A Long-Term View.
The Kaiser Family Foundation, November 2009.
2000's
The costs of employment-based health insurance have also increased as a percentage of GDP
during the same periods. While total compensation costs have remained stable over time,
ranging from 56 to 59 percent of GDP, employer health care costs have increased from 0.6
percent of GDP in 1960 to 3.8 percent in 2008. 19
B.
Advantages of Employer-Provided Health Insurance
1. Employer-Provided Health Insurance is a Compensation Cost for Employers
Much has been written about the so-called “favorable tax status” of employer-provided health
insurance and many have opined that this favorable tax status has led to the burgeoning costs of
employment-based health insurance as well as encouraging employers to offer more
comprehensive coverage than they would otherwise provide. On the other hand, a 2008 report
by the Congressional Research Service stated that “the historical argument about the importance
19
Id.
P a g e | 12
of tax regulatory policies [in the increases in employer-sponsored health insurance] may be
overstated.” 20
It is important to understand the differences between the tax benefits to employers and the tax
benefits to employees of employment-based health insurance. Employers are entitled to deduct
the costs of their contributions to employment-based health insurance. However, these costs
represent compensation costs that would otherwise be deductible if, instead of providing health
insurance, the employer paid the same amount directly to employees. 21 Thus, from a Federal tax
perspective, employers are neutral as to the decision to provide cash wages to employees or to
provide employees with an equivalent amount in benefits such as health insurance. 22
Employers compete for workers by offering wage and benefit packages that will attract and
retain employees. Employers offer noncash benefits like health insurance to their employees in
lieu of cash wages because employees value these benefits more than they value cash wages.
This can occur for two primary reasons. First, the amounts that an employer pays for health
insurance coverage on behalf of employees are not currently included in employees’ income for
Federal (and sometimes state) income tax purposes and for employment tax purposes. Thus, a
dollar of health insurance coverage is worth more to an employee than a dollar of wages.
Second, employers purchasing health insurance may be able to negotiate better rates so that the
cost of health insurance coverage for an employee is lower if purchased through an employer
than it would be if the employee purchased the coverage directly.
An important point to consider is that, for employees, there is a direct tradeoff between cash
wages and employer-provided health insurance. When employers pay for health insurance for
their employees, economists generally believe that the employer’s costs for health insurance
translate to lower wages for workers. Thus, employees receive less in current wages because of
the amounts their employers pay for health insurance. 23 Further, if an employee elects to receive
employer-provided health insurance, the employee has lower wages for employment tax
purposes. While this has the effect of reducing the amount of employment taxes the employee
pays, it also may reduce the amount of Social Security benefits to which the employee may be
entitled when he or she retires.
20
Lyke, Bob. CRS Report for Congress. The Tax Exclusion for Employer-Provided Health Insurance: Policy
Issues Regarding the Repeal Debate. Congressional Research Service, November 21, 2008.
21
If an employer provides health insurance instead of cash wages to employees, the value of the health insurance
benefits provided is not subject to employment taxes (e.g., taxes to help fund Social Security and Medicare).
However, as discussed below, economists generally believe that these taxes are ultimately borne by employees,
rather than employers; thus, this difference in treatment between health insurance and cash wages should not affect
the employer’s decision whether to offer health insurance.
22
The value of health insurance provided to employees is excludable from wages for Federal payroll tax purposes;
thus, employers are not required to pay the 6.2 percent of payroll employer share of OASDI taxes on the value of
employer-provided health insurance. However, economists generally believe that employees bear the burden of
payroll taxes through reduced cash compensation; thus, this tax benefit at least theoretically accrues to employees
rather than employers. The only exception to this rule would be employees subject to the Federal minimum wage,
as their cash compensation cannot be reduced below the Federal minimum.
23
Blumberg, Linda J. Who Pays for Employer Sponsored Health Insurance? Evidence and Policy Implications.
Health Affairs, Vol. 18, No. 6, November/December 1999.
P a g e | 13
The costs of health insurance for an employer include the direct costs of the insurance coverage
itself as well as the indirect costs of offering this benefit in lieu of current wages. For example,
an employer has administrative costs related to processing employee elections with respect to
health insurance coverage as well as the costs of researching and securing a health insurance
provider (or providers).
2. Tax Advantages Create Incentives for Employees to Prefer Employer-Provided
Health Insurance
Employees, on the other hand, do have specific tax advantages that lead them to prefer to receive
health insurance (and other tax-favored benefits, such as retirement savings) to cash
compensation. From an employee’s perspective, there are Federal tax advantages and
sometimes, state tax advantages to employer-provided health insurance.
Federal tax advantages
From a Federal tax perspective, several tax benefits accrue from employer-provided health
insurance. First, the value of the employer’s contribution to health insurance is excludable from
the employee’s income for income tax and employment tax purposes. 24 The value of any
benefits the employee receives under the health insurance policy also is excluded from income.
In addition, in some cases, the employee’s share of the costs of health insurance coverage may be
excluded from income. For example, employers can set up plans (cafeteria plans, flexible
spending arrangements, and Health Savings Accounts (HSAs)) that allow employees to pay for
out-of-pocket medical expenses on a pre-tax basis. Overall, the Federal tax system provides
strong incentives for employees to prefer to receive health insurance through an employer.
Because the Federal income tax is a progressive tax system in which the tax rates increase as
total income increases, the greater an employee’s income, the greater the value an employee
receives for the exclusion from income for employer-provided health insurance. Thus, an
employee in a 15 percent Federal income tax bracket receives a smaller dollar benefit from the
exclusion for employer-provided health insurance than an employee in the 25 percent Federal
income tax bracket.
Federal employment taxes for social security and disability income (OASDI) and for hospital
insurance under Medicare (HI) apply at a rate of 15.3 percent of compensation. OASDI taxes
apply at a rate of 12.4 percent up to the taxable wage base ($106,800 for 2010); the employee
and employer each pay half of these taxes. The HI tax rate is 2.9 percent of all compensation,
which the employee and the employer also split equally. Thus, in the case of Federal
employment taxes, the value of the exclusion for employer-provided health insurance is equal to
15.3 percent of compensation up to the taxable wage base and then 2.9 percent of compensation
24
It should be noted that there are other types of employer-provided benefits, such as retirement savings, transit
benefits, etc., that provide a similar Federal tax advantage for employees. Thus, there is an interaction between
demand for health insurance, demand for cash wages, and demand for other types of benefits. However, for
simplicity, the analysis ignores the demand for other types of benefits.
P a g e | 14
thereafter. Economists generally believe that employees ultimately bear the burden of the
employer’s share of Federal employment taxes. 25 Thus, the employees theoretically accrue the
advantage of the exclusion for the employer share of employment taxes.
Table 2 shows examples of the value of the Federal tax benefits for three sets of employees. The
examples show the effects on a single individual of receiving $5,000 of health insurance from an
employer and the alternative effect if the individual receives an additional $5,000 in cash
compensation.
Table 2 – Examples of the Value of Federal Tax Benefits to Employees
for Employer-Provided Health Insurance
(2009 Federal Tax Rates)
Employee A
Employee B
Employee C
$25,000
compensation
$20,000
compensation;
$50,000
compensation;
$45,000
compensation;
$100,000
compensation;
$95,000
compensation;
no employerprovided
health
insurance
$5,000 of
employerprovided
health
insurance
no employerprovided
health
insurance
$5,000 of
employerprovided
health
insurance
no employerprovided
health
insurance
$5,000 of
employerprovided
health
insurance
1. Taxable income, all
$15,650
$10,650
$40,650
$35,650
$90,650
$85,650
from compensation with
employer
2. Total Federal income
$1,934
$1,184
$6,356
$5,106
$19,109
$17 ,709
taxes
3. Total Federal
$3,825
$3,060
$7,650
$6,885
$15,300
$14,535
OASDHI taxes (15.3%
of cash compensation)
4. Value of Federal
$0
$750
$0
$1,250
$0
$1,400
income tax exclusion
(difference between
income tax with all cash
compensation and
income tax with $5,000
of health insurance)
5. Value of Federal
$0
$765
$0
$765
$0
$765
employment tax
exclusion (15.3% of
excluded compensation)
6. Total Federal tax
$0
$1,515
$0
$2,015
$0
$2,165
savings from employerprovided health
insurance (sum of 4. and
5.)
Source: Authors’ calculations using 2009 Federal tax rate schedules. In order to isolate the effect of the exclusion for employerprovided health insurance, this example assumes a single individual claiming one personal exemption, the standard deduction, and no
other income, exclusions, deductions, or credits. In addition, the example ignores the possible effects of the individual medical expense
deduction.
25
However, in the case of low-wage workers who are subject to the minimum wage, the employee cannot directly
bear the burden of these taxes through reduced wages.
P a g e | 15
For Employee A, the $5,000 worth of health insurance has a net cost, after Federal tax savings,
of $3,485 ($5,000 minus $1,515 of savings); this represents a net cost of 70 percent of the pre-tax
cost. For Employee B, the net cost of $5,000 worth of employer-provided health insurance is
$2,985 ($5,000 minus $2,015); this represents 60 percent of the pre-tax cost. For Employee C,
the net cost is $2,835 ($5,000 minus $2,165); this represents 57 percent of the pre-tax cost. As
employee income rises, the net cost of $5,000 declines. Thus, the examples show that the value
of the income tax exclusion increases as an employee’s marginal income tax rate increases,
making it more valuable to employees in higher income tax brackets. Further, the value of the
employment tax exclusion is equivalent in all of these examples because none of the employees
earn more than the social security taxable wage base (which was $106,800 for 2009). As
employees’ compensation exceeds the taxable wage base, the value of the employment tax
exclusion declines.
State tax advantages
In addition to the Federal tax advantages, there may also be tax advantages accruing to
employees at the state level from the receipt of health insurance through an employer. In states
with income tax systems, the Federal exclusion generally applies for state income tax purposes
so that the amounts excluded from income for Federal income tax purposes also receive the state
income tax exclusion. The value of the exclusion will depend upon the tax rate structure in
effect in the state. In those states without an income tax, the exclusion from income is irrelevant.
3.
Nontax Advantages Create Additional Incentives
In addition to the tax advantages that accrue to employees who receive health insurance through
an employer, powerful nontax advantages can drive demand for employer-sponsored health
insurance. These nontax benefits accrue to both employers and employees.
Healthy employees
For employers, a healthy workforce can reduce workdays lost to sickness. There is a general
belief that people who have health insurance tend to be healthier than those people who do not
have health insurance. However, there is a “chicken and egg” problem with this analysis
because individuals who have health insurance tend to have a more stable relationship with the
workforce, have higher income, and have more education than those without health insurance. 26
All of these factors could contribute separately to the overall better health of those individuals
with health insurance.
Group rates/negotiating power
Employers have more bargaining power than individuals have and can negotiate better rates for
health insurance than individual employees could negotiate on their own. Particularly with
26
A new study in the State of Oregon will actually test the healthiness of individuals with and without health
insurance. Results of this study are expected beginning in 2011. For information on this landmark study of people’s
health and access to care, see www.oregonhealthstudy.org.
P a g e | 16
respect to large employers, the economies of scale afforded by group health insurance offer
significant savings in the cost of health insurance relative to purchases in the individual market.
Thus, the operation of the marketplace for group health insurance provides a powerful incentive
to prefer health insurance through an employer.
This may not be intuitively obvious since many surveys show health insurance premiums in the
nongroup market are similar to (or even lower than) those in the employer group health market.
However, statistics that look only at premiums fail to account for differences in the type of health
insurance coverage provided. In addition, people who are purchasing health insurance in the
nongroup market are, on average, healthier than people who have employer-sponsored health
insurance. 27 Despite the difference in the demographics of the nongroup group market compared
the employer-sponsored health insurance market, individuals purchasing nongroup health
insurance pay a higher proportion (52 percent) of their health expenditures out of pocket
compared to those with employer-sponsored health insurance (30 percent out of pocket),
suggesting that nongroup health insurance provides less coverage than employer-sponsored
health insurance. 28
Cost sharing
If employers pay part of the cost of their employees’ health insurance coverage, employees may
perceive that they are receiving more in compensation than their cash wages. Although
economists believe that employees ultimately bear the full burden of these costs that are “shared”
by an employer, employee perception may not conform to this theory.
Risk pool advantages
A fundamental theory of insurance is the spreading of risks across a group. Risk pooling works
because, when a large number of people are included in the pool covering the costs of their
health care, the larger the group, the more stable the average costs become. This is because the
high costs of any one individual have a smaller effect on the average as the group gets bigger.
Employment-based health insurance can be advantageous because of risk pooling. For large
employers, the size of their group receiving health insurance coverage is large enough for the
benefits of risk pooling to occur.
27
Comparison of Expenditures in Nongroup and Employer-Sponsored Insurance: 2004-2007, Kaiser Family
Foundation, March 2010. Accessed at www.kff.org/insurance/snapshot/chcm111006oth.cfm.
28
Id.
P a g e | 17
III.
HEALTH INSURANCE IN THE
SMALL BUSINESS MARKET
A.
Access to Health Insurance Coverage in the Small
Business Sector
1.
Small Business Health Insurance Access Rate by Employer Size
As noted above, approximately 60 percent of workers in U.S. establishments receive health
insurance through an employer. In 2009, 55 percent of private sector establishments offered
health insurance to their employees. 29 However, the percentage of private-sector establishments
offering health insurance to their employees is directly correlated to firm size; as the size of the
firm grows, so does the percentage of firms offering health insurance to employees. Table 3
shows the percentage of firms offering health insurance by firm size for 2009 and by other firm
characteristics.
Table 3 – Percentage of Private Sector Establishments Offering
Health Insurance to Employees, 2009, by firm size and other selected characteristics
Firm Size, by
Total
>50% Low Wage <50% Low Wage Incorporated Unincorporated
employment
Employees*
Employees
(for profit)
(for profit)
All Firms
55.0
41.0
62.2
59.6
37.9
Fewer than 10
33.6
17.9
41.7
36.3
25.5
10-24
62.5
32.8
76.4
65.1
49.5
25-99
81.6
59.5
91.4
81.8
72.8
100-999
94.3
88.7
97.1
93.4
92.5
1000 or more
99.2
98.5
99.7
99.3
99.0
Source: Agency for Healthcare Research and Quality, Center for Financing, Access and Cost Trends, 2009 Medical
Expenditure Panel Survey – Insurance Component (MEPS-IC), Table I.A.2. The MEPS-IC data are collected at the
establishment level. However, for purposes of identifying the appropriate size classification for establishments, firm
level data are used.
* Low Wage Employees are defined as employees earning at or below the 25th percentile for all hourly wages in the
United States. For 2009, a Low Wage Employee is one who earns no more than $11.00 per hour.
As Table 3 shows, small firms and firms with predominantly low-wage workers are significantly
less likely to offer health insurance to employees. While 99.2 percent of establishments for firms
with 1,000 or more employees offered health insurance to their employees in 2009, the
establishment access rate was only 33.6 percent for firms with fewer than 10 employees.
29
Agency for Healthcare Research and Quality, Center for Financing, Access and Cost Trends, 2009 Medical
Expenditure Panel Survey – Insurance Component. In contrast to the data in part A, above, the MEPS data
examines health insurance access by private sector establishment, rather than by total private sector workers. An
establishment is a particular workplace or physical business location where the business performs services or
industrial operations. However, for purposes of classifying establishments by size, firm level data are used. Thus, if
a business has more than one establishment, the number of employees in all establishments are aggregated to
determine the size of the firm. In the case of many small businesses, the firm and the establishment will be the
same. But some employers may have many small establishments that aggregate into a single large firm. Thus,
using the firm level data for size classification purposes provides a better measure of the size of the employer. See
Appendix D for a discussion of the various data sources relating to health insurance access and coverage.
P a g e | 18
Unincorporated firms, many of which are likely to be doing business as sole proprietorships, are
less likely to be offering health insurance than firms of the same size category that are
incorporated. 30 The likelihood of offering health insurance to employees also varies across
industries, as shown in Table 4, below.
Table 4 – Percentage of Private Sector Establishments Offering
Health Insurance to Employees, 2009
by firm size and industry group
Industry Group
All Firms
Less than 10
Employees
10-24
Employees
25-99
Employees
100-999
Employees
1,000 or
More
Employees
100.0
Agriculture, fishing,
26.4
20.6
39.1
83.1
68.2
forestry
Mining and
67.7
43.0
79.2
90.4
97.9
99.8
manufacturing
Construction
42.3
31.1
73.5
87.8
87,8
100.0
Utilities and
57.1
26.7
67.8
84.5
94.2
99.3
transportation
Wholesale trade
66.6
44.9
81.8
90.2
98.5
99.0
Financial services
67.8
39.0
75.7
90.0
97.4
98.5
and real estate
Retail trade
59.1
25.5
60.4
84.7
93.0
99.6
Professional services
58.8
40.7
72.3
88.1
97.8
99.4
Other services
45.4
28.1
43.4
65.2
86.1
99.4
Source: Agency for Healthcare Research and Quality, Center for Financial, Access and Cost Trends, 2009 Medical
Expenditure Panel Survey – Insurance Component, Table I.A.2.
Table 4 shows that the agriculture, fishing, and forestry industry (26.4 percent), construction
(42.3 percent), other services (45.4 percent), and utilities and transportation (57.1 percent) have
lower access rates for health insurance than other industries, which range from an access rate of
59.1 percent (retail trade) to 67.8 percent (financial services and real estate). Even by industry,
however, the establishment access rate is considerably lower for the smallest firms than for the
largest firms.
30
See the discussion below concerning the self-employed health insurance deduction, which is relevant for the
owners of unincorporated businesses.
P a g e | 19
Graph 4 Percent of Private-Sector U.S. Establishments that Offer Health
Insurance, Firm Size by Employment, 2009
99.2
100
93.5
96.8
90
81.6
80
70
62.5
Percent
60
50
40
33.6
30
20
10
0
Less than 10
10 to 24
25 to 99
100 to 499
500 to 999
1000 or more
Source: DHHS, MEPS, Table II A2, 2009 and author's calculations.
Graph 4 displays the percent of private sector establishments that offer health insurance to their
employees. The largest firms, those with 500 or more employees have offer rates approaching
100 percent. The smallest firms, on the other hand, have an offer rate of 33.6 percent. Graph 4
shows that the likelihood of an employer offering health insurance increases steadily with firm
size.
2.
Take-Up Rates
Workplace Coverage – How many individuals actually have employer provided health insurance
coverage depends upon both the offer rate and the take-up rate. Offer rates indicate whether or
not an employee has access to health insurance in the workplace. However, access tells only part
of the story. Assuming an employee has access to health insurance coverage at work, the
decision to accept the employer-provided health insurance (take-up rate) affects the numbers of
workers covered by the plan. The participation rate is the product of the offer and take-up rates.
The Bureau of Labor Statistics (BLS) provides estimates of access (offer rates) and take-up rates
of employer-sponsored health insurance by establishment size. 31 Table 5 displays the BLS
31
Data available from the Bureau of Labor Statistics, National Compensation Survey (NCS) does not offer detailed
breakout of establishments with fewer than 50 employees. In addition, the NCS data does not offer a detailed size
P a g e | 20
access and take-up rates from the March 2010 National Compensation Survey (NCS). Take-up
rates tend to show less variation by establishment size. Approximately 70-80 percent of
employees who are offered health insurance through an employer take up or accept the
insurance.
Table 5 shows that participation rates, which equal access rates multiplied by take-up rates,
correlate positively with firm size. Thus, while 70 to 72 percent of small business employees
take advantage of employer-sponsored health insurance that is offered, the rate of establishment
offering means that participation rates are significantly lower for these employees. For the
smallest establishments (those with less than 50 employees), only 39 percent of employees
participate in employer-sponsored health insurance.
Table 5 – Access, Take-Up , and Participation Rates,
by Establishment Size
(Percent)
Establishment Size, by
Access
Take-up
Participation
Employment
1 to 49
50 to 99
100 to 499
500 or more
Total All Firms
55
70
82
88
71
70
72
72
78
73
39
50
59
68
51
Source: BLS, National Compensation Survey, Employee Benefits in the United States, March 2010.
A recent study by the Employee Benefits Research Institute (EBRI) indicates that participation
rates have remained stable since the late 1980s. 32 EBRI reports that in most cases, employees
who decline workplace health insurance coverage are more likely to have coverage from another
employer or from a spouse. Further, EBRI estimated that less than 4 percent of workers eligible
for workplace health insurance coverage remained uninsured between 1995 and 2005. 33
Self-Employed Coverage – Many small businesses are organized as sole proprietorships,
partnerships, and S corporations. For Federal income tax purposes, these types of businesses are
not subject to the corporate income tax. Instead, the owners of the businesses are subject to tax
on business income on their individual income tax returns. This distinction has important
implications for the treatment of health insurance. The owner of a corporation who works for the
corporation is treated as an employee, i.e., a wage and salary worker, for Federal tax purposes.
Thus, the cost of health insurance for the owner of a corporation is deductible for income and
employment tax purposes. However, the owner of a sole proprietorship, partnership, or S
breakout of employer classes with 500 or more employees. It should be noted that business size is categorized based
on the establishment for NCS survey data, whereas business size is categorized based on the firm size for the MEPSIC survey data.
32
Fronstin, Paul, “Employment-Based Health Benefits: Access and Coverage, 1988-2005, Employee benefits
Research Institute, Issue Brief No. 303, March 2007.
33
Ibid.
P a g e | 21
corporation generally is not treated as an employee, but is treated as a self-employed individual.
The deduction for employer contributions to a health plan does not apply to these self-employed
individuals. Instead, they are entitled to claim the self-employed health insurance deduction.
The self-employed health insurance deduction is only allowed for income tax purposes; it is not
allowed for employment tax purposes. 34
Many small businesses in the United States do not have any employees other than the business
owner. In 2008, there were 21.4 million small businesses without employees in the United
States. 35 Unless they have health insurance coverage available through other employment or
through a spouse’s employment, these self-employed individuals must obtain their health
insurance coverage in the privately purchased individual insurance market.
Graph 5 displays the use of the self-employed health insurance deduction for 1998 and 2008,
showing that the use of the deduction correlates positively with income. Overall in 2008, only
17 percent of returns reporting no self-employment income also reported the deduction for selfemployed health insurance.
Closer inspection indicates that over the 1998 to 2008 period, the percent of returns with selfemployed income that reported the deduction for self-employed health insurance declined for all
but two income classes (Graph 5). Returns with adjusted gross incomes of $500,000 or more
(less than one-tenth of one percent of all returns reporting self-employed business income) as
well as those returns with no net income (3 percent of all returns reporting self-employed
business income) reported an increase in the deduction for self-employed health insurance
coverage. 36
34
Section 162(l) of the Internal Revenue Code of 1986.
The Census Bureau publishes this data using administrative records from the Internal Revenue Service. Most of
the nonemployee firms are sole proprietorships, but there are also some partnerships and corporations that report no
employees included in this number. In order to identify legitimate operating businesses, the BLS only includes
businesses than have at least $1,000 of annual receipts.
36
When a taxpayer reports a net loss, the SOI tables classify them as having no net income. To the casual observer,
this might suggest a low-income person. In fact, it typically reflects an otherwise high-income taxpayer that
experiences unusual losses.
35
P a g e | 22
Graph 5 Percent of Returns with Self-Employment Income Claiming the
Self-Employed Health Insurance Deduction
Tax Years 1998 and 2008, Distributed by AGI
90
80
81
84
(Percent of Returns Reporting Self-Employed
Health Insurance Deduction)
Percent of Returns
70
60
53
50
46
40
32
30
17
20
12
10
16
9 8
21
20
16
18
15
16
19
23
21
17
16
9
No
Under
adjusted $10,000
gross
income
$10,000
under
$20,000
$20,000
under
$30,000
$30,000
under
$40,000
$40,000
under
$50,000
1998
$50,000 $75,000 $100,000 $200,000
under
under
under
under $500,000
$75,000 $100,000 $200,000 $500,000 or more
2008
Source: Internal Revenue Service, Statistics of Income, Individual Income Tax Return Data,
Tax Years 1998 and 2008
3.
Cost and Quality of Health Insurance
The data show that at least 70 percent of individuals who have access to health insurance through
an employer-sponsored health plan participate in such insurance, irrespective of firm size.
However, the type of health insurance coverage to which employees have access can also vary
by firm size. While the idea of the quality of health insurance coverage can be subjective and,
therefore, difficult to quantify, there is some evidence that the health insurance offered to
employees of small firms differs from the health insurance offered to employees of large firms.
A 2003 Small Business Administration study used the actuarial value of a health plan as a
measure of the plan’s generosity; the actuarial value measures how much of the health
expenditures of a standard employed population are paid by the health plan. 37 This study found
that the actuarial value of a health insurance plan for firms with fewer than 10 employees
average 78 percent of expected costs, while the actuarial value of health insurance plans for firms
with 1,000 or more employees was 83 percent of expected costs.
In general, employer-sponsored health insurance premiums are higher for employees of small
firms than for employees of large firms. Graph 6 shows the average total single premium per
37
Chu, Rose C. and Trapnell, Gordon R. Study of the Administrative Costs and Actuarial Values of Small Health
Plans. U.S. Small Business Administration, Office of Advocacy, January 2003.
P a g e | 23
enrolled employee by firm size for 2009. While the average premium across all firms is $4,669,
the average for firms with fewer than 10 employees is $4,982 and the average for firms with
1,000 or more employees is $4,673. Interestingly, the average single premiums for firms with 10
to 24 employees and for firms with 25 to 99 employees are lower than the average for firms with
1,000 or more employees, but this may reflect differences in other plan characteristics, such as
deductibles and copayments. Graph 7 provides the average total family premium by firm size for
2009.
Graph 6 Average Single Premium of Private Sector Employees
Enrolled in an Employer-Sponsored Health Insurance Plan,
by firm size, 2009
5,100
$4,982
5,000
4,900
4,800
$4,702
4,700
$4,673
$4,669
$4,573
4,600
$4,521
4,500
4,400
4,300
4,200
Fewer than 10 10-24 employees
employees
25 to 99
employees
100 to 999
employees
1,000 or more National average
employees
Source: Insurance Component of the Medical Expenditure Panel Survey, 2009.
P a g e | 24
Graph 7 Average Family Premium of Private Sector Employees
Enrolled in an Employer-Sponsored Health Insurance Plan,
by firm size, 2009
13,500
$13,325
$13,081
$13,027
13,000
12,500
$12,330
$12,040
12,000
$11,900
11,500
11,000
Fewer than 10 10-24 employees
employees
25 to 99
employees
100 to 999
employees
1,000 or more National average
employees
Source: Insurance Component of the Medical Expenditure Panel Survey, 2009.
The 2009 MEPS data also show that the average annual deductible paid for health insurance
coverage by employees varies significantly by firm size. 38 Graph 8 shows the average single
deductible by firm size and Graph 9 shows the average family deductible by firm size. Graph 8
shows that, in 2009, the average single deductible for private sector employees with employersponsored health insurance coverage was $917. However, for employees of firms with fewer
than 10 employees, the average single deductible was $1,266 and, for employees of firms with
1,000 or more employees, the average single deductible was $678. Graph 9 shows a similar
pattern for family coverage, with an average family deductible of $1,761 across all firms, but an
average family deductible of $2,832 for employees of firms with fewer than 10 employees and
an average family deductible of $1,477 for employees of firms with 1,000 or more employees.
38
Sommers, John P. and Crimmel, Beth Levin. Co-Pays, Deductibles, and Coinsurance Percentages for EmployerSponsored Health Insurance in the Private Sector, by Firm Size Classification, 2006. U.S. Department of Health
and Human Services, Agency for Healthcare Research and Quality, Statistical Brief #209, July 2008.
P a g e | 25
Graph 8 Average Single Deductible of Private Sector Employees
Enrolled in an Employer-Sponsored Health Insurance Plan,
by firm size, 2009
1,400
$1,266
$1,300
$1,264
1,200
$1,029
$917
1,000
800
$678
600
400
200
0
Fewer than 10 10-24 employees
employees
25 to 99
employees
100 to 999
employees
1,000 or more National average
employees
Source: Insurance Component of the Medical Expenditure Panel Survey, 2009.
Graph 9 Average Family Deductible of Private Sector Employees
Enrolled in an Employer-Sponsored Health Insurance Plan,
by firm size, 2009
$2,832
3,000
$2,567
2,500
$2,462
$1,828
2,000
$1,761
$1,477
1,500
1,000
500
0
Fewer than 10 10-24 employees
employees
25 to 99
employees
100 to 999
employees
1,000 or more National average
employees
Source: Insurance Component of the Medical Expenditure Panel Survey, 2009.
The MEPS data also show that the percentage of employees making a copayment for a doctor’s
office visit and the average amount of the copayment varies by firm size. In 2009, for firms with
P a g e | 26
fewer than 10 employees, 72.5 percent of employees with health insurance were required to
make a copayment for a doctor’s office visit and the average copayment was $24.16. 39 For firms
with 1,000 or more employees, 69.9 percent of employees were required to make a copayment
for a doctor’s office visit and the average copayment was $20.53 dollars. The average
coinsurance for a doctor’s office visit also varied by firm size, with an average coinsurance
percentage of 20.6 percent for firms with fewer than 10 employees and an average coinsurance
percentage of 18.1 percent for firms with 1,000 or more employees.
B.
Barriers to Offering Health Insurance in Small Businesses
A 2009 report examined some of the barriers to offering health insurance that small employers
face. 40 Among the barriers, the report identified four factors (1) low-wage workers, (2) rating
and risk practices, (3) higher costs, and (4) uncertainty of future costs—as the problems small
employers face. These barriers pose significant obstacles to small employers that would like to
offer health insurance to their workers.
These barriers can influence the responsiveness of small employers to premium subsidies offered
to encourage small businesses to offer health insurance to employees.
1.
Small Business Employees are Lower Paid Than Employees of Larger
Businesses
According to the National Compensation Survey (NCS), employees of small businesses earn less
in benefits and in cash wages compared to employees of large businesses. 41 In general,
employees who have lower wages are less likely to have health insurance through their
employers. The lower paid an employee, the more likely that the employee will value cash
wages over a benefit such as health insurance. In addition, some of these lower paid workers
may be eligible for Medicaid or Medicare coverage, which would reduce their demand for
employer-sponsored health insurance.
However, as discussed earlier, employee take-up rates tend to be reasonably uniform across firm
size, suggesting that employees do generally value employer health insurance coverage.
For March 2010, private sector workers earned, on average, $27.73 per hour (or approximately
$58,000 annually) including cash wages and benefits. 42 Cash wages account for approximately
70 percent of these compensation costs. 43 Table 6 shows the breakdown of average
compensation costs by size of employer. The table shows a clear positive correlation between
the employment size of a firm and the compensation paid to employees of the firm.
39
Insurance Component of the Medical Expenditure Panel, 2009.
Blumberg, Linda J. and Stacey McMorrow. What Would Health Care Reform Mean for Small Employers and
Their Workers? Timely Analysis of Immediate Health Policy Issues, Robert Wood Johnson Foundation and the
Urban Institute, December 2009.
41
Employers Costs for Employee Compensation – March 2010. Bureau of Labor Statistics, U.S. Department of
Labor, USDL-10-0774, June 9, 2010.
42
Id.
43
Id.
40
P a g e | 27
Table 6 – Private Sector Employer Compensation Costs in the
United States, by Establishment Size, March 2010
(Average Hourly Wages)
Establishment
Size, by
employment
1-49
50-99
100-499
500 or more
All firms
Total
Compensation
Wages and
Salaries
Percent of
Total
Compensation
Health
Insurance
Percent of
Total
Compensation
$22.10
$25.10
$28.56
$39.78
$27.73
$16.41
$18.05
$19.99
$26.45
$19.58
74
72
70
66
71
$1.34
$1.82
$2.36
$3.38
$2.08
6
7
8
8
8
Source: BLS, National Compensation Survey, March 2010
The lower compensation cost for health insurance for small firms relative to larger firms reflects
the fact that small firms are less likely to offer health insurance as a benefit to employees.
Graph 10 displays the average hourly wages of private sector workers. 44 Employees in the
smallest firms (1 to 49 workers) earn 66 cents to the dollar compared to the earnings of workers
in the largest firms (500 or more workers).
Lower wage employees of small business tend to value wages over benefits. Lower income
workers tend to be liquidity constrained in their household budgets, struggling to cover the
household obligations. Faced with reducing their take-home paycheck by to obtain health
insurance coverage, many low-income workers would prefer wages to benefits. 45
44
Graph 6 displays the mean hourly earnings excluding benefits. Data displayed in Table 5 provide comparable
statistics for total compensation, which includes benefits.
45
A low-income employee’s preference for health insurance coverage will also be affected by a number of other
factors, such as family status and whether the employee has a spouse has access to health insurance through his or
her employer.
P a g e | 28
$30.00
Graph 10 Mean Hourly Earnings of Workers in Private Industry
$26.51
Establishments, by employment size of establishment
$25.00
$20.61
$19.18
$20.00
$17.57
$15.00
$10.00
$5.00
$0.00
1- 49 workers
50-99 workers
100-499 workers
500 or more workers
Source: Bureau of Labor Statistics, Occupational Earnings Tables: United States, December 2008 to
January 2010.
In addition to the fact that employees of small businesses earn less, on average, than employees
of large firms, the demographics of small business employees may make them less likely to
value health insurance benefits over cash wages. A 2000 paper examining the demographics of
small business employees found that small firms employ more workers under age 25 and more
workers age 65 or older compared to large firms. 46 Those workers age 65 or older have health
insurance coverage through Medicare, making this workplace benefit less important to them.
In addition, small firms have higher percentages of employees who had less than a high school
diploma and employees whose highest degree was a high school diploma. Small firms employ
more people who are receiving financial assistance (excluding loans) from friends or relatives
and more people who receive public assistance from the government.
Each of these demographic characteristics (younger and older workers, less educated workers,
lower-income workers ) identify classes of employees who may place less value on employerprovided health insurance than other employees. 47 As a result, employees of small businesses
may generally place less value on health insurance as a benefit.
46
Headd, Brian. The Characteristics of Small-Business Employees. Monthly Labor Review, April 2000.
A 2006 study by Hirth, et al. explored the issue of whether employees sort themselves into firms with or without
health insurance based upon their preferences for cash wages or health insurance coverage. This study noted that
47
P a g e | 29
A 2010 Urban Institute study found that there are racial and ethnic differences in health
insurance coverage rates explained partially by employment patterns. 48 In particular, the study
found that Latino parents were more likely to have a small-firm employer or to be a contingent
worker or an employee in alternative work arrangements. As a result, this study found that for
Hispanic workers, this contributed to a significantly lower rate of employer-sponsored health
insurance coverage (32.5 percent) relative to all groups (57.1 percent). 49
2.
Risk Group Too Small/Potential for Adverse Risk Selection
Historically, small business employers have had more difficulty finding affordable health
insurance because they are unable to utilize the economies of scale that a large employer can
utilize to spread risks across its workforce. A small employer’s risk group is too small and the
health costs of any single employee can drive up the group’s average costs significantly enough
to make future costs unaffordable. Sometimes, small employers can find trade association or
other groups to join to enable the employer to take advantage of a large group insurance rate, but
the employer must take the time to research the available groups.
Some states have changed their laws to encourage the pooling of small businesses for health
insurance purposes to provide cross-subsidies among small employers, thereby reducing the
problem of a single high-cost worker driving up an employer’s costs substantially. At the
national level, the health insurance exchanges for small businesses enacted as part of health care
reform were designed to address this problem.
A related problem is the potential for adverse risk selection. Because the costs of health
insurance can be quite high for a small group, only those employees who anticipate high health
insurance expenses will join the group and healthy employees will opt not to purchase health
insurance or to purchase such insurance separately. A recent analysis of potential problems with
the health exchanges enacted as part of health care reform provides an example of adverse
selection. 50 The analysis discusses a small-business pool called PacAdvantage, which operated
in California from 1993 to 2006, which at one point had 150,000 enrollees. However, the pool
ultimately ceased operations because it attracted enrollees with high medical costs; as sicker
individuals enrolled in the pool, premiums went up, and healthier individuals left the pool for
sources of less expensive insurance.
workers in firms that do not offer health insurance coverage are more likely to have characteristics associated with
low demand for health insurance, which the authors identified as young, male, and having other sources of income.
In addition, the research noted that nearly half of small employers cited a lack of demand for health insurance on the
part of their employees as a reason for not offering the coverage. The study concluded that at least some workers
sort themselves into firms that meet their preferences for cash wages versus health insurance, but found overall that
one out of six uninsured workers in the United States were “involuntarily” uninsured because they worked for firms
that did not offer health insurance. Hirth, Richard A., Baughman, Reagan, Chernew, Michael, and Shelton, Emily.
Worker Preferences, Sorting and Aggregate Patterns of Health Insurance Coverage. February 9, 2006.
48
Clemans-Cope, Lisa, Kenney, Genevieve, and Lucas, Aaron. Health Insurance in Nonstandard Jobs and Small
Firms: Differences for Parents by Race and Ethnicity. The Urban Institute, Brief 12, April 2010.
49
Id.
50
Lueck, Sarah. States Should Structure Insurance Exchanges to Minimize Adverse Selection. Center on Budget
and Policy Priorities, August 17, 2010. Accessed at http://www.cbpp.org/files/8-17-10health.pdf.
P a g e | 30
3.
Higher Administrative Costs
Small employers often do not offer health insurance to their employees because of the high
administrative and overhead costs of providing such coverage. In a large employer, these costs
are averaged over a much larger workforce and the per employee cost of offering health
insurance is relatively low. However, the administrative costs are not proportionately smaller for
small businesses; as a result, small employers must average high administrative costs over a
much smaller pool of employees. In addition, because job turnover tends to be higher among
small employers, the ongoing administrative costs of health insurance plan elections and
enrollment can be disproportionately higher than for a large employer with a more stable
workforce.
The 2003 Small Business Administration study cited previously also examined the effect of
administrative costs on the health insurance premium costs of small firms. 51 The study found
that administrative expenses for insurers of small firm health insurance plans make up 25 to 27
percent of premiums and 33 to 37 percent of claims, compared to 5 to 11 percent for large
companies with self-insured health plans.
4.
Unpredictable Costs
For a small business, health insurance coverage represents a cost that is more volatile and more
difficult to control than other compensation costs. 52 As a percentage of total costs, this
unpredictability often presents unacceptable risks to a small business compared to a larger
business. Once a business offers compensation in the form of health benefits, the business will
tend to attract employees who value the benefit. Thus, it can become more difficult for the
employer to discontinue the benefit.
C.
Effects of the Recession on the Availability of EmployerProvided Health Insurance
Employers provide employer-sponsored health insurance to their employees as part of an overall
compensation package. As noted above, economists believe that the cost of health insurance
coverage provided by an employer is ultimately borne by the worker in the form of foregone
wages. Further, over the long term, market forces will drive the amount that employers are
willing to pay for wages and benefits. Thus, when the economy is expanding and business
profits increase, employers are able to pay more to their employees in the form of wages and
benefits. Conversely, during a recession when the economy is contracting, the amount that
employers have available for wages and benefits will also contract. This contraction will result
in reductions in (1) the size of the workforce, (2) wages paid, and (3) benefits, such as health
insurance, provided to employees.
Because the provision of health insurance coverage occurs predominantly through the workforce,
there is a high correlation between the lack of health insurance and the unemployment rate. A
51
Chu and Trapnell, supra.
Feder, Lester and Whelan, Ellen-Marie. Small Businesses, Large Problems. Health Care Costs Hit Small
Employers. Center for American Progress, October 30, 2008. Accessed at
http://www.americanprogress.org/issues/2008/10/small_business_brief.html.
52
P a g e | 31
2009 Kaiser Family Foundation analysis examines the effect of increasing unemployment on the
number of individuals without health insurance. 53 In this analysis, Holahan and Garrett
estimated that a one percentage point increase in unemployment would increase Medicaid
enrollment by 1.0 million individuals and would increase the number of uninsured individuals by
1.1 million. Thus, in January 2009, the authors estimated that, if the unemployment rate reached
10 percent, individuals with employer-sponsored health insurance would decrease by 13.2
million, the number of individuals with Medicaid and SCHIP coverage would increase by 5.4
million, and the number of uninsured would increase by 5.8 million. 54
Thus, one empirical question is the extent to which the recession that began in December of 2007
has affected employer-provided health insurance access and coverage. Reductions in access to
employer-provided health insurance can occur (1) as employees lose their jobs and (2) as
employers eliminate or alter these benefits to reduce costs. Employers could drop their
employer-sponsored health insurance, increase copayments and deductibles, or alter the
eligibility requirements for the health insurance.
A May 2010 Employee Benefits Research Institute (EBRI) issue brief explored changes in
employment-based health insurance coverage during the most recent recession using data from
the 2004 and 2008 panels of the Survey of Income and Program Participation (SIPP). 55 The
EBRI issue brief found that, between December 2007 and May 2008, the percentage of workers
with employment-based health coverage in their own name fell from 60.4 percent to 56.8 percent
and declined further to 55.9 percent by July 2009. 56 This is consistent with the recently released
Census Bureau CPS data that indicates the percent of private sector employees receiving
workplace health insurance coverage decreased to 55.8 percent in 2009.
The EBRI study also looked at the decline in employment-based health insurance coverage by
firm size. The study found that, from September 2007 to April 2009, there was a decline in
employment-based health insurance coverage of 10.7 percent for firms with less than 25
employees, a decline of 6.9 percent for firms with 25 to 99 employees and a decline of 3.5
53
Holahan, John and Garrett, A. Bowen. Rising Unemployment, Medicaid and the Uninsured, Kaiser Commission
on Medicaid and the Uninsured, January 2009. Accessed at www.kff.org/uninsured/upload/7850.pdf. Using data
from 1990-2003 from the CPS, the authors estimated regression models of coverage rates for employer-sponsored
insurance, Medicaid and SCHIP, private health insurance, and no insurance and structured the models to estimate
the relationship between each type of coverage and the unemployment rate, holding constant the effects of other
factors, such as state health insurance costs and demographic characteristics, that might also have an impact.
54
Id.
55
Fronstin, Paul. The Impact of the Recession on Employment-Based Health Coverage. Employee Benefit
Research Institute, EBRI Issue Brief No. 342, May 2010. See also the discussion about the SIPP as a data source on
health insurance in Appendix D.
56
When workers lose employment-based health insurance coverage because they have lost their job, they are
entitled to purchase the same coverage for up to 18 months through a continuation of coverage program known as
COBRA (named for the Act that enacted the benefit). Employers with 20 or more employees are required to make
COBRA coverage available to employees who terminate employment (unless the termination was for gross
misconduct). The employee must pay the full amount of the COBRA premium, which equals 100 percent of the
cost for similarly situated individuals (including both the employer and employee shares of the cost) plus 2 percent
for administrative costs. However, under a provision of the American Recovery and Reinvestment Act of 2009,
certain individuals are eligible for a Federal subsidy of 65 percent of the COBRA premium for up to 9 months.
P a g e | 32
percent for firms with 100 or more employees. Thus, employees of small businesses faced a
significantly larger decline in employment-based health coverage during this period, as shown in
Graph 11.
Graph 11 Percent Decline in Employment-Based Health Insurance
Coverage, Establishment Size by Employment,
September 2007 to April 2009
Total
less than 25
25 to 99
100 or more
0
-2
-3.5
-4
Percent
-4.3
-6
-6.9
-8
-10
-10.7
-12
Source: Fronstin, Paul, EBRI Issue Brief No. 342, May 2010 (using SIPP data).
Graph 12 shows the trends in access rates for establishments from 1998-2009 by employment
size of the firms of which the establishments are a part.
P a g e | 33
Graph 12 Percent of Private-Sector Establishments that Offer Health Insurance,
Establishments by Employment Size of Firm, 1998 to 2009
100.0
94.3
94.6
93.3
94.7
94.8
93.5
92.7
93.4
93.4
94.8
93.5
90.0
85.3
83.8
84.5
83.2
82.4
81.2
82.6
81.6
81.0
81.3
81.6
80.0
69.9
Percent
70.0
69.3
67.8
67.4
66.7
66.2
64.0
64.0
63.2
66.1
62.5
60.0
50.0
39.6
40.0
35.9
39.3
38.6
36.8
35.6
34.1
35.7
35.1
35.6
33.6
30.0
1998
1999
2000
2001
less than 10
2002
10 to 24
2003
2004
25 to 99
2005
100 to 499
Source: DHHS, MEPS, Tables II A.2, various years.
P a g e | 34
2006
2008
2009
For establishments in the largest class of small employers (firms with 100 to 499 employees)
access rates during the period ranged from 92.7 percent to 94.8 percent. Only 33.6 percent of
establishments for firms with fewer than 10 employees offered coverage in 2009 compared to
35.6 percent in 2008. Likewise, 62.5 percent of establishments for firms with 10 to 24
employees offered coverage in 2009 compared to 66.1 percent in 2008.
In the case of establishments associated with the smallest firms (fewer than 10 employees),
access rates declined from a high of 39.6 in 2000 to 33.6 percent in 2009. Other small-firm
establishments faced similar declines in access rates from a high of 69.9 percent in 1999 to 62.5
percent in 2009 (in the case of establishments for firms with 10 to 24 employees). For firms with
25 to 99 employees, access rates declined from a high of 85.3 percent in 1999 to 81.6 percent in
2009. Graph 12 shows this pattern of decreased access rates following the 2001 recession, for all
but the largest small-employer size category. However, the decline in access rates from 2008 to
2009 is greater in all cases.
The following maps show the change in employer health insurance access rates from 2006 to
2009 for different size categories of small employers, identifying whether the access rates
increased or decreased.
Overall, there were no situations where offer rates remained unchanged during this period. The
lack of stability in the offer rate may reflect the relatively higher turnover rates for smaller firms.
Smaller firms compared to larger firms tend to remain in business, on average, for shorter
periods. Further, newer firms starting in business tend not to offer health insurance until the firm
becomes established. Therefore, with this type of underlying firm turnover, it is likely that these
numbers would change over time.
Map 1 shows the change in access rates for the establishments associated with the smallest firms.
The vast majority of states experienced a (modest) decline in access rates, with only 17 states
posting an increase.
A similar trend as that shown in the first map appears in Map 2 and Map 3. In both maps, the
majority of states display a decrease in access. However, it is important to note that the number
of states with an overall increase in access appears positively associated with firm size.
Establishments associated with 10 to 24 employee firms show increases in access in 20 states
and establishments associated 25 to 99 employee firms show increases in access in 25 states.
Map 4 shows the change in access rates for establishments associated with 100 to 499 employee
firms. In this case, 23 states posted an increase in access over this period. Closer examination
reveals that states reporting access declines had only modest declines (an average of 3.5 percent).
Conversely, states reporting access increases had somewhat larger increases (an average of 4.8
percent).
P a g e | 35
P a g e | 36
P a g e | 37
P a g e | 38
P a g e | 39
IV.
A.
ANALYZING THE OFFERING OF HEALTH INSURANCE
BY SMALL BUSINESSES AT THE STATE LEVEL
Overview
Generally, there are variations in health insurance coverage on a state-by-state basis. Certain areas of
the country (the Northeast, for example) have historically had higher levels of health insurance
coverage, while other areas (the Southwest, for example) have historically had lower levels of health
insurance coverage.
The offering of small business health insurance coverage also varies on a state-to-state basis. Some
states have higher rates of small businesses offering health insurance to employees, while other states
have significantly lower offer rates. This section provides an overview of the offering of health
insurance by small employers on a state-by-state basis and then explores the role that special tax
incentives might play in this area.
The MEPS provides the best data on health insurance access rates by employers broken down by firm
size, by state, and by other worker demographic characteristics. The data confirm that offering health
insurance correlates positively with firm size. The larger the firm, the more likely it is that employees
have access to health insurance. Graph 13 shows the percentage of private sector firms that offer health
insurance by employer size for 1998-2009. Note that the Department of Health and Human Services
(DHHS) did not conduct the Medical Expenditure Panel Survey-Insurance Component (MEPS-IC) in
2007.
P a g e | 40
Graph 13 Establishment Offer Rates for Health Insurance,
by Employment Size of Firm, 1998-2009
100
94
95
95
95
95
94
94
94
94
95
94
90
84
85
85
83
82
81
81
83
82
81
82
69
67
68
66
64
64
63
Percent
80
70
70
67
66
63
60
50
40
40
39
36
39
37
36
34
36
35
36
34
2002
2003
2004
2005
2006
2008
2009
30
1998
1999
2000
2001
Less than 10 Employees
25 to 99 Employees
10 to 24 Employees
100 to 499 Employees
Source: MEPS, Insurance Component, 2009 and author's calculations
The data show that the offer rates in establishments for the smallest firms (fewer than 10 employees)
range from a high offer rate of 40 percent in 2000 to a low offer rate of 34 percent in 2004 and 2009.
Establishments for firms with 10 to 24 employees range from a high offer rate of 70 percent in 1999 to
a low of 63 percent in 2006 and 2009. Establishments for firms with 25 to 99 employees range from an
offer rate of 85 percent in 1999 and 2000 to a low of 81 percent in 2003, 2004, and 2008. The two
largest firm size categories (100-999 employees and 1,000 or more employees) have comparable
establishment offer rates of approximately 95 percent and 99 percent, respectively. This is consistent
with the notion that larger, more established firms are unlikely to drop their employer-provided health
insurance programs.
Health insurance offer rates also show significant geographic variation. Table 7 provides the
establishment access rates by firm size and by state for 2009.
Table 7 – Offer Rates for Employer-Provided Health Insurance, 2009
(Percent of establishments, by firm size and by state)
Less than 10
employees
Alabama
Alaska
34
20
10-24
employees
58
42
25-99
employees
88
64
100-499
employees†
91
94
P a g e | 41
Table 7 – Offer Rates for Employer-Provided Health Insurance, 2009
(Percent of establishments, by firm size and by state)
Less than 10
employees
Arizona
Arkansas
California
Colorado
Connecticut
Delaware
District of Columbia
Florida
Georgia
Hawaii
Idaho
Illinois
Indiana
Iowa
Kansas
Kentucky
Louisiana
Maine
Maryland
Massachusetts
Michigan
Minnesota
Mississippi
Missouri
Montana
Nebraska
Nevada
New Hampshire
New Jersey
New Mexico
New York
North Carolina
North Dakota
Ohio
Oklahoma
Oregon
Pennsylvania
Rhode Island
P a g e | 42
31
23
37
38
44
38
55
27
30
76
26
31
23
28
33
29
23
33
42
40
33
36
21
32
22
24
30
39
50
27
44
24
30
42
24
35
42
43
10-24
employees
38
43
62
62
74
68
74
67
53
96
53
64
43
59
62
66
52
76
68
76
64
60
57
67
57
50
60
76
77
55
74
63
64
72
51
54
66
69
25-99
employees
76
72
82
84
92
86
87
79
79
99
75
85
79
90
86
86
73
86
84
91
85
75
78
80
77
77
75
89
90
72
90
76
91
82
77
83
85
96
100-499
employees†
95
93
89
91
97
88
100
94
87
98
94
94
92
96
91
95
88
99
95
99
93
97
88
98
97
94
87
98
99
91
93
97
93
97
93
92
98
95
Table 7 – Offer Rates for Employer-Provided Health Insurance, 2009
(Percent of establishments, by firm size and by state)
Less than 10
employees
South Carolina
South Dakota
Tennessee
Texas
Utah
Vermont
Virginia
Washington
West Virginia
Wisconsin
Wyoming
28
29
29
28
24
38
28
34
25
25
22
10-24
employees
58
70
57
53
54
82
66
64
54
61
53
25-99
employees
78
81
86
68
73
91
81
84
77
88
72
100-499
employees†
94
98
92
90
93
100
98
97
90
91
90
†Authors’ calculations. Estimated access rates rely on the MEPS-IC, 2009 and the U.S. Census State and
County Business Patterns, 2007. MEPS-IC does not provide a breakdown for firms with 100 to 499
employees. Thus, we estimated weights, based on employment statistics from Census State and County
Business Patterns, for the firm size of 100 to 499 employees to derive the appropriate access rates.
Access rates for employer-sponsored health insurance tend to follow regional patterns. Access rates
tend to be higher in Northeastern states and lower in Southwestern states. Some states with higherthan-average offer rates among small employers have special programs designed to make health
insurance more affordable to small businesses. For example, New York has the Healthy NY program,
which is a subsidized reinsurance pool providing lower cost health insurance for low-income
individuals and small businesses with 50 or fewer employees. 57 The geographical differences in offer
rates likely reflect a variety of factors, including: (1) some states may maintain programs designed to
encourage small businesses to offer health insurance, (2) employers in geographic areas compete for the
same employees and, therefore, are likely to offer similar benefit packages and (3) there may be higher
concentrations of employers that are less likely to offer health insurance in certain geographic areas,
such as less populous areas and rural areas. 58
57
58
See Appendix C.
Refer to Appendix E for maps showing the employer access rates by state and by employer size.
P a g e | 43
B.
The Role of Special Tax Incentives at the State Level in the
Offering of Small Business Health Insurance
One question that we examined is whether there is a relationship between state-by-state
variations in the offering of small business health insurance and the adoption of special state tax
incentives to encourage small businesses to offer health insurance to employees. Table 8 shows
that relatively few states adopted state tax incentives for health insurance. 59 Appendix C
provides a more complete listing of the special provisions applicable to health insurance and
small businesses in all 50 states and the District of Columbia.
Table 8 – State Tax Incentives for Small Businesses to Offer Health
Insurance to Employees, 2009
State
Alabama
Arizona
Georgia
Idaho
Indiana
Kansas
Maine
Missouri
59
Type of Tax Incentive
Permits businesses with less than 25 employees to deduct 150 percent of the amount
paid for employee health insurance premiums. This deduction took effect beginning in
2009. Employees of eligible employers may deduct 50 percent of the amount they paid
for health insurance premiums.
Provides an indirect incentive for small business health insurance by allowing health
insurers a credit against premium taxes for up to 50 percent of premiums (up to $1,000
per single individual and $3,000 per family) received from small businesses (businesses
with 2-25 employees).
Georgia provides up to $250 per year per enrolled employee (nonrefundable) tax credit
for small business high-deductible health insurance plans. Small business is defined as
a business with 1-50 employees. This credit took effect beginning in 2009.
Provides a tax credit for employer-provided health insurance for new employees who
are provided health insurance (if average employment increases over the prior year).
The credit is $1,000 for employees earning at least $15.50 per hour and $500 for other
employees.
Indiana allows businesses (with 2-100 employees) to claim a 50 percent credit for the
costs of providing qualified wellness programs to employees.
Kansas provides a refundable small business health insurance credit for up to 3 years.
Credit equals $70 per month per enrolled employee in year one, $50 in year two, and
$35 in year three. An eligible small business has between 2 and 50 employees and has
not contributed to any health insurance premium or Health Savings Account for
employees for the prior two years. This health insurance credit was effective beginning
in 2005; prior to 2005, a smaller credit was available.
Maine allows a nonrefundable credit for employers with no more than 5 employees for
dependent health insurance provided to low-income employees. Credit is 20 percent of
dependent health benefits or $125 per year up to 50 percent of state income tax liability.
Low-income employees must work at least 30 hours per week or 1,000 hours per year.
Missouri provides a self-employed health insurance tax credit to taxpayers who are not
eligible for the Federal self-employed health insurance deduction.
As of 2009, the National Council of State Legislatures identified these on their website:
www.ncls.org/Default.aspx?tabID=13956.
P a g e | 44
Table 8 – State Tax Incentives for Small Businesses to Offer Health
Insurance to Employees, 2009
Montana permits small business employers with 20 or fewer employees working at least
20 hours per week to claim a nonrefundable tax credit for up to 3 years if the employer
pays at least 50 percent of each Montana employee’s health insurance premiums. The
maximum credit is $25 per month per employee up to 10 employees or $250. If the
employer pays less than 100 percent of the health insurance premiums, the amount of
the credit is proportionately reduced. Montana enacted the credit in its current form in
2001.
Montana
Employers with 2-9 employees who provide health insurance to their employees and do
not receive premium assistance through the small business health insurance pool may
claim a separate refundable credit against corporation income tax. The credit is up to
$100 per month per employee, $100 per employee’s spouse, and $40 per employee’s
dependent (up to a maximum of 50 percent of premiums paid). This credit is part of the
Insure Montana program, funded by and subject to tobacco tax revenues. The program
was at capacity in 2009.
Effective for 2007-2009, small businesses with no more than 25 employees are eligible
to claim a small business health insurance credit against North Carolina corporate or
personal income tax or corporation franchise tax. The employer must pay at least 50
North Carolina
percent of the employee premiums. The credit is available with respect to employees
whose total annual wages do not exceed $40,000. The maximum per employee credit
is $250. The credit sunsetted for taxable years beginning after December 31, 2009.
Oklahoma provides a refundable tax credit to employers. The employer must offer new
health insurance coverage to employees and pay at least 50 percent of the premium for
employees. Credit is $15 per month per eligible employee for up to 2 years. An eligible
Oklahoma
employee must work an average of 24 hours per week or more. Oklahoma also has a
premium assistance program available to employers with less than 100 employees to
provide assistance with health insurance expenses of eligible low-income employees.
Sources: National Council of State Legislatures and various state legislative websites.
An interesting question is whether the experiences in the states might lend any insight into the
general question of the effectiveness of tax incentives to encourage small businesses to offer
health insurance to their employees. The approaches in the states vary widely. There is no
single type of special tax incentive adopted by the states. In general, the provisions adopted are
available to different categories of small businesses. These special tax incentives generally have
been limited to the smallest employers. Some programs are available to employers with less than
20 employees and some are available to employers with fewer than 10 employees. In addition,
in some cases, the type of tax incentive provided is relatively narrow. Indiana, for example,
provides a tax incentive only for the provision of qualified wellness programs. Arizona provides
an indirect incentive to small businesses by providing a premium tax credit for insurers selling
health insurance to small businesses. Some of the state programs, like Alabama, have only been
in effect for a short time, thus providing an insufficient time to test the effectiveness of the state’s
incentives.
This section examines the tax incentives adopted in two states – Kansas and Montana – in order
to explore whether there is any evidence of the effectiveness of these special tax incentives in
P a g e | 45
encouraging small businesses to offer health insurance to their employees. These states have the
broadest tax incentives adopted and have maintained these incentives for sufficient time to
examine the potential affect on offer rates.
1.
Kansas
Kansas offers a refundable small business health insurance credit to eligible small businesses for
up to 3 years. Refundable credits are essentially equivalent to a direct subsidy payment from the
state government because the credit is available without regard to the business’s tax liability. A
refundable tax credit provides a dollar-for-dollar subsidy as opposed to a deduction in which the
value of the tax subsidy is determined by the marginal income tax rate faced by the taxpayer.
The Kansas small employer tax credit equals $70 per month ($840 per year) per enrolled
employee in year one, $50 per month ($600 per year) in year two, and $35 per month ($420 per
year) in year three. A small business is eligible for this credit if it has between 2 and 50
employees and has not contributed to any health insurance premium or Health Savings Account
for employees for the prior two years. New businesses that have been in existence for less than
two years are also eligible if they have not provided health insurance or Health Savings Accounts
to their employees.
For 2009, the average premium per enrolled employee for employer-based health insurance in
the state of Kansas was $4,236 ($353 per month) for single coverage and $11,829 ($986 per
month) for family coverage. 60 Thus, the $70 per month small employer credit provides a subsidy
equal to approximately 20 percent of the average cost of single health insurance coverage
provided through employer-sponsored insurance and approximately 7 percent of the average cost
of family health insurance coverage.
The Kansas credit is interesting for two reasons. First, the current iteration of the credit has been
in effect since 2005. Second, there was a smaller credit in effect for the years 2000-2005. By
looking at employer health insurance access rates in the state of Kansas, it may be possible to
determine whether the small employer health insurance credit had any discernible impact on the
small employer health insurance access rate in the state. In addition, the Kansas credit is only
available to employers that have not offered health insurance for the prior two years. It is
important to remember that this analysis is imprecise because there are other factors, such as
general economic conditions and other legislation relating to the offering of health insurance that
might also affect the small employer access rates.
60
The Kaiser Family Foundation, statehealthfacts.org. Data sources: Agency for Healthcare Research and Quality,
Center for Financing, Access and Cost Trends. 2009 MEPS-IC. Tables II.D.1, II.D.2, II.D.3 available at: MEPS,
accessed July 15, 2010.
P a g e | 46
Table 9 – Access Rates for Employer-Provided Health Insurance in Kansas,
2000-2009, Percent of Establishments, by Firm Size
Firm Size, by
2000 2001 2002 2003 2004 2005 2006 2007 2008 2009
employment
Less than 10
39
n/a
34
33
34
29
32
n/a
36
33
10-24
71
n/a
59
66
58
63
62
n/a
71
62
25-99
91
n/a
68
83
83
85
83
n/a
77
86
100-999
90
n/a
91
95
95
92
94
n/a
96
92
1,000 or more
99
n/a
100
100
98
100
98
n/a
100
99
Source: Tabulations from Department of Health and Human Services, Agency for Healthcare Research
and Quality, Medical Expenditure Panel Survey, various years. The complete file for all states and all
employer sizes is located in Appendix A.
The Department of Health and Human Services, Agency for Healthcare Research and Quality
did not collect data for 2001 for the state of Kansas and did not conduct the MEPS for 2007.
Offer rates for Kansas employer health insurance tend to the middle range of access rates
nationwide (see Tables 8 through11).
Establishment access rates did not demonstrate a discernible uptick after the increased tax credit
went into effect in Kansas in 2005. In fact, the only discernible pattern in the access rates
appears to be in 2002, when there was a noticeable decline in access rates for employers with
fewer than 100 employees, which may be a response to the recession that began in 2001. In
2009, there was a decline in access rates for the two smallest classes of employers, which may be
attributable to the most recent recession.
2.
Montana
Historically, the health insurance access rate by small businesses in the state of Montana has
been among the lowest rates in the country. In 2009, only 22 percent of the establishments for
firms with fewer than 10 employees in Montana offered health insurance to their employees and
the overall access rate for all establishments in the state was approximately 40 percent, the
lowest access rate in the country. 61
The state of Montana has a two-part system of incentives for small employers. There is a
nonrefundable credit for employers with 20 or fewer employees and a refundable credit for
employers with 2-9 employees who provide health insurance and do not receive a premium
subsidy through the Montana small business purchasing pool.
Montana permits small business employers with 20 or fewer employees working at least 20
hours per week to claim a nonrefundable tax credit for up to three years if the employer pays at
least 50 percent of each Montana employee’s health insurance premiums. The credit equals 50
percent of the percentage of premiums paid by the employer times $25 per month per employee
up to 10 employees. The maximum credit applies if the employer pays 100 percent of the
61
Table 7, above, and 2009 Medical Expenditure Panel Survey,Table II.A.2.
P a g e | 47
premium; the maximum credit equals $250 per month or $3,000 per year. If the employer pays
less than 100 percent of the health insurance premiums, the amount of the credit declines
proportionately, but the credit is not available if the employer pays less than 50 percent of the
premiums. Nonrefundable credits can only be used by employers with positive income tax
liability. This credit has been in effect in this form since 2001.
Montana also allows employers to take a separate refundable credit against corporation income
tax. This credit is available to employers with 2-9 employees who provide health insurance to
their employees and do not receive premium assistance through the small business health
insurance purchasing pool. The credit is up to $100 per month per employee, $100 per
employee’s spouse, and $40 per employee’s dependent (up to a maximum of 50 percent of
premiums paid). For employees who are at least age 45, the tax credit increases to $125 per
month. This credit is part of the Insure Montana program, which receives funding by and is
subject to tobacco tax revenues. In 2009, the Insure Montana program was at capacity with 700
businesses participating in the purchasing pool and another 700 businesses qualifying for the tax
credit. 62 On July 1, 2009, an additional $3 million became available, which led to the enrollment
of an additional 169 businesses in the purchasing pool program and 79 businesses in the tax
credit program. There are approximately 100-150 additional businesses on a waiting list.
In 2009, the average single premium per enrolled employee in employer-provided health
insurance in the state of Montana was $4,546 per year. The average premium for family
coverage was $11,365.
With respect to the nonrefundable credit available to employers with up to 20 employees, the
$300 annual tax credit per employee is approximately 7 percent of the annual single premium for
Montana for 2009 and approximately 3 percent of the average family premium.
The separate refundable tax credit for very small employers (2-9 employees) that do not receive
assistance through the state small business health insurance pool is more generous than the
nonrefundable credit. The refundable credit offers a subsidy of $100 per month for a single
individual ($1,200 per year) and $240 per month ($2,880) for family coverage for a married
couple plus one child.
62
Insure Montana Small Business Insurance Program Newsletter, Volume 4, Issue 2, September 1, 2009, available
at www.sao.mt.gov/InsureMontana/PDF/NewslettersSept09.pdf.
P a g e | 48
Table 10 – Access Rates for Employer-Provided Health Insurance in Montana,
2000-2009, Percent of Establishments, by Firm Size
Firm Size, by
employment
Fewer than 10
10-24
25-99
100-999
1,000 or more
2000
2001
2002
2003
2004
2005
2006
2007
2008
2009
n/a
n/a
n/a
n/a
n/a
n/a
n/a
n/a
n/a
n/a
39
56
71
98
91
30
62
74
95
96
22
50
76
93
95
20
55
85
88
95
22
63
88
100
100
n/a
n/a
n/a
n/a
n/a
25
61
66
97
97
22
57
77
97
100
Source: Tabulations from Department of Health and Human Services, Agency for Healthcare Research and Quality,
Medical Expenditure Panel Survey, various years. The complete file for all states and all firm sizes is located in
Appendix A.
Note: The Medical Expenditure Panel Survey was not conducted in 2007. While the survey was conducted in years
2000 and 2001, data for certain states is not available.
The nonrefundable credit in Montana pays up to $3,000 per year for up to three years for
employers with up to 20 employees. This credit might encourage employers who do not offer
health insurance coverage to offer it to their employees. On the other hand, the amount of the
credit per employee ($250 per year) is such a small percentage of the average premiums for
employer-sponsored health insurance that it is unlikely to provide any significant incentive for
employers to offer health insurance coverage. Further, the refundable credit is available only to
those employers that already provide health insurance coverage to their employees and is only
available to the smallest employers (those with 2-9 employees); thus, this credit is unlikely to
induce significant new health insurance offerings by small employers.
The data support this analysis. For the smallest two classes of employers (those with fewer than
10 employees and those with 10 to 24 employees), the access rates have declined or fluctuated
up and down over the 2002 to 2009 period. For employers with fewer than 10 employees, the
access rate for health insurance declined from 39 percent in 2002 to 22 percent in 2009. In
addition, the Insure Montana program, which provides a purchasing pool to eligible employers,
may also influence the access rates for employer health insurance.
C.
Relationship Between State Tax Rates and Health
Insurance Offer Rates
Conventional wisdom generally posits that tax rates will influence business decisions,
particularly the decision to offer employee benefits. This view neglects to consider the many
facets of business decision making. If businesses respond to high tax rates, then as state tax rates
increase the state access rates for health insurance should theoretically decline.
From an employee’s perspective, increasing tax rates provide a benefit because of the favorable
tax treatment for employer-sponsored health insurance. Typically, from the small business
perspective, increasing tax rates represent an increased burden to small business operations. To
examine if high tax rates imposed a burden to small employers and perhaps, influenced the
P a g e | 49
health insurance access rates, the analysis considers the two extremes of state corporation tax
rates (states with the highest rates and zero tax states); these extremes are represented by states
with corporate tax rates at 9 percent or higher and states with no corporate income tax. Graph 14
displays the eight states with corporation tax rates at 9 percent or higher. Among these states, it
is noteworthy that Alaska has the lowest access rates, but otherwise the state health insurance
access rates (for all small business sizes) remain high. Graph 15 displays the four states with no
corporation income tax. In this graph, it is noteworthy that Wyoming has the lowest access rates
(compared to the other zero-tax states as well as all states).
The graphs suggest that the small business decision to offer health insurance to their workforce
depends on a number of factors and state tax rates play a small role in influencing this decision.
Graph 14 Small Business Health Insurance Establishment Access Rates, by
Firm Size States with State Corporate Tax Rates of 9 percent or higher
100
100
98
96
80
77
76
75
74
69
66
64
60
59
60
90
87
85
70
99
96 95
94
91
90
90
Percent
99
97
55
50
50
42
40
30
42
40
43
36
28
20
20
10
Iowa
Pennsylvania
District of
Columbia
Fewer than 10 Employees
25 to 99 Employees
Minnesota
Massachusetts
Alaska
Rhode Island
New Jersey
10 to 24 Employees
100 to 499 Employees
Source: Access rates from the MEPS, Insurance Component by state; state tax rate data from authors' research.
P a g e | 50
Graph 15 Small Business Health Insurance
Establishment Access Rates, by Firm Size for
States with No State Corporate Tax
120
98
100
97
90
87
84
81
Percent
80
75
72
70
64
60
60
53
40
34
29
30
22
20
Wyoming
South Dakota
Fewer than 10 Employees
25 to 99 Employees
Nevada
Washington
10 to 24 Employees
100 to 499 Employees
Source: Access rates from the MEPS, Insurance Component by state and tax rate data from authors' research.
P a g e | 51
V. Use of Existing Federal Tax Incentives by Small
Businesses and Implications of Health Care Reform
Theoretically, an employer is indifferent between offering benefits and paying wages to their
employees. From a Federal tax perspective, the employer’s tax treatment of a dollar of benefits
is the same as a dollar of wages – the employer is entitled to a current deduction for these
compensation costs. 63 As a result, the desire to attract a workforce that meets the business’s
needs will largely drive the employer’s decision to offer a benefit such as health insurance in lieu
of cash compensation.
In practice, when an employer provides health insurance benefits, it may become difficult for
some employers to discontinue such benefits – despite the potential cost increases. On the other
hand, wages offer predictable costs that the employer controls directly. In many ways, the
employer – particularly the small employer – has little control over the health insurance costs for
the workplace coverage.
Employees, on the other hand, should prefer to receive some of their compensation in the form of
benefits such as health insurance because of the Federal tax benefits to an employee of receiving
health insurance coverage through the employer in lieu of cash wages and lower costs with group
purchases. Thus, as a rule, employees should exert pressure on employers to offer health
insurance as a benefit.
Because Federal taxes represent a substantial percentage of overall tax liability for most people,
the Federal tax advantage for employer-provided health insurance provides a far greater
incentive than the state tax effects. Thus, the Federal tax rather than state tax effects are more
likely important drivers of behavior.
The following sections examine the role of the Federal tax incentives for health insurance. One
method to demonstrate the importance of Federal tax incentives is to consider what Federal tax
data suggests concerning the utilization of employer-sponsored health insurance.
A. Small Corporation Use of Federal Incentives
As with other compensation, an employer is entitled to deduct the cost of health insurance
premiums paid on behalf of their employees. Employers report the amounts deducted for health
insurance separately from other compensation amounts. Recent corporation income tax data
suggest that the deduction for all employee benefits (excluding retirement savings) was
approximately $322 billion in 2007. 64 Health insurance comprises nearly 90 percent of all
63
In some cases, the states may provide special tax incentives to the employer to offer compensation in the form of
benefits rather than wages. See the discussion in Part IV.B.
64
Refer to the IRS, Statistics of Income, Corporation Source Book, Tax Year 2007, “Returns of Active
Corporations.” It is not possible to get similar statistics for sole proprietorships and partnerships.
P a g e | 52
benefits (excluding retirement savings) for small corporations. 65 This suggests that small
corporations deducted approximately $53.8 billion for health insurance benefits alone. 66
While small employers file approximately 98 percent of corporation income tax returns, they
account for only 19 percent of the employee benefits deducted. 67 Graph 16 displays the
estimated amounts that small corporations deducted for health insurance benefits. Since 2003,
the amount deducted remained approximately 19 percent of the total benefits deducted for all
corporations. However, the amount deducted for small corporations increased 11 percent from
2003 to 2007.
Graph 16 Estimated Small Corporation Deduction for Employer
Health Insurance Benefits, Tax Years 2003 to 2007
$55.0
$54.1
$54.0
$53.8
$53.0
Billions of Dollars
$52.0
$51.2
$51.0
$50.0
$48.9
$49.0
$48.0
$47.9
$47.0
$46.0
$45.0
$44.0
2003
2004
2005
2006
2007
Source: Author's calculation based on Statistics of Income Corporate Source Book Data (2003-2007)
and Employer Benefit Costs From the Bureau of Labor Statistics, National Compensation Survey.
The employer deduction for health insurance is only one side of the story. If the employer
contributes to the cost of health insurance for their employees, those amounts are excludable
from the employee’s income for both income and payroll taxes. The Joint Committee on
65
This estimate excludes retirement benefits and other benefits reported with wage and salary expenses.
Components of employee benefits for small businesses were from the Bureau of Labor Statistics, Employer Costs
for Compensation, prepared from the National Compensation Survey, March 2010 Table 13.
66
Data for small C and S corporations are used because the IRS does not publish comparable data by asset size for
sole proprietorships and partnerships.
67
The small business definition is those businesses with less than $10 million in assets. Refer to the IRS, Statistics
of Income, 2007.
P a g e | 53
Taxation reported that in 2007, individuals saved approximately $246 billion in Federal taxes for
amounts paid by their employers for health insurance. 68 This tax savings includes both income
tax ($145.3 billion) and employment taxes ($100.7 billion).
Nearly 75 percent of the individual tax savings (73.2 percent) accrues to taxpayers with adjusted
gross incomes of less than $100,000, as shown in Graph 17. In general, employees of small
businesses tend to earn less compared to their counterparts working with large employers.
Therefore, it is likely that employees of small businesses would find both the provision of
employer-sponsored insurance and the corresponding tax savings to be an important benefit.
However, as noted in Part II above, because of the graduated Federal income tax rate structure,
the value of the exclusion becomes more valuable for individuals with higher adjusted gross
income. Thus, while 21 percent of the exclusion accrues to taxpayers in the $100,000 to
$200,000 adjusted gross income category, this represents a relatively small percentage of all
taxpayers.
25.0
Graph 17 Total Tax Savings for the Exclusion of Health Insurance Benefits
Provided by an Employer, Distributed by Adjusted Gross Income,
Tax Year 2007
21.1
19.9
Percent of Total Tax Savings
20.0
18.6
16.1
15.8
15.0
10.0
5.3
5.0
1.7
1.4
less than
$10,000
$10,000 less
than $30,000
$30,000 less
than $50,000
$50,000 less
than $75,000
$75,000 less $100,000 lesss $200,000 less
than $100,000 than $200,000 than $500,000
Source: Joint Committee on Taxation, JCX-66-08.
68
See the Joint Committee on Taxation, Tax Expenditures for Health Care, JCX-66-08, July 31, 2008.
P a g e | 54
$500,000 or
more
B. Self-Employed Use of Federal Incentives
Under current law, self-employed individuals are entitled to deduct the costs of health insurance
for themselves and their spouses and dependents. The deduction does not apply for selfemployment tax purposes, which creates a disparity of treatment between self-employed
individuals and corporate owners who work for their corporation. For many years, the deduction
for self-employed health insurance expenses was 50 percent of the cost of health insurance.
Legislation enacted in 1998 phased in the self-employed health insurance deduction to 60
percent for 1999 through 2001, 70 percent for 2002, and 100 percent in 2003 and thereafter.
Graph 18 shows that the annual total deductions for self-employed health insurance increased
significantly between 2002 and 2003 (56.9 percent increase). This suggests that the increase in
the self-employed health insurance tax deduction from 70 percent in 2002 to 100 percent in 2003
created an incentive for some self-employed individuals to purchase health insurance or perhaps
purchase more insurance. In fact, the number of returns claiming the self-employed health
insurance deduction increased 6.5 percent (from 3.6 to 3.8 million returns) between 2002 and
2003. (Refer to Table A1 in Appendix A for the numbers of returns and the deduction amounts.)
Graph 18 Amount of Self-Employed Health Deduction for Returns
Claiming a Deduction, Tax Years 1998 to 2008
(Dollar Amounts in Billions)
$25.0
$19.6
$20.0
$21.3
$21.2
2007
2008
$20.3
$18.5
$16.5
Billions
$15.0
$10.5
$10.0
$6.8
$5.0
$7.6
$8.2
$4.7
$1998
1999
2000
2001
2002
2003
2004
2005
2006
Source: Internal Revenue Service, Statistics of Income, Individual Income Tax Returns, Table 1.4, 1998 through 2008.
Graph 19 displays the average amount of the self-employed health deduction for those returns
claiming a deduction. As shown, the average deduction claimed increased 47.3 percent between
P a g e | 55
2002 and 2003. This increase in the average deduction amount indicates that the value of the
deduction, the cost of health insurance, and the quantity of insurance increased. The subsequent
increases, from 2004 through 2008, are consistent with increases in the cost of insurance, as the
number of returns claiming the deduction decreased slightly over this period.
$6,000
Graph 19 Average Amount of Self-Employed Health Deduction for Returns
Claiming a Deduction, Tax Years 1998-2008
(in Dollars)
$5,858
$5,544
$5,337
$5,036
$5,000
$4,752
$4,327
Dollars
$4,000
$2,939
$3,000
$1,935
$2,000
$2,123
$2,297
$1,388
$1,000
$1998
1999
2000
2001
2002
2003
2004
2005
2006
2007
2008
Source: Internal Revenue Service, Statistics of Income, Individual Income Tax Returns, Table 1.4, 2008. Averages
calculated as total self-employed deductions divided by total returns claiming the deduction.
P a g e | 56
Graph 20 Self-Employed Deduction for Health Insurance, Returns and
Deduction Amount, Distributed by AGI, Tax Year 2008
(Percent of Returns and Percent of Deductions)
25
22
20
18
15
Percent
14
12
8
4 3
4
6
5
11
10
9 9
9
9
10
5
17
7
7
5
5
$30k
under
$40k
$40k
under
$50k
5
No
adjusted
gross
income
Under
$10k
$10k
under
$20k
$20k
under
$30k
Returns
$50k
under
$75k
$75k
under
$100k
$100k
under
$200k
$200k
under
$500k
$500k or
more
Self-Employed HI Deduction Amount
Source: Internal Revenue Service, Statistics of Income, Individual Income Tax Returns, Table 1.4, 2008.
The deduction for self-employed health insurance tends to correlate positively with income.
Unlike the exclusion for employer-sponsored insurance that delivers sizeable benefits to lower
income taxpayers, the self-employed deduction distributes the tax benefits more evenly among
income classes. Graph 20 distributes the returns and the amount of the self-employed deduction
by adjusted gross income class. Approximately half (49 percent) of the tax benefits (deduction
amounts) accrue to taxpayers with incomes over $100,000.
C. Health Care Reform
1. Overview
The Patient Protection and Affordable Care Act of 2010 (Health Care Reform Act), signed by
President Obama on March 23, 2010, adopts significant changes to the system of health care
delivery in the United States. The Act will set up state health insurance exchanges that will offer
individuals and small businesses access to health insurance, provide greater regulation of health
insurance, and provide tax credits for individuals and small businesses to help offset the cost of
health insurance.
The Health Care Reform Act affects small businesses in a variety of ways. Small employers
with 50 or more employees are assessed a fee if they do not provide health insurance to their
P a g e | 57
employees and if any of their employees received subsidized health insurance coverage through
a health insurance exchange. Small businesses with fewer than 50 employees are exempt from
this requirement.
Beginning in 2014, small businesses with up to 100 employees will have access to health
insurance through the state exchanges. Starting in 2017, states will have the option of expanding
the state exchanges to businesses with more than 100 employees. In addition, employees of
small businesses that do not offer health insurance will be able to purchase health insurance
through the exchanges.
The Act requires the Department of Health and Human Services to establish a new website with
information on affordable and comprehensive health insurance coverage choices. In addition,
the website will provide specific information geared toward small businesses, such as
information on using the small business tax credits and finding insurance through health
exchanges. This website is located at http://www.healthcare.gov/foryou/small/index.html.
2.
Small Business Health Insurance Tax Credit
One of the most significant aspects of health care reform for small businesses is the adoption of
the small business health insurance tax credit. Beginning in 2010, small businesses can claim a
nonrefundable tax credit for the costs of health insurance they provide to their employees. 69 As a
nonrefundable credit, the credit in any year is limited to the employer’s Federal income tax
liability for the year. Because this credit is a general business credit, the business may carry any
unused credit amount back one year and forward up to 20 years.
The tax credit is available to employers with less than 25 full-time equivalent (FTE) employees
and average wages of less than $50,000 per year. The maximum credit is 35 percent of an
employer’s contributions to employer-sponsored insurance for 2010-2013 and 50 percent for
2014 and later years.
An employer must contribute at least 50 percent of the premium costs to qualify for this credit,
but could pay up to 100 percent of the premium costs. The following examples illustrate the
value of the credit.
Example 1.—Assume an employer contributes 100 percent of the premium costs for
employee health insurance coverage. The employer has 10 full-time employees with average
wages of $25,000, so the employer qualifies for the maximum credit of 35 percent (2010-2013)
and 50 percent in 2014 and beyond. In 2010, five employees have single coverage with per
employee premium costs of $5,000 and five employees have family coverage with per employee
premium costs of $11,000. The employer’s total premium costs are $80,000 (5×$5,000 plus
5×$11,000). The employer qualifies for the maximum credit rate of 35 percent, so the employer
is eligible for a credit of $28,000 (.35×$80,000).
69
Nonprofit employers may take a smaller credit, allowed against income tax withholding from employee wages
and against the employer and employee share of Medicare taxes.
P a g e | 58
Example 2.—Assume the employer in Example 1 contributes 50 percent of the premium
costs for employee health insurance coverage. In this case, the employer would qualify for a
maximum credit of $14,000 (.35×.50 of the premium costs).
A recent study estimated the number of small employers that might be eligible for the small
business health insurance tax credit. 70 These estimates are consistent with estimates of the
President’s Council of Economic Advisors that approximately 4 million small businesses would
be eligible for the credit. 71 Table 12 shows the estimates, by state, of the number of businesses
with no more than 25 employees and average wages of less than $50,000 and the estimates of the
number of businesses with no more than 10 employees and average wages of less than $25,000
for 2010.
Table 12 – Estimated Number of Small Businesses With Fewer Than 25 (10) Employees and
Average Wages of Less Than $50,000 ($25,000), 2010
State
Alabama
Alaska
Arizona
Arkansas
California
Colorado
Connecticut
Delaware
District of Columbia
Florida
Georgia
Hawaii
Idaho
Illinois
Indiana
Iowa
Kansas
Kentucky
Louisiana
Maine
Maryland
Massachusetts
Michigan
Minnesota
Total Number of
Businesses with
25 or Fewer
Employees
57,800
12,800
84,700
42,300
571,200
99,700
57,500
13,700
11,800
307,100
143,200
20,100
33,200
203,600
94,800
56,300
51,600
57,400
66,200
28,700
82,600
109,700
148,300
92,500
Employers with 25 or Fewer
Employees and Less than
$50,000 Average Wages
Percent of
Number
Total
50,600
87.7
10,400
81.0
72,600
85.7
39,900
94.2
456,500
79.9
82,400
82.6
44,000
76.5
11,300
82.7
6,800
57.8
246,000
80.1
120,300
84.0
16,300
81.3
29,800
89.5
159,900
78.5
88,100
92.9
51,100
90.8
45,800
88.9
51,500
89.2
57,400
86.8
25,800
90.1
66,000
79.8
81,300
74.1
126,300
85.1
77,900
84.3
Employers with 10 or Fewer
Employees and Less than
$25,000 Average Wages
Percent of
Number
Total
15,900
27.5
3,700
28.9
18,900
22.3
13,000
30.7
135,900
23.8
24,500
24.6
12,900
22.4
3,100
22.6
1,500
12.7
77,400
25.2
37,500
26.2
4,900
24.4
10,400
31.3
48,400
23.8
26,000
27.4
14,000
24.9
13,100
25.4
15,800
27.5
18,800
28.4
8,600
30.0
18,500
22.4
19,800
18.1
39,600
26.7
22,800
24.7
70
A Helping Hand for Small Businesses. Health Insurance Tax Credits. A Report for Families USA and Small
Business Majority, July 2010.
71
See http://www.treasury.gov/press-center/pressreleases/Documents/additional%20background%20on%20the%20small%20business%20health%20care%20tax%20
credit.pdf.
P a g e | 59
Table 12 – Estimated Number of Small Businesses With Fewer Than 25 (10) Employees and
Average Wages of Less Than $50,000 ($25,000), 2010
Employers with 25 or Fewer
Employers with 10 or Fewer
Employees and Less than
Employees and Less than
$50,000 Average Wages
$25,000 Average Wages
State
Percent of
Percent of
Number
Number
Total
Total
Mississippi
36,600
34,100
93.2
11,400
31.3
Missouri
92,700
85,100
91.8
25,100
27.1
Montana
28,800
27,100
94.0
8,300
28.8
Nebraska
35,400
33,200
93.8
10,300
29.1
Nevada
38,100
29,600
77.8
9,400
24.7
New Hampshire
24,400
19,600
80.3
4,500
18.4
New Jersey
163,500
126,800
77.5
37,000
22.6
New Mexico
27,900
24,800
88.9
5,500
19.7
New York
349,500
285,000
81.6
78,300
22.4
North Carolina
144,200
126,100
87.5
37,600
26.1
North Dakota
16,500
15,200
91.9
5,100
30.9
Ohio
149,100
127,800
85.7
38,900
26.1
Oklahoma
58,400
50,300
86.2
18,200
31.2
Oregon
77,000
67,100
87.1
19,800
25.7
Pennsylvania
178,500
160,700
90.0
43,800
24.5
Rhode Island
19,100
15,700
82.0
3,900
20.4
South Carolina
60,400
53,200
88.1
15,900
26.3
South Dakota
18,800
17,600
93.6
4,600
24.5
Tennessee
74,200
66,500
89.6
21,600
29.1
Texas
307,800
248,700
80.8
79,100
25.7
Utah
44,200
37,800
85.5
12,600
28.5
Vermont
14,900
13,100
87.9
3,400
22.8
Virginia
127,000
102,600
80.8
30,700
24.2
Washington
127,200
110,000
86.5
32,500
25.6
West Virginia
23,500
21,200
90.3
6,100
26.0
Wisconsin
99,200
86,100
86.8
25,800
26.0
Wyoming
15,600
12,700
86.8
4,000
25.6
Total, U.S.
4,798,300
4,015,300
83.7
1,198,700
25.0
Source: Lewin Group estimates for Families USA and Small Business Majority, 2010. These estimates are
consistent with estimates of the President’s Council of Economic Advisors that approximately 4 million small
businesses would be eligible for the credit. See http://www.treasury.gov/press-center/pressreleases/Documents/additional%20background%20on%20the%20small%20business%20health%20care%20tax%20
credit.pdf.
Total Number of
Businesses with
25 or Fewer
Employees
Because average wages determine eligibility for the small business health credit, there will be
geographic disparities in eligibility. In states with higher average wages, fewer employers will
qualify for the credit. Similarly, in states with lower average wages, more employers will
qualify.
Two factors will affect actual utilization of the credit. First, for a variety of reasons, it is likely
that the credit will initially primarily benefit those small businesses that already provide health
insurance for their employees. Some small employers may be reluctant to offer health insurance
P a g e | 60
to their employees because of perceived uncertainty about the effects of health care reform.
Other small employers may wait until the health insurance exchanges are available to offer
health insurance to their employees. Because of uncertainty about the economy, other small
employers may defer decisions to add a new employee benefit.
Second, it is important to remember that only those employers with positive Federal tax liability
will be able to utilize the credit in the current year. If an employer does not have sufficient
Federal tax liability, the credit is not currently available and the employer must carry over and
use the credit to offset Federal income tax liability in subsequent years (or can carry any unused
amount back one year).
According to the 2007 IRS Statistics of Income (SOI), approximately 42.8 percent of all small
businesses (businesses with assets of less than $10 million) filing a corporate return (including S
corporations) have no net income and therefore, no Federal tax liability. 72 However, those small
businesses likely to offer health insurance benefits to their workers are also more likely to report
net income. Further, in the early years following availability of the credit, it is likely that those
firms that previously offered health insurance benefits will claim the vast majority of the tax
credits. There are three possible responses of small employers to the health insurance tax credit
and the other provisions of health care reform: (1) small employers that either offer health
insurance to their employees currently or do not offer such coverage continue the status quo, (2)
small employers that offer health insurance to their employees drop the coverage, and (3) small
employers who do not currently offer health insurance to their employees begin to offer it. In the
short run, the possible responses in (1) (i.e., the status quo response) may be the most likely
response as employers take time to evaluate the effects of health care reform legislation and to
analyze the costs and benefits of offering health insurance to employees. The status quo
response will tend to result in utilization of the credit by those employers already offering health
insurance to their employees. On the other hand, there is considerable uncertainty about the
possible take-up rates for small employer health insurance under health care reform. The
Congressional Budget Office estimated that approximately 1 million fewer people would have
employer-based health insurance coverage in 2019-2021 because of health care reform. 73
However, this estimate reflects the net effect of individuals having new access to employer
health insurance, having access to employer health insurance but enrolling in an exchange health
plan instead, or losing access to employer health insurance.
Estimates of the number of small businesses eligible for the health insurance tax credit identify
the potential universe of small businesses eligible for the credit, but do not account for the fact
that not all small businesses would be able to utilize the credit because they do not have
sufficient Federal tax liability to benefit from the credit. The ability to utilize the credit will
affect the attractiveness of the credit for many small businesses.
72
Author’s calculations based on the 2007 Corporation Source Book of Statistics of Income. Refer to Table 3 – (file
07co03ccr.xls) Balance Sheet, Income Statement and Selected Other Items, by Size of Total Assets, Tax Year 2007
and (file 07sb1ai.xls) Returns of Active Corporation. Data for small C and S corporations are used because the IRS
does not publish comparable data by asset size for sole proprietorships and partnerships.
73
Testimony of Douglas W. Elmendorf, Director, CBO’s Analysis of the Major Health Care Legislation Enacted in
March 2010, Testimony before the Subcommittee on Health, Committee on Energy and Commerce, U.S. House of
Representatives, March 30, 2011.
P a g e | 61
Our estimates suggest that the actual number of small businesses that could benefit from the
credit will be much smaller than the 4 million estimated to be eligible for it. Based on an analysis
of MEPS data on small firm employees, access rates, and enrollment, as well as IRS statistics of
income (SOI) data, approximately 65 percent of eligible firms could use the credit at the time
that health insurance benefit are provided to employees. We estimate that approximately 2.6
million of the 4.0 million firms estimated to be eligible for the credit would receive a current
benefit from the tax credit in 2010.
The Federal small business health insurance tax credit provides a significant tax incentive to
employers to offer health insurance to their employees. However, because the credit is
nonrefundable, the credit will only provide a current incentive to those employers that have
current Federal tax liability, however, it will be possible for businesses to carry any unused credit
amount back one year and forward for up to 20 years.
P a g e | 62
VI.
CONCLUSIONS
Individuals who lack health insurance coverage in the United States are more likely to work for a
small employer as opposed to a large employer. There is a positive correlation between access to
employer-provided health insurance and employer size (Table 13). On the other hand, at least 70
percent of employees with access to employer-provided health insurance elect to use it. Because
the access rates increase with employer size, the participation rates (access rate multiplied by
take-up rate) also increase with employer size.
Table 13 – Access, Take-Up, and Participation Rates, by Establishment Size, 2010
(Percent)
Firm Size, by Employment
1 to 49
50 to 99
100 to 499
500 or more
Total: All Firms
Access
55
70
82
88
71
Take-up Rates
70
72
72
78
73
Participation
39
50
59
68
51
Source: U.S. Bureau of Labor Statistics, National Compensation Survey, March 2010
The recession that began in December 2007 has had an adverse effect on employment-based
health insurance coverage. As unemployment rates go up, the percentage of individuals with
employment-based health insurance declines. From September 2007 to April 2009,
employment-based health insurance coverage declined by 4.3 percent. However, the percentage
decline was 10.7 percent for individuals employed by establishments with less than 25
employees, 6.9 percent for individuals employed by establishments with 25 to 99 employees, and
3.5 percent for individuals employed by establishments with at least 100 employees. 74
Employment-based health insurance is the most common source of health insurance in the
United States. Lack of access to employment-based health insurance among employees of small
businesses has been one of the most intractable problems facing the U.S. health care system.
While the Federal health care reform legislation enacted in 2010 does not mandate that
employers offer health insurance to their employees, certain aspects of the legislation, such as the
creation of health exchanges to which small businesses will have access and the adoption of a
small business health insurance credit, are designed to encourage more small businesses to make
health insurance available to their employees.
The states have tried a variety of approaches to improve health insurance coverage and,
particularly, to improve the offering of health insurance by small businesses. However, we
found that most state tax-incentive programs adopted apply to very narrow classes of employers
(typically the smallest of employers) and provide relatively narrow tax benefits. In general, we
found no correlation between any of these tax incentives and access rates for health insurance.
74
Fronstin, Paul, EBRI Issue Brief No. 342, May 2010 (using SIPP data).
P a g e | 63
The Health Care Reform Act of 2010 adopted comprehensive changes to the U.S. health
insurance system. The Act will set up state health exchanges that will offer individuals and
small businesses access to health insurance, provide greater regulation of health insurance, and
provide tax credits for individuals and small businesses to help offset the cost of health
insurance.
The Health Care Reform Act affects small businesses in a variety of ways. Beginning in 2013,
small businesses with 50 or more employees are assessed a $2,000 per worker fee if they do not
provide health insurance to their employees and if any of their employees receive subsidized
health insurance coverage through a health insurance exchange. In addition, beginning in 2014,
small businesses with less than 100 employees will have access to health insurance through the
state exchanges and, starting in 2017, the states will have the option of expanding the states’
exchanges to businesses with more than 100 employees. In addition, employees of small
businesses that do not offer health insurance will be able to purchase health insurance through
the state exchanges.
One of the most significant aspects of health care reform for small businesses is the adoption of a
generous tax credit to help subsidize the cost of small business health insurance. The credit is
nonrefundable and generally is available only to offset current Federal income tax liability.
Thus, employers who do not have sufficient current Federal income tax liability cannot
immediately utilize the credit; unused credits can be carried back one year and carried forward
20 years.
A recent analysis estimated that approximately 4 million small businesses will be eligible for the
small business health insurance tax credit nationwide and that approximately 1.2 million will be
eligible for the full amount. 75 It is important to distinguish between eligibility for the credit and
ability to apply the credit to current tax liabilities. Eligibility means that by virtue of the firm
characteristics, the small business is eligible to claim the credit. Because the credit is
nonrefundable, an employer can only use the credit immediately if the employer has positive
Federal tax liability that the credit can offset.
Based on an analysis of MEPS data on small firm employees, access rates, and enrollment, as
well as IRS statistics of income (SOI) data, approximately 65 percent of eligible firms could use
the credit at the time that health insurance benefit are provided to employees. We estimate that
approximately 2.6 million of the 4.0 million firms estimated to be eligible for the credit would
receive a current benefit from the tax credit in 2010.
It remains to be seen whether the provisions in Federal health care reform will be sufficient to
overcome the barriers to small businesses offering health insurance to their employees. While
Federal health care reform will clearly overcome some of these barriers, the unpredictable costs
associated with providing health insurance may continue to deter small businesses from offering
health insurance to their employees. On the other hand, because Federal health care reform
mandates that individuals have health insurance, demand for small businesses to offer health
insurance should increase.
75
A Helping Hand for Small Business, supra.
P a g e | 64
Appendix A – Data on Health Insurance Offered by Small Businesses
Data in Table A1 show that 20 percent of eligible income tax returns claim the self-employed health insurance deduction. However,
this utilization rate positively correlates with income and increases measurably for taxpayers with adjusted gross income of at least
$100,000. Sole proprietors, partners, and S corporation shareholders may claim this deduction if they purchase health insurance in the
individual market.
Table A1 – Percent of Individual Income Tax Returns that Claim the
Self-Employed Health Insurance Deduction, 1998 to 2008,
Percent of Returns and Percent of Returns by Adjusted Gross Income (AGI) Levels
1998
1999
2000
2001
2002
2003
2004
2005
2006
2007
2008
Total Sole Prop Returns
20
20
20
20
19
20
19
19
18
17
16
No adjusted gross
income
Under $10,000
$10,000 under $20,000
$20,000 under $30,000
$30,000 under $40,000
$40,000 under $50,000
$50,000 under $75,000
$75,000 under 100,000
$100,000 under $200,000
$200,000 under $500,000
$500,000 or more
12
14
13
13
16
17
17
15
16
17
17
09
16
20
21
18
19
21
32
53
81
10
17
21
20
19
19
21
32
53
79
11
17
20
20
19
20
19
30
52
79
10
17
19
21
20
18
19
30
54
88
10
15
20
19
18
18
19
30
55
93
11
16
19
21
19
18
21
28
52
90
10
13
19
20
19
19
20
28
53
85
10
12
17
18
17
17
21
27
52
83
7
11
17
17
17
17
18
26
48
81
7
10
15
16
18
17
18
24
48
81
8
09
16
15
16
17
16
23
46
84
Source: IRS, Statistics of Income, Table 1.4, Tax Years 1998 – 2008
P a g e | 65
Tables A2 to A6 show the percent of establishments offering health insurance to employees, by firm size and by state.
Table A2 – Percent of Private-Sector Establishments That Offer Health Insurance by State, 1998 to 2009‡
Firms with fewer than 10 employees
State
1998
1999
2000
2001
2002
2003
2004
2005
2006
2008
2009
United States
36
39
40
39
37
36
34
36
35
36
34
Alabama
Alaska
Arizona
Arkansas
California
Colorado
Connecticut
Delaware
30
46
41
40
33
23
35
42
48
40
†
37
34
†
25
38
30
31
31
32
24
†
40
46
40
37
00
34
36
23
39
42
50
†
†
42
32
84
†
40
35
31
41
32
28
36
51
50
50
35
27
31
44
23
39
46
57
†
37
39
30
†
†
38
35
30
39
40
28
†
37
53
45
34
30
41
31
24
38
23
39
48
49
49
58
40
30
69
25
41
37
31
†
29
28
42
38
49
51
43
22
35
36
26
29
20
37
34
46
42
58
36
29
75
34
31
26
27
33
36
25
36
37
49
42
31
25
34
39
22
33
20
34
32
52
43
54
33
30
69
27
35
25
26
34
34
20
30
44
44
39
34
19
34
38
19
34
16
41
32
44
33
52
31
28
81
23
31
35
26
29
36
29
35
42
43
43
32
21
28
40
16
27
24
38
37
45
38
57
33
25
82
29
31
25
31
32
33
26
36
48
50
33
27
21
32
40
23
27
20
40
32
44
38
52
35
31
80
24
34
29
33
36
34
29
36
37
51
36
29
21
35
34
20
31
23
37
38
44
38
55
27
30
76
26
31
23
28
33
29
23
33
42
40
33
36
21
32
District of Columbia
Florida
Georgia
Hawaii
Idaho
Illinois
Indiana
Iowa
Kansas
Kentucky
Louisiana
Maine
Maryland
Massachusetts
Michigan
Minnesota
Mississippi
Missouri
P a g e | 66
28
†
38
38
43
31
†
37
29
83
33
39
37
28
34
32
30
38
37
42
45
35
26
33
Table A2 – Percent of Private-Sector Establishments That Offer Health Insurance by State, 1998 to 2009‡
Firms with fewer than 10 employees
State
Montana
Nebraska
Nevada
New Hampshire
New Jersey
New Mexico
New York
North Carolina
North Dakota
Ohio
Oklahoma
Oregon
Pennsylvania
Rhode Island
South Carolina
South Dakota
Tennessee
Texas
Utah
Vermont
Virginia
Washington
West Virginia
Wisconsin
Wyoming
†States not shown
1998
1999
2000
2001
2002
2003
2004
2005
2006
2008
2009
†
31
†
54
42
27
43
36
†
37
26
32
48
†
29
†
23
27
43
†
37
36
34
34
26
32
30
34
38
†
47
†
45
33
†
42
32
40
45
52
35
†
32
33
†
44
39
39
†
42
†
33
†
27
†
47
50
33
48
38
31
45
29
35
49
†
38
25
31
30
27
†
39
41
32
38
†
42
†
†
36
†
48
†
47
32
†
43
31
41
47
44
26
†
30
26
32
40
38
36
†
40
†
33
39
26
24
52
46
38
40
25
†
46
33
39
50
†
25
†
26
27
30
30
26
37
52
46
30
44
34
28
36
26
40
46
48
32
26
26
26
27
37
40
38
26
31
24
22
26
30
41
46
27
42
33
27
39
20
36
44
44
30
26
26
20
30
38
39
37
26
32
20
20
24
31
38
57
30
44
37
31
40
25
37
42
41
30
29
27
26
21
43
34
36
21
39
21
22
22
40
41
47
27
45
36
27
38
32
38
43
49
25
20
30
26
27
41
38
33
25
35
31
25
19
44
47
53
27
43
30
33
36
30
31
39
46
29
26
32
26
31
37
36
41
29
27
27
22
24
30
39
50
27
44
24
30
42
24
35
42
43
28
29
29
28
24
38
28
34
25
25
22
39
38
34
38
†
32
separately
‡ The MEPS did not release estimates for 2007.
† Survey data not collected for the year.
Source: Department of Health and Human Services, Medical Expenditure Panel Survey, various years
P a g e | 67
Table A3 – Percent of Private-Sector Establishments That Offer Health Insurance by State, 1998 to 2009‡
Firms with 10 to 24 employees
State
1998
1999
2000
2001
2002
2003
2004
2005
2006
2008
2009
United States
67
70
69
67
68
66
64
64
63
66
63
Alabama
Alaska
Arizona
Arkansas
California
Colorado
Connecticut
Delaware
District of
Columbia
Florida
Georgia
Hawaii
Idaho
Illinois
Indiana
Iowa
Kansas
Kentucky
Louisiana
Maine
Maryland
Massachusetts
Michigan
Minnesota
Mississippi
Missouri
71
†
60
58
59
70
75
74
†
63
†
66
62
68
80
75
†
77
†
64
64
63
74
73
†
63
74
59
57
49
61
79
82
70
78
66
72
60
66
44
59
63
88
65
90
70
51
53
61
62
69
79
69
81
65
49
46
44
67
72
78
69
82
69
47
36
38
65
53
83
63
77
78
80
79
74
77
78
83
73
75
58
42
38
43
62
62
74
68
74
63
44
00
55
73
63
68
62
71
58
†
74
79
77
76
†
71
61
60
97
†
78
63
68
68
69
55
61
72
79
78
78
56
71
68
62
†
†
76
71
70
71
83
47
†
63
83
82
75
55
56
64
49
97
52
82
64
60
†
71
62
46
74
83
79
77
52
52
61
61
94
†
72
60
60
59
75
58
64
78
80
82
73
54
63
66
58
99
64
67
61
69
66
67
56
66
82
81
76
76
40
65
57
49
95
51
61
59
52
58
70
42
71
78
71
70
75
39
59
63
61
100
54
62
54
56
63
59
53
76
76
77
67
66
42
65
61
57
100
58
70
58
68
62
70
47
73
72
75
66
67
39
68
62
60
74
77
71
68
60
71
68
61
68
64
70
76
70
56
62
67
53
96
53
64
43
59
62
66
52
76
68
76
64
60
57
67
P a g e | 68
61
†
64
70
81
73
Table A3 – Percent of Private-Sector Establishments That Offer Health Insurance by State, 1998 to 2009‡
Firms with 10 to 24 employees
State
Montana
Nebraska
Nevada
New Hampshire
New Jersey
New Mexico
New York
North Carolina
North Dakota
Ohio
Oklahoma
Oregon
Pennsylvania
Rhode Island
South Carolina
South Dakota
Tennessee
Texas
Utah
Vermont
Virginia
Washington
West Virginia
Wisconsin
Wyoming
†States not shown
1998
1999
2000
2001
2002
2003
2004
2005
2006
2008
2009
†
48
†
71
79
55
78
71
†
71
48
72
75
†
76
†
58
56
51
†
60
65
58
82
55
66
56
65
70
†
82
†
75
79
†
74
50
65
76
71
76
†
58
57
†
81
80
67
†
77
†
69
†
65
†
83
76
53
72
78
58
71
62
75
89
†
62
63
63
53
75
†
71
74
65
71
†
69
†
†
63
†
85
†
72
63
†
82
53
69
71
84
43
†
65
54
47
81
74
62
†
76
†
68
56
51
70
74
69
62
82
68
†
74
59
70
75
†
60
†
45
59
62
†
69
70
54
73
61
59
62
56
64
86
68
60
73
68
68
62
52
69
80
84
63
65
60
48
57
78
73
76
62
77
55
50
53
51
77
81
48
78
56
50
70
54
70
78
77
47
68
57
48
50
61
73
69
52
71
59
55
46
40
83
82
60
75
50
69
72
53
71
70
81
46
70
48
53
51
62
63
70
63
70
38
63
46
49
78
69
56
70
67
69
71
61
75
73
85
66
57
52
44
39
70
79
66
48
53
54
61
62
72
60
73
60
53
51
50
62
53
50
61
56
62
53
64
57
57
56
54
65
97
66
62
57
50
60
76
77
55
74
63
64
72
51
54
66
69
58
70
57
53
54
82
66
64
54
61
53
separately
‡ The MEPS did not release estimates for 2007.
† Survey data not collected for the year.
Source: Department of Health and Human Services, Medical Expenditure Panel Survey, various years
P a g e | 69
Table A4 – Percent of private-sector establishments that offer health insurance by State, 1998 to 2009‡
Firms with 25 to 99 employees
State
1998
1999
2000
2001
2002
2003
2004
2005
2006
2008
2009
United States
84
85
85
83
82
81
81
83
82
81
82
Alabama
Alaska
Arizona
Arkansas
California
Colorado
Connecticut
Delaware
District of
Columbia
Florida
Georgia
Hawaii
Idaho
Illinois
Indiana
Iowa
Kansas
Kentucky
Louisiana
Maine
Maryland
Massachusetts
Michigan
Minnesota
Mississippi
Missouri
98
†
78
81
77
85
91
91
†
94
†
84
69
79
82
85
†
†
82
†
85
73
77
85
94
†
89
75
82
69
81
90
92
83
91
†
73
†
77
77
98
81
90
75
80
69
80
85
85
93
81
77
64
71
83
81
93
87
94
74
65
56
87
88
98
74
92
77
75
71
79
88
96
80
74
80
73
70
78
81
91
92
88
64
76
72
82
84
92
86
69
81
†
80
80
86
89
85
88
79
†
88
90
91
86
†
90
85
82
100
†
89
80
80
82
88
86
93
89
93
92
95
72
83
89
85
80
†
†
92
86
91
91
85
70
†
89
91
88
81
72
86
83
75
80
100
77
88
80
86
†
85
85
98
†
90
85
78
68
85
81
89
87
94
87
84
77
84
93
78
76
100
83
82
73
87
83
82
84
77
88
95
74
80
69
85
90
72
68
98
85
87
84
89
83
79
73
77
88
100
86
83
72
88
87
80
78
100
76
86
83
75
86
82
72
89
87
95
78
91
81
78
91
72
83
95
65
86
75
80
83
76
81
91
86
84
90
89
68
88
91
85
77
99
85
84
83
92
77
82
81
87
84
96
71
84
79
78
87
79
79
99
75
85
79
90
86
86
73
86
84
91
85
75
78
80
P a g e | 70
92
77
88
94
91
87
76
72
87
Table A4 – Percent of private-sector establishments that offer health insurance by State, 1998 to 2009‡
Firms with 25 to 99 employees
State
Montana
Nebraska
Nevada
New Hampshire
New Jersey
New Mexico
New York
North Carolina
North Dakota
Ohio
Oklahoma
Oregon
Pennsylvania
Rhode Island
South Carolina
South Dakota
Tennessee
Texas
Utah
Vermont
Virginia
Washington
West Virginia
Wisconsin
Wyoming
†States not shown
1998
1999
2000
2001
2002
2003
2004
2005
2006
2008
2009
†
85
†
90
91
74
85
90
†
92
83
79
88
†
78
†
86
81
74
†
85
91
68
94
79
68
92
91
†
82
†
85
90
†
93
82
87
93
92
82
†
82
71
†
92
85
93
†
97
†
†
92
†
93
86
71
91
82
89
86
80
92
91
†
84
74
84
76
83
†
86
85
91
90
†
†
†
76
†
92
†
91
83
†
85
79
81
94
93
85
†
84
63
86
80
91
80
†
89
†
71
82
89
93
91
70
87
79
†
90
70
83
83
†
69
†
82
70
89
†
76
79
80
92
77
74
79
85
94
91
63
89
79
80
89
69
89
84
89
82
80
70
65
78
88
87
80
76
89
80
76
78
77
91
93
74
85
73
79
86
81
66
93
86
66
78
83
64
78
86
97
79
75
78
77
85
91
83
93
87
65
87
84
78
86
84
77
84
92
81
85
82
68
75
93
85
63
78
89
69
88
75
73
93
85
64
85
89
86
89
82
84
93
86
69
72
73
65
75
97
87
90
69
89
75
66
86
79
94
92
79
85
82
90
77
73
82
90
90
82
76
78
71
71
89
85
88
77
87
82
77
77
75
89
90
72
90
76
91
82
77
83
85
96
78
81
86
68
73
91
81
84
77
88
72
88
82
80
78
88
separately
‡ The MEPS did not release estimates for 2007.
† Survey data not collected for the year.
Source: Department of Health and Human Services, Medical Expenditure Panel Survey, various years
P a g e | 71
Table A5 – Percent of private-sector establishments that offer health insurance by State, 1998 to 2009‡
Firms with 100 to 999 employees
State
1998
1999
2000
2001
2002
2003
2004
2005
2006
2008
2009
United States
94
95
95
95
95
94
94
94
94
95
94
Alabama
Alaska
Arizona
Arkansas
California
Colorado
Connecticut
Delaware
District of
Columbia
Florida
Georgia
Hawaii
Idaho
Illinois
Indiana
Iowa
Kansas
Kentucky
Louisiana
Maine
Maryland
Massachusetts
Michigan
Minnesota
Mississippi
Missouri
Montana
Nebraska
100
†
96
100
96
96
97
68
93
†
96
86
92
90
100
†
93
†
92
94
96
100
96
†
94
97
96
88
95
95
100
100
99
†
94
†
95
96
100
93
98
96
82
98
91
79
99
86
93
100
90
94
91
93
100
90
91
97
97
94
95
97
98
81
86
95
95
95
92
92
100
84
97
99
97
98
93
96
94
83
92
94
96
94
90
92
97
89
†
97
88
†
98
98
97
95
93
91
86
†
100
94
87
95
†
92
†
98
†
96
94
100
†
94
96
97
94
91
97
97
100
98
96
95
97
96
99
98
82
96
95
†
†
95
97
97
90
95
91
†
82
95
91
100
95
96
†
99
98
97
93
97
93
93
96
93
†
98
89
100
100
99
100
99
92
97
†
†
†
89
95
100
†
97
98
97
91
92
95
99
99
95
97
89
94
97
98
99
100
94
86
100
95
95
95
99
95
99
89
99
93
89
88
100
97
82
95
91
100
99
92
98
98
98
98
98
95
97
99
93
97
100
100
95
83
92
93
91
97
96
93
100
91
96
92
100
92
87
90
99
95
91
94
100
93
95
88
97
93
100
93
100
100
93
95
96
94
93
94
100
95
92
97
100
97
95
100
95
95
92
95
98
87
97
96
97
96
94
95
100
100
99
99
90
97
100
97
97
100
94
89
98
95
95
94
96
92
95
90
99
96
99
94
97
90
98
97
95
P a g e | 72
Table A5 – Percent of private-sector establishments that offer health insurance by State, 1998 to 2009‡
Firms with 100 to 999 employees
State
Nevada
New Hampshire
New Jersey
New Mexico
New York
North Carolina
North Dakota
Ohio
Oklahoma
Oregon
Pennsylvania
Rhode Island
South Carolina
South Dakota
Tennessee
Texas
Utah
Vermont
Virginia
Washington
West Virginia
Wisconsin
Wyoming
†States not shown
1998
1999
2000
2001
2002
2003
2004
2005
2006
2008
2009
†
95
90
93
95
87
†
98
93
92
94
†
97
†
97
90
96
†
88
91
94
98
93
94
†
99
†
100
96
92
99
98
82
98
96
97
93
†
94
98
94
90
96
†
89
100
95
96
†
95
†
94
†
98
97
†
98
99
93
100
98
91
†
96
88
96
100
99
91
†
97
†
97
100
94
91
99
100
†
97
92
97
93
†
94
†
96
92
99
†
100
95
93
96
96
94
100
92
93
99
99
98
96
94
100
98
100
93
90
95
94
96
99
92
97
98
88
84
93
100
92
92
99
88
92
99
93
88
97
100
92
99
100
84
83
97
99
98
87
98
88
96
92
94
94
97
93
92
94
95
95
87
100
96
99
97
91
93
90
99
98
87
97
93
89
92
100
86
100
87
92
96
90
94
96
100
86
93
100
84
86
100
99
94
88
96
100
91
99
99
88
98
99
91
95
93
98
94
99
97
97
99
89
88
98
100
100
91
97
89
89
98
99
92
94
98
94
97
94
93
98
96
95
98
93
91
94
100
98
97
91
93
91
94
99
†
96
91
98
92
97
93
†
96
94
†
99
97
97
†
100
†
96
96
92
96
94
separately
‡ The MEPS did not release estimates for 2007.
† Survey data not collected for the year.
Source: Department of Health and Human Services, Medical Expenditure Panel Survey, various years
P a g e | 73
Table A6 – Percent of Private-Sector Establishments That Offer Health Insurance by State, 1998 to 2009‡
Firms with 1,000 or more employees
State
1998
1999
2000
2001
2002
2003
2004
2005
2006
2008
2009
United States
99
99
99
99
99
99
99
99
98
99
99
Alabama
Alaska
Arizona
Arkansas
California
Colorado
Connecticut
Delaware
District of
Columbia
Florida
Georgia
Hawaii
Idaho
Illinois
Indiana
Iowa
Kansas
Kentucky
Louisiana
Maine
Maryland
Massachusetts
Michigan
Minnesota
Mississippi
Missouri
99
†
†
97
†
†
99
96
99
†
99
100
100
100
100
†
100
†
100
100
100
100
97
†
99
99
100
97
100
100
100
95
100
†
99
†
98
94
100
91
100
100
99
94
96
100
97
99
100
98
98
97
100
98
97
96
99
97
100
94
100
100
99
98
100
96
100
93
99
97
99
92
100
98
100
98
99
100
100
95
99
99
99
99
99
100
100
94
†
100
100
†
†
100
93
100
99
98
97
†
100
99
99
100
†
100
†
100
99
99
†
96
100
99
100
100
100
100
100
100
98
99
99
100
99
99
99
†
†
100
99
97
99
99
100
†
99
99
97
100
99
100
98
99
96
100
98
100
100
97
†
100
100
100
100
100
100
99
100
99
†
100
95
100
†
99
100
93
100
100
100
100
100
100
97
100
99
100
100
100
100
100
100
100
100
100
100
89
100
99
99
100
100
100
99
97
99
97
100
100
100
100
100
100
98
98
97
100
100
100
100
98
99
100
97
98
97
100
100
99
97
100
100
100
98
100
100
100
100
100
96
100
100
99
97
98
93
100
100
97
98
100
98
96
100
100
98
98
99
99
99
99
100
100
100
100
100
99
100
99
100
100
100
100
99
100
99
98
100
98
100
97
100
99
100
100
99
99
100
99
99
100
99
100
100
99
P a g e | 74
Table A6 – Percent of Private-Sector Establishments That Offer Health Insurance by State, 1998 to 2009‡
Firms with 1,000 or more employees
State
Montana
Nebraska
Nevada
New Hampshire
New Jersey
New Mexico
New York
North Carolina
North Dakota
Ohio
Oklahoma
Oregon
Pennsylvania
Rhode Island
South Carolina
South Dakota
Tennessee
Texas
Utah
Vermont
Virginia
Washington
West Virginia
Wisconsin
Wyoming
†States not shown
1998
1999
2000
2001
2002
2003
2004
2005
2006
2008
2009
†
95
†
100
100
†
100
100
†
100
99
†
100
†
100
†
100
100
†
†
98
†
100
100
†
100
97
99
†
100
†
99
100
†
100
100
100
100
96
100
†
100
97
†
100
98
100
†
100
†
†
96
†
97
100
98
100
100
100
100
100
100
99
†
100
100
100
99
100
†
99
95
100
100
†
†
†
100
†
99
†
100
100
†
100
98
98
100
100
100
†
99
100
100
100
100
99
†
100
†
91
99
97
93
100
91
100
100
†
99
100
100
100
†
100
†
100
100
90
†
100
99
100
100
100
96
100
97
100
97
100
100
98
100
100
100
100
100
100
100
97
98
99
98
100
97
100
100
100
98
95
100
100
100
100
96
100
97
100
99
91
100
100
90
100
95
100
99
92
98
98
99
97
100
98
95
98
99
100
96
97
100
100
100
99
98
100
100
99
100
100
99
98
100
100
98
98
100
100
100
100
98
95
97
100
100
100
100
97
98
97
96
98
98
96
100
97
98
98
100
98
98
97
100
99
97
100
96
100
100
98
98
100
100
100
98
100
99
98
100
100
98
95
99
100
100
97
100
100
98
100
100
99
100
100
99
100
100
100
100
98
99
100
100
100
100
99
98
100
100
100
100
100
100
97
100
100
99
99
98
separately
‡ The MEPS did not release estimates for 2007.
† Survey data not collected for the year.
Source: Department of Health and Human Services, Medical Expenditure Panel Survey, various years
P a g e | 75
APPENDIX B – CURRENT FEDERAL TAX INCENTIVES FOR
HEALTH INSURANCE
A. Overview
The Patient Protection and Affordable Care Act (PPACA), as amended by the Health Care and
Education Reconciliation Act of 2010 (referred to as the “2010 Health Care Reform Act”)
modified the Federal tax incentives for health insurance and health benefits. These modified
Federal tax incentives are taken into account for purposes of the analysis in the body of this
paper. This section provides a brief overview of the modified Federal tax incentives.
Individuals who have employer-sponsored health insurance are eligible for more favorable tax
treatment under Federal law than individuals who purchase health insurance on their own. The
value of the employer-provided health insurance is excludable from income for income tax and
employment tax purposes, which provides an incentive for employees to prefer to receive a
portion of their wages in the form of employer-provided health insurance.
The 2010 Health Care Reform Act requires individuals to have health insurance coverage or to
pay a penalty based on household income beginning in 2014. Individuals who do not have
access to employer-sponsored health insurance will be able to purchase health insurance
coverage through a state health insurance exchange. Low- and moderate-income individuals and
families who purchase health insurance through an exchange will be entitled to tax credits to
help offset the costs of the health insurance coverage.
The 2010 Health Care Reform Act does not include a so-called “mandate” that employers offer
health insurance coverage to their employees. However, employers with at least 50 full-time
equivalent (FTE) employees that do not offer health insurance coverage to their employees will
be required to pay a penalty with respect to any full-time employees who purchase health
insurance through an exchange and who are entitled to a tax-credit or cost-sharing subsidy for
that insurance. In addition, beginning in 2014, employers who offer health insurance coverage
will be charged the penalty with respect to employees who purchase health insurance through a
state exchange if the employee is eligible for a tax credit or cost-sharing subsidy.
P a g e | 76
B. Tax Provisions Relating to Individuals Who Purchase Health
Insurance on Their Own
1.
Itemized Deduction for Out-of-Pocket Medical Expenses (IRC Sec. 213) 76
Historically, individual taxpayers who itemize their deductions have been entitled to deduct their
out-of-pocket medical expenses to the extent that these expenses exceed a threshold. Prior to the
enactment of the 2010 Health Care Reform Act, the threshold for the medical expense deduction
was 7.5 percent of adjusted gross income (AGI). Under the 2010 Health Care Reform Act,
beginning in 2013, the threshold for the itemized deduction for medical expenses is increased to
10 percent of AGI, except that the 7.5 percent of AGI threshold applies until 2017 for individuals
who are age 65 and older.
The itemized deduction for individuals for medical expenses benefits fewer individuals than the
Federal tax benefits applicable to employment-based health insurance. First, the deduction is
only available to those taxpayers who itemize their deductions. Further, the deduction is only
available if the medical expenses exceed a relatively high percentage of AGI. Thus, for example,
in 2008, 48.8 million taxpayers filed Schedule A (itemized deductions) with their Federal income
tax return and, of those, 10.1 million included amounts for medical and dental expenses.
2.
Tax Credits for the Purchase of Health Insurance (new IRC Sec. 36B)
Effective in 2014, the 2010 Health Care Reform provides a tax credit for qualifying taxpayers
who purchase health insurance through a health insurance exchange. This credit – the premium
assistance credit – is refundable and payable in advance directly to the insurer. Taxpayers are
eligible for the credit if their household income is between 100 percent and 400 percent of the
Federal poverty level. The credit design limits the percentage of premiums that low- and
moderate-income taxpayers are required to pay for health insurance coverage through the
exchange. This percentage ranges from 2 percent for the taxpayers at 100 percent of the Federal
poverty level to 9.5 percent for taxpayers at 400 percent of the Federal poverty level.
3.
Health Care Tax Credit (HCTC) (IRC Sec. 35)
Certain displaced workers (i.e., workers who are receiving trade adjustment assistance payments)
and certain workers receiving pension benefits from the Pension Benefit Guaranty Corporation
(PBGC) are entitled to a refundable tax credit if they purchase continuation health insurance
coverage under COBRA, purchase certain state-based coverage, or purchase certain other health
insurance coverage. The credit equals 80 percent (65 percent for years before 2011) of the
amount paid for health insurance coverage. This credit is available to a relatively narrow class of
taxpayers.
76
References to IRC are references to the sections of the applicable law in the Internal Revenue Code of 1986.
P a g e | 77
C. Exclusion From Income for Employer-Sponsored Health Insurance
(IRC Sections 104, 105, 106, 125, 3121(a), and 3306(a))
One of the reasons that employment-based health insurance became a prominent form of health
insurance in the United States is the exclusion from income for employees of the value of
employer-provided care that they receive. If an employer contributes to a plan to provide health
coverage to employees (through health insurance or through a self-funded health plan), the
employer contributions and the amount of any benefits that an employee receives from the plan
are not included in the employee’s income for Federal income and payroll tax purposes. There is
no dollar limit on the amount of employer-provided health care that is excludable from income.
Employers are entitled to deduct the amounts they contribute for employee health care, just as
they are entitled to deduct cash compensation paid and other allowable benefits to employees.
Thus, from a Federal income tax perspective, employers are indifferent as to whether they pay
compensation in cash or in the form of health care because both payments are deductible by the
employer. The value of employer-provided health insurance is also excluded from wages for
employment tax purposes, lowering both the employer and employer share of employment taxes
that must be paid.
Employers may also maintain a cafeteria plan, which typically offers employees a choice
between cash compensation and certain nontaxable benefits. If the cafeteria plan satisfies certain
requirements, then amounts received as nontaxable benefits are excluded from an employee’s
income for income and payroll tax purposes. 77 One of the benefits that a cafeteria plan might
provide is the opportunity for an employee to forego current compensation in order to pay for the
employee’s share of health insurance premiums. 78 This allows the employee to convert what
otherwise would be taxable wages (the employee’s share of health insurance premiums) into a
nontaxable benefit.
D. Deduction for Health Insurance Premiums of Self-Employed
Individuals (IRC sec. 162(l))
Self-employed individuals are entitled to a deduction from their income for Federal income tax
(but not employment tax) purposes for the health insurance costs of the self-employed individual
and his or her spouse and dependents. The amount of this deduction cannot exceed the amount
of the individual’s self-employment income. Self-employed individuals include sole proprietors,
partners in partnerships, and more than two percent shareholders in S corporations.
Because the deduction for health insurance premiums of self-employed individuals does not
apply for employment tax purposes, the treatment of self-employed individuals for Federal tax
purposes is less favorable than the treatment of employees, who are entitled to exclude the value
of health insurance benefits for income and employment tax purposes.
77
In the absence of the cafeteria plan rules, employees who had a choice between a taxable and nontaxable benefit
would not be able to exclude the value of the nontaxable benefit from their income.
78
Employers often pay for only a portion of the cost of employer-provided health insurance coverage and require
the employee to contribute the rest of the cost.
P a g e | 78
E. Flexible Spending Accounts and Health Reimbursement
Arrangements (IRC sec. 125(i)
Employers may offer employees the opportunity to participate in a plan that reimburses
employees for medical expenses not covered by health insurance. These arrangements include
flexible spending accounts (FSAs) and health reimbursement arrangements (HRAs).
Under a typical FSA offered as part of a cafeteria plan, an employee foregoes a portion of their
salary and that amount is credited to an FSA for the employee. Thus, the employee reduces his
or her current cash compensation in order to have that amount available to reimburse the
employee for out-of-pocket medical expenses. The advantage of using the FSA for the employee
is that amounts credited to the FSA are not included in the employee’s income for Federal
income or employment tax purposes. In essence, an FSA allows an employee to avoid income
and employment taxes on the amounts that they would have expended in any event for out-ofpocket medical expenses. However, if any amounts are remaining in an FSA at the end of a
year, those amounts are forfeited (use it or lose it); thus, employees need to estimate their out-ofpocket medical expenses carefully to make sure they do not contribute too much to an FSA.
Current law does not limit the amounts that employees can contribute to an FSA each year.
Under the PPACA, the amount that employees can set aside each year into an FSA is limited to
$2,500, beginning in 2013. 79 This dollar limitation will be indexed for inflation after 2013.
Health reimbursement arrangements are similar to FSAs, except that funding is not on a salary
reduction basis. Thus, an employer would make contributions of all (or a class of) employees
and they can withdraw amounts to pay for out-of-pocket medical expenses. The use it or lose it
rule does not apply to health reimbursement accounts. In addition, funds from the HSA may
cover the employee share of the health insurance costs, but funds from a health FSA cannot.
F. Health Savings Accounts and Archer Medical Savings Accounts
(IRC sec. 125(d)(2))
Special tax incentives encourage individuals to enroll in high deductible health plans. Under
these rules, individuals may make tax-deductible contributions to a Health Savings Account
(HSA), which is a tax-exempt account similar to an individual retirement arrangement (IRA). 80
The earnings on amounts contributed to an HSA are not subject to Federal income tax and
withdrawals used for qualified medical expenses are not included in the individual’s income. If
an employer contributes to an employee’s HSA, the contributions are excluded from the
employee’s income for Federal income and employment tax purposes. 81 In addition, employees
may make HSA contributions through a cafeteria plan maintained by an employer.
79
In addition, effective for tax years beginning after December 31, 2012, the PPACA changed the definition of
permitted medical expenses for FSAs, HRAs, HSAs, and MSAs to exclude doctor prescribed over-the-counter
medicines from eligibility for reimbursement on a tax-favored basis.
80
Individuals enrolled in Medicare Part A or Part B are not permitted to make contributions to an HSA.
81
An employer must make comparable contributions to HSAs on behalf of all employees with comparable health
plan coverage during the same period.
P a g e | 79
A high deductible health plan must have an annual deductible that is at least $1,200 for self-only
coverage or $2,400 for family coverage. 82 The sum of the deductible plus other out of pocket
expenses cannot exceed $5,950 for self-only coverage and $11,900 for family coverage. The
maximum annual contribution amount to an HSA is $3,050 for self-only coverage and $6,150 for
family coverage; these amounts increase by $1,000 for each individual over age 55.
Archer Medical Savings Accounts (Archer MSA) are similar to, but less generous than, HSAs.
Archer MSAs are only available to self-employed individuals and employees of small
businesses. In addition, after 2007, the ability to contribute to Archer MSAs is limited to
individuals who previously made Archer MSA contributions and employees covered under a
high deductible health plan of an employer who previously participated in Archer MSAs.
G. Retiree Medical Benefits (IRC sec. 401(h), 419, 419A, and 501(c)(9))
Providing employees with health insurance coverage after retirement is a benefit primarily
provided by large employers and, over time, fewer large employers are offering this retirement
benefit. Under current law, employers can prefund, on a deductible basis, the costs attributable
to retiree medical expenses over the working lives of the covered employees. Employers may
contribute to a tax-exempt voluntary employees’ beneficiary association (VEBA) or to a taxqualified pension plan maintained by the employer (into a retiree medical account). In addition,
if an employer maintains a qualified defined benefit pension plan with a retiree medical account,
transfers of excess assets under the pension plan may fund the retiree medical account.
H. Small Business Health Insurance Tax Credit (IRC sec. 36B)
Under the Health Care Reform Act, certain small employers are eligible to claim a tax credit for
contributions for employee health insurance. The credit is effective for years beginning after
December 31, 2009. To be eligible for the credit, an employer must (1) pay at least 50 percent of
the premiums for their employees’ health insurance and (2) have less than 25 full-time equivalent
(FTE) employees with average wages of less than $50,000.
Small businesses may use the small business health insurance non-refundable tax credit to offset
Federal income tax liability. If the employer does not have sufficient tax liability to utilize the
credit fully, the employer may carry the unused credit back one year and forward up to 20 years.
Tax-exempt small businesses can use the credit to offset certain payroll taxes, which for this
purpose includes amounts required to be withheld from employees’ pay for Federal income tax
purposes plus the employer and employer share of Medicare (i.e., HI) taxes.
The maximum credit rate is 35 percent of the employer contributions for health insurance for
2010-2013 and 50 percent of the employer contributions beginning in 2014. The maximum
credit is available for employers with up to 10 FTE employees and average wages of up to
$25,000. After that level, the credit rate phases down as the number of employees and average
wages increases. Tables B1 and B2 show the phase down of the credit for 2010-2013 and for
2014 and thereafter.
82
The dollar amounts are for 2010 and are indexed each year for inflation.
P a g e | 80
Table B1 Maximum Small Business Health Insurance Tax Credit
(Percentage of Employer Contribution to Premiums)
2010-2013 83
Average Wage
Firm Size, by
Up to
$30,000
employment
$25,000
(FTEs)
Up to 10
35
28
11
33
26
12
30
23
13
28
21
14
26
19
15
23
16
16
21
14
17
19
12
18
16
9
19
14
7
20
12
5
21
9
2
22
7
0
23
5
0
24
2
0
25
0
0
Source: Congressional Research Service, 2010.
$35,000
$40,000
$45,000
$50,000
21
19
16
14
12
9
7
5
2
0
0
0
0
0
0
0
14
12
9
7
5
2
0
0
0
0
0
0
0
0
0
0
7
5
2
0
0
0
0
0
0
0
0
0
0
0
0
0
0
0
0
0
0
0
0
0
0
0
0
0
0
0
0
0
83
Peterson, Chris L. and Chaikind, Hinda. Summary of Small Business Health Insurance Tax Credit Under PPACA
(P.L. 111-148). Congressional Research Service, CRS Report for Congress, R41158, April 20, 2010.
P a g e | 81
Table B2 Small Business Health Insurance Tax Credit
(Percentage of Employer Contribution to Premiums)
2014 and Subsequent Years
Average Wage
Firm Size, by
Up to
$30,000
employment
$25,000
(FTEs)
Up to 10
50
40
11
47
37
12
43
33
13
40
30
14
37
27
15
33
23
16
30
20
17
27
17
18
23
13
19
20
10
20
17
7
21
13
3
22
10
0
23
7
0
24
3
0
25
0
0
Source: Congressional Research Service, 2010.
$35,000
$40,000
$45,000
$50,000
30
27
23
20
17
13
10
7
3
0
0
0
0
0
0
0
20
17
13
10
7
3
0
0
0
0
0
0
0
0
0
0
10
7
3
0
0
0
0
0
0
0
0
0
0
0
0
0
0
0
0
0
0
0
0
0
0
0
0
0
0
0
0
0
I. Small Business Simple Cafeteria Plan (IRC sec. 125(j))
The Health Care Reform Act created a “simple cafeteria plan” for small employers. A small
employer who maintains a simple cafeteria plan is not subject to certain nondiscrimination rules
that otherwise would apply. For purposes of these rules, a small employer is defined as an
employer with 100 or fewer employees. Under a simple cafeteria plan, an employer must make
contributions on behalf of qualified employees equal to (1) a uniform percentage (not less than
two percent) of each employee’s compensation or (2) an amount not less than the lesser of six
percent of employee compensation or two times the salary reduction contributions of each
qualified employee. Qualified employees are nonhighly compensated employees who are not
key employees who are eligible to participate in the plan.
P a g e | 82
Appendix C – Summary of State Tax Provisions
Relating to Health Insurance
In addition to the Federal tax incentives that cause employees to prefer to receive health
insurance through an employer-sponsored plan, state tax incentives may influence the preference
for employer-sponsored health insurance. Every state with an income tax system allows selfemployed individuals to claim the self-employed health insurance deduction against their income
for state income tax purposes. 84 These states also provide an exclusion from income for
employer-provided health insurance.
In a limited number of cases, states have adopted special small business tax incentives designed
to encourage small businesses to offer health insurance coverage to their employees. Some
states have adopted nontax programs designed to encourage or make it easier for small
businesses to offer health insurance to their employees or to make it easier for employees of
small businesses to purchase health insurance.
This section details the provisions enacted at the state level in four categories: (1) general health
tax incentives, (2) provisions designed to encourage or require the use of cafeteria plans to offer
health insurance, (3) specific provisions relating to small business tax incentives to offer health
insurance, and (4) other provisions relating to small business health insurance. If a state does not
have all four categories outlined, it means that there are no specific state law provisions in the
omitted categories. In general, the rules outlined in this section were in effect on January 1,
2010; thus, this summary does not reflect any changes adopted subsequent to that date. Further,
this section will not reflect any changes to state law that may be (or may have been) enacted in
response to the enactment of Federal health care reform legislation.
Alabama
General Health Tax Incentives
Alabama allows a deduction for self-employed health insurance expenses and an exclusion for
employer-provided health insurance for state income tax purposes.
Alabama allows an individual to claim an itemized deduction for medical and dental expenses
(not including health insurance premiums paid by an employer-sponsored plan (cafeteria plan))
that exceed 4 percent of adjusted gross income.
Small Business Tax Incentives
84
States that do not have an individual income tax do not have a reason to enact special tax incentives for health
insurance. The following states do not have an individual income tax (or have a limited income tax, such as an
income tax on interest and dividends only): Alaska, Florida, Nevada, New Hampshire, South Dakota, Tennessee,
Texas, Washington, and Wyoming.
P a g e | 83
Alabama permits businesses with fewer than 25 employees to deduct 150 percent of the amount
they pay for employee health insurance premiums for state income tax purposes. Employees of
businesses with fewer than 25 employees may claim a 50 percent deduction against their
personal state income tax for amounts they pay as health insurance premiums as part of an
employer-provided health insurance plan. To be eligible, employees must make $50,000 or less
in annual wages and report no more than $75,000 in adjusted annual gross income ($150,000 in
the case of a married couple filing a joint return). This provision was enacted in 2007 and
became effective January 1, 2009.
Alaska
General Health Tax Incentives
Alaska allows corporations to deduct health insurance premiums paid on behalf of employees as
a compensation expense. Alaska does not have an individual income tax, so there are no specific
tax incentives provided for self-employed individuals and employees.
Arizona
General Health Tax Incentives
Arizona allows a deduction for self-employed health insurance expenses and an exclusion for
employer-provided health insurance for state income tax purposes. In addition, Arizona
generally follows the Medical Savings Account provisions of sec. 220 of the Internal Revenue
Code. However, Arizona residents are permitted to set up MSAs in two situations in which they
are not permitted under Federal law. A person can set up an MSA even though his or her
employer is not a small employer (with 50 or fewer employees) and even if the maximum
number of MSAs that can be set up under Federal law (750,000) has been reached.
Small Business Tax Incentives
Arizona allows a credit against premium tax liability incurred by a health care insurer that
provides health insurance to individuals or small businesses certified by the Arizona Department
of Revenue. Health insurance must be provided within 90 days after a certificate of eligibility is
provided. For health insurance coverage issued to small businesses, the amount of the tax credit
allowed is the lesser of $1,000 for coverage of a single person or $3,000 for family coverage; or
50 percent of the health insurance premium. The maximum amount of tax credits allowed to all
taxpayers is capped at $5 million per calendar year. Eligible small businesses must have been in
existence for at least one calendar year, not provided health insurance to its employees for at
least six months, and had between 2 and 25 employees during the most recent calendar year.
Arkansas
General Health Tax Incentives
P a g e | 84
Arkansas allows a deduction for self-employed health insurance expenses and an exclusion for
employer-provided health insurance for state income tax purposes.
In addition, Arkansas adopted Internal Revenue Code Sec. 106 concerning employer
contributions to an employee Medical Savings Plan and IRC Sec. 138 concerning excluding
Medicare plus MSA payments from income.
Arkansas also provides incentives for Health Savings Accounts (HSAs), which enable workers
with high deductible health insurance to make pre-tax contributions equal to the lesser of the
annual deductible or $3,000 for self-coverage ($5,950 for families) for 2009 to cover health care
costs.
Other State Health Incentives
ARHealthNet (formerly called the Arkansas Safety Net Benefit Program) is a group health
insurance program for small to medium size businesses (two to 500 employees) that have not
offered health insurance for 12 months. This is a limited benefit plan with premiums subsidized
for employees under 200 percent of the Federal poverty level. The program has employee
participation requirements. Spouses who do not have health insurance are also eligible.
California
General Health Tax Incentives
California allows a deduction for self-employed health insurance expenses and exclusion for
employer-provided health insurance for state income tax purposes.
Colorado
General Health Tax Incentives
Colorado allows a deduction for self-employed health insurance expenses and exclusion for
employer-provided health insurance for state income tax purposes. In addition, Colorado permits
employers (without regard to size) to establish Medical Savings Accounts for employees. The
maximum amount that may be contributed on a tax-free basis on behalf of an employee is $3,000
per year.
For tax years during which the state’s fiscal year ends with a qualified surplus, eligible resident
individuals can claim a Colorado income tax credit for certain health benefit plan premiums that
they pay for themselves, their spouses, or their dependents. The credit is up to $500 for certain
low-income individuals. The health benefit plan credit was not available for tax years 2002
through 2010.
P a g e | 85
Connecticut
General Health Tax Incentives
Connecticut allows a deduction for self-employed health insurance expenses and exclusion for
employer-provided health insurance for state income tax purposes.
State’s Use of Cafeteria Plans to Provide Health Insurance
Connecticut requires any employer providing health insurance benefits paid partly through
payroll deductions to offer a cafeteria plan, effective October 1, 2007.
Delaware
Delaware allows a deduction for self-employed health insurance expenses and exclusion for
employer-provided health insurance for state income tax purposes.
District of Columbia
General Health Tax Incentives
The District of Columbia allows a deduction for self-employed health insurance expenses and an
exclusion for employer-provided health insurance for state income tax purposes.
Florida
State’s Use of Cafeteria Plans to Provide Health Insurance
The Cover Florida Health Care Access Program, enacted in May 2008, requires that employers
who voluntarily choose to participate in the program comply with certain requirements,
including establishing a cafeteria plan, Flexible Spending Arrangement or both.
Georgia
General Health Tax Incentives
Georgia allows a deduction for self-employed health insurance expenses and exclusion for
employer-provided health insurance for state income tax purposes. Georgia provides tax
incentives to encourage high deductible health plans (HDHPs). Individuals are permitted to
deduct premium costs paid for HDHPs. In addition, Georgia provides a specific tax incentive
related to HDHPs for small businesses.
P a g e | 86
Small Business Tax Incentives
Georgia provides a nonrefundable tax credit for small employer high-deductible health plans up
to $250 per year per enrolled employee. The credit is available for employers with 1 to 50
employees that make a HDHP available to employees. Employees must be enrolled in the plan
for 12 consecutive months. The tax credit was effective beginning in 2009.
Hawaii
General Health Tax Incentives
Hawaii allows a deduction for self-employed health insurance expenses and exclusion for
employer-provided health insurance for state income tax purposes.
Other State Health Provisions
The Hawaii Prepaid Health Care Act requires all Hawaii businesses to provide health insurance
to employees who work at least 20 hours per week for four consecutive weeks. 85
Idaho
General Health Tax Incentives
Idaho allows a deduction for self-employed health insurance expenses and exclusion for
employer-provided health insurance for state income tax purposes.
Small Business Tax Incentives
Idaho provides a credit for employer-provided health insurance. The credit is available for any
taxable year during which the number of new employees increases above the average
employment of the firm in prior years. A $1,000 credit is permitted for each new employee who,
in the calendar year ending during the taxable year for which the credit is claimed, received
annual earnings at an average rate of $15.50 or more per hour and was eligible for employerprovided accident or health coverage. A $500 credit is permitted per new employee who does
not meet the $1,000 criteria, but who is employed in a revenue-producing enterprise.
The total credit allowed cannot exceed 3.25 percent of net income from the taxpayer’s revenueproducing enterprise in which the employment occurred. The amount of this and all other
permissible tax credits cannot exceed 50 percent of the taxpayer’s tax liability. Any tax credit
can be carried over to the three succeeding taxable years.
85
Although the Employee Retirement Income Security Act of 1974 (ERISA) generally preempts any state laws
relating to the regulation of employer health insurance plans, Hawaii received a statutory exception from ERISA for
its state mandate.
P a g e | 87
Illinois
General Health Tax Incentives
Illinois allows a deduction for self-employed health insurance expenses and exclusion for
employer-provided health insurance for state income tax purposes. In addition, Illinois adopted
Medical Savings Account provisions similar to Federal law.
Indiana
General Health Tax Incentives
Indiana allows a deduction for self-employed health insurance expenses and exclusion for
employer-provided health insurance for state income tax purposes. In addition, Indiana allows a
deduction for contributions to Health Savings Accounts, and contributions to Archer MSAs for
state individual income tax purposes.
Indiana provides a tax credit for new employer-provided health insurance, effective January 1,
2007. The credit is available to pass-through entities such as partnerships and S corporations.
The credit applies to section 125 cafeteria plans. The credit is the lesser of $50 per enrolled
employee per year or $2,500 for two years. The employer must not have provided insurance for
one year prior to claiming the credit and must offer insurance to eligible employees (those who
work at least 30 hours per week) and their dependents. This credit was effective January 2008.
Small Business Tax Incentives
Indiana provides a small employer wellness tax credit program. The credit is available to S
corporations and partnerships. This credit allows employers with 2 to 100 employees to claim a
tax credit for 50 percent of the costs incurred in a given year for providing qualified wellness
programs to their employees. This provision was enacted in 2007.
Iowa
General Health Tax Incentives
Iowa allows an exclusion for employer-provided health insurance for state income tax purposes.
In addition, Iowa allows individuals (including self-employed individuals) to deduct 100 percent
of the amount paid for health and dental insurance premiums. The deduction is not available
with respect to health insurance premiums paid on a pretax basis. Iowa allows taxpayers to
claim the Health Savings Account deduction from their Federal individual income tax return.
P a g e | 88
State’s Use of Cafeteria Plans to Provide Health Insurance
Iowa enacted a law in 2008 that requires the Commissioner of Insurance to assist employers with
25 or fewer employees to implement and administer a cafeteria plan including medical expense
reimbursement accounts. The law also mandates a study of the ramifications of requiring
employers with at least 10 employees to adopt and maintain a cafeteria plan.
Kansas
General Health Tax Incentives
Kansas allows a deduction for self-employed health insurance expenses and exclusion for
employer-provided health insurance for state income tax purposes. It also allows a deduction for
contributions to Health Savings Account deduction for individual income tax purposes.
State’s Use of Cafeteria Plans to Provide Health Insurance
Kansas passed a law in 2008 requiring all insurers to offer premium-only cafeteria plans. In
2007, Kansas appropriated $150,000 toward a small employer cafeteria plan development fund.
Small Business Tax Incentives
Kansas provides a refundable small employer health insurance credit. The employer must have
established a small employer health benefit plan or made contributions to a Health Savings
Account of an eligible employee after December 31, 2004. The employer must not have
contributed within the 2 years prior to claiming the credit to any health insurance premium or
Health Savings Account on behalf of an eligible employee. Eligible employees must work at
least 30 hours per week. The credit equals $70 per month per enrolled employee; the credit
amount decreases for each year of the credit ($70, $50, $35) for a maximum of three years.
For employers that established a small employer health benefit plan after December 1, 1999, and
before January 1, 2005, the amount of the credit was $35 per month per eligible covered
employee or 50 percent of the total paid by the employer during the tax year, whichever is less,
for the first two years of participation. The credit decreases to 75 percent of this amount in the
third year, 50 percent in the fourth year, and 25 percent in the fifth year. No credit is allowed
after the fifth year. Taxpayers claiming the credit must reduce the amount of the deduction for
related expenses by the amount of the credit.
Kentucky
General Health Tax Incentives
Kentucky allows an exclusion for employer-provided health insurance for state income tax
purposes. Kentucky allows individuals, including self-employed individuals, to deduct from
gross income 100 percent of medical and dental insurance premiums paid with after-tax dollars.
P a g e | 89
Other State Health Incentives
The Insurance Coverage, Affordability and Relief to Employers (ICARE) program provides a
subsidy (decreasing for each year in the program) of $40 to $60 per employee per month to small
businesses that pay at least 50 percent of the premium for health insurance, have been uninsured
for at least 12 months, and have average employee wages below 300 percent of the Federal
poverty level. A small business is one with two to 25 employees.
Louisiana
General Health Tax Incentives
Louisiana allows a deduction for self-employed health insurance expenses and exclusion for
employer-provided health insurance for state income tax purposes.
Maine
General Health Tax Incentives
Maine allows a deduction for self-employed health insurance expenses and exclusion for
employer-provided health insurance for state income tax purposes.
Small Business Tax Incentives
Maine provides a tax credit for small employer health plans. The credit was the lesser of 20
percent of dependent health benefits paid or $125 per year per enrolled low-income employee
with dependent coverage. Credit may not exceed 50 percent of the state income liability. The
employer can claim the credit for low-income employees who work at least 30 hours per week or
1,000 hours per year. The employer must provide health insurance for dependents of lowincome employees. The employer must have no more than five employees and meet
contribution requirements. There is no duration limit; the credit is nonrefundable. The credit
was implemented in 2001.
Other State Health Incentives
Maine’s DirigoChoice covers small businesses with two to 50 employees, self-employed
individuals, and other individuals. Small business employers and self-employed individuals
must contribute 60 percent of the cost of health insurance premiums to be eligible for the
premium assistance subsidy. DirigoChoice is currently open only for small employers.
Maryland
General Health Tax Incentives
Maryland allows a deduction for self-employed health insurance expenses and exclusion for
employer-provided health insurance for state income tax purposes. In addition, Maryland
P a g e | 90
excludes contributions to Health Savings Account from income for purposes of the individual
income tax.
Other State Health Incentives
The Working Families and Small Business Health Coverage Act offers subsidies to small
businesses with two to nine employees and an average wage below $50,000 of up to 50 percent
of the premium cost for health insurance. The maximum subsidy per employee depends on the
health insurance coverage chosen and the average annual wage for the business. Any planned
employer contribution to an employee’s Health Savings Account is treated as an additional
employer premium contribution in calculating the premium subsidy. The employer cannot have
offered health insurance to employees in the previous 12 months. This program took effect
October 1, 2008. The subsidy is shared between the employer and each employee based on the
share of the premium that each contributes. Those employers that join are required to offer a
cafeteria plan to their employees. Enrollment in the program is capped to stay within a budget of
$15 million.
Massachusetts
General Health Tax Incentives
Massachusetts allows an exclusion for employer-provided health insurance for state income tax
purposes and a deduction for self-employed health insurance. The Massachusetts Health Care
Reform Act requires most adults age 18 and over with access to affordable health insurance to
purchase it. If an individual fails to comply with this requirement, the penalties are imposed on
the individual’s personal income tax return and shall not exceed 50 percent of the minimum
monthly insurance premium for which an individual would have qualified. The penalties only
apply to adults who are deemed able to afford health insurance.
State’s Use of Cafeteria Plans to Provide Health Insurance
Beginning in 2007, Massachusetts became the first state to require all employers with 11 or more
employees to offer at least a premium-only cafeteria plan. This provision was one of the primary
employer responsibilities in a larger universal health plan. Employers must make a “fair and
reasonable” contribution toward an employee health plan or pay a state assessment of up to $295
per employee, per year.
Other State Health Incentives
The Insurance Partnerships in Massachusetts offers premium assistance for small businesses with
two to 50 employees that have not offered health insurance in the past six months, will have an
employer contribution toward the premiums of at least 50 percent, and have at least one
employee who earns below 300 percent of the Federal poverty level.
Michigan
P a g e | 91
General Health Tax Incentives
Michigan allows a deduction for self-employed health insurance expenses and exclusion for
employer-provided health insurance for state income tax purposes.
Minnesota
General Health Tax Incentives
Minnesota allows a deduction for self-employed health insurance expenses and exclusion for
employer-provided health insurance for state income tax purposes.
A nonrefundable credit is provided equal to 20 percent of the health insurance premiums paid
during the first 12 months of participation in a cafeteria plan for health care. This credit is
allowed only for individuals who did not have health care coverage for the previous 12 months
and whose household income falls below the eligible range.
State’s Use of Cafeteria Plans to Provide Health Insurance
Effective July 2009, Minnesota requires employers with 11 or more employees who do not offer
health insurance to establish a cafeteria plan. The employer is not required to establish a health
plan or contribute to the cafeteria plan and employees can opt out of participation. Employers
may “opt out” of this requirement by certifying to the Commissioner of Commerce that they
have received education and information on the advantages of cafeteria plans and have chosen
not to establish such a plan.
Other State Health Incentives
Minnesota offers grants of up to $350 to certain small employers (with 2 to 50 employees) that
establish cafeteria plans to help offset the costs of setting up the plan.
Mississippi
General Health Tax Incentives
Mississippi allows a deduction for self-employed health insurance expenses and exclusion for
employer-provided health insurance for state income tax purposes. In addition, Mississippi
allows a deduction for contributions to Health Savings Accounts.
Missouri
General Health Tax Incentives
Missouri allows a deduction for self-employed health insurance expenses and exclusion for
employer-provided health insurance for state income tax purposes.
P a g e | 92
State’s Use of Cafeteria Plans to Provide Health Insurance
Effective January 1, 2008, Missouri requires all employers with health insurance plans (other
than self-insured plans) and that pay a portion of the premiums to offer a cafeteria plan to
employees.
Small Business Tax Incentives
Missouri provides a self-employed health insurance tax credit. Effective August 28, 2007, a selfemployed taxpayer who is otherwise ineligible for the health insurance deduction allowed under
IRC section 162 is allowed a personal income tax credit for the federal tax paid on amounts that
the taxpayer has paid for self-employed health insurance. The credit allowed is equal to the
portion of the taxpayer’s federal tax liability incurred as a result of the taxpayer’s inclusion of
such amounts in federal adjusted gross income. To the extent that the allowable credit exceeds
the taxpayer’s state income tax liability, the excess will be considered an overpayment of tax and
will be refunded. The credit is not transferable.
Montana
General Health Tax Incentives
Montana allows a deduction for self-employed health insurance expenses and exclusion for
employer-provided health insurance for state income tax purposes. Montana also allows a
deduction for contributions to Health Savings Accounts for state tax purposes. Shareholders in S
corporations are allowed to deduct the cost of health insurance premiums for state tax purposes.
Montana provides an exemption from state income tax for deposits made into a Montana
Medical Savings Account. Annual exclusion from gross income is permitted for up to $3,000 of
contributions plus accumulated interest and other earnings. For married couple filing a joint
return, exclusion is $3,000 per spouse.
Small Business Tax Incentives
Montana provides a nonrefundable credit for small business employers (Health Insurance for
Uninsured Montanans Credit). To qualify for this credit, the employer must have been in
business in Montana for at least 12 months, must employ 20 or fewer employees who work at
least 20 hours per week, and must pay at least 50 percent of each Montana employee’s insurance
premium. The credit is only available for three years. The tax credit is limited to a maximum of
10 employees and equals 50 percent of the percentage of employer premiums paid times $25 per
month per covered employee.
A separate credit is also available (Insure Montana Small Business Health Insurance Credit).
Beginning in 2006, a refundable tax credit is available against corporation license (income) tax
as part of a program established to provide small businesses with assistance in paying for group
health insurance. An eligible employer that does not receive premium assistance payments or
premium incentive payments through the small business health insurance pool may claim a credit
P a g e | 93
of not more than $100 each month for each employee and $100 each month for each employee’s
spouse (if the employer covers the spouse), if the average age of the group is 45 years of age or
older; and not more than $40 each month for each covered dependent, not to exceed two
dependents of an employee in addition to the employee’s spouse. An employer may not claim a
credit in excess of 50 percent of the total premiums paid by the employer for the qualifying small
groups, for premiums paid from a Medical Savings Account, or for premiums for which a
deduction is claimed in computing corporation license or personal income tax. If an eligible
employer’s tax credit exceeds the employer’s corporation license or personal income tax
liability, the excess amount must be refunded. Eligible small employers proposing to apply for a
tax credit must be registered each year with the Commissioner.
As of January 2009, both the small business tax credit and the purchasing pool programs were at
full capacity because of limited funding. Small businesses applying for either program are being
put on a waiting list. The program is funded through increases in Montana’s tobacco tax.
Other State Health Incentives
Beginning in 2005, Insure Montana offers assistance to small businesses with two to nine
employees currently not offering insurance. These businesses can receive monthly assistance
payments amounting to roughly $100 per employee for both the employer’s and the employee’s
portion of the health insurance premium. To be eligible, the business can have no employee who
earns more than $75,000, other than the owner of the business.
Nebraska
General Health Tax Incentives
Nebraska allows a deduction for self-employed health insurance expenses and exclusion for
employer-provided health insurance for state income tax purposes. Nebraska also allows a
deduction for contributions to Health Savings Accounts for state tax purposes.
Nevada
Other State Health Incentives
Nevada Check Up Plus provides premium assistance to parents or guardians with income below
200 percent of the Federal poverty level or those whose children are eligible for Medicaid or
Nevada Check Up. To qualify, the parents must work for a small employer (with two to 50
employees) with an employer contribution of at least 50 percent of health care premiums. The
program provides premium assistance up to $100 per month per parent.
P a g e | 94
New Hampshire
Other State Health Incentives
New Hampshire has enacted HealthFirst, which requires major insurance carriers to offer a
standard wellness plan to businesses with up to 50 employees. The target premium is 10 percent
of the prior year’s median wage, about $262 per month in 2008.
New Jersey
General Health Tax Incentives
New Jersey permits a deduction for medical expenses, qualified Archer Medical Savings
Account contributions (following Federal rules), and health insurance costs of the self-employed.
Other State Health Incentives
New Jersey has a small employer health benefits program to ensure that small employers have
access to small group health benefits plans. A small employer is defined as one that employs an
average of at least two, but not more than 50 eligible employees on business days during the
preceding calendar year. Eligible employees are those who work at least 25 hours per week. At
least 75 percent of a small employer’s eligible employees must participate in coverage. The
small employer is required to pay 10 percent of the total cost of the health benefits plan.
New Mexico
General Health Tax Incentives
New Mexico allows a deduction for self-employed health insurance expenses for state individual
income tax purposes. New Mexico allows a deduction for individual income tax purposes for
medical expenses not included in itemized deductions for Federal return, including unreimbursed
and uncompensated medical care expenses. Reimbursed and compensated insurance premiums
like those paid with pre-tax dollars under cafeteria and similar benefit plans are not eligible for
the deduction.
Other State Health Incentives
New Mexico provides a premium assistance program (State Coverage Insurance) for individuals
with income below 200 percent of the Federal poverty level. The program applies to health
insurance offered by small businesses with no more than 50 employees and that have not offered
health insurance in at least 12 months. The program sets guidelines for the employer and
employee contributions based on the employee income. The program has currently reached its
maximum enrollment and, as of December 19, 2009, all employer group applicants were being
placed on a waiting list.
P a g e | 95
New York
General Health Tax Incentives
New York allows a deduction for self-employed health insurance expenses and exclusion for
employer-provided health insurance for state income tax purposes.
Other State Health Incentives
Healthy NY, a subsidized reinsurance pool, provides lower cost health insurance for low-income
individuals and small businesses (with 50 or fewer employees) that meet specific eligibility
criteria concerning low-income employees. The small business must not have provided health
insurance to employees in the last 12 months. At least 30 percent of the firm’s employees must
earn $40,000 or less in annual wages (adjusted for inflation). In order to participate in the
program, employers must contribute at least 50 percent of the employees’ premiums, certify that
at least 50 percent of employees offered health insurance will accept it or have health insurance
through another source, and must offer health insurance to all employees who work at least 20
hours per week and earn $40,000 per year or less. Healthy NY offers a high deductible health
plan that qualifies to be used with a Health Savings Account.
North Carolina
General Health Tax Incentives
North Carolina allows a deduction for self-employed health insurance expenses and exclusion for
employer-provided health insurance for state income tax purposes.
Small Business Tax Incentives
Effective for the 2007, 2008, and 2009 tax years, small businesses with no more than 25
employees are eligible to claim a small business health insurance credit against North Carolina
corporate or personal income tax or corporation franchise tax if they provide health benefits to
all eligible employees. For purposes of the credit, a taxpayer provides health benefits if it pays at
least 50 percent of the premiums for health care coverage that equals or exceeds the minimum
provisions of the basic health care plan of coverage recommended by the Small Employer
Carrier Committee or if its employees have qualifying existing coverage. The credit may only be
claimed for health insurance premiums paid for eligible employees whose total annual wages
received from the business do not exceed $40,000. The credit is equal to the lesser of $250 or
the costs incurred. Taxpayers must make an irrevocable election regarding the tax against which
the credit will be claimed when filing the return on which the first credit installment is claimed.
Any carry forward of a credit must be claimed against the same tax. All Article 3B credits,
including carryovers, may not exceed 50 percent of the tax against which they are claimed for
the taxable year. Unused credit may be carried over for five years. The credit expires for taxable
years beginning on or after January 1, 2010.
P a g e | 96
North Dakota
General Health Tax Incentives
North Dakota allows a deduction for self-employed health insurance expenses and exclusion for
employer-provided health insurance for state income tax purposes.
Ohio
General Health Tax Incentives
Ohio allows a deduction for self-employed health insurance expenses and exclusion for
employer-provided health insurance for state income tax purposes. Ohio also allows a deduction
for (1) unsubsidized health care insurance premiums and excess health care expenses, and (2)
contributions (up to $4,197 for 2009) to, and earnings of, a Medical Savings Account.
Oklahoma
General Health Tax Incentives
Oklahoma allows a deduction for self-employed health insurance expenses and exclusion for
employer-provided health insurance for state income tax purposes. An exemption from income
for state tax purposes is provided for contributions to, and interest earned on, an Oklahoma
Medical Savings Account and for contributions to, and interest earned on, an Oklahoma Health
Savings Account.
Small Business Tax Incentives
Oklahoma offers a refundable tax credit for employers in basic health plans. The credit is $15
per month per employee for up to 2 years. An employer is eligible if the employer (1) has done
business in Oklahoma for at least one year, (2) has not provided group health insurance in the
previous 15 months, (3) offers a state-certified basic health benefit plan to all eligible employees,
and (4) pays 50 percent of the premium for the employee. An eligible employee is one who
works an average of 24 hours per week or more for the employer and was not covered by a group
health insurance policy within the 15 months preceding the offer to purchase health insurance.
Other State Health Incentives
Oklahoma pays a portion of health plan premiums for eligible employees through its Insure
Oklahoma program. This program is offered to businesses with two to 99 employees (but the
program may be extended to employers with up to 250 full-time employees). As of September
2008 the program had approximately 10,000 employees enrolled and uses competition among
private insurance carriers to keep costs as low as possible. To participate, employees must meet
income guidelines (250 percent of the Federal poverty level) and must contribute up to 15
percent of premium costs. The business must offer a qualified health plan and contribute at least
P a g e | 97
25 percent of employee premiums. The state pays 60 percent of the insurance costs and the
employee pays the remaining 15 percent.
Oregon
General Health Tax Incentives
Oregon allows a deduction for self-employed health insurance expenses and exclusion for
employer-provided health insurance for state income tax purposes. In addition, Oregon provides
a special medical deduction for taxpayers age 62 or older.
Other State Health Incentives
Oregon provides rules regulating the sale of health insurance to employers with two to 50
employees, which require insurance companies to sell to small employers irrespective of their
employees’ health and using the same rate-setting factors for all small employer groups.
Employers who purchase these plans must offer health insurance to all employees who meet
minimum service requirements. Insurers may require employers to contribute up to 100 percent
of the cost of the health insurance.
Pennsylvania
General Health Tax Incentives
Pennsylvania allows a deduction for self-employed health insurance expenses and exclusion for
employer-provided health insurance for state income tax purposes. Pennsylvania also allows
deductions for personal income tax purposes for Medical Savings Account contributions and
Health Savings Account contributions.
Rhode Island
General Health Tax Incentives
Rhode Island allows a deduction for self-employed health insurance expenses and exclusion for
employer-provided health insurance for state income tax purposes.
State’s Use of Cafeteria Plans to Provide Health Insurance
In 2007, Rhode Island became the first state to require employers (with 25 or more employees)
to offer employees the opportunity to purchase health insurance with pre-tax income (a “standalone” cafeteria plan). Neither the state nor employers are required to contribute to the purchase
price, but the state estimated premium savings of up to 40 percent depending upon an
employee’s tax bracket. The plan was implemented in July 2009.
Other State Health Incentives
P a g e | 98
Rhode Island offers small businesses an affordable product that emphasizes healthier lifestyles.
This program offers lower-premium and lower-deductible health insurance through the small
group market to businesses of 50 or fewer employees whose workers agree to abide by five
preventive health behaviors: complete a health risk assessment; select a primary care physician;
pledge to remain at a healthy weight or participate in weight management programs, if morbidly
obese; pledge to remain smoke free or participate in smoking cessation programs; and pledge to
participate in disease management programs if applicable. Members who opt for these plans
participate in regular assessments. If they do not comply with the requirements, their deductibles
are increased to non-discounted levels. The programs premiums are about 15 percent to 20
percent lower than comparable plans. Enrollment is limited to 5,000 individuals per insurer with
three insurer’s offering insurance.
South Carolina
General Health Tax Incentives
South Carolina allows a deduction for self-employed health insurance expenses and exclusion for
employer-provided health insurance for state income tax purposes.
Individuals are provided a nonrefundable credit for replacement health insurance coverage.
Individuals who held a health insurance policy with an insurer that withdrew from writing
policies in South Carolina and, as a result, were assigned to the South Carolina Health Insurance
Pool, are entitled to a credit for 50 percent of the premium costs paid during a year for health
insurance coverage. The credit cannot exceed $3,000 for each qualifying person covered.
South Dakota
South Dakota does not offer any tax incentives.
Tennessee
General Health Tax Incentives
Tennessee allows a deduction for self-employed health insurance expenses and exclusion for
employer-provided health insurance for state income tax purposes.
State’s Use of Cafeteria Plans to Provide Health Insurance
Tennessee enacted a law that provides that any employer that has implemented a cafeteria plan
must arrange for employee health insurance premiums and dental insurance premiums to be
automatically paid through the cafeteria plan beginning January 1, 2008.
P a g e | 99
Other State Health Incentives
Cover Tennessee (CoverTN) is a partnership between the state, employers, and individuals to
offer small businesses guaranteed, affordable basic health coverage. The state, the employer and
the employee each pay one-third of premium costs, which vary depending on the age, smoking
status and weight of the employee. Monthly premiums vary from $37 to $109. Plans focus on a
basic benefit package and encourage regular doctor visits and preventive screenings. The plans
do not have an out-of-pocket maximum. The insurance is portable, so members can continue
with the same insurance plan even if their place of employment changes. To be eligible, small
businesses must have 25 or fewer full-time employees and half of the workforce must make less
than 250 percent of the Federal poverty level. Effective December 1, 2009, CoverTN has been
suspended until further notice because the state reached its budget capacity.
Texas
Other State Health Incentives
Texas law allows insurance companies to sell a wide array of small employer health care
coverage plans and packages. The term “small employer” means a business with two to 50
eligible employees. The law provides these businesses added protections, including a 15 percent
annual cap on rate increases related to health factors, a guarantee that carriers cannot arbitrarily
discontinue coverage, and a provision that allows small employers to pool their purchasing clout
to negotiate lower insurance rates. For employees of small businesses, the law provides several
ways to maintain benefits after leaving a job and limits the waiting period before a health plan
will cover pre-existing conditions. Beyond these requirements, small-employer carriers may
offer a wide variety of plans, with virtually any combination of features and benefits.
Utah
General Health Tax Incentives
Utah allows a deduction for self-employed health insurance expenses and exclusion for
employer-provided health insurance for state income tax purposes. Under Utah law, individuals
may claim a credit of 5 percent of the amount paid for a health benefit plan only if the individual,
spouse, or dependent is not insured under a health benefit plan maintained by an employer. The
credit is not available for amounts that are excluded from income for Federal tax purposes. The
maximum credit is $300 per individual.
A credit is allowed for Utah individual income tax for contributions to Medical Savings
Accounts that were not deducted on the individual’s Federal income tax return.
State’s Use of Cafeteria Plans to Provide Health Insurance
An employer that chooses to establish a defined contribution arrangement to provide a health
benefit plan for employees is required to provide a pre-tax contribution including a cafeteria
plan.
P a g e | 100
Other State Health Incentives
Utah established the Utah Health Insurance Exchange, which allows small employers with up to
50 employees to buy a choice of health insurance policies.
Vermont
General Health Tax Incentives
Vermont allows a deduction for self-employed health insurance expenses and an exclusion for
employer-provided health insurance for state income tax purposes. In addition, Vermont allows
a deduction for contributions to Health Savings Accounts for state individual income tax
purposes.
Other State Health Incentives
Vermont imposes an employer assessment (fee) for every full-time equivalent employee who is
either not offered health insurance or is not enrolled in offered insurance and is uninsured. The
first eight qualifying full-time equivalent employees are exempt from the assessment in 2007 and
2008, first six in 2009, and first four in 2010 and thereafter. The assessment is based on FTEs at
the rate of $102.20 per quarter ($404.80 per year). The assessment rate will increase annually,
based upon premium growth.
Virginia
General Health Tax Incentives
Virginia allows a deduction for self-employed health insurance expenses and exclusion for
employer-provided health insurance for state income tax purposes.
Washington
State’s Use of Cafeteria Plans to Provide Health Insurance
Under the Health Insurance Partnership (HIP), participating small business employers are
required to offer a cafeteria plan. The state-run partnership provides cafeteria plan “technical
assistance” to small employers.
P a g e | 101
Other State Health Incentives
The HIP combines contributions from small employers, employees and the State of Washington
to make small group health insurance coverage affordable for employees. The program offers a
premium subsidy to eligible employees, based on their family income. Eligible small employers
are those with two to 50 employees, the majority of whose employees earn no more than $10 per
hour, and which does not currently offer health insurance to its employees. Budget constraints
delayed program implementation, but a Federal grant allowed the state to resume work on the
program and it is expected to be operational on September 1, 2010.
West Virginia
General Health Tax Incentives
West Virginia allows a deduction for self-employed health insurance expenses and exclusion for
employer-provided health insurance for state income tax purposes. In addition, West Virginia
allows a deduction for corporate income tax purposes for employer contributions to Medical
Savings Accounts included in Federal taxable income. The amount of the deduction may not
exceed the maximum amount that would have been deductible from the corporation’s Federal
taxable income if the aggregate amount of the contributions to individual Medical Savings
Accounts were permitted under Federal law.
West Virginia offers an Economic Opportunity Tax Credit for Jobs Creation. An employer in an
eligible industry (manufacturing, warehousing, information processing, goods distribution,
destination tourism, and research and development) creating less than 20 new jobs for a regular
employer and less than 10 new jobs for a qualified small business is eligible for an annual credit
of $3,000 per new employee for five years. The new jobs must be full-time, pay a minimum
salary of $32,000, and offer health benefits. The credit is first applied to the business and
occupation tax, then the business franchise tax, the corporation net income tax, and the personal
income tax.
Other State Health Incentives
West Virginia allows small businesses to tap into the purchasing power of the Public Employees
Insurance Agency (PEIA) through a public/private partnership with insurance companies. This
program saves money by allowing private insurance carriers’ access to PEIA physician and
provider reimbursement rates, with the insurance carriers assuming risk and taking smaller
administrative fees but potentially gaining more small business customers. Eligible employers
must have two to 50 employees, been without a company-sponsored health insurance plan for at
least 12 months, been in operation for at least one year, and have a minimum of 75 percent of
eligible employees sign up for the plan; the employer must pay at least 50 percent of the cost of
individual coverage. Premiums costs in West Virginia’s program are 17 to 22 percent lower than
the usual market rate for small businesses.
P a g e | 102
Wisconsin
General Health Tax Incentives
Wisconsin allows a deduction for self-employed health insurance expenses and an exclusion for
employer-provided health insurance for state income tax purposes. Wisconsin does not allow
individuals to claim deductions for contributions to Health Savings Accounts.
Wisconsin allows a deduction for all or a portion of the amount paid by an individual taxpayer
for medical care insurance, but the individual cannot include amounts not included in gross
income, such as contributions to a cafeteria plan or flexible spending arrangement.
Wyoming
No special tax or special health insurance incentives.
P a g e | 103
APPENDIX D – SOURCES OF DATA RELATING TO
HEALTH INSURANCE ACCESS AND COVERAGE
IN THE UNITED STATES
A variety of data sources provide information on health insurance access and coverage in the
United States. The data sources often provide different ways to examine the issue relating to
health insurance coverage and medical care in general. Thus, each data source offers a different
way of looking at the issue of health care access and coverage in the United States. However, it
is important to understand both the benefits of, and limitations to, each data source. This
appendix provides a brief overview of some of the primary data sources utilized in this paper.
Current Population Survey
The Current Population Survey (CPS) is a monthly survey of approximately 50,000 households
in the United States. The Bureau of the Census and the Bureau of Labor Statistics (BLS) jointly
conduct the CPS. This survey is the primary source of information on the labor force
characteristics of the U.S. population, including employment, unemployment, earnings, and
hours of employment. Supplemental questions produce estimates relating to income, previous
work experience, school enrollment, employee benefits, and other issues.
The Annual Social and Economic Supplement (ASEC) to the CPS asks questions about health
insurance coverage during the prior calendar year. 86 The survey asks questions about the various
types of possible health insurance coverage, private or government. For this purpose, private
health insurance includes a plan provided through an employer or union (employment-based
coverage) or purchased by an individual from a private company (direct purchase). Government
health insurance includes coverage under Federal programs, such as Medicare, Medicaid,
military health care, the Children’s Health Insurance Program (SCHIP), and individual state
health plans. If the individual answers no to each of the coverage questions, the survey then asks
the individual to verify that the household was not, in fact, covered by health insurance during
the prior year. The survey classifies people as “covered” by health insurance if they had any
coverage for all or part of the preceding year. Thus, under this survey, people are treated as
uninsured only if they do not report any type of health insurance coverage during the entire prior
calendar year.
However, research shows that survey respondents tend to underreport health insurance coverage
trends in the CPS ASEC. People may forget health insurance coverage that they had at a point in
time during the prior year, because of the time difference between having coverage and
conducting the survey. 87 Further, some people may report their health insurance coverage at the
time of the interview, rather than reporting their coverage during the prior year. Compared with
other health insurance surveys, the CPS ASEC estimates of the number of people without health
86
DeNavas- Walt, Carmen, Bernadette D. Proctor, and Jessica C. Smith. U.S. Census Bureau, Current Population
Reports, P60-236, Income, Poverty, and Health Insurance Coverage in the United States: 2008. U.S. Government
Printing Office, Washington, DC, September 2009.
87
The CPS collects responses in February and April of the following year. Therefore, a year or more may pass from
the time of coverage and the survey.
P a g e | 104
insurance tend to approximate the number of people who were uninsured at a specific time
during the year rather than the people who were without health insurance for the entire year.
Medical Expenditure Panel Survey
Beginning in 1996, the Medical Expenditure Panel Survey (MEPS) is a set of large-scale surveys
of families and individuals, their medical providers, and employers in the United States
conducted by the United States Department of Health and Human Services, Agency for
Healthcare Research and Quality. 88 There are two major components to the MEPS – the
Household Component and the Insurance Component, as well as smaller components, including
the Medical Provider Component and the Nursing Home Component. This research uses data
from the Medical Expenditure Panel Survey – Insurance Component (MEPS-IC).
The MEPS-IC is an annual survey of establishments that collects information concerning the
offering of employment-based health insurance in the United States. 89 This survey relies on a
nationally representative sample of employers developed from Census Bureau data. Survey data
are collected at the establishment level, which is defined as a particular workplace or physical
location here business is conducted or services or industrial operations are performed. A firm is
a business entity consisting of one or more establishments. In the case of a single location firm,
the firm and the establishment are identical. The survey data are collected during the year for
which the data are relevant and published the following year.
The MEPS-IC survey data compiles estimates (by firm size, by industry, and by establishment
characteristics) that provide the following information:
▪ Establishment-based data such as the percent of establishments that offer health
insurance;
▪ Employee-based data, such as the percent of employees that enroll in health insurance
plans;
▪ Total premiums and employee contributions for premiums, including averages and
percentile distributions; and
▪ Deductibles and copayments for enrollees.
While the MEPS-IC data are collected and presented at the establishment level, establishments
are categorized for size purposes based on the size of the firm of which an establishment is a
part. This approach allows a small establishment that is part of a large national chain to be
categorized as part of a large firm.
In addition to national estimates, the MEPS-IC sample has been large enough since 2003 to
permit estimates for all 50 states and the District of Columbia. In 1996, estimates were made for
the most populous 40 states. From 1997-2002, estimates were done for the 20 least populated
88
MEPS Insurance Component: Technical Notes and Survey Documentation. Agency for Healthcare Research and Quality,
Rockville, Md. http://www.meps.ahrq.gov/survey_comp/ic_technical_notes.shtml.
89
MEPS Insurance Component: Technical Notes and Survey Documentation. U.S. Department of Health and
Human Services, Agency for Healthcare Research and Quality, Medical Expenditure Panel Survey.
http://www.meps.ahrq.gov/mepsweb/survey_comp/ic_technical_notes.shtml.
P a g e | 105
states on a rotating basis. Table D1 shows the smaller states for which estimates are not
available for 1996-2002.
In addition, since 2002, the MEPS-IC sample and design supports a limited number of privatesector metropolitan-level estimates.
Table D1 – States with Smaller Populations for Which MEPS-IC Estimates are Not
Available, 1996–2002
Note: An x indicates that State-level estimates are available for that year;
a blank indicates that there are no estimates for that year.
State
1996
Alaska
Arkansas
1997
1999
x
x
x
x
x
x
x
Maine
x
x
x
Mississippi
x
x
x
x
Montana
Nevada
x
x
x
New Hampshire
x
x
x
x
x
**
x
x
x*
x
x
x
x
x
x
x
x
x
x
**
x
x
x
Rhode Island
x
x
South Dakota
x
x
x
Vermont
x
x
**
x
x
x
x
x
x
x
** States received an additional sample that supported estimates for smaller firms only.
x
x*
* States received an additional sample that supported a full set of state estimates not otherwise possible.
P a g e | 106
x*
x*
x
North Dakota
Wyoming
x
x
x
x
x
Kansas
West Virginia
x
x*
x
Nebraska
2002
x
x
Idaho
Utah
x
x
x
2001
x
x
District of Columbia
New Mexico
2000
x
Delaware
Hawaii
1998
x
x
Survey of Income and Program Participation
The Survey of Income and Program Participation (SIPP) is a continuous series of national panel
surveys conducted by the U.S. Census Bureau. The SIPP has sample sizes of 14,000 to 36,700
U.S. households. The purpose of the SIPP is to collect information on the source and amount of
income, labor force information, program participation and eligibility, and general demographic
characteristics.
The SIPP is a longitudinal survey that collects information on topics such as poverty, income,
employment and health insurance coverage. Like the CPS, the SIPP is a household survey.
Because the SIPP uses different sample sizes, interview techniques, sample compositions, and
survey reference periods than the CPS, the two surveys produce varying estimates of health
insurance coverage. For example, the SIPP collects information monthly whereas the CPS
ASEC is collected once per calendar year several months following the end of the year. Some
researchers believe that the CPS estimates are more useful as a point-in-time estimate, whereas
the SIPP produces a more accurate annual estimate. 90
Kaiser Family Foundation Annual Survey of Employer Health Benefits
The Kaiser Family Foundation and the Health Research and Educational Trust (HRET) (a
nonprofit research organization that is an affiliate of the American Hospital Association) conduct
an annual survey of employer-sponsored health benefits. 91 The 2009 survey was conducted
between March and May of 2009 and included 3,199 randomly selected private and public firms
with three or more employees (2,054 firms responded to the full survey and an additional 1,134
firms responded to a question concerning the offering of health insurance). The survey contains
as many as 400 questions. The sample strata are by industry and number of workers in the firm.
In identifying firms for the sample, the survey attempts to repeat interviews with prior years’
survey respondents who had at least 10 employees and who had participated in either the 2007 or
2008 survey.
The Kaiser/HRET survey asks questions relating to the:
▪ costs of health insurance,
▪ health benefits access rates,
▪ employee coverage, eligibility, and participation,
▪ types of plans offered,
▪ market shares of health plans,
▪ employee and employer contributions for premiums,
▪ employee cost sharing,
▪ high-deductible health plans with savings option,
▪ prescription drug benefits,
▪ plan funding,
90
Bhandari Shailesh, "People with Health Insurance: A Comparison of Estimates from Two Surveys," Survey of
Income and Program Participation Report No. 243, June 8, 2004, at
http://www.sipp.census.gov/sipp/workpapr/wp243.pdf.
91
Refer to the Employer Health Benefits Survey, 2009 Annual Survey, Kaiser Family Foundation and Health
Research and Educational Trust, 2009, at http://ehbs.kff.org/pdf/2009/7936.pdf.
P a g e | 107
▪
▪
▪
retiree health benefits,
wellness programs and health risk assessments, and
employer and health plan practices and employer opinions.
The Kaiser/HRET survey identifies small employers as those with 3 to 199 workers and large
employers as those with 200 or more workers. In some cases, there is further delineation by
employer size in the Kaiser/HRET survey to identify characteristics of employers with 3 to 9
employees, 10 to 24 employees, 25 to 49 employees, 50 to 199 employees, 200 to 999
employees, 1,000 to 4,999 workers, and 5,000 or more employees.
P a g e | 108
APPENDIX E – Maps Depicting Percent of Private Sector
Establishments that Offer Health Insurance, by Firm Size
While access to employer-sponsored health insurance increases with the size of the firm, there
are also regional variations in access to employer-sponsored health insurance as well. Across all
small firm size categories, these regional variations tend to show higher access rates in the
Northeast and lower access rates in the South. The following maps (E5 to E9) show access rates
to employer-sponsored health insurance for various small firm categories.
Some anomalies can be observed. For example, California has one of the highest access rates
(42.1 percent and above) for establishments of firms of fewer than 10 employees, but has one of
the lowest access rates (90 percent and below) for establishments of firms with 100 to 499
employees. Montana, on the other hand, has one of the lowest access rates for establishments of
firms of fewer than 10 employees, but has a fairly high access rate (96.1 to 97.7 percent) for
establishments of firms with 100 to 499 employees.
There are likely a number of reasons that these regional variations in access occur. An Urban
Institute analysis demonstrated that coverage by private health insurance (which is
predominantly employer-sponsored health insurance) declines as the county of an individual’s
residence becomes more remote. 92 This analysis identified Mississippi as the most rural state,
with 53.7 percent of Mississippi residents living in counties that were not adjacent to an urban
area. Consistent with the Urban Institute analysis, Maps E-5 to E9 show that Mississippi has
among the lowest access rates in the country. The Urban Institute analysis notes that employersponsored health insurance is less common in rural areas because of great prevalence of small
businesses, lower wages, and high rates of self-employment.
92
Ormond, Barbara A., Stephen Zuckerman, and Apama Lhila. Rural/Urban Differences in Health Care Are Not
Uniform Across States. The Urban Institute, Series B, No. B-11, May 2000.
P a g e | 109
P a g e | 110
P a g e | 111
P a g e | 112
P a g e | 113
BIBLIOGRPAHY
Auerbach, David and Janet Holtzblatt, Paul Jacobs, Alexandra Minicozzi, Pamela Moomau,
Chapin White, Will Health lnsurance Mandates lncrease Coverage?, Congressional
Budget Office Working Paper Series, Working Paper 2010-05, August 2010.
Baer, David and Ellen O’Brien. Federal and State Income Tax Incentives for Private Long-Term
Care Insurance, AARP Public Policy Institute, November 2009.
Bhandari, Shailesh. "People with Health Insurance: A Comparison of Estimates from Two
Surveys," Survey of Income and Program Participation Report No. 243, June 8, 2004, at
http://www.sipp.census.gov/sipp/workpapr/wp243.pdf.
Blakeley, Stephen. Employers, Workers, and the Future of Employment-Based Health
Insurance. Employee Benefit Research Institute, Issue Brief No. 339, February 2010.
Blumberg, Linda J. Who Pays for Employer Sponsored Health Insurance? Evidence and Policy
Implications. Health Affairs, Vol. 18, No. 6, November/December 1999.
Blumberg, Linda J. and Stacey McMorrow. What Would Health Care Reform Mean for Small
Employers and Their Workers? Timely Analysis of Immediate Health Policy Issues,
Robert Wood Johnson Foundation and the Urban Institute, December 2009.
Blumenthal, David. Employer-Sponsored Health Insurance in the United States – Origins and
Implications. New England Journal of Medicine, 355,1, July 6, 2006.
Chu, Rose C. and Gordon R. Trapnell. Study of the Administrative Costs and Actuarial Values of
Small Health Plans. U.S. Small Business Administration, Office of Advocacy, January
2003.
Clemans-Cope, Lisa, Genevieve Kenney, and Aaron Lucas. Health Insurance in Nonstandard
Jobs and Small Firms: Differences for Parents by Race and Ethnicity. The Urban
Institute, Brief 12, April 2010.
DeNavas-Walt, Carmen, Bernadette D. Proctor, and Jessica C. Smith. U.S. Census Bureau,
Current Population Reports, P60-236, Income, Poverty, and Health Insurance Coverage
in the United States: 2008. U.S. Government Printing Office, Washington, DC,
September 2009.
Employee Benefits Research Service, Issue Brief, Sources of Health Insurance and
Characteristics of the Uninsured: Analysis of the March 2009 Current Population
Survey, No. 334, September 2009.
Employee Benefits Research Service, Notes, Health Insurance Coverage of Individuals Ages
55−64, 1994−2007, Vol. 30, No. 8, August 2009.
P a g e | 114
Employee Benefits Research Service, Fast Facts, Health Plan Differences: Fully-Insured vs.
Self-Insured, No. 114, February 11, 2009.
Families USA and the Small Business Majority, A Helping Hand for Small Businesses. Health
Insurance Tax Credits. July 2010.
Feder, Lester and Ellen-Marie Whelan. Small Businesses, Large Problems: Health Care Costs
Hit Small Employers, Center for American Progress, October 30, 2008, available at
http://www.americanprogress.org/issues/2008/10/small_business_brief.html.
Fronstin, Paul. The Impact of the Recession on Employment-Based Health Coverage. Employee
Benefit Research Institute, Issue Brief No. 342, May 2010.
Fronstin, Paul. Capping the Tax Exclusion for Employment-Based Health Coverage:
Implications for Employers and Workers. Employee Benefits Research Institute Issue
Brief No. 325, January 2009.
Fronstin, Paul, Employment-Based Health Benefits: Access and Coverage, 1988-2005, Employee
Benefits Research Institute, Issue Brief No. 303, March 2007.
Headd, Brian. The Characteristics of Small-Business Employees. Monthly Labor Review, April
2000.
Hirth, Richard A., Reagan Baughman, Michael Chernew, and Emily Shelton. Worker
Preferences, Sorting and Aggregate Patterns of Health Insurance Coverage. February 9,
2006.
Holahan, John and Garrett, A. Bowen. Rising Unemployment, Medicaid and the Uninsured,
Kaiser Commission on Medicaid and the Uninsured, January 2009. Accessed at
www.kff.org/uninsured/upload/7850.pdf.
Insure Montana Small Business Insurance Program Newsletter, Volume 4, Issue 2, September 1,
2009, available at www.sao.mt.gov/InsureMontana/PDF/NewslettersSept09.pdf.
Kaiser Family Foundation, Comparison of Expenditures in Nongroup and Employer-Sponsored
Insurance: 2004-2007, March 2010. Accessed at
www.kff.org/insurance/snapshot/chcm111006oth.cfm.
Kaiser Family Foundation, statehealthfacts.org.
Kaiser Family Foundation, Snapshots: Health Care Costs. Wages and Benefits: A Long-Term
View. November 2009. Accessed at:
www.kff.org/insurance/snapshot/chcm012808oth.cfm.
Kaiser Family Foundation and Health Research and Educational Trust, Employer Health Benefits
Survey, 2009 Annual Survey, available at http://ehbs.kff.org/pdf/2009/7936.pdf.
P a g e | 115
Lueck, Sarah. States Should Structure Insurance Exchanges to Minimize Adverse Selection.
Center on Budget and Policy Priorities, August 17, 2010, available at
http://www.cbpp.org/files/8-17-10health.pdf.
Lyke, Bob. The Tax Exclusion for Employer-Provided Health Insurance. Policy Issues
Regarding the Repeal Debate. CRS Report for Congress. Congressional Research
Service, November 21, 2008.
Ormond, Barbara A., Stephen Zuckerman, and Apama Lhila , Rural/Urban Differences in Health
Care Are Not Uniform Across States, Urban Institute, Series B, No. B-11, May 2000.
Peterson, Chris L. and Hinda Chaikind. Summary of Small Business Health Insurance Tax
Credit Under PPACA (P.L. 111-148). Congressional Research Service, CRS Report for
Congress, R41158, April 20, 2010.
Sommers, John P. and Beth Levin Crimmel. Co-Pays, Deductibles, and Coinsurance
Percentages for Employer-Sponsored Health Insurance in the Private Sector, by Firm
Size Classification, 2006. U.S. Department of Health and Human Services, Agency for
Healthcare Research and Quality, Statistical Brief #216.
U.S. Bureau of the Census, Income, Poverty, and Health Insurance Coverage in the United
States: 2009, March 2010 Supplement to the Current Population Survey, issued
September 2010.
U.S. Bureau of the Census, Current Population Survey, March 2009 Supplement to the Current
Population Survey.
U.S. Bureau of the Census, Current Population Survey, March 2008 Supplement to the Current
Population Survey.
U.S. Congress, Joint Committee on Taxation, Tax Expenditures for Health Care, JCX-66-08,
July 31, 2008.
U.S. Congressional Budget Office, The Effects Of Health Reform on the Federal Budget,
presented by Douglass W. Elmendorf, Director to the World Health Care Congress, April
12, 2010.
U.S. Department of Labor, Bureau of Labor Statistics, National Compensation Survey, March
2010.
U.S. Department of Labor, Bureau of Labor Statistics, Employers Costs for Employee
Compensation – March 2010, USDL-10-0774, June 9, 2010.
U.S. Department of Health and Human Services, Agency for Healthcare Research and Quality,
Medical Expenditure Panel Survey, 2009.
P a g e | 116
U.S. Department of Health and Human Services, Agency for Healthcare Research and Quality,
MEPS Insurance Component: Technical Notes and Survey Documentation.
http://www.meps.ahrq.gov/mepsweb/survey_comp/ic_technical_notes.shtml.
U.S. Department of Health and Human Services, Agency for Healthcare Research and Quality,
Statistical Brief #209, July 2008.
U.S. Small Business Administration. Table of Small Business Size Standards Matched to North
American Industry Classification System Codes. Effective November 5, 2010.
U.S. Treasury Department, Internal Revenue Service, Statistics of Income, Individual Income
Tax Return Data, Tax Years 1998 through 2008.
U.S. Treasury Department, Internal Revenue Service, Statistics of Income, Corporate Source
Book Data, 2003 through 2007 editions.
P a g e | 117

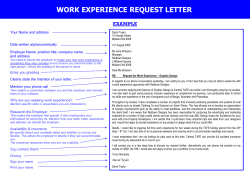


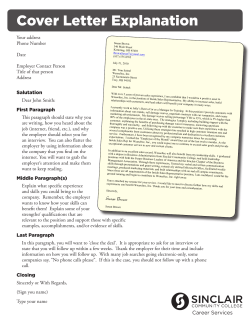
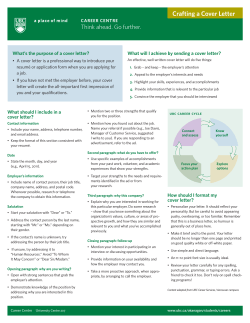

© Copyright 2026