
Delivery of Bioactives in the Intestinal Tract through
Delivery of Bioactives in the Intestinal Tract through Nanoparticles. Stability, Absorption and the Role of the Mucus Layer by Yang Li A Thesis presented to The University of Guelph In partial fulfilment of requirements for the degree of Master of Science in Food Science Guelph, Ontario, Canada © Yang Li, April, 2015 ABSTRACT DELIVERY OF BIOACTIVES IN THE INTESTINAL TRACT THROUGH NANOPARTICLES, STABILITY, ADSORPTION AND THE ROLE OF THE MUCUS LAYER Yang Li University of Guelph, 2015 Advisor: Professor Milena Corredig Co-advisor: Professor Lisa Duizer This thesis is an investigation of mucus interactions with different food delivery systems in vitro to understand the effect of intestinal mucus layer on bioefficacy of bioactive compounds. Milk proteins and liposomes were employed as carriers for model bioactives, Epigallocatechin-3-gallate and -carotene. Mucus was harvested from mucin producing human intestine cell line—HT29-MTX. Liposomes were prepared from milk and soy phospholipids using microfluidizer, their physicochemical properties were characterized. Mucus interactions with bioactives and matrices were studied on an air/liquid interface by drop shape tensiometry, where interactions were shown by the changes of interfacial tension and dilational viscoelasticity. The bioactives uptake was conducted on cells models with/without mucus present, where higher uptake was found in mucus free Caco-2 cells. These results clearly indicated that specific interactions between mucus and food components need to be taken into account and studied to better understand the absorption behaviour of bioactives during digestion. Acknowledgements I would like to express my great gratitude to Dr. Milena Corredig for giving me the opportunity to conduct this project. Without her direction and assistance this thesis would not have been possible. I appreciate her far-sighted guidance, patience, and support during the entire project. I would like to sincerely thank Dr. Lisa Duizer for providing her generous support, advice and suggestions on my research. When things become rough and I feel emotional stress, her encouragements and cheerful attitudes give me great confidence to continue this project. I would like to thank my advisory committee member, Dr. Massimo Marcone. The critical thinking and analytical skills I learned from him during my undergraduate study are essential components for completing this research project. Special thanks to Drs. Anilda Guri and Elena Arranz for their assistance and collaboration in the cell culture work. Their advice and guidance have been so helpful for the completion of the project. This research could not have been successful without the assistance of all the staff and researchers in food science department. I am also thankful to all the staff of the Main Office for their help in various aspects during my time at the University of Guelph. I convey my special thanks to my entire dairy lab 129 family members: Eleana Kristo, Jin Chen, Jonathan Andrade, Zhengtao Zhao, Lu Zhang and every other lab-mates for giving me advice and support academically as well as during daily life. Their companionship has made the challenging graduate study life full of sweet and iii unforgettable memories. Moreover, I would like to express my deepest gratefulness to my mother Feng Li, father Jun He, and my boyfriend Bo Zhu for their infinite love, support and understanding. Though they are in China, their confidence in me and encouragements have taken a great deal of stress off my shoulder and made me ambitious and passionate for oversea graduate study. Last but not least, I would like to thank Fonterra for donating the phospholipid fractions, and the Ontario Dairy Council and Natural Sciences and Engineering Research Council of Canada (NSERC) for the financial support towards this project. iv Table of Contents Acknowledgements...........................................................................................................iii Table of Contents...............................................................................................................v List of Tables .................................................................................................................. viii List of Figures ................................................................................................................... x Chapter 1. General Introduction, Hypotheses and Research Objectives .................... 1 1.1 General Introduction ............................................................................................ 1 1.2 Hypotheses and Objectives .................................................................................. 4 Chapter 2. Literature Review .......................................................................................... 6 2.1 Intestinal mucus ........................................................................................................ 6 2.1.1 Composition of mucus and structure of intestinal mucin .................................. 6 2.1.2 The functions of mucus in digestive system ...................................................... 7 2.2 Bioactive compounds—properties of interests of the selected model molecules ..... 8 2.2.1 Epigallocatechin-3-gallate (EGCG) ................................................................... 9 2.2.2 -Carotene........................................................................................................ 10 2.3 Technological challenges of delivering bioactives in food systems ....................... 12 2.4 Encapsulation—a viable tool for bioactives delivery ............................................. 13 2.4.1 Milk proteins—an ideal matrix for polyphenol delivery ................................. 14 2.4.2 Liposomes as delivery systems ........................................................................ 16 2.5 Significance of mucus on particle absorption ......................................................... 18 2.6 In vitro models for evaluation of particle transport ................................................ 21 2.7 Physicochemical properties of delivery systems affect bio-interaction and mucus penetration..................................................................................................................... 23 2.8 Modification of liposomes may affect mucus penetration ...................................... 25 2.9 Mucus interaction with food components ............................................................... 27 2.10 Outlook ................................................................................................................. 29 Chapter 3. Interfacial dilational properties of tea polyphenols and milk proteins with gut epithelia and the role of mucus in nutrients adsorption ............................... 31 3.1 Introduction ............................................................................................................. 31 3.2 Materials and Methods ............................................................................................ 34 v 3.2.1 Materials .......................................................................................................... 34 3.2.2 Cell viability..................................................................................................... 34 3.2.3 EGCG uptake ................................................................................................... 36 3.2.4 EGCG quantification ....................................................................................... 37 3.2.5 Mucus extraction .............................................................................................. 38 3.2.6 Sample preparation .......................................................................................... 38 3.2.7 Interfacial tensiometry ..................................................................................... 39 3.2.8 Trypsin hydrolysis of milk protein................................................................... 40 3.2.9. Statistical analysis ........................................................................................... 41 3.3 Results and Discussion ........................................................................................... 41 3.3.1 Cell viability and uptake of EGCG on cell cultures ........................................ 41 3.3.2 Drop tensiometry studies ................................................................................. 44 3.3.3 Interfacial properties after in situ trypsin digestion ......................................... 55 3.4 Conclusions ............................................................................................................. 63 Chapter 4. Mucus interactions with liposomes encapsulating bioactives: interfacial tensiometry and cellular uptake on Caco-2 and cocultures of Caco-2/HT29-MTX . 65 4.1 Introduction ............................................................................................................. 65 4.2 Materials and Methods ............................................................................................ 68 4.2.1 Materials .......................................................................................................... 68 4.2.2 Liposome preparation ...................................................................................... 69 4.2.3 Determination of apparent particle diameter and ζ- potential using dynamic light scattering ........................................................................................................... 71 4.2.4 Liposome morphology determined by Cryo-TEM .......................................... 71 4.2.5 Stability of liposome dispersions during storage ............................................. 72 4.2.6 Encapsulation efficiency determination ........................................................... 72 4.2.7 Cell cultures and mucus extraction .................................................................. 75 4.2.8 Interfacial tensiometry ..................................................................................... 76 4.2.9 Cell culture viability and uptake ...................................................................... 77 4.2.10 Statistical analysis .......................................................................................... 80 4.3 Results ..................................................................................................................... 81 4.3.1 Liposomes characterization ............................................................................. 81 4.3.2 Encapsulation efficiency .................................................................................. 86 vi 4.3.3 Liposome stability as affected by pH and temperature .................................... 88 4.3.4 Interactions between milk and soy phospholipids liposomes and mucus studied by drop tensiometry................................................................................................... 95 4.3.4.1 Interfacial properties of milk and soy phospholipids liposomes .................. 95 4.3.4.2 Interfacial characteristics of liposome encapsulating bioactives in buffer, and their interactions with human intestinal mucus ...................................................... 100 4.3.5 Absorption studies using in vitro models of intestinal cells........................... 105 4.3.5.1 EGCG uptake .............................................................................................. 108 4.3.5.2 β-carotene recovery in the cell lysates ........................................................110 4.4 Discussion ..............................................................................................................113 4.5 Conclusions ............................................................................................................115 Chapter 5. Conclusions and future directions .............................................................117 Chapter 6. References ................................................................................................... 122 vii List of Tables Table 3.1 Interfacial tension of the air-liquid interface of milk, mucus and milk in mucus with and without EGCG. Values are means and standard deviations of at least 2 individual replicates. Different letters indicate significant difference (P<0.05)………………………………………………………...……………..47 Table 3.2 Interfacial dilational viscoelastic modulus of the air-liquid interface of milk, mucus and milk in mucus with and without EGCG. Measurements reported for 100 mHz and a strain amplitude of 0.1. The data are means and standard deviations of at least 2 individual replicates. Different letters indicate significant difference (P<0.05). ……………………………………………....51 Table 3.3 Surface tension of milk before and after trypsin digestion. Two different digestion conditions were used, 3 h room temperature in situ in the cuvette and 1 h digestion at 37C in water bath prior to testing in the tensiometer. The data are means and standard deviations of at least 2 individual replicates.….....….59 Table 3.4 Surface tension () after in situ digestion (3 h) of the air-liquid interface and dilational viscoelastic modulus ( at 3000s aging time, frequency 100 mHz, strain amplitude 0.1. The data are means and standard deviations of at least two individual replicates. Within each column, different letters indicate significant difference (P<0.05).….…………….………………………………………….56 Table 4.1 Mean apparent diameter (nm) and 𝜁 -Potential (mV) of milk and soy phospholipids liposomes, empty or encapsulating EGCG or 𝛽 -carotene. Values are the means of at least three replicates with standard deviations…...83 Table 4.2 Encapsulation efficiencies of EGCG and β-carotene in milk and soy phospholipids liposomes. Data are the average of at least three replicate samples. Within a row, the different letters indicate significant differences (P<0.05).…………………………………………………………………..…..87 Table 4.3 Average apparent diameters of milk or soy phospholipid liposomes as affected by pH after one-week storage at room temperature (22 °C) and at 4°C. Values are the means of at least three replicates with standard deviations.……. ……92 Table 4.4 Values of interfacial tension of milk and soy phospholipids liposomes measured after 3000 s of adsorption as a function of liposome concentration (mg ml-1). Within a row, different letters indicate statistically significant differences (P<0.05)…………….. ………….…………..................................98 Table 4.5 Basolateral uptake of EGCG by Caco-2 and coculture cells grown for 21 days on permeable Transwell® plates as affected by administration of free EGCG or viii encapsulated in milk or soy liposomes at 2h incubation duration in the cell culture medium. The experiments were carried out in triplicates. The data are means and standard deviations of at least 2 individual replicates. Within a row, different letters indicate significant difference (P<0.05)……………………109 Table 4.6 Carotene uptake in cell lysates of Caco-2 and coculture cells grown for 21 days on permeable Transwell® plates as affected by administration of free carotene or encapsulated in milk or soy liposomes after 2h incubation duration in the cell culture medium. The experiments were carried out in triplicate. The data are means and standard deviations of at least 2 individual replicates. Within a row, different letters indicate significant difference (P<0.05).…………..….112 ix List of Figures Figure 2.1 Chemical structures of EGCG and -carotene................................................11 Figure 3.1 Cell viability (%) of HT29-MTX (A) and Caco-2 (B) incubated with EGCG in solution (black bars) or EGCG-milk mixture (white bars) as a function of dilution rate in the cell culture medium during an incubation period of 24 h in humidified atmosphere at 37° C and 5% CO2. Cells growing in medium only were used as control. All the experiments were carried out at least in triplicate……………………………………………………………………. 42 Figure 3.2 Changes in the interfacial tension for mucus (squares), milk (circles) and milk and mucus interfaces (filled triangles), in the absence (A) and presence (B) of 250 mg ml-1 EGCG. Results are representative runs……………………..…46 Figure 3.3 Dilational viscoelasticity as a function of frequency of milk proteins (A), mucus (B) and mixed milk and mucus interfaces (C) in the absence (solid symbols) or presence (empty symbols) of EGCG (0.25 mg ml-1). Values are the average of at least two individual experiments, bars indicate standard deviations........................................................................................................50 Figure 3.4 Interfacial modulus of dilational viscoelasticity for a milk protein interface, before (filled circles) and after tryptic digestion, as a function of oscillation frequency. The values are average of at least two individual experiments. The milk interface was subjected to in situ hydrolysis at room temperature for 3 h during tensiometry experiments (empty circles) or milk was incubated with trypsin for 1 h at 37°C and the hydrolysate was then tested by drop tensiometry (filled inverted triangles).............................................................56 Figure 3.5 Interfacial dilational viscoelasticity modulus as a function of drop age after in situ trypsin digestion for milk (A), mucus (B), and mixed milk and mucus interfaces (C). Control milk, mucus and mixed milk and mucus before digestion (squares), interfaces with (filled circles) or without (empty circles) 250 mg.ml-1 EGCG. The values are average of at least two individual experiments with standard errors around 5 mN m-1 (not shown)...................61 Figure 4.1 Diameter distribution of liposomes dispersions prepared with milk (A) and soy (B) phospholipids. Control (filled circles); liposomes containing EGCG (empty circles); liposomes containing 𝛽-carotene (inverted triangles). Data are representative of at three replicate samples..............................................82 Figure 4.2 Cryo-TEM micrograph of liposomes prepared with milk phospholipids (A), and soy phospholipids (B) in 20 mM imidazole 50 mM NaCl buffer. Images x are representative and taken right after preparation. Bar size is 100 nm and arrows pointed to liposome vesicles...............................................................85 Figure 4.3 Average apparent diameter (A, B) and 𝜁-potential (C, D) of milk (A, C) and soy (B, D) liposomes as a function of pH. Control liposomes (filled circles), and liposomes containing EGCG (empty circles) and β-carotene (inverted triangles). Values are the means of at least three replicates with error bars indicate the standard deviation……................................................................89 Figure 4.4 Visual appearances of freshly prepared liposomes containing EGCG (A and B) or -Carotene (C and D). Liposomes were prepared milk (A and C) and soy (B and D) phospholipids (10 mg ml-1) in 20 mM imidazole, 50 mM NaCl buffer……………………………...................................................................93 Figure 4.5 Visual appearances of milk (A, C, E) and soy (B, D, F) liposomes after one week of storage at 22 °C. Empty liposomes (A and B), liposomes containing EGCG (C and D) or -Carotene (E and F).....................................................94 Figure 4.6 Changes in interfacial tension of milk (A) and soy (B) phospholipids liposomes at various concentrations (0.1 (solid circles), 0.1 (empty circles), 1 (solid squares), 10 mg ml-1 (empty squares)). Results are representative of at least duplicate experiments.........................................................................96 Figure 4.7 Interfacial modulus of dilational viscoelasticity for milk (A) and soy (B) phospholipids liposomes as a function of oscillation frequency, for various concentrations 0.01 (solid circles), 0.1 (empty circles), 1 (solid squares), 10 mg ml-1 (empty squares)…………………………………………………... 99 Figure 4.8 Values of interfacial tension of milk (black bars) or soy (white bars) liposomes (0.1mg ml-1) with or without encapsulated EGCG or -carotene (A) and for mixed interfaces containing human intestinal mucus (B). Mucus interface (grey bar) as control is shown in (B). Values are the averages of three independent experiments, and the error bars indicate the standard deviation. Differences among six samples were compared using ANOVA and Tukey HSD with same letter indicate no statistically significant differences (P>0.05)........................................................................................................101 Figure 4.9 Changes in the dilational modulus as a function of oscillation frequency for milk (A,B) and soy (C,D) phospholipids liposomes in isolation (A,C) or in mixed layers containing human intestinal mucus (B,D). Measurements were carried out at a liposome concentration of 0.1 mg ml-1. Empty liposomes (solid circles), liposomes containing EGCG (empty circles), carotene (inverted triangles). Mucus layer in isolation is also shown (filled squares). Values are the averages of at least two individual experiments with errors bar xi indicating standard deviations. .....................................................................103 Figure 4.10 Cell viability (%, related to control grown in medium) as a function of the dilution, after 2 h (A,C) and 24 h of incubation (B,D) in a humidified atmosphere at 37 ℃ and 5% CO2. Control samples contained only the medium and are considered to have 100% viability. Liposomes containing EGCG (A,B) and -carotene (C,D). Free EGCG or -carotene (filled circles), and milk (squares) or soy (triangles) phospholipids liposomes, with empty controls (empty symbols) or containing bioactive (filled symbols). Results are the average of at least three independent experiments, and bars represent standard deviation.……………………… …...............................................106 xii Chapter 1. General Introduction, Hypotheses and Research Objectives 1.1 General Introduction The interest in developing delivery systems and food matrices for the protection and controlled release of bioactive compounds continues to grow, because of the increase in consumer awareness of the strong connections between diet and health. Despite their potential for improving health, the creation of delivery systems in foods still has many technological and biological challenges to overcome. The stability and bioactivity of the compounds in question has to be maintained, not only during processing and storage but also under digestive conditions (Benshitrit et al. 2012). A variety of different types of delivery systems, including simple solutions, suspensions, emulsions, association colloids, gels solid matrices, have been developed to incorporate bioactive compounds (McClements et al. 2009). Among various types of bioactive carriers, milk proteins have been intensively studied and identified as an ideal platform for the delivery of bioactives such as Vitamin D, calcium, or polyphenols (Livney 2010; Guri and Corredig 2014; Tavares et al. 2014). In addition, another delivery system based on phospholipid vesicles, i.e., liposomes, originated from pharmaceutical and medical research, has been suggested by food scientists as a simple delivery system in food applications (Mozafari 2005). Liposomes have been made with natural ingredients through food-grade preparation methods (Mozafari et al. 2008). Besides conventional soy or egg phospholipids, milk derived phospholipids show the potential to be used in food grade liposomes (Corredig, 1 Roesch, and Dalgleish 2003; Thompson and Singh 2006). To evaluate the bioefficacy of bioactives delivered in food systems, in vitro digestion models have been employed. Such in vitro studies have shown that delivery systems better protect bioactive compounds during digestion and enhance their bioavailability (Takahashi et al. 2008; Liu et al. 2013). In addition to digestion models, uptake and bioefficacy of bioactives can also be assessed in vitro using cell culture models (Sugawara, Kushiro, and Zhang 2001; Zhang et al. 2004; Mahler, Shuler, and Glahn 2009). Results from cell models have further revealed that cells with or without mucus secreting ability have different degree of uptake of the bioactives (Anand et al. 2010; Guri, Gülseren, and Corredig 2013), and that the mucus layer may also influence the bioactivity of the compounds (D’Agostino et al. 2012; Guri, Haratifar, and Corredig 2014). This has been demonstrated with pharmaceutical models for drug transport and uptake (Khanvilkar, Donovan, and Flanagan 2001; Lai, Wang, and Hanes 2009). Indeed, the mucus lining the entire walls of the intestinal tract may have strong effect by interacting with bioactive molecules and the delivery systems, and cause differences in the absorption of nutrients. Hence, the interactions between the intestinal mucus and food macromolecular assemblies cannot be overlooked, when studying the mechanisms of breakdown and adsorption of nutrients during digestion. Mucus is a complex biological material mainly comprised of glycoproteins and water. Other minor components such as lipids, proteins, salts contribute to the heterogeneity of mucus network (Lai et al. 2009). The intestinal mucus layer is 2 commonly referred to as a viscoelastic gel that protects the underlying epithelium against foreign harmful particles while permitting the rapid absorption of ions, nutrients and many proteins (Mackie et al. 2012). During the absorption, nutrients interact with the gut mucosa and epithelial cells, and, after absorption they are then delivered into the bloodstream for systemic circulation (Naahidi et al. 2013). The barrier properties of intestinal mucus on drug penetration and absorption have been intensively studied since early 1990s (Karlsson, Wikman, and Artursson 1993). However, the role that the mucus layer plays on the absorption of bioactives delivered through food macromolecular assemblies is generally scarce in literature. EGCG is a widely studied hydrophilic model bioactive. The antiproliferative activities of EGCG on various cancer cell lines have been widely reported in literature and the bioefficacy of EGCG can be easily assessed based on cell viability. -carotene, a common carotenoids, is widespread among fruits and vegetable. It has phytochemical, antioxidant and many health-promoting activities (i.e. immune protection, cancer prevention). The insolubility of -carotene in water limits its application in foods and beverages, thus -carotene is usually employed as a hydrophobic model bioactive and is continuously gaining study interests. The current research was designed to evaluate mucus interactions with food macromolecular assemblies often employed as delivery systems: protein aggregates and liposomes. To better understand the effect of intestinal mucus layer on bioefficacy of bioactive compounds, two model bioactives were employed, Epigallocatechin-3-gallate 3 (EGCG) and -carotene. 1.2 Hypotheses and Objectives The main objective of the thesis was to better understand the mechanisms underlying the absorption of nutrients carried by delivery systems during digestion. The first part of the research employed milk proteins as a model for delivery of EGCG. EGCG is known to strongly interact with glycoproteins, hence, the study tested the hypothesis that mucus interacts with EGCG differently when free or present in a complex with milk proteins. Furthermore, it was hypothesized that these interactions would hinder EGCG uptake. To test this hypothesis, the interactions between mucus and free or complexed EGCG were tested using interfacial dilational rheology. Furthermore, it was hypothesized that digestion of milk modifies the interfacial properties of the delivery system and this further increases the complexity of mucus – nutrient interactions. The first part of this research had the following objectives: (1) To study the interfacial properties of intestinal mucus by interfacial tensiometry. (2) To study the mucus and its interactions with EGCG, free or complexed with milk proteins. (3) To determine the effect of in situ tryptic hydrolysis of milk protein and polyphenol complexes on these interactions. 4 A second example of delivery system was also tested in this thesis: liposomes. They are recognized as carriers of both hydrophilic and hydrophobic molecules. Liposomes are phospholipids based vesicles, and their presence in the gastrointestinal tract is either extrinsic (through food) or intrinsic (from intestinal cells) (Carey, Small, and Bliss 1983; Keller 2001). The interactions of liposomes containing EGCG and β-carotene with mucus were studied. In this case, the physicochemical properties of liposomes containing bioactives were studied first, to determine their stability and their encapsulation behaviour; it was hypothesized that liposomes are effective carriers for hydrophilic and hydrophobic bioactives and that the encapsulation can protect bioactives during digestion. To determine if the interactions with the mucus affects bioactive uptake, firstly the interactions were evaluated using interfacial rheology. Then, bioactive uptake was evaluated on cell models. This part of the research had the following objectives: (1) To study the properties of liposomes prepared from milk and soy phospholipids by microfluidization and used for the encapsulation of EGCG and β-carotene. (2) To probe mucus interaction with liposome incorporating bioactives by interfacial tensiometry. (3) To investigate the uptake of bioactives delivered in liposomes on human colon cancer cells, and to explore the effect of intestinal mucus layer on the interaction and bioefficacy. 5 Chapter 2. Literature Review 2.1 Intestinal mucus 2.1.1 Composition of mucus and structure of intestinal mucin Mucus is a very complex viscoelastic system comprised of glycoproteins, water and other minor components (i.e. DNA, lipids, ions, proteins, cells and cellular debris) (Lai et al. 2009). Mucus forms a protective barrier across a variety of epithelial surfaces including respiratory, reproductive and gastrointestinal (GI) tracts (Mackie et al. 2012). Mucins constitute the major part of mucus, they are slimy, viscoelastic glycoproteins that coat all mucosal surfaces (Tabak et al. 1982). Mucins have an average molecular mass of 2 ×10⁶ Daltons (Kim and Khan 2013), they consist of a peptide backbone containing alternating glycosylated and non-glycosylated domains. The O-linked glycosylated regions constitute of around 70-80% of this polymer (Deplancke and Gaskins 2001). There are two types of mucin groups in the GI tract, membrane-bound and secreted. Membrane-bound mucins, like MUC1 known as glycolcalyx, are transmembrane glycoproteins produced at the apical surface of enterocytes. Secreted mucins, like MUC2, are specialized glycoproteins with high molecular weight (5-40 MDa) and size range 600~900 nm. MUC2 is the predominant intestinal mucin secreted by goblet cells (Mackie et al. 2012; Round et al. 2012). The trimerization of MUC2 oligomers seems to be responsible for the assembly of porous, lamellar networks of mucin on the surface of porcine intestine. This network is two-dimensional with little interaction between 6 lamellae (Round et al. 2012). In other systems such as gastric, salivary, ocular, respiratory and cervicovaginal epithelia, secreted mucins are MUC5AC, MUC5B and MUC6 (Allen and Garner 1980; Karlsson, Wikman, and Artursson 1993; Cone 2009; Macierzanka, Böttger, and Rigby 2012; Round et al. 2012). These secreted mucins (MUC5AC, MUC5B, and MUC6) retain a linear morphology (Round et al. 2012). 2.1.2 The functions of mucus in digestive system Mucus is usually referred to as a viscoelastic gel and a non-Newtonian fluid (Lai et al. 2009). The viscous and elastic properties of gastrointestinal mucus are responsible for its lubricating and protective functions (Allen and Snary 1972). The primary functions of mucus include 1) lubrication, to facilitate passage of objects; 2) hydration of epithelium; 3) defense, as a barrier to destructive enzymes, pathogens and hazardous compounds; 4) filtration, as a permeable layer for gas exchanges and absorption of nutrients (Karlsson, Wikman, and Artursson 1993; Cone 2009; Mackie et al. 2012). It has been shown that the mucosal layer of the gastrointestinal (GI) tract plays an important role in the innate defense systems. Mucus helps to prevent infection by interacting and hindering the mobility of pathogenic viruses and bacteria, while aiding in the digestion process by immobilizing enzymes close to the epithelium surface to allow higher degree of hydrolysis and adsorption of nutrients (Mahler, Shuler, and Glahn 2009). 7 Mucus plays different functions also depending on the area of the gastrointestinal tract. In brief, in the oral cavity, salivary mucins play an important role in non-immune protection by protecting against desiccation, providing lubrication and possessing antimicrobial effects (Tabak et al. 1982). In the stomach, the secretion of bicarbonate into the mucus layer neutralizes luminal acids and forms a pH gradient which provides a mild, neutral environment for epithelium in stomach and duodenum (Allen and Garner 1980). On the other hand, the adherent mucus layer acts as a limiting barrier to luminal pepsin and ion diffusion, thanks to the unique, laminated structure of mucus gel, which is formed noncovalently by the large, highly hydrated multimetric mucin molecules (Allen and Flemström 2005). In the intestine, the mucus includes a loosely and a firmly adherent layer attaching to the mucosa. This mucus exhibits a physical barrier against mechanical damage and digestive enzymes to the epithelium. Intestinal mucus is relatively permeable to low molecular weight particles, and this unique property plays an important role for nutrients adsorption in the small intestine (Karlsson, Wikman, and Artursson 1993; Kim and Khan 2013). 2.2 Bioactive compounds—properties of interests of the selected model molecules Bioactive compounds include antioxidants, probiotics, polyunsaturated fatty acids, bioactive peptides, amongst others (Borel and Sabliov 2014). In addition to their initial nutritional values, bioactives can be added to foods to prevent aging, cancer, cardiovascular disease, and many other diseases (Korhonen 2009; Borel and Sabliov 8 2014). Increasing evidence is supporting the adoption of diet and nutrition habits that will reduce the risk for chronic diseases and more in general, to promote health. Developing functional foods that carry added value by incorporating bioactive compounds in food matrices is now the focus of the food industry. Amongst various bioactives, EGCG and -carotene have been widely employed as bioactive model molecules in delivery studies. 2.2.1 Epigallocatechin-3-gallate (EGCG) Tea is a worldwide popular beverage and a major source of dietary flavonoids. The consumption of tea has been associated with various health benefits, including anti-inflammatory, antimicrobial, immunostimulatory, bactericidal, antioxidant, antiproliferative against cancer cells (Ikigai et al. 1993; Saito and Welzel 2006; Chacko et al. 2010). Tea polyphenols, for example, have been shown to enhance insulin activity and to protect against cardiovascular diseases and cerebral ischemic damages (Anderson and Polansky 2002; Lambert 2003). The cancer chemopreventive activity of tea has been linked to the bioavailability of tea polyphenols (Lambert 2003). Many of these beneficial effects are related (−)-epicatechin-3-gallate to tea catechins, (ECG), including (−)-epicatechin (−)-epigallocatechin (EGC) (EC), and (−)-epigallocatechin-3-gallate (EGCG) (Chacko et al. 2010). Among all other catechins, EGCG is the most abundant and remarkable catechin due to its radical scavenging abilities (Hirun and Roach 2011). 9 EGCG is a water-soluble, colorless compound. Its hydrophilic character is due to the multiple hydroxyl groups (Figure 2.1), which are also associated with the bitter and astringent taste in tea (Jöbstl et al. 2004). Studies show that EGCG and other catechins are not stable when directly added to aqueous solutions due to fast oxidation. EGCG is especially susceptible to alkaline condition and light exposure (Chacko et al. 2010; Hirun and Roach 2011). Thus EGCG is an ideal bioactive model for studying the potential of delivery systems for improving bioefficacy in functional foods. 2.2.2 -Carotene Carotenoids, abundant in widespread fruits and vegetables, play important roles in photobiology, photochemistry and photomedicine (Edge, McGarvey, and Truscott 1997). -carotene is a commonly known carotenoid with various active phytochemical and health-promoting properties. It helps prevent night blindness and skin disorders (Chuwers et al. 1997). Dietary -carotene is suggested to inhibit certain types of cancer, mainly through its pro-vitamin A and antioxidant activities. In particular, -carotene acts as a precursor of vitamin A and quenches free radicals to protect cells and organisms against photo-oxidation (Edge, McGarvey, and Truscott 1997). -carotene has also been shown to prevent some chronic diseases, enhance immune system and improve reproductive system (Dingle and Lucy 1965; Handelman 2001; Hughes 2001). However, -carotene has limited applications in foods and beverages due to its high insolubility in water. The structure of -carotene is also shown in Figure 2.1. 10 EGCG -carotene Figure 2.1 Chemical structure of EGCG and -carotene. 11 The hydrogen−carbon skeleton structure and high unsaturation degree make -carotene insoluble in water and only slightly soluble in oil at room temperature (Liang and Shoemaker 2013). Furthermore, -carotene’s high sensitivity to light, oxygen and high melting point lead to technological challenges during its processing and storage, as degradation commonly occurs (Yuan et al. 2008; Qian et al. 2012; Liang and Shoemaker 2013). Crystallinity is another problem associated with -carotene, resulting in poor oral bioavailability and low uptake (Yuan et al. 2008; Qian et al. 2012). To overcome these limitations, encapsulation of -carotene is a viable technique, but the bioefficacy depends on the types of delivery system and -carotene’s compatibility with the food matrix (Qian et al. 2012). 2.3 Technological challenges of delivering bioactives in food systems Despite the health-promoting effects of bioactive compounds, their bioefficacy when incorporated into food matrices is still under debate (Siddiqui et al. 2010). The physiochemical characterization of the delivery systems is required to evaluate and predict bioactives’ compatibility with food matrices, their stability during processing, storage, under digestion, and sometimes, the overall functionality and sensory quality of the products (Benshitrit et al. 2012). In particular, only recently, the interest in understanding the breakdown and interaction of delivery systems during digestion has grown, as there is a need for a more fundamental understanding of the underlying mechanisms to be able to best design food matrices for optimal delivery of nutraceuticals. 12 To design food delivery systems, all materials need to meet the generally regarded as safe (GRAS) status. Furthermore, considerations are needed that the physicochemical properties of the carriers and targeting molecules may affect the absorption, distribution, metabolism, and excretion (ADME) profile of the delivery systems (Borel and Sabliov 2014). The assembly of the various components during processing and storage, and their disruption during digestion needs to be carefully studied to be able to identify the challenges related to their stability and maintenance of their bioefficacy. Last, some anatomical and physiological considerations are needed as these delivery systems are to promote the absorption of nutrients and nutraceuticals (Borel and Sabliov 2014). Their functionality after ingestion needs to be evaluated, e.g. bioavailability and intestinal permeability. 2.4 Encapsulation—a viable tool for bioactives delivery Encapsulation not only provides means to enhance solubility, stability, cellular uptake and overall bioavailability, but it can also induce controlled release of food bioactives (Anand et al. 2010; Borel and Sabliov 2014). However, there is no single encapsulation technique that is suitable for all bioactives. The selection of the appropriate delivery matrix is based on the characteristics of the bioactives, coating materials, and the properties of desired delivering carriers (Tavares et al. 2014). In addition, considerations are needed to ensure the biocompatibility of bioactive compounds with food matrices at various stages of the product life cycle (Zuidam and Nedović 2010). 13 The most widely used encapsulation technologies include emulsification, spray drying, spray cooling/chilling, freeze drying, extrusion, spinning disk, cocrystallization, coacervation, and inclusion (Fang and Bhandari 2010; Tavares et al. 2014). Various compounds, e.g. flavor compounds, fish oil, enzymes and peptides, bioactives, have been successfully encapsulated and their applications have shown great potential for applications in food (Zuidam and Nedović 2010). Commonly used encapsulating materials in the food industry are protein-based (e.g. animal origin, casein, and whey proteins), lipid-based (e.g. emulsion, liposome, organogels) and carbohydrate-based (e.g. starch, pectin, chitosan, alginate) (Benshitrit et al. 2012). There are various types of delivery systems, generally classified as liquid or solid (Borel and Sabliov 2014). The liquid-based systems include for example, emulsions, liposomes, polymerosomes or other macromolecular complexes while solid-based systems include liquid particles, polymetric particles, solid particles or nano and micro-crystals (Borel and Sabliov 2014). In foods, milk proteins and liposomes are considered excellent platforms for delivering bioactive compounds (Mozafari 2005; Mozafari et al. 2008; Quintanilla-Carvajal et al. 2009; Livney 2010; Tavares et al. 2014) 2.4.1 Milk proteins—an ideal matrix for polyphenol delivery Milk is a worldly recognized nutritious food, it is comprised of water, fat, protein, lactose, and minerals. Milk is an ideal platform for delivery of hydrophobic and 14 hydrophilic compounds. Milk proteins are able to bind or entrap various bioactives through the formation of aggregates or polyphasic systems such as emulsions and hydrogels (Tavares et al. 2014). Due to the unique structural and physicochemical properties, milk proteins can interact synergistically with bioactives to provide optimal delivery and enhanced functionality (Livney 2010; Guri and Corredig 2014). Two complementary approaches, “top-down” and “bottom-up”, are adopted to extend the applications of milk proteins. Bioactives such as ions, fatty acids, drug compounds and vitamins haven been successfully incorporated in milk proteins (Livney 2010; Tavares et al. 2014). In particular, many researchers have studied the interactions between polyphenols and milk proteins. These complexes occur mainly via hydrogen and hydrophobic binding (Bennick 2002; Yuksel, Avci, and Erdem 2010). The proline groups in caseins can interact with the hydroxyl (-OH) groups of catechins (Arts et al. 2002). It has been shown that tea polyphenols interact with α- and β-caseins, and the complexes formed can affect the polyphenols’ antioxidant activity (Hasni et al. 2011). In another study investigating tea cathechins and casein micelles interactions on processing functionality, EGCG was shown to bind with the casein proteins in the casein micelles, and the binding affected the coagulating properties of the milk. This interaction was concentration dependent, and it was concluded that EGCG adsorbed also on the surface of the casein micelles, hence it is able to hinder destabilization of the protein particles during renneting (Haratifar and Corredig 2014). Nonetheless, the bioefficacy of polyphenols was well maintained in the 15 EGCG-casein complex after both batch or dynamic in vitro digestion (Guri, Haratifar, and Corredig 2014). These studies demonstrated that milk caseins may be a good delivery system for tea polyphenols. However, the contribution of the mucus layer to the absorption of the digestates still needs to be understood. 2.4.2 Liposomes as delivery systems Liposomes are colloidal particles comprised of phospholipids bilayer membranes encapsulating an aqueous core. The basic principle for liposome formation lies behind the hydrophilic/hydrophobic interactions between lipid-lipid and lipid-water molecules (Mozafari 2005). Polar lipid molecules, i.e. phospholipids, under sufficient energy input (homogenization, sonication, shaking, heating), will arrange themselves in the form of bilayer vesicles to reach a thermodynamic equilibrium in the aqueous phase (Mozafari 2005). Liposomes can be composed of one or more phospholipid bilayers depending on the preparation methods. Liposomes that contain more than one single concentric bilayer are referred to as multilamellar vesicles (MLV), while liposomes composed of many non-centric vesicles encapsulated within one big lipid bilayer are referred to as multivesicular vesicle (MVV). The third type is known as unilamellar vesicle (ULV) where there is only one lipid bilayer. The sizes of liposome can also vary from a few nanometers to a few micrometers in diameter (Mozafari et al. 2008). 16 Liposomes are ideal carriers for hydrophilic molecules due to the polar environment in their core, but hydrophobic molecules can also be entrapped in the lipid bilayers and protected from external conditions (Mozafari et al. 2008). Liposome encapsulation has been shown to improve the stability of bioactive compounds during storage and environmental conditions (Taylor et al. 2007; Gülseren and Corredig 2013), and under gastrointestinal digestion (Singh, Ye, and Horne 2009; Liu et al. 2012; Liu et al. 2013). Soy or egg phospholipids are traditionally employed for liposome preparation. Recently, another extract has shown potential as an ingredient for liposome preparation. Milk phospholipids can indeed be prepared from extracts derived from the milk fat globule membrane (MFGM) (Corredig, Roesch, and Dalgleish 2003). Liposomes prepared with milk phospholipids contain more saturated fatty acids and have been shown to exert a higher stability under in vitro digestion compared to soy phospholipids (Liu et al. 2012; Liu et al. 2013). In addition, milk phospholipids contain more sphingolipids. These compounds have been related to biological functions such as memory improvement and cellular signaling (Contarini and Povolo 2013). Thus MFGM phospholipids have recently been suggested as an alternative to soy for more nutritionally functional liposome preparation (Thompson and Singh 2006; Farhang 2013). Conventional liposome preparation methods involve organic solvents. Hence, food-grade liposome manufacturing techniques have been developed, including heating methods, microfluidization and extrusion (Mozafari 2005; Mozafari et al. 2008; Quintanilla-Carvajal et al. 2009; Farhang 2013). Though liposome preparations have 17 been well characterized in literature, their effectiveness as delivery systems in foods and above all, the bioefficacy after in vitro digestion of the compounds encapsulated within has yet to be fully evaluated. It has been shown that when encapsulated in liposomes, bioactives are better protected, and this results in enhanced bioefficacy (Nacka, Cansell, and Entressangles 2001; Taylor et al. 2007; Takahashi et al. 2008; Hermida, Sabés-Xamaní, and Barnadas-Rodríguez 2009; Smith et al. 2010; Liu et al. 2013). Furthermore, studies have also suggested that the surface modification of liposomes can improve their mucus penetration ability and enhance drug delivery (Li et al. 2011; Chen et al. 2013). However, to understand the interactions between liposomes and mucus, better approaches are needed than in vivo or ex vivo studies. 2.5 Significance of mucus on particle absorption During digestion, food particles are disrupted by enzymes, and the digestates interact with the gut mucosa and finally are absorbed by the epithelial cells. The nutrient molecules then enter into the bloodstream and systemic circulation (Naahidi et al. 2013). For bioactives to be absorbed in an active state, the delivery systems have to overcome the low pH of stomach, various digestive enzymes, the interactions with the mucus layer covering the intestine, and the selectivity of the cell membrane (Borel and Sabliov 2014). Though absorption may take place along different parts of the gastrointestinal tract, the small intestine is the main region of digestion and absorption of food components, especially proteins and lipids (Zhang et al. 2004; Benshitrit et al. 2012; Guerra et al. 18 2012). Although a number of in vitro studies have shown how the physical and chemical properties of food matrices may affect the digestion behaviour and absorption of nutrients (Takahashi et al. 2008; Mahler, Shuler, and Glahn 2009; Singh, Ye, and Horne 2009), much less in understood on the interactions between the macromolecular assemblies and mucus in the gastrointestinal tract. Recent studies have demonstrated that the interactions of the digestates with the intestinal mucus may affect the absorption of various food components (Cone 2009; Li et al. 2011; Mackie et al. 2012; Boegh et al. 2014 ). The inner surface of the small intestine is comprised of epithelial cells, which are the essential components for the uptake of nutrient molecules. The cells are covered by a mucus layer, which aids in the absorption of nutrients while avoiding toxic and harmful compounds. In the small intestine, the mucus layer is highly heterogeneous in density and porosity, and the mucus layer morphology and thickness depends on its location in the gastrointestinal tract (Mackie et al. 2012). The average pore size of the mucus layer underlying the human intestine is about 100 nm (Lai et al. 2009; Lai, Wang, and Hanes 2009). This is an important parameter when considering the optimal size of a delivery system, as it relates to its mobility through the mucus layer. Particles mainly pass through the small pores of the MUC2 mucin network by interaction between the inter-lamellar channels (Round et al. 2012). Conventionally, the diffusion of particles through the mucus network requires a mesh size that will allow the passage of the particles. Even though inconsistent mucus mesh sizes, from 20 nm to 340 nm depending on mucus origin and methods of determination, were reported in literature, nanoparticles as large as 0.5 ~ 19 2 μm have been shown to be able to diffuse through the mucus layer (Adam Macierzanka et al. 2011). Round et al. (2012) suggested a new transport mechanism of nanoparticles through the intestinal mucus. The lamellar structure of MUC2 seems to be critical for allowing the passage of large non-interacting particles transport through transient channels between individual lamellae, rather than requiring larger pores in the mucin gel (Round et al. 2012). Conflicting results can be found in the literature regarding the role that mucus may play on compound absorption. In general, most studies found mucus as a barrier to particle absorption (Nimmerfall and Rosenthaler 1980). For example, it was shown that a human native mucus layer, formed by mucin molecules produced from HT29-H, remained a significant barrier to the lipophilic compound testosterone. These barrier effects were attributed to the stabilization of the unstirred water layer and the interaction between mucus components and diffusing molecules (Karlsson, Wikman, and Artursson 1993). Similarly, it was demonstrated that the mucus layer secreted by HT29-MTX remained a significant barrier to drug absorption for a series of lipophilic drugs (Behrens et al. 2001). A decrease in drug permeability was also shown in cocultures of HT29-H/Caco-2 compared to mucus free Caco-2 (Allen et al. 1991). Furthermore, mucus also can decrease iron absorption, in in vitro cell models (Mahler, Shuler, and Glahn 2009). Although there seems to be evidence of the impact of mucus on absorption of certain nutrients, other studies demonstrated that mucus does not limit the transport and 20 absorption. A study testing the diffusion coefficients and permeability values of 19 compounds on Caco-2/TC7 and HT29-MTX showed similar values for both hydrophilic and lipophilic drugs, suggesting that the mucus layer secreted by HT29-MTX did not act as a diffusion barrier (Pontier et al. 2001). It was not possible to conclude that mucus was a barrier to particle uptake using a cocultures system of Caco-2/HT29-MTX as in vitro model to investigate the delivery of curcumin in solid lipid nanoparticles (Guri, Gülseren, and Corredig 2013). 2.6 In vitro models for evaluation of particle transport The effect of the intestinal mucus layer on the interactions and absorption of digested food assemblies is still under debate. When designing delivery systems it is thus necessary to evaluate compound transport based on a mucus-involved in vitro model. Despite this need, there are very few transport studies involving mucus and there is currently no standard protocol available for mucus penetration studies, or studies on the interactions between mucus and food molecules. Caco-2, a cell line derived from human colonic tumor, is the most frequently used in vitro model for drug absorption studies. As the molecular structure and physical and chemical properties of compounds are greatly associated with their absorption potential, the Caco-2 cell line is an established model to determine and rank the absorption potential of various components (Pontier et al. 2001). However, this model has some drawbacks. Caco-2 has the main disadvantage of being composed only of enterocytes, 21 while, in reality, mucus-secreting goblet cells account for the second most numerous cells in the intestinal epithelium. In addition, as the paracellular permeability of Caco-2 resembles colonic tissues, and when grown as a monolayer, these cells show low permeability for hydrophilic, paracellular transported compounds (Behrens et al. 2001). Other disadvantages include the lack of a nervous control, systemic blood flow and motility of the intestine, when these cells are studied on a monolayer surface (Behrens et al. 2001). The human adenocarcinoma HT29-MTX is a mucus producing cell model that has been developed to further investigate the role of mucus on drug transport across the intestinal barrier (Meaney and O’Driscoll 1999; Behrens et al. 2001; Pontier et al. 2001). The HT29-MTX is derived from the parental cell line HT29 after adapting it to 10-6 M methotrexate medium for 6 month. This allows development of goblet cells with morphological and mucin-producing characteristics. The mucin molecules produced by goblet cell monolayers form a mucus layer covering the apical side of cells (Pontier et al. 2001). Coculture models have been developed to represent the absorptive and goblet cell types commonly found in the small intestinal epithelium. In vitro drug and peptide absorption have been studied on cocultures of Caco-2 and HT29-H cells for more than two decades (Wikman-Larhed and Artursson 1995). Drug permeability seems to be well correlated between the in vitro coculture of Caco-2 and HT29-MTX and in vivo bioavailability data (Walter and Janich 1996). Hilgendorf also investigated cocultures of 22 Caco-2 and HT29-MTX at three different seeding ratios to systematic characterize the drug absorption screening procedure and study intestinal permeability of compounds (Hilgendorf 2000). These studies have shown that cocultures of Caco-2 and mucus-producing goblet cells grown together to form monolayers with tight junctions can be used simultaneously to study transport and absorption of food molecules. More recently, a novel approach was reported, whereby a biosimilar mucus comprised of purified gastric mucin, lipids and protein in buffer was employed and coupled with Caco-2 monolayer culture to establish a more representative in vitro model of the intestinal mucosa (Boegh et al. 2014). By using this model, it was shown that the biosimilar mucus significantly affected the permeability of various drug compounds (Boegh et al. 2014). In addition to in vitro models, in silico models can also be used to predict the role of mucus in absorption. The molecular diffusion through mucus can be characterized by relevant mathematical modeling. By knowing the characteristics of mucus gel, its constituents and the molecules themselves, drug transportation through mucus can be modeled based on the principles of physical chemistry (Cu and Saltzman 2009). 2.7 Physicochemical properties of delivery systems affect bio-interaction and mucus penetration Nanocarriers, such as nanoliposomes, nanoemulsion, solid lipid nanoparticles, are commonly known delivery systems shown to improve the stability, controlled release and 23 targeting property of incorporated bioactives. The physicochemical properties of the delivery vehicles, for example, particle size, surface charge and hydrophobicity not only affect their stability during processing and storage, but also affect the in vivo activity of the delivery systems (Borel and Sabliov 2014). It was shown that nanoparticles could be modified by their surface properties to modulate their interaction with mucosal layer and affect their adsorption and transport, hereby obtaining bioadhesive or non bioadhesive particles (Behrens et al. 2002). Nanoparticles are mainly uptaken through endocytosis, a process that is affected by particle size. The cellular uptake mechanisms involve entry into cells, immune cell stimulation, and particle clearance (Naahidi et al. 2013). Particle sizes between 60 and 500 nm can be endocytosed by enterocytes. Small nanoparticles between 1~20 nm reside in the cell longer than larger ones, whereas particles larger than 500 nm are usually excreted before entering the bloodstream (Yoo and Mitragotri 2010; Naahidi et al. 2013). Surface charge of nanoparticles affects bio-interaction during entry into cells, immune cell stimulation, toxicity, and plasma proteins (Naahidi et al. 2013). The intestinal mucus layer is negatively charged (Lai et al. 2009). It was hypothesized that negative charged particles may have higher penetration into the mucus, while neutral or positive charged particles may have limited diffusion through mucus (Macierzanka et al. 2011). The absorption of bile salts (BS) on the surface of the particles, or the formation of micelles, will increase negative charges and facilitate the penetration through mucus (Macierzanka et al. 2011; Maldonado-Valderrama et al. 2011; Macierzanka, Böttger, and 24 Rigby 2012). On the other hand, partially digested lipids droplets in the absence of BS will be more likely to adhere to mucus layer (Mackie et al. 2012). Hydrophobicity of carrier particles affects cellular uptake by their distribution, clearance as well as recognition of immune cells and plasma (Naahidi et al. 2013). It has been previously demonstrated that macrophages of the reticulo-endothelial system can recognize hydrophobic particles as foreign substances, resulting fast clearance through biliary excretion. On the other hand, hydrophilic particles are less likely to be seen as exotic objects in blood (Naahidi et al. 2013). Studies tested on purified gastrointestinal mucus demonstrated that lipophilicity was the most important physicochemical characterisc influencing drugs’ diffusion coefficient compared to size and charge (Larhed and Artursson 1997). Similarly, Karlsson, Wikman, and Artursson found hydrophobicity appeared to be a major effect in limiting drug diffusion across mucus layers among other parameters tested (Karlsson, Wikman, and Artursson 1993). Lai, Wang, and Hanes observed that hydrophobic particles transfer through mucus was slower than hydrophilic particles (Lai, Wang, and Hanes 2009). Moreover, the reduction in hydrophobic and/or electrostatic interactions of polyethylene glycol coated nanoparticles led to lower degrees of mucoadhesion and a rapid penetration through human mucus (Cu and Saltzman 2008). 2.8 Modification of liposomes may affect mucus penetration As mucus constitutes a potential barrier to the delivery of bioactive compounds, it is desirable to design delivery systems with mucus-penetrating properties to improve 25 delivery and ultimately promote absorption. Liposome is a commonly used carrier for delivery of various target compounds. Recent studies have shown that the liposomes surface properties may be modified to fine tunre their delivery properties. For example, when liposomes were modified using cationic and hydrophilic nonionic polymers, the oral absorption of cyclosporine A was improved (Chen et al. 2013). In vitro studies also revealed that chitosan-modified liposomes aggregate in simulated intestinal fluid, and could be found trapped in the mucus layer. Parallel in vivo results showed that the cationic liposomes mainly remained in the upper intestinal tract and had limited mucus penetration ability (Chen et al. 2013). On the other hand, liposomes modified with nonionic polymers were stable in simulated gastric fluid as well as intestinal fluid, and could penetrate the mucus layer and reach the epithelial surface (Chen et al. 2013). As pectin has well-known mucoadhesive properties, this polymer has also been investigated to determine its impact on the interactions with porcine mucin solution, when present on the surface of delivery systems. It was found that high methoxyl-pectin coated liposomes have the highest interaction with mucin, indicating by the largest particle size and turbidity (Klemetsrud et al. 2013). This work also suggested an in vitro method for estimating mucoadhesiveness of nanoparticles (Klemetsrud et al. 2013). 26 2.9 Mucus interaction with food components The barrier properties of intestinal mucus have been intensively investigated in the pharmaceutical field. However, although many in vitro digestion studies have been conducted to evaluate the bioaccessibility of bioactives in different food grade delivery systems, only limited information is available on the effect of mucus on bioaccessibility and bioavailability. The interactions between mucus and food components are mutually affected. On one hand, food components affect the properties of the mucus layer. On the other hand, the mucus layer can affect the bioavailability of the compounds of interest. The effect of food constituents on the rheological properties of the intestinal mucus has been studied. For example, it was shown that the presence of alginate in aqueous purified porcine gastric mucin causes the formation of a weak viscoelastic gels and promotes mucin-mucin interaction (Taylor et al. 2005). On the contrary, it was shown that low-molecular-weight guluronic acid oligomers extracted from alginate are able to disrupt mucus interactions in both purified and native porcine gastric mucus, resulting in rheological changes with decreased cross-link density and resistance of mucus gel deformation (Nordgård and Draget 2011). These two studies have shown that under different conditions, biopolymers interaction with mucus can either enhance or weaken the viscoelastic properties of this important intestinal barrier. It is important to note that the mucus used in these studies was an extract from porcine stomach. The origins of mucus and mucin compositions will affect the rheological behaviour (Boegh et al. 2014) , and will also cause differences in the interactions occurring with food components 27 (Taylor et al. 2005; Nordgård and Draget 2011). To date, most studies have been carried out using synthetic systems or mucus extracted from animals, especially porcine. Limited studies have been conducted with human intestinal mucus. In this thesis, the mucus expressed by a human colon cell culture was used for the first time. The intestinal mucus layer can be altered by microbial modulation. Many microbial-derived and host-derived factors were shown to affect mucin gene expression, mucus composition and mucus secretion (Deplancke and Gaskins 2001). Food components can also modulate mucin production. For example, whey proteins from milk stimulate intestinal mucin synthesis without affecting gene expression of MUC2 (Sprong, Schonewille, and van der Meer 2010). Another study found dietary fibers also protect against mucus degradation by decreasing bacterial translocation, and thus show the potential to reduce intestinal disorders (Komiyama et al. 2011). The presence of mucus may affect the bioavailability of the components present in the digestates. Mucin binds with iron, forming mucin-iron complexes which prevent iron precipitation at neutral pH in small intestine (Conrad, Umbreit, and Moore 1994). Recently, with an in vitro digestion model, it was shown that mucus plays a significant role in iron absorption as an increasing ratio of mucus-producing HT29-MTX resulted in a decline in iron detection (Mahler, Shuler, and Glahn 2009). In a study that observed changes in bioefficacy of polyphenols as antiproliferative agents also demonstrated higher viability in mucus-producing HT29-MTX cells compared to a decreased viability in HT29 cells. In this case, the decrease in cell proliferation was shown to be 28 proportional to polyphenol concentration (Guri, Haratifar, and Corredig 2014). The use of HT29-MTX cells may lead to a more accurate prediction of bioavailability, as these cells form a more physiologically realistic mucus layer on the surface. 2.10 Outlook The intestinal mucus is a dynamic gel network that acts as a protective barrier for the underlying epithelium while permitting the absorption of nutrients. Mucins (glycoproteins) are responsible for the viscoelastic behaviors of mucus in the gastrointestinal tract. Underestimating the role of the interactions between mucus and food components may lead to inaccurate predictions and may raise challenges in the design of delivery systems (Khanvilkar, Donovan, and Flanagan 2001). The mucus layer is destined to play a significant role in the uptake of nutrients and bioactives. However, the study remains challenging as understanding the mechanisms breakdown and absorption of food components during digestion is very complex. Various novel food engineering technologies, especially nanoencapsulation, have been developed and many food delivery systems have been introduced to improve the stability of bioactives during processing and storage. Nevertheless, the study of the changes occurring during digestion in food matrices delivering bioactives is just in its infancy. Some in vitro models have been developed to predict the permeation and uptake of compounds through mucus. For small, uncharged molecules that do not interact with mucus and can diffuse readily through mucus gel network, mucus-lacking models, such 29 as Caco-2 monolayer, seem viable (Khanvilkar, Donovan, and Flanagan 2001). However, most food components are still organized in macromolecular structures, and are often charged, and the particles may interact with mucins and other mucus components. They can easily be entrapped into the mucus network and result in changes to mucus characters and barrier properties. The mucus layer may then interact with bioactive compounds and lead to a lower bioavailability, or a change in the kinetics of absorption. Hence, more information is required to better understand the mucus interactions with food delivery platforms. By better understanding such interactions it will be possible to modify the structural and physicochemical properties of food delivery systems to enhance the delivery of bioactive compounds through mucus layer. 30 Chapter 3. Interfacial dilational properties of tea polyphenols and milk proteins with gut epithelia and the role of mucus in nutrients adsorption 3.1 Introduction During the last decade increasing effort has been focused on the design of food-based delivery system to benefit human health. These processes not only require better structuring of food matrices with higher nutritional and functional properties, but also, an in-depth understanding of how food components are broken down and absorbed during digestion. During human digestion mechanical and enzymatic transformations occur simultaneously during transit through the mouth, stomach and intestine (Guerra et al. 2012). In the gastrointestinal tract, the small intestine is the main port for nutrient absorption. The luminal surface is comprised of gut epithelial cells that are covered by a mucus layer, acting as a defensive barrier against harsh digestive environment. Mucus, commonly referred to as a viscoelastic gel and a non-Newtonian fluid, is synthesized and secreted by specialized goblet cells (D’Agostino et al. 2012). Mucus is comprised mainly of water and mucins, but also other minor components like DNA, lipids, ions, proteins, cells and cellular debris (Lai et al. 2009). Mucins are high molecular glycoproteins responsible for its gel like behavior (Tabak et al. 1982). Epigallocatechin-3-gallate (EGCG) is the most abundant catechin in green tea, and it has been shown to have biological activities, and of particular relevance to this work, anti-inflammatory and anti-proliferative properties on cancer cells (Chacko et al. 2010; 31 Gülseren, Guri, and Corredig 2012). Hence, polyphenols make ideal model molecules to study the delivery of bioactives via food matrices, as their presence and activity can be tested on human intestinal cancer cells (D’Agostino et al. 2012). In nature, polyphenols are mostly present as a complex with other components. It has been shown that polyphenols have high affinity for proteins (especially proline rich proteins) and often cause their precipitation (Sausse, Aguié-Béghin, and Douillard 2003; Jöbstl et al. 2004; Aguié-Béghin et al. 2008; Hasni et al. 2011; Haratifar and Corredig 2014). Likewise polyphenols have preferentially shown to bind to oral mucus, which subsequently lead to physical changes to the mucus layer and the complex formed result in a dry perception in the mouth, referred as astringency (Jöbstl et al. 2004;Monteleone et al. 2004). Similar polyphenol-mucin complexes may form with the intestinal mucus during digestion of polyphenols rich foods, and may affect the release and absorption of nutrients. A previous study of EGCG cytotoxicity on human colon cancer cells showed higher cell viability on HT29-MTX compared to HT29 cells, the former containing a confluent mucus layer that mimics the intestine (Guri, Haratifar, and Corredig 2014). However, the mechanisms behind the gut epithelia layer-nutrient interactions during absorption are still largely unknown, especially those interactions occurring between food molecules and mucus before they reach the underlayered absorptive cells. The objective of this study was to determine the interactions of nutrients and intestinal mucus at the interface in vitro, using epithelial mucus extracted from human 32 colonic adenocarcinoma cells HT29-MTX. The complexes between EGCG and milk proteins, in particular, caseins, were employed as model system for this study. It has been recently shown that EGCG forms complexes with milk proteins, namely caseins and whey proteins (Aguié-Béghin et al. 2008; Haratifar and Corredig 2014; Lestringant et al. 2014). The in vitro digestion of EGCG casein micelles complexes did not inhibit proteolysis of caseins during digestion, and did not alter its bioefficacy (Guri, Haratifar, and Corredig 2014). In addition, when the absorption of β-lactoglobulin-EGCG complexes was tested using Caco-2 cells, it was reaffirmed that the EGCG bioaccessibility was retained also in this protein complex, and that the complexes protected EGCG from degradation (Lestringant et al. 2014; Shpilgelman et al. 2010). In this work, it was hypothesized that intestinal mucus may interact differently with free EGCG or when EGCG is associated with macromolecular assemblies such as casein micelles, and that non-digested and digested systems may also exhibit different adsorption behavior. To test these hypothesis, the uptake of EGCG either in the free form or complexed with skim milk proteins was tested on a Caco-2 cell monolayer (which does not contain mucus) and a co-culture of Caco-2/HT29-MTX where mucus covers the monolayer. Further, the molecular aspects of nutrient-mucus interactions were studied using interfacial dilational rheology. The mucus was harvested from HT29-MTX cell line, as this will confer less artifacts than a simulated mucus mixtures (Boegh et al. 2014). The molecular interactions between EGCG, milk and mucus were tested in situ with or without trypsin hydrolysis, to determine possible differences due to digestion of the 33 protein. 3.2 Materials and Methods 3.2.1 Materials Tea polyphenol (Teavigo®, DSM Nutritional Products, Ayr, ON, Canada) extract contained mostly (−)-epigallocatechin-3-gallate (EGCG) (min. 94 %). HPLC-grade water was obtained from Fisher Scientific (Mississagua, ON, Canada). Dulbecco’s Modified Eagle medium (DMEM) (25 mM glucose), HEPES buffer, protease inhibitor cocktail (P8340) were obtained from Sigma-Aldrich Corporation (Oakville, ON, Canada). MilliQ water (Billerica, MA, USA) was used for sample preparation. Fetal bovine serum (FBS) heat inactivated, nonessential aminoacids (NEAA), 0.25% trypsin (1mM EDTA 4Na) (1×), L-glutamine, penicillin-streptomycin (10000 units of penicillin and 10000 µg of streptomycin per ml), phosphate-buffered saline (PBS), Hank’s balanced salt solutions (HBSS), were purchased from Invitrogen (Invitrogen Canada Inc., Burlington, ON, Canada). Transwell permeable polyester (PET) clear inserts (0.4 μm) and 12-well cell culture plates were obtained from Corning (Fisher Sci., Mississagua, ON, Canada). Freshly pasteurized skim milk was purchased locally (Parmalat Canada Inc., Toronto, Canada). 3.2.2 Cell viability Caco-2 cells were obtained from the Canadian Research Institute for Food Safety 34 (CRIFS) Culture Collection (Food Science, University of Guelph, ON, Canada) and HT29-MTX cells were differentiated from HT-29 (Guri, Gülseren, and Corredig 2013). The cells were maintained in DMEM supplemented with 10% FBS, 100 U.mL-1 penicillin, 100 mg.mL-1 streptomycin, 1% NEAA and 2 mM L-glutamine at 37 ºC at humidified atmosphere containing 5% CO2 incubator (Forma Series II Water-jacketed CO2 Incubator, Model No: 3110, Forma Scientific, California, USA). Caco-2 and HT29-MTX adenocarcinoma cells were seeded separately on 96-well plates (Fisher Sci.) at a density of 8 x 10³ and 4 x 10³ cells per well, respectively, and allowed to grow for 24 h until reached 90 % confluency. Then the old medium was removed and plates were washed with PBS (3x), and incubated in medium without serum 1 h prior to treatment. Freshly prepared EGCG or EGCG in milk dispersions at a final concentration in the well 150 μg.ml-1 was added to the cells. After 24 h incubation the spent medium was discarded followed by washing with PBS (3x) to remove the possible cell debris. Cell proliferation was assessed based on NADPH production using CellTiter 96®reagent (CellTiter 96®Aqueous One Solution Cell Proliferation Assay, Promega, Madison, WI). The relative optical density (OD)/well was determined at a wavelength of 490nm with a 96-well plate reader (Multi detetctor Microplate Reader, Biotek Synergy HT Model, Vermont, USA). The cell viability was measured as percentage of viability with regard to untreated control samples (taken as 100%) corrected for the blank values (wells without cells). Results were expressed as means and standard deviations of three independent experiments, each consisting of quadruplicates. 35 3.2.3 EGCG uptake Caco-2 cells alone were seeded in twelve-well Transwell® plates (0.4 μm pore size, inserts of 1.2 cm diameter, BD Biosciences, Becton Dickinson and Company, Mississauga, ON, Canada) at a density of 6x10⁴ cells per insert. For cocultures, Caco-2 and HT29-MTX were grown separately and were mixed prior to deeding at a ratio 75:25 (v/v) at final density 6x10⁴ cells per insert. This seeding ratio was chosen to mimic the ratio between the major cell types in the intestine (Mahler, Shuler, and Glahn 2009). The cells were maintained for three weeks until they reached full confluency and medium was changed every other day. Apical and basolateral compartments were washed with PBS to remove any debris and then incubated respectively with 500 µL and 1500 µL of DMEM, (no FBS). A stock solution of EGCG in water or EGCG–milk (combining the stock EGCG solution with skim milk) at a concentration of 1 mg ml-1 was initially prepared and and allowed to equilibrate for 20 min at 4°C (Guri, Haratifar, and Corredig 2014). The cells were incubated with DMEM medium at 37 ºC for 30 min prior to the experiments to equilibrate the monolayers and the EGCG in aqueous solution or complexed with milk at a final EGCG concentration 150 μg well-1 was administered to the cells. Cells were incubated for 2 and 4 h at 37 ºC respectively. The integrity of the monolayer was checked during uptake by measuring the transepithelial electrical resistance (TEER) (Evon World Precision Instruments, Sarasota, FL, USA). After the transport experiment the basolateral samples were collected and stored at – 80 ºC untill 36 analysed. 3.2.4 EGCG quantification The amount of EGCG found in the basolateral compartment after the completion of the uptake experiments was quantified by means of Liquid Chromatography/Mass Spectroscopy (LS/MS/MS) (Zhang et al. 2004). The collected medium was immediately freeze-dried (Genesis 25L, Virtis, SP Industries, Warminster, PA, USA) to concentrate the samples and subsequently reconstituted in methanol, centrifuged at 6000×g for 10 min then filtered in a 0.45 µm PVDF filter (Fisher Sci, Mississagua, ON, Canada) to remove the insoluble matter. Samples were injected into a Dionex UHPLC (UltiMate 3000) liquid chromatograph interfaced to an Amazon SL ion trap mass spectrometer (Bruker Daltonics, Billerica, MA). A Luna C18 column (5 µ particle size, 150 mm x 2 mm, Phenomenex, CA, USA) was used for chromatographic separation. The initial mobile phase conditions were 90 % water (0.1 % formic acid) and 10 % acetonitrile (0.1 % formic acid) then a single step gradient to 100 % acetonitrile in 10 min was reached. The flow rate was maintained at 0.4 ml min-1. MRM mode was used to select the parent ion at 457 with 4 m/z isolation width and 169 m z-1 product ion was monitored for quantification. The mass spectrometer was set on enhanced resolution negative-ion mode. The instrument was externally calibrated with the ESI TuneMix (Agilent). Quantitation of EGCG was determined using the Quant Analysis software (Bruker Daltonics). EGCG concentrations in the samples were calculated based on the comparison of the intensity values with 37 reference samples. 3.2.5 Mucus extraction To obtain the mucus dispersion, HT29-MTX cells were growing routinely in T-75 flasks for 21 days, by the time they completed their differentiation. After complete mucus formation, cells were gently washed with PBS (100 mM) to remove any cell debris. Afterwards, 10 ml of PBS (100 mM) supplemented with N-acetyl cysteine (10 mM) and the cocktail protease inhibitor at a ratio 1:1000 (v/v) was added to harvest the mucus. Cells were incubated at 37 °C, 5 % CO2 for 1 h and kept under mild agitation. The mucus suspension was gently aspirated, aliqouted in eppendorf tubes and kept at -80°C until analyzed. 3.2.6 Sample preparation The protein content of the mucus was 1.1±0.1 mg ml-1 as determined by Lowry (Lowry et al. 1951). Mucus and milk dispersions were prepared in (100 mM) PBS with a final protein concentration of 0.1 mg ml-1 which was used throughout the study. EGCG stock solution was added to milk or mucus dispersion at a concentration of 0.25 mg ml-1. To study the mixtures of EGCG and milk in mucus, a mixture of EGCG-milk was prepared first and then added to mucus dispersion to the final same concentration as described above. These dispersions were equilibrated at room temperature and used for interfacial dilational characterization by drop shape tensiometry. 38 3.2.7 Interfacial tensiometry The interfacial tension (γ) and surface dilational modulus (E) at air-liquid interface were studied using a dynamic drop shape tensiometry (20±1℃) (Tracker, IT Concept, Longessaigne, France) as previously described (Gülseren and Corredig 2012). An air bubble of 5 l volume was automatically formed at the tip of a sample syringe, which was immersed in a glass cuvette containing different bulk solution. The final concentration of mucus was 0.1 mg ml-1 (protein based), which was corresponded to a 1:10 dilution from the original mucus in phosphate buffer. Similarly, milk was added at 0.1 mg ml-1 protein, and in mixed samples, the final concentration was 0.2 mg ml-1 (based on protein). The interfacial tension over time was recorded at sampling frequency 0.5 s-1. A charge coupled device (CCD) camera was employed to acquire high quality images of the syringe and the cuvette. Dynamic interfacial tension (γ) was calculated based on the Younge-Laplace equation (Lucassen-Reynders, Cagna, and Lucassen 2001). The dilational viscoelasticity measurements were carried out after the interfacial tension reached a plateau after 1 h. The air bubble was subjected to sinusoidal oscillation at a certain frequency (6.7 mHz to 100 mHz) with strain amplitude 0.1 (ΔA/A = 0.1, A being the droplet surface area). This strain amplitude was predetermined to be within the linear viscoelastic range (data not shown). The surface dilational viscoelastic modulus (mN m-1) was calculated from the change in interfacial tension (dγ) relative to the change in droplet surface area (dA) 39 (Lucassen-Reynders, Cagna, and Lucassen 2001): E= 𝑑𝛾 𝑑 𝑙𝑛 𝐴 (1) E is a complex modulus as the dynamic surface tension relaxation is a time-dependent processes (Rossetti, Ravera, and Liggieri 2013a). 3.2.8 Trypsin hydrolysis of milk protein In situ tryptic digestion was performed at room temperature. Trypsin stock (1 mg ml-1) was freshly prepared in phosphate buffer. Then enzyme was carefully added to glass cuvette at trypsin to milk protein ratio 1:100 (w/w), and the surface tension was monitored for 3 h until equilibrium state was reached. After reaching the plateau of surface tension, a sinusoidal oscillation was performed at fixed frequency (100 mHz) as a function of drop aging time to provide information on the viscoelastic properties of the pre-adsorbed interfaces. As the interfacial viscoelasticity did not seem to reach a plateau over time, at the 3000 s experiment was stopped and the viscoelastic modulus of all samples were compared. Enzymatic hydrolysis was also performed at 37 C in water bath for 1 h and the interfacial parameters, interfacial tension (γ) and dilational viscoelasticity (E) were compared to in situ hydrolysis. The mucus dispersion contained same amount of protein (0.1 mg ml-1) as milk proteins and trypsin was added to achieve the same enzyme: protein ratio (1:100). For the mixtures of milk and mucus (1:1), though it contained 0.2 mg ml-1 in total, trypsin was not expected to hydrolyzed mucin, thus amount of enzyme was maintained constant for in 40 situ digestion experiment. Trypsin in phosphate buffer as control was also performed. The procedure of EGCG addition (0.25 mg ml-1) to samples was same as previously described in 3.2.6. 3.2.9. Statistical analysis All tests were performed in triplicate and presented as average with respective standard deviations. One-way analysis of variance (ANOVA) and Tukey HSD test were used to assess the statistical significant differences among test samples, with p<0.05 considered significant. 3.3 Results and Discussion 3.3.1 Cell viability and uptake of EGCG on cell cultures The anti-proliferative and chemopreventive effects of EGCG on various human cancer cell lines have been demonstrated (Yang et al. 1998; Valcic et al. 1996). However, it has been previously hypothesized that the presence of mucus layer may cause increased resistance against EGCG toxicity (D’Agostino et al. 2012; Guri, Haratifar, and Corredig 2014). In this study, the toxicity of free EGCG as well as a mixture of milk and EGCG (whereby EGCG would be present as a complex with the protein) at a final concentration of 150 g well-1 was tested on both HT29-MTX and Caco-2 cells after 24 h (Figure 3.1). 41 140 Cell viability (%) B A 120 100 80 60 40 20 0 0.27 0.54 1.09 2.18 3.27 0.27 0.54 1.09 2.18 3.27 EGCG concentration ( M) Figure 3.1 Cell viability (%) of HT29-MTX (A) and Caco-2 (B) incubated with EGCG in solution (black bars) or EGCG-milk mixture (white bars) as a function of dilution rate in the cell culture medium during an incubation period of 24 h in humidified atmosphere at 37° C and 5% CO2. Cells growing in medium only were used as control. All the experiments were carried out at least in triplicate. 42 These two cells differ in the presence of mucus on the monolayer. As expected, the presence of EGCG in the medium decreased cells’ viability. There was a lower effect of EGCG when present with milk, at concentrations < 1 g ml-1. This confirmed previous results: the difference was attributed to the nutrient enriched media when milk is present, in addition to the association of EGCG with the milk proteins (Haratifar and Corredig 2014). The response to EGCG toxicity of the two cell lines, Caco-2 and HT29-MTX, was not significantly different. It was hypothesized that at post confluence, the two cell lines would show different behavior due to mucus build up on the monolayer by HT29-MTX cells, which may alter the absorption of the nutrients. The similar effect of EGCG on the cell viability would suggest that the presence of mucus did not change the bioefficacy of EGCG for the two cell lines. Uptake experiments were also conducted, using a co-culture of Caco-2/HT29-MTX. The results of the uptake of free EGCG or EGCG complexed with milk protein was compared to the uptake on a Caco-2 monolayer system. This cell line does not produce mucus. The transepithelial electrical resistance (TEER) value was measured prior to and after the uptake experiment and no changes in TEER (%) were recorded (data not shown). The constant TEER values confirmed the integrity of the cell monolayers during the uptake experiments. After 2 h incubation, in the Caco-2 monolayer transport experiments, approximately 1.3 % of the initial EGCG applied to the cells was recovered in the basolateral fractions. However, this was not the case for the EGCG complexed with milk, where the amount of 43 EGCG in the basolateral fraction was below the detection limit (as measured by LC/MS/MS). Similarly, EGCG was also not recovered in the basolateral fraction of the cocultures of Caco-2/HT29-MTX, for both free and complexed EGCG. An extended uptake experiment was conducted for 4 h, and in this case, EGCG was not recovered regardless of the cell line model or of the EGCG treatment. EGCG is a very labile, fast degrading molecule (Nagle, Ferreira, and Zhou 2006). As cell viability experiments (Figure 3.1) demonstrated the bioefficacy of the EGCG in both systems, it was concluded that the molecule was rapidly oxidized and metabolized within the cell, hence, the little recovery in the basolateral fraction. . Although the shorter incubation time suggested a possible difference in the uptake of EGCG between complexed and free, and a possible effect of mucus on the uptake, it was not possible to describe the underlying mechanism and identify possible differences with these uptake experiments. These results clearly raised the need for alternative approaches to better understand the interactions of mucus with the EGCG, free or complexed with milk proteins. In the present research, drop tensiometry was employed to study such interactions. 3.3.2 Drop tensiometry studies 3.3.2.1 Interfacial tension The binding of polyphenols to milk proteins and saliva mucus has been extensively studied (Arts et al. 2002; Bennick 2002; Yuksel, Avci, and Erdem 2010). Dilational 44 rheology has been previously employed to study the ability of saliva mucins to bind to different polyphenols (Rossetti, Ravera, and Liggieri 2013a,b). In this work, the behaviour of EGCG, free or complexed with protein, was observed using drop tensiometry. All samples were dissolved in 100 mM phosphate buffer. This buffer had a baseline interfacial tension value of 73.8±0.5 mN m-1, not different from the values measured for air water (ultrapure water) interfaces (about 72 mN m-1). Preliminary experiments were conducted by testing the changes in interfacial tension for varying concentrations of EGCG (from 50 g ml-1 to 1000 g ml-1). A concentration of 250 g ml-1 was chosen for all the experiments. At this concentration, the interfacial tension measured for the interface prepared from the EGCG solution (250 g ml-1) was 70.9±0.2 mN m-1. The results clearly confirmed that EGCG had no surface activity, as previously reported (Sausse, Aguié-Béghin, and Douillard 2003). The changes occurring at the interface as function of time for EGCG in isolation, skim milk proteins, mucus extracted from the HT29-MTX, and their mixtures are shown in Figure 3.2. Regardless of the treatment, there was a decrease in the interfacial tension as a function of time, reaching a plateau value for all the interfaces tested. The differences between the plateau values are summarized in Table 3.1. The interfacial tension of the mucus layer, at a concentration of 0.1 mg ml-1 (protein basis), reached values of about 41.5 mN m-1 (Table 3.1). This value was significantly lower than the interfacial tension measured for the milk proteins’ layer (47.7mN m-1), also tested at 0.1 mg ml-1 protein. 45 -1 Interfacial Tension (mN m ) 80 B A 70 60 50 40 30 0 1000 2000 0 3000 500 1000 1500 2000 2500 3000 3500 Time (s) Time (s) Figure 3.2 Changes in the interfacial tension for mucus (squares), milk (circles) and milk and mucus interfaces (filled triangles), in the absence (A) and presence (B) of 250 mg ml-1 EGCG. Results are representative runs. For statistical analysis see Table 3.1. 46 Table 3.1 Interfacial tension of the air-liquid interface of milk, mucus and milk in mucus with and without EGCG. Values are means and standard deviations of at least 2 individual replicates. Different letters indicate significant difference (P<0.05). Sample Mucus Milk proteins Mucus and Milk proteins No EGCG (mN m-1) EGCG added(mN m-1) 41.5 ± 2.3 a 47.7 ± 0.1 b 45.8 ± 0.1 ab 42.2 ± 2.1a 51.5 ± 0.2 b 42.0 ± 0.4 a 47 The lower interfacial tension for mucus was due to the surface active glycoproteins, mucins (Lai et al. 2009). Furthermore, the decrease of the interfacial tension in the case of mucus was slower than when milk proteins were present (see for example, Figure 3.2A), and it reflected the slower rate of adsorption of mucins at the interface, compared to milk proteins. When a mixed interface of milk and mucus was tested (0.1 and 0.1 mg ml-1 protein, respectively) (Figure 3.2A), there was a faster decrease in the interfacial tension due to the presence of milk proteins; however, the final value of interfacial tension (45.8 mN m-1) was not significantly different from that of the mucus interface. This indicated that the mucin proteins were present at the interface. Figure 3.2B illustrates the changes in the adsorption behaviour for mixed interfaces in the presence of EGCG (250 g ml-1). There was no effect of EGCG at the mucus interface, with a similar adsorption kinetic as well as statistically comparable values of interfacial tension (Table 3.1). This was also the case with milk, whereby the presence of EGCG did not significantly change the interfacial tension at plateau. In the case of the mixed interface containing mucus extract, milk proteins and EGCG, there was a faster adsorption, similar to what observed in milk, but with a lower plateau interfacial tension, compared to milk alone, suggesting once again, the presence of mucin protein in the mixed interface. The results shown in Figure 3.2 clearly led to the conclusion that EGCG did not affect the interfacial adsorption of milk proteins and mucins, and that in all cases, there were no differences in the interfacial tension in the presence of EGCG. Previous reports have identified the presence of complexes between EGCG-casein proteins which 48 affect the rearrangements of the proteins on the interfacial film (Aguié-Béghin et al. 2008). Furthermore, EGCG seems to delay the adsorption kinetics of β-casein (Sausse, Aguié-Béghin, and Douillard 2003). The present work used mixed milk protein interfaces, and no changes were observed. 3.3.2.2 Interfacial viscoelasticity The viscoelastic properties of the mixed interfaces were determined to provide further understanding of the interactions among mucus extract, milk proteins and EGCG. After reaching plateau (see Figure 3.2), the air bubble was subjected to a controlled sinusoidal oscillation at a strain amplitude of 0.1 (Figure 3.3). The values of the interfacial modulus of dilational viscoelasticity measured at 100 mHz are shown in Table 3.2. The interfacial viscoelasticity of the mucus interface was much larger than that of milk protein interfaces. For example, an air-water interface of saliva mucus was previously reported have elastic properties, with moduli > 60 mN m-1 (Rossetti, Ravera, and Liggieri 2013 a,b) while air-water interfaces covered by 𝛽-casein show moduli around 10 mN m-1 (Martin et al. 2002). In this study, the interface formed with milk proteins showed an elastic modulus of about 11-14 mN m-1 at low frequency, (<20 mHz) and reached a plateau at 19 mN m-1 (Figure 3.3A, Table 3.2). The frequency dependence of the interfacial modulus of dilational viscoelasticity is fully consistent with previous literature reports. 49 45 40 30 -1 E (mN m ) 35 25 20 15 10 5 A 0 40 30 -1 E (mN m ) 35 25 20 15 10 5 B 0 40 30 -1 E (mN m ) 35 25 20 15 10 5 C 0 0 20 40 60 80 100 Frequency (mHz) Figure 3.3 Dilational viscoelasticity as a function of frequency of milk proteins (A), mucus (B) and mixed milk and mucus interfaces (C) in the absence (solid symbols) or presence (empty symbols) of EGCG (0.25 mg ml-1). Values are the average of at least two individual experiments, bars indicate standard deviations. 50 Table 3.2 Interfacial dilational viscoelastic modulus of the air-liquid interface of milk, mucus and milk in mucus with and without EGCG. Measurements reported for 100 mHz and a strain amplitude of 0.1. The data are means and standard deviations of at least 2 individual replicates. Different letters indicate significant difference (P<0.05). Sample Milk proteins Mucus Mucus and Milk proteins No EGCG (mN m-1) EGCG added(mN m-1) 19.4 ± 0.7 a 36.8 ± 2.9 b 34.4 ± 0.2 b 23.6 ± 0.1 a 40.3 ± 0.5 b 37.6 ± 2.6 b 51 Casein proteins, present in the largest concentration in milk, are flexible molecules, and rearrange at the interface. Similar dilational moduli have been reported for caseins (Martin et al. 2002). Whey proteins, on the other hand, form more elastic networks at the interface to limit molecules diffusional and conformational relaxation (Williams and Prins 1996; Gülseren and Corredig 2012). These proteins usually show less frequency dependence. Milk interfaces containing EGCG showed little difference in elastic modulus at 100 mHz (Table 3.2); however, the results would suggest that complex formation affected the flexibility of the proteins, as the modulus was high also at low frequencies, in the presence of EGCG (Figure 3.2A), with a value of 20.5±0.3 mN m-1 in the presence of EGCG, compared to 11.9±0.9 mN m-1 for the interface containing only milk protein. This indicated the formation of a more rigid and elastic film caused by complexes with EGCG. The mucus interface showed no frequency dependence of the elastic modulus, indicating a predominantly elastic interface, with a value of about 33 mN m-1 at all frequencies (Figure 3.3B). The viscoelasticity of such interface is fully consistent with its protective and functional roles as biological material in GI tract (Lai et al. 2009; Mackie et al. 2012). The addition of EGCG (Figure 3.3B) did not significantly affect the dilational viscoelastic modulus of mucin interfaces at 100 mHz (Table 3.2), albeit there was an increase at the low frequencies. These results confirm the reports on human whole saliva mucins, where it has been shown that exposure of polyphenol solutions strengthened the viscoelastic modulus of human whole saliva, which contained mucus as 52 a major component (Rossetti, Ravera, and Liggieri 2013 a,b). The discrepancy points at the molecular differences in composition of the mucin proteins in the various gastrointestinal environments, and indicates that the use of mucin produced by cell cultures may be a relevant model for the study of the interactions between intestinal mucus and food components. The interfacial rheology of mixed interfaces of milk protein (0.1 mg ml-1) and mucus (0.1 mg ml-1 protein) with and without EGCG is also shown in Figure 3.3C. Unlike for the mucus interfacial layer, a mixed milk protein-mucus interface showed a frequency dependence of the dilational viscoelastic modulus, and a high modulus at 100 mHz, not different than that measured for mucus alone (Table 3.2). The frequency dependence would suggest the presence of milk proteins at the interface, but the value of the dilational modulus was higher than that for the milk interface (shown in Figure 3.3A), and significantly lower than that of mucus interface (Figure 3.3B). Milk proteins are fast adsorbing at the interface, and this affected the rigidity of the film at low frequencies, while at the higher frequencies, when there is little time for recovery, the elastic properties of the mucus prevailed. These differences in the rheological behaviour for the mixed interface demonstrated that milk-mucus interfaces are substantially different from mucus interfaces alone. These results suggest that this physical method of studying dilational viscoelasticity allows determining possible interactions between human mucus and food macromolecules during digestion (Figure 3.3C). Figure 3.3C clearly indicates that the presence of EGCG changes the properties of 53 the mixed interface. The overall viscoelastic behaviour was quite similar, although there was an increased dilational modulus at all frequencies (Figure 3.3C) compared to the mixture without EGCG. These changes in the viscoelastic properties point to the formation of a complex between milk, mucus proteins and EGCG, and an increase in the rigidity of the mixture with EGCG in the mucus layer. The properties of the interface are greatly influenced by the structural properties of the macromolecules (Girardet et al. 2000). The interfacial rheology depends not only on the composition but also the structure of molecules and their interactions (Gülseren and Corredig 2012). When proteins undergo rearrangements and conformational changes, the dynamic and mechanical properties of surface layers are modified (Fainerman, Lucassen-Reynders, and Miller 1998). In this study, the interactions of polyphenols with mucus were further confirmed by the changes occurring to the viscoelastic properties of the mixed interfaces whereas mucus exhibited predominantly elastic properties as shown by the values of surface tension and dilational viscoelasticity. These results are in full agreement with previous reports (Boegh et al. 2014), on the rheological profile of a biosimilar mucus mixture composed of purified gastric mucin, lipids and protein in buffer. It could be concluded that the EGCG affects the adsorption of milk proteins by changing the surface properties of the milk proteins. This would confirm previous reports that the hydroxyl group of EGCG preferably binds to proline rich groups of caseins (Yuksel, Avci, and Erdem 2010), and not affecting the adsorption at the interface, but their structuring at the interface. 54 3.3.3 Interfacial properties after in situ trypsin digestion In the human body, nutrients undergo oral, gastric and intestinal stages of digestion before they can reach the intestinal mucus layer, and be absorbed by epithelial cells. The absorption of the nutrients from the matrices may be dependent on the diffusion of compounds through the mucus layer. To better understand how the interactions between EGCG and milk proteins with the mucus, further experiments were carried out with interfaces subjected to in situ hydrolysis with trypsin, or after trypsin treatment of milk protein. It was indeed hypothesized that polypeptides, small peptides and amino acids resulting from milk protein hydrolysis may be less prone to changes in the viscoelastic properties of the mucus layer. Trypsin alone in buffer had high surface tension 49.87±1.4 mN m-1, indicated preferable adsorption of milk proteins to the interface, Trypsin hydrolysis caused an increase in surface activity of the milk interface. After in situ hydrolysis, the surface tension values of milk proteins’ interface significantly decreased from 47.7±0.6 mN m-1 to 42.2±0.5 mN m-1 (Table 3.3). Furthermore, there were significant increases of the interfacial dilational modulus for milk proteins after hydrolysis, at all oscillation frequencies due to the hydrolysis of the milk proteins, for example, at 100 mHz, the dilational modulus increased from 19 to 41 mN m-1 (Figure 3.4). 55 60 E (mN.m-1) 50 40 30 20 10 0 0 20 40 60 80 100 Frequency (mHz) Figure 3.4 Interfacial modulus of dilational viscoelasticity for a milk protein interface, before (filled circles) and after tryptic digestion, as a function of oscillation frequency. The values are average of at least two individual experiments. The milk interface was subjected to in situ hydrolysis at room temperature for 3 h during tensiometry experiments (empty circles) or milk was incubated with trypsin for 1 h at 37 °C and the hydrolysate was then tested by drop tensiometry (filled inverted triangles). 56 Table 3.3 Surface tension of milk before and after trypsin digestion. Two different digestion conditions were used, 3 h room temperature in situ in the cuvette and 1 h digestion at 37 C in water bath prior to testing in the tensiometer. The data are means and standard deviations of at least 2 individual replicates. Sample Milk control Milk + trypsin (without trypsin) in situ Surface Tension (mN m-1) 47.7 ± 0.6 42.2 ± 0.5 57 Milk + trypsin 37C (1h) 43.0 ± 0.7 A separate experiment was also conducted by incubating milk proteins in the presence of trypsin in solution, prior to the interfacial dilational experiments. The results are summarized in Table 3.3 and Figure 3.4. The interfacial parameters (both interfacial tension and dilational modulus) were fully comparable to those of the experiments carried out in situ, with a value of interfacial tension for the peptides solution of 43.0±0.7 mN m-1 (Table 3.3) and a comparable behaviour of the elastic modulus (Figure 3.4). In both cases, with in situ trypsin digestion or with predigested peptides, the interfacial modulus of dilational viscoelasticity was higher than for the unhydrolyzed milk proteins interface. The frequency dependence of the elastic modulus was maintained, with lower modulus at low frequencies in both cases (Figure 3.4). It is therefore important, when studying the interactions between milk proteins and human intestinal mucus, to take into account the presence of peptides in the complex mixture. In addition to the surface tension, measurements were also carried out to determine the interfacial modulus of dilational viscoelasticity. The mucus interfacial layer, the milk protein interfacial layer and the mixture were all measured after digestion as summarized in Table 3.4. After addition of trypsin in situ, samples were first allowed to reach a plateau of interfacial tension (around 3h), then the bubble was subjected to oscillation at an amplitude of 0.1, a frequency of 100 mHz. 58 Table 3.4 Surface tension () after in situ digestion (3 h) of the air-liquid interface and dilational viscoelastic modulus ( at 3000s aging time, frequency 100 mHz, strain amplitude 0.1. The data are means and standard deviations of at least two individual replicates. Within each column, different letters indicate significant difference (P<0.05). Sample (mN m-1) (mN m-1) Mucus Milk Mucus and milk Mucus with EGCG Milk with EGCG Milk and mucus, with EGCG 45.5 ± 0.1bc 42.0 ± 0.7ab 41.0 ± 0.9a 47.4 ± 1.5c 44.5 ± 1.3abc 41.1 ± 0.4a 62.6 ± 1.1cd 41.5 ± 1.6a 50.0 ± 2.7b 68.9 ± 1.5d 47.9 ± 1.1ab 58.1 ± 2.4c 59 In situ trypsin hydrolysis caused significant changes to the values of surface tension measured at the air/water interface. These results were well in line with previous published reports, as after trypsin hydrolysis, cleaving the carboxyl side of the amino acids lysine or arginine, the proteins undertake conformational changes, and the hydrophobic nonpolar side-chains which usually locate at interior area of proteins, are released and exposed to relocate to air phase (Phillips 1981). In milk samples, the values of surface tension decreased significantly (compare Table 3.1 with Table 3.4) after in situ digestion, both with or without EGCG added. In the case of the intestinal mucus layer, the addition of trypsin showed a slight increase in the values of surface tension from about 41 mN m-1 before to about 45 mN m-1 after in situ digestion, regardless of the presence of EGCG. In mixed interfaces, composed of milk proteins and mucus, there were no differences in the surface tension after in situ digestion, once again, suggesting that in the mixed interfaces, the mucus layer was predominantly affecting the surface properties. Figure 3.5 illustrates the changes in dilational modulus as a function of ageing time, for milk, mucus and mixed interfaces, after trypsinolysis, in the presence or absence of EGCG. While control samples (milk, mucus interfaces) showed no time dependence, it was clear that after in situ hydrolysis, milk interfaces showed a high time dependence, suggesting interfacial rearrangements over time (Figure 3.5A). 60 70 50 -1 E (mN m ) 60 40 30 20 10 A 0 70 50 -1 E (mN m ) 60 40 30 20 10 B 0 70 50 -1 E (mN m ) 60 40 30 20 10 C 0 0 500 1000 1500 2000 2500 3000 Aging time (s) Figure 3.5 Interfacial dilational viscoelasticity modulus as a function of drop age after in situ trypsin digestion for milk (A), mucus (B), and mixed milk and mucus interfaces (C). Control milk, mucus and mixed milk and mucus before digestion (squares), interfaces with (filled circles) or without (empty circles) 250 mg ml-1 EGCG. The values are average of at least two individual experiments with standard errors around 5 mN m -1 (not shown). 61 A similar behaviour was shown regardless of the presence or absence of EGCG at the interface, albeit, in the presence of EGCG, a higher interfacial modulus was measured at all times (see also Table 3.4). When the mucus interface was measured after in situ hydrolysis, there was no time dependence of the modulus (Figure 3.5B), although the values were higher after digestion compared to the original values (see also Table 3.1 and 3.4) and again, similar in trend to those in the presence of EGCG. Furthermore, in the mixed interfaces (Figure 3.5C), the values for the modulus were lower than those of mucus alone, and in all cases the values were higher than before in situ digestion (compare Table 3.4 with Table 3.1). The mixed interfaces (Figure 3.5C) showed a time dependent viscoelastic behaviour after digestion, in agreement with that observed with milk interfaces (Figure 3.5A). At 3000s aging time, there was an increase in the elastic modulus for all samples (Table 3.4), reconfirming that tryptic digestion changed interfacial behavior through alteration of interface composition. In the case of mucus layers the presence of enzyme caused a large shift in the elastic modulus, compared to the untreated sample. The increased modulus of mucus from 36.8 mN m-1 to 62.6 mN m-1 before and after digestion, respectively, confirmed that tat the intestinal human mucus acting as a defensive barrier by forming a stiff interface. This result would also point to the active role played by trypsin in changing the viscoelastic properties of the intestinal mucus layer. Such results have never been reported in the literature, and should stem further investigation. 62 3.4 Conclusions In this study, the interactions of the human intestinal mucus layer and milk proteins were examined, in the absence and presence of EGCG, a major component of tea polyphenols. The results clearly indicated that dilational rheology is an appropriate tool to determine interactions between the intestinal cell mucus and food delivery systems. Indeed, while absorption data obtained using Caco-2 or mixed cultures of HT29-MTX and Caco-2 did not seem to show large differences in the absorption and delivery of EGCG, it was clear that the different macromolecular constituents can significantly affect the viscoelastic properties of the mucus. Though the presence of EGCG did not significantly affect the interfacial adsorption of milk proteins and mucins at the interfaces, EGCG contributed to the increased elasticity of surface films by interacting with milk and mucus proteins. The differences in the dilational elastic modulus also revealed that the mixed interfaces were significantly different from mucus interface alone, indicating the changes of mucus’ physical properties by the interactions with nutrients. Furthermore, the results would suggest that the hydrolyzed peptides associated with mucus and EGCG provided a stiffer mucus network. In the human body, intestinal mucus acts as a protectice barrier of epithelial cells against harsh environment and biological enzymes such as bile salts, pancreatin, trypsin, phospholipase (Lai et al. 2009; Ensign, Cone, and Hanes 2012; Boegh et al. 2014). The surface tensions of the interfaces measured, after in situ digestion were greatly reduced. The change of surface tension 63 regulates the surface layer composition through system reorientation and aggregation, whose effect is pronounced in protein adsorbed layers (Fainerman, Lucassen-Reynders, and Miller 1998). Enzyme treatments by trypsin reduced the protein folding, therefore modified interfacial composition. This in turn influenced the interfacial properties as shown by increased viscoelastic modulus. The results above may indicate that digested nutrients are more likely to interact with intestinal mucus, before transported and adsorbed effectively by enterocytes. This work pointed out to the complexity of mucus– nutrient interactions and the significant role intestinal mucus may play on nutrients uptake cannot be overlooked. 64 Chapter 4. Mucus interactions with liposomes encapsulating bioactives: interfacial tensiometry and cellular uptake on Caco-2 and cocultures of Caco-2/HT29-MTX 4.1 Introduction Functional foods have been focus of much development in the past decade, due to the increased interest of consumers for food products with health promoting effects. However, the limited bioactivity and bioavailability of bioactive molecules incorporated in foods makes development of the appropriate food matrix extremely challenging. The limited bioefficacy of health promoting compounds is largely attributed to the instability of the molecules during processing and storage, their interactions with other food molecules, their high instability after ingestion, their rapid degradation to metabolites during digestion, and finally, poor intestinal absorption. Furthermore, the biological properties of bioactives may also depend on their interaction with food matrices, intestinal absorption, and the extent of bioconversion in intestine (Parker 1996; Zhang et al. 2004; Acosta 2009). Encapsulation offers an effective approach to protect the bioactives during processing and storage, and may also help enhancing their bioefficacy. Liposomes have been employed in the pharmaceutical and cosmetic industry for decades to protect bioactive compounds, and in foods, they have been shown to improve the stability and compatibility of incorporated bioactives under environmental and digestive conditions 65 (Nacka, Cansell, and Entressangles 2001; Taylor et al. 2007; Liu et al. 2012; Liu et al. 2013). Liposomes are spherical bilayer vesicles comprised of phospholipids, thus both hydrophilic and hydrophobic bioactives can be simultaneously encapsulated (Mozafari 2005). Solvent free methods are preferred in food grade formulations, and the use of high pressure homogenization is proposed as an effective technique for liposome preparation (Thompson and Singh 2006). Liposomes are usually prepared using soy phospholipids; however, recently phospholipids from milk have been suggested as an alternative source to conventional soy phospholipids (Thompson, Haisman, and Singh 2006; Thompson and Singh 2006). Milk phospholipids have a distinct phospholipids composition, containing high levels of sphingomyelin (SM) and phosphatidylserine (PS) (Burling and Graverholt 2008). These molecules and their metabolites have been associated with beneficial health effects, such as antiinflammatory, antiproliferative, memory improvement functions and stress control (Burling and Graverholt 2008). Soy phospholipids, on the other hand, are mainly comprised of phosphatidylcholine (PC), phosphatidylethanolamine (PE), and phosphatidylinositol (PI) with very low concentrations of SM and PS (Burling and Graverholt 2008). For an effective delivery of bioactive components through the diet, the food matrix needs to resist digestive condition before reaching the intestinal epithelium. The inner intestinal wall is comprised of a single layer of epithelial cells that are covered by a mucosal layer, acting as a natural defense and a protective barrier to pathogens and most 66 bacteria, while permitting the exchange of nutrients (Karlsson, Wikman, and Artursson 1993; Pontier et al. 2001). Mucin proteins, the major component of mucus, significantly affect and modulate the rheological behavior of the mucus layer (Lai et al. 2009). Recent studies suggest that mucus may hinder the diffusion of particles by causing agglomeration, and mucus interactions can be modulated by physiochemical and surface properties of particles (Behrens et al. 2002; Lai, Wang, and Hanes 2009; Ensign, Cone, and Hanes 2012; Borel and Sabliov 2014). The mucus penetration ability of the food particles will affect their absorption in the gut, and the bioavailability of bioactive compounds. Particle composition, size, surface charge, hydrophobicity, surface coating, targeting properties, are amongst the factors modulating the mucus-penetrating properties of delivery systems (Lai, Wang, and Hanes 2009; Li et al. 2011; Naahidi et al. 2013). Therefore, it has been proposed that the cellular uptake of bioactives may be tailored by modifying the physiochemical properties of macromolecular structures in food delivery systems (Macierzanka et al. 2011). Though liposome encapsulation can enhance the delivery and bioavailability of drugs and bioactive compounds over elongated period (Taylor et al. 2007), liposome—mucus interactions are seldom investigated. Little is known about liposomes’ penetrating abilities through intestinal mucus and their interactions, not to mention understanding the mechanism that governs cellular uptake of bioactives delivered in liposomes. In the small intestine, various digestive enzymes, bile salts, phospholipids work simultaneously to digest food components and form mixed micelles for intestinal 67 cell absorption. It is known that liposomes are naturally present in the gut, and even in breast milk (Keller 2001). Liposomes can be directly absorbed by enterocytes as the bilayer vesicle structures are similar to cell membranes (Li et al. 2011). The present research focused on evaluating the interactions of human intestinal mucus with liposomes. EGCG and carotene were employed as model bioactive molecules. The physicochemical properties of liposomes, morphology, encapsulation efficiency, and liposome stability were first investigated. Then, the interactions between liposomes and the human mucus layer were studied using drop shape tensiometry. In addition, uptake was evaluated using two in vitro cell models, Caco-2 and cocultures of Caco-2/HT29-MTX cells. These two cell lines were employed as the Caco-2 line represents a mucus free cell model, it forms a polarized monolayer of absorptive, gastric-like cells on the apical surface with distinct tight junctions (Karlsson, Wikman, and Artursson 1993; Pontier et al. 2001); while the HT29-MTX line consists of differentiated goblet cells with mucus secreting properties (Pontier et al. 2001). Hence, cocultures of Caco-2 and HT29-MTX will represent a model that closely mimics the intestinal epithelium, including the presence of a mucus layer. 4.2 Materials and Methods 4.2.1 Materials Milk phospholipids (NZMP Phospholipid Concentrate 700) were donated by Fonterra (Fonterra Co-operative Group, Palmerston North, New Zealand). According to 68 the manufacturer, PC-700 contained 85.1% lipids (3% PS, 31% PC, 8.7% PE, and 16% SM). The moisture content was 1.7% and the extract also contained 6.6% lactose and 8.3% ash. Soy phospholipids (Ultralec P lecithin) were donated by ADM (Decatur, IL, USA), and they were composed of 23% PC, 18% PE and 15% PI. A tea polyphenol extract (Teavigo®) was donated by DSM Nutritional Products (Ayr, Ontario, Canada) containing mostly (−)-epigallocatechin-3-gallate (EGCG) (min. 94 %). 95% β-carotene powder was purchased from Sigma Aldrich (St. Louis MO, USA). Sodium chloride, imidazole, HPLC-grade water, acetonitrile, methanol, chloroform, and glacial acetic acid were obtained from Fisher Scientific. All other chemicals were of analytical grade and obtained from Fisher Scientific (Mississagua, ON, Canada) or Sigma-Aldrich Canada Ltd (Oakville, ON, Canada). Dulbecco´s Modified Eagle Medium (DMEM), phosphate-buffered saline (PBS), HEPES and, Hanks Balanced Salt Solution (HBSS) buffer were purchased from Sigma-Aldrich Corporation (Oakville, ON, Canada), while fetal bovine serum (FBS) heat inactivated, nonessential aminoacids (NEAA), trypsin 1 mM EDTA, L-glutamine and penicillin–streptomycin (10,000 units of penicillin and 10,000 mg of streptomycin per mL) were purchased from Invitrogen (Canada Inc., Burlington, ON, Canada). 4.2.2 Liposome preparation Liposomes were prepared as previously described with some modifications (Thompson and Singh 2006; Alexander et al. 2012; Farhang 2013). Briefly, empty 69 liposomes were prepared by dispersing a 10 mg ml-1 of milk or soy phospholipids in imidazole buffer (20 mM imidazole, 50 mM NaCl in MilliQ water, pH 7) for 2 h. All dispersions were pre-homogenized using a Polytron mixer (Brinkmann Inst. Corp., Mississauga, ON, Canada) at 10,000 rpm for 5 min and then cycled through a microfluidizer (model M-110Y, Microfluidics Corporation, Newton, MA, USA) for 5 passes with an input air pressure of 58 MPa (Thompson et al. 2006). To encapsulate tea polyphenols in liposomal dispersions, EGCG (4 mg ml-1) was also added to the buffered phospholipid dispersion. The concentration of EGCG was chosen based on previous studies (Gülseren and Corredig 2013). To encapsulate 𝛽-carotene, a molar ratio of 0.004 (𝛽-carotene to phospholipids) was employed (Liu and Park 2009; Thompson, Couchoud, and Singh 2009; Lee and Tsai 2010). The low molar ratio was used to minimize the destructive effects of hydrophobic compounds to liposome bilayer. To determine the molar ratio, an average molecular weight of 800 g mol-1 was assumed for phospholipids. Hence, 13.8 mg 𝛽-carotene was added to 10 g milk phospholipids powder. To be able to compare with the milk phospholipids, the same amount of 𝛽-carotene (13.8 mg) was added to 10 g soy phospholipids. To better dissolve -carotene, ethanol (20 ml) was added to the mixture with constant stirring until a uniform paste was obtained. The solvent was then evaporated under nitrogen to form a lipid thin film. The imidazole buffer (100 ml) (Imidazole-NaCl buffer, pH 7.0) was then added and stirred using a magnetic stirrer to hydrate the lipid 70 film. The phospholipid dispersion was then pre-homogenized and cycled for 5 passes through microfluidizer as described above. In all cases, samples were carefully covered to avoid light degradation. 4.2.3 Determination of apparent particle diameter and 𝛇- potential using dynamic light scattering The average apparent diameter and 𝜁-potential of the liposomes prepared with 10 mg ml-1 milk or soy liposomes were determined using a dynamic light scattering (DLS) technique (Zetasizer Nano, Malvern Instruments, Worcestershire, UK). The latex reference samples used for size and 𝜁-potential measurements were purchased from Duke Scientific, Palo Alto, CA, USA (catalog nos. 3550A and 5009A). The liposomal dispersions were appropriately diluted using 0.22 m prefiltered imidazole buffer (20 mM imidazole, 50 mM sodium chloride, pH 7). Liposome samples were diluted 1,000 times for size measurement and 50 times for 𝜁-potential measurements. Refractive indices of phospholipids and water were taken as 1.45 and 1.33, respectively, and a medium viscosity of 1.054 mPa s was used for the calculation of the size from the diffusion coefficient data. 4.2.4 Liposome morphology determined by Cryo-TEM Cryogenic transmission electron microscopy (Cryo-TEM) was employed to provide information on the microstructure of the liposome particles. The sample (4 μL) was 71 pipetted onto a quantifoil (Quantifoil Micro, Jena, Germany) grid with 2 μm holes. The excess sample was blotted off in a vitrobot (FEI), (Eindhoven, Holland) and immediately plunged into liquid ethane held at liquid nitrogen temperature. The specimen was transferred under liquid nitrogen to a Gatan 626 Cryo holder (Warrendale, PA, USA) and viewed at -176 °C in the Tecnai G2 F20 TEM (Eindhoven, Holland). Images are recorded with a Gatan 4K bottom mount CCD camera using the Gatan Digital Micrograph software. 4.2.5 Stability of liposome dispersions during storage Prior to storage, the liposome dispersions were adjusted to different pH values (3, 5, 7, 9) with either HCl (1 N) or NaOH (1 N). Immediately after pH adjustment, the particle size and 𝜁-potential of liposome dispersions were determined by DLS. The dispersions were stored under refrigeration temperature (4 °C) and room temperature (25 °C), and the stability was evaluated for mean particle size after one-week period. 4.2.6 Encapsulation efficiency determination Immediately following liposome preparation, the un-encapsulated EGCG or 𝛽-carotene was separated using gel permeation chromatography. Aliquots (1.5 mL) of the liposome dispersion were loaded to a desalting column (HiTrap desalting column, product no.17-408-01, GE Healthcare, Uppsala, Sweden). Imidazole buffer (20 mM imidazole, 50 mM sodium chloride, pH 7) was used as the mobile phase. After discarding 72 the first 1.5 ml, a fraction (3 mL) containing liposomes was collected and unbounded bioactive compounds were further eluted. Control runs were carried out with empty liposomes as well as with free EGCG or 𝛽-carotene to test the performance of the column. After separation, the collected liposomal fraction was subjected to a Bligh-Dyer extraction (Bligh and Dyer 1959; Smedes and Thomasen 1996) to disrupt liposome structure and release the encapsulated bioactives. This technique is based on the solubilization of lipids in methanol followed by their transfer to the more lipophilic phase upon the addition of chloroform. Briefly, chloroform (3 ml) was first added to 3 ml of liposome suspension (collected from gel filtration) to disrupt the bilayer membrane. After vigorous mixing, 6 ml methanol was added to solubilize lipids, then another 3ml chloroform was added to extract lipids and hydrophobic compounds. The extraction was completed by the addition of another 3 ml water. The extraction procedure was followed by centrifugation to ensure the complete separation of the two phases. The samples were centrifuged at 5,000 g for 30 min (Eppendorf 5415D, Brinkmann Instruments, Westbury, NY, USA). Rapidly afterwards, the isolated samples, EGCG from aqueous phase or 𝛽-carotene from organic phase, were withdrawn and the concentration was quantified using a reversed-phase high performance liquid chromatography (RP-HPLC) technique. Encapsulation efficiency was determined as the ratio of the amount of EGCG or 𝛽-carotene recovered in the liposomal fraction to the initial amount of bioactives added to the sample. 73 Encapsulation efficiency (%) = 𝑏𝑖𝑜𝑎𝑐𝑡𝑖𝑣𝑒𝑠 𝑟𝑒𝑐𝑜𝑣𝑒𝑟𝑒𝑑 𝑓𝑟𝑜𝑚 𝑙𝑖𝑝𝑜𝑠𝑜𝑚𝑎𝑙 𝑓𝑟𝑎𝑐𝑡𝑖𝑜𝑛(mg ml−1 ) 𝑏𝑖𝑜𝑎𝑐𝑡𝑖𝑣𝑒𝑠 𝑎𝑑𝑑𝑒𝑑 𝑡𝑜 𝑜𝑟𝑖𝑔𝑖𝑛𝑎𝑙 𝑠𝑎𝑚𝑝𝑙𝑒(mg ml−1 ) To quantify the amount of EGCG, samples were first filtered with 0.22 µm PVDF filters (Fisher Sci, Mississagua, ON, Canada) to remove any insoluble matter before injected into the RP-HPLC (UltiMate® 3000, Dionex, Thermo Scientific with Chromeleon®-Chromatography Data System). The column used for this analysis was a Nova-Pak C18 column (4 μm, 3.9 × 150 mm, part no. WAT086344, Waters Corporation, Milford, MA, USA) connected in series with a guard column (WAT44380). A binary mobile phase was utilized for the gradient elution of EGCG, and it consisted of 2% (v/v) acetic acid in HPLC water (buffer A) and 100% acetonitrile (buffer B). A linear gradient of 1-30% acetonitrile (buffer B) was carried out in the first 20 min of analysis, followed by 5 min holding time, then another linear gradient was carried out in 5min to reach the initial conditions of 1% acetonitrile (buffer B). The detection was carried out at 280 nm. Temperature and flow rate were kept constant throughout the analyses (35 °C and 1 ml min-1, respectively). Total running time for each sample was 30 min. EGCG stock standard (10 mg ml-1) was freshly prepared in HPLC grade water. Subsequent standards (10 g ml-1~5 mg ml-1) were obtained from further dilution from the stock in water. In all cases, the major ECGC peak was acquired around 10 min. The measurements were performed in triplicates for every treatment and subsample. The same column (Nova-Pak C18 column) and guard column were also used for the analysis of 𝛽-carotene using previously published methodology (Barba et al. 2006) with 74 some modifications. Briefly, an isocratic elution was used with methanol/acetonitrile (90:10 v/v) as mobile phase. The mobile phase flow rate was 1 ml min-1, the column temperature was kept at 35 °C, the detection absorbance was read at 475 nm and total running time was 40 min. 𝛽-carotene stock standard (0.2 mg ml-1) was freshly prepared in chloroform and further diluted to 5 g ml-1~ 100 g ml-1 in chloroform. In all cases, the 𝛽-carotene peak was acquired around 17 min and the measurements were performed in triplicates for every treatment and subsample. 4.2.7 Cell cultures and mucus extraction Caco-2 and HT29-MTX epithelial carcinoma cells were received from Canadian Research for Food Safety (CRIFS) culture collection. HT29-MTX cells were derived by HT-29 epithelial cancer cell line as previously described (Guri, Gülseren, and Corredig 2013). Cell were grown routinely in DMEM medium supplemented with 10% FBS heat inactivated, 1% antibiotic solution (100 U mL-1 penicillin, 100 mg mL-1 streptomycin), 1% non-essential aminoacids (NEAA) and 2 mM L-glutamine at 37 ºC in humidified atmosphere containing 5% CO2 incubator (Forma Series II Water-jacketed CO2 Incubator, Model No: 3110, Forma Scientific, California, USA). Cells were passaged weekly using trypsin 1 mM EDTA. Cells from passages 18-37 were used throughout experiments. Mucus was extracted from HT29-MTX. This cell line as previously described and characterized is able to produce a mucus layer which is stable at full confluency (Guri, Gülseren, and Corredig 2013). Thus, cells were growing for 21 days in 75 cm2 flasks 75 until cell differentiation and completion of mucus formation. After washing with PBS (100 mM) to remove any cell debris, 10 ml of PBS (100 mM) supplemented with N-acetyl cysteine (10 mM) and the cocktail protease inhibitor at a ratio 1:1000 (v/v) was added to extract the mucus. Cells were incubated at 37 °C, 5 % CO2 for 1 h and kept under mild agitation. The mucus suspension was gently aspirated, portioned in eppendorf tubes and kept at -80°C until analyzed. The protein content (1.1±0.1 mg ml-1) in mucus was determined by Lowry method (Lowry et al. 1951). Mucus suspension was further diluted in PBS (100mM) to a final protein concentration 0.1mg ml-1 and was used throughout the interfacial tensiometry experiments. 4.2.8 Interfacial tensiometry The interfacial tension (γ) and dilational viscoelastic modulus (E) of liposomes at air-liquid interface were studied using a dynamic drop shape tensiometry (Tracker, IT Concept, Longessaigne, France) (Gülseren and Corredig 2012). An air bubble of 5 l volume was immersed in aqueous solution containing either PBS buffer or mucus dispersion. The interfacial tension over time was recorded at sampling frequency 0.5 s-1. Dynamic interfacial tension (γ) was calculated based on the Younge-Laplace equation (Lucassen-Reynders, Cagna, and Lucassen 2001). The dilational viscoelasticity measurements were carried out after the interfacial tension reached the equilibrium. The air bubble was oscillated over a frequency sweep (10 mHz to 100 mHz) with strain amplitude 0.1 (ΔA/A = 0.1, A being the droplet surface area). This strain amplitude was 76 predetermined to be within the linear viscoelastic range (data not shown). The dilational viscoelastic modulus (mN m-1) was calculated from the change in interfacial tension (dγ) relative to the change in droplet surface area (dA) (Lucassen-Reynders, Cagna, and Lucassen 2001): E= 𝑑𝛾 𝑑 𝑙𝑛 𝐴 (1) E is a complex modulus as the dynamic surface tension relaxation is a time-dependent processes (Rossetti, Ravera, and Liggieri 2013a). For the interfacial dilational characterization of liposome, empty liposomes (controls) (10 mg ml-1) were diluted in 100 mM phosphate buffer to a series concentration of 0.01, 0.1, 1 and 10 mg ml-1 and their interfacial tension and dilational viscoelasticity were studied. The bioactive encapsulated liposomes were first subjected to the gel permeation chromatography to separate free bioactives from the liposomal fraction (see 4.2.6), and the liposomal fractions containing bioactives were further diluted in phosphate buffer to 0.1 mg ml-1, and used for interfacial rheology methods. Intestinal mucus harvested from cells had protein content 1.1±0.1 mg ml-1 as determined by Lowry (Lowry et al. 1951). This mucus suspension was diluted in phosphate buffer to a final protein concentration of 0.1 mg ml-1 and was used throughout the study. 4.2.9 Cell culture viability and uptake The encapsulated liposomes initially containing 4 mg ml-1 EGCG or 0.138 mg ml-1 carotene were subjected to gel filtration (see 4.2.6), to separate the unbound material 77 from the liposomal fraction. The empty controls were diluted to the same concentration as liposomal fractions and used for cell culture studies. The effect of the liposomes (empty and bioactives encapsulated) on the viability of Caco-2 cells was investigated. The uptake of bioactives encapsulated in liposomal fraction was investigated on Caco-2 cells and cocultures of Caco-2/HT29-MTX. Free bioactive solutions as controls for cell viability and uptake experiments were prepared by dissolving EGCG in HBSS buffer to the same concentration as encapsulation, and by dissolving carotene in dimethyl sulfoxide (DMSO) medium first, further dilute 100 times in HBSS buffer to the same final carotene concentration as encapsulation. To study the effect of liposomal dispersions on the epithelial cells, Caco-2 cells were seeded at a concentration of 1×10⁴ cells well-1 in 96-well plates and incubated for 24 h at 37℃ and 5%. Then growth medium was removed and plates were washed 2 times with PBS and incubated in medium without serum 1 h prior to treatment. Cells were subsequently washed with PBS (2 × ) and freshly prepared EGCG or 𝛽 -carotene encapsulated liposomal dispersions from milk and soy phospholipids were added to the HBSS buffer at a series dilution ratio sample: medium from 1:1 (v/v) to 1: 40 (v/v). EGCG in aqueous solution, 𝛽-carotene in DMSO as well as empty milk and soy liposomes were also tested as controls. Caco-2 cells were incubated for 2 and 24 h at 37 ℃ and 5 % CO2 to test the influence of the liposomal fractions on the proliferation rate of the cells. Cell viability was assessed by Sulforhodamine B, a colorimetric assay by 78 reading absorbance at 570 nm. Results were compared with control wells, cells with media only (Vichai and Kirtikara 2006). For uptake measurements, Caco-2 cells alone were seeded at a density of 6×10⁴ cells per insert in 12-well Transwell® plates (0.4 μm pore size, inserts of 1.2 cm diameter, BD Biosciences, Becton Dickinson and Company, Mississauga, ON, Canada). For cocultures, Caco-2 and HT29-MTX were grown separately and were mixed prior to deeding at a ratio 75:25 (v/v) at final density 6×10⁴ cells per insert. This seeding ratio was chosen to mimic the ratio between the major cell types in the intestine (Mahler, Shuler, and Glahn 2009). Then cells were allowed to completely differentiate growing for three weeks and maintained regularly by changing the medium every second day. After 21 days apical and basolateral compartments were washed with PBS (2×) to remove any debris and then incubated respectively with 500 µL and 1500 µL of DMEM (no FBS). The cells were incubated at 37 ºC for 30 min prior the experiments to equilibrate the monolayers. For the uptake studies A–B (apical to basolateral), freshly prepared EGCG in aqueous solution, 𝛽-carotene in DMSO medium, EGCG and 𝛽-carotene encapsulated milk and soy liposomal fractions obtained after separation by desalting column were diluted in HBSS (1:1, v/v) and administered to cells. Cells were incubated for 2 h at 37 ºC. The integrity of the monolayer was controlled during uptake by measuring the transepithelial electrical resistance (TEER) (Evon World Precision Instruments, Sarasota, FL, USA). After the transport experiment the samples collected from cell lysate (0.5 ml) and basolateral compartment (1.5 ml) were stored at –80 ºC till HPLC analysis. 79 The amount of EGCG found in the basolateral compartment of each sample after the completion of 2 h uptake experiments was quantified by HPLC. Aliquots (1.5 ml) were withdrawn from basolateral compartment and filtered with 0.22 m PVDF filter (Fisher Sci, Mississagua, ON, Canada) for HPLC analysis (see above). Little recovery of carotene could be identified from basolateral within 2 h of transport study, due to the low solubility of carotene in transport buffer, the insufficient time period (2 h) for carotene transportation, and also the possibility of reaching of an equilibrium. Thus the amount of carotene in all cell lysates was quantified instead. After 2 h of transport study, mucus was removed by washing with PBS, and the cells were with trypsinized with 200 l per well trypsin-EDTA solution and collected in Eppendorf tubes. The cells were sonicated using a bath sonicator (FS 20H, Fisher Scientific) for 5 min to disrupt the cells and the supernatants were removed by centrifugation (6,000 rpm, 10 min at 25 ℃) using a benchtop centrifuge (Eppendorf 5415D) and the lysed cells were collected. 𝛽-carotene was extracted with 400 l chloroform, followed by adequate votex and centrifugation (6,000 rpm, 10 min at 25 ℃). The organic part was filtered with 0.22 m PVDF filter into inserts before HPLC analysis. 4.2.10 Statistical analysis All tests were performed in triplicates. Results are reported as average and standard deviations. One-way analysis of variance (ANOVA) and Tukey HSD test were used to assess the statistical significant differences among test samples, with p<0.05 considered 80 significant. Student’s t-test was also used to assess the statistical significant differences between two sample groups (=0.05). All statistics were performed using R software (R Project for Statistical Computing version 2.15.1). 4.3 Results 4.3.1 Liposomes characterization Liposomes (10 mg ml-1) were prepared from milk or soy derived phospholipids. All the fresh liposome dispersions showed a monomodal size distribution (Figure 4.1). The mean apparent diameter and the 𝜁 -potential of liposomes encapsulating EGCG or 𝛽-carotene are summarized in Table 4.1. Milk liposomes had mean diameter of about 110 nm while soy liposomes were smaller, with a diameter of about 90 nm. The presence of bioactives did not cause a statistically significant change of particle size or surface charge. Conventional liposome preparation methods, such as chloroform evaporation or simple heating method, may not be conducive to food grade use, because of the use of solvent or the large size of the vesicles obtained (Mozafari 2005; Thompson, Mozafari, and Singh 2007), liposomes prepared with microfluidization technique are proposed as a good model for food delivery systems. 81 14 B A 12 Intensity (%) 10 8 6 4 2 0 1 10 100 Diameter (nm) 1 1000 10 100 Diameter (nm) 1000 10000 Figure 4.1 Diameter distribution of liposomes dispersions prepared with milk (A) and soy (B) phospholipids. Control (filled circles); liposomes containing EGCG (empty circles); liposomes containing 𝛽-carotene (inverted triangles). Data are representative of at three replicate samples. 82 Table 4.1 Mean apparent diameter (nm) and 𝜁 -Potential (mV) of milk and soy phospholipids liposomes, empty or encapsulating EGCG or 𝛽-carotene. Values are the means of at least three replicates with standard deviations. Liposome Diameter (nm) 𝜁-Potential (mV) Milk control 113±2 -15.1±0.8 Milk EGCG 119±4 -16.2±1.4 Milk 𝛽-carotene 117±3 -15.8±1.3 Soy control 89±2 -25.4±1.5 Soy EGCG 94±4 -25.1±2.3 Soy 𝛽-carotene 95±3 -26.1±1.4 83 Such liposomes can have diameters below 100 nm (Thompson, Couchoud, and Singh 2009; Farhang, Kakuda, and Corredig 2012). Both the solubilization of compounds in the dispersed phase of the liposomes, or the molecules orientation packed in the bilayer membranes can affect the size distribution of liposomes (Thompson, Couchoud, and Singh 2009). The milk liposomes prepared in this study were significantly larger in diameter than soy liposomes (Table 4.1) , in agreement with earlier reports (Thompson et al. 2006; Thompson, Couchoud, and Singh 2009). All liposomes were negatively charged, with an average charge of -15 and -25 mV for milk and soy derived liposomes, respectively. To better evaluate the morphology of the liposomes prepared, cryogenic transmission electron microscopy (Cryo-TEM) was employed as previously reported in the literature (Almgren, Edwards, and Karlsson 2000). Figure 4.2 shows representative Cryo-TEM images of the milk (A) and soy (B) liposomes prepared in imidazole buffer. Both unilamellar and multilamellar structures were observed, and with sizes comparable to those measured using light scattering. Although the liposomes are often described with single-walled and monodispersed structures (Almgren, Edwards, and Karlsson 2000), in reality, the majority of liposomes are found to be double-, multi-walled with high polydispersity (Almgren, Edwards, and Karlsson 2000). It was also shown that at high phospholipids concentration, multi-vesicular and multilamellar structures homogenization (Farhang 2013). 84 can form during high pressure A B Figure 4.2 Cryo-TEM micrograph of liposomes prepared with milk phospholipids (A), and soy phospholipids (B) in 20 mM imidazole 50 mM NaCl buffer. Images are representative and taken right after preparation. Bar size is 100 nm and arrows pointed to liposome vesicles. 85 4.3.2 Encapsulation efficiency The encapsulation efficiencies (EE %) of EGCG and 𝛽-carotene in milk and soy liposomes are shown in Table 4.2. Liposomes prepared with milk phospholipids had a statistically higher encapsulation efficiency of EGCG (52 %) than soy liposomes (41 %). The difference could be explained by their difference in size distribution, as milk liposomes had a larger diameter, hence a larger core. Hydrophilic compounds such as EGCG mainly locate at the core of liposome (Thompson, Couchoud, and Singh 2009). Consistent encapsulation efficiencies of polyphenols (50~60 %) were observed in literature (Lu, Li, and Jiang 2011; Gülseren and Corredig 2013). However, it was shown that high polyphenol concentration can cause visual destabilization of liposomes (Gülseren and Corredig 2013). This effect may be related to tea polyphenol’s capacity to disrupt phospholipid bilayers, resulting a decrease in colloidal stability (Ikigai et al. 1993). β-carotene showed an encapsulation efficiency of about 35 % for both soy and milk phospholipids (Table 4.2). The hydrophobic compounds are mainly incorporated into liposome bilayer membranes (Thompson, Couchoud, and Singh 2009), which partly explains the lower encapsulation efficiency of hydrophobic compound than the hydrophilic one as β-carotene has low solubility in lipid bilayer membranes (Wisniewska, Widomska, and Subczynski 2006). 86 Table 4.2 Encapsulation efficiencies of EGCG and β-carotene in milk and soy phospholipids liposomes. Data are the average of at least three replicate samples. Within a row, the different letters indicate significant differences (P<0.05). Encapsulation efficiency Milk liposomes Soy liposomes EGCG at 280 nm 52 ± 4a 41 ± 4b β-carotene at 475 nm 36 ± 5a 34 ± 4a (%) by RP-HPLC 87 Apart from partition locations, the phospholipids concentration is shown to affect the entrapment efficiency (Thompson, Couchoud, and Singh 2009), other factors, such as solvents employed for better miscibility, molecular orientations and mobility in the bilayer membrane, may also affect the packing and incorporation of hydrophobic bioactives into the bilayer membranes (Thompson, Couchoud, and Singh 2009; Farhang 2013). 4.3.3 Liposome stability as affected by pH and temperature The changes in liposome size and 𝜁-potential as a function of pH for milk and soy phospholipids liposomes are shown in Figure 4.3. In the case of milk phospholipids the diameter of the liposomes showed a slight increase at pH <5 for control, and the size was stable for vesicles containing EGCG or β-carotene. 𝜁 -potential is an indicator of liposomes’ colloidal stability and charge quantity (Taylor et al. 2007), it measures the magnitude of the electrostatic charge repulsion or attraction between particles. The surface charge of the liposomes remained negative in the entire pH range, with the extent of charge decreasing with decreasing pH. The 𝜁-potential of milk liposomes was around -14 mV at pH 7, and the surface charge significantly increased to around -7 mV at pH 3 due to protonation by hydrogen ion. Under alkaline condition, 𝜁-potential decreased to around -25 mV at pH 9 (Figure 4.3 C). 88 160 140 Diameter (nm) 120 100 80 60 40 20 A B C D 0 potential (mV) -5 -10 -15 -20 -25 -30 -35 3 5 7 9 pH 3 5 7 9 pH Figure 4.3 Average apparent diameter (A, B) and 𝜁-potential (C, D) of milk (A, C) and soy (B, D) liposomes as a function of pH. Control liposomes (filled circles), and liposomes containing EGCG (empty circles) and β-carotene (inverted triangles). Values are the means of at least three replicates with error bars indicate the standard deviation. 89 Despite surface charge differences, milk liposomes had good stability under broad pH ranges, and encapsulation of bioactives did not seem to affect liposome size and surface charge. The current results are in agreement with Liu et al. (2013) who observed that the changes of pH did not significantly affect milk liposomes’ structural properties. In the case of soy liposomes, the average size was about 80 nm for empty control and vesicles loaded with EGCG at pH 7 (Figure 4.3 B). The apparent diameter of the liposomes containing -carotene was slightly higher at this pH. There was an increase in size of the liposomes at low pH values. Most importantly, there was visible aggregation at pH 3 for liposomes containing EGCG, in spite of the negative charge for all suspensions at all pH values (Figure 4.3D). At pH 7, the 𝜁-potential of soy liposomes was about -25 mV. The surface charge decreased to about -29 mV at pH 9 while it increased to -13 mV and -23 mV at pH 3 and 5, respectively (Figure 4.3 D). The difference in the stability with pH between milk and soy phospholipids liposomes has been previously reported (Gülseren and Corredig 2013). Environmental pH affects the structure and fluidity of liposome bilayer by modifying the surface charge of the formed bilayers (Nacka, Cansell, and Entressangles 2001). As pH decreases, the negative surface charge decreases and electrostatic repulsions between liposome particles are reduced. However, the stability of liposome does not solely depend on charge repulsion as milk liposomes were more stable than soy liposomes over a wider pH range despite their low ζ-potential values (Thompson, Haisman, and Singh 2006). 90 The apparent diameter of the liposomes suspensions was also measured after 1 week of storage at room and refrigeration temperature, respectively. Results are summarized in Table 4.3. In the case of milk liposomes, there were no significant differences in liposome size, with storage temperature and pH, for empty liposomes or liposomes containing -carotene. However, after 1 week of storage, aggregation was observed at pH 9 for EGCG containing liposomes. The affinity of gallic acid ester in EGCG to liposome bilayer may lead to disruptive effects and alter liposome membrane structure, whose effects is more pronounced under alkaline pH condition (Nakayama et al. 2000). The appearance of the liposome suspensions prepared with milk and soy phospholipids before and after storage at room temperature is shown in Figures 4.4 and 4.5, respectively. The empty soy liposome dispersions were most stable at pH 7, and gelation occurred at pH 3 due to fusion of the liposome vesicles. In general, at pH 5 an increase in particle diameter occurred for both control and liposomes containing -carotene and EGCG, and at pH 3, visible destabilization occurred. Visual appearance of β-carotene sedimentation was observed after 1 week of storage (Figure 4.5). Precipitation was more pronounced for soy liposomes than for milk liposomes. At pH 5, soy liposomes showed larger average sizes, with or without bioactive encapsulation. Furthermore, as shown in Table 4.3 soy liposomes with EGCG were larger than empty, control liposomes at all pH values. 91 Table 4.3 Average apparent diameters of milk or soy phospholipid liposomes as affected by pH after one-week storage at room temperature (22 °C) and at 4°C. Values are the means of at least three replicates with standard deviations. Room temperature pH 3 Milk control Soy pH 5 pH 7 pH 9 126 ± 3 112 ± 1 117 ± 3 111 ± 2 EGCG 117 ± 2 112 ± 1 116 ± 2 aggregation -carotene 121 ± 11 99 ± 2 97 ± 1 101 ± 7 control aggregation 136 ± 2 88 ± 1 86 ± 1 EGCG aggregation 162 ±2 116 ± 1 107 ± 1 -carotene aggregation 155 ± 1 97 ± 1 85 ± 1 pH 3 pH 5 pH 7 pH 9 control 120 ± 1 112 ± 2 111 ± 2 104 ± 1 EGCG 138 ± 6 117 ± 1 125 ± 9 aggregation -carotene 115 ± 2 101 ± 2 92 ± 1 131 ± 11 control aggregation 127 ± 1 81 ± 1 80 ± 1 EGCG aggregation 149 ± 2 103 ± 1 105 ± 1 -carotene aggregation 133 ± 1 92 ± 2 88 ± 1 4°C Milk Soy 92 A B C D Figure 4.4 Visual appearances of freshly prepared liposomes containing EGCG (A and B) or -Carotene (C and D). Liposomes were prepared milk (A and C) and soy (B and D) phospholipids (10 mg ml-1) in 20 mM imidazole, 50 mM NaCl buffer. A B 93 C D A B C D E F Figure 4.5 Visual appearances of milk (A, C, E) and soy (B, D, F) liposomes after one week of storage at 22 °C. Empty liposomes (A and B), liposomes containing EGCG (C and D) or -Carotene (E and F). 94 Milk liposomes have been shown to be more stable than soy liposomes under environmental and in vitro digestive condition (Thompson, Haisman, and Singh 2006; Liu et al. 2013; Gülseren and Corredig 2013). This is mostly due to milk phospholipids have higher phase transition temperature, thicker membrane and lower membrane permeability (Thompson et al. 2006). The high content of saturated fatty acids and sphingolipids render milk liposomes’ bilayers with a more structured gel phase and less membrane fluidity than soy liposomes (Thompson and Singh 2006). 4.3.4 Interactions between milk and soy phospholipids liposomes and mucus studied by drop tensiometry. 4.3.4.1 Interfacial properties of milk and soy phospholipids liposomes Before probing mucus interactions with liposome in vitro, it was necessary to study the interfacial properties of empty milk and soy phospholipids liposomes, dispersed in 100 mM phosphate buffer. Figure 4.6 shows the effect of milk and soy liposomes on surface tension at air/liquid interface over time, at different concentrations. At the lowest liposome concentration (0.01 mg ml-1), there was a very slow and small decrease in interfacial tension, as this concentration was not sufficient to fully cover the droplet interface, and a plateau was not reached even after 3 h. At a 0.1 mg ml-1 concentration, there was faster adsorption, but only higher concentrations, 10 mg ml-1, there was fast adsorption and a plateau in the value of surface tension was reached after 1 h, in both milk and soy phospholipids liposomes. 95 -1 Surface tension (mNm ) 75 70 65 60 55 50 B A 45 0 1000 2000 Time (s) 3000 0 1000 2000 Time (s) 3000 Figure 4.6 Changes in interfacial tension of milk (A) and soy (B) phospholipids liposomes at various concentrations (0.1 (solid circles), 0.1 (empty circles), 1 (solid squares), 10 mg ml-1 (empty squares)). Results are representative of at least duplicate experiments. 96 At this concentration (10 mg ml-1), both systems caused a decrease in the interfacial tension to about 39 mN m-1. Values of surface tension measured at various concentrations are summarized in Table 4.4. The adsorption behaviour of liposomes to the interface using dynamic drop shape tensiometry technique has yet to be reported. However, using the Wilhelmy plate, the surface pressure of dipalmitoylphosphatidylcholine (DPPC) liposomes (10 mg ml-1) at air-water interface was reported to be around 20 mN m-1 after 3600 s (Launois-Surpas et al. 1992), a value much lower than what measured in the present study. Many factors, including liposome solution conditions, surface properties and liposome composition, were shown to influence liposome adsorption to the interface (Er, Prestidge, and Fornasiero 2004). After 3000 s the dilational modulus was measured for milk and soy liposomes at different concentrations, as shown in Figure 4.7. In general, the interfacial viscoelasticity of milk and soy liposome over oscillation frequency exhibited similar trends at various concentrations (Figure 4.7). At the low concentrations, a higher modulus was measured with soy phospholipids liposomes showing a more rigid interface than milk phospholipids liposomes. However at concentrations where sufficient amounts of phospholipids were added, there was a lower modulus, and an obvious frequency dependence, indicating a more viscoelastic interface. Based on the surface tension and interfacial viscoelasticity, milk and soy liposomes at concentration 0.1 mg ml-1 were chosen for further experiments and used throughout the study to obtain a rapid liposome adsorption to interface with a low frequency dependence of the dilational modulus. 97 Table 4.4 Values of interfacial tension of milk and soy phospholipids liposomes measured after 3000 s of adsorption as a function of liposome concentration (mg ml-1). Within a row, different letters indicate statistically significant differences (P<0.05). Surface tension (mNm-1) 0.01 mg ml-1 0.1 mg ml-1 1 mg ml-1 10 mg ml-1 Milk liposomes 55 ± 1a 47 ± 1b 42 ± 1c 39 ± 3d Soy liposomes 58 ± 2a 49 ± 1b 46 ± 2c 40 ± 1d 98 A 50 B -1 E (mN m ) 40 30 20 10 0 0 20 40 60 80 100 Frequency (mHz) 0 20 40 60 80 100 Frequency (mHz) Figure 4.7 Interfacial modulus of dilational viscoelasticity for milk (A) and soy (B) phospholipids liposomes as a function of oscillation frequency, for various concentrations 0.01 (solid circles), 0.1 (empty circles), 1 (solid squares), 10 mg ml-1 (empty squares). 99 4.3.4.2 Interfacial characteristics of liposome encapsulating bioactives in buffer, and their interactions with human intestinal mucus The interfacial properties of liposomes encapsulating EGCG or 𝛽-carotene were determined in buffer, and after mixing with human intestinal mucus (0.1 mg ml-1 based on protein). Liposomes were tested at a concentration of 0.1 mg ml-1. EGCG in solution showed a high value of interfacial tension (70.9±0.2 mN m-1), suggesting EGCG did not adsorb onto the interface. Due to its extreme hydrophobicity, carotene did not dissolve in buffer, thus the interfacial tension of the dispersion was 74.7±0.7 mN m-1. Before testing, the liposomes containing EGCG or carotene were isolated from the unbound fraction using desalting column chromatography (see 4.2.6). Figure 4.8 summarizes the values of interfacial tension obtained after 3000 s for liposomes (Figure 4.8A) and for liposomes and mucus mixed interfaces (Figure 4.8B). All liposomes showed similar values of interfacial tension, regardless of the presence or absence of bioactive. Soy liposomes reached a higher surface tension compared to milk phospholipids liposomes (Figure 4.8A). Figure 4.8B shows values of interfacial tension for a mixed interface composed of mucus and liposomes. The presence of liposomes, empty or containing bioactive components did not show an effect on mucus interfaces. Milk liposomes and soy liposomes containing -carotene showed a slightly lower interfacial tension, but all around 46 mN m-1. 100 55 B b -1 Interfacial tension (mNm ) A ab 50 ab ab a b a ab ab ab ab a a 45 40 35 liposome control EGCG loaded carotene loaded control EGCG loaded carotene loaded Figure 4.8 Values of interfacial tension of milk (black bars) or soy (white bars) liposomes (0.1mg ml-1) with or without encapsulated EGCG or -carotene (A) and for mixed interfaces containing human intestinal mucus (B). Mucus interface (grey bar) as control is shown in (B). Values are the averages of three independent experiments, and the error bars indicate the standard deviation. Differences among six samples were compared using ANOVA and Tukey HSD with same letter indicate no statistically significant differences (P>0.05). 101 To better understand possible differences in the interaction behaviour between soy and milk liposomes with mucus, dilational viscoelasticity measurements were also conducted. Figure 4.9 shows the interfacial modulus of dilational viscoelasticity as a function of oscillation frequency, at 0.1 strain amplitude, for milk and soy phospholipids liposomes interfaces, and mixed mucus liposomes interfaces. In all interfaces, the elastic modulus showed a frequency dependence, with lower modulus at the low frequencies. The lowest frequency dependence was shown for mucus interfaces (Figure 4.9B and D). In the case of milk phospholipids liposomes, the elastic modulus of empty and carotene encapsulated milk phospholipids liposomes showed a similar trend, while EGCG encapsulated liposomes showed a larger value indicating a stiffer interface (Figure 4.9A). The presence of polyphenols may cause differences in the rearrangements of the phospholipids at the interface. Polyphenols have been shown to increase the elastic modulus of other systems such as saliva proteins (Bennick 2002; Rossetti, Ravera, and Liggieri 2013 a,b) and milk proteins (Aguié-Béghin et al. 2008; Chapter 3), whose effects are mainly attributed to polyphenols binding with proline rich proteins. Therefore it was not surprising that EGCG encapsulation in liposomes enhanced the interfacial elasticity in a similar manner. 102 60 55 A B C D 45 -1 E (mN m ) 50 40 35 30 25 20 60 55 45 -1 E (mN m ) 50 40 35 30 25 20 15 0 20 40 60 80 100 0 20 40 60 80 100 Frequency (mHz) Frequency (mHz) Figure 4.9 Changes in the dilational modulus as a function of oscillation frequency for milk (A,B) and soy (C,D) phospholipids liposomes in isolation (A,C) or in mixed layers containing human intestinal mucus (B,D). Measurements were carried out at a liposome concentration of 0.1 mg ml-1. Empty liposomes (solid circles), liposomes containing EGCG (empty circles), carotene (inverted triangles). Mucus layer in isolation is also shown (filled squares). Values are the averages of at least two individual experiments with errors bar indicating standard deviations. 103 When mucus was present, there was a clear difference in behaviour with liposomes containing polyphenols, as the modulus was much lower, and there was much less frequency dependence (Figure 4.9B). Empty milk phospholipids liposomes and liposomes containing -carotene showed no effect of modulus on mucus layers. These results clearly demonstrate that these milk liposomes do not change the viscoelastic properties of the mucus, and are in contrast with previous findings on mucus interactions with milk proteins and EGCG, both free and complexed, whereby such interactions increased the rigidity of the mucus layer (Chapter 3). Figure 4.9C illustrates the changes in dilational modulus of soy phospholipids liposomes in buffer. Compared to milk liposomes, soy liposomes had similar trends but with much higher elasticity. Similarly to what had already been demonstrated for milk liposomes in buffer, EGCG encapsulated soy liposomes had significantly higher elastic modulus than empty control, while carotene encapsulated soy liposomes had modulus close to empty control. The similar behaviour of -carotene and empty liposomes is most probably related to the low amount of bioactive present in the interfacial layer. The behaviour of soy phospholipids liposomes and mucus mixed interfaces (Figures 4.9D) was significantly different from that of milk phospholipids liposomes (Figures 4.9B). In all cases, all soy liposomes in mucus had significantly higher dilational modulus than the mucus control. These results may have biological significance, as they indicate that the two delivery systems do not have a similar behaviour when interacting with the human mucin layers. This difference is related to the origin of the phospholipids, as in the 104 case of milk, the phospholipids derive from the apical membrane of mammary secretory cells. The study of drop tensiometry of mucus layers clearly demonstrates differences in the interactions between different macromolecular structures. It remains therefore of interest to determine if these interactions observed in vitro also occur during absorption and uptake studies, using relevant cell culture models. 4.3.5 Absorption studies using in vitro models of intestinal cells. Before studies on absorption, the cytocompatibility of the various liposome dispersions was assessed using Caco-2 cell cultures. The viability after 2 and 24 h upon the administration of EGCG or carotene encapsulated liposomes, at various dilution rates is shown in Figure 4.10. This allowed for the determination of the maximum loading of liposome dispersions. After 2 h of incubation, all treatments showed cell viability, once dispersions were diluted (Figure 4.11 A,C), regardless of the type of phospholipid used and the type of bioactive molecule present. On the other hand, after 24 h incubation time, cell viability was significantly reduced for samples containing EGCG, and the effect was caused not only by the presence of EGCG but also phospholipids. Indeed, at low dilution, also empty liposomes caused a significant cytotoxicity effect after 24 h (Figures 4.10 B,D). 105 140 A B C D Viability (%) 120 100 80 60 40 20 140 0 0 10 20 30 40 30 40 Dilution rate 120 Viability (%) 100 80 60 40 20 0 0 10 20 30 40 Dilution rate 0 10 20 Dilution rate Figure 4.10 Cell viability (%, related to control grown in medium) as a function of the dilution, after 2 h (A,C) and 24 h of incubation (B,D) in a humidified atmosphere at 37℃ and 5% CO2. Control samples contained only the medium and are considered to have 100% viability. Liposomes containing EGCG (A,B) and -carotene (C,D). Free EGCG or -carotene (filled circles), and milk (squares) or soy (triangles) phospholipids liposomes, with empty controls (empty symbols) or containing bioactive (filled symbols). Results are the average of at least three independent experiments, and bars represent standard deviation. 106 Phospholipids and EGCG both have been shown to have anti-proliferative activity to cancer cells (Yang et al. 1998; Valcic et al. 1996; Gülseren, Guri, and Corredig 2012; Zanabria et al. 2014). Phosphatidyl choline in soy phospholipids was shown to affect the structure of biological membranes at high concentration and inhibited the growth of human skin fibroblasts (Berrocal and Bujan 2000). A previous study also demonstrated that soy liposomes inhibited the proliferation of HT-29 human colon cancer cell line, while milk phospholipids liposomes at the same concentration did not (Gülseren, Guri, and Corredig 2012). Unlike EGCG, carotene did not induce toxic effects to cancer cells. Thus at high sample dilution rate, all cells remained viable during the 24 h incubation with or without carotene encapsulation. The integrity of the Caco-2 cell monolayer was also measured, by monitoring the transepithelial electrical resistance (TEER) values prior to and after the uptake experiment. The TEER value is of importance in absorption studies, as the monolayer integrity needs to be preserved during exposure of the cells to the bioactive components. The changes in the TEER value were not significant (data not shown), confirming that liposomes had minimal effects on cellular monolayer integrity. To retain a low dilution of liposome samples for bioactive uptake experiment while maintaining cell viability and monolayer integrity, liposome to medium dilution (1:1) and 2 h running time were considered appropriate for the bioactive uptake assays. 107 4.3.5.1 EGCG uptake The absorption and transport of EGCG through the cells was studied for milk and soy phospholipids liposomes containing EGCG using two cell culture models: a Caco-2 monolayer and a co-culture of Caco-2 and HT29-MTX cells, producing mucus. Table 4.5 summarizes the concentration of EGCG recovered in the basolateral compartment after 2 h incubation time as well as its percentage relative to the initial concentration added to the apical compartment. It is important to note that only the fraction of EGCG encapsulated was tested. The amount of EGCG recovered in the basolateral portion was 0.43 % and 0.32 % (based on the original concentration loaded in the media) for Caco-2 and cocultures, respectively. The low recovery of EGCG was mostly due to the rapid degradation rate and metabolism of EGCG, which has been widely reported in literature. Several sulfated and methylated conjugate metabolites from green tea catechins have been identified on Caco-2 cell model, as same types found in human (Zhang et al. 2004). Also, in the current study, only un-metabolized EGCG from basolateral was analyzed by HPLC, their metabolites were not accounted for. In a previous study, various polyphenols metabolites during the absorption were identified by HPLC coupled with LC/MS (Zhang et al. 2004). Furthermore, the current study only investigated the uptake of EGCG from apical to basolateral. However, significant efflux, from basolateral to apical, mediated by multi-drug resistance protein (MRP) was reported during the transport of polyphenols, which could account for their low transepithelial absorption (Zhang et al. 2004). 108 Table 4.5 Basolateral uptake of EGCG by Caco-2 and coculture cells grown for 21 days on permeable Transwell® plates as affected by administration of free EGCG or encapsulated in milk or soy liposomes at 2h incubation duration in the cell culture medium. The experiments were carried out in triplicates. The data are means and standard deviations of at least 2 individual replicates. Within a row, different letters indicate significant difference (P<0.05). Sample EGCG in solution EGCG in milk liposome EGCG in soy liposome Caco-2 Basolateral (ng ml-1) Percentage (%) 2865 ± 247 a 0.43 ± 0.04 a 107 ± 5 a 0.062 ± 0.003 a 37 ± 4 a 0.027 ± 0.003 a 109 Cocultures Basolateral (ng ml-1) Percentage (%) 2163 ± 254 a 0.32 ± 0.04 a 46 ± 1 b 0.027 ± 0.001b 29 ± 1 b 0.021 ± 0.0002b Compared to the tests with EGCG in solution, the recovery of EGCG from encapsulated liposomes was lower (P<0.05), and this may indicate that longer time was required for cells’ absorption and transport through the monolayer. This would support earlier reports that a steady release of polyphenols was observed to prohibit the growth of cancer cell over elongated period (Gülseren, Guri, and Corredig 2012). EGCG recovery from Caco-2 was higher than from mucus-present cocultures and this was more significant when EGCG was delivered in liposomes (p<0.05) (Table 4.5). This suggested that liposomes were more likely to interact with mucus layer than free EGCG, leading to a longer retention of EGCG on the cells within the same incubation time. These results would support the data obtained from interfacial tensiometry that liposome interaction with mucus might take place. Furthermore, there seemed to be a higher amount of EGCG recovered in samples of milk phospholipid liposomes compared to soy phospholipids liposomes (Table 4.5), albeit in the same order of magnitude. The differences in liposome physicochemical characteristics such as size, surface charge and phospholipids composition greatly affect liposome recognition by cells (Lee, Hong, and Papahadjopoulos 1992; Düzgüneş and Nir 1999). 4.3.5.2 𝛃-carotene recovery in the cell lysates Because of the high hydrophobicity of the molecule, the recovery of -carotene in basolateral compartments is a challenge. Indeed, in this study, the -carotene concentration from basolateral compartment was beyond the detection limit by HPLC 110 (Table 4.6). Insolubilization of carotene in medium, oxidative degradation and metabolic conversion all reduced carotene accumulation in cells. In the cells, carotene metabolizes to retinal by β-C 15,15’ oxygenase 1, and the retinal is further reduced to retinol by retinal reductase (Harrison 2012). However, Caco-2 cells’ ability to convert carotene to vitamin A is very low (Sugawara, Kushiro, and Zhang 2001), plus the 2 h incubation time as standard condition was short and unlikely to affect cellular carotenoids (Sugawara, Kushiro, and Zhang 2001). Hence, the uptake of carotene in the cells was considered a good indication of their transport through the monolayers of Caco-2 and cocultures. Other possible metabolic conversions or oxidative degradation were thus neglected. Solubilization remains a major barrier for the absorption of hydrophobic compounds since crystal carotene cannot be absorbed by cells (Garrett et al. 1999; Sugawara, Kushiro, and Zhang 2001; Harrison 2012). The carotenoids uptake by cells is a facilitated, time-dependent process which depends on carotene conformation and incorporation in chylomicrons (During 2002). For intestinal absorption, carotenoids need to be solubilized in mixed micelles (During 2002; Liang and Shoemaker 2013). When carotene is encapsulated in liposomes, carotene appears to be absorbed by a mechanism involving passive diffusion (Parker 1996). Bioactives were less likely to accumulate in cells than building up in basolateral compartment (Gülseren, Guri, and Corredig 2014), upon incorporation in liposomes, carotene was able to rapidly permeate through Caco-2 monolayer. 111 Table 4.6 Carotene uptake in cell lysates of Caco-2 and coculture cells grown for 21 days on permeable Transwell® plates as affected by administration of free carotene or encapsulated in milk or soy liposomes after 2h incubation duration in the cell culture medium. The experiments were carried out in triplicate. The data are means and standard deviations of at least 2 individual replicates. Within a row, different letters indicate significant difference (P<0.05). Sample Cell lysates (ug ml-1) carotene in medium 1.88 ± 0.36 a carotene in milk liposome 0.27 ± 0.03 a carotene in soy liposome 0.33 ± 0.02 a Caco-2 Percentage (%) 2.17 ± 0.42 a 1.71 ± 0.20 a 2.25 ± 0.16 a 112 Cocultures Cell lysates Percentage (%) -1 (ug ml ) 1.00 ± 0.21 b 1.16 ± 0.24 b 0.19 ± 0.03 a 1.19 ± 0.20 a 0.28 ± 0.01 b 1.91 ± 0.04 b Over 1% of carotene was identified in all cell lysates from Caco-2 and cocultures (Table 4.6), suggesting liposome encapsulated a viable tool for enhanced carotene delivery. On the other hand, there were lower percentages of carotene recovered in cocultures than Caco-2, in agreement with EGCG uptake, as the mucus layer may affect the uptake of carotene entrapped in liposomes. 4.4 Discussion The mucus interactions with liposomes containing bioactives were affected by the physicochemical properties of delivery systems. The interfacial dilational characterization of liposomes at the interface and their effect on the intestinal mucus layer allowed a better understanding of their interactions with mucus. The small, surface-active liposomes were quickly adsorbed to the interface as shown in Figure 4.6. Results showed different interfacial properties between milk and soy liposomes. In buffer, milk liposomes had lower surface tension and a lower moulus of dilational vis oelasticity than soy liposomes. Hence, it was suggested that this may result in different degrees of mucus interactions and ultimately, different extent of bioactive adsorption. In a mixed interface with intestinal mucus, the pre-adsorbed mucin molecules contributed to the viscoelasticity of the film. The presence of liposomes did not seem to affect the surface tension of the mucus layer. The elastic modulus of the mixed interface of milk liposomes and mucus showed a similar trend to that of mucus control, indicating the adsorption of both milk liposomes and mucin molecules to the interface, and milk liposome-mucus 113 interactions were likely to occur. In contrast, the elastic modulus of the mixed interface of soy liposomes and mucus was not significantly different from soy liposomes in buffer, suggesting the dominant effects of soy liposomes at the interface, possibly by displacing mucin molecules. Relevant cell culture models were exploited to investigate the absorption and uptake of liposomes containing bioactives in order to further elucidate liposome-mucus interaction in vitro. Particle size greatly affects cellular uptake mechanisms through entry into enterocytes (Naahidi et al. 2013). The route for liposome entry into cells is mainly through endocytosis, preceded by specific or nonspecific interaction between cell membrane and liposomes, including possible liposome receptors (Düzgüneş and Nir 1999). The liposomes in this study, with apparent diameter around 100 nm, thus they can be directly endocytosed (Naahidi et al. 2013). Surface charge of delivery systems affects interaction during entry into cells (Naahidi et al. 2013). The surface charge of liposomes is mainly due to the negatively charged phospholipids phosphatidylserine and phosphatidylglycerol (Spitsberg 2005; Taylor et al. 2007). The mucus layer is also negatively charged due to high content of sialic acid and sulfate (Lai et al. 2009; Macierzanka et al. 2011). As soy liposomes had higher negative charge, they were hypothesized to have a reduced mucus reaction and a faster mucus penetration rate during cellular uptake. 𝛽-carotene delivered in soy liposomes indeed had higher amount present in cell cylatstes, but the uptake of EGCG did not confirm our hypothesis as EGCG delivered in milk liposomes had a slightly higher recovery in the basolateral compartment. 114 These results suggested that there might be other factors contributing to the uptake of bioactives. It was reported earlier that the uptake of liposome depends on liposome surface properties, not only including surface charge, but also lipid head group and charge density in the liposome bilayer (Lee, Hong, and Papahadjopoulos 1992). Moreover, phospholipids composition could affect liposomes’ surface properties and modulate their uptake (Düzgüneş and Nir 1999). Both interfacial properties and the physicochemical properties of delivery systems affect their interaction and penetration through intestinal mucus layer (Mackie et al. 2012), and it may be hypothesized that they will affect the in vivo activity of the delivered bioactive (Borel and Sabliov 2014). However, this work seems to indicate that while cell absorption studies do not clearly show large differences between delivery systems, interfacial dilational studies may allow better fine tuning of the interactions between the mucus and the food particles. 4.5 Conclusions In this study, intestinal mucus interactions with liposomes containing model bioactives were studied. Milk phospholipids liposomes prepared using microfluidization technique had bigger size, higher encapsulation efficiencies and better stability compared to soy phospholipids liposomes. Milk and soy phospholipids liposomes also showed different interfacial properties. The mucus interactions with liposomes were demonstrated at the mixed interfaces by interfacial dilational characterization, where milk and soy 115 liposomes showed different degrees of mucus interations. Liposomes containing EGCG seemed to affect the rheological properties of mucus layer while empty liposome or liposomes containing 𝛽-carotene did not show such behaviour. The bioactive uptake was further conducted in vitro on Caco-2 cells and cocultures of Caco-2/HT29-MTX, where the mucus layer covering cocultures was associated with the lower recoveries of EGCG and 𝛽-carotene. Overall, using mucus-associated model will render a more proper and underexploited approach for determining the bioefficacy of bioactives, and it is necessary to take mucus into account when designing food delivery systems. 116 Chapter 5. Conclusions and future directions The health-benefits and instability of bioactive compounds render both opportunities and challenges for the development of functional foods. Bioactives are often encapsulated into food matrices for enhanced bioactivity and bioefficacy. This study investigated the interactions of intestinal mucus layer with two types of carriers, milk proteins and liposomes, for the delivery of two model bioactives, tea polyphenol (EGCG) and -carotene. The study aimed to bring some insights and provide a fundamental understanding of the role of mucus layer may play on the absorption of bioactive compounds in the intestine. The mucus used in this study was harvested from HT29-MTX, a human colon cancer cell line with mucin-secreting ability. Compared to artificial and animal originated mucus that had been utilized in literature, this type of mucus was very similar to human intestinal mucus layer in terms of composition and rheological properties. Dynamic drop shape tensiometry, a useful and effective tool for studying interfacial dilational properties, was used here to probe nutrients interactions with pre-adsorbed mucin film at an air-liquid interface. In the first part of this study, the rheological property of mucus dispersion was first studied by drop shape tensiometry. Mucins (glycoproteins), the major component in mucus, were found responsible for the viscoelastic properties at the interface. Milk proteins are shown as an ideal platform for polyphenols delivery in literature (Livney 2010; Tavares et al. 2014). To study mucus interactions with tea polyphenol, free or 117 complex with milk proteins, a combination of interfacial dilational rheology and in situ trypsin proteolysis of milk proteins was used to characterize the properties of the interface mixed with mucus dispersion. Rheological characterization showed that EGCG, whether or not complexed with milk proteins, did not affect the adsorption of mucin molecules to the interface. However, EGCG enhanced the elastic modulus of the mixed interfaces containing mucus, providing a stiffer surface film. The in situ digestion of milk proteins by trypsin showed higher surface activities as a result of protein unfolding and competitive adsorption of the hydrolyzed products. Besides, an increase of viscoelastic modulus of the mixed interfaces was observed, indicating the formation of a stiffer interfacial network over drop aging time. These results suggested the complexity of mucus–nutrient interactions during digestion and mucus layer play an important role on nutrients absorption. The second part of this study focused on studying mucus interactions with liposomes, a phospholipids-based delivery system, encapsulating EGCG and 𝛽-carotene. Liposome encapsulation is considered an effective technology for enhancing the stability and bioavailability of bioactive compounds as well as for inducing their controlled release (Mozafari et al. 2008; Lu, Li, and Jiang 2011). Liposomes were prepared from milk and soy derived phospholipids through microfluidization—a food grade processing technique, and small, unilamellar nanoliposomes were obtained. The physicochemical and interfacial properties of liposomes were characterized. Results showed that milk phospholipids liposomes had larger apparent diameters, lower surface charges, higher 118 encapsulation efficiencies and higher stability under various environmental conditions compared to soy phospholipids liposomes. Encapsulation of EGCG or -carotene did not seem to affect their physicochemical properties. Using drop shape tensiometry, empty milk and soy phospholipids liposomes in buffer showed different interfacial parameters, i.e. interfacial tension and modulus of dilational viscoelasticity. Liposomes containing EGCG showed increased dilational modulus while empty and liposomes containing -carotene showed similar values. The presence of liposomes, empty or containing bioactives, did not significantly affect the interfacial tension values of the mucus interface. In terms of interfacial viscoelasticity, milk phospholipids liposomes showed no effect on modulus of the mucus layers while soy phospholipids liposomes significantly increased the dilational modulus of the mixed interfaces containing mucus. Then, in vitro uptake of EGCG and -carotene, free or encapsulated in liposomes was investigated on two cell models, Caco-2 and cocultures of Caco-2/HT29-MTX. Results confirmed with the rheological experiments that mucus layer from cocultures affected the uptake of bioactives, as a more pronounced uptake was noticed in the mucus-free Caco-2 monolayer. However, the bioactive recoveries were generally very low, especially for EGCG due to the liability and fast degradation of this polyphenol. Current results also pointed to the difficulties and challenges of using in vitro cell models to investigate bioactive absorption. Some studies found mucus as a permeation barrier and reduced compounds transport (Karlsson, Wikman, and Artursson 1993; Khanvilkar, Donovan, and Flanagan 2001; 119 Mahler, Shuler, and Glahn 2009), others suggested that intestinal mucus layer might enhance nutrient delivery by extending their retention time in the gut (Behrens et al. 2001; Cone 2009). In the current study, using the material science approach, the human intestinal mucus layer interactions with food matrices were clearly demonstrated at the air/liquid interface by drop shape tensiometry. Changes in the surface tension and modulus of dilational viscoelasticity indicated different degrees of mucus interactions with milk proteins and liposomes as nanocarriers for bioactives. Based on the results gathered in the present study, physicochemical and interfacial properties of bioactive carriers affected the nanoparticle penetration and interactions with mucus. There are some recommendations made for future studies. Firstly, future research will be needed to better understand the mechanisms that govern mucus interaction with delivery systems. This will help design food delivery systems with desired portraits for mucoadhesion or mucopenetration for an optimal delivery and enhanced bioavailability of bioactive compounds. Secondly, as nutrients undertake digestion process before reaching the intestinal epithelium, future work is desired to systematically investigate various delivery systems after digestion in order to acquire more representative mucus interaction behaviour. Thirdly, as an improved stability under digestion does not guarantee a high penetration through mucus, therefore it is recommended to evaluate the bioefficacy of bioactives and the effectiveness of food delivery systems based on a mucus-involved model. Lastly, as there is a need for a more fundamental understanding of the underlying mechanisms governing nutrients absorption during digestion, using 120 studies solely based on in vitro or in vivo absorption models cannot meet such demands. Material science, on the other hand, is gaining more attention nowadays due to its ability to probe interactions at the molecular level. Only after better evaluation of the interactions using such mechanistic studies it will be possible to further interpret the results of in vivo human intervention trials. 121 Chapter 6. References Acosta E. 2009. Bioavailability of nanoparticles in nutrient and nutraceutical delivery. Curr. Opin. Colloid Interface Sci. 14:3–15. Aguié-Béghin V, Sausse P, Meudec E, Cheynier V, Douillard R. 2008. Polyphenol-beta-casein complexes at the air/water interface and in solution: effects of polyphenol structure. J. Agric. Food Chem. 56:9600–9611. Alexander M, Acero Lopez A, Fang Y, Corredig M. 2012. Incorporation of phytosterols in soy phospholipids nanoliposomes: Encapsulation efficiency and stability. LWT - Food Sci. Technol. 47:427–436. Allen A, Flemström G. 2005. Gastroduodenal mucus bicarbonate barrier: protection against acid and pepsin. Am. J. Physiol. 288: C1-C19. Allen A, Garner A. 1980. Mucus and bicarbonate secretion in the stomach and their possible role in mucosal protection. Gut:249–262. Allen JD, Martin GP, Marriott C, Hassan I, Williamson I. 1991. Drug transport across a novel mucin secreting cell model: comparison with the Caco-2 cell system. J. Pharm. Pharmacol. 43: 63P. Allen A, Snary D. 1972. The structure and function of gastric mucus. Gut.13:666–672. Almgren M, Edwards K, Karlsson G. 2000. Cryo transmission electron microscopy of liposomes and related structures. Colloids Surfaces A… 174:3–21. Anand P, Nair HB, Sung B, Kunnumakkara AB, Yadav VR, Tekmal RR, Aggarwal BB. 2010. Design of curcumin-loaded PLGA nanoparticles formulation with enhanced cellular uptake, and increased bioactivity in vitro and superior bioavailability in vivo. Biochem. Pharmacol. 79:330–8. Anderson R, Polansky M. 2002. Tea enhances insulin activity. J. Agric. Food …50:7182– 7186. Arts MJ, Haenen GR, Wilms LC, Beetstra SA, Heijnen CG, Voss HP, Bast A. 2002. Interactions between flavonoids and proteins: Effect on the total antioxidant capacity. J. Agric. Food Chem. 50:1184–1187. 122 Barba AO, Hurtado MC, Mata MS, Ruiz VF, De Tejada MLS. 2006. Application of a UV–vis detection-HPLC method for a rapid determination of lycopene and β-carotene in vegetables. Food Chem. 95:328–336. Behrens I, Pena A, Alonso M, Kissel T. 2002. Comparative uptake studies of bioadhesive and non-bioadhesive nanoparticles in human intestinal cell lines and rats: the effect of mucus on particle adsorption and transport. Pharm. Res. 19:1185-1193. Behrens I, Stenberg P, Artursson P, Kissel T. 2001. Transport of lipophilic drug molecules in a new mucus-secreting cell culture model based on HT29-MTX cells. Pharm. Res. 18:1138–1145. Bennick A. 2002. Interaction of Plant Polyphenols With Salivary Proteins. Crit. Rev. Oral Biol. Med. 13:184–196. Benshitrit RC, Levi CS, Tal SL, Shimoni E, Lesmes U. 2012. Development of oral food-grade delivery systems: current knowledge and future challenges. Food Funct. 3:10– 21. Berrocal M, Bujan J. 2000. Comparison of the effects of dimyristoyl and soya phosphatidylcholine liposomes on human fibroblasts. Drug Deliv. 7:37–44. Bligh E, Dyer W. 1959. A rapid method of total lipid extraction and purification. Can. J. Biochem. … 37:911-917. Boegh M, Baldursdóttir SG, Müllertz A, Nielsen HM. 2014. Property profiling of biosimilar mucus in a novel mucus-containing in vitro model for assessment of intestinal drug absorption. Eur. J. Pharm. Biopharm. 87:227–35. Borel T, Sabliov CM. 2014. Nanodelivery of bioactive components for food applications: types of delivery systems, properties, and their effect on ADME profiles and toxicity of nanoparticles. Annu. Rev. Food Sci. Technol. 5:197–213. Burling H, Graverholt G. 2008. Milk–A new source for bioactive phospholipids for use in food formulations. Lipid Technol. 20:229–231. Carey M, Small D, Bliss C. 1983. Lipid digestion and absorption. Annu. Rev. Physiol. 45:651–677. Chacko SM, Thambi PT, Kuttan R, Nishigaki I. 2010. Beneficial effects of green tea: a literature review. Chin. Med. 5:1-9. 123 Chen D, Xia D, Li X, Zhu Q, Yu H, Zhu C, Gan Y. 2013. Comparative study of Pluronic(®) F127-modified liposomes and chitosan-modified liposomes for mucus penetration and oral absorption of cyclosporine A in rats. Int. J. Pharm. 449:1–9. Chuwers P, Barnhart S, Blanc P, Brodkin CA, Cullen M, Kelly T, Keogh J, Omenn G, Williams J, Balmes JR. 1997. The protective effect of beta-carotene and retinol on ventilatory function in an asbestos-exposed cohort. Am. J. Respir. Crit. Care Med. 155:1066–71. Cone RA. 2009. Barrier properties of mucus. Adv. Drug Deliv. Rev. 61:75–85. Conrad ME, Umbreit JN, Moore EG. 1994. Iron absorption and cellular uptake of iron. Progress in Iron Research. Springer US. 69-79. Contarini G, Povolo M. 2013. Phospholipids in milk fat: composition, biological and technological significance, and analytical strategies. Int. J. Mol. Sci. 14:2808–31. Corredig M, Roesch RR, Dalgleish DG. 2003. Production of a novel ingredient from buttermilk. J. Dairy Sci. 86:2744–50. Cu Y, Saltzman WM. 2008. Controlled Surface Modification with Poly (ethylene) glycol Enhances Diffusion of PLGA Nanoparticles in Human Cervical Mucus. Mol. Pharm. 6:173–181. Cu Y, Saltzman WM. 2009. Mathematical modeling of molecular diffusion through mucus. Adv. Drug Deliv. Rev. 61:101–14. D’Agostino EM, Rossetti D, Atkins D, Ferdinando D, Yakubov GE. 2012. Interaction of tea polyphenols and food constituents with model gut epithelia: the protective role of the mucus gel layer. J. Agric. Food Chem. 60:3318–28. Deplancke B, Gaskins HR. 2001. Microbial modulation of innate defense: goblet cells and the intestinal mucus layer. Am. J. Clin. Nutr. 73:1131S–1141S. Dingle J, Lucy J. 1965. Vitamin A, carotenoids and cell function. Biol. Rev.40:422-458 During A. 2002. Carotenoid uptake and secretion by CaCo-2 cells: beta-carotene isomer selectivity and carotenoid interactions. J. Lipid Res. 43:1086–1095. Düzgüneş N, Nir S. 1999. Mechanisms and kinetics of liposome–cell interactions. Adv. Drug Deliv. Rev. 40:3–18. 124 Edge R, McGarvey DJ, Truscott TG. 1997. The carotenoids as anti-oxidants—a review. J. Photochem. … 41:189–200. Ensign LM, Cone R, Hanes J. 2012. Oral drug delivery with polymeric nanoparticles: the gastrointestinal mucus barriers. Adv. Drug Deliv. Rev. 64:557–70. Er Y, Prestidge CA, Fornasiero D. 2004. Attenuated total reflectance infrared studies of liposome adsorption at the solid-liquid interface. Colloids Surfaces B: Biointerfaces 36:147–153. Fainerman V, Lucassen-Reynders E, Miller R. 1998. Adsorption of surfactants and proteins at fluid interfaces. Colloids Surfaces A: Physicochem. Eng. Asp. 143:141–165. Fang Z, Bhandari B. 2010. Encapsulation of polyphenols – a review. Trends Food Sci. Technol. 21:510–523. Farhang B, Kakuda Y, Corredig M. 2012. Encapsulation of ascorbic acid in liposomes prepared with milk fat globule membrane-derived phospholipids. Dairy Sci. Technol. 92:353–366. Farhang B. 2013. Encapsulation of Bioactive Compounds in Liposomes prepared with Milk Fat Globule Membrane-Derived Phospholipids. A Thesis Present. to Univ. Guelph. Garrett D, Failla M, Sarama R, Craft N. 1999. Accumulation and retention of micellar carotene and lutein by Caco-2 human intestinal cells. J. Nutr. … 10:573–581. Girardet JM, Debomy L, Courthaudon JL, Miclo L, Humbert G, Gaillard JL. 2000. Viscoelastic Properties of Oil-Water Interfaces Covered by Bovine β-Casein Tryptic Peptides. J. Dairy Sci. 83:2410–2421. Guerra A, Etienne-Mesmin L, Livrelli V, Denis S, Blanquet-Diot S, Alric M. 2012. Relevance and challenges in modeling human gastric and small intestinal digestion. Trends Biotechnol. 30:591–600. Gülseren I, Corredig M. 2012. Interactions at the interface between hydrophobic and hydrophilic emulsifiers: Polyglycerol polyricinoleate (PGPR) and milk proteins, studied by drop shape tensiometry. Food Hydrocoll. 29:193–198. Gülseren I, Corredig M. 2013. Storage stability and physical characteristics of tea-polyphenol-bearing nanoliposomes prepared with milk fat globule membrane phospholipids. J. Agric. Food Chem. 61:3242–3251. 125 Gülseren I, Guri A, Corredig M. 2012. Encapsulation of Tea Polyphenols in Nanoliposomes Prepared with Milk Phospholipids and Their Effect on the Viability of HT-29 Human Carcinoma Cells. Food Dig. 3:36–45. Gülseren I, Guri A, Corredig M. 2014. Effect of interfacial composition on uptake of curcumin-piperine mixtures in oil in water emulsions by Caco-2 cells. Food Funct. 5:1218–1223. Guri A, Haratifar S, Corredig M. 2014. Bioefficacy of Tea Catechins Associated with Milk Caseins Tested Using Different In Vitro Digestion Models. Food Dig. 5:8-18 Guri A, Corredig M. 2014. Chapter 17 - Dairy Materials as Delivery Tools for Bioactive Components in Dairy Platforms. In: Mike Boland, Matt Golding and Harjinder Singh, editors. Food Structures, Digestion and Health. Academic Press.Elsevier Inc. p.465–488. Guri A, Gülseren I, Corredig M. 2013. Utilization of solid lipid nanoparticles for enhanced delivery of curcumin in cocultures of HT29-MTX and Caco-2 cells. Food Funct. 4:1410–9. Handelman GJ. 2001. The evolving role of carotenoids in human biochemistry. Nutrition. 17:818–822. Haratifar S, Corredig M. 2014. Interactions between tea catechins and casein micelles and their impact on renneting functionality. Food Chem. 143:27–32. Harrison EH. 2012. Mechanisms involved in the intestinal absorption of dietary vitamin A and provitamin A carotenoids. Biochim. Biophys. Acta. 1821:70–7. Hasni I, Bourassa P, Hamdani S, Samson G, Carpentier R, Tajmir-Riahi HA. 2011. Interaction of milk α- and β-caseins with tea polyphenols. Food Chem. 126:630–639. Hermida LG, Sabés-Xamaní M, Barnadas-Rodríguez R. 2009. Combined strategies for liposome characterization during in vitro digestion. J. Liposome Res. 19:207–19. Hilgendorf C. 2000. Caco‐2 versus caco‐2/HT29‐MTX co‐cultured cell lines: permeabilities via diffusion, inside‐and outside‐directed carrier‐mediated transport. J. Pharm. Sci. 89:63–75. Hirun S, Roach P. 2011. A study of stability of (-) Epigallocatechin gallate (EGCG) from green tea in a frozen product. Int. Food Res. J. 18:1261–1264. 126 Hughes DA. 2001. Dietary carotenoids and human immune function. Nutrition. 17:823– 827. Ikigai H, Nakae T, Hara Y, Shimamura T. 1993. Bactericidal catechins damage the lipid bilayer. 1147:132–136. Jöbstl E, O’Connell J, Fairclough JPA, Williamson MP. 2004. Molecular model for astringency produced by polyphenol/protein interactions. Biomacromolecules. 5:942–9. Karlsson J, Wikman A, Artursson P. 1993. The mucus layer as a barrier to drug absorption in monolayers of human intestinal epithelial HT29-H goblet cells. Int. J. Pharm. 99:209–218. Keller B. 2001. Liposomes in nutrition. Trends Food Sci. Technol. 12:25–31. Khanvilkar K, Donovan M, Flanagan D. 2001. Drug transfer through mucus. Adv. Drug Deliv. Rev. 48:173–193. Kim J, Khan W. 2013. Goblet Cells and Mucins: Role in Innate Defense in Enteric Infections. Pathogens. 2:55–70. Klemetsrud T, Jonassen H, Hiorth M, Kjøniksen AL, Smistad G. 2013. Studies on pectin-coated liposomes and their interaction with mucin. Colloids Surf. B. Biointerfaces. 103:158–65. Komiyama Y, Mitsuyama K, Masuda J, Yamasaki H, Takedatsu H, Andoh A, Tsuruta O, Fukuda M, Kanauchi O. 2011. Prebiotic treatment in experimental colitis reduces the risk of colitic cancer. J. Gastroenterol. Hepatol. 26:1298–308. Korhonen H. 2009. Milk-derived bioactive peptides: From science to applications. J. Funct. Foods. 1:177–187. Lai S, Wang Y, Wirtz D, Hanes J. 2009. Micro- and macrorheology of mucus. Adv. Drug Deliv. Rev. 61:86–100. Lai SK, Wang YY, Hanes J. 2009. Mucus-penetrating nanoparticles for drug and gene delivery to mucosal tissues. Adv. Drug Deliv. Rev. 61:158–71. Lambert J. 2003. Cancer chemopreventive activity and bioavailability of tea and tea polyphenols. Mutat. Res. Mol. Mech. Mutagen. 523:201–208. 127 Larhed A, Artursson P. 1997. Diffusion of drugs in native and purified gastrointestinal mucus. J. Pharm. Sci. 86:660–665. Launois-Surpas MA, Ivanova T, Panaiotov I, Proust JE, Puisieux F, Georgiev G. 1992. Behavior of pure and mixed DPPC liposomes spread or adsorbed at the air-water interface. Colloid Polym. Sci. 270:901–911. Lee K, Hong K, Papahadjopoulos D. 1992. Recognition of liposomes by cells: in vitro binding and endocytosis mediated by specific lipid headgroups and surface charge density. Biochim. Biophys. Acta (BBA)-Biomembranes. 1103:185–197. Lee WC, Tsai TH. 2010. Preparation and characterization of liposomal coenzyme Q10 for in vivo topical application. Int. J. Pharm. 395:78–83. Lestringant P, Guri A, Gülseren I, Relkin PR, and Corredig M. 2014. Effect of Processing on Physicochemical Characteristics and Bioefficacy of β-Lactoglobulin– Epigallocatechin-3-gallate Complexes. J. Agric. Food Chem. 62:8357–8364. Li X, Chen D, Le C, Zhu C, Gan Y, Hovgaard L, Yang M. 2011. Novel mucus-penetrating liposomes as a potential oral drug delivery system: preparation, in vitro characterization, and enhanced cellular uptake. Int. J. Nanomedicine.6:3151–62. Liang R, Shoemaker C. 2013. Stability and bioaccessibility of β-carotene in nanoemulsions stabilized by modified starches. J. Agric. Food Chem. 61:1249–1257. Liu W, Liu J, Li T, Liu C. 2013. Improved physical and in vitro digestion stability of a polyelectrolyte delivery system based on layer-by-layer self-assembly alginate– chitosan-coated nanoliposomes. J. Agric. Food Chem. 61:4133–4144. Liu N, Park HJ. 2009. Chitosan-coated nanoliposome as vitamin E carrier. J. Microencapsul. 26:235–242. Liu W, Ye A, Liu C, Liu W, Singh H. 2012. Structure and integrity of liposomes prepared from milk- or soybean-derived phospholipids during in vitro digestion. Food Res. Int. 48:499–506. Liu W, Ye A, Liu W, Liu C, Singh H. 2013. Stability during in vitro digestion of lactoferrin-loaded liposomes prepared from milk fat globule membrane-derived phospholipids. J. Dairy Sci. 96:2061–70. Livney YD. 2010. Milk proteins as vehicles for bioactives. Curr. Opin. Colloid Interface Sci. 15:73–83. 128 Lowry O, Rosebrough N, Farr A, Randall R. 1951. Protein measurement with the Folin phenol reagent. J biol Chem. 193:265–275. Lu Q, Li DC, Jiang JG. 2011. Preparation of a tea polyphenol nanoliposome system and its physicochemical properties. J. Agric. Food Chem. 59:13004–11. Lucassen-Reynders E, Cagna A, Lucassen J. 2001. Gibbs elasticity, surface dilational modulus and diffusional relaxation in nonionic surfactant monolayers. Colloids Surfaces A Physicochem. Eng. Asp. 186:63–72. Macierzanka A, Böttger F, Rigby N. 2012. Enzymatically structured emulsions in simulated gastrointestinal environment: impact on interfacial proteolysis and diffusion in intestinal mucus. Langmuir.28:17349–17362. Macierzanka A, Rigby NM, Corfield AP, Wellner N, Böttger F, Mills ENC, Mackie AR. 2011. Adsorption of bile salts to particles allows penetration of intestinal mucus. Soft Matter. 7:8077. Mackie AR, Round A. N, Rigby NM, Macierzanka A. 2012. The Role of the Mucus Barrier in Digestion. Food Dig. 3:8–15. Mahler GJ, Shuler ML, Glahn RP. 2009. Characterization of Caco-2 and HT29-MTX cocultures in an in vitro digestion/cell culture model used to predict iron bioavailability. J. Nutr. Biochem. 20:494–502. Maldonado-Valderrama J, Wilde P, Macierzanka A, Mackie A. 2011. The role of bile salts in digestion. Adv. Colloid Interface Sci. 165:36–46. Martin A, Grolle K, Bos M, Stuart M, Vanvliet T. 2002. Network Forming Properties of Various Proteins Adsorbed at the Air/Water Interface in Relation to Foam Stability. J. Colloid Interface Sci. 254:175–183. McClements DJ, Decker EA, Park Y, Weiss J. 2009. Structural design principles for delivery of bioactive components in nutraceuticals and functional foods. Crit. Rev. Food Sci. Nutr. 49:577–606. Meaney C, O’Driscoll C. 1999. Mucus as a barrier to the permeability of hydrophilic and lipophilic compounds in the absence and presence of sodium taurocholate micellar systems using cell culture models. Eur. J. Pharm. Sci. 8:167–75. Monteleone E, Condelli N, Dinnella C, Bertuccioli M. 2004. Prediction of perceived astringency induced by phenolic compounds. Food Qual. Prefer. 15:761–769. 129 Mozafari MR, Johnson C, Hatziantoniou S, Demetzos C. 2008. Nanoliposomes and their applications in food nanotechnology. J. Liposome Res. 18:309–27. Mozafari MR, Khosravi-Darani K, Borazan GG, Cui J, Pardakhty A, Yurdugul S. 2008. Encapsulation of Food Ingredients Using Nanoliposome Technology. Int. J. Food Prop. 11:833–844. Mozafari MR. 2005. Liposomes: an overview of manufacturing techniques. Cell. Mol. Biol. Lett. 10:711–719. Naahidi S, Jafari M, Edalat F, Raymond K, Khademhosseini A, Chen P. 2013. Biocompatibility of engineered nanoparticles for drug delivery. J. Control. Release 166:182–94. Nacka F, Cansell M, Entressangles B. 2001. In vitro behavior of marine lipid-based liposomes. Influence of pH, temperature, bile salts, and phospholipase A2. Lipids. 36:35–42. Nagle DG, Ferreira D, Zhou YD. 2006. Epigallocatechin-3-gallate (EGCG): Chemical and biomedical perspectives. Phytochemistry. 67:1849–1855. Nakayama T, Hashimoto T, Kajiya K, Kumazawa S. 2000. Affinity of polyphenols for lipid bilayers. Biofactors 13:147–151. Nimmerfall F, Rosenthaler J. 1980. Significance of the goblet-cell mucin layer, the outermost luminal barrier to passage through the gut wall. Biochem. Biophys. Res. Commun. 94:960–966. Nordgård CT, Draget K. 2011. Oligosaccharides as modulators of rheology in complex mucous systems. Biomacromolecules.12:3084–3090. Parker R. 1996. Absorption, metabolism, and transport of carotenoids. FASEB J. 10:542– 551. Phillips MC.1981. Protein conformation at liquid interfaces and its role in stabilizing emulsions and foams. Food Technology. 35: 50. Pontier C, Pachot J, Botham R, Lenfant B, Arnaud P. 2001. HT29-MTX and Caco-2/TC7 monolayers as predictive models for human intestinal absorption: role of the mucus layer. J. Pharm. Sci. 90:1608–19. 130 Qian C, Decker EA, Xiao H, McClements DJ. 2012. Physical and chemical stability of β-carotene-enriched nanoemulsions: Influence of pH, ionic strength, temperature, and emulsifier type. Food Chem. 132:1221–1229. Quintanilla-Carvajal MX, Camacho-Díaz BH, Meraz-Torres LS, Chanona-Pérez JJ, Alamilla-Beltrán L, Jimenéz-Aparicio A, Gutiérrez-López GF. 2009. Nanoencapsulation: A New Trend in Food Engineering Processing. Food Eng. Rev. 2:39–50. Rossetti D, Ravera F, Liggieri L. 2013a. Effect of tea polyphenols on the dilational rheology of Human Whole Saliva (HWS): Part 1, HWS characterization. Colloids Surf. B. Biointerfaces.110:466–73. Rossetti D, Ravera F, Liggieri L. 2013b. Effect of tea polyphenols on the dilational rheology of human whole saliva (HWS): part 2, polyphenols-HWS interaction. Colloids Surf. B. Biointerfaces. 110:474–9. Round AN, Rigby NM, Garcia de la Torre A, Macierzanka A, Mills ENC, Mackie AR. 2012. Lamellar structures of MUC2-rich mucin: a potential role in governing the barrier and lubricating functions of intestinal mucus. Biomacromolecules. 13:3253–61. Saito S, Welzel A. 2006. A method for fast determination of epigallocatechin gallate (EGCG), epicatechin (EC), catechin (C) and caffeine (CAF) in green tea using HPLC. Food Sci. Technol. 26:394–400. Sausse P, Aguié-Béghin V, Douillard R. 2003. Effects of Epigallocatechin Gallate on β-Casein Adsorption at the Air/Water Interface. Langmuir.19:737–743. Siddiqui IA, Adhami VM, Ahmad N, Mukhtar H. 2010. Nanochemoprevention: sustained release of bioactive food components for cancer prevention. Nutr. Cancer 62:883–90. Singh H, Ye A, Horne D. 2009. Structuring food emulsions in the gastrointestinal tract to modify lipid digestion. Prog. Lipid Res. 48:92–100. Smedes F, Thomasen TK. 1996. Evaluation of the Bligh & Dyer lipid determination method. Mar. Pollut. Bull. 32:681–688. Smith AM, Jaime-Fonseca MR, Grover LM, Bakalis S. 2010. Alginate-loaded liposomes can protect encapsulated alkaline phosphatase functionality when exposed to gastric pH. J. Agric. Food Chem. 58:4719–24. Spitsberg VL. 2005. Invited review: Bovine milk fat globule membrane as a potential nutraceutical. J. Dairy Sci. 88:2289–94. 131 Sprong RC, Schonewille AJ, van der Meer R. 2010. Dietary cheese whey protein protects rats against mild dextran sulfate sodium-induced colitis: role of mucin and microbiota. J. Dairy Sci. 93:1364–71. Sugawara T, Kushiro M, Zhang H. 2001. Lysophosphatidylcholine enhances carotenoid uptake from mixed micelles by Caco-2 human intestinal cells. J. Nutr. 131:2921–2927. Tabak LA, Levine MJ, Mandel ID, Ellison SA. 1982. Role of salivary mucins in the protection of the oral cavity. J. Oral Pathol. 11:1–17. Takahashi M, Kitamoto D, Imura T, Oku H, Takara K, Wada K. 2008. Characterization and Bioavailability of Liposomes Containing a Ukon Extract. Biosci. Biotechnol. Biochem. 72:1199–1205. Tavares GM, Croguennec T, Carvalho AF, Bouhallab S. 2014. Milk proteins as encapsulation devices and delivery vehicles: Applications and trends. Trends Food Sci. Technol. 37:5–20. Taylor C, Pearson J, Draget K, Dettmar P, Smidsrod O. 2005. Rheological characterisation of mixed gels of mucin and alginate. Carbohydr. Polym. 59:189–195. Taylor TM, Gaysinsky S, Davidson PM, Bruce BD, Weiss J. 2007. Characterization of Antimicrobial-bearing Liposomes by ζ-Potential, Vesicle Size, and Encapsulation Efficiency. Food Biophys. 2:1–9. Thompson AK, Singh H. 2006. Preparation of liposomes from milk fat globule membrane phospholipids using a microfluidizer. J. Dairy Sci. 89:410–9. Thompson AK, Couchoud A, Singh H. 2009. Comparison of hydrophobic and hydrophilic encapsulation using liposomes prepared from milk fat globule-derived phospholipids and soya phospholipids. Dairy Sci. Technol. 89:99–113. Thompson AK, Mozafari M, Singh H. 2007. The properties of liposomes produced from milk fat globule membrane material using different techniques. Lait.87:349–360. Thompson AK, Haisman D, Singh H. 2006. Physical stability of liposomes prepared from milk fat globule membrane and soya phospholipids. J. Agric. Food Chem. 54:6390–7. Thompson AK, Hindmarsh JP, Haisman D, Rades T, Singh H. 2006. Comparison of the structure and properties of liposomes prepared from milk fat globule membrane and soy phospholipids. J. Agric. Food Chem. 54:3704–11. 132 Valcic S, Timmermann BN, Alberts DS, Wächter GA, Krutzsch M, Wymer J, Guillén JM. 1996. Inhibitory effect of six green tea catechins and caffeine on the growth of four selected human tumor cell lines. Anti-cancer drugs. 7:461-468. Vichai V, Kirtikara K. 2006. Sulforhodamine B colorimetric assay for cytotoxicity screening. Nature protocols. 1:1112-1116. Walter E, Janich S. 1996. HT29‐MTX/Caco‐2 cocultures as an in vitro model for the intestinal epithelium: In vitro–in vivo correlation with permeability data from rats and humans. J. Pharm. Sci. 85:1070–1076. Wikman-Larhed A, Artursson P. 1995. Co-cultures of human intestinal goblet (HT29-H) and absorptive (Caco-2) cells for studies of drug and peptide absorption. Eur. J. Pharm. Sci. 3:171–183. Williams A, Prins A. 1996. Comparison of the dilational behaviour of adsorbed milk proteins at the air-water and oil-water interfaces. Colloids Surfaces A Physicochem. Eng. Asp. 114:267–275. Wisniewska A, Widomska J, Subczynski WK. 2006. Carotenoid-membrane interactions in liposomes: Effect of dipolar, monopolar, and nonpolar carotenoids. Acta Biochim. Pol. 53:475–484. Yang GY, Liao J, Kim K, Yurkow EJ, Yang CS. 1998. Inhibition of growth and induction of apoptosis in human cancer cell lines by tea polyphenols. Carcinogenesis. 19:611-616 Yoo JW, Mitragotri S. 2010. Polymer particles that switch shape in response to a stimulus. Proc. Natl. Acad. Sci. U. S. A. 107:11205–10. Yuan Y, Gao Y, Zhao J, Mao L. 2008. Characterization and stability evaluation of β-carotene nanoemulsions prepared by high pressure homogenization under various emulsifying conditions. Food Res. Int. 41:61–68. Yuksel Z, Avci E, Erdem YK. 2010. Characterization of binding interactions between green tea flavanoids and milk proteins. Food Chem. 121:450–456. Zanabria R, Tellez AM, Griffiths MW, Corredig M. 2014. The antiproliferative properties of the milk fat globule membrane are affected by extensive heating. Dairy Sci. Technol. 94:439–453. 133 Zhang L, Zheng Y, Chow MSS, Zuo Z. 2004. Investigation of intestinal absorption and disposition of green tea catechins by Caco-2 monolayer model. Int. J. Pharm. 287:1–12. Zuidam NJ, Nedović VA. 2010. Encapsulation technologies for active food ingredients and food processing. Zuidam NJ, Nedovic V, editors. New York, NY: Springer New York. 134


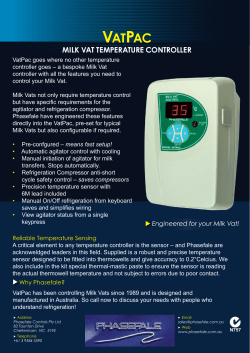


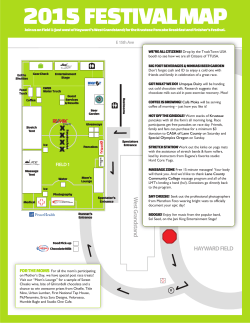
© Copyright 2026