
UNILEVER SUSTAINABLE LIVING PLAN PROGRESS
PROGRESS
REPORT 2012
UNILEVER
SUSTAINABLE
LIVING PLAN
STRATEGY
1 Our Changing World
2 Chief Executive Officer’s Review
4 Our Compass Strategy
5 Our Business Model
6Embedding Sustainability
8 Operational Highlights
10 Unilever Sustainable Living Plan in 2012
progress on the plan >
12Health and Hygiene
Improving hygiene and promoting well-being
18Nutrition
Helping people make healthy choices
governance >
50Governance and External Commentary
52 Verification and Metrics
24Greenhouse Gases
Helping to tackle climate change
30Water
Reducing our water use where it matters most
34Waste
Reduce, reuse, recycle
40Sustainable Sourcing
Growing for the future
46Better Livelihoods
Supporting economic development
In November 2010 we set out the Unilever Sustainable Living Plan (USLP),
our blueprint for achieving our vision to double the size of the business whilst
reducing our environmental footprint and increasing our positive social impact.
About our reporting
The Unilever Sustainable Living Plan: Progress Report 2012, published in April 2013, is complemented by:
Boundaries for reporting
• The online Unilever Sustainable Living Report for 2012. Our website is our principal means of reporting.
It includes more background to our progress on the USLP and the scope of our assurance programme
as well as more detailed information on our approach to running a responsible business. It also contains
indices that cross reference our performance to the UN Global Compact Principles, the Millennium
Development Goals and Global Reporting Initiative indicators.
www.unilever.com/sustainable-living
This Progress Report 2012 covers Unilever’s global
operations for the period 1 January-31 December
2012 unless otherwise stated. Data is provided for
Unilever’s wholly owned companies, subsidiaries
and key joint ventures and listed entities where
we have a majority ownership.
• Unilever’s Annual Report and Accounts 2012: Making Sustainable Living Commonplace, which outlines
our business and financial performance including key financial and non-financial performance indicators.
www.unilever.com/investorrelations
The Unilever Sustainable Living Plan is
independently assured. Further information
on our approach to assurance can be found on
page 52.
www.unilever.com/SUSTAINABLE-LIVING
STRATEGY
progress on the plan >
governance >
OUR
CHANGING
WORLD
THE CONTEXT
OUR RESPONSE
9 billion
The Unilever Sustainable Living
Plan is our strategic response to
the unprecedented challenges the
world faces. It is at the heart of our
Compass strategy which sets out
our ambitious vision and purpose.
People expected on the planet by 2050;
population is growing by 200,000 a day
200 million
Unemployed today; 600 million jobs
need to be created over the next decade
2 million
Children die every year from diarrhoea
and pneumonia
Climate change
Is accelerating towards a temperature
rise greater than 2 degrees
Two-thirds
Of the world could be living in
water-stressed conditions by 2025
40%
Our purpose
TO MAKE SUSTAiNABLE
LIVING COMMONPLACE
We work to create a better future every day,
with brands and services that help people
feel good, look good and get more out of life.
Our first priority is to our consumers – then
customers, employees, suppliers and
communities. When we fulfil our responsibilities
to them, we believe that our shareholders will
be rewarded.
Of the world’s agricultural land is
seriously degraded
40% rise
In food prices expected 2010-20
1 in 10
Of the adult population is obese while
almost 1 billion people go hungry
Unilever Sustainable Living Plan: Progress Report 2012
Our Changing World
1
CHIEF
EXECUTIVE
OFFICER’S
REVIEW
Volatility and uncertainty
– the new normal
2012 proved to be another challenging
year for the global economy. Commodity
markets remained volatile and costs rose
significantly in excess of expectations.
The threat of the world’s largest economy
going over a ‘fiscal cliff’ and the euro crisis
added uncertainty and undermined fragile
consumer confidence.
Overall we continue to see sluggish growth
in most developed markets contrasted by
relatively healthy consumption and growth
in aspiring markets. These both have
consequences in terms of the world’s
social and environmental equilibrium.
Inequality and rising levels of unemployment
– especially among young people – place
added strains on social cohesion. But the
biggest challenge is the continuing threat to
‘planetary boundaries’, resulting in extreme
weather patterns and growing resource
constraints. These have an increasing
impact on people’s lives.
Put simply, we cannot thrive as a business
in a world where too many people are
still excluded, marginalised or penalised
through global economic activity; where
nearly 1 billion go to bed hungry every night,
2.8 billion are short of water and increasing
numbers of people are excluded from the
opportunity to work.
Our vision for growth
We remain convinced that businesses that
address both the direct concerns of citizens
and the needs of the environment will
prosper over the long term. We need to
build new business models that enable
responsible, equitable growth that is
decoupled from environmental impact.
This thinking lies at the heart of the Unilever
Sustainable Living Plan and our Compass
vision of doubling the size of the business
whilst reducing our environmental footprint
and increasing our positive social impact.
To achieve our vision, we have set clear
goals to halve the environmental footprint
of our products, to help more than 1 billion
people take action to improve their health
and well-being, to source 100% of our
agricultural raw materials sustainably and
to enhance the livelihoods of people across
our value chain.
2
Chief Executive Officer’s Review
As the thinking becomes embedded in
our business, there is increasing evidence
that it is accelerating our growth in ways
that contribute to positive change in
people’s lives.
Strong business performance
Unilever performed well in 2012, despite
difficult economic conditions.
Turnover increased by 10.5%, taking
Unilever through the €50 billion barrier,
a significant milestone to becoming an
€80 billion company. Emerging markets
grew for the second consecutive year by
more than 11% and now account for 55%
of total business. Personal Care and
Home Care showed double-digit growth,
in line with our strategic priorities.
Unilever Sustainable Living Plan
The Unilever Sustainable Living Plan
(USLP) inspires us to grow in line with our
new purpose to make sustainable living
commonplace. The lens of sustainable
living is helping us to drive brands that have
a strong purpose in people’s lives, to reduce
costs and take waste out of the system and
to drive innovation that will make a positive
difference to the environmental and social
challenges facing us all. The Plan pushes
us to think ahead, reducing risk and
making the business more resilient for
the long term.
In 2012 we continued to make good progress
delivering the Plan’s commitments.
Our factories made great strides in cutting
energy, water and waste. For example all
our US operations have moved to purchasing
their energy from certified, renewable
sources and more than half our sites
worldwide have achieved zero nonhazardous waste to landfill.
What makes our commitment unique
is that it is across the total value chain.
We are not only managing our own and
upstream operations, but we are also
determined to help people to live more
sustainably through the impact of our
products in their lives.
We have maintained the momentum
towards our target of sourcing all our
agricultural raw materials sustainably,
reaching 36% by the end of 2012. All our
palm oil is now covered by GreenPalm
certificates. We have made a start in buying
Unilever Sustainable Living Plan: Progress Report 2012
STRATEGY
progress on the plan >
governance >
The Unilever Sustainable Living Plan
Our Plan has three big goals to achieve by 2020:
•Help more than 1 billion people improve
their health and well-being.
•Halve the environmental footprint of
our products.
traceable oil. Investment in a new palm oil
processing factory in Indonesia, working
with partners and other initiatives are all
helping us to make progress towards our
new commitment to 100% certified
sustainable palm oil which is traceable
back to the plantations on which it is grown.
We are also helping to improve the
livelihoods of farmers while guaranteeing
future supplies, and we will increasingly
place a special focus on women, due to the
multiplier effect we know that women have
in developing societies. We are working with
many partners, including with Rainforest
Alliance on tea for Lipton, with Barry
Callebaut on cocoa for Magnum and with
vegetable farmers through Knorr’s
Sustainability Partnership Fund.
Brands that are starting to put their
sustainable living ambition at the heart of
their proposition not surprisingly enjoyed
strong growth. Lifebuoy soap delivered
another year of double-digit growth while
scaling up its handwashing campaigns.
Our Brush Day and Night oral health
campaign, which encourages parents and
children to adopt good brushing habits,
reached 49 million people and has helped
our Signal brand grow by 22% since 2008.
We see an equal acceleration in
sustainability-led innovations, such as
great-tasting low fat margarines with
up to 80% less saturated fat than butter
(and less environmental impact) and more
concentrated detergents.
Challenges remain
We still face challenges in some
important areas.
Through working with Oxfam on a study
of our business in Vietnam over 2011-12 we
have gained important insights into human
and labour rights in our own and our
suppliers’ operations. The study has
implications for our global business.
We are identifying how we can promote
sustainable livelihoods for all our workers
and those in our value chains.
In areas where big breakthroughs are
needed, we must step up joint working with
others. Making more progress on healthy
eating, for example, will require action
across the industry whilst governments
will need to take a bigger lead on action to
combat climate change and decarbonise
energy supplies.
Overall it is clear that we will need creative
as well as science-based solutions if we
are to achieve our full ambition by the end
of the decade.
Working with partners
Partnerships are key to unlocking these
solutions. So I particularly want to thank the
partners who are assisting us to deliver this
new business model: NGOs who are helping
us to address real issues, suppliers who are
bringing us solutions for sustainable living,
and our customers with whom we share an
ambition to reach consumers at scale.
With scale comes responsibility – so we
must continue to play a leadership role in
seeking solutions for global transformational
issues like climate change, food security and
poverty alleviation.
•Source 100% of our agricultural raw
materials sustainably and enhance
the livelihoods of people across our
value chain.
This is why we are working with organisations
and initiatives such as the Consumer Goods
Forum, the World Business Council for
Sustainable Development, the World
Economic Forum, the Tropical Forest Alliance
2020, Refrigerants, Naturally!, the Global
Green Growth Forum and the UN’s Zero
Hunger Challenge and Scaling Up Nutrition
initiatives. This is also why I agreed to join
the UN Secretary General’s High Level Panel
to review the Post-2015 Development Agenda.
Looking ahead
Despite the scale of the task, I believe
we are on track to become a sustainable
growth company. But one thing is sure
– this will not be possible without the
dedication and hard work of our 173,000
colleagues and our many partners around
the world. They are demonstrating the
power of purpose, making Unilever again
‘fit to win’.
I hope this report gives you a good sense
of the progress we are making, and our
ambition for the future. Please contact me
if you have comments and suggestions that
will help us at:
[email protected]
Warm regards
Paul Polman
Chief Executive Officer
Scaling up to reach 1 billion people
cost-effectively with hygiene programmes
that make handwashing a habit remains
a challenge. Equally, we are finding that
helping people to use less hot water and
energy when washing, showering and doing
the laundry is challenging. We continue to
experiment with ways to tackle this, such
as detergents which perform well in shorter
wash cycles, and dry shampoo which might
encourage people to wash their hair with hot
water less often.
Unilever Sustainable Living Plan: Progress Report 2012
Chief Executive Officer’s Review
3
OUR COMPASS
STRATEGY
POSITIVE
SOCIAL IMPACT
Our vision Double the
DOUBLE THE
BUSINESS
size of the business, whilst
reducing our environmental
footprint and increasing
our positive social impact
We will lead for responsible growth, inspiring people to take small
everyday actions that will add up to a big difference.
REDUCE
ENVIRONMENTAL
FOOTPRINT
We will grow by winning shares and building markets everywhere.
OUR COMPASS
The volatility and uncertainty facing the
world remain the ‘new normal’ and are
set to last for the medium term. These
ongoing pressures – economic, social and
environmental – frame our approach to our
business strategy and our business model.
We call our business strategy ‘the Compass’,
since it sets out a constant path for Unilever
for the long term. The Compass lays out our
ambitious vision and purpose, and defines
four ‘Winning with’ pillars within the
business that will help us achieve both:
4
Our Compass Strategy
brands and innovation; marketplace;
continuous improvement; and people.
Our performance against these pillars
is explained in our Annual Report and
Accounts 2012. First developed in 2009,
the Compass was sharpened in 2012 but
its core elements remained the same.
The Compass gives life to our determination
to build a sustainable business for the long
term and to find new ways to operate that
do not just take from society and the
environment. This is captured in the
Unilever Sustainable Living Plan (USLP).
In 2012 we added our new purpose –
“To make sustainable living commonplace”.
This builds on the original purpose of
our 19th century founder, William Lever,
“to make cleanliness commonplace”.
Unilever Sustainable Living Plan: Progress Report 2012
progress on the plan >
STRATEGY
OUR
BUSINESS
MODEL
Our brands
Strong brands and innovation
are central to our ambition to
double in size. We are investing
in brand equity, finding and
strengthening the connections
between consumers and the
products they buy. Where equity
is strong, we are leveraging it –
creating efficiencies by focusing
on fewer, bigger projects that
enhance margins. And we are
seeking superior products
which consumers will prefer,
driving profitable growth.
Our business model is designed
to deliver sustainable growth.
For us, sustainability is integral
to how we do business. In a
world where temperatures
are rising, water is scarce,
energy is expensive, sanitation
is poor in many areas and food
supplies are uncertain and
expensive, we have both
a duty and an opportunity to
address these issues in the
way we do business.
Our operations
On any given day 2 billion
consumers use our products
and we want to reach many
more, by developing innovative
products that address different
consumer needs at different
price points. To do this we use
our global scale to help deliver
sustainable, profitable growth
by seeking to add value at
every step in the value chain
by enhancing product quality
and customer service, and
rolling out innovations faster
across all markets.
PROFITABLE
VOLUME
GROWTH
OUR
governance >
The inputs to the model, like
those of all major packaged
goods manufacturers, are
threefold: brands; people; and
operations. These map directly
on to our Compass ‘Winning
with’ pillars – both continuous
improvement and the market
place pillars support the
operations strand of the model.
The differentiator in our
business model is our USLP and
the goal of sustainable living.
Our people
Sustainable, profitable growth
can only be achieved with the
right people working in an
organisation that is fit to win,
with a culture in which
performance is aligned with
values. We are increasingly
an agile and diverse business
with people motivated by doing
good while doing well. We
are building capability and
leadership among our people
and attracting some of the best
talent in the market place.
The outputs of the model are
threefold: sustained growth;
lower environmental impact;
and positive social impact.
These align directly with
our vision statement.
The diagram below represents
our virtuous circle of growth.
It summarises, simply, how we
derive profit from the application
of our business model.
Sustainable living
For us, sustainable, equitable
growth is the only acceptable
business model. Business
needs to be a regenerative
force in the system that gives
it life. For example, by reducing
waste, we create efficiencies
and reduce costs, helping
to improve margins while
reducing risk. Meanwhile,
looking at more sustainable
ways of developing products,
sourcing and manufacturing
opens up opportunities for
innovation while improving
the livelihoods of our suppliers.
COST
LEVERAGE +
EFFICIENCY
BRAN DS
PE
ER
OUR
ATI
ON
S
SUSTAINABLE
LIVING
OP
OP
E
L
OU
R
INNOVATION +
MARKETING
INVESTMENT
A virtuous circle of growth
Profitable volume growth
Profitable volume growth is the basis of the
virtuous circle of growth. Stronger brands
and innovation are the key drivers behind it.
Consistently strong volume growth builds
brand equity as we reach more consumers,
more often.
Cost leverage + efficiency
Profitable volume growth allows us
to optimise the utilisation of our
infrastructure and spread fixed costs
over a larger number of units produced,
reducing the average cost per unit.
It improves our profitability and allows
us to invest in the business.
Unilever Sustainable Living Plan: Progress Report 2012
Innovation + marketing
investment
Lower costs and improved efficiency enable
us to strengthen our business further.
New and improved products are the result
of investment in R&D and, together with
effective marketing, strengthen our brand
equity. This results in profitable volume
growth, self-perpetuating the virtuous circle
of growth.
Our Business Model
5
Embedding
sustainability
In order to realise sustainable growth,
we are integrating sustainability into
our strategy, brands and innovation.
We are working with our customers
and suppliers, engaging employees
and forging new partnerships.
TH
ROW
DG
-LE
TY
LI
I
B
PROFITABLE
VOLUME
GROWTH
COST
LEVERAGE +
EFFICIENCY
SUSTAINABLE
LIVING
SU
ST
AI
TE, LESS RISK
WAS
SS
LE
SU
ST
AI
NA
Our Business Strategy
With 7 billion people on our planet, the earth’s
resources can be strained. This means
sustainable, equitable growth is the only
acceptable model of growth for our business.
We believe growth and sustainability are
not in conflict. In fact, in our experience,
sustainability drives growth.
NA
BL
& C E INNO
VATI
OLL
ABOR ON
ATION
INNOVATION +
MARKETING
INVESTMENT
By focusing on sustainable living needs,
we can build brands with a significant
purpose. By reducing waste, we create
efficiencies and reduce costs, which
helps to improve our margins. By taking
a long-term view, we can reduce risk,
for example securing raw material supply
through sustainable sourcing. And we have
found that once we start looking at product
development, sourcing and manufacturing
through a sustainability lens, it opens up
great opportunities for innovation.
Our product category and functional
teams are playing a central role in driving
sustainable growth. They review progress
against their targets quarterly. And in
2012 we asked our businesses in our
largest markets to identify a small number
of priority areas where they can harness
the Plan to drive growth, such as
handwashing with Lifebuoy soap in India
and the Dove Self-Esteem Project in
the US.
We are linking progress to reward with
sustainable business goals in the remuneration
of a growing number of managers. This
includes the CEO and several members of
the Unilever Leadership Executive. We have
sustainability champions covering every
key function, category and country.
Brands and innovation
We are accelerating the integration of
sustainability into our brands. Brands are
developing their own USLP ambition – for
example Knorr has chosen sustainable
sourcing. Our Brand Imprint model enables
us to take a 360-degree view of the social,
environmental and economic impacts
of brands and – among other outputs
– triggered Lipton’s decision to source its
tea sustainably. We are now applying the
methodology to help brands make a
investing in sustainable business
Through Unilever Ventures, we are investing in early and mid-stage
companies with new technologies and compelling business models
that are of strategic relevance to Unilever. Sustainable business is
a key factor in this mix.
Our portfolio includes a number of innovative start-ups from the green
tech and low-carbon sectors, such as Recyclebank (see page 37).
In 2013 we are launching a new Sustainable Business Venture Fund
with €50 million allocated to investment in new businesses which
specifically support our USLP goals.
6
Embedding Sustainability
sustainable business contribution
in line with their positioning. Similarly,
our Five Levers for Change methodology
is helping our brands prompt consumers
to adopt new behaviours (see page 15).
Innovation is critical to achieving our
sustainable living goals. We are committing
a significant proportion of our R&D budget
to finding sustainability-led technologies.
We are also supporting the commercialisation
of innovative technologies through our
investment arm, Unilever Ventures.
In 2012 our Open Innovation team launched
an online system which offers outside
experts the chance to work with Unilever
on research projects in a number of areas
that will promote sustainable living, such
as cold-water wash laundry products.
We have received 150 submissions ranging
from packaging design to energy-efficient
processes.
We have updated the tools we use to evaluate
the environmental impacts of new products
and packaging, known as Innovation Process
Management. We use a simple traffic light
system to compare the potential impacts of
an innovation with the products we currently
market as well as the impacts on our
category portfolio.
The Marketplace
Many retailers have sustainability goals.
For the last three years we have worked
on A Better Future Starts at Home, a joint
shopper programme with Tesco. It combines
advice on sustainable living with promotions
of sustainable products. Nine countries from
the UK to China have run the programme.
INNOVATION in MANUFACTURING
Many employees have sustainable business ideas and our
Manufacturing team has set up a Small Actions, Big Difference
budget to make them happen.
Factory employees can apply for investment for their ideas which are
evaluated on the basis of environmental benefit and financial return.
In 2012 over 600 projects were identified and the best 100 will be
implemented in 2013. Their combined benefits will deliver savings
of around 1% of our global energy and water use and achieve an
average pay back of under two years.
Unilever Sustainable Living Plan: Progress Report 2012
STRATEGY
In 2012 we launched a joint programme with
Walmart, The Living Project, that will help
200 million shoppers every week make
sustainable choices. So far it has been
implemented in Brazil, China and the US.
Working with our suppliers
In 2011 Unilever launched a programme
called Partner to Win, to work more
closely with its key suppliers, including on
sustainable practices. In particular, we are
developing partnerships with our agricultural
raw material suppliers to achieve our
sustainable sourcing goal. For example,
we established the Knorr Sustainability
Partnership Fund to support vegetable
suppliers on complex sustainable agriculture
projects that they are unable to tackle alone.
People
Our vision of creating a sustainable business
is motivating for employees, but it is not
always clear to them how to apply it to their
role. We integrate sustainability into existing
training and have created bespoke training,
for example, new brand managers engage
in a week-long sustainable marketing
challenge during their foundation course.
Collaboration with Partnerships
Global issues such as deforestation, water
scarcity and under-nutrition are too complex
for any single organisation to tackle alone.
We are engaging with governments to
create an environment in which the big
sustainability challenges can be tackled.
At the UN Conference on Sustainable
Development in Rio in 2012 we urged
collaboration to agree Sustainable
progress on the plan >
governance >
THREE KEY FEATURES OF OUR PLAN
•Spans our entire portfolio of brands and all countries in which we sell our products.
•Has a social and economic dimension – our products make a difference to health and
well-being, and our extended supply chain supports the livelihoods of many people.
•When it comes to the environment, we work across the whole value chain – from the
sourcing of raw materials to the way consumers use our products.
We work across the value chain
25%
4%
+
Raw materials
2%
+
Manufacture
68%
+
Transport
1%
+
Consumer use
Disposal
UNILEVER’S GREENHOUSE GAS FOOTPRINT (SEE PAGE 25)
Development Goals to succeed the
Millennium Development Goals. Our
CEO was subsequently invited to join the
UN Secretary General’s High Level Panel to
review the post-2015 Development Agenda.
We recognise the scale of change that
is needed and we are stepping up our
engagement in multi-sector and crosssector stakeholder groups, such as the
Tropical Forest Alliance 2020, Refrigerants,
Naturally! and the Roundtable on Sustainable
Palm Oil. We take part in initiatives such as
the World Economic Forum’s New Vision for
Agriculture and the UN’s Scaling up Nutrition
(SUN) and Zero Hunger Challenge which
tackle the challenge of high levels of
under-nutrition and hunger in the world.
UNILEVER FOUNDATION
Established in 2012, the Unilever Foundation’s mission is to improve
the quality of life for communities through the provision of hygiene,
sanitation, access to clean drinking water and basic nutrition, and
by enhancing self-esteem.
Working with five partners – Oxfam, PSI (Population Services
International), Save the Children, UNICEF and the World Food
Programme (WFP) – the Foundation is developing programmes
designed to grow the business and support the USLP’s goal to help
more than 1 billion people take action to improve their health and
well-being.
Unilever Sustainable Living Plan: Progress Report 2012
Tropical Forest Alliance 2020
Unilever has led the process of building the Tropical Forest Alliance
2020, a public-private partnership between the US government and
the Consumer Goods Forum (CGF). The CGF is a large industry body
made up of almost all the major retail and consumer goods companies
in the world, with revenues amounting to more than $3 trillion.
The Tropical Forest Alliance 2020 was announced at the Rio+20
summit. It aims to reduce and eventually eliminate the deforestation
associated with the sourcing of commodity crops such as soy, palm
oil, beef, pulp and paper. The Dutch and Norwegian governments have
signed up and companies, NGOs and other governments will be
invited to join. The Indonesian government is co-hosting a workshop
on the palm and paper value chains in 2013.
Embedding Sustainability
7
OPERATIONAL
HIGHLIGHTS
In 2012, we continued to make good progress
in the transformation of Unilever to a sustainable
growth company. We exceeded €50 billion turnover,
with all regions and categories contributing to
growth. Despite further cost increases and volatile
commodity markets, our gross margin rose by 0.1
percentage points and our core operating margin
by 0.3 percentage points, reflecting the disciplined
implementation of our strategy.
• Turnover is up 10.5% at €51.3 billion with net
acquisitions contributing 1.1% and currency
changes 2.2%
• Underlying sales growth of 6.9% is well balanced
between volume +3.4% and price +3.3%
• Emerging markets grew underlying sales
by 11.4%, now representing 55% of turnover
KEY FINANCIAL INDICATORS*
UNDERLYING
SALES GROWTH
UNDERLYING VOLUME
GROWTH
CORE OPERATING
MARGIN
FREE CASH FLOW
6.9%
3.4%
13.8%
€4.3 billion
2011: 6.5%
2011: 1.6%
2011: 13.5%
2011: €3.1 billion
KEY NON-FINANCIAL INDICATORS†
HEALTH AND HYGIENE:
People reached with Lifebuoy
handwashing programmes
NUTRITION:
Portfolio by volume meeting salt
levels equivalent to 5 g per day
GREENHOUSE GASES:
CO2 from energy per tonne
of production
WATER:
Water per tonne of production
71 million
80%
99.97kg
2.23m
2011: 34.5 million
2011: See ◊ below
2011: 118.31kg
2011: 2.40m3
WASTE:
Total waste per tonne
of production
SUSTAINABLE SOURCING:
Palm oil purchases from
sustainable sources
BETTER LIVELIHOODS:
Number of Shakti entrepreneurs
(cumulative since 2010)
PEOPLE:
Total recordable accident
frequency rate
3.85kg
100%
48,000
1.16
2011: 4.96kg
2011: 64%
2011: 45,000
2011: 1.27 per 1m
hours worked
◊
3
per 1m
hours worked
* Further details of our key financial indicators can be found in our Annual Report and Accounts 2012.
†These key non-financial indicators form part of the Unilever Sustainable Living Plan.
◊Measured January-September 2012. In 2012 we moved to full volume-based (tonnes sold) reporting for this target. This number is not comparable to previously
reported numbers measured by product (stock keeping unit), see page 20.
†† NAMET refers to North Africa, Middle East and Turkey; AMET refers to Africa, Middle East and Turkey; and RUB refers to Russia, Ukraine and Belarus.
8
Operational Highlights
Unilever Sustainable Living Plan: Progress Report 2012
progress on the plan >
STRATEGY
governance >
OUR CATEGORIES
• Turnover €14.4 billion
• Underlying sales
growth 1.8%
• Underlying volume
growth (0.9)%
• Market shares were down
slightly, reflecting a mixed
performance with volume
gains in dressings, offset
by declines in savoury and
volume share stabilisation
in spreads
• Turnover €18.1 billion
• Underlying sales
growth 10.0%
• Underlying volume
growth 6.5%
• Market shares increased
across geographies, with
strong gains in Latin
America, NAMET & RUB††
and North America; driven
by hair care, deodorants
and skin cleansing
PERSONAL CARE
FOODS
• Turnover €9.7 billion
• Underlying sales
growth 6.3%
• Underlying volume
growth 2.4%
• Market shares were
slightly down overall,
reflecting price aggressive
competition in ice cream
in developed markets
• Turnover €9.1 billion
• Underlying sales
growth 10.3%
• Underlying volume
growth 6.2%
• Market share gains
were driven by powerful
performance in nearly all
our markets; in laundry
in particular in Europe,
China and South Africa
REFRESHMENT
HOME CARE
REFRESHMENT
HOME CARE
OUR geographical areas
Asia/AMET/RUB††
• Turnover €20.4 billion
• Underlying sales growth 10.6%
• Underlying volume growth 5.7%
The Americas
• Turnover €17.1 billion
• Underlying sales growth 7.9%
• Underlying volume growth 3.1%
Europe
• Turnover €13.9 billion
• Underlying sales growth 0.8%
• Underlying volume growth 0.9%
2 billion €51 billion
On any given day
Turnover of
consumers worldwide use
a Unilever product
for 2012
173,000 190
Around
Products sold in over
employees at the end of 2012
countries worldwide
FOR MORE: WWW.UNILEVER.COM/
INVESTORRELATIONS
Unilever Sustainable Living Plan: Progress Report 2012
Operational Highlights
9
UNILEVER
SUSTAINABLE
LIVING PLAN
in 2012
IMPROVING HEALTH
AND WELL-BEING
By 2020 we will help more than a billion people
take action to improve their health and well-being.
We estimate that we helped 224 million people
take action to improve their health and well-being.
The Unilever Sustainable Living Plan
(USLP) sets out to decouple our growth
from our environmental impact, while
at the same time increasing our positive
social impact.
1 HEALTH AND
HYGIENE
2 NUTRITION
3 GREENHOUSE
GASES
It has three big goals to achieve by 2020
– to improve health and well-being,
reduce environmental impact and
source 100% of our agricultural raw
materials sustainably and enhance
the livelihoods of people across our
value chain.
Supporting these goals are seven
commitments underpinned by targets
spanning our social, environmental
and economic performance across the
value chain – from the sourcing of raw
materials all the way through to the use
of our products in the home.†
In the second year of our Plan, we made
steady progress towards our goals.
Our USLP is ambitious and we have
much more to do. We continue to strive
to deliver our stretching goals.
By 2020 we will help more than
a billion people to improve their
hygiene habits and we will bring
safe drinking water to 500 million
people. This will help reduce the
incidence of life-threatening
diseases like diarrhoea.
224 million people
reached by end 2012
Key
Reduce diarrhoeal and
respiratory disease through
handwashing
Achieved
On-plan
Off-plan
% of target achieved
Note Our most material targets are shaded
We will continually work to
improve the taste and nutritional
quality of all our products. By 2020
we will double the proportion
of our portfolio that meets the
highest nutritional standards,
based on globally recognised
dietary guidelines. This will help
hundreds of millions of people to
achieve a healthier diet.
18% of our portfolio by
volume met the criteria
for highest nutritional
standards in 2012
Provide safe drinking water
Improve oral health
Improve self-esteem
Saturated fat:
92 Reduce saturated fat
92 Increase essential fatty acids
Reduce workplace injuries
and accidents
For more see page 12 >
†In our 2011 Progress Report we presented our people
and workplace targets as a standalone set of targets.
In 2012 we incorporated these targets into the main body
of the Plan.
*Throughout this document our environmental targets are
Reduce salt levels
Halve the greenhouse gas impact
of our products across the
lifecycle by 2020.*
Our greenhouse gas
impact per consumer
use has reduced by
around 6% since 2010*
Reduce GHG from skin
cleansing and hair washing
Reduce GHG from washing
clothes:
Concentration
Reformulation
Consumer behaviour
Remove trans fat
Reduce GHG from
manufacturing:
CO2 from energy
Renewable energy
New factories
Reduce sugar
Reduce GHG from transport
Reduce calories
Reduce GHG from refrigeration
Improve heart health
rovide healthy eating
P
information
Reduce energy consumption
in our offices
Improve employee health
and nutrition
Reduce employee travel
For more see page 24 >
For more see page 18 >
expressed on a ‘per consumer use’ basis. This means a
single use, portion or serving of a product (see page 53).
We have taken a lifecycle approach with a baseline of 2008.
+In seven water-scarce countries representing around half
the world’s population (see page 53).
10
Unilever Sustainable Living Plan in 2012
Unilever Sustainable Living Plan: Progress Report 2012
progress on the plan >
STRATEGY
governance >
REDUCING
ENVIRONMENTAL IMPACT
ENHANCING
LIVELIHOODS
By 2020 our goal is to halve the environmental footprint of the making and
use of our products as we grow our business.*
By 2020 we will enhance the livelihoods
of hundreds of thousands of people as
we grow our business.
Our greenhouse gas and waste impacts per consumer use have reduced
and our water impact per consumer use has remained broadly unchanged.*
4 WATER
Halve the water associated with
the consumer use of our products
by 2020.* +
5 WASTE
We have trained around 450,000
smallholder farmers.
6 SUSTAINABLE
SOURCING
Halve the waste associated with
the disposal of our products
by 2020.*
By 2020 we will source 100% of
our agricultural raw materials
sustainably.
7 BETTER
LIVELIHOODS
By 2020 we will engage with at
least 500,000 smallholder
farmers and 75,000 small-scale
distributors in our supply network.
Our water impact per
consumer use has
remained broadly
unchanged since 2010*
Our waste impact per
consumer use has
reduced by around 7%
since 2010*
36% of agricultural
Reduce water use in the
laundry process:
Easy rinse products
Products that use less water
Palm oil:
Sustainable
Traceable
450,000 smallholder
farmers trained;
smallholders’ metric
in development;
48,000 small-scale
Shakti distributors
by end 2012
Paper and board
Smallholder farmers
Soy beans and soy oil
Small-scale distributors
Tea
Fruit
Vegetables
Cocoa
Sugar
Sunflower oil
Rapeseed oil
Dairy
Fairtrade Ben & Jerry’s
Cage-free eggs
Reduce water use in skin
cleansing and hair washing
Reduce water use
in agriculture
Reduce water use in
manufacturing process:
Reduce abstraction
New factories
For more see page 30 >
Reduce packaging
Recycle packaging:
Increase recycling and
recovery rates
Increase recycled content
Reuse packaging
Tackle sachet waste
Reduce waste from
manufacturing:
Reduce total waste
Zero non-hazardous waste
to landfill
New factories
99
Eliminate PVC
Reduce office waste:
Recycle, reuse, recover
Reduce paper consumption
Eliminate paper in processes
For more see page 34 >
raw materials
sustainably sourced
by end 2012
For more see page 46 >
Increase sustainable sourcing
of office materials
For more see page 40 >
Unilever Sustainable Living Plan: Progress Report 2012
Unilever Sustainable Living Plan in 2012
11
1 HEALTH AND
HYGIENE
IMPROVING HYGIENE
AND PROMOTING
WELL-BEING
12
Health and Hygiene
Unilever Sustainable Living Plan: Progress Report 2012
STRATEGY >
governance >
progress on the plan
The biggest challenge
we face is to scale
up programmes
cost-effectively.
HEALTH AND HYGIENE
By 2020, we will help more than a billion people
to improve their hygiene habits and we will bring
safe drinking water to 500 million people. This
will help reduce the incidence of life-threatening
diseases like diarrhoea.
224 million people reached by end 2012.
119 million people with Lifebuoy; 45 million with safe drinking water
from Pureit; 49 million with our toothpaste brands; and 11 million through
Dove Self-Esteem programmes.
OUR perspective
Poor hygiene, lack of safe drinking water
and poor sanitation are the cause of millions
of preventable deaths.
These issues are closely interconnected.
Evidence shows that individuals will be
healthier and communities more productive
if they have access to clean water and better
sanitation and if they adopt improved
hygiene practices.
Unilever brands can play an important role
here. We make effective, affordable products
that improve health, hygiene and well-being.
As one of the world’s leading consumer
goods companies, we can use our expertise
in marketing and delivering campaigns to
reach large, diverse populations and achieve
a lasting impact on everyday behaviours.
One brand which demonstrates this is
Lifebuoy soap. It is also one of Unilever’s
fastest-growing brands – it has achieved
double digit-growth over 2010-12. It is a good
example of how brands that help to address
social challenges can build brand equity and
grow their business.
piloting a sanitation programme between
our Domestos toilet cleaner brand and
partners UNICEF and the World Toilet
Organization. This will help us to take
a more joined-up approach to improving
health through a concerted effort around
clean water, sanitation and hygiene in future.
We have made good progress towards
our goal. Lifebuoy and Dove have extended
existing partnerships and developed new ones.
Our oral care brands are set to meet their
target much earlier than planned. We have
also gained a better understanding of the
impact of our handwashing programmes.
The biggest challenge we face across
all our programmes is to scale up costeffectively. Forming the right partnerships
with governments, NGOs and other
experts is helping us. But to reach our
ambitious targets, we need to move faster
to widespread implementation.
We have also started to explore how we
can develop a more systematic approach
to water, sanitation and hygiene issues by
TARGET SUMMARY
Achieved: 0
On-plan: 5
Off-plan: 0
Unilever Sustainable Living Plan: Progress Report 2012
% of target achieved: 0
Health and Hygiene
13
1 HEALTH AND HYGIENE
Lifebuoy TARGETS countries with
high child mortality
During 2012 Lifebuoy launched handwashing programmes in seven new countries:
Egypt, Ghana, Nigeria, South Sudan, Uganda, Zambia and Zimbabwe.
Our behaviour change programmes are now running in 16 countries, reaching eight
of the top ten countries most affected by child mortality.
Reaching more for less
REDUCE DIARRHOEAL
ANd RESPIRATORY
DISEASE THROUGH
HANDWASHING
A lower-cost model
for our schools’
programmes
Lifebuoy has ambitious plans to scale up
the reach of its school hygiene promotion
programmes in Africa. However, in some
countries the brand has been launched
or re-introduced only recently and is still
a relatively small brand. A multi-brand
programme is more cost-efficient and is
an opportunity to connect people to more
of our brands that have a social impact.
Our Central African business and Lifebuoy
have piloted a programme with our Close Up
toothpaste and Blue Band margarine brands
in Nigeria and an external partner, D.lite,
which produces solar lanterns to enable
children to do homework after dark.
The 21-day programme uses multiple
classroom contacts to help children practise
new behaviours: handwashing with soap,
brushing teeth day and night, and eating
well. We have been able to reduce our cost
per contact significantly by sharing costs
across brands. The programme has huge
potential for roll-out in other countries in
Africa. Schools, governments and NGOs
support this approach as, by promoting
a number of healthy behaviours together,
it has the potential to deliver significant
health impact at lower cost.
OUR TARGETS
•By 2015, our Lifebuoy brand aims
to change the hygiene behaviour of
1 billion consumers across Asia, Africa
and Latin America by promoting the
benefits of handwashing with soap at
key times.
is run at scale. We found that handwashing
with soap at key occasions increased
significantly after the schools’ hygiene
promotion programme. Soap use
increased from 53% to 75%. This increase
was sustained at the same level more than
six months after the programme ended.
†
To be independently assured by PwC in 2013, see page 52.
Reaching new
communities
OUR PERFORMANCE
119 million people reached since
2010, of whom 71 million were
reached in 2012.†
Some communities can be difficult and
costly for Lifebuoy to reach by itself. We are
collaborating with the Millennium Villages
Project to promote handwashing with soap
in rural communities across Africa.
OUR PERSPECTIVE
The major challenge we face is scaling
up our handwashing programmes costeffectively. Since 2010, we have made
strong progress, developing models
which more than halve the cost. We have
expanded the programme to 16 countries
in 2012 and have reached five times as
many people as we did in 2010. Our most
significant expansion is in Africa where
programmes are now running in nine
countries, reaching more than 11 million
people in 2012, compared to 400,000 over
2010-11. This has contributed to Lifebuoy’s
continued double-digit business growth
in 2012.
The project will enable us to adapt our
current handwashing programme and
advocacy to this setting, reaching 475,000
people across ten countries by 2015. Our
aim is to work together to develop scalable,
cost-effective water, sanitation and hygiene
interventions which can then be rolled out
at national level and to new countries,
improving health through better hygiene.
Partnerships with NGOs and government
are critical – by tapping into existing
on-ground networks and expertise we
can reduce costs and reach more people.
In Africa, Unilever Foundation partner PSI
(Population Services International) and
the Millennium Villages Project are
helping us to adapt our programmes for
different contexts. In India we are working
with the government and Foundation
partner UNICEF to promote handwashing
in Madhya Pradesh and in Africa and
South Asia, with Water & Sanitation for
the Urban Poor. These partnerships are
also building local capabilities to sustain
the programmes for the long term.
The first 28 days of life is the period when
children are most vulnerable to disease
and infant mortality is highest. Every year
an estimated 3.6 million newborn babies
die in the first month of their lives. Simple,
low-cost health interventions such as
handwashing with soap can reduce this
figure by up to 44%. In Indonesia we have
developed a new partnership with USAID
and the Maternal and Child Health
Integrated Program to reach new mothers
and birth attendants with hygiene education.
We continue to evaluate impact. In Indonesia
we conducted a quantitative study with
TNS, a market research company,
to assess impact when the programme
14
Health and Hygiene
Unilever Sustainable Living Plan: Progress Report 2012
STRATEGY >
governance >
progress on the plan
SAFE DRINKING WATER
Pureit offers a range of in-home water purifiers that
provide water ‘as safe as boiled’ – without the need for
electricity or a pressurised water supply – by removing
harmful viruses, bacteria and parasites.
Pureit offers environmental benefits too: our detailed
lifecycle analysis shows that its total carbon footprint is
at least 80% lower than boiled or bottled water.
PROVIDE SAFE
DRINKING WATER
OUR TARGETS
•We aim to make safe drinking water
available and affordable to 500 million
people through our Pureit in-home
water purifier by 2020.
OUR PERFORMANCE
45 million people have gained access
to safe drinking water from Pureit
since its launch in 2005, of whom
10 million were reached in 2012.†
OUR Five Levers for
Change Model
OUR PERSPECTIVE
The lack of safe drinking water is a major
public health issue, particularly in
developing countries where around 80% of
diseases are water borne. An independent
study has shown that Pureit can reduce
the incidence of diarrhoeal disease by up
to 50%.*
Encouraging people to adopt new behaviours
is essential if we are to achieve our goals.
Underpinning our approach is our model of
behaviour change, Unilever’s Five Levers for
Change – a set of principles which, if applied
consistently, increases the likelihood of
creating a lasting impact.
During 2012 Pureit focused on distribution
expansion in existing markets – India,
Bangladesh, Indonesia, Mexico and Brazil
– and also launched in new markets such
as Sri Lanka and Nigeria.
We first used this model to develop our
behaviour change programmes with
Lifebuoy soap and our oral care brands.
We have learned a great deal through our
health and hygiene campaigns and we are
now applying the methodology to improve
our performance in other areas, for example
we are using it to understand how we
can motivate consumers to reduce their
salt intake.
Expansion in India was the biggest
contributor to performance in 2012, where
consumers have been attracted to our
wider product range.
The most affordable model costs €20
(1,400 rupees) in India. We are working with
a range of microfinance and NGO partners
to improve the affordability of the purifier
for those for whom the price remains
a barrier to purchase.
Domestos tackles
sanitation crisis
More than 2,000 children die every day
from diarrhoea, which is linked, among
other things, to a lack of clean toilets for
over 2 billion people worldwide.
In November 2012, Domestos and our partner,
the World Toilet Organization, opened the
world’s first ‘Domestos toilet academies’
in Vietnam, the first stage in a global
programme to train local entrepreneurs
to set up hygienic toilet businesses.
The academies leverage the ’SaniShop’
business model developed and proven by
the World Toilet Organization in Cambodia.
Training local entrepreneurs to supply
latrines, toilet cleaner and sanitation
education is an innovative market-based
model which creates demand for improved
sanitation within local communities and
provides jobs.
Our ambition to reach 500 million people
remains demanding. To achieve our target
we plan to expand into more new markets
in Africa, while continuing to grow in
existing markets.
To be independently assured by PwC in 2013, see page 52.
* Randomised trial by the National Institute of Epidemiology,
based on 430 children in Chennai, India, 2005-06.
†
Unilever Sustainable Living Plan: Progress Report 2012
Health and Hygiene
15
1 HEALTH AND HYGIENE
Brush Day and Night
promotes growth
Our leading family health toothpaste brands,
Signal and Pepsodent, are growing strongly
thanks to our Brush Day and Night oral health
campaigns. Over 2008-12, Signal grew by 22%
worldwide. In Indonesia, one of our biggest
markets, sales of Pepsodent rose by nearly
16% in 2012 compared to the previous year.
IMPROVE ORAL HEALTH
IMPROVE SELF-ESTEEM
OUR TARGETS
•We will use our toothpaste and
toothbrush brands and oral health
improvement programmes to encourage
children and their parents to brush
day and night. We aim to change the
behaviour of 50 million people by 2020.
OUR PERFORMANCE
49 million people reached since 2010,
of whom 4.7 million were reached in 2012.
OUR PERSPECTIVE
Our Brush Day and Night campaigns have
proved very effective and we are set to
achieve our target early. Many additional
countries ran the campaign after observing
the strong link between the campaign’s
social impact and business growth, helping
us to reach more people than anticipated.
The campaigns, which focus on brushing
twice a day with fluoride toothpaste,
were extended to new countries such as
Côte d’Ivoire in 2012. Countries with existing
programmes such as Indonesia and France
saw an improvement in brushing frequency
and an increase in market share and sales
growth following the campaign. In France
the oral care market has grown by nearly
5% over 2009-12 and sales of our Signal
brand increased by nearly 7% over 2009-12,
and by 4% in 2012 alone.
We continue to work in a global partnership
with the FDI World Dental Federation.
In 2012, 28 local oral health promotion
projects with national dental associations
focused on communicating the importance
of twice-daily brushing with fluoride
toothpaste through dental practices,
schools, hospitals and communities across
25 countries. We are evaluating the impact
on over 28,000 people involved in these
programmes around the world.
OUR TARGETS
With our Dove brand we are helping millions
of young people to improve their self-esteem
through educational programmes.
•By 2015 we aim to have helped 15 million
young people.
Building brands
OUR PERFORMANCE
Over 11 million young people have
received our help since 2005. Over
2 million participated in the programme
in 16 countries in 2012.
Poor oral health is a widespread problem
in Indonesia. This leads to tooth decay and,
in some cases, more serious illnesses.
In 2009 Unilever collaborated with PDGI
(the Indonesian Dental Association) to
initiate the Brush Day and Night campaign.
OUR PERSPECTIVE
Dove is committed to helping women
look and feel their best. It has made good
progress in helping to raise the self-esteem
of millions of young people worldwide and
is on track to meet its target.
The campaign’s consistent messages across
multiple channels are helping people to
change their habits. In 2012, Indonesians
used 7% more toothpaste than in 2011,
indicating a gradual increase in toothbrushing.
Brand equity has also strengthened.
By offering parents effective products
and by helping them to pass on the habit of
brushing day and night, we have increased
the proportion of people who rate Pepsodent
as ‘the most effective toothpaste’.
In 2012 Dove redesigned its self-esteem
programme to capitalise better on media
and educational innovation and reach more
girls with a greater impact while reducing
the costs for each intervention.
The redesigned programme – now called
the Dove Self-Esteem Project – is launching
in early 2013. We have worked with experts to
make the programme content more rigorous
and engaging. Developing global partnerships
as well as creating local communities of
advocates among mothers and teachers will
help Dove reach more people.
It is difficult to measure changes in attitude.
We are partnering with academic thought
leaders in the US and the UK to conduct
studies to track the longer-term impact
of our programme.
A new campaign in 2013 is designed to
address parents as the primary target to
encourage behaviour change.
16
Health and Hygiene
Unilever Sustainable Living Plan: Progress Report 2012
STRATEGY >
progress on the plan
governance >
Dove: our leading
Personal Care brand
Dove is our largest Personal Care brand, available in
over 70 countries and with an annual turnover of over
€3 billion. It continues to grow strongly, experiencing
its third consecutive year of double-digit growth in 2012.
Reduce workplace
injuries and accidents
OUR TARGETS
•We aim for zero workplace injuries.
By 2020 we will reduce the Total
Recordable Frequency Rate (TRFR)
for accidents in our factories and offices
by 50% versus 2008.
Dove boosts
self-esteem and
business success
Part of the success of our Dove Self-Esteem
Project has been an increased willingness
among consumers to spread the brand’s
affirmative message and to purchase
Dove’s products.
Research by Millward Brown, a research
company, shows that among women in the
US who are aware of the Dove Self-Esteem
Project, 62% would recommend the Dove
brand to others – 16% more than among
those who are not aware of the project.
Among women in Canada who are aware
of the project, 82% would be more likely to
purchase Dove. These results motivate us
to continue to invest in the Project.
OUR PERFORMANCE
45% reduction in TRFR at end 2012
compared to 2008, down from 2.1 to 1.16†
accidents per 1 million hours worked.
OUR PERSPECTIVE
We are among the leaders in our industry
on safety. Therefore the target to halve our
injury rate is a stretching one and becomes
progressively harder as we get closer to
our aim.
We measure our progress using an accident
rate (TRFR) which counts all workplace
injuries except those requiring only simple
first aid treatment. With the exception of 2001,
we have achieved continuous improvement
in our health and safety record since 1996.
In 2012 we continued this progress, reducing
TRFR by 9% compared to 2011, from 1.27 to
1.16† per 1 million hours worked.
However, reducing road traffic accidents
remains a priority for protecting our people.
Much of our business growth comes from
developing markets where our sales people
are at increased risk because the local road
infrastructure can be poor.
We have been working with Cranfield
University in the UK and other partners to
develop a holistic approach that tackles
internal risks as well as collaborating with
others to address external risks, such as
local road safety blackspots.
†
To be independently assured by PwC in 2013, see page 52.
Unilever Sustainable Living Plan: Progress Report 2012
Future challenges
Achieving our targets to reach such
significant numbers of people with
hygiene messages and safe drinking
water was always going to be challenging.
While we have made progress, we
recognise there is a considerable gap
to fill to achieve our goal.
This is particularly true for Lifebuoy
where we need to reach a further
881 million by 2015. We remain confident
of our plans to scale up handwashing
programmes at a faster rate over the
next few years. Lifebuoy is focusing on the
following priority areas to meet its target:
•increasing the impact of rural outreach
through partnerships and multi-brand
programmes
•creating larger partnerships with a
pioneering approach to co-investment
•rolling out a cost-effective and scalable
programme to new countries
•learning from evaluation studies to
identify and roll out best practice
•continuing to raise the profile of
hygiene issues with governments,
key opinion formers and wider
communities.
To help more than a billion people improve
their hygiene habits, we also recognise the
need to develop a more holistic approach to
the inter-related issues of water, sanitation
and hygiene. We are looking at how we
can promote affordable toilet provision
and good toilet hygiene for millions while
growing business for our Domestos brand.
We are working with partners such as
UNICEF and the World Toilet Organization
to develop appropriate models to create
and fulfil demand for toilets.
See our website for more
Health and Hygiene
17
2 NUTRITION
HELPING PEOPLE
MAKE HEALTHY
CHOICES
18
Nutrition
Unilever Sustainable Living Plan: Progress Report 2012
STRATEGY >
governance >
progress on the plan
Industry needs to
collaborate with
government and public
health organisations.
NUTRITION
We will continually work to improve the taste
and nutritional quality of all our products.
By 2020, we will double the proportion of our
portfolio that meets the highest nutritional
standards, based on globally recognised dietary
guidelines. This will help hundreds of millions
of people to achieve a healthier diet.
In 2012 the majority of our products met, or were better than,
benchmarks based on national nutritional recommendations.
Our commitment goes further: 18% of our portfolio by volume
met the highest nutritional standards, based on globally
recognised dietary guidelines.
OUR perspective
Our aim is to make great-tasting food which
makes a positive contribution to a healthy diet.
Our Nutrition Enhancement Programme,
launched in response to the World
Health Organization’s call for action,
has substantially reduced salt, saturated
and trans fat and sugar in our products.
In 2010 we raised our standards further
by benchmarking our progress against the
highest nutritional standards, based on
globally recognised dietary guidelines.
This has inspired us to create healthier
products which people want to eat. We
relaunched our European salad dressings
to reduce salt while delivering great taste
and our new Specially for Kids logo on ice
creams enables parents to make more
informed choices.
In 2012 we moved from reporting by product
(or ‘stock keeping unit’) to reporting by volume
(ie tonnes sold). Reporting by volume better
reflects the relative impact of our foods and
beverages on people’s diets.
We have also moved to a more automated
reporting system, enabling us to increase
significantly the scope of our analysis.
Together, these changes provide a more
extensive and robust analysis of our Foods
and Refreshment portfolio.
In 2012, 18% of our portfolio met the criteria
for highest nutritional standards, based
on globally recognised dietary guidelines.
This figure is not comparable with the 25%
we reported for 2011 due to the significant
changes to our scope. This new scope is
prompting us to consider our future actions.
Looking ahead, we are continuing to improve
the nutritional profile of our portfolio, while
recognising that this is sometimes difficult.
Collaboration between industry, government
and public health organisations is needed to
address complex diet and lifestyle issues.
TARGET SUMMARY
Achieved: 1
On-plan: 5
Off-plan: 1
% of target achieved: 2
Note: Progress on targets for highest nutritional standards; salt; saturated fats; trans fat; and kilocalories is
measured January-September 2012. Progress on sugar target is measured January 2011-September 2012.
In 2012 we moved to full volume-based (tonnes sold) reporting for highest nutritional standards and salt.
Unilever Sustainable Living Plan: Progress Report 2012
Nutrition
19
2 NUTRITION
salad dressings
with less salt
In 2012 we reformulated our extensive range of
salad dressings in Europe – Knorr, Hellmann’s,
Calvé, Amora and Ligeresa – to salt levels that
meet our stringent 5 g per day target. Up to 35%
reduction in salt has been achieved while delivering
great taste. These products will be on the market
from early 2013.
REDUCE SALT LEVELS
OUR TARGETS
Prior to 2010 we had already significantly
reduced salt levels in our products.
Our goal is to reduce the level further to
help consumers meet the recommended
level of 5 g of salt per day based on
globally recognised dietary guidelines.
•Our first milestone was to reduce salt
levels to an interim target of 6 g per
day by the end of 2010. This required
reductions of up to 25%. Our ambition
is to reduce by a further 15-20% on
average to meet the target of 5 g of
salt per day between 2015 and 2020.
OUR PERFORMANCE
80% of our Foods and Refreshment
portfolio by volume met salt levels
equivalent to 5 g per day by end
September 2012; for our Foods
portfolio alone, more than 50%
reached 5 g per day.*
OUR PERSPECTIVE
Salt consumption in many countries remains
much higher than the recommended daily
amount. Achieving our target will require
a significant shift in consumer behaviour
and different stakeholders to play their part.
We are using the Unilever Five Levers for
Change model to help us identify where
to act. We believe we have most impact
through creating great-tasting products.
Typically, to reduce the level of salt,
we completely redesign the recipe so it
tastes better as well as being healthier.
Our nutrition measurements cover our
Foods and Refreshment products to give
a rounded picture of our portfolio. However,
the products in our Refreshment category
of ice cream and beverages make very
small contributions to salt intakes.
We identify the proportion of our Foods
portfolio that reached 5 g per day
because this is the most relevant area
for salt reduction.
*This number is not comparable to the 61% reported for
2011 measured by product (stock keeping unit).
20
Nutrition
Unlocking the
real taste with
reduced-salt
products
REDUCE SATURATED FAT
Foods that need salt for preservation or
preparation can contribute significantly
to salt intakes. But motivating people to
choose products with less salt is difficult.
Unilever initiated consumer surveys on salt
reduction among 6,000 consumers in seven
countries. The results informed a series of
joint workshops with the International Union
of Nutritional Sciences, bringing together
scientists, policy-makers, food industries
and consumer groups to generate compelling
communication on salt reduction for
consumers.
Our surveys revealed that 80% of people
do not see the need to reduce salt intake.
Results from the workshops confirmed
that we need to put taste at the heart of
our approach to salt reduction as people
are worried that lower-salt foods will not
taste as good.
OUR TARGETS
We are committed to improving the fat
composition of our products by reducing
saturated fat as much as possible and
increasing levels of essential fats.
•By 2012 our leading spreads will
contain less than 33% saturated fat
as a proportion of total fat.
•A daily portion will provide at least
15% of the essential fatty acids
recommended by international
dietary guidelines.
OUR PERFORMANCE
92 92% of our leading spreads by volume
contained less than 33% saturated
fat as a proportion of total fat by end
September 2012.
92 92% of our leading spreads by
volume provided at least 15% of the
essential fatty acids recommended
by international guidelines by end
September 2012.
OUR PERSPECTIVE
The biggest contribution we can make
to reducing saturated fat intake is to
encourage people to switch from butter
to margarine. We have been able to
reduce saturated fat levels in the vast
majority of our leading spreads – to levels
of about half the saturated fat present
in butter.
Our leading spreads are those we sell in
tubs under brands such as Flora, Becel,
Rama and Blue Band, comprising around
two-thirds of our soft margarine by volume.
The small proportion of our leading
brands that do not meet our target are
sold in tropical countries. A higher
saturated fat level is required to make the
product stable at ambient temperatures.
We are investigating cost-effective
technologies that will allow us to reduce
saturated fat by approximately a third in
these countries – taking the saturated
fat level to 38% – while still keeping
products affordable.
Unilever Sustainable Living Plan: Progress Report 2012
STRATEGY >
governance >
progress on the plan
Sweetness without
calories
Stevia, a sweetener derived from natural sources,
is meeting consumer demand for ingredients from
natural sources while also delivering a reduction in
sugar. While reducing sugar, we also improved the
taste of many of our Lipton ready-to-drink teas.
We continue to improve the fat composition
of our products by increasing the level of
essential fats. For practical reasons,
we generally increase essential fats at the
same time as we reduce saturated fat levels,
so the two targets are closely interlinked.
OUR TARGETS
•By 2012 we will have removed from all
our products any trans fat originating
from partially hydrogenated vegetable oil.
OUR PERFORMANCE
up to 80% less
saturated fat
than butter
REDUCE SUGAR
REMOVE TRANS FAT
By September 2012, 100% of our portfolio
by volume did not contain trans fats
originating from partially hydrogenated
vegetable oil.
OUR PERSPECTIVE
To ensure we maintain our performance
against this target, we have made the absence
of trans fats from partially hydrogenated
vegetable oil a standard reporting requirement
for all our suppliers.
OUR TARGETS
•Prior to 2010 we had already reduced
sugar levels in our ready-to-drink teas.
By 2020 we will remove an additional 25%.
OUR PERFORMANCE
4% reduction in sugar by end
September 2012.
OUR PERSPECTIVE
In 2012 we introduced several Lipton
ready-to-drink tea products with reduced
sugar levels, particularly in Europe and
North America.
Most of these use Stevia (steviol glycosides)
– a sweetener from natural sources that
provides sweetness without calories.
Additionally, Stevia has a lower carbon
footprint than sugar.
After the launch in 2011, we are continuing
to roll out our new recipe Flora/Becel
margarines, which are now available in
more than ten countries. As well as being
lower in calories, research has shown
consumers find them tastier.
Using technological innovation, the biggest
of its kind for 60 years, we have been able
to reduce saturated fats by around 25%
and calories by 20%. It has up to 80% less
saturated fat than butter. Margarine already
has a quarter of the carbon footprint of butter
and uses around half the land.* Our new
recipes will reduce these environmental
impacts even further.
* Nilsson K et al. International Journal of Life Cycle
Assessment 2010;15:916-26.
Unilever Sustainable Living Plan: Progress Report 2012
Nutrition
21
2 NUTRITION
Strong growth
Unilever is the world’s largest ice cream company,
with brands on sale in over 40 countries. Our popular
Max and Paddle Pop ice creams continue to do well,
achieving underlying sales growth of nearly 20% in 2012,
and will be using our new Specially for Kids logo.
By the end of 2012, 81% of our children’s ice creams
contained 110 kilocalories or fewer per portion.
REDUCE CALORIES
OUR TARGETS
•By 2014 100% of our children’s ice
creams will contain 110 kilocalories or
fewer per portion. 60% will meet this
level by 2012.
OUR PERFORMANCE
81% of our children’s ice creams
contained 110 kilocalories or fewer per
portion by end September 2012, up from
73% at end 2011.
OUR PERSPECTIVE
We continue to invest significantly in this
area and are on track to meet our 2014
target. In particular, we are working on new
technologies that will allow us to reduce
calories by lowering fat and sugar. As part
of our Partner to Win strategic supplier
initiative, we have a long-term partnership
with Barry Callebaut, our supplier of cocoa
and chocolate products, to develop cocoa
based coatings with reduced saturated fat.
seductive nutrition
Calories
Calories
42%
31%
834
626
Calorie Calculator
See for yourself how exchanging one or two
ingredients for healthier food selections, or
adjusting portion sizes, can reduce total calories
in one of your top dishes
Use the Calorie Calculator as Inspiration to
Reduce Calories
More at: www.unileverfoodsolutions.us
People enjoy healthy eating at home.
Our research shows they would like
healthier options when they eat out too.
Our professional catering business, Unilever
Food Solutions, is working with restaurant
operators around the world to make their
menus more nutritious with the help of
our products.
Working with food experts and industryspecific bodies, our Seductive Nutrition
programme provides recipe ideas and
advice for creating nutritious and delicious
meals, especially for top-selling dishes.
Under the programme in the US, over 5,000
operators pledged to remove more than 450
million calories from their menus in 2012.
In 2013 we started to introduce a Specially
for Kids logo on ice creams that meet our
strict nutrition criteria and still appeal to
children as fun treats through a combination
of taste, texture, shapes and colours.
The logo helps parents to identify ice creams
that children can enjoy as part of a balanced
diet and active lifestyle. To promote active
lifestyles we have partnered with a leading
child development psychologist to create an
‘adventurous play’ guide with imaginative
and active games.
22
Nutrition
The campaign is already active in 17 countries
worldwide. It will enable restaurateurs to tap
into consumer demand and increase revenues,
while also contributing to public health.
IMPROVE HEART HEALTH
OUR TARGETS
•By 2020 we aim to motivate 100 million
people to take the Heart Age test.
(Target revised 2013.)
Our goal is to motivate people to adopt
healthier diets and lifestyles, as this
can reduce elevated heart age.
OUR PERFORMANCE
In 2012 we joined forces with Microsoft
to launch Heart Age as an app.
OUR PERSPECTIVE
In 2009 Unilever and the World Heart
Federation launched Heart Age, a simple
online tool to raise awareness of
cardiovascular disease. The tool proved
an excellent mechanism for making
heart health personally relevant.
Until 2011 our Flora/Becel spread brands
provided the foundation for raising
awareness of Heart Age but recognised that,
by themselves, they could not drive enough
people to the tool. In our 2011 Progress
Report we stated that these brands would no
longer be the sole sponsors of the Heart Age
tool, and that Unilever would look to work
with a broader set of external partners with
a common heart health goal to maximise the
tool’s potential.
During 2012, Unilever joined forces
with Microsoft to launch the Heart Age
application on the new Windows 8 platform.
This gives us the potential to reach a
significant number of people as the platform
grows, to co-promote the tool and to explore
opportunities through Microsoft’s emerging
health platform.
Following the launch in December, we are
further expanding the reach of Heart Age
via a wide consortium of partners interested
in heart health, in addition to continued
support from our Flora/Becel pro•activ
brands and Microsoft.
Unilever Sustainable Living Plan: Progress Report 2012
STRATEGY >
progress on the plan
governance >
Investing in employee health
We have increasing evidence that our Lamplighter health programme is a sound investment
for our employees and for our business. Independent analysis shows a return on investment
of €4.82 for every €1 invested in the programme in Brazil, based on combined healthcare
and productivity savings over 2008-11.
In Singapore the return on investment was €3:1 over 2009-12 and there has been a reduction
in the health risk factors associated with higher healthcare costs, such as poor diet
and fitness.
PROVIDE HEALTHY EATING
INFORMATION
OUR TARGETS
Our aim is to provide clear, simple labelling
on our products to help consumers make
choices for a nutritionally balanced diet.
All our products in Europe and North
America provide full nutritional information.
•By 2015 this will be extended to cover
all our products globally. We will include
energy per portion on the front of pack
plus eight key nutrients and % Guideline
Daily Amounts (GDA) for five nutrients on
the back of pack.*
OUR PERFORMANCE
We have achieved full nutritional labelling
in Europe, North America, Latin America,
Australia and New Zealand; in 2012 we
made progress in Africa, the Middle East
and Asia.
OUR PERSPECTIVE
To help us meet our target, at the end
of 2012 we put in place a new system to
improve our monitoring and tracking of
this information.
Our standards in this area often go beyond
country regulations, providing more
nutritional information on labels than is
required locally. Examples include Kenya,
the Philippines, Turkey, Russia and
some countries in North Africa and the
Middle East.
Improve employee
health and nutrition
OUR TARGETS
Our Lamplighter employee programme
aims to improve the nutrition, fitness and
mental resilience of employees. By 2010
it had already been implemented in 30
countries, reaching 35,000 people.
•In 2011 we aimed to extend the reach of
Lamplighter to a further eight countries.
We will implement Lamplighter in an
additional 30 countries between 2012
and 2015. Our longer-term goal is to
extend it to all the countries where
we operate.
OUR PERFORMANCE
Lamplighter has reached over 50,000
employees across more than 50 countries.
In 2012 it was rolled out to 12 countries.
OUR PERSPECTIVE
Lamplighter is key to addressing the top
three health risks we have identified across
our business: mental well-being; lifestyle
factors (eg exercise, nutrition, smoking and
obesity which can lead to conditions such
as hypertension, diabetes and heart disease);
and ergonomic factors (eg repetitive
strain injury).
In 2012 we implemented a global No Smoking
Standard for employees while at work.
By the end of the year, compliance with the
new standard reached 72%; we aim to reach
100% in 2013.
Lamplighter helps us to analyse our
employees’ health risks and to put in place
steps to control them. For example, in India
the programme has reduced the number of
employees categorised as ‘high risk’ (due to
obesity or hypertension for example) from
8% to under 4% over 2007-12.
Future challenges
Reducing salt continues to be one of the
biggest nutritional challenges facing our
industry. People tend to prefer the taste
of traditionally salted products. If the food
is perceived as not salty enough, people
will often compensate by adding salt at
the table.
We are pursuing three approaches:
•exploring technologies that provide
an alternative to sodium salts
•reformulating recipes with other
ingredients to retain flavour while
reducing salt
•changing consumer preference for
salt by gradually reducing salt levels
over time.
However, the salt challenge cannot be
solved by one company acting alone.
Ultimately, it requires collaboration
between industry, governments, public
health organisations and the scientific
community.
In developing and emerging countries
millions of people have diets lacking in
essential micronutrients. Our challenge
remains reaching more people worldwide
with fortified products that are affordable
and commercially viable.
Our approach is to integrate fortification
into our core product portfolio. About a
third of Unilever sales volume (excluding
our ready-to-drink tea business) contains
at least 15% of the recommended daily
amount (RDA) of an essential vitamin or
mineral. For example, our spreads are
fortified with vitamins A and D, and also
contain vitamin E naturally present in the
vegetable oils.
It is proving a valuable tool for safeguarding
employees’ health, improving productivity
and reducing costs.
* Where applicable and legally allowed and in accordance with
local or regional industry agreements.
Unilever Sustainable Living Plan: Progress Report 2012
See our website for more
Nutrition
23
3 GREENHOUSE GASES
HELPING TO TACKLE
CLIMATE CHANGE
24
Greenhouse Gases
Unilever Sustainable Living Plan: Progress Report 2012
STRATEGY >
governance >
progress on the plan
We are seeking
innovations to help
people reduce their
greenhouse gas
impacts.
GREENHOUSE GASES
Halve the greenhouse gas impact of our products
across the lifecycle by 2020.*
Our greenhouse gas impact per consumer use has reduced
by around 6% since 2010.*
OUR perspective
Climate change is accelerating and the
effects are being felt across the world.
It has a significant impact on our business.
The sourcing of our agricultural raw
materials will be affected by changes in
weather patterns; our business and our
consumers will be affected by increases in
energy and food prices and extreme weather
events will displace communities.
Being proactive on climate change is
essential to ensuring we remain a viable
business in the future. We also reap the
benefits through innovation, new product
development and cost efficiencies.
For example, our new dry shampoos do not
need hot water when used and in 2012 grew
by over 19% in sales. And we have avoided
€99 million in costs since 2008 by improving
energy use in our factories.
We are making progress towards our
commitment. The greenhouse gas footprint
of the making and use of our products has
reduced by around 6% per consumer use
since 2010.*
Our biggest challenge however, remains
reducing the hot water used with our soaps,
shower gels and shampoos. To achieve our
goal we need to provide consumers with
more products and tools which motivate
them to use less water. But material change
will require wide-scale decarbonising of
energy grids, effective carbon pricing and
courageous government policies.
We have made particularly good progress
in reducing greenhouse gas emissions from
transport and manufacturing by increasing
efficiency and using more renewable energy.
OUR FOOTPRINT
25%
4%
+
Raw materials
2%
+
Manufacture
68%
+
Transport
1%
+
Consumer use
Disposal
TARGET SUMMARY
Achieved: 2
On-plan: 8
Off-plan: 1
% of target achieved: 0
Source for footprint and pie chart: Unilever 2011-12 footprint study across 14 countries. % of total in tonnes.
* Our environmental targets are expressed against a baseline of 2008 and on a ‘per consumer use’ basis. This means a single
use, portion or serving of a product. As of April 2013, our new automated system only allows us to compare our footprint to 2010
rather than to our original 2008 baseline.
Unilever Sustainable Living Plan: Progress Report 2012
Greenhouse Gases
25
3 GREENHOUSE GASES
Dry Shampoo sales grow 19%
Our dry shampoos allow women to refresh hair between washes,
saving time and extending their style. They may also encourage
people to wash their hair with hot water less often.
We have now rolled out our dry shampoos to ten countries under
nine brands, including TRESemmé, Suave, TiGi and VO5. Sales
grew by over 19% in 2012. We are the market leader in the US with
75% share and in 2012 launched the product under the Dove brand.
OUR FOOTPRINT
The product categories which make the
largest contribution to our greenhouse gas
footprint are those where the consumer
requires heated water. Soap, shower gel
and shampoo and conditioner products
alone account for more than half our
total footprint.
our greenhouse gas footprint
(% contribution by category 2011-12)
4
3
2 2 11
5
6
48
6
11
11
Soap and shower gel
Laundry detergents and fabric conditioners
Shampoo and conditioners
Soups, sauces and stock cubes
Tea and beverages
Household cleaners
Ice cream
Margarine and spreads
Mayonnaise, mustards and dressings
Deodorants
Toothpaste
Skin care
REDUCE greenhouse
gas emissions from
washing clothes
REDUCE greenhouse
gas emissions from
skin cleansing and
hair washing
OUR TARGETS
•By 2015 we aim to reach 200 million
consumers with products and tools
that will help them to reduce their
greenhouse gas emissions while
washing and showering. Our plan is
to reach 400 million people by 2020.
OUR PERFORMANCE
While we have made some limited
progress, overall this target remains
challenging.
OUR PERSPECTIVE
The greatest greenhouse gas impact
of our shampoos, shower gels and soaps
occurs when they are used by consumers
with heated water. During 2012 we
continued to explore a range of approaches
to help us understand consumer
behaviour to influence their showering
and bathing habits. These included:
the roll-out of dry shampoo under
many brands such as Dove, Suave and
TRESemmé; a promotional offer of a
free aerator with Radox shower gel in
South Africa; and crowd sourcing fresh
ideas on how to encourage consumers
to reduce heated water in the shower.
We estimate that compared to washing
hair with heated water, using a dry
shampoo reduces CO2 by around 90%.
The dry shampoo market is still quite new
and the number of users is relatively low;
however quantitative consumer panel
data from the US shows that for those
who bought a dry shampoo, it replaced
a wet wash in 60% of uses. This suggests
dry shampoo is a potential way to reduce
heated water in the shower by offering
a motivating beauty benefit which leads
to a sustainable behaviour.
OUR TARGETS
Reduce the greenhouse gas impact of
the laundry process by:
•Concentrating our liquids and
compacting our powders.
•Reformulating our products to reduce
greenhouse gas emissions by 15%
by 2012.
•Encouraging our consumers to wash
at lower temperatures and at the
correct dosage in 70% of machine
washes by 2020.
OUR PERFORMANCE
14% of our portfolio in our top 14
countries was made up of concentrated
and compacted products at end 2012,†
compared to our baseline of 4%
in 2008.
Over 95% (by volume) of our laundry
We communicate the benefits of
powders in our top 14 countries have
been reformulated, achieving a
reduction of 15% in greenhouse
gas emissions.
low-temperature washing on our
packs and online and are encouraging
our consumers to use the right dosage.
OUR PERSPECTIVE
Liquid laundry detergents are popular
with consumers and in 2012 we were the
market leader in emerging markets, with
market share of over 25%. The majority of
our liquid detergents are now sold in
concentrated form.
Concentrating our laundry products helps
to reduce greenhouse gas emissions,
and is good for our business – great
performance combined with lower material
and transport costs.
However, it can take time for consumers
to switch to concentrated or compacted
products and use the right dosage. Some
consumers continue to use larger doses
than needed, while others under-dose.
26
Greenhouse Gases
Unilever Sustainable Living Plan: Progress Report 2012
STRATEGY >
governance >
progress on the plan
Over €300 million cost avoided
Since 2008, our manufacturing eco-efficiency programme has used a number of costeffective investments to reduce our energy, water and waste. Initiatives range from
encouraging people to adopt small actions that make a big difference cumulatively, such as
ensuring lights are turned off, to larger investments such as biomass boilers. We have
reduced our environmental footprint while avoiding cumulative supply chain costs of over
€300 million:
By designing our products differently,
we can cut out these variations. One example
is concentrated laundry capsules, which we
are promoting in Europe as they ensure
consumers use an accurate dose.
• Water
€17 million
• Energy
• Waste disposal
€10 million
• Materials
REDUCE greenhouse gas emissions
from our manufacturing
OUR TARGETS
•By 2020 CO2 emissions from energy
from our factories will be at or below
2008 levels despite significantly
higher volumes.
This represents a reduction of around
40% per tonne of production.
Versus a 1995 baseline, this represents
a 63% reduction per tonne of production
and a 43% absolute reduction.
We have worked hard to reformulate our
products by replacing ingredients that
have a high greenhouse gas impact with
those with lower impacts. These can
reduce greenhouse gas impact by up to
a third.
We have had some success with helping
people to adopt different habits. We are
working with the International Association
for Soaps, Detergents and Maintenance
Products (AISE) to encourage people to
wash at lower temperatures.
€186 million
However, in some cases the cost of
renewable energy is high compared to
energy from non-renewable fuels.
We continue to evaluate cost-effective
and scalable renewable technologies that
will contribute to our global target.
Our new factories now have sustainability
built into their core designs. In addition
to eco-efficient design of production
processes, we are using certification
systems such as LEED and BREEAM
environmental assessment methods and
rating systems for buildings. Our seven
new factories in 2013 will achieve a rating
of LEED Silver or above.
•We will more than double our use
of renewable energy to 40% of our
total energy requirement by 2020.
We recognise that this is only a first
step towards a long-term goal of 100%
renewable energy.
•All newly built factories will aim to have
less than half the impact of those in our
2008 baseline.
OUR PERFORMANCE
838,000 fewer tonnes of CO2 from
energy produced in 2012 than in 2008
(a reduction of 31.5% per tonne of
production).†
Compared to 1995, this represents
a 60% reduction in absolute terms.
At end 2012 renewable energy
Seven new factories were specified in
contributed 26.3%† of our total energy
use compared to 15.8% in 2008.
2012 for opening in 2013. Their ecoefficient design aims for emissions to
be 50% less than our 2008 baseline.
OUR PERSPECTIVE
We continued to make progress in reducing
CO2 in 2012, adding to savings since our 2008
baseline, which are now equivalent to taking
around 200,000 cars off the road. We have
also made good progress in increasing the
energy from renewable sources at our
manufacturing sites. All our sites in the
US now purchase electricity from certified
renewable sources, as well as those in
Europe and Canada.
†
€99 million
To be independently assured by PwC in 2013, see page 52.
Unilever Sustainable Living Plan: Progress Report 2012
REDUCING GHG
THROUGH BIOMASS
In 2012 we commissioned a new biomass
boiler at our Pouso Alegre site in Brazil
which produces our AdeS and Knorr
products. This burns recycled wood rather
than oil and will reduce emissions by
around 80%.
We are now using bio-energy at 30 of our
252 manufacturing sites, providing around
7% of the energy we use. This reduces our
annual emissions from fossil fuels by over
150,000 tonnes of CO2. We are planning to
install additional boilers at sites in Latin
America, Africa and Asia.
†
To be independently assured by PwC in 2013, see page 52.
Greenhouse Gases
27
3 GREENHOUSE GASES
Ultralogistik
saves €50 million
Our UltraLogistik control tower organisation
enables us to co-ordinate our transport
activities efficiently. We established a tower
in Poland in 2007 which has saved more than
€50 million in costs over 2008-12. We now
have towers in other regions and will continue
with more in 2013.
REDUCE greenhouse gas
emissions from TRANSPORT
OUR TARGETS
•By 2020 CO2 emissions from our global
logistics network will be at or below
2010 levels despite significantly higher
volumes. This will represent a 40%
improvement in CO2 efficiency.
We will achieve this by reducing truck
mileage; using lower emission vehicles;
employing alternative transport such as
rail or ship; and improving the energy
efficiency of our warehouses.
OUR PERFORMANCE
10% improvement in CO2 efficiency since
2010. 7% improvement in CO2 efficiency
and a 7% reduction in absolute terms in
2012 compared to 2011.*
OUR PERSPECTIVE
To get our products from our factories to
the market, we transport our goods over
1.5 billion km each year – the equivalent of
travelling to the moon and back more than
2,000 times.
We are leveraging this scale by creating
regional distribution hubs which will
improve operational efficiency significantly
(see right).
To reach our 2020 target we need to
collaborate with external partners as we
do not own the trucks, trains and ships that
we use. We are making sustainability part of
our working agreements with infrastructure
providers and operators.
Transport network
saves carbon and
road miles
As part of our UltraLogistik transport network,
we are creating regional distribution hubs.
These will improve operational efficiency
significantly and reduce total distance
travelled by 175 million km in Europe alone
from 2013 to 2015 (compared to 2010).
These hubs are part-funded by the EU’s
programme for logistics operators who are
committed to the sustainable transport of
goods across Europe.
We will have 12 hubs in Europe by 2014.
Each is responsible for ensuring that trucks
are more fully loaded as they travel across
Europe, which will reduce CO2 emissions
by nearly 16,000 tonnes over 2010-14.
Making our logistics more efficient delivers
real business benefits including reduced
costs, better business planning and
improved service.
REDUCE greenhouse gas emissions
from refrigeration
OUR TARGETS
As the world’s largest producer of ice
cream, we will accelerate our roll-out of
freezer cabinets that use climate-friendly
(hydrocarbon) refrigerants. When we
launched our Plan in November 2010 we
had already purchased 450,000 units with
the new refrigerant.
•We will purchase a further 850,000
units by 2015.
OUR PERFORMANCE
Around 332,000 climate-friendly
freezers purchased in 2012, taking us
to over 800,000 of our target of 850,000.
OUR PERSPECTIVE
Our climate-friendly hydrocarbon (HC)
freezers have a negligible global warming
potential compared to those that contain
hydrofluorocarbons (HFCs). They are also
around 10% more energy efficient.
In addition to buying freezers with climatefriendly refrigerants, we have been
pioneering new models using state-ofthe-art components to increase their
energy efficiency.
Over 2010-12 we purchased around 290,000
of these more energy-efficient freezers.
We estimate that the energy efficiency of the
freezers we bought in 2012 avoided around
40,000 tonnes of CO2 emissions compared to
2008 models.
We are working with industry to promote
the move to more environmentally friendly
freezers. We are driving an industry
commitment to phase out HFCs by 2015
through our participation in the Consumer
Goods Forum and as the chair of
Refrigerants, Naturally!
*Cumulative improvement since 2010 is measured across
our top 14 countries; annual improvement is measured in
more than 50 countries.
28
Greenhouse Gases
Unilever Sustainable Living Plan: Progress Report 2012
STRATEGY >
progress on the plan
governance >
Climate-friendly freezers grow
sales and cut costs
In Denmark our greener freezers have helped us win new business.
We agreed new partnerships with Fakta discount stores in 2009 and OK Plus petrol chain in 2011,
which are part of the retailer COOP. Prior to this Unilever had very little business with either
company. A key factor was our ability to demonstrate that our climate-friendly freezers generate
lower CO2 emissions and use less energy, delivering better energy efficiency for our customers.
We have achieved excellent growth with both each year since then.
Reduce energy consumption in
our offices
OUR TARGETS
•By 2020 we will halve the energy (kWh)
purchased per occupant for the offices
in our top 21 countries versus 2010.
OUR PERFORMANCE
11% reduction in energy (kWh)
purchased per occupant since 2010.
OUR PERSPECTIVE
In 2012 we continued to focus on making
improvements to our IT systems to reduce
energy use in our offices. Since 2011, all new
personal computers are silver or gold Energy
Star rated and all servers in our data centres
are gold Energy Star rated. In our data
centres, we are consolidating the number
of servers in the US, Asia, Africa, the Middle
East and Turkey; we have decommissioned
over 3,000 servers since 2008. We have
started to roll out a PC power management
platform which is expected to reduce PC
power consumption by a minimum of 20%.
In 2013, we will introduce a personal
consumption monitor to show employees
their energy savings and paper use.
Reduce employee travel
OUR TARGETS
•We are investing in advanced video
conferencing facilities to make
communication easier while reducing
travel for our employees. By 2011
this network will cover more than
30 countries.
OUR PERFORMANCE
54 countries were covered by end 2011.
OUR PERSPECTIVE
We exceeded our 2011 target. Through
the use of telepresence in 26 counties we
eliminated the need for around 14,500
short-haul flights and over 23,500 longhaul flights. This delivered clear business
benefits with an estimated saving of almost
€40 million in costs and 113,500 tonnes in
CO2 emissions. We continue to promote
more flexible ‘agile working’ to lessen the
burden of travel for our employees and
reduce greenhouse gas emissions.
We are using our buildings more efficiently
by increasing the average occupancy density
and optimising lighting, heating and cooling
systems. We have developed a toolkit which
helps sites take small actions to reduce the
energy they use.
Future challenges
Our greatest greenhouse gas impact
comes from the heated water people
need when they take a shower with
our soaps, shower gels and shampoos
– especially in the US. Finding ways to
reduce this is crucial if we are to meet
our goal to halve the greenhouse gas
emissions of our products across
the lifecycle.
We are finding this very difficult and have
only made limited headway. We have
made a start by understanding people’s
showering habits. In 2011 we reported
on showering research in the UK. We have
followed up with a similar study in Australia
(see page 32).
Given the barriers to change, we are
experimenting with products like dry
shampoo, with offers such as free shower
aerators from Radox shower gel – which
can save consumers up to €450 a year
– and with competitions to open source
innovative ideas.
A big part of our footprint today is in the
US. But as people in the fast-growing
markets of Asia and Africa start to
acquire washing machines and showers
the task becomes even more difficult.
Our challenge will be to ensure that
people continue to wash their clothes
at low temperatures when they get
a washing machine.
We do not yet have viable solutions and
we will continue to seek innovations
which will help people reduce their
impacts. But large-scale change will only
come about if carbon has an economic
price and if governments put the right
frameworks in place. So we continue
to advocate ambitious public policy to
address climate change and to incentivise
the transition to a low-carbon economy.
See our website for more
Unilever Sustainable Living Plan: Progress Report 2012
Greenhouse Gases
29
4 WATER
REDUCING OUR
WATER USE WHERE
IT MATTERS MOST
30
Water
Unilever Sustainable Living Plan: Progress Report 2012
STRATEGY >
governance >
progress on the plan
We have a long way
to go to meet our goal.
We must work in
partnership with
others to drive
systemic change.
WATER
Halve the water associated with the consumer
use of our products by 2020.*
Our water impact per consumer use has remained broadly
unchanged since 2010.*
OUR perspective
ater shortages are already affecting many
W
parts of the world. By 2025, 1.8 billion people
will be living in countries or regions with
absolute water scarcity and two-thirds in
water-stressed conditions.
While around 70% of available fresh water is
used for agriculture, when it comes to personal
and domestic use, the UN estimates that each
person needs about 50-100 litres per day for
drinking, cooking and washing. Yet in the
poorest countries people live on as little as
10 litres a day. The collection of water, typically
undertaken by women, is also an issue.
According to the UN, sub-saharan Africa alone
loses 40 billion hours per year collecting water.
Our approach is to work across our value
chain from raw material sourcing to the
design of our products. Since 2010 we have
worked with the Water Footprint Network to
measure our agricultural water impact.
We have learnt that our priority water-intensive
crops are tomatoes and sugar cane and that
overall our footprint is lower than we had
previously estimated. We have been working
with our tomato suppliers for many years and
we will continue to introduce drip irrigation to
our suppliers for this and other crops.
e are making some progress in designing
W
and rolling out products which require
less water. Our Comfort One Rinse fabric
conditioner is now available in more
water-scarce countries. Lifebuoy has
launched a foam handwash which cuts
water use and we have rolled out dry
shampoo to ten countries.
We have made particular progress in reducing
water abstracted by our manufacturing sites.
Since 2008 we have saved the equivalent of
around 1.5 litres of water for every person on
the planet.
We have a long way to go to meet our goal.
As we go forward, we will be better prepared
for sourcing essential raw materials from
farmers with limited water supplies and
we will open up new markets by providing
products which meet the needs of people
with restricted access to water. But in the end
transformational change will only come about
when water is priced and there is a financial
incentive to encourage new behaviours.
he water used by our consumers in washing
T
and cleaning is more than seven times greater
than the water embedded in the agricultural
raw materials we buy. In emerging countries,
washing clothes can take up one-third of
a household’s water supply.
OUR FOOTPRINT
15%
<1%
+
+
Water used in the agricultural raw
materials we source, measured in all
water-scarce countries in the world
85%
Water we add
to the product
Water used by consumers in water-scarce countries, measured in
seven water-scarce countries representing around half the world’s population
TARGET SUMMARY
Achieved: 0
On-plan: 5
Off-plan: 1
% of target achieved: 0
Source for footprint and pie chart: Unilever 2011-12 footprint study across 7 water-scarce countries. % of total
in litres. Our baseline for water includes the water used by consumers with our products and the water in the
formulation. We have calculated the water used in agriculture in a separate study which covers all water-scarce
countries in the world, see www.unilever.com/sustainable-living/water/footprint/
Unilever Sustainable Living Plan: Progress Report 2012
* Our environmental targets are expressed against a baseline of 2008 and
on a ‘per consumer use’ basis. This means a single use, portion or serving
of a product. As of April 2013, our new automated system only allows us to
compare our footprint to 2010 rather than to our original 2008 baseline.
Water
31
4 WATER
Radox saves
consumerS money
We are experimenting with ways to help
consumers reduce water use. Our Radox
brand of shower gels in South Africa gave
consumers a free aerator when they
purchased two products. These can be
fitted to shower heads to reduce water and
they can save people up to €450 a year.
OUR FOOTPRINT
Our water footprint is calculated in seven
countries which we have defined as waterscarce, accounting for around half the
world’s population (see page 53).
REDUCE water use in
the laundry process
Our analysis shows that around 38% of
our water footprint comes from the laundry
process – a significant proportion of
this is washing laundry by hand in the
developing world.
OUR TARGETS
We will reduce the water required in the
laundry process by:
A further 39% of our footprint comes from
showering, bathing and washing hair with
our products.
our WATER footprint
(% contribution by category 2011-12)
8
•Making easier rinsing products more
widely available.
•Providing 50 million households in
water-scarce countries with laundry
products that deliver excellent results
but use less water by 2020.
OUR PERFORMANCE
In 2012 we launched Comfort One Rinse,
our fabric conditioner, in India and
Cambodia and expanded the Comfort
One Rinse range in Thailand, Vietnam,
Indonesia and the Philippines.
10
38
13
31
Laundry detergents and fabric conditioners
Soap and shower gel
Household cleaners
Toothpaste
Shampoo and conditioners
The chart above shows the water associated
with the consumer use of our products.
In 2012 One Rinse products were used
in 1.4 billion washes in 28.7 million
households worldwide, a 66% increase
on 2010.†
OUR PERSPECTIVE
We assessed both these targets as off
track in our last Report. Compared to 2011,
we have more projects agreed in our
innovation pipeline that give us confidence
we will make greater progress in the
coming years. We have also significantly
expanded One Rinse products and sales are
growing, so we have assessed our progress
as back on track to reach our 2020 target.
In water-scarce countries, around 38% of
domestic water is used to clean clothes.
In many of these areas, people wash
garments by hand. Our One Rinse fabric
conditioner reduces the amount of water
needed to remove detergent residues to one
bucket rather than three. This can save up
to half the water per wash, around 30 litres,
if used correctly.
REDUCE water use in
skin cleansing and
hair washing
OUR TARGETS
•By 2015 we intend to reach 200 million
consumers with products and tools
that will help them to use less water
while washing and showering. Our
goal is to reach 400 million by 2020.
OUR PERFORMANCE
In 2012 we have improved our
understanding of this area but
progress remains slow.
OUR PERSPECTIVE
Around 39% of our domestic water
footprint occurs when people use our
soaps, shower gels and shampoos and
they can be slow or reluctant to change
their habits. We have undertaken several
studies in different countries to improve
our understanding of people’s showering
behaviour and how it can be influenced.
For example, our shower study of 100
households in Australia gathered data
on shower habits and the relationship
between consumer behaviour and product
use. We installed sensors to measure the
duration, water use and frequency of
showers. We found the average shower
lasts about 9 minutes, longer than the
average UK shower of 8 minutes.
We have introduced two innovations that
provide consumer benefits and encourage
less water use: dry shampoo, which
refreshes the hair without water, and
Lifebuoy foam handwash which can cut
water use by 18%.
In 2012 we continued to introduce this
product to new countries and it is now
available in India and Cambodia. It has
a leading position in some markets,
accounting for 38% of the fabric conditioner
market in Vietnam and has risen to
a quarter of the market in Indonesia.
†
32
Water
To be independently assured by PwC in 2013, see page 52.
Unilever Sustainable Living Plan: Progress Report 2012
STRATEGY >
governance >
progress on the plan
Eco-efficiency
avoids €17 million
in costs
Investment in cost-effective technologies in
our factories – along with the treatment of
process effluents to enable water reuse and
increased monitoring – has avoided over
€17 million in cumulative cost since 2008.
REDUCE WATER USE
IN AGRICULTURE
OUR TARGETS
•We will develop comprehensive plans
with our suppliers and partners to
reduce the water used to grow our
crops in water-scarce countries.
OUR PERFORMANCE
In 2012 we refined our understanding
of our irrigation water footprint and
identified priority crops and locations
for further work.
OUR PERSPECTIVE
In 2012, using data from the Water Footprint
Network, we completed a ground-breaking
assessment of the amount of irrigation water
used to produce our key agricultural raw
materials in all the water-scarce countries
we source from. This included a detailed
assessment of our key agricultural materials
(around two-thirds of our volumes) and
consideration of a further 30 materials.
Our assessment is much more precise than
our previous analysis which we used to draw
up our 2008 water footprint diagram. This is
largely due to better water footprint
estimates and more specific information on
the areas in which our key crops are grown.
Our footprint is lower than we had previously
estimated. We thought that the total water
used to produce our agricultural ingredients
was about 50% of our value chain footprint.
We now know that it is about 15%, and that
about 85% relates to water used by our
consumers (see updated footprint, page 31).
The assessment identified tomatoes and
sugar cane as priority crops from a water
perspective. We have already worked for
many years on promoting drip irrigation
with our tomato suppliers. We will now
step up our activity and continue to work
with suppliers to collect data for self-verified
crops grown according to the Unilever
Sustainable Agriculture Code.
REDUCE WATER USE IN OUR
MANUFACTURING PROCESS
Future challenges
The largest part of our footprint is
associated with showering, bathing
and washing clothes, just as our
greenhouse gas footprint is associated
with heating that water for showers and
washing machines.
OUR TARGETS
•By 2020, water abstraction by our
global factory network will be at or
below 2008 levels, despite significantly
higher volumes.
In those parts of the developing world
where water is scarce, women often have
to walk long distances to collect water,
or they have to become ‘water managers’
in the home – storing and rationing
scarce water carefully. If we can develop
more innovations like Comfort One Rinse,
which reduce the water needed for doing
the laundry, these will save people time
as well as being more convenient.
This represents a reduction of around
40% per tonne of production.
Versus a 1995 baseline, this represents
a 78% reduction per tonne of production
and a 65% absolute reduction. We will
focus in particular on factories in
water-scarce locations.
•All newly built factories will aim to
abstract less than half the water of those
in our 2008 baseline.
Long-term lack of investment in water
infrastructure will exacerbate the problem
of water scarcity in many countries.
OUR PERFORMANCE
13 million fewer m3 of water abstracted
in 2012 than in 2008 (a reduction of
25% per tonne of production).†
We need to work in partnership with
governments, NGOs and consumers
to address and manage water use
effectively. Water pricing and water
metering, alongside consumer education,
will ultimately be necessary to drive
systemic change.
Compared to 1995, this represents
a 73% reduction in absolute terms.
Seven new factories were specified in
2012 for opening in 2013. Their ecoefficient design aims to abstract 50%
less water per tonne of production than
the 2008 baseline.
OUR PERSPECTIVE
We have made good progress in reducing
water abstracted by our manufacturing sites:
since 2008 we have saved the equivalent of
around 1.5 litres of water for every person on
the planet. Water use per tonne of production
decreased by 7% in 2012 compared to 2011.
In 2012 we invested in four effluent recycling
projects at sites in South Asia to reduce
abstraction by over 60,000 m3 per year.
Our Indian manufacturing sites provide many
good examples of how rainwater is used
for factory utilities such as cooling towers,
boilers, manufacturing processes (following
treatment) and toilet flushing.
However, the relatively low cost of water
makes justifying the costs of some water
reduction projects difficult. We will therefore
focus on reducing water use in sites we have
identified as priority water-scarce locations.
Unilever Sustainable Living Plan: Progress Report 2012
See our website for more
†
To be independently assured by PwC in 2013, see page 52.
Water
33
5 WASTE
REDUCE, REUSE,
RECYCLE
34
Waste
Unilever Sustainable Living Plan: Progress Report 2012
STRATEGY >
governance >
progress on the plan
Over half our
factories achieved
zero non-hazardous
waste to landfill
in 2012.
WASTE
Halve the waste associated with the disposal
of our products by 2020*
Our waste impact per consumer use has reduced by
around 7% since 2010.*
OUR perspective
Packaging plays a key role in protecting our
products. But it can also end up as waste
in landfill, dumping grounds or as litter.
Increasing resource scarcity means it is
more urgent than ever to be efficient with
packaging and find solutions to deal with
‘post consumer waste’ – packaging and
product thrown away after use by our
consumers. This is particularly important in
developing markets where infrastructure to
manage packaging waste has not kept pace
with the rapid rise in consumption.
Our approach is to reduce, reuse and
recycle. There is a clear business case.
By reducing packaging we can gain cost
benefits in materials, energy and transport.
We have made good progress in reducing
our waste. In manufacturing, over half
our sites achieved zero non-hazardous
waste to landfill in 2012 and we are setting
a new target for all our sites to achieve this
by 2015.
Progress has also been made in
lightweighting our packaging. This often
involves selecting new materials which
enable less material use. Our dedicated
global team of experts, called the Materials
Capability Group, develops long-term
innovative solutions to reduce packaging.
They work with specialist suppliers to draw
on the latest technologies which are then
applied across our product categories.
More of our packaging is now recyclable
or contains recycled material, but we are
finding that tackling post-consumer waste
is more challenging.
We are continuing to work with others
– from influencing government policy to
learning from suppliers and waste service
providers, as well as collaborating with
other industry players on non-competitive
priorities, such as developing new materials
that can be easily recycled. We have initiated
a number of pilots on materials which are
usually considered more difficult to recycle
at scale. We will collaborate with others
across our value chain to develop new
end-to-end solutions.
OUR FOOTPRINT
58%
19%
+
Primary packaging
23%
+
Transport packaging
[X%]
–
Product leftovers
National index of materials
recycled and recovered / estimates
TARGET SUMMARY
Achieved: 1
On-plan: 9
Off-plan: 1
Source for footprint and pie charts: Unilever 2011-12 footprint study across 14 countries.
% of total in tonnes.
* Our environmental targets are expressed against a baseline of 2008 and on a ‘per consumer use’
basis. This means a single use, portion or serving of a product.
Unilever Sustainable Living Plan: Progress Report 2012
% of target achieved: 1
We set our baseline by calculating the waste from over 1,600 representative products. We did
this at an absolute level as well as on a per consumer use basis in 14 countries. The calculation
covers 70% of our volumes. As of April 2013, our new automated system only allows us to
compare our footprint to 2010 rather than to our original 2008 baseline.
Waste
35
5 WASTE
New technology saves money
During 2011 we launched a new bottle design in Indonesia and
Thailand for our Citra skin care brand. This resulted in a weight
reduction of 365 tonnes of material. In 2012, we introduced a
new technology – bi-modal resin – and we saved a further
70 tonnes of material. The same technology is now being rolled
out across many more of our skin care and hair care brands
and will bring further savings in material and cost.
OUR FOOTPRINT
Our analysis has highlighted that our food
packaging is one of the biggest contributors
to our waste footprint. But to achieve our
goal we will need to reduce waste across
all product categories by reducing the
weight of packaging and by helping to
increase recycling. Tea bags form a
significant proportion of product leftovers.
OUR WASTE FOOTPRINT
(% contribution by category 2011-12)
4
5
OUR TARGETS
•By 2020 we will reduce the weight
of packaging that we use by a
third through:
-lightweighting materials
-optimising structural and
material design
-developing concentrated versions
of our products
17
5
CUTTING
PACKAGING COSTS
REDUCE PACKAGING
-eliminating unnecessary packaging.
5
11
7
OUR PERFORMANCE
An estimated 9.5% reduction in weight
per consumer use over 2011-12
compared to 2010, achieved through
a combination of lightweighting and
material design optimisation.
8
11
8
10
9
Soups, sauces and stock cubes
Soap and shower gel
Tea and beverages
Laundry detergents and fabric conditioners
Deodorants
Shampoo and conditioners
Ice cream
Mayonnaise, mustards and dressings
Household cleaners
Margarine and spreads
Skin care
Toothpaste
OUR WASTE FOOTPRINT
(% contribution by MATERIAL TYPE
2011-12)
4
3
3
11
33
13
16
Paper and board
Flexible laminates
Glass
PP
The material we use to wrap our ice cream
brands, Twister, Paddle Pop and Fruttare is
made of layers. Our R&D experts, working
with academics and suppliers, have
developed new materials which reduce both
the number of layers and their thickness.
The results speak for themselves. These
brands have reduced their use of flow
wrap from 19 specifications to just three
worldwide. This change reduces the amount
of packaging we use and has immediate
business benefits. We started rolling out
these materials in 2012. When our roll-out
is complete, we anticipate a saving of around
€1.3 million, complemented by a material
reduction of around 530 tonnes.
OUR PERSPECTIVE
We are making good progress to reduce
our packaging. We have traditionally
focused on reducing packaging material
simply as a route to cutting costs. But our
focus has changed. We are now focusing
on developing innovation in lighter,
stronger and better materials that have
a lower environmental impact. To help us
do this we have established a Materials
Capability Group who work together with
suppliers to develop new technologies.
New technologies are critical to ensure
we have a continuous programme for
packaging reductions. For example,
we have reduced the number of layers
and the thickness of the sachet materials
used for our hair products in South East
Asia, and we will now roll this out across
India, Pakistan and Bangladesh. Once the
roll-out is complete, we will save around
2,500 tonnes of material.
17
PE
Other
PET
Metals
Measured by material type, paper and board,
flexible laminates and glass make up the
majority of our waste footprint.
36
Waste
Unilever Sustainable Living Plan: Progress Report 2012
STRATEGY >
progress on the plan
governance >
Deeper insights drive action
Our detailed analysis shows that national recycling rates for particular materials often lack
clarity. For example, a 90% recycling rate for aluminium packaging may be based largely on
recycling of aluminium drinks cans, and it is therefore inappropriate to apply the same rate
when calculating waste to landfill for our aluminium aerosol packaging.
This analysis helps focus our efforts to increase recycling for specific packaging formats.
For example we have increased aerosol deodorant recycling through strategic partnerships
with industry associations and some of our customers in the UK, Brazil and Mexico.
RECYCLE PACKAGING
REUSE PACKAGING
OUR TARGETS
•
We will provide consumers with
refills in our home and personal care
portfolio to make it possible to reuse
the primary pack.
OUR TARGETS
•Working in partnership with industry,
governments and NGOs, we aim to
increase recycling and recovery rates
on average by 5% by 2015 and by 15%
by 2020 in our top 14 countries. For
some this means doubling or even
tripling existing recycling rates.
We will make it easier for consumers
to recycle our packaging by using
materials that best fit the end-of-life
treatment facilities available in
their countries.
•By 2020 we will increase the recycled
material content in our packaging to
maximum possible levels. This will act
as a catalyst to increase recycling rates.
OUR PERFORMANCE
3.5% increase in recycling and
recovery rates, over the 2010 average
Recycling and Recovery Index (RRI),
averaged across our top 14 countries.
Some of this increase resulted from
improved data.
3,126 tonnes of post-consumer
recycled materials incorporated
into our rigid plastic packaging.
OUR PERSPECTIVE
We have made modest progress against
our targets.
This area is complex, as we anticipated.
In some countries there is almost no
infrastructure available to collect waste
and some materials cannot readily be
recycled as technologies do not yet exist.
In other countries with more developed
infrastructure, certain packaging formats,
although manufactured from popular
materials such as PET, are still not collected
and recycled in significant volumes.
encouraging
more recycling
We are building our knowledge of recycling
in several ways.
In the US, our Dove and Suave brands are
working with Recyclebank to incentivise
consumers to recycle more bathroom
products. Unilever Ventures has invested
indirectly in Recyclebank as it will help us
increase our understanding of how to
encourage people to recycle more.
OUR PERFORMANCE
We introduced refills in several
markets during 2012, including China,
India, South Africa and the UK.
OUR PERSPECTIVE
We are having some success in developing
markets. We sell refill pouches in China and
South Africa for some of our shampoo brands.
In developed markets this area remains
challenging as consumers sometimes see
refills as unappealing. However, we continue
to experiment and are expanding our range.
An example is Timotei shampoo’s 500 ml
refill, launched in the UK in 2012.
In Europe, we have commissioned studies
in several countries aimed at understanding
the recycling infrastructure for polypropylene
(PP) pots, trays and tubs. These are widely
used by our margarine brands, Wall’s ice
creams and Vaseline jars. The studies have
shown that this type of packaging is hardly
recycled and, at best, is burnt for energy.
We are currently engaged in discussions
with players from each stage of the recycling
process. We intend to pilot a project in 2013
focused on creating a viable business model
which stimulates greater demand for PP
pots, trays and tubs to be collected, sorted
and recycled.
We are using the knowledge gained from
infrastructure studies and pilot initiatives
to develop the most suitable solutions,
whether this involves developing a new
recycling waste stream or reviewing the
materials used in our products.
Unilever Sustainable Living Plan: Progress Report 2012
Waste
37
5 WASTE
Rethinking waste
avoids over €196
million in costs
Zero waste to landfill
We estimate that between 2008 and 2012 our
focused manufacturing programme of waste
elimination, reuse, recycling and recovery has
avoided costs of over €186 million in raw and
packaging materials and has driven down
waste disposal costs by more than €10 million.
TACKLE SACHET WASTE
OUR TARGETS
•
Our goal is to develop and implement a
sustainable business model for handling
our sachet waste streams by 2015.
OUR PERFORMANCE
We are investigating the potential of
a new technology to find uses for sachet
waste. We believe this will generate
higher value returns for sachet waste,
thereby helping us to build a stronger
business case, which for the moment
remains a challenge.
OUR PERSPECTIVE
Empty sachets are generally considered not
worth collecting because they are small and
lightweight so they lack value. Our ambition
is to develop a viable business model for
sachet waste which continues to provide the
price and convenience benefits of sachets to
low-income consumers whilst tackling the
environmental issues associated with their
use, such as litter and lack of recyclability.
In our 2011 Progress Report we shared the
results of our trials using pyrolysis – the
recovery of energy from sachet waste. We
proved that the resulting fuel was of high
enough quality for our Hindustan Unilever
factory. To make the oil useable and
profitable we have been working with our
supplier in India to set up a distillation
column. But scale-up is proving a challenge.
In 2012 we identified a new technology which
we believe is the next generation to pyrolysis.
Small-scale trials have shown a high yield
and superior quality end product. We are
currently in negotiations with the developer
and other value-chain partners with the aim
of commissioning the first commercial plant
in Indonesia during 2013.
One of the biggest barriers to turning
pyrolysis or next generation technology into
a business opportunity for reprocessors is
taking collection of sachet waste to scale.
We have engaged NGOs in India to assist
us and we plan to test different approaches
in 2013.
38
Waste
In 2012 about 76,000 fewer tonnes of site
waste were sent to landfill compared to our
2008 baseline. This is the equivalent of more
than one million household bins of waste.
Reduce waste from
our manufacturing
OUR TARGETS
•By 2020 total waste sent for disposal
will be at or below 2008 levels despite
significantly higher volumes.
This represents a reduction of around
40% per tonne of production.
Versus a 1995 baseline, this represents
an 80% reduction per tonne of production
and a 70% absolute reduction.
•By 2015 all manufacturing sites will
achieve zero non-hazardous waste
to landfill.
(New Target 2012.)
•All newly built factories will aim to
generate less than half the waste of
those in our 2008 baseline.
OUR PERFORMANCE
76,000 fewer tonnes of total waste in
2012 than in 2008. This represents a
51% reduction per tonne of production.†
Compared to 1995, this represents an
85% reduction in absolute terms.
53% (133) of our manufacturing sites
Seven new factories were specified in
achieved zero non-hazardous waste to
landfill by end 2012.
By the end of 2012, 133 manufacturing sites
achieved zero non-hazardous waste to landfill.
This is over half our 252 sites, up from 74 at
the start of the year. In the UK for example,
we reduced the number of waste providers
from 65 to one, maximising opportunities
to identify recycling and beneficial recovery
routes and achieving cost savings.
Building on our good progress, in 2012 we
set a stretching new target for 100% of our
manufacturing sites to achieve zero nonhazardous waste to landfill by the end
of 2015.
Finding new
uses for waste
In manufacturing, apart from eliminating
waste, we also employ three other means
of cutting our waste – reuse, recycling and
recovery. Examples include: the introduction
of reusable transit packaging in our Hefei
factory in China; waste mayonnaise
converted to biofuel; and effluent plant
sludges in Turkey and the Philippines given
a second life as alternative raw materials in
construction products.
2012 for opening in 2013. Their ecoefficient design aims for waste to be
50% less than the 2008 baseline and
zero non-hazardous waste to be sent
to landfill.
OUR PERSPECTIVE
In 2012 we halved our waste disposed from
manufacturing sites compared to our 2008
baseline in both absolute terms and per
tonne of production, whilst growing our
business. This significant milestone – which
has far exceeded our initial target – was
achieved through waste elimination and
reduction activities and by diverting waste
away from disposal routes such as landfill.
This equates to a cost saving of almost
€10 million since 2008, achieved without
the need for capital expenditure. In addition,
reduction in waste in manufacturing since 2008
has avoided costs of €186 million.
†
To be independently assured by PwC in 2013, see page 52.
Unilever Sustainable Living Plan: Progress Report 2012
STRATEGY >
progress on the plan
governance >
Zero waste to landfill
in half our factories
Over half our 252 factories across the world, from
Costa Rica to Japan, now send no non-hazardous waste
to landfill.
We have set a stretching new target – none of our
factories across the world will send any non-hazardous
waste to landfill by the end of 2015.
ELIMINATE PVC
OUR TARGETS
•We will eliminate PVC (polyvinyl chloride)
from all packaging by 2012 (where
technical solutions exist).
OUR PERFORMANCE
99 99% of PVC removed from our portfolio
by end 2012.
OUR PERSPECTIVE
We committed to eliminate PVC from our
packaging in 2009. Virtually all our
packaging is now free of PVC. To get there
our R&D teams around the world have
developed and trialled new materials and
our supply chain has invested in new
equipment.
However, we have yet to eliminate PVC
completely. Some of our foods use PVC in
packaging for safety or hygiene reasons,
for example as a sealant in metal food lids.
For such uses, commercially viable technical
solutions do not yet exist. We are seeking
out new materials that provide the same
functional properties as PVC at a viable cost.
Demand for such alternative materials is
currently small, so we have been at the
forefront of catalysing innovation in the
marketplace. Once these new options
become available, many industries will
benefit from them.
Since we launched the Unilever Sustainable
Living Plan, we have made several
acquisitions which have brought more
PVC into our business. PVC from these
acquisitions is not included in our 99%
above. We are taking action to eliminate it.
REDUCE OFFICE WASTE
OUR TARGETS
•In our top 21 countries, at least 90% of
our office waste will be reused, recycled
or recovered by 2015 and we will send
zero waste to landfill by 2017.
•By 2015 we will reduce paper
consumption by 30% per head in our
top 21 countries.
•We will eliminate paper in our invoicing,
goods receipt, purchase order processes,
financial reporting and employee expense
processing by 2015, where legally
allowable and technically possible.
OUR PERFORMANCE
88% of our office waste was reused,
recycled or recovered by end 2012.
24% reduction in paper consumption per
14% of our incoming invoices were
head in our top 21 countries by end 2012.
processed electronically in 2012, up from
10% in 2011.
Future challenges
While we are making good progress in
reducing packaging, we cannot achieve
our target to halve our waste unless
recycling rates increase significantly.
We are involved in several interventions
associated with recycling and recovery,
such as the Metal Matters campaign in
the UK. However this is an area where
we have little control over the value chain
and are reliant on working with others.
That is why we reviewed our internal
position on packaging recycling and
extended producer responsibility. We
are working with our major markets to
increase our capacity to engage with
governments and other stakeholders to
find the best policy solutions to drive up
recycling rates, which may vary from
country to country.
Although this is clearly a challenge, it is
also an opportunity to inspire end-to-end
solutions through collaboration on
non-competitive priorities, not only
within the supply chain, but also with
our customers and our peer companies.
OUR PERSPECTIVE
We have made good progress in reusing,
recycling and recovering our office waste.
In 2012, employee engagement campaigns
and recycling stations helped us to improve
waste awareness, reduce paper use and
divert waste from landfill. This, combined
with agreements with waste management
contractors, has enabled us to achieve zero
waste to landfill at 45% of target sites in our
top 21 countries.
In 2012 we launched a global print standard.
Double-sided printing rose to 37% from 28%
in 2010 in our top 21 countries.
See our website for more
Unilever Sustainable Living Plan: Progress Report 2012
Waste
39
6 SUSTAINABLE
SOURCING
GROWING FOR
THE FUTURE
40
Sustainable Sourcing
Unilever Sustainable Living Plan: Progress Report 2012
STRATEGY >
governance >
progress on the plan
More than a third of
our agricultural raw
materials are now
sourced sustainably.
SUSTAINABLE SOURCING
By 2020 we will source 100% of our agricultural
raw materials sustainably: 10% by 2010; 30% by
2012; 50% by 2015; 100% by 2020.
36% of our agricultural raw materials were sustainably
sourced by the end of 2012. This exceeded our interim
milestone of 30%, and marks a significant rise from 24%
in 2011.
OUR perspective
Half of our raw materials come from farms
and forests and the decisions that we make
on who we source from, and how we work
with them, can have profound implications
on global resources, climate change and
farmer livelihoods.
There is a clear business case for Unilever
to source its raw materials sustainably.
By taking a long-term view we can ensure
security of supply, reduce costs and protect
scarce resources. This long-term approach
can also create a win-win for farmers.
For example, ensuring the traceability of palm
oil back to its source can help Unilever secure
supplies sustainably while also ensuring
deforestation, land use and social and
community issues are managed responsibly.
By sharing information about where products
come from, we are also meeting emerging
consumer needs. Lipton tea and Magnum
ice cream’s Rainforest Alliance certification
and the new Knorr soup labelling on
sustainably grown tomatoes are leading
the way.
Our progress on sourcing has been strong.
We are concentrating first on our top ten
agricultural raw material groups, which
account for around two-thirds of our
volumes: palm oil; paper and board; soy;
sugar; tea; fruit and vegetables; sunflower
oil; rapeseed oil; dairy ingredients; and
cocoa. We are on track for all these
materials. But the task remains immense,
particularly where our volumes are small.
TARGET SUMMARY
Achieved: 1
On-plan: 15
Off-plan: 1
Unilever Sustainable Living Plan: Progress Report 2012
% of target achieved: 0
Sustainable Sourcing
41
6 SUSTAINABLE SOURCING
Promoting the uptake of
sustainable palm oil in China
Around 14% of palm oil is now certified as sustainable by the RSPO, but only half the
available certified sustainable palm oil is being taken up in the market.
In 2012 Unilever joined key players in industry and government for the China Sustainable
Palm Oil Supply Chain Forum, for talks on promoting faster uptake in China, the world’s
second-largest consumer of palm oil.
SUSTAINABLE
PALM OIL
OUR TARGETS
•We will purchase all palm oil from
certified sustainable sources by 2015.
•We will purchase all palm oil
sustainably from certified, traceable
sources by 2020.
(New target 2012.)
OUR PERFORMANCE
100% of palm oil from sustainable
sources by end 2012:
97% via GreenPalm certificates;† and
3% of palm oil purchased from
certified, traceable sources (through
a segregated supply) by end 2012.
OUR PERSPECTIVE
In April 2012, we announced that we would
reach our 2015 target three years ahead of
schedule. This has been achieved primarily
through the purchase of GreenPalm
certificates. We recognise that these
make a significant contribution to a more
sustainable palm oil industry, but they are
only a first step.
To source sustainably we need to be able
to trace our palm oil back to the plantation
on which it is grown, and trace its route
through certified mills, transport and use.
Our new target is to source all our palm oil
from certified, traceable sources by 2020.
We began sourcing traceable palm oil
for our European markets in 2011, from
suppliers certified by the Roundtable on
Sustainable Palm Oil. We are investing
€69 million in a palm kernel oil processing
plant in Indonesia and considering similar
joint venture investments in processing
crude palm oil derivatives elsewhere to
help us achieve traceable supplies.
We are committed to working with
suppliers, peers, competitors and
governments to transform the industry.
This will provide assurances to consumers
and help to break the links between
palm oil, deforestation and land conflict.
†
Sustainable paper
AND board
Sustainable soy
OUR TARGETS
•We will source 75% of the paper and
board for our packaging from certified
sustainably managed forests or from
recycled material by 2015. We will
reach 100% by 2020.
OUR PERFORMANCE
63% of our paper and board came
from certified sustainably managed
forests or from recycled material by
end 2012.
OUR PERSPECTIVE
Of the 63%, 87% comprised recycled fibre
and 13% certified virgin fibre.
In our 2011 Progress Report we estimated
that 60% of our paper and board came from
sustainable sources. Since then, we have
made significant improvements to our data
collection and reporting processes so that
we now have more detailed, auditable data
that does not rely on estimates.
In 2012 we rolled out sustainable paper
packaging certified by the Forest
Stewardship Council for our Knorr wet
soups in Europe, and for our AdeS soy
drinks in Brazil.
OUR TARGETS
•We will source sustainably all soy beans
by 2014 and all soy oils by 2020.
OUR PERFORMANCE
10% of soy oil sustainably sourced in the
form of RTRS certificates by end 2012.
For soy beans, in 2012 we made steady
progress towards certified supplies
in 2013.
OUR PERSPECTIVE
We use soy oil in our spreads, mayonnaise
and dressings. We have supported the
Round Table on Responsible Soy (RTRS)
since it first issued certificates and in 2012
we were one of the largest single purchasers
of certificates.
We buy most of our soy oil in the US, where
there is currently no RTRS certified soy.
Over 2011-12 we explored the potential for
an RTRS National Interpretation for the US
soy industry with the United Soybean Board
(USB) and WWF US, but were unsuccessful.
However, we have joined Field to Market:
The Keystone Alliance for Sustainable
Agriculture. This brings together US
producers, agribusinesses, food companies
and conservation organisations to create
sustainable outcomes for agriculture.
Its Fieldprint Calculator enables growers
to analyse how their management choices
impact natural resources and operational
efficiency. Making use of this tool, we
continue to work with the USB as it refines
its Soy Pledge’s assurance protocol for
sustainable soy.
In 2012, we did not purchase as much
sustainable soy oil as we hoped; however,
in 2013 we will begin a pilot with US soy
farmers to track and verify performance
improvements to achieve equivalence to
our Sustainable Agriculture Code.
Soy beans make up about 10% of our soy
purchases, for use in our AdeS soy drinks.
We expect to make the first purchases
of sustainable beans in 2013. We are
determined to make progress and have a
roadmap in place to meet our 2014 target.
To be independently assured by PwC in 2013, see page 52.
42
Sustainable Sourcing
Unilever Sustainable Living Plan: Progress Report 2012
STRATEGY >
governance >
progress on the plan
Knorr’s first product with
sustainably sourced label
Sustainable
sourcing
Knorr’s new Tomato and Mascarpone soup was launched in France in 2012 carrying the
label ‘Made with sustainably grown tomatoes’. This is the first time we have promoted an
ingredient as sustainably sourced with farmers verifying their progress in accordance with
Unilever’s Sustainable Agriculture Code.
We have been working with tomato suppliers for the last 15 years to reach this point. Building
traceability has been key – to ensure that the tomatoes that reach our packs are sustainably
grown and traceable right through the supply chain and manufacturing process.
Sustainable TEA
OUR TARGETS
•By 2015 we aim to have the tea in all
Lipton tea bags sourced from Rainforest
Alliance Certified™ estates. By 2020,
100% of Unilever’s tea, including loose
tea, will be sustainably sourced.
OUR PERFORMANCE
75% of our Lipton tea bag blends
contained a proportion of Rainforest
Alliance Certified™ tea by end 2012.
Overall, 39% of the tea purchased for all
our brands was sourced from Rainforest
Alliance Certified™ farms.
OUR PERSPECTIVE
In 2007 we were the first major tea company
to commit to sustainable sourcing of tea on
a large scale. We are on track to achieve our
2015 milestone and 2020 target.
Over the last five years Unilever and our
suppliers have invested heavily in improving
farming practices among tea farmers,
building capacity to more than 170,000
tonnes of Rainforest Alliance certified
tea. For example, all the tea we source
from Argentina is now Rainforest Alliance
certified, and this effort has contributed
significantly to the development of the tea
industry in the Misiones Province.
Between 2007 and the end of 2012, a total
of around 450,000 farmers had been trained
to the Rainforest Alliance standard, in
partnership with Unilever, in preparation
for certification.
During 2012 we continued to partner
with the Netherlands-based Sustainable
Trade Initiative (IDH) and the Kenya Tea
Development Agency (KTDA) to co-fund
farmer field schools which promote
sustainable agriculture through group
learning and field observation techniques.
Unilever and IDH have jointly agreed to
invest a further €4 million over the next
two years to help take our sustainability
initiatives to scale in Africa, Vietnam and
India. This training will not only benefit
Unilever but also the tea industry as a whole.
Sustainable FRUIT AND
VEGETABLES
OUR TARGETS
•We will purchase 100% of our fruit
from sustainable sources by 2015.
•We will purchase 50% of our top 13
vegetables and herbs from sustainable
sources by 2012 and 100% by 2015.
This accounts for over 80% of our
global vegetable and herb volume.
OUR PERFORMANCE
7% of fruit purchased sustainably by
end 2012.
59% of our top 13 vegetables and herbs
purchased from sustainable sources
by end 2012.
OUR PERSPECTIVE
We bought our first sustainable fruit in 2012.
In 2013 we will focus our efforts on working
with our suppliers and looking for further
partnership opportunities as we are a small
player in this market. We have not made as
much progress as we would have liked.
This makes our 2015 target challenging,
but we have a plan in place which makes
us confident we will reach it.
We exceeded our interim target for our top
13 vegetables and herbs; more than half our
suppliers had self-verified their practices
according to the Unilever Sustainable
Agriculture Code by the end of 2012. We
now have 24 ‘Landmark Farms’ supplying
vegetables for our Knorr brand and acting as
agricultural role models for other suppliers.
Sustainable COCOA
OUR TARGETS
•We will source cocoa sustainably
for our Magnum ice cream by 2015.
All other cocoa will be sourced
sustainably by 2020.
OUR PERFORMANCE
64% of cocoa for Magnum sustainably
sourced through Rainforest Alliance
certification by end 2012. Overall,
43% of all cocoa sourced sustainably.
OUR PERSPECTIVE
On pack and online, Magnum shares with
its consumers why it has teamed up with
Rainforest Alliance: to source high-quality
cocoa beans, to increase the income of
farmers and deliver social benefits such
as improved health and safety practices.
To achieve certification, we are working with
20,000 small farmers across West Africa.
Our strategic supply partner, Barry Callebaut,
runs farmer training schools. The schools
work with groups of local farmers to build
their skills and knowledge around sustainable
cultivation practices. Those farmers then act
as trainers, spreading good practice amongst
their community and encouraging more
farmers to follow the programme.
To meet our target, we have been working
with suppliers and their farmers around the
world to identify areas for improvement and
assess their progress using the Unilever
Sustainable Agriculture Code. We work with
suppliers of onions, garlic and tomatoes in
California, US and suppliers of gherkins and
fruit in India. In India we aim to boost yields
to at least the global average.
Unilever Sustainable Living Plan: Progress Report 2012
Sustainable Sourcing
43
6 SUSTAINABLE SOURCING
Investing in traceability
for sunflower oil
In South Africa we have been working with our supplier Ceoco to improve traceability
in the supply chain. We identified a farming community in Limpopo with good practices
that we could build on, then worked with the farmers by providing financial incentives to
develop hybrid seeds with higher yields. We can trace the oils right back to the individual
farms where the seeds were grown.
Our next step will be to scale up the project and roll it out to different provinces and
more farmers.
Sustainable RAPESEED OIL
Sustainable SUGAR
Sustainable DAIRY
OUR TARGETS
•We will source all sugar sustainably
by 2020.
OUR TARGETS
•We will source all rapeseed oil
sustainably by 2020.
OUR TARGETS
•We will source all dairy produce
sustainably by 2020.
OUR PERFORMANCE
8% of sugar sustainably sourced by
end 2012.
OUR PERFORMANCE
16% of rapeseed oil sustainably sourced
by end 2012.
OUR PERSPECTIVE
Unilever has joined the Bonsucro
roundtable, a not-for-profit initiative that is
dedicated to reducing the environmental and
social impacts of sugar cane production.
In December 2012, we purchased the firstever Bonsucro sustainable sugar credits in
Brazil. Although we are not a major buyer of
sugar, we were the first Bonsucro member
to buy credits as we are committed to the
sustainable production of sugar.
OUR PERSPECTIVE
During 2012, we worked with one of our
major suppliers, Cargill, to verify German
oilseed rape production against the Unilever
Sustainable Agriculture Code. This builds
on a pilot project we began in 2009, which
has helped us to agree annual improvement
plans that go beyond European good
agricultural practice, including biodiversity
action plans to enhance habitats. We now
have a model that can be applied to other
oilseed crops.
OUR PERSPECTIVE
We made significant progress in 2012,
increasing the proportion of sustainably
sourced dairy ingredients from 10% in 2011
to 31% in 2012.
In 2012, we also sourced our first sugar
from beet farmers in France, Germany and
the Netherlands. This was verified according
to our Sustainable Agriculture Code.
OUR PERFORMANCE
31% of dairy produce sustainably
sourced by end 2012.
Following a successful pilot in 2011, we
have scaled up our work with one of the
largest dairy co-operatives in the world,
FrieslandCampina. The company has its
own sustainability commitments, such as
the treatment of cows, grazing conditions,
local biodiversity and waste impacts.
These are aligned with the standards of
our Sustainable Agriculture Code.
Sustainable SUNFLOWER OIL
OUR TARGETS
•We will source all sunflower oil
sustainably by 2020.
OUR PERFORMANCE
14% of sunflower oil sustainably sourced
by end 2012.
OUR PERSPECTIVE
In 2011 we scoped pilot projects for
sustainable sunflower oil in several regions,
but these took longer than expected to come
to fruition. However, in 2012, we were able
to source our first sustainable sunflower oil
and are back on track to achieve our target.
In the UK, we have worked closely with the
sustainable agriculture NGO, LEAF (Linking
Environment And Farming), and our supplier
ADM to source certified rapeseed oil at scale
for the first time.
Our supplies were self-verified according
to our Sustainable Agriculture Code and
sourced from Hungary via Cargill and from
South Africa (see above).
44
Sustainable Sourcing
Unilever Sustainable Living Plan: Progress Report 2012
STRATEGY >
progress on the plan
governance >
Our Sustainable Agriculture Code
The Unilever Sustainable Agriculture Code was launched in 2010, after 15 years’ work.
Our sustainable sourcing programme relies on compliance with the Code, through selfassessment or through external certification standards.
2012 was our first year of getting to scale and gave us deeper insights about suppliers’ challenges.
We have now sustainably sourced tomatoes, dairy, rapeseed, sunflower seed, sugar beet and
potatoes, demonstrating the Code’s flexibility across crops and countries. Chinese tomato
farmers have significantly reduced fertilizer use while increasing yields, and we are tracking
pest infestation using traps and smartphones, leading to lower pesticide use and better quality
crops for Mediterranean tomato farmers.
FAIRTRADE BEN & JERRY’S
OUR TARGETS
•All flavours of Ben & Jerry’s ice cream
will be Fairtrade certified by 2013.
(Target revised 2012.)
OUR PERFORMANCE
In 2012 we made steady progress
towards achieving Fairtrade certification
on all our ice cream flavours.
OUR PERSPECTIVE
In Europe, our five key commodities (sugar,
cocoa, coffee, vanilla and bananas) were
converted to Fairtrade (FT) by the end of 2011.
Converting the rest of our ice creams is a
major undertaking, involving around 200
ingredients for nearly 90 flavours. In 2011
we reported setbacks in the US which meant
that we could not source all the FT-certified
ingredients we needed for our US business.
We have found that FT ingredients are
simply not available or do not meet our
specifications for a range of the ingredients
we use (such as some nuts and spices).
So we have had to revise our target from
our previous ‘all ingredients’ to ‘all flavours’.
In 2012 we worked with Fairtrade
International to adjust our US conversion
plan and identified that by using FT
ingredients for the five major commodities
in all our base mixes and for our chunks and
swirls, all our ice cream flavours will qualify
for FT certification by 2013. The vast majority
of our ice creams will be available in stores
by the end of the year, with the remainder
becoming available early in 2014.
CAGE-FREE EGGS
OUR TARGETS
•We aim to move to 100% cage-free eggs
for all our products,* including Ben
& Jerry’s ice cream and Hellmann’s,
Amora and Calvé mayonnaises
OUR PERFORMANCE
Our roll-out of products using cage-free
eggs continued, with around one-third
of our mayonnaise portfolio in North
America becoming cage-free by
end 2012.
OUR PERSPECTIVE
In Western Europe our Hellmann’s, Amora
and Calvé brands have been 100% cage-free
since 2009 and by the end of 2011, 99% of all
eggs used in Ben & Jerry’s ice cream mix
worldwide were cage-free.
We have made good progress in North
America in 2012, and are confident that we
will achieve 100% cage-free eggs in our
mayonnaise portfolio in this region over the
coming years.
Our progress has been helped by the fact
that we have built long-term contracts to
give suppliers the confidence to invest in
cage-free production.
*Where allowed by local legislation.
Increase sustainable sourcing
of office materials
OUR TARGETS
•By 2013 we will source all paper-based
office materials for our top 21 countries
from either certified sustainable forests
or recycled sources.
Future challenges
Sustainable sourcing of all our raw
materials remains an ambitious target,
especially where our market influence
is lower because of our smaller volumes.
We started with our top 10 agricultural
materials and are now considering the
next 30. These account for around 20%
of our volume, so progress in these areas
will mark a significant milestone. In 2012
we made considerable progress with
ingredients such as vanilla and meat.
We recognise that verification and
certification are not end goals. The real
challenge is to show the positive impacts
that sustainability can have on the lives
of farmers, the environment and the
communities in which they live and work.
These issues are complex to tackle.
Working with others is a critical success
factor: by transforming global supply
chains together, we can move faster
and also increase awareness among
consumers of the benefits of sustainably
sourced products.
Our non-agricultural (and therefore nonrenewable) raw materials have also been
a focus in 2012.
We have been mapping the landscape for
mineral mining to identify sustainability
improvements and we now have visibility
on the origins and extraction sites for
about half our portfolio. We have also
looked into existing initiatives and
programmes to reduce the environmental,
health and safety impacts of the raw
materials we use (‘product stewardship
programmes’).
OUR PERFORMANCE
More than 95% of paper-based materials
from certified sustainable forests or
recycled sources by September 2012.
OUR PERSPECTIVE
We are making good progress towards our
2013 target and will continue to work closely
with our suppliers to ensure the robustness
of our reporting process.
Unilever Sustainable Living Plan: Progress Report 2012
See our website for more
Sustainable Sourcing
45
7 BETTER LIVELIHOODS
SUPPORTING
ECONOMIC
DEVELOPMENT
46
Better Livelihoods
Unilever Sustainable Living Plan: Progress Report 2012
STRATEGY >
governance >
progress on the plan
We will work with
others including
industry, NGOs and
trade unions to
mainstream human
and labour rights
into our business.
BETTER LIVELIHOODS
By 2020 we will engage with at least 500,000
smallholder farmers and 75,000 small-scale
distributors in our supply network.
We have increased the number of tea farmers trained
in sustainable practices to around 450,000. The next step
is to develop a methodology to assess improvement in
smallholder livelihoods. We have consolidated our
small-scale distributors programme, reaching 48,000
entrepreneurs.
OUR perspective
Our business contributes to the economic
well-being of many communities across our
value chain, whether through employment,
upskilling or linkage into our extended
supply chain.
In developing and emerging markets we have
an even greater impact on livelihoods. This is
because our supplier and distribution
networks involve millions of small-scale
farmers, distributors and retailers. Most
smallholder farmers grow their crops on less
than 2 hectares of land. They are often held
back from improving their incomes because
of their lack of knowledge of up-to-date
farming practices. If smallholders have
access to training, better quality seeds and
fertiliser they can significantly increase their
yields. This benefits Unilever. As we grow our
business in developing and emerging
markets, we will be sourcing more
agricultural materials grown by smallholders.
If they prosper and their incomes improve,
they will be able to invest and we will have
greater certainty of supply and, often, better
quality raw materials for our food products.
We have expanded the number of
smallholders we reach with training and
increased our investment. But we still have
much to do to demonstrate the impact of our
work on their livelihoods, and how we are
engaging with women farmers. Smallholders
and their practices are diverse which makes
the task of measuring the benefits of our
interventions more difficult. Nevertheless we
want to co-develop a simple, cost-effective
method to show that our interventions do
improve smallholders’ livelihoods.
purchasing cocoa certified by Rainforest
Alliance and we are part of the Roundtable on
Sustainable Palm Oil’s (RSPO) Smallholders
Task Force where we are collectively working
on how best to achieve sustainable
certification for palm oil smallholders.
Unilever is committed to respecting and
promoting human rights and good labour
practices. The adoption of the United Nations
Guiding Principles on Business and Human
Rights has led us to re-think how we should
integrate human and labour rights strategies
across our business and value chain. To tackle
this, in early 2013 we created a new role of
Global Vice President for Social Impact.
We recognise that we have more work to
do in this area.
As the world’s largest purchaser of black tea
we led the way with Rainforest Alliance to
certify our tea supply. We are now
TARGET SUMMARY
Achieved: 0
On-plan: 2
Off-plan: 0
Unilever Sustainable Living Plan: Progress Report 2012
% of target achieved: 0
Better Livelihoods
47
7 BETTER LIVELIHOODS
Technology increases
Shakti sales and
earnings
In 2012 we improved our Shakti rural selling operation
by part-funding mobile phones for a number of our sales
women, equipping them with a simple application
to drive sales. This low-cost but very effective mobile
technology helps them sell the right products, saving time
during sales calls while increasing sales and earnings.
Helping smallholder
farmers
OUR TARGETS
•
Our goal is to engage with at least
500,000 smallholder farmers in our
supply network. We will help them
improve their agricultural practices
and thus enable them to become
more competitive. By doing so we will
improve the quality of their livelihoods.
OUR PERFORMANCE
We continue to engage with partners
to develop an effective methodology
to assess improvement in livelihoods
in our supply chain network.
OUR PERSPECTIVE
Through our supply partnerships we have
helped to train 450,000 tea farmers in
sustainable practices, around 150,000 more
than in 2011. Over 300,000 of them have
achieved Rainforest Alliance certification,
the majority of whom are smallholders in
Kenya. Elsewhere we have supported cocoa
farmers to gain Rainforest Alliance
certification in West Africa.
We are focusing our effort on interventions
which improve agricultural practices.
We want to demonstrate that these
enhance livelihoods. Having examined
existing assessment methodologies, we
decided to consult NGO and supply chain
partners on how to develop a livelihood
assessment methodology which is simple,
quick and affordable. Our goal is to develop
and test this methodology in 2013.
Although we still have much to do to
demonstrate the impact of our work, our
procurement standards and our ability to
share best practice mean we can have an
important influence on the wider sector.
In our Sunrise partnership with Oxfam GB,
we have moved from a single programme
to learning by engaging with a number of
smallholder farmer programmes run by
our suppliers. The aim is to develop clear
blueprints for inclusive business models,
which deliver both commercial success
and help improve social, environmental
and economic conditions.
supporting small-scale
distributors
OUR TARGETS
Shakti, our door-to-door selling operation
in India, provides work for large numbers of
people in poor rural communities.
•We will increase the number of Shakti
entrepreneurs that we recruit, train and
employ from 45,000 in 2010 to 75,000
in 2015.
Assessing our
impact
We operate similar schemes in Bangladesh,
Sri Lanka and Vietnam which we are also
committed to expanding.
In 2012 we commissioned an independent
assessment to evaluate livelihoods, focusing
especially on the impact Rainforest Alliance
(RA) certification has had on smallholders
and their farm workers in our tea supply
chain in Kenya.
The study confirmed that RA-certified
farmers and their workers experience
greater improvements than non-RAcertified farmers in several areas of social,
economic and environmental well-being.
However this is not uniform, as in some
areas, non-certified farmers reported
similar positive impacts.
This is a complex area, and we are assessing
the results and undertaking other studies
with NGOs and other partners to understand
the best way to achieve the right outcomes.
OUR PERFORMANCE
48,000 entrepreneurs (‘Shakti ammas’)†
were selling products to over 3.3 million
households in over 135,000 Indian
villages in 2012.
OUR PERSPECTIVE
Recruiting and training female entrepreneurs
(Shakti ammas) is a resource-intensive
process. During 2012 we worked with our
existing entrepreneurs to help them grow
and develop their businesses. This has helped
to consolidate and strengthen our network.
We are planning to expand our rural
distribution over 2013-15 to reach more
small, remote villages. Engaging more Shakti
ammas is an important part of this plan.
Shakti sales people have proved successful
in increasing our presence in rural areas
and building strong local relationships with
consumers, which encourages brand loyalty.
The model we use improves the lives of our
sales people and their families, usually
doubling the income of the household.
The programme was extended in 2010 to
include ‘Shaktimaans’ who are typically
the husbands or brothers of the Shakti
ammas. They sell our products by bicycle to
surrounding villages, covering a larger area
than Shakti ammas can do on foot. There are
over 30,000 Shaktimaans across India and we
have plans to enlarge the programme in 2013.
These 30,000 Shaktimaans complement our
48,000 Shakti ammas.
†
48
Better Livelihoods
To be independently assured by PwC in 2013, see page 52.
Unilever Sustainable Living Plan: Progress Report 2012
STRATEGY >
progress on the plan
governance >
Boosting women’s incomes
The impact of economically empowering women has a magnifier effect on lifting families
out of poverty. For example, in India, as a result of a partnership between the Maharashtra
government and Hindustan Unilever, a woman entrepreneur was able to invest in a tomato
processing plant, contracting supplies from 600 smallholder farmers. We trained the
farmers in sustainable agricultural practices which contributed to high-quality tomatoes
for our Kissan Ketchup brand. In our Shakti rural sales operation, earnings usually double
household incomes. For many, these new earnings mean they can realise their ambition to
provide a good education for their children.
BETTER LIVELIHOODS
SUSTAINABLE, PROFITABLE GROWTH
DEPENDS ON OUR PEOPLE
We expect all our employees to observe
high standards of behaviour in their everyday
work, reflecting our values of integrity,
respect, responsibility and demonstrating
a pioneering spirit. Sustainable, profitable
growth can only be achieved if we have the
right people working for an organisation
that is fit to win, underpinned by a culture
in which performance is always aligned to
our values.
HUMAN AND LABOUR RIGHTS
Our Code of Business Principles and
Supplier Code set out our commitment to
human and labour rights and specifically
to treat our employees and business
partners with dignity, integrity and fairness.
The Board of Unilever is responsible
for ensuring adherence to these
commitments and our senior management
has responsibility for overseeing their
implementation and ensuring that any
breaches of our Codes are investigated.
We expect and encourage employees
to bring any breach of our Codes to
our attention.
Like many other companies, we have been
undertaking a comprehensive assessment
of how best to operationalise and implement
the UN Guiding Principles on Business and
Human Rights, including reviewing our Code
Policies and ensuring alignment with our
Sustainable Living Plan. In early 2013 we
appointed a Global Vice President for Social
Impact to lead this integration.
We are reviewing our Vietnamese supply
chain in light of the recommendations.
The report also has implications for our
business globally and we are studying how
we can promote sustainable livelihoods for
all our workers and those in our value
chains and will review our use of temporary
workers. We will look at our suppliers’
understanding of our Supplier Code and
ensure that our own operations meet the
same standards as we expect of our
suppliers. We will also develop key
performance indicators on labour and
human rights.
Recognising that progress can best be made
by working together, we will work with others
including industry, NGOs, trade unions and
business partners to mainstream the
integration of human and labour rights into
our business.
Future challenges
For smallholder farmers, our challenge
is to develop an effective yet affordable
methodology for impact assessment.
In some pilot studies, evaluation costs
more than the intervention it is assessing.
Even then the evidence can be uncertain
due to lack of baseline data. We will
continue to work with partners such
as Oxfam, Grameen and the Bill and
Melinda Gates Foundation to refine our
understanding of what is practical.
We are working to integrate respect for
human and labour rights throughout our
value chain, including issues around land
rights, women and community dialogue.
DIVERSITY
We celebrate the diversity of people, believe
in inclusion and respect people for who they
are and what they bring. Women make up
more than 75% of our consumer base.
Our workforce must take account of this.
The proportion of women in management
positions increased from 39% in 2011 to 41%
in 2012. After a decade of steady improvement,
achieving an increase of more than 1% shows
progress – but we recognise there is still
a long way to go. We have three women
Non-Executive Directors on the Board (25%)
and propose to appoint two more in 2013.
In 2012 we appointed a second woman to the
Unilever Leadership Executive.
This assessment was also informed by a
two-year research project by Oxfam, Labour
Rights in Unilever’s Supply Chain, published
in early 2013. Oxfam used our Vietnamese
operations as its main case study and made
six recommendations for our business.
These are based around supporting
workers’ livelihoods, providing human
rights training within the organisation,
implementing more ways in which workers
can raise areas of concern and working
closely with suppliers and partners to
ensure standards are met.
See our website for more on our
approach to people management,
including diversity, labour rights,
training and development.
Unilever Sustainable Living Plan: Progress Report 2012
Better Livelihoods
49
GOVERNANCE
AND EXTERNAL
COMMENTARY
Governance
Strong governance structures enable us
to deliver our Plan, realise the benefits
for the business and draw on relevant
expert input.
Implementation and delivery of the Plan
are monitored by the Unilever Leadership
Executive – the leaders of our categories,
regions and functions headed by our CEO.
The Unilever Sustainable Living Plan Steering
Team supports the Executive. The Team
includes our Category Presidents and the
leaders of key business functions.
The Board’s Corporate Responsibility
Committee comprises three independent
Non-Executive Directors. Their role is to
oversee Unilever’s conduct as a responsible
business, including monitoring the progress
– and potential risk – of the Plan and
ensuring this is fed back to the Board.
Unilever Sustainable
Development Group
The Group’s expertise covers a broad range
of environmental, social and economic
issues in developed and developing
countries. It meets twice a year with our
senior leaders to critique our strategy and
share insights on sustainability issues and
trends. Their perspectives feed into our
leadership teams and our Board’s
Corporate Responsibility Committee.
Jonathon Porritt
Founder Director of Forum for the Future, UK
Malini Mehra
Founder and CEO of the Centre for Social Markets,
India
Ma Jun
Founder Director of the Institute of Public and
Environmental Affairs (IPEA), China
Helio Mattar
President of the Akatu Institute for Conscious
Consumption, Brazil
Further independent opinion on our strategy
comes from our external advisers - the
Unilever Sustainable Development Group
and specialist groups such as our Sustainable
Sourcing Advisory Board. We invited some
members of these groups to comment on
progress in the second year of our Plan.
See our website for more
Jonathon Porritt
Founder Director
of Forum for
the Future, UK
Unilever has been ‘doing sustainability’
in one way or another for a very long time
– some would argue from the first moment
back in the late 19th century when the
founder of the company first committed to
producing affordable soap to help tackle the
hygiene conditions of Victorian Britain.
But it’s only in the last few years that
sustainability has worked its way through to
the heart of the business – and in Unilever,
that means the brands.
Whilst there have always been a handful of
brands that had a great sustainability story
to tell (Dove, Lipton, Lifebuoy and so on),
all the major brands are now being asked to
‘own’ their share of the targets outlined in
the Unilever Sustainable Living Plan, and to
share that with consumers, creatively and
compellingly, in order to ‘make sustainable
living commonplace’.
That’s where the real energy needs to come
from now, reflected differently in all the
different countries where Unilever operates.
By any reckoning, this is one of the most
ambitious ‘change management’
programmes going on in any big company
today. As this Report shows, progress is
good, and some individual projects are
hugely inspiring.
But there is still a long way to go before the
USLP is lived and breathed by every single
part of the business. For instance, it’s only
in the last couple of years that Finance
has seriously addressed the challenge of
aligning all those processes focused on ‘the
numbers’ of the USLP. ‘Doubling the size of
the company’ and ‘halving the footprint’
have to become one and the same ambition
– not separate drivers.
‘Mainstreaming sustainability’ sounds like
such an easy thing to do. But it really isn’t!
50
Governance and External Commentary
Unilever Sustainable Living Plan: Progress Report 2012
STRATEGY >
Malini Mehra
Founder and CEO
of the Centre for
Social Markets,
India
This year’s Progress Report continues the
‘warts and all’ tradition Unilever adopted
with its first report.
In a world of fakery and green-wash,
Unilever stands tall for being different.
This is not a report that shouts ‘we got it
all right’ but dares to say, when it needs to,
‘we’re not on target – yet’ and ‘we find this
very difficult’.
This modesty is entirely appropriate for the
times. Today’s readers don’t want tough
challenges hidden from view. They want to
know what they are and how the company
intends to address them. For example, how
to deliver on the social dimensions of
sustainability – something that requires
more complex socio-cultural interventions.
Or how to reduce growing inequalities and
wealth gaps – which will as profoundly
affect the context Unilever works in globally
as much as resource security.
Unilever has made huge strides in its
efforts to support vulnerable groups in its
supply chain – from smallholder farmers
to rural women entrepreneurs. It now
needs to build on that base to more actively
address the growing socio-economic
divides that will bedevil delivery of the Plan.
The good news? Unilever knows this is a
problem area and has appointed a Global
Vice President for Social Impact to
address it.
In a post-MDG world, this is one area where
Unilever’s straight-talking leadership will
be needed more than ever.
progress on the plan >
governance
Sustainable Sourcing Advisory Board
The Board comprises experts from
diverse backgrounds such as NGOs, research
institutes, companies and academia. Its
1
members advise our procurement function
on key aspects of our Plan – the sustainable
Janet Barber
Independent,
UK
7
David Bright
Oxfam GB, UK
Tom Burke
Independent, UK
Colin Chartres
Independent, Sri Lanka
Ken Giller
University of Wageningen,
Netherlands
Camilla Toulmin
International Institute for
Environment and Development, UK
Alan Knight
Independent, UK
Anne Wallin
Dow Chemical, Switzerland
Christophe Liebon
Intertek, Hong Kong
Tensie Whelan
Rainforest Alliance, US
Richard Perkins
WWF-UK, UK
David Bright
Oxfam GB, UK
I would note two areas of progress around
the USLP. The first is its target to deliver
positive social impact by engaging 500,000
smallholders to improve their livelihoods.
To deliver on this target Unilever has
both begun to identify its own actions
and align actions with multiple suppliers.
This requires clarity on which men and
women smallholders are targeted and on
how risk and benefits can be more fairly
shared through supply chains to improve
smallholder livelihoods. Given the extended
nature of global supply chains, the work to
identify smallholders and the ongoing effort
to monitor this change at farm level should
not be under-estimated.
Secondly, Unilever works hard to bring
together other companies, academia and
civil society to try to both lead and learn on
delivering sustainability as a sector, for
example in putting land grabs and biofuels
on the agenda of the B20 Task Force on
Food Security in 2012.
Unilever Sustainable Living Plan: Progress Report 2012
sourcing of raw materials and engaging
smallholders – and the various areas that
impact sustainability in our value chain,
such as biodiversity, the use of chemicals,
labour conditions and poverty alleviation.
RICHARD PERKINS
WWF-UK, UK
WWF strongly advocates that companies
make their sourcing more sustainable by
buying to independent standards (thirdparty verified, with multi-stakeholder
governance and ISEAL compliant, eg Forest
Stewardship Council). WWF does not accept
self-verification as equivalent to such
independent standards.
There are a huge number of products for
which there is no applicable independent
standard. In these cases, Unilever’s 100%
sustainable sourcing strategy has to
consider other ways of making production
more sustainable. Self-verification is one
approach that WWF supports Unilever
using in these cases.
Self-verification should not be used in cases
where a relevant independent standard
exists. I have suggested in my advice to
Unilever that self-verification might be
buttressed by statistical sampling of those
submitting self-verification to add confidence.
It is great to see Unilever employing
self-verification to make progress on
sustainability with suppliers where
independent standards do not exist.
Governance and External Commentary
51
VERIFICATION
AND METRICS
materiality
We address the material sustainability
issues for our company through the Unilever
Sustainable Living Plan and in our approach
to running a responsible business.
We define materiality as: (1) the degree to
which an issue is aligned with our vision
and purpose, brand portfolio and geography;
(2) the potential impact on our own
operations, or on our sourcing and
consumers; (3) the extent of Unilever’s
influence on the issue; (4) the importance
of an issue to our key stakeholders.
Our Plan will evolve as we refine our
understanding and identify further material
issues. For example, we are studying how
we could take a more holistic approach to
improving hygiene by addressing sanitation
while delivering sustainable growth for our
business (see page 13).
We run a programme of stakeholder
engagement to help us understand external
views on the issues relevant to our business,
and to identify people and partners we can
learn from. During 2012, we ran events to
gather feedback on the Plan in 25 countries.
We also launched the Sustainable Living
Lab, a 24-hour online dialogue between
Unilever managers and external experts
which attracted participants from 77
countries and generated valuable insights.
See our website for more
ASSURANCE 2011
External assurance of sustainability
performance indicators is important to
us and the environmental reporting of
our manufacturing operations has been
independently assured since 1996.
In 2012 we appointed PricewaterhouseCoopers LLP (PwC) to provide independent
assurance of the Unilever Sustainable
Living Plan.
PwC’s scope of work was to provide limited
assurance of a number of performance
measures selected on the basis of their
materiality to the Plan.
The work included interviews with the
Unilever Sustainable Living Plan Steering
Team and with the managers responsible
for the data underpinning the eight
measures selected for assurance. These
measures covered: Lifebuoy; Pureit; salt;
concentrated/compacted laundry products;
ice cream freezer cabinets; One Rinse
fabric conditioners; palm oil; and Shakti
entrepreneurs.
PwC’s conclusion, together with Unilever’s
Basis of Preparation for the reporting
period 1 January - 31 December 2011, is
published on our website, alongside limited
assurance carried out by Deloitte on eight
environmental and two occupational safety
performance indicators for the period
1 January - 31 December 2011.
PwC’s conclusions have been shared
with the Unilever Leadership Executive,
the Unilever Sustainable Living Plan
Steering Team and those responsible for
the indicators. We are acting upon PwC’s
recommendations and the lessons learned
are helping to inform our future work.
ASSURANCE to 2020
For the future assurance of the USLP,
starting with the period 2012, we have
developed a phased approach to 2020 that
will enable us to obtain assurance over the
seven commitments which are central to
our Plan.
In the transition to assuring the seven
commitments, underlying metrics
supporting each commitment will be
selected on the basis of criticality,
following a detailed internal assessment.
Our definition of criticality includes the
following factors:
•materiality – the importance of the
metric’s contribution to the commitment
•maturity – the metric’s stage of
development
• proximity to target completion.
Although our environmental indicators
for manufacturing and our occupational
health and safety indicators do not directly
contribute to the achievement of our seven
commitments, we consider them crucial
for our business and they will always be
assured.
In addition, we recognise that the need may
sometimes arise for external assurance
of specific metrics, such as those with a
higher reputational risk.
Unlike financial accounting standards or
carbon reporting, there are currently no
industry norms or globally recognised
practices for evaluating many of the targets
in the Unilever Sustainable Living Plan. It is
groundbreaking work that will evolve over
the coming years.
The findings from the first year of assurance
of the Plan’s metrics have provided
valuable insights, for example on identifying
appropriate risk assessment processes
for data preparation and reporting,
and improving the documentation and
replicability of calculations. The findings
also prompted us to review and strengthen
our governance.
See our website for more
52
Verification and Metrics
Unilever Sustainable Living Plan: Progress Report 2012
STRATEGY >
OUR METRICS
Our Plan has three big goals to improve
health and well-being, reduce environmental
impact and enhance livelihoods. Supporting
these goals are seven commitments
underpinned by targets spanning our social,
environmental and economic performance
across the value chain.
In our 2011 Progress Report we presented
our people and workplace targets as a
standalone set of targets. In 2012 we
incorporated these targets into the main
body of the plan.
Listed in the box are the key metrics
we use to measure progress on our
commitments.
OUR ENVIRONMENTAL FOOTPRINT
PER CONSUMER USE
To measure our big goal to halve the
environmental footprint of the making and
use of our products ‘per consumer use’* for
GHG, water and waste is a complex process.
It requires a detailed analysis of the water,
waste and greenhouse gas impacts of
thousands of products spread across
14 countries. The calculation accounts for
70% of our volumes.
For each product, we analyse sourcing
and ingredient information, manufacturing
impacts and data on consumer habits
(which often vary by country).
In 2012 we invested in an automated system
to improve the speed and accuracy of our
footprint calculations, which we measure on
a rolling-year basis from 1 July to 30 June.
Currently, this system only allows us to
compare our footprint to 2010 rather than
our original 2008 baseline.
Produced by Unilever Sustainable Business Team
advice on reporting Corporate Citizenship
DESIGN Red Letter Design
PRINTING Charterhouse (ISO 9000 & 14001)
PAPER Amadeus 100% Recycled Silk
– 100% recycled content, 100% de-inked post-consumer waste
progress on the plan >
governance
OUR METRICS
Health and hygiene (page 12)
The number of people reached on a
cumulative basis by an intervention
which, based on past studies, can be
expected to result in sustained, positive
behaviour change.
Nutrition (page 18)
The percentage of products which
meet the highest nutritional standards,
based on globally recognised dietary
guidelines for all four priority nutrients:
salt, saturated and trans fat and sugar.
From 2012, these are measured by volume
rather than by product.
Greenhouse gases (page 24)
Greenhouse gases per consumer use:
CO2 equivalents across the product
lifecycle (grams).*
Our metric measures the greenhouse
gas emissions associated with the
lifecycle of a product from raw materials,
to manufacturing to consumer use and
disposal.
Water (page 30)
Water per consumer use in water-scarce
countries: water added to the product
plus the water used by consumers in
water-scarce countries (litres).*+
Our metric excludes water used in
agriculture, and water used in our
manufacturing operations which we
measure as part of our eco-efficiency
programme (see Reduce water use in
our manufacturing process, page 33).
Feature photography Kieran Doherty,
Igor Emmerich, Philip Gatward, Getty Images,
Chris Moyse, Martin Wanyoike.
Waste (page 34)
Waste per consumer use: packaging
and product leftovers that have not been
reused, recycled or recovered (grams).*
We define waste as the amount of product
left in the pack, and the amount of
packaging that ends up either in landfill
or as litter, ie the amount of packaging
that is not recycled, reused or recovered
for energy recapture. Our metric requires
the use of published national indices
for recycling and recovery, or our own
estimates where these are not available.
The metric excludes the waste generated
by our manufacturing operations which
we measure as part of our eco-efficiency
programme (see Reduce waste from our
manufacturing, page 38).
Sustainable sourcing (page 40)
Raw or packaging material sourced
from verifiable sustainable renewable
sources or made from recycled materials
(% by weight).
Better livelihoods (page 46)
We recognise that it is difficult to provide
evidence of improvements in livelihoods.
We are developing an appropriate
methodology to do this.
*The metrics for our commitments for greenhouse gases
(GHG), water and waste are expressed against a baseline
of 2008 and on a ‘per consumer use’ basis. This means
a single use, portion or serving of a product, eg the GHG
impact of drinking a single cup of tea; the water needed for
one hair wash with shampoo; or the waste associated with
one serving of soup.
+Water-scarce countries: China, India, Indonesia, Mexico,
South Africa, Turkey and USA, representing around half
the world’s population.
If you have finished with this report and no
longer wish to retain it, please pass it on to
other interested readers or dispose of it in
your recycled paper waste. Thank you.
53
Unilever N.V.
Weena 455, PO Box 760
3000 DK Rotterdam
The Netherlands
T +31 (0)10 217 4000
F +31 (0)10 217 4798
Commercial Register Rotterdam
Number: 24051830
Unilever PLC
Unilever House
100 Victoria Embankment
London EC4Y 0DY
United Kingdom
T +44 (0)20 7822 5252
F +44 (0)20 7822 5951
For further information on our
social, economic and environmental
performance, please visit our website
www.unilever.com/SUSTAINABLE-LIVING
Unilever PLC registered office
Unilever PLC
Port Sunlight
Wirral
Merseyside CH62 4ZD
United Kingdom
Registered in England and Wales
Company Number: 41424
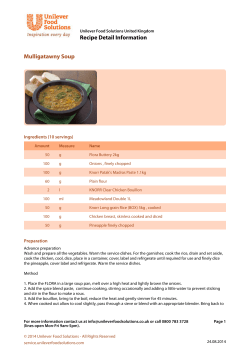


© Copyright 2026