
SOFTWARE PROCESS DIVERSITY - Scheller College of Business
SOFTWARE PROCESS DIVERSITY: CONCEPTUALIZATION, MEASUREMENT, AND ANALYSIS OF IMPACT ON PROJECT PERFORMANCE Narayan Ramasubbu, University of Pittsburgh, ([email protected]) Anandhi Bharadwaj, Emory University, ([email protected]) Giri Kumar Tayi, SUNY, Albany, ([email protected]) Abstract We investigate software process diversity, defined as the project condition arising out of the simultaneous use of multiple software development process frameworks within a single project. We analyze the antecedents and consequences of software process diversity and examine the relationship among software process diversity, organizational process compliance, and software project performance. Our conceptualization characterizes software process diversity as the response of a project team to contingencies such as requirements volatility, design and technological novelty, and the level of customer involvement in the project. We empirically tested this conceptualization utilizing a discovery-oriented approach and data collected from 410 large commercial software projects. Results show that higher levels of requirements volatility, design and technological novelty, and customer involvement increased software process diversity within a project. However, software process diversity within a project decreased with an increase in the level of process compliance enforced on the project. We also found that a higher degree of fit (or match) between process diversity and process compliance, rather than those mechanisms independently, was significantly associated with an increase in project productivity and quality. These results indicate that increasing software process diversity in response to project-level contingencies improves project performance only when there is a concomitant increase in organizational process compliance efforts. We discuss the implications of these results for research and derive prescriptive guidelines to manage the fit between process diversity and process compliance for achieving better software project performance. Key Words: Software process diversity, process compliance, plan-based processes, agile processes, software engineering, productivity, quality, fit as matching. Paper under review; please do not cite or distribute INTRODUCTION Pursuing firm-wide process standardization has traditionally been prescribed as a ‘best practice’ for software organizations to address the challenges of developing high quality software in a cost effective way (Humphrey 1989; Van der Pijl et al. 1997; Harter et al. 2000; Ramasubbu et al. 2008). Until recently, such standardization efforts have been typically implemented through a firm-wide adoption of a single plan-based or agile normative software process framework1 (Krishnan and Kellner 1999; Lycett et al. 2003; Ramasubbu 2014). Accordingly, a majority of prior research on software development processes implicitly treat project-level processes as being uniformly derived from a single normative process framework (Krishnan et al. 2000; Jiang et al. 2004; Agarwal and Chari 2007). However, project-level processes in software development can be divisible, and project teams can customize their processes by selecting and combining elements from multiple plan-based and agile normative frameworks (Fitzgerald et al. 2006; Napier et al. 2008). Practitioner reports from the field also suggest that firms are increasingly adopting multiple process frameworks for their projects and embracing software process diversity (Anderson 2005; Bella et al 2008). Software process diversity refers to the condition of project-level processes being composed of elements drawn from multiple normative software process frameworks that could differ in their underlying attributes and philosophies (Lindvall and Rus 2000; Deck 2002). There is growing recognition that software process diversity could aid teams in overcoming the limitations imposed by standardized processes based on a single normative process framework that advocates strict adherence to either plan-based processes or agile 1 Normative software process frameworks refer to a wide array of models (or methodologies) of software development published by standards organizations in the software industry such as the Software Engineering Institute, Scrum.org, and the International Organization for Standardization (ISO). These frameworks such as the Capability Maturity Model (CMM) and Scrum provide templates and guides for firms to model their software development processes. Firms often seek certifications from the industry standards bodies to signal to the market that their software processes are compliant with the prescriptions of the adopted normative frameworks. [1] processes (Vinekar et al. 2006; Napier et al. 2008; Magdaleno et al. 2012). Past research studies have highlighted that the combination of plan-based and agile processes within a single project, and the resulting increase in software process diversity, could help software teams to better adapt to changing user requirements and design specifications (Harris et al. 2009; Ramesh et al. 2012). Capabilities gained from embracing process diversity could also help teams address the conflicting demands in a project such as the need to be efficient versus the need to be flexible (Subramanyam et al. 2012). By increasing process diversity, software teams that traditionally use plan-based frameworks could infuse flexibility into their context by adopting certain components of agile process frameworks such as accepting requirement changes and more frequent testing (Boehm 2003; Ramasubbu and Balan 2009). Similarly, by embracing process diversity, agile software teams could incorporate some elements of structure and formal communication associated with plan-based process approaches to enhance efficiency and overall predictability of outcomes (Ramesh et al. 2012). While examining the impacts of software process diversity on the performance of custom software development projects, it is important to recognize the presence of another countervailing force in the form of organizational process compliance enforced in those projects. Stringent compliance to established process standards is considered as an important firm capability in the custom software development industry (Ethiraj et al. 2005; Ramasubbu 2014). Software firms are known to voluntarily seek compliance verification and certification from third-party standards organizations in order to gain reputation as “high process maturity” firms (Van der Pijl et al. 1997; Gopal and Gao 2009). These firms allocate significant resources to monitor project teams for their compliance to organizational process standards (McGarry and Decker 2002; Staples and Niazi 2008; Ramasubbu et al. 2008). Such organizational process [2] compliance enforced on project teams can be expected to influence both the levels of process diversity pursued by individual project teams and their subsequent performance. However, there is a dearth of research examining the impacts of software process diversity on the performance of projects executed in an environment of stringent process compliance mandates. We address this gap through this study. We raise the following research questions: What factors contribute to an increase in software process diversity in real world projects that are also actively monitored for compliance to mandated process standards? What is the joint effect of software process diversity and process compliance on project performance? To answer these research questions, we proceeded as follows. We theoretically conceptualized the software process diversity construct and developed its empirical formulization. Then, we adopted a discovery-oriented research approach to facilitate model development by integrating theory-based perspectives and field-based insights elicited from industry practitioners (Menon et al. 1999; Tuli et al. 2007). We partnered with a leading multinational software firm for in-depth field observations of software projects. By iterating insights from our field observations and in-depth interviews of software team members with the corresponding research literature, we developed a conceptual model of the antecedents and performance implications of software process diversity. Subsequently, we tested and verified our conceptualization utilizing archival data from 410 software projects completed at our research site. Finally, based on the results from the analysis and from follow up discussions with project managers from the field, we developed a set of prescriptive guidelines for balancing process diversity and process compliance in software projects. A CONCEPTUALIZATION OF SOFTWARE PROCESS DIVERSITY When software teams adopt and fuse multiple normative process frameworks within a single project, they increase the overall software process diversity within the project. While there [3] have been anecdotal and case descriptions of software process diversity in prior research (e.g., Boehm 2003; Jakobsen and Jhonson 2008; Jakobsen and Sutherland 2009), a rigorous analysis of the concept of software process diversity, its relationship with organizational process compliance, and their joint impact on project performance is absent in the literature. To address this gap, we draw on the broader management literature which has focused on various forms of organizational diversity such as demographic differences, differences in values, functional skills, and personality types. Harrison and Klein (2007) review the literature on organizational diversity and provide guidelines for its conceptualization and measurement. They recommend conceptualizing diversity as the differences in the beliefs and values of team members (diversity as separation), the differences in the knowledge, experience and perspectives of team members (diversity as variety), and the differences in the influences and resources held by team members (diversity as disparity). Building on this, we theoretically define software process diversity as the composition of differences in separation, variety, and disparity of key process areas implemented in a software project. A key process area (KPA) is a cluster of related activities (or tasks) in a project that, when performed collectively, achieves a set of goals for successful software development (Ramasubbu et al. 2008). Normative software process frameworks prescribed by industry-based standards organizations clearly specify the number and scope of KPAs that they support. For example, the CMMI framework for software development consists of a total of 22 KPAs covering the entire lifespan of a development project2. When a software organization adopts a normative process framework such as the CMMI, a process template covering the KPAs of the framework is instituted. This process template provides a predefined collection of artifacts that 2 For more details on the 22 KPAs of the CMMI framework for development, refer to the technical report entitled “CMMI for Development, Version 1.3,” CMU/SEI-2010-TR-033, published by the Software Engineering Institute. [4] can be used to organize the workflow spanning the KPAs throughout a project’s lifecycle. In organizations that allow project teams to simultaneously use multiple normative frameworks process templates corresponding to the different frameworks are made available to a software project team. Software teams typically activate specific components of each of those templates for use in their projects (Fitzgerald et al. 2006; Ramasubbu et al. 2008). Thus, in this scenario, multiple process templates collectively implement the entire set of KPAs of a project. Since the use of process templates by a software team is logged and traceable, longitudinal observations of the membership of a project’s KPAs to the different process templates provides an empirical basis to reliably measure software process diversity and the underlying dimensions of separation, variety, and disparity of the KPAs implemented in a project. The separation dimension of software process diversity measures the composition of differences among KPAs in a software project belonging to process templates derived from planbased versus agile normative process framework. This is analogous to assessing diversity in a project team by acknowledging the differences in knowledge bases, perspectives, and deeply held values and beliefs among the team members (Kilduff et al. 1995; Homan et al. 2007). Planbased and agile process frameworks vary in their overall values, beliefs, and practice attitudes (Boehm 2002; Boehm and Turner 2003). For example, while plan-based frameworks such as the CMMI favor structured planning processes and comprehensive documentation for traceability, agile frameworks such as Extreme Programming tend to emphasize “individuals and interactions over tools, working software over documentation, customer collaboration over contract negotiation, and responding to change over following a plan” (Beck et al. 2001). Measuring the composition of KPAs belonging to the plan-based and agile process templates in a project captures the extent to which a project’s KPAs are diverse in their process values and beliefs. [5] The variety dimension of software process diversity measures the composition of differences in the spread of KPAs across the different process templates used in a project. This accounts for differences among the varieties of process frameworks used in a project even when they are not separated in their overall philosophy (e.g., plan versus agile). For example, a software project might utilize templates from two plan-based frameworks such as the CMMI and Rational Unified Process (RUP), and allocate to each 50% of the total project KPAs. Another project in the firm might utilize the same two process templates, but allocate 25% of its KPAs to the CMMI process template and 75% of its KPAs to the RUP template. The separation diversity score for these two projects would be zero as both CMMI and RUP impose a plan-based development paradigm and there is no separation of values in this case. However, the two projects still differ in the extent to which they allocate KPAs to the two varieties of process templates (CMMI and RUP). Thus, there is a need to capture differences among software projects with respect to the number of process templates they use and the way they allocate KPAs to those different varieties of process templates. The variety dimension of software process diversity accomplishes this by capturing the spread of the KPAs among the different varieties of process templates used in a project. The disparity dimension of software process diversity measures the composition of differences in the resource allocation to the KPAs belonging to the different varieties of process templates utilized in a project. Measuring disparity in resource allocation is important because it captures the extent to which the diverse elements in a process were actually utilized in project activities. Resource allocation in software projects has been typically measured as the percentage of total project effort allocated to a particular activity (Krishnan et al. 2000; Ramasubbu et al. 2008). Accordingly, the disparity dimension of process diversity accounts for resource allocation [6] differences by considering the differences in the project effort allocated to the different KPAs and the process templates they are associated with. In summary, rather than assuming that the KPAs of a project are homogenously distributed with respect to the underlying normative process framework(s), the construct of software process diversity allows us to account for the separation, variety, and disparity of software processes within a project. Next, we develop a conceptual model of the antecedents and consequences of software process diversity and formulate our key hypotheses. RELATING SOFTWARE PROCESS DIVERSITY, PROCESS COMPLIANCE, AND PROJECT PERFORMANCE Discovery-Oriented Research Approach To develop the conceptual model of this study we followed a discovery-oriented research approach that facilitates the uncovering of theories-in-use or forms of knowledge embedded in the realm of practitioners (Menon et al. 1999; Tuli et al. 2007). We first formulated the basic tenets of a preliminary model based on the research findings reported in the information systems development and software engineering literatures, and then refined it based on in-depth discussions with practitioners in the field. Keeping in mind the dual forces of software process diversity and process compliance in high process maturity environments, we began our model formulation by building on prior research findings on “controlled-flexible” process designs (Harris et al. 2009). Controlledflexible process designs aim for both process improvisation and establishment of disciplined management controls to enforce compliance. Using case studies, Harris et al. (2009) established evidence for the superior performance of controlled-flexible process designs when compared to pure plan-based designs. Those case studies revealed cross-project variations in the way controlled-flexible process designs were enacted by different project teams under the influence [7] of technological and market uncertainties. Addressing how teams could adapt to such uncertainties, Vidgen and Wang (2009) studied software process design through the lens of complex adaptive systems and discussed the coevolution of software processes along with the business environment. In the software engineering literature, project-level contingencies such as requirements volatility, degree of customer involvement, and code size have been reported as influencing specific process design choices made by a software team (Boehm and Turner 2003; Ramasubbu and Balan 2009; Magdaleno et al. 2012). Finally, prior research has also established that high process maturity organizations, such as those assessed at CMM level-5 process maturity, enforce stringent process compliance mechanisms to ensure minimal deviance from prescribed standards (Ethiraj et al. 2005; Ramasubbu et al. 2008). Process compliance efforts tend to reduce process variations within a project, and they have been associated with the benefits of minimizing schedule deviation and lowering the number of defects in the delivered software (Krishnan and Kellner 1999; Harter et al. 2000; Harter et al. 2012). The above research findings motivated our conceptual model development as follows: (1) depending on specific project-level contingencies, software teams make choices regarding the underlying normative process frameworks for their projects, which could result in increased levels of software process diversity within the projects; and (2) process diversity and process compliance efforts expended on a project jointly impact project performance outcomes. To enrich our preliminary conceptualization, we conducted in-depth discussions with practitioners in the field. We collaborated with a leading multi-national software development firm that was a recipient of the IEEE Software Process Achievement Award (IEEE SPA 2010) and had an industry-wide reputation as a leader in process innovation. The firm operated in 55 countries with over a hundred thousand employees and about 8 billion dollars in annual revenues [8] at the time of our data collection. All the development centers from which we collected data for this study were assessed as operating at CMM level-5 process maturity by an independent auditing agency. As is common in a discovery-oriented research method, we took our initial conceptualization to the field and engaged with practitioners through focus group meetings and structured interviews. Our goal was to perform a qualitative face validity test of the initial model and to discover underlying mechanisms that influence the relationship between software process diversity, process compliance, and project performance. Interacting with a total of 109 practitioners at our research site, we conducted 27 focus group meetings and 28 one-on-one, structured interviews. Our discussions and interviews involved participants describing their team’s development environment, process design rationale, and lessons learned from their experience. Through these field interactions, we discovered temporal variations in the way different project teams situated themselves in the plan based-toagile process design continuum during the lifespan of their projects. While prior case studies in the literature had documented cross-project variations in process design, we were able to confirm the existence of significant within-project variation in process designs. Discussions with practitioners also highlighted the influential role played by centralized and independent organizational units such as the software engineering process group (SEPG). At our research site, the SEPG was empowered to act as an autonomous body that conducted rigorous internal audits on project teams to enforce compliance to the firm’s process standards. These discussions informed the further development of the study’s hypotheses described below. Antecedents and Consequences of Process Diversity As noted earlier, software process variations within a project reflect the choices made by the software team in response to specific contingencies encountered during the project life cycle. [9] Prior research on software project risk has examined how specific project-level contingencies (or project risk factors) contribute to overall project risk and impact performance outcomes (Barki et al. 1993; Keil et al. 2000). Much of this work characterizes project risks as stemming from various types of uncertainties related to project requirements, end user involvement, underlying technological and design complexity, project team composition, and the overall organizational environment (Wallace et al. 2004). We draw on the risk framework proposed by Wallace et al. (2004) to develop specific hypotheses relating project risk factors and software process diversity. In doing so, we characterize the extent of process diversity observed in a project as the collective response of the project team to the perceived project risks through a key mechanism they control, namely, process design. However, as noted earlier, a countervailing choice exercised by SEPG in the form of process compliance mechanisms attempts to reign in the within-project process diversity. Software process diversity is therefore the result of both project-specific risk factors as well as the extent of organizational process compliance enforced on the project. In contrast to prior studies that have examined project risks in relation to overall project performance, we focus on the intermediate outcome of software process diversity, which in our conceptualization is a key conduit through which project risk factors impact project performance. Accordingly, among the six dimensions of project risk identified by Wallace et al. (2004)3, we develop hypotheses pertaining to requirements risk, design and technology risk, and end-user (customer) involvement risk. These factors were emphasized as the key triggers for increasing software process diversity by practitioners at our research site during our discussions. We account for the remaining risk factors through appropriate control variables, such as software project size, team size, and personnel experience, in our empirical models. 3 The six dimensions are organizational environment risk, user risk, requirements risk, project complexity risk, planning and control risk, and team risk. [10] The final component of our conceptualization is the joint impact of process diversity and process compliance on project performance. In hypothesizing this effect, we consider two project performance dimensions widely examined in the information systems development literature: productivity and quality (Krishnan et al. 2000; Harter et al. 2000; Ramasubbu et al. 2008). We utilize the “fit as matching” perspective (Venkatraman 1989) to characterize the fit (or match) between process diversity and process compliance that impacts project performance. Conceptually, project performance improves with a good fit. That is, when a higher (lower) level of process diversity is matched with a higher (lower) level of investment in process compliance, there is an improvement in productivity and quality. Table 1 presents a summary of the key hypothesized constructs and Figure 1 shows our overall conceptual model. Table 1. Key Constructs in Conceptualization Model Component Construct Requirements volatility Antecedents of software process diversity Design and technological novelty Customer involvement Organizational process compliance Performance implications of software process diversity Fit (misfit) between process diversity and process compliance Productivity Quality Description Uncertainty surrounding project requirements and frequent change in requirements The level of newness and unfamiliarity with the system design and implementation technology The level of involvement from key stakeholders of the client firm The extent of effort spent on meeting process standards mandated by the firm The degree of congruence (deviance) between the extent of process diversity and efforts spent on process compliance activities in a project Overall efficiency in delivering the project (output/input) Overall quality of delivered software (1/defects delivered) Correspondence to Wallace et al. (2004) risk dimension Requirements risk Project complexity risk User risk Planning and control risk --N/A-- Project performance Project performance Requirements Volatility Requirements volatility refers to the extent to which the functional and non-functional requirements for a software system being developed change during the project’s lifespan (Barry et al. 2006; Agarwal and Chari 2007). Requirement changes and subsequent alterations of [11] software code have been reported to create “ripple effects” of rework in a project (Harter et al. 2000; Mookerjee and Chiang 2002). Rework might result due to legitimate changes in a client’s needs, but can also stem from ambiguous, inadequate or wrong articulation of requirements in the first place (Wallace et al. 2004). Figure 1. Conceptual Model Plan-based and agile processes vary in their approaches to handle requirements volatility, the underlying causes, and subsequent ripple effects of rework. Plan-based approaches primarily work towards minimizing requirements volatility through a combination of formal contracts that evoke client commitments and partitioning mechanisms that “freeze” requirements over certain stages of a project’s lifecycle. In contrast, agile processes tend to respond to requirements volatility through improvisation, rapid adaptation, and incremental delivery of software (Boehm 2002). The rapid adaptation and social approach inherent in agile process framework, however, have been noted as not scalable due to inefficiencies of frequent informal meetings (Begel and Nagappan 2007; Dyba and Dingsoyr 2008). Thus, in the presence of requirements volatility, there are tradeoffs to be made when any single framework is used exclusively in a project. One way to remove the constraints of such tradeoffs, then, is to adopt both plan-based and agile process frameworks within a project. Using multiple process frameworks would help [12] project teams to better handle the fluidity in requirements as they could cordon off parts of the project that have different levels of volatility and tackle them through different process approaches. For example, teams could partition a project into different phases (or iterations) of high and low volatility to use different process frameworks for these phases (MacCormack and Verganti 2003). Teams could also partition the software into different modules according to the requirements volatility levels and suitably apply different varieties of processes to them (MacCormack et al. 2001). Use of different varieties of process templates from both plan-based and agile frameworks creates separation in the overall philosophies towards software development within a project. Also, it has been observed that requirements volatility may not occur homogeneously throughout a project’s lifecycle and it does not affect all parts of a system’s development in a uniform way (Banker and Slaughter 2000; Barry et al. 2006). The heterogeneous patterns of requirements volatility, in turn, cause disparity in effort expenditure on the different project phases, partitioned systems parts developed during those phases, and their associated process templates. Thus, an increase in the requirements volatility of a project tends to increase the variety, separation, and disparity of processes within the project, which leads to an overall increase in software process diversity. Therefore, H1. A higher level of requirements volatility in a project is associated with a higher level of software process diversity. Design and Technology Novelty Project teams facing new software design and technologies face a steep learning curve during the development process (Kemerer 1992; Boh et al. 2007). Initially, such teams might employ agile processes with rapid iterations to gain early feedback and accelerate team learning (MacCormack et al. 2001). However, over time as the new technological features become more [13] familiar and tasks get predictable, the focus can shift to a plan-based approach that facilitates better efficiency and benefits due to scale economies of longer iterations (Banker et al. 1997). Furthermore, the use of novel design and technologies in a software project could be a significant contributor to project complexity resulting in higher levels of project management risk (Wallace et al. 2004). Normative process frameworks that imbibe an exclusive plan-based or agile paradigm advocate different approaches toward mitigating such risks. While plan-based frameworks often prescribe explicit risk management processes, risk management in agile process frameworks often remains a passive activity (Boehm 2003; Moran 2014). Higher levels of design and technological novelty present a demanding requirement on software teams to both accommodate quick iterations to facilitate effective learning and implement a planned approach to manage risks. Teams facing such challenging requirements resort to combining the attributes of multiple varieties of process frameworks as it helps them to develop ambidextrous capabilities (Napier et al. 2008; Magdaleno et al. 2012; Ramesh et al. 2012). In such a scenario, the variety of process frameworks chosen by a project team would include a number of agile-oriented process components because rapid iterations facilitated by agile processes aid efficient learning and effective client feedback during early project stages (MacCormack et al. 2001). Inclusion of agile-oriented process component in high process maturity environments, where the use of structured and plan-based approaches is the organizational norm, naturally leads to a separation of values and beliefs within a project. Furthermore, learning curve effects resulting from higher levels of design and technological novelty cause variance in the effort expended on project tasks over the lifecycle of the project (Kemerer 1992). As teams learn and get familiar with the new designs and technologies, effort required to complete project tasks tends to decrease, although the patterns of [14] such a decrease may not be uniform during the different project stages (Boh et al. 2007). This variance in effort expenditure corresponds to a variance associated with the use of different varieties of process templates during the early and late project stages. That is, there is disparity in the allocation of resources to the different varieties of process templates utilized during the various project lifecycle stages. Thus, an increase in design and technological novelty increases the variety, separation, and disparity of processes within a project and therefore, H2. A higher level of design and technological novelty in a project is associated with a higher level of software process diversity. Customer Involvement The level of customer (end-user) involvement in a project and how this influences the project’s processes and performance repeatedly came up in our discussions with team members at the research site. Prior research findings also lend strong support to a link between end-user involvement and project-level processes and outcomes. Wallace et al. (2004) categorize the lack of user involvement in a project as a significant project risk and note that such risks could contribute to project failures. Exploring customer-developer links in software projects, Keil and Carmel (1995) show that projects with a higher degree of participation from customers tend to perform better. Such project success has been attributed to the ability of software teams to match their processes to customer needs through appropriate changes to development processes (MacCormack and Verganti 2003). On the one hand, when there is a high degree of customer participation in a project, team members might be expected to more actively respond to evolving customer requirements (Subramanyam et al. 2010). On the other hand, a higher degree of customer participation might also necessitate the need for more formal communication plans, especially when there are organizational boundaries between the customer and the vendor teams (Pikkarainen et al. 2008; Ramesh et al. 2012). [15] To respond to such dual needs in managing customer involvement in a project, software teams could draw appropriate process components from multiple normative frameworks for their projects. As highlighted in prior research, a higher degree of customer involvement positively influences a project team’s orientation towards selecting more agile process components (Boehm and Turner 2003; Ramasubbu and Balan 2009). Naturally, in the context of custom software development executed by high process maturity firms, this leads to a situation where a software team has to grapple with separate value systems enshrined in the different varieties of process templates used in the project. Furthermore, the degree of client involvement in a project may not be uniform throughout the different phases of a software project (Subramanyam et al. 2010). There are also variations in the expectations of different end-users of a customer firm with respect to the formalism required in project-level communications and the corresponding coordination mechanisms (Nidumolu 1995; Andres and Zmud 2002). These variations result in overall heterogeneity in effort expenditures across formal (documents, contracts, etc.) and informal (mutual adjustments, informal interaction, etc.) coordination schemes. In turn, these would cause a corresponding disparity in the effort allocation to the different KPAs belonging to the plan-based and agile process templates that respectively facilitate formal and informal coordination. Thus, we expect the degree of customer involvement to positively influence the variety, separation, and disparity of processes of a project team. Therefore, H3. A higher level of customer involvement in a software project is associated with a higher level of software process diversity. Process Compliance Process compliance mechanisms are procedures enacted to ensure the fidelity of the software design processes to the selected process frameworks (such as adherence of the team to the normative prescriptions of the CMMI framework). Process compliance is typically enforced [16] by quality control groups, charged with the responsibility of auditing and evaluating adherence to quality metrics including the normative prescriptions for process design and documentation (Ogasawara et al. 2006; Ramasubbu 2014). In high process maturity environments, project teams are expected to report all process tailoring activities, and they are monitored and evaluated through internal audits and related quality assurance activities. Thus, process compliance efforts contribute to an indirect selection mechanism wherein a deliberate investment is made to monitor the project-level processes and assess their fit with the overall project and firm context. They act as a stabilizing force that tends to limit process diversity by blocking process variations that are deemed unfit, unnecessary, or non-compliant with firm standards, as evaluated by the independent quality assurance personnel. Apart from pruning project-level process variations, higher levels of process compliance enforcement can also provide learning opportunities for reconciling disparate values among project members (Ramasubbu et al. 2008). This can result in project teams utilizing more cohesive process components that are not too distinct in their underlying value attributes. Also, with a higher level of process compliance, process components that do not receive significant levels of resource commitments from the project team could be identified as potentially less useful variations that can be eliminated without significantly impacting project outcomes. Thus, we expect process compliance to act as a countervailing force to software process diversity by reducing the variety, separation, and disparity of processes in a software project. Hence, H4: A higher level of process compliance effort in a software project is associated with a lower level of software process diversity. Fit Between Process Diversity and Process Compliance The discussion up to this point has focused on examining the project-level contingencies that increases software process diversity and the role of process compliance in reining in process [17] diversity. In this section, we examine the fit (or match) between process diversity and process compliance and examine their joint effects on overall project performance. Following wellestablished protocols in prior literature for measuring software project performance (e.g., Krishnan et al 2000; Harter et al 2000; Ramasubbu et al. 2008), we conceptualize project performance along the two dimensions of development productivity of a project team and the conformance quality in the software code delivered by the project team. Development productivity refers to the efficiency of a project team in developing and delivering software code using resources available to the team (Krishnan et al. 2000). When lower levels of process diversity in a project are matched with a high degree of process compliance investments, it results in suboptimal use of organizational resources. The excessive compliance efforts in the above scenario could have otherwise been used for core project tasks such as software development and verification. Similarly, when a project team is subjected to lower level of investments in organizational process compliance, but operates using a higher level of process diversity, there is a mismatch and a negative impact on productivity. This is because insufficient process compliance efforts often lead to the propagation of suboptimal or bad practices that cause rework during the late stages of a project (Stamelos 2010). The costs of such rework are difficult to contain because of complex dependencies that cause ripple effects through all parts of the software system that is being developed (Mookerjee and Chiang 2002). Such additional expenditures due to rework ripples dent the overall development productivity of a project. Similarly, when higher levels of process diversity are met with lower levels of process compliance efforts, there are insufficient resources to detect software errors committed during development (i.e., lower levels of conformance quality). Such undetected development errors are likely to be reported by customers after the delivery of software code, for example, during [18] acceptance testing. Rectifying software errors after delivery is challenging and leads to an overall increase in project rework and cost of quality (Harter et al. 2000). In contrast, a good fit between process diversity and process compliance enables a project team to optimally balance the increased flexibility resulting from the use of multiple process frameworks and the rigor needed to detect and rectify software development errors before delivery. Such an optimal balance has been reported to engender process-based learning in software development that helps teams to realize improvements in productivity and reduce the number of defects delivered to customers (Ramasubbu et al. 2008; Subramanyam et al. 2012). A good fit between process diversity and process compliance also leads to the development of coevolutionary change mechanisms that help project teams adapt to uncertain business situations in an efficient way (Volberda and Lewin 2003; Vidgen and Wang 2009). Thus, a better fit between process diversity and process compliance endows project teams with capabilities that help them cope with project contingencies in an efficient way and reduce defects (or improve quality) through improved learning and effective quality control mechanisms. Therefore, our final set of hypothesis is: H5a: A higher degree of fit between process diversity and process compliance in a software project is associated with a higher level of project productivity. H5b: A higher degree of fit between process diversity and process compliance in a software project is associated with a higher level of software quality. ANALYSIS AND RESULTS Data and Variables We collected data from 410 commercial software projects completed by a multinational software vendor firm in a recent two year period. The data had been verified multiple times by the firm’s external auditors for quality certification purposes (CMMI level-5 compliance and IEEE SPI award). Thus, we were able to utilize a unique and highly reliable data for our analysis. [19] Process Diversity: As noted earlier, we consider a KPA as the fundamental unit of a software process design. At our research site, a majority of the software development centers used the 22 KPAs prescribed for CMMI level-54 development operations. Other normative process frameworks that project teams subscribed to during the time period of this study were IBM’s Rational Unified Process (RUP), Agile RUP, Scrum, and Extreme Programming (XP). The baseline process templates for all of these five normative process frameworks were standardized and controlled by the firm’s centralized SEPG. Individual projects were allowed to implement all or a subset of the five process templates for their specific use. Therefore, software teams had the flexibility to both choose a set of relevant process templates for their project and design the spread of KPAs across the process templates, which resulted in project-specific customizations of plan-based and agile frameworks. To be able to monitor and control such customized processes through uniform metrics, the firm’s SEPG teams mapped the KPAs of the normative process frameworks under a seamless and uniform process compliance framework5. The project-level process customizations and the spread of KPAs to the different process templates formed the basis for the measurement of the process diversity construct. For each of the KPAs implemented in a project, we observed the membership of the KPA to the corresponding process template and traced its use throughout the project’s lifecycle. Then, we calculated the separation, variety, and disparity process diversity scores for each project. The separation dimension was derived using a standard deviation-based measurement scheme. Assigning an agile score for each KPA of a project (1 if the KPA belongs to an agile process template, 0 otherwise), the separation dimension of process diversity is derived as: 4 CMMI is an integrated process improvement framework developed by the Software Engineering Institute at the Carnegie Mellon University. Level-5 of the CMMI is the highest maturity level indicating quantitatively controlled and well-optimized processes. 5 A generalized example of such a mapping of CMM KPAs and Extreme Programming framework can be found in Paulk (2001). [20] 𝑆𝑒𝑝𝑎𝑟𝑎𝑡𝑖𝑜𝑛 = √∑𝑠𝑖=1 (𝑎𝑔𝑖𝑙𝑒𝑠𝑐𝑜𝑟𝑒𝑖 −𝑎𝑔𝑖𝑙𝑒𝑠𝑐𝑜𝑟𝑒𝑚𝑒𝑎𝑛 )2 𝑠 where, a project uses s KPAs belonging to process templates derived from either a planbased normative framework (in which case the agile score=0) or an agile-based process framework (agile score=1). For example, consider a scenario where three different projects use 22 KPAs each for software development; project-1 uses only CMMI; project-2 implements 12 KPAs using CMMI and 10 KPAs using RUP; and project-3 uses CMMI for 12 KPAs and SCRUM for 10 KPAs. The separation diversity score for both project-1 and project-2 would be zero as there is no separation among the KPAs in these projects (they all belong to plan-based process frameworks, either CMMI or RUP). In contrast, for project-3 the separation score is 0.4986, indicating the presence of a plan-based (CMMI) and agile (SCRUM) process separation among the KPAs of the project. The variety dimension of diversity has been traditionally measured using the Blau’s index (Harrison and Klein 2007; Gibbs and Martin 1962), which we adapted to the context of software process diversity as follows: 𝑣 𝑉𝑎𝑟𝑖𝑒𝑡𝑦 = 1 − ∑ 𝑝𝑖 2 𝑖=0 where, pi would be the proportion of the s KPAs that belong to the v variety of process templates. Consider the previous example scenario where three different projects use 22 KPAs each for software development; project-1 uses only CMMI; project-2 implements 12 KPAs using CMMI and 10 KPAs using RUP; and project-3 uses CMMI for 12 KPAs and SCRUM for 10 KPAs. As explained above, the separation diversity scores for projects-1, 2, and 3 would be 0, 0, and 0.498 respectively, which captures the separation of KPAs into plan-based and agile 6 The mean agile score for project-3 is 0.45 and the overall separation score is the standard deviation of the agile scores (10 counts of 1 and 12 counts of 0, yielding a standard deviation of 0.498). [21] categories. On the other hand, the variety diversity scores for the projects1, 2, and 3 would be 0, 0.496, and 0.496 respectively7, which captures the different patterns of spread of KPAs across different process templates, but unlike the separation diversity score, it does not explicitly capture the separation of plan-based KPAs and agile KPAs. Disparity dimension of diversity has been typically measured using a coefficient of variation (Harrison and Klein 2007), which we adapted to the context of this study as follows: 2 √∑𝑣𝑖=1 (𝑒𝑓𝑓𝑜𝑟𝑡𝑖 − 𝑒𝑓𝑓𝑜𝑟𝑡𝑚𝑒𝑎𝑛 ) 𝑣 𝐷𝑖𝑠𝑝𝑎𝑟𝑖𝑡𝑦 = 𝑒𝑓𝑓𝑜𝑟𝑡𝑚𝑒𝑎𝑛 where, efforti is the percentage of total project effort spent on KPAs belonging to a v variety of process templates. Expanding the previous example scenario where three different projects used 22 KPAs each for software development, let us say project-1 uses only CMMI and allocates 100% of its effort to it; project-2 implements 12 KPAs using CMMI and 10 KPAs using RUP, and allocates 65% of project effort to CMMI KPAs and the rest 35% to RUP KPAs; and project-3 uses CMMI for 12 KPAs and SCRUM for 10 KPAs, and allocates 70% of project effort to the CMMI KPAs and the rest 30% to the RUP KPAs. As discussed before, the separation diversity scores for the projects1-3 are 0, 0, and 0.498 respectively; the corresponding variety diversity scores are 0, 0.496, and 0.496. The disparity scores for the projects1-3 are 0, 0.424, and 0.566 respectively8, which capture the differences in the effort allocation between the different varieties of process frameworks used in the projects. Process Compliance: Process compliance efforts in a project involve the monitoring, assessment, and auditing of process engineering activities in a project. The process compliance personnel at our research site reported to both the project manager of a software team as well as 7 Project-1 variety score = (1-1)=0); project-2 variety score = 1-(12/22)2-(10/22)2=0.496; project-3 variety score=1(12/22)2-(10/22)2=0.496. 8 Project-1 disparity score = √((100-100)2/1)/100=0; project-2 disparity score = √(((65-50)2+(35-50)2)/)2)/50=0.424; project-3 disparity score=√(((70-50)2+(30-50)2)/)2)/50=0.566. [22] to the compliance supervisor at the SEPG. Although compliance personnel had sufficient autonomy within a software project team, executing process compliance activities required them to collaborate with individual developers. The extent of resources allocated to process compliance varied across the projects and we observed a corresponding variance in the extent to which the process compliance personnel were able to systematically monitor and assess process variants across projects. We had access to the task-level accounting and work log of all SEPG personnel participating in a software project, and we were able to identify and trace the overall process compliance effort expended in a project. Similar to prior research where investments in quality management processes where measured as a percentage of total project effort (Ramasubbu et al. 2008), we derived the process compliance variable as the percentage of total project effort spent on process compliance activities. Fit between Process Diversity and Process Compliance: To derive the fit variable, we follow the “fit as matching” perspective developed in prior literature (cf. Venkatraman 1989; Tang and Rai 2014). Fit as matching technique enables us to derive the match between process diversity and process compliance without reference to an external criterion variable (such as project performance). The criterion-independent matching perspective is particularly apt for our study because process diversity and process compliance efforts are primarily influenced by different and independent actors in a project who have different goals and incentives. While process diversity is driven by project-level contingencies faced by software teams, process compliance efforts are driven by standards mandated at the organizational level that are enforced by central SEPG agents. We utilized the deviation score and residual score approaches to measure the match between process diversity and process compliance (cf. Venkatraman 1989). In the deviation [23] score approach, misfit (or mismatch) is derived as the absolute difference between the standardized scores of process diversity and process compliance variables. Inversing the sign of the misfit variable obtained from the deviation score approach reflects fit, and is used for easier interpretation of the regression coefficients. In the residual score approach, we derive the fit variable using the residuals from the regression of process compliance on process diversity. To verify the robustness of results, we also used the residuals from the regression of process diversity on process compliance to derive the fit variable as recommended in the literature (cf. Dewar and Werbel 1979). Project performance: The dependent construct in our model, project performance, is measured using two variables, namely, software productivity and quality. To derive the productivity variable, we first measured project size using function points, which is a programming language-independent measure of software functionality (Kemerer 1993). Then, we calculated productivity as an efficiency measure by treating the total function points produced by a software team as the output of a project and total project effort as the input. Similar to prior research, we utilized the log transformed productivity variable for the regression estimations (Harter et al. 2000; Krishnan et al. 2000; Ramasubbu et al. 2008). We derived the second performance measure, software quality, as the inverse of the total number of unique software defects reported by customers (Subramanyam and Krishnan 2003). Requirements Volatility: This variable measures the extent to which requirements changes from customers induced rework in a software project. We calculated requirements volatility as the percentage of effort spent on rework due to change in customer requirements, holding the planned development effort before the change occurred as the baseline. Design and Technology Novelty: The extent to which the software design and [24] technology involved in a project was new to the project team is self-reported by project managers and programmers using a questionnaire adapted from Takeishi (2002). We sought at least two survey responses from each project team, one from a manager and the other from a technical team member. The survey asked the participants to rate the extent to which their project involved “design newness” and familiarity with the technology used to implement the designs. The responses were measured using a 0-100 point scale with ranges from old design (0%), some modifications to old design (less than 30%), to radically different than prior designs (100%). Similarly, technological familiarity was measured using scales that ranged from completely familiar to old technologies used (0%), to completely new and unfamiliar technology (100%). The responses to the design newness and technology familiarity items were highly correlated (0.94), and we took an average of those item scores to calculate the value of design and technology novelty in a project. Customer Involvement: We calculated the extent of customer involvement in a project as the percentage of total project effort spent by a software team in engaging with end-users. We systematically parsed the daily time logs submitted by software project members that were utilized for billing and cost accounting purposes of the firm to identify the time allocation of individual team members for client-facing activities. Then, we aggregated the total time spent on these client-facing activities at the project level. We also identified and accounted for the presence of clients in team meetings, peer reviews, and quality inspection meetings that were not specifically reported as client-facing activities in the time logs by matching the meeting participant logs with the list of project personnel we obtained from project managers. Control Variables: As mentioned before, we used software code size measured using Function Points to derive the productivity variable. Similar to prior research, we used log- [25] transformed code size in the regression analysis as a control variable (Harter et al. 2000; Krishnan et al. 2000). We utilize the full-time equivalent count of personnel involved in a project as the team size control variable to account for the extent of coordination and administration needs of the project. Since the cumulative experience of a project team could potentially influence the overall project performance (Boh et al. 2007), we included the average professional work experience of the project team (in years) in the regression models. Finally, some project managers at our research site had obtained professional certifications on specific normative process frameworks (e.g., certified Scrum Master). To account for this difference between the managers, we included a categorical control variable in the models, coded as 1 if a project manager possessed any professional certifications and as 0 otherwise. Estimation and Results The functional forms of the various relationships embedded in the conceptual model (Figure 1) are shown in equations 1-3. Equation 1 shows that process diversity within a project is a function of project-specific conditions and process compliance. Equations 2 and 3 indicate that the project performance outcomes, productivity and quality, are a function of fit between process diversity and process compliance after controlling for other project variables. To establish the robustness and validity of the results using the fit as matching perspective, original process diversity and process compliance variables are also included in equations 2 and 3 apart from the match variable derived from these individual components. We also included the absolute level of agile process KPAs used in a project in equations 2 and 3 to control for an alternate explanation that process agility might drive performance9. 9 We thank an anonymous reviewer for this suggestion. We measured the agile KPA score control variable as the percentage of total KPAs of project implemented using agile process frameworks. [26] Process diversity = 0 + 1*(process compliance) + 2*(requirements volatility) + 3*(design and technology novelty) + 4*(customer involvement) + 5*(team size) + 6*(team experience) + 7*(code size) + 8*(project manager certification) + ε Eq(1) Productivity = α0 + α1*(fit between process diversity and process compliance) + α2*(process diversity) + α3* (process compliance) + α4* (agile KPA score) + α5*(requirements volatility)+ α6*(design and technology novelty) + α7*(customer involvement) + α8*(team size) + α9*(team experience) + α10*(code size) + α11*(project manager certification) + µ Eq(2) = ϒ0 + ϒ1*(fit between process diversity and process compliance) + ϒ2*(process diversity) + ϒ3* (process compliance) + ϒ4* (agile KPA score) + ϒ6*(requirements volatility) + ϒ6*(design and technology novelty) + ϒ7*(customer involvement) + ϒ8*(team size) + ϒ9*(team experience) + ϒ10*(code size) + ϒ11*(project manager certification) + ζ Eq(3) Quality Before estimating the regression equations, we examined the empirical relationship between the three process diversity scores, namely, separation, variety, and disparity scores. Pairwise correlation between the three scores (shown in Table 2) revealed a high degree of correlation (at p<0.01) between them. Table 2. Correlation between Variety, Separation, and Disparity Scores Diversity Score Separation Variety Disparity 1 2 3 1 1.00 0.79 0.78 2 3 1.00 0.80 1.00 We examined the covariance patterns between the three diversity scores in our sample and used a series of sphericity tests and confirmed that their covariance patterns were similar. The high correlation and similar covariance structures between the three diversity scores precluded us from differentiating the distinct effects of separation, variety, and disparity dimensions in our analysis. One reason for such a high correlation between the different diversity scores could be because all the projects at our research site during our observation period existed [27] in a CMMI-level 5 organizational environment and moved towards higher levels of process diversity from that baseline. So project-level variations that caused process variety also simultaneously caused a separation of KPAs into plan-based and agile frameworks in a project. Further, the effort allocation across the different varieties of process templates followed the same pattern as the proportion of KPAs allocated to the different varieties of process templates in the project. Therefore, we are not able to sufficiently tease out the differences between the separation, variety, and disparity dimensions of software process diversity using our empirical data. As a result, we only infer our results using each of the separation, variety, and disparity scores individually and mutually exclusively in the regressions. Results were similar across the models where the separation, variety, and disparity scores were separately used as the process diversity variable. Also, the process diversity variable derived as a linear combination (additive, average, etc.) of the separation, variety, and disparity scores yielded similar results10. The summary statistics and correlations between the variables utilized in the regression models are presented in Tables 3 and 4 respectively. We note that the fit variables derived using the deviation score and the residual score approaches are highly correlated with each other (0.83) as expected. However, the fit variables have relatively lower levels of correlation with the individual components that are used to derive them (process diversity and process compliance), which indicates a good level of discriminant validity for them. As our model specification contained three linear equations (equations 1-3) with potential contemporaneous cross-equation error correlations, we use seemingly unrelated regression (SUR) to estimate the model (Zellner 1962). We tested for endogeneity in the system of equations using Durbin-Wu-Hausman test (Davidson and MacKinnon 1993, pp.237-242). 10 We thank the review team for suggesting the different ways of deriving a process diversity variable to be used in the regression models. [28] Table 3. Summary Statistics (N=410) Variable Mean Std. Dev. Min Max Productivity 0.16 0.26 0.01 3.37 Quality 0.02 0.03 0.71*10-3 0.28 Process diversity† 0.28 0.26 0.00 0.91 Process compliance 0.16 0.11 0.01 0.42 Fit between process diversity and process compliance (deviation score) -1.12 0.87 -3.12 -0.01 Fit between process diversity and process compliance (residual score) 0.03 1.17 -2.15 2.53 Agile KPAs score 27.14 24.67 2.27 41.54 Requirements volatility 15.58 22.27 0.00 275.05 Design and technology novelty 35.00 48.00 0.00 100.00 Customer involvement 16.75 11.31 0.00 100.00 Team size 10.86 10.48 2.00 116.00 Team experience 3.81 2.26 0.19 21.86 Code size 1467.34 2645.18 25.94 32767.00 Project manager certification 0.45 0.50 0.00 1.00 Note:† Disparity process diversity score used in regression models; results are similar for the use of separation and variety process diversity scores. Table 4. Correlations (N=410) Variable Productivity Quality Process † diversity Process compliance Fit (deviation) Fit (residual) Agile KPA score Requirements volatility Design and technology novelty Customer involvement Team size Team experience Code size Project manager certification 1 2 3 4 5 6 7 8 0.22 0.37 1.00 0.54 0.51 0.25 0.04 1.00 -0.12 0.41 0.49 0.52 0.40 0.02 1.00 -0.07 -0.01 -0.15 -0.23 0.01 0.18 -0.18 1.00 0.01 0.03 0.06 0.01 0.07 0.12 0.19 0.17 0.03 1.00 -0.17 0.15 -0.10 -0.07 -0.02 0.21 0.01 0.17 -0.04 0.57 0.01 1.00 0.05 0.21 -0.12 0.21 0.18 0.19 0.07 0.23 0.04 0.04 0.27 0.03 1 2 1.00 0.18 1.00 3 -0.16 -0.13 1.00 4 -0.11 -0.10 -0.33 1.00 5 6 0.15 0.08 0.32 0.38 1.00 0.21 0.10 0.34 0.05 0.83 1.00 7 -0.25 -0.16 0.53 -0.18 0.31 1.00 8 -0.04 0.04 0.24 -0.11 0.27 9 0.10 0.13 0.54 -0.27 10 0.01 -0.10 0.55 11 -0.06 -0.31 -0.11 12 -0.02 0.04 13 0.47 14 0.03 9 10 11 12 13 14 1.00 Note: All pairwise correlations >0.1 or <-0.1 are significant at p<0.05; disparity process diversity score used in regression models; results are similar for the use of separation and variety process diversity scores. In all cases the Durbin-Wu-Hausman test indicated that the null hypotheses (variables are exogenous) could not be rejected, which indicates that the SUR regression results are [29] consistent11. As an additional robustness check, we also performed a two-stage least squares instrumental variable regression to test the relationship between software process diversity, productivity, and quality12. The two-stage least squares regressions yielded results consistent with SUR, lending support for the use of the SUR results for hypotheses testing. Results pertaining to the antecedents of process diversity and utilized to verify hypotheses 1-4 are presented in Table 5. In Table 6, we present results pertaining to the two project performance variables, productivity and quality, estimated using the two different ways of measuring fit between process diversity and process compliance. We see that all the models are statistically significant at <1% level and the adjusted R-squared values are indicative of good explanatory power. Post-regression diagnostics to detect outliers using Cook’s distance metric and leverage plots did not reveal any problems. The highest variance inflation factor among all the models was 2.6 and the highest condition index was 16.23, which confirm that multicollinearity issues are not of concern (Belsley et al. 2004, p. 105). Table 5. Estimation Results: Antecedents of Process Diversity† Independent Variables Effect on Process Diversity Process compliance 1 -0.087** (0.012) Requirements volatility 2 0.129*** (<0.001) Design and technology novelty 3 0.309*** (<0.001) Customer involvement 4 0.056*** (<0.001) Team size 5 -0.024*** (<0.001) Team experience 6 -0.146*** (<0.001) Code size 7 0.087*** (0.009) Project manager certification 8 0.293*** (<0.001) Intercept 9 0.352 (0.210) Sample size 410 Adjusted R-Squared 0.713 Chi-Squared 1112.20*** (<0.001) *** ** * Note: Two-tailed p-values in parenthesis; significant at <1%; significant at <5%; significant at <10%; † Disparity process diversity score used in regression model; results do not vary across the use of disparity, separation, and variety process diversity scores as well as their linear combinations. 11 Durbin-Wu-Hausman test statistics were as following for the productivity and quality equation respectively: F(1, 399)=0.63, p>F =0.427; F(1, 399)=1.02; p>F=0.312. 12 We utilized instrumental variables used in prior studies, namely, defect density of in-process defects and the ratio of upfront project investments for uniquely identifying the two-stage least square regression models (Krishnan et al. 2000; Harter et al. 2000). [30] Table 6. Estimation Results: Performance Implications Fit measured as deviation score Fit measured as residual score† (1) Effect on (2) Effect (3) Effect on (4) Effect on Independent Variables Productivity on Quality Productivity Quality Fit between process diversity and 1.152*** 0.312*** 1.14*** 0.282*** 1 process compliance (<0.001) (<0.001) (<0.001) (0.004) -0.559 -0.015 -0.309 -0.007 ‡ Process diversity 2 (0.126) (0.119) (0.282) (0.190) -0.547 -0.017 -0.208 -0.014 Process compliance 3 (0.154) (0.135) (0.171) (0.149) -0.229 -0.038 -0.149 -0.032 Agile KPA Score 4 (0.257) (0.447) (0.284) (0.453) -0.296** -0.086 -0.215** -0.054 Requirements volatility 5 (0.013) (0.168) (0.014) (0.280) -0.257*** 0.006 -0.292*** 0.003 Design and technology novelty 6 (0.003) (0.376) (<0.001) (0.497) -0.007** -0.001*** -0.006** -0.001*** Customer involvement 7 (0.026) (<0.001) (0.046) (<0.001) -0.038*** -0.005*** -0.037*** -0.006*** Team size 8 (<0.001) (<0.001) (<0.001) (<0.001) 0.013 0.002*** 0.006 0.001** Team experience 9 (0.339) (<0.001) (0.678) (0.024) 0.614*** -0.075*** 0.616*** -0.067*** Code size 10 (<0.001) (<0.001) (<0.001) (<0.001) -0.021 -0.001 -0.037 -0.005 Project manager certification 11 (0.543) (0.510) (0.499) (0.585) -5.404*** 0.114*** -6.033*** 0.174*** Intercept 12 (<0.001) (<0.001) (<0.001) (<0.001) Sample size 410 410 410 410 Adjusted R-Squared 0.605 0.251 0.582 0.243 613.34*** 136.96*** 743.55*** 129.78*** Chi-Squared (<0.001) (<0.001) (<0.001) (<0.001) *** ** * † Note: p-values in parenthesis; significant at <1%; significant at <5%; significant at <10%; Residual scores calculated from regression of process diversity on process compliance and vice versa yield consistent results. ‡ Disparity process diversity score used in regression model; results do not vary across the use of disparity, separation, and variety process diversity scores as well as their linear combinations. Referring to Table 5, we see that requirements volatility, design novelty, and customer involvement all had a positive and statistically significant effect on process diversity. Confirming hypothesis 1, the results indicate that a percentage increase in requirements volatility leads to about 13 percentage points increase in process diversity (=0.129; p<0.001). Validating hypothesis 2, we see that a unit increase in design and technology novelty score increases process diversity by about 31 percentage points (=0.309; p<0.001). As predicted by hypothesis 3, a percentage increase in customer involvement in the project increased process diversity in the [31] project by about 6 percentage points (=0.056; p<0.001). Hypothesis 4 posited that an increase in process compliance efforts in a project would be negatively associated with process diversity. Our results support this prediction and show that a unit increase in process compliance efforts decreases process diversity within a project by about 9% percentage points (=-0.087; p<0.05). Results for the other control variables show that larger teams and more experienced teams have lower levels of process diversity. In contrast, projects with a bigger code base and projects led by managers who were professionally certified in any of the five normative process frameworks adopted by the research site were associated with increased levels of software process diversity. Recall that hypotheses H5a and H5b predicted that a better fit between process diversity and process compliance efforts yield higher productivity and quality respectively. To verify this prediction, we refer to the results pertaining to columns 1-4 in Table 6. Coefficients presented in columns 1 and 2 of Table 6 pertain to the regression specifications using the fit variable derived as a deviation score. Columns 3 and 4 present the regression coefficients when an alternate residual score measure is used to derive the fit variable. Overall, the regression results are consistent and do not vary irrespective of the way the fit between process diversity and process compliance is measured. The results confirm our hypotheses that a better fit between process diversity and process compliance efforts is associated with higher levels of project performance. We see that a unit increase in the fit between process diversity and process compliance improves productivity by 1.15 units (α=1.152; p<0.001; Table 6, column 1) and increases software quality by 0.31 units (ϒ=0.312; p<0.001; Table 6, column 2). The individual, direct effects of both process diversity and process compliance on productivity and quality are not statistically significant. An important insight from this empirical result is that the fit between process diversity and process compliance, and not those mechanisms acting independently, has an impact [32] on project performance. Therefore, in order to benefit from process diversity, concomitant investments in organizational process compliance activities are necessary. Results for other control variables show that requirements volatility has a significant negative effect on productivity, but does not significantly affect quality. Based on this result we infer that project teams in our dataset encountered productivity losses for maintaining a higher level software quality when they faced client-driven requirements changes. We also find that bigger software code base and larger team size have a negative effect on project performance. Finally, we find that a higher degree of customer involvement is negatively associated with project performance. This implies that project teams we observed worked better when presented with well-specified and codified customer contracts that facilitated minimal intervention from customers. Although a higher level of customer involvement in a project is commonly expected to be positively associated with project success, prior research findings have shed light on some of the mixed effects of a high degree of customer involvement, such as the possibility of a conflict-ridden, lengthy, and less effective development process (Heinbokel et al. 1996; Subramanyam et al. 2010). It is possible that the presence of process diversity in a high process maturity environment exacerbates such negative effects of a higher degree of client involvement. Also, clients could have increased their involvement if they perceived their projects as not performing well. Beyond these speculations, we do not have a sufficient basis to tease out the causal direction of the effects of customer involvement. There is a need for further investigation of the effects of customer involvement on project performance in the presence of process diversity in high process maturity environments. Robustness Test for Group Size Effects Diversity variables operationalized to measure group-level separation, variety, and [33] disparity scores have been reported to suffer from biases when there is a large variation of group sizes in the sample (Biemann and Kearney 2010). Recall that we treat a KPA as the fundamental unit of a software process, and group size is determined by the membership of KPAs to process templates. To rule out group size-induced biases in our results, we specifically accounted for group size (number of KPAs) while deriving the variance and standard deviation scores as recommended in the literature (cf. Biemann and Kearney 2010). Regression estimates using the original and the bias-corrected process diversity scores were similar, indicating that group sizeinduced biases are not of a concern in this study13. DISCUSSION Implications for Research This study takes an important step forward in rigorously conceptualizing, measuring, and analyzing software process diversity. We have laid the groundwork for theorizing software process diversity as an outcome of choices made by a project team in response to specific contingencies faced during the lifecycle of the project. By drawing on prior work on organizational and demographic diversity (cf. Harrison and Klein 2007), we conceptualized how software process diversity can be understood not only in terms of the traditional separation of plan versus agile dichotomies (i.e., the separation dimension), but also along the variety and disparity dimensions. Even when software projects appear homogenous at a surface level classification of plan versus agile, a consideration of the additional variety and disparity dimensions might suggest that there is greater heterogeneity, such as when project teams adopt and fuse different frameworks from within the agile or within the plan-based family of process frameworks. We believe that the study has laid a good foundation to “move beyond the entrenched disagreements about planning versus agility” (Austin and Devin 2009), and has 13 We thank the Senior Editor and Associate Editor for recommending this robustness check. [34] created a theoretically well-informed and empirically verifiable framework for studying software process diversity. We have established a rigorous case for usefully combining the disparate control and flexibility-focused process frameworks that could facilitate a new generation of software process innovations. Our finding regarding the importance of a good fit between process diversity and process compliance has important implications. It suggests that as process diversity proliferates within a project, adequate and appropriate process compliance mechanisms are needed to mitigate hazards due to poor or ill-conceived process variants. This result calls for expanding the current theoretical conceptualizations of software project risk management to accommodate process variations within a project as a potential and distinct source of risk that spans both the social and technical subsystems of a project (Wallace et al. 2004; Iversen et al. 2004). The need to achieve a good fit between software process diversity and process compliance has at least two additional implications for software project management. First, it is important to understand how adequate autonomy and appropriate coordination mechanisms could be instituted between project-level personnel and centrally organized (at firm-level) compliance personnel without exacerbating the tradeoffs between efficiency and flexibility (Ramasubbu 2014; Subramanyam et al. 2012). Second, prior conceptualizations of project control (e.g., Kirsch et al. 2002; Nidumolu and Subramani 2003) need to be complemented with new mechanisms that explicitly take into consideration the effects of process diversity. We only studied the overall effort expended on process compliance, leaving open the need for further investigations of how specific portfolios of controls could be designed and implemented to regulate the fit between process diversity and process compliance. Implications for Practice An important implication for practice that stems from this research is the need to [35] judiciously manage the alignment between process diversity and process compliance in software projects. Based on our discussions with the practitioners at our research site, we provide a few implementable guidelines for software development organizations. First, development of metaroutines or problem-solving procedures that are independent of specific normative process frameworks would provide firms with an organization-wide platform for improving the efficiency of compliance mechanisms without compromising overall flexibility (Adler et al. 1999). Such meta-routines need to be enabled through appropriate infrastructural and organizational support mechanisms such as automation of process template audits and adequate “separation of concerns” between organizational-level SEPG personnel and project-level development personnel (Ramasubbu 2014). Second, we noticed that teams used scope and temporal partitioning for creating effective boundaries between the applications of different varieties of processes in their projects. The possibility of spatial partitioning, that is, the use of separate specialized units that could independently handle the distinct aspects of plan-based and agile processes were also raised during our discussions with project managers. The use of such scope, temporal, and spatial partitioning of tasks within a unit has been known to aid organizational ambidexterity (Puranam et al. 2006). In such scenarios, partitioning and switching events of a project need to be used to trigger the necessary process compliance investments. For example, whenever a software team performs process partitioning or switching, an automatic audit by SEPG could be triggered, thereby facilitating a systematic way to match the levels of process diversity and process compliance in a software project. Furthermore, process partitioning and switching milestones could be used for enrichment and learning activities such as peer-reviews, root-cause analyses, and formal training that improve software project performance (Ramasubbu et al. 2008). Thus, [36] we recommend SEPG managers to develop infrastructural capabilities that help implement mechanisms to track and trace project-level process partitioning and switching events. Finally, since our results indicated that customer involvement plays an important role in the way project teams initiate process variations, we recommend SEPG personnel to use cues from customer communication at the organizational-level (e.g., customer satisfaction surveys) to triangulate and verify the actual need to approve or block process variations. Such triangulation of customer feedback from multiple communication channels (organizational and project levels) could help process compliance personnel to identify and rectify the existence of contradictory customer policies at different levels, and, thereby, avoid unnecessary or risky process variations. Limitations and Further Research There are some limitations of this study that future research could address. First, we could not fully distinguish the unique effects of separation, variety, and disparity dimensions of software process diversity in this research. The three diversity scores were highly correlated in our dataset, and we suspect that idiosyncratic characteristics of the development environment at our research site could be a reason for this. Future research could shed light on the factors that lead to distinct effects of the separation, variety, and disparity process diversity dimensions through data gathered from a broader set of firms. Second, since we observed only custom (bespoke) software development projects, we should be cautious in generalizing our results across all types of software development projects (maintenance, reengineering, product development, etc.). The conceptual model and empirical analysis utilized in this study can be replicated in other project settings and future research could embark on the necessary comparative analyses. Third, we did not observe the long-term impacts of process diversity, and only studied its impact on immediate project performance outcomes. Further research is needed to ascertain the long-term impacts of software process diversity on learning curves and capability [37] development of project teams. Fourth, we studied only software projects that used standard process components drawn from well-established normative process frameworks. Not all software teams utilize standard process frameworks, and we need to be cautious in extrapolating the results reported in the paper to teams that use a variety of home-grown processes. Finally, the distinct coexistence of several process designs in a software production ecosystem for longer periods of time, and the way those diverse process designs coevolve and adapt to each other warrants further examination. We believe that these are fruitful lines of enquiry for future research on software process diversity. REFERENCES Adler, P.S., Goldoftas, B., and Levine, D. I., 1999. “Flexibility versus Efficiency: A case study of model changeovers in the Toyota production system,” Organization Science (10:1), pp. 43-68. Agarwal, M., and Chari, K., 2007. “Software Effort, Quality, and Cycle Time: A Study of CMM Level 5 Projects,” IEEE Transactions on Software Engineering (33:3), pp.145-156. Anderson, D. J., 2005., “Stretching Agile to Fit CMMI Level 3 – The story of Creating MSF for CMMI Process Improvement at Microsoft Corporation,” Proceedings of 2005 Agile Conference, pp. 192201. Andres, H. P., and Zmud, R. W., 2002. “A Contingency Approach to Software Project Coordination,” Journal of Management Information Systems (18:3), pp. 41-70. Austin, R. D., and Devin, L., 2009. “Weighing the Benefits and Costs of Flexibility in Making Software: Towards a Contingency Theory of The Determinants of Development Process Design,” Information Systems Research (20:3), pp. 462-477. Banker, R. D., and Slaughter, S., 1997. “A Field Study of Scale Economies in Software Maintenance,” Management Science (43:12), pp. 1709-1725. Banker, R. D., and Slaughter, S.A., 2000. “The Moderating Effects of Structure on Volatility and Complexity in Software Enhancement,” Information Systems Research (11:3), pp. 219-240. Barki, H., Rivard, S., Talbot, J., 1993. “Toward an Assessment of Software Development Risk,” Journal of Management Information Systems (10:2), pp. 203-225. Barry, E. J., Kemerer, C. F., and Slaughter, S. A., 2006. “Environmental Volatility, Development Decisions, and Software Volatility: A Longitudinal Analysis,” Management Science (52:3), pp. 448464. Beck, K., Beedle, M., van Bennekum, A., Cockburn, A., Cunnigham, W., Fowler, M., Grenning, J., et al. 2001. “Manifesto for Agile Software Development,” Accessed April 06, 2014., http://agilemanifesto.org/. [38] Bella, F., Hormann, K., and Vanamali, B., 2008. “From CMMI to SPICE-Experiences on How to Survive a SPICE Assessment Having Already Implemented CMMI,” Proceedings of the 9th International Conference on Product-Focused Software Process Improvement, pp. 133-142. Belsley. D. A., Kuh, E., and Welsch, R. E., 2004. Regression Diagnostics: Identifying Influential Data and Source of Collinearity, Hoboken, NJ: John Wiley & Sons. Begel, A., and Nagappan, N., 2007. “Usage and Perceptions of Agile Software Development in an Industrial Context: An Exploratory Study,” in Proceedings of the First International Symposium on Empirical Software Engineering and Measurement, Madrid, Spain, September 20-21. Biemann, T., and Kearney, E., 2010. “Size Does Matter: How Varying Group Sizes in a Sample Affect the Most Common Measures of Group Diversity,” Organizational Research Methods (13:3), pp. 582-599. Boehm, B., 2002. “Get Ready for Agile Methods, With Care,” IEEE Computer (35:1), pp. 64-69. Boehm, B., 2003. “Using Risk to Balance Agile and Plan-Drive Methods,” IEEE Computer (36:6), pp. 57-66. Boehm, B., and Turner, R., 2003. Balancing Agility and Discipline: A Guide for the Perplexed, AddisonWesley. Boh, W. F., Slaughter, S. A., and Espinosa, J. A., 2007. “Learning from Experience in Software Development: A Multilevel Analysis,” Management Science (53:8), pp. 1315-1331. Davidson, R., and MacKinnon, J. G., 1993. Estimation and Inference in Econometrics, New York, NY: Oxford University Press. Deck, M., 2002. “Managing Process Diversity while Improving Your Practices,” IEEE Software (18:3), pp. 21-27. Dewar, R. and Werbel, J., 1979. “Universalistic and Contingency Predictions of Employee Satisfaction and Conflict,” Administrative Science Quarterly (24: 3), pp. 426-448. Dyba, T., and Dingsoyr, T., 2008. “Empirical Studies of Agile Software Development: A Systematic Review,” Information and Software Technology (50:9-10), pp. 833-859. Ethiraj, S., Kale, P., Krishnan, M. S., Singh, J. V., 2005. “Where do Capabilities Come From and How Do They Matter? A Study in the Software Services Industry,” Strategic Management Journal (26:1), pp. 24-25. Fitzgerald, B., Hartnett, G., and Conboy, K., 2006. “Customising Agile Methods to Software Practices at Intel Shannon,” European Journal of Information Systems (15:2), pp. 197-210. Gibbs, P. J., and Martin, W. T., 1962. “Urbanization, Technology, and the Division of Labor: International Patterns,” American Sociological Review (27:5), pp. 667-677. Gopal, A., and Gao, G., 2009. “Certification in the Indian Offshore IT Services Industry,” Manufacturing and Service Operations Management (11:3), pp. 471-492. Harris, M. L., Collins, R. W., and Hevner, A. R., 2009. “Control of Flexible Software Development Under Uncertainty,” Information Systems Research (20:3), pp. 400-419. Harrison, D. A., and Klein, K. J., 2007. “What’s the Difference? Diversity Constructs as Separation, Variety, or Disparity in Organizations,” Academy of Management Review (32:4), pp. 1199-1228. [39] Harter, D., Krishnan, M. S., and Slaughter, S. A., 2000. “Effects of Process Maturity on Quality, Cycletime, and Effort in Software Product Development,” Management Science (46:4), pp. 451-466. Harter, D., Kemerer, C., and Slaughter, S. A., 2012. “Does Software Process Improvement Reduce the Severity of Defects? A Longitudinal Field Study,” IEEE Transactions on Software Engineering (38:4), pp. 810-827. Homan, A. C., van Knippenberg, D., Van Kleef, G. A., and De Dreu, C. K. W., 2007. “Bridging Faultlines by Valuing Diversity: Diversity Beliefs, Information Elaboration, and Performance in Diverse Work Groups,” Journal of Applied Psychology (92:5), pp. 1189-1199. Humphrey, W. S., 1989. Managing the Software Process. Reading, MA: Addison-Wesley IEEE SPA., 2010. IEEE Computer Society Software Process Achievement Award, http://www.computer.org/portal/web/awards/processachievement, Accessed 17 October, 2010. Iversen, J. H., Mathiassen, L., Nielsen, P. A., 2004. “Managing Risk in Software Process Improvement: An Action Research Approach,” MIS Quarterly (28:3). pp. 395-433. Jakobsen, C. R., and Johnson, K. A., 2008. “Mature Agile with a Twist of CMMI,” Proceedings of the 2008 Agile conference, pp. 212-217. Jakobsen, C. R., and Sutherland, J., 2009. “Scrum and CMMI Going from Good to Great,” Proceedings of the 2009 Agile conference, pp. 333-337. Jiang, J. J., Klein, G., Hwang, H-G., Huang, J., Hung, S-Y., 2004. “An Exploration of the Relationship between Software Development Process Maturity and Project Performance,” Information and Management (41: 3), pp. 279-288. Keil, M., and Carmel, E., 1995. “Customer-Developer Links in Software Development,” Communications of the ACM (38:5), pp. 33-44. Keil, M., Wallace, L., Turk, D., Dixon-Randall, G., and Nulden, U., 2000. “An Investigation of Risk Perception and Risk Propensity on the Decision to Continue a Software Development Project,” Journal of Systems and Software (53:2), pp. 145-157. Kemerer, C. F., 1992. “How the Learning Curve Affects CASE Tool Adoption,” IEEE Software (9:3), pp. 23-28. Kemerer, C. F., 1993. “Reliability of Function Points Measurement: A Field Experiment,” Communications of the ACM (36: 2), pp. 85-97. Kilduff, M., Angelmar, R., and Mehra, A., 1995. “Top Management Team Diversity and Firm Performance: Examining the Role of Cognitions,” Organization Science (11:1), pp. 21-34. Kirsch, L. J., Sambamurthy, V., Ko, D-G., and Purvis, R.L., 2002. “Controlling Information Systems Development Projects: The View from the Client,” Management Science (48:4), pp. 484-498. Krishnan, M. S., and Kellner, M. I., 1999. “Measuring Process Consistency: Implications for Reducing Software Defects,” IEEE Transactions on Software Engineering (25:6), pp. 800-815. Krishnan, M. S., Kriebel., C. H., Kekre, S., and Mukhopadhyay, T., 2000. “An Empirical Analysis of Productivity and Quality in Software Products,” Management Science (46:6), pp. 745-759. Lindvall, M., and Rus, I., 2000. “Process Diversity in Software Development,” IEEE Software (7:4), pp. 14-18. Lycett, M., Macredie, R.D., Patel, C., and Paul, R.,J., 2003. “Migrating Agile Methods to Standardized [40] Development Practice,” IEEE Computer (36:6), pp.79-85. MacCormack, A., Verganti, R., and Iansiti, M., 2001. “Developing Products on “Internet Time”: The Anatomy of a Flexible Development Process,” Management Science (47:1), pp. 133-150. MacCormack, A., and Verganti, R., 2003. “Managing the Sources of Uncertainty: Matching Process and Context in Software Development,” Journal of Product Innovation Management (20:3) pp. 217-232. Magdaleno, A. M., Werner, C. M. L., and Araujo, R. M., 2012. “Reconciling Software Development Models: A Quasi-Systematic Review,” Journal of Systems and Software (85:2), pp. 351-369. McGarry, F., and Decker, B., 2002. “Attaining Level 5 in CMM Process Maturity,” IEEE Software (19:6), pp. 87-96. Menon, A., Bharadwaj, S. G., Adidam, P. T., Edison, S. W., 1999. “Antecedents and Consequences of Marketing Strategy Making: A Model and a Test,” Journal of Marketing, (63: 2), pp. 18-40. Mookerjee, V., and Chiang, I. R., 2002. “A Dynamic Coordination Policy for Software System Construction,” IEEE Transactions on Software Engineering (28:7), pp. 684-694. Moran, A., 2014. “Agile Risk Management,” in Agile Risk Management, Springer Briefs in Computer Sicence, pp. 33-60. Napier, N. P., Mathiassen, L., Robey. D., 2008. “From Dichotomy to Ambidexterity: Transcending Traditions in Software Management,” Proceedings of the Americas Conference on Information Systems, August 14-17, Toronto, Canada. Nidumolu, S. R., 1995. “The Effect of Coordination and Uncertainty on Software Project Performance: Residual Performance Risk as an Intervening Variable,” Information Systems Research (6:3), pp. 191-219. Nidumolu, S. R., and Subramani M. R., 2003. “The Matrix of Control: Combining Process and Structure Approaches to Managing Software Development,” Journal of Management Information Systems (20: 3), pp. 159-196. Ogasawara, H., Ishikawa, T., and Moriya, T., 2006. “Practical Approach to Development of SPI Activities in a Large Organization: Toshiba’s SPI History since 2000,” Proceedings of the 2006 International Conference on Software Engineering, pp. 595-599. Paulk, M. C., 2001. “Extreme Programming from a CMM Perspective,” IEEE Software (18:6), pp. 19-26. Pikkarainen, M., Haikara, J., Salo, O., Abrahamasson, P., and Still, J., 2008. “The Impact of Agile Practices on Communication in Software Development,” Empirical Software Engineering (13:3), pp. 303-337. Puranam, P., Singh, H., Zollo, M., 2006. “Organizing for Innovation: Managing the CoordinationAutonomy Dilemma in Technology Acquisitions,” Academy of Management Journal (49:2), pp. 263-280. Ramesh, B., Mohan, K., and Cao, L., 2012. “Ambidexterity in Agile Distributed Development: An Empirical Investigation,” Information Systems Research, (23:2), pp.323-339. Ramasubbu, N., Mithas, S., Krishnan, M. S., and Kemerer, C. F., 2008. “Work Dispersion, Process-Based Learning, and Offshore Software Development Performance,” MIS Quarterly (32:2), pp. 437-458. Ramasubbu, N., and Balan, R. K., 2009. “The Impact of Process Choice in High Maturity Environments: An Empirical Analysis,” Proceedings of the 31st International Conference on Software Engineering, IEEE Computer Society, pp. 529-539. [41] Ramasubbu, N., 2014. “Governing Software Process Improvements in Globally Distributed Product Development,” IEEE Transactions on Software Engineering (40:3), pp. 235-250. Slaughter, S. A., Levine, L., Ramesh, B., Pries-Heje, J., and Baskerville, R., 2006. “Aligning Software Processes with Strategy,” MIS Quarterly (30:4), pp. 891-918. Stamelos, I., 2010. “Software Project Management Anti-Patterns,” Journal of Systems and Software (83:1), pp. 52-59. Staples, M., and Niazi, M., 2008. “Systematic Review of Organizational Motivations for Adopting CMMBased SPI,” Information and Software Technology (50:7-8), pp. 605-620. Subramanyam, R., and Krishnan, M.S., 2003. “Empirical analysis of CK metrics for object-oriented design complexity: Implications for software defects,” IEEE Transactions on Software Engineering, (29:4), pp. 297–310. Subramanyam, R., Weisstein, F. L., and Krishnan, M. S., 2010. “User Participation in Software Development Projects,” Communications of the ACM (53:3), pp. 137-141. Subramanyam, R., Ramasubbu, N., and Krishnan, M. S., 2012. “In Search of Efficient Flexibility: Effects of Software Component Granularity on Development Effort, Defects, and Customization Effort,” Information Systems Research (23:3), pp. 787-803. Takeishi, A., 2002. “Knowledge Partitioning in the Interfirm Division of Labor: The Case of Automotive Product Development,” Organization Science (13:3), pp. 321-338. Tang, X., and Rai, A., 2014. “How Should Process Capabilities be Combined to Leverage Supplier Relationships Competitively?” European Journal of Operational Research (239: 1), pp. 119-129. Tuli, K. R., Kohli, A. K., and Bharadwaj, S. G., 2007. “Rethinking Customer Solutions: From Product Bundles to Relational Processes,” Journal of Marketing (71: 3), pp. 1-17. Van der Pijl, G. J., Swinkles, G. J. P., and Verrijdt, J. G., 1997. “ISO 9000 versus CMM: Standardization and Certification of IS Development,” Information & Management (32:6), pp. 267-274. Venkatraman, N., 1989. “The Concept of Fit in Strategy Research: Toward Verbal and Statistical Correspondence,” The Academy of Management Review (14: 3), pp. 423-444. Vidgen, R., and Wang, X., 2009. “Coevolving Systems and the Organization of Agile Software Development,” Information Systems Research (20:3), pp. 355-376. Vinekar, V., Slinkman, C. W., and Nerur, S., 2006. “Can Agile and Traditional Systems Development Approaches Coexist? An Ambidextrous View,” Information Systems Management (23:3), pp. 31-42. Volberda, H. W., and Lewin, A. Y., 2003. “Co-evolutionary Dynamics Within and Between Firms: From Evolution to Co-evolution,” Journal of Management Studies (40:8), pp. 2111-2136. Wallace, L., Keil, M., and Rai, A., 2004. “How Software Project Risk Affects Project Performance: An Investigation of the Dimensions of Risk and an Exploratory Model,” Decision Sciences (35:2), pp. 289-321. Zellner, A., 1962. “An Efficient Method of Estimating Seemingly Unrelated Regressions and Tests for Aggregation Bias,” Journal of American Statistics Association (57), pp. 348-368. [42]
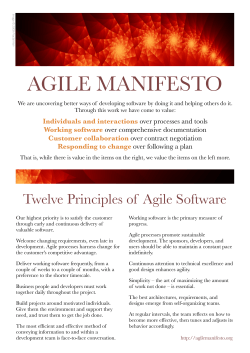

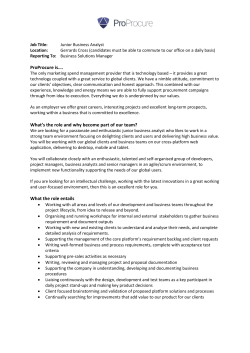

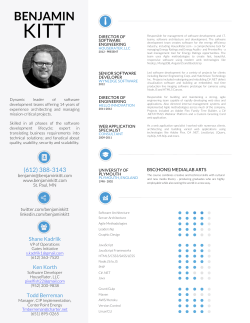
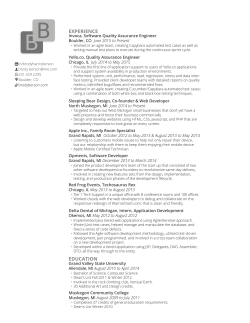
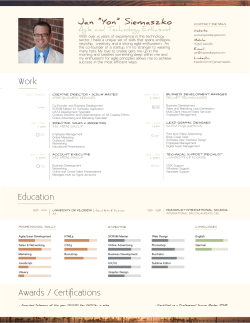


© Copyright 2026