
WING ECOMORPHOLOGY OF SEABIRDS FROM JOHNSTON ATOLL`
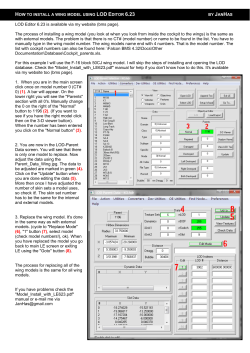
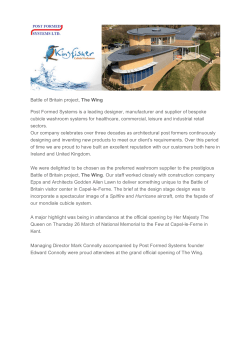
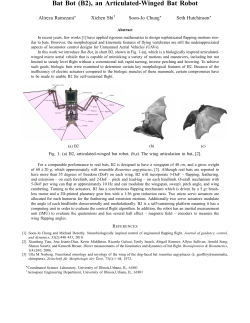
The Condor 101:549-556
? The Cooper Ornithological Society 1999
WING ECOMORPHOLOGYOF SEABIRDS FROM
JOHNSTONATOLL'
FRITzHERTEL
Departmentof Biology, Universityof California,Los Angeles, CA 90095-1606, e-mail:[email protected]
LISA T. BALLANCE
Ecology Program,NOAA,NMFS,SouthwestFisheries Science Center,8604 La Jolla Shores Drive,
La Jolla, CA 92037
Abstract. Wing morphologyof nine species of seabirdsfrom JohnstonAtoll in the central tropicalPacific was analyzed to determinehow wing size and shape correlatedwith
observed foraging behaviorand, in some species, the energetic cost of flight. Red-tailed
Tropicbirds(Phaethon rubricauda)and ChristmasShearwaters(Puffinusnativitatis)had
lower wing areas, shorterwing spans, and higher relative wing loading than would be
predictedfrom mass alone. Brown Noddies (Anousstolidus)and Red-footedBoobies (Sula
sula) had lower wing loading, Brown Boobies (Sula leucogaster)and Sooty Terns(Sterna
fuscata) had higheraspectratios,and Brown Noddies had lower aspectratiothanwould be
predictedfrom mass alone. Aspect ratioshowed greaterintraspecificvariationthanthe other
variables.In most cases, predicteddifferencesin wing morphologycorrelatedwell with
observedforagingdifferencesamongspecies, and species thatdid not differ significantlyin
body mass differed with respect to wing size and shape; these morphologicaldifferences
reflectedvarying flight and foragingbehaviors.Sooty Ternshad a higher aspect ratio and
higherwing loadingthanBrown Noddies reflectingtheirmore pelagic lifestyle, and Christmas Shearwatershad a lower aspectratioandhigherwing loadingthanWedge-tailedShearwaters(Puffinuspacificus)reflectingtheirpursuitplungingbehavior.
Keywords: ecomorphology,flight, Laridae,Phaethontidae,Procellariidae,seabirds,Sulidae, wings.
INTRODUCTION
Morphological studies usually provide important
insights into the relationship between organisms
and their ecology, because morphological structures are intimately linked to performance, and
performance determines the suite of ecological
strategies available to a species. Interspecific
variation in morphology is indicative of the different roles played by each species within a
community, however the success of characterizing these roles depends on choosing the appropriate morphological features that correspond
with the performance character of interest.
Flight is a performance parameter about
which much can be learned through the study of
ecomorphology. For almost all birds, flight is intimately linked with a suite of morphological
traits, all of which are interdependent and relatively highly constrained.
Pelagic seabirds provide an intriguing system
in which to study ecomorphological aspects of
flight. The spatial scale of pelagic systems is
large relative to terrestrial ones (McGowan and
' Received 2 July 1998. Accepted22 March 1999.
Walker 1993), and some pelagic seabird species
traverse hundreds or thousands of kilometers per
day on a regular basis in search of food (Strikwerda et al. 1986, Jouventin and Weimerskirch
1990). This is particularly true in the tropics,
where productivity is low relative to high latitudes (Ainley and Boekelheide 1993, Ballance
and Pitman 1999), and thus there should be
strong selection for flight capabilities that allow
seabirds to locate and secure prey in the face of
diminished feeding opportunities. Some tropical
seabirds such as Sooty Terns (Sterna fuscata)
and Red-footed Boobies (Sula sula) have metabolic costs of flight much lower than would be
predicted based on body mass alone (Flint and
Nagy 1984, Ballance 1995), and they exhibit behavioral adaptations that increase flight proficiency, including the use of wind as an energy
source (Pennycuick 1982, Ballance 1995, Spear
and Ainley 1997). Given these physiological and
behavioral adaptations, it is expected that morphological adaptations also exist for proficient
flight.
Warham (1977, 1996) presented data for several procellariiform species that revealed how
wing morphology reflected ecology. For exam-
[549]
This content downloaded from 130.166.34.124 on Tue, 05 May 2015 23:04:44 UTC
All use subject to JSTOR Terms and Conditions
550
FRITZ HERTEL ANDLISA T. BALLANCE
TABLE 1. Species sampledfrom JohnstonAtoll. Valuesrepresentmean ? SE. Wing loadingin Newtonsm-2.
Species
Procellariiformes
Wedge-tailedShearwater
ChristmasShearwater
Pelecaniformes
Brown Booby
MaskedBooby
Red-footedBooby
Red-tailedTropicbird
Charadriiformes
Sooty Tern
Brown Noddy
White Tern
n
Mass
(kg)
Aspect ratio
Wing loading
(N m-2)
Wing span
(m)
Wing area
(m2)
40 0.38 ? 0.01
12 0.34 ? 0.01
10.41 ? 0.06 37.94 + 0.63 1.01 ? 0.01
10.34 ? 0.78 51.51 ? 1.48 0.82 ? 0.02
0.10 ? 0.001
0.07 ? 0.001
14
7
42
15
12.14 +
12.16 +
11.43 +
10.92 +
0.19 ?
0.22 ?
0.20 ?
0.11 ?
1.26 ?
1.90 ?
1.10 ?
0.65 ?
0.06
0.06
0.02
0.02
0.13
0.29
0.09
0.08
64.06 + 2.38
84.76 3.13
54.98 ?_ 0.78
56.67 ? 1.49
1.52 ?
1.64 ?
1.50 ?
1.11 ?
0.06
0.03
0.01
0.01
0.004
0.005
0.002
0.001
27 0.20 ? 0.01 11.23 + 0.10 26.92 ? 0.39 0.90 ? 0.004 0.07 ? 0.001
30 0.19 ? 0.003 9.67 + 0.06 23.38 ? 1.89 0.85 ? 0.004 0.08 ? 0.001
2 0.11 ? 0.003 11.12 ? 0.12 23.54 ? 0.76 0.70 ? 0.001 0.04 ? 0.001
ple, diving-petrels (Pelecanoididae), which pursue prey underwater using wing propulsion,
showed convergent morphological adaptations
with auks (Alcidae), which also pursue prey underwater by using their wings. Other studies
have suggested that certain wing traits are associated with low energetic cost of flight in seabirds; Southern Giant Petrels (Macronectes giganteus) are similar in mass to some albatrosses
but have differently shaped wings and greater
flight costs (Pennycuick 1982, Obst and Nagy
1992).
Tropical seabirds must be selected for proficient flight, especially in comparison with high
latitude seabirds. They also exhibit a diversity of
flight behaviors that reflect ecological differences in searching for and acquiring prey (Ashmole
1971). In this paper we examine the wing morphology of nine seabird species in the tropical
Pacific with the premise that wing morphology
reflects these ecological differences. Morphological differences are used to make predictions
about ecology, which are based on results from
previous studies (Norberg 1985, 1989, Rayner
1988, Pennycuick 1989) and are tested by investigating what is known about the distribution
and feeding ecology of these seabirds.
METHODS
STUDY AREA AND SPECIES
Johnston Atoll, a group of four small islands
(each - 2.5 km2), is located approximately
1,200 km southwest of Hawaii in the eastern
tropical Pacific (16045'N, 16931 'W). Vegetation
consists of 3 native and 124 introduced species
(Amerson and Shelton 1976). Thirteen species
of seabirds currently breed on the atoll and 9 of
these, representing three orders and four families
of birds, were sampled for this study (Table 1).
Birds were live-captured, measured, and released unharmed within a period of 8 min. All
species were sampled during the breeding season (incubating, brooding, and/or provisioning
young). The feeding behavior of each species
was categorized based on their most typical
feeding behavior as determined by Ashmole
(1971) and from our own field observations.
DATA COLLECTION
Measurements were collected following the
methods outlined by Pennycuick (1989). Body
mass (kg), wing length (m), and wing area (m2)
were recorded for each bird. Wing length was
calculated as the rectilinear distance from the
sternum, a homologous landmark, to the tip of
the outstretched wing along the ventral surface
of the bird; wing span was thus twice the wing
length (Fig. 1). The fully outstretched wing was
traced with the wing positioned ventral side
down. This tracing (partial wing area) was later
digitized using the program SIGMASCAN (Jandel Corp., San Rafael, California) to determine
its area. The tracing was shorter than the wing
length because of the body area between the
proximal edge of the wing and sternum, known
as the root box (Pennycuick 1989). This rectangular area was quantified by multiplying the
width of the wing where it meets the body, and
the difference between the wing length and the
length of the wing tracing (Fig. 1). The root box
was added to the partial wing area, thus wing
area was twice this value (Fig. 1).
This content downloaded from 130.166.34.124 on Tue, 05 May 2015 23:04:44 UTC
All use subject to JSTOR Terms and Conditions
SEABIRDWINGECOMORPHOLOGY551
results are conductedwithin the context of seabirds.
WingLength
IN
i?
PartialWingArea
Root Box
takenof the wing.Wing
FIGURE1. Measurements
lengthmeasuredfromthe sternumto the tip of the
wing,thuswingspan= 2 X winglength.Partialwing
areacalculatedfroma tracingof the birdwing.Root
the widthof the wing
box quantified
by multiplying
whereit meetsthe body by the differencebetween
winglengthandpartialwinglength,thuswingarea=
2 X (rootbox + partialwingarea).
These data were used to calculatewing loading and aspectratio,the lattera size-independent
variablethat can contain significantinformation
(Norbergand Norberg 1988, Rayner 1988). Aspect ratio, a dimensionless number that describes the shape of the wing, was calculatedas:
wing span2/wingarea
DATAANALYSIS
No sexual distinctionwithin species was made
in these analyses either because there was no
apparentsexual dimorphismor sample sizes between known sexes were too small for statistical
analyses. To determinewhetherthere was a biased effect from species with largersample sizes, a species mean was generatedfor all variables and used in all analyses;these resultswere
compared with analyses using individual data.
Results were similarin all but one case (see below), thereforeonly results for individuals are
presented.
A Pearsoncorrelationmatrixwas generatedto
show relationshipsamong all variables. Body
size is an importantecological variable, therefore least-squares regressions of logi0-transformed variables(wing area, wing span, aspect
ratio, and relative wing loading) were used to
investigate allometric relationships between
each of these variablesand log body mass; the
mean absolute value of residuals from the regression indicatedwhich species deviated most
for each variable.Species similar in body mass
were examinedfor significantdifferencesin other variables.
Body mass, relativewing loading, and aspect
ratio were used to constructa multidimensional
morphospace,which provided a graphicalrepresentationof the relationshipsamong all species. Axes were representedas standarddeviates
of the mean value for each variable.All analyses
were done using SYSTAT(Wilkinson1988).
Higher values for this index indicate a comparatively narrowerwing, and lower values a comparativelybroaderwing.
Wing loadingdescribesthe weight (force) that
is borne per unit area of the wings, or the
amount of weight carriedby the bird's wings;
the units are in Newtons (force) m-2. It was cal- RESULTS
culated as:
AMONGVARIABLES
CORRELATIONS
statistics
for body mass and wing pabody mass X gravitationalconstant (a)/wing Summary
rameters
are
in
Table 1. Ourresultsfor the
given
area
two shearwaters agree closely with those of
Largerbirds typically have a higher wing load- Warham(1977, 1996). Analysis of individual
ing than smaller birds because of area-volume specimens showed a significant correlation
scaling relationships (Hildebrand 1988). Nor- among body mass, wing loading, aspect ratio,
berg and Norberg (1988) used relative wing wing span, and wing area (r > 0.59, P < 0.001
loading (wing loading divided by the cube root for all variables).The lowest correlationswere
of body mass) for comparisonswith geometric between aspect ratio and each of the other varsimilarityand to help account for the effects of iables (0.59 < r < 0.68). Analysis of species
body size; thus relative wing loading also was means indicateda similartrendwith one excepused in this analysis. As a group, seabirdstypi- tion, aspect ratio. Body mass, wing loading,
cally have long, narrow wings compared with wing span, and wing area were all significantly
most other birds, and so our comparisonsand correlated(r > 0.84, P < 0.001 for all vari-
This content downloaded from 130.166.34.124 on Tue, 05 May 2015 23:04:44 UTC
All use subject to JSTOR Terms and Conditions
552
FRITZ HERTEL ANDLISA T. BALLANCE
0.53X - 0.77; Fig. 2b), and with relative wing
loading (R2 = 0.35, P < 0.001; Y = 0.14X +
1.77; Fig. 2c). The exception was aspect ratio;
this relationship was not significant (R2 = 0.36,
P = 0.06; Y = 0.06 X + 1.06; Fig. 2d), and
intraspecific variation tended to be greater for
this variable than the other measures of wing
morphology.
Mean regression residuals were generally
greatest for two species, which also were farthest from the 95% confidence intervals, Redtailed Tropicbirds (Phaethon rubricauda) and
Christmas Shearwaters (Puffinus nativitatis).
Both had shorter wing spans, lower wing areas,
and higher relative wing loading than would be
predicted from mass alone (Figs. 2a-c, respectively). Brown Noddies (Anous stolidus) and
Red-footed Boobies (Sula sula) had greater negative residual values for wing loading, suggesting they have a relatively lower than predicted
wing loading (Fig. 2c). Mean residual values of
aspect ratios were most positive for Brown Boobies (Sula leucogaster) and Sooty Terns (Sterna
fuscata), suggesting higher aspect ratios (narrower wings); mean residual values were most
negative for Christmas Shearwaters and Brown
Noddies, suggesting lower aspect ratios (wider
wings) (Fig. 2d).
z
cS.1
w
o
z_ 0
-.1
-5
T
sT
.
b
-.7
w
B
o
z
N
3. -1.1':
0
0
.
T
x
s
-1.5
C
2
z
S1.8
s
0
j
S1.6
0
N
1.5
1.16
dM
S
S1.12
S1.08
-.8
-
-A
2
-2
A
D
1.04O
SPECIESSIMILARIN BODY MASS
c,
oR
X
" .96
.92
-12
-1
-.8
-A
-2
0
-.6
LOG BODYMASS (kg)
2
A
.6
FIGURE 2. Least-squaresregressionson log body
mass for seabirdspecies from JohnstonAtoll for (a)
log wing span, (b) log wing area,(c) log relativewing
loading, and (d) log aspect ratio. Letter codes: B =
Brown Booby, F = White Tern, M = Masked Booby,
N = Brown Noddy, R = Red-footed Booby, S = Sooty
Tern, T = Red-tailed Tropicbird, W = Wedge-tailed
Shearwater,X = ChristmasShearwater.
ables), however there was no significant correlation between aspect ratio and any other variable (r < 0.78, P > 0.1).
REGRESSIONSWITHLOG BODY MASS
In general, body mass was a better predictor of
wing size than wing shape. There was a significant relationship of body mass with wing span
(R2 = 0.90, P < 0.001; Y = 0.30X
2a), wing
area (R2 = 0.89,
+ 0.14; Fig.
P < 0.001; Y =
ANOVA for all species indicated two species
pairs that did not differ significantly in body
mass. Sooty Terns and Brown Noddies (hereafter, tern-noddy pair) did not show body mass
differences, but were significantly different with
respect to all wing parameters (P < 0.001 for
all values). The small sample size (n = 2) for
White Terns (Gygis alba) precluded their use for
statistical comparisons. Wedge-tailed Shearwaters (Puffinus pacificus) and Christmas Shearwaters also did not differ in body mass but
showed significant differences for all wing parameters (P < 0.001) with the exception of aspect ratio (P > 0.5).
GROUPDIVERSITY
A three-dimensional plot of body mass, aspect
ratio, and relative wing loading depicted how
species segregated along these axes (Fig. 3). A
nested ANOVA showed significant differences
at the family and genus level for each variable;
boobies and tropicbirds (Pelecaniformes) had
greater values for all three variables, terns
This content downloaded from 130.166.34.124 on Tue, 05 May 2015 23:04:44 UTC
All use subject to JSTOR Terms and Conditions
SEABIRDWING ECOMORPHOLOGY 553
aspect ratio and each of the other variables is
partly a result of it being a dimensionless number in which the effect of size has been minimized. The coefficient of variation for aspect ratio was greater than for any other variable and
in all species. As mentioned previously, size-independent variables are important for illustrating
adaptive significance (Norberg and Norberg
1988, Rayner 1988), thus particular attention is
given to aspect ratio. With respect to our study,
the intraspecific variation in aspect ratio suggests fewer constraints on this variable than other parameters of wing morphology.
2
1B
0
-2
212 -1
---1
1Loading
wn
tRelat're
FIGURE 3. Three-dimensional morphospace for
body mass, relativewing loading, and aspectratiofor
seabird species from JohnstonAtoll. Axes plotted as
standarddeviates of the mean value for each index.
Lettercodes as in Figure2. Pelecaniformes(B, M, R,
T) had greatervalues for all three variables,Charadriiformes (F, N, S) showed the converse, and Procellariiformes(W, X) had intermediatevalues except for
aspect ratio, which was similarto Charadriiformes.
(Charadriiformes) showed the converse, and
shearwaters (Procellariiformes) had intermediate
values except for aspect ratio, which was similar
to terns (Table 1, Fig. 3).
DISCUSSION
BODY SIZE
Not surprisingly, variables with the highest correlations among each other reflected some measure of size: wing span, wing area, body mass,
and to a lesser extent wing loading. Body size
is an important determinant of feeding flock
composition in the tropical Pacific, particularly
in flocks in which boobies were the numerically
dominant species (Ballance et al. 1997). Larger
body size was important for gaining access to
prey while potentially excluding others from the
same. In addition, Brown Boobies and Masked
Boobies (Sula dactylatra) typically feed by
plunge diving, where they enter the water, often
from great heights, to seize prey below the surface (Ashmole 1971, Hoyo et al. 1992, Ballance
et al. 1997). Masked Boobies are the largest
boobies and their size allows them to plunge
deeper than Brown Boobies, providing access to
prey potentially unavailable to a smaller species.
The comparatively low correlations between
MORPHOLOGICAL
PREDICTIONSOF
ECOLOGY
Results from empirical and theoretical research
designed to determine general relationships between wing morphology and flight performance
can be used in this particular study to predict
ecology from morphology. For example, aspect
ratio might be used as a predictor of distance
traveled when foraging; the more far-ranging the
species, the higher the aspect ratio (Norberg
1985, Rayner 1988). This relationship is exemplified by albatrosses, among the most far-ranging of seabirds (Jouventin and Weimerskirch
1990) and those with the highest aspect ratios
(Hildebrand 1988, Warham 1996).
Similarly, wing loading might be used as a
predictor of distance traveled when foraging because the energetic cost of flight is likely to be
positively correlated with wing loading. For example, Obst and Nagy (1992) found that Southern Giant Petrels (Macronectes giganteus) had
greater flight costs, higher wing loading, and
lower aspect ratio than several albatrosses of
similar mass; the former regularly feed on shore
or in nearshore waters, whereas the latter rarely
do so (Harrison 1983, Hoyo et al. 1992).
A third prediction is that wing loading will be
negatively correlated with glide/flight speed
(Pennycuick 1989). Thus, we would predict that
only those species with relatively low wing
loading will be able to utilize foraging strategies
that require low flight speeds. This would be especially important in tropical regions where
wind speeds are typically lower compared with
winds at higher latitudes.
Tern-noddy pair. The tern-noddy pair did not
differ significantly in body mass, yet they differed significantly in all wing parameters measured. Sooty Terns had a higher aspect ratio,
This content downloaded from 130.166.34.124 on Tue, 05 May 2015 23:04:44 UTC
All use subject to JSTOR Terms and Conditions
554
FRITZHERTELANDLISA T. BALLANCE
greaterwing loading, and longer wing span (Table 1). Therefore,we expect them to have lower
flight costs, range fartherto forage, and fly at
greaterspeeds than Brown Noddies.
These predictions are largely supportedby
distributionalpatterns.Sooty Terns forage over
great distances (80-500 km) and remain at sea
for months to years, rarelyresting on the water
(Pitman1986, Flint 1991). In the easterntropical
Pacific, they are found in greatestabundancein
areasof low productivity(Ballance et al. 1997).
Thus we expect that selection for proficientlocomotion would be strong in this species, and
indeed Sooty Ternshave flightcosts much lower
than would be predictedfrom mass alone (Flint
and Nagy 1984). These differences were believed to be due largely to wing morphology,in
a manner consistent with the results presented
here. In contrast,Brown Noddies forage closer
to shore and usually returnto land to roost at
night (Ashmole 1968). To our knowledge, flight
costs for this species have not been quantified,
but it would seem that selection for low flight
cost, and associated wing morphology, would
not be as strongas for the more widely foraging
Sooty Tern.
Shearwaters. The two shearwatersalso did
not differ significantlyin body mass, but they
differed significantly in most wing measurements. Wedge-tailed Shearwaters had greater
wing span, greaterwing area, and lower wing
loading than ChristmasShearwaters,but were
similarin aspect ratio;the latterspecies fell notably below the regression for wing span and
wing area, and above that for wing loading
(Figs. 2a-c, respectively). Accordingly, one
might predict that Wedge-tailed Shearwaters
would have slower flight speeds, and increased
maneuverabilityat such speeds, both resulting
from low wing loadings (Norberg1985, Rayner
1988). Additionally,because the power required
for flightcan be reducedby combininglow wing
loadingwith high aspectratio(Rayner1988), we
expect flight costs would be lower for Wedgetailed than for ChristmasShearwaters.
These predictions are difficult to test, given
our lack of knowledge about the at-sea ecology
of shearwaters, particularlyChristmas Shearwaters.Both species forage far from shore (Harrison 1983, Pitman 1986) and both commonly
feed in flocks in association with subsurface
predators(Ballanceet al. 1997). We suspectthat
the morphologicaldifferencesbetween them re-
flect differencesin feeding behavior.For example, Wedge-tailedShearwatersareknownto pursue prey aerially (Ballance 1993), whereas
ChristmasShearwatershave not been recorded
to do so. Christmas Shearwatersalso pursuit
dive (underwaterflight)more frequentlythando
Wedge-tailedShearwaters(Ashmole 1971), so a
higher wing loading (smaller wing area) might
reflect this behavior given the greaterforce requiredto move the wings throughwaterrelative
to air. In supportof this idea, a relatively high
wing loadingwas reportedfor diving-petrelsand
alcids, both of which use wing propulsionunderwater to pursue their prey (Warham1977,
1996). More informationis needed on the energetics and feeding behavior of these shearwaters.
Boobies. The threebooby species differedsignificantly in body mass, however Red-footed
and Brown Boobies differed only slightly. Redfooted Boobies had a significantlylower aspect
ratio and wing loading than the other two species, wing loading being anomalouslylow (Fig.
2c). We would thereforepredictthat Red-footed
Boobies would have a lower cost of flight and
would not forage as widely as Brown Boobies.
These predictions appear to be only partly
supported. Red-footed Boobies forage over
much greaterdistancesthanBrown Boobies, the
latterforagingin more nearshorewaters(Pitman
1986, Hoyo et al. 1992). For Red-footed Boobies, Ballance (1995) found their measuredcost
of flight well below that predictedby aerodynamictheory for a bird of their size. Differences
in aspectratiomay be explained,in part,through
differences in feeding behavior.Whereas most
boobies use plunge-diving (Ashmole 1971,
Hoyo et al. 1992, Ballance et al. 1997), Redfooted Boobies in the tropicalPacific also feed
by pursuingand capturingflying fish in the air
(Ballance 1993). This behavior requires quick
maneuvering, and presumably,a low cost of
flight. Relatively short,narrowwings would be
advantageousfor quick maneuvering (Rayner
1988) but precisely how this relates to aspect
ratio requires furtherinvestigation.Red-footed
Booby wings may representa compromisebetween selection for a low cost of flight/wideforaging range (higher aspect ratio), and an aerial
pursuitpredatorybehavior (lower aspect ratio).
More behavioraldata in otherregions and more
sulid species are needed to resolve this relationship.
This content downloaded from 130.166.34.124 on Tue, 05 May 2015 23:04:44 UTC
All use subject to JSTOR Terms and Conditions
SEABIRD WING ECOMORPHOLOGY
Tropicbirds. Red-tailed Tropicbirds had shorter wing span, lower wing area, and greater wing
loading (Figs. 2a-c, respectively) than predicted
based on body mass; aspect ratio was slightly
lower than expected (Fig. 2d). This morphology
predicts that flight speed and cost of flight would
be high (Norberg 1985, Rayner 1988).
Red-tailed Tropicbirds travel great distances
(200-500 km) when foraging (Pitman 1986,
Schreiber and Schreiber 1993), but not much is
known regarding their foraging ecology other
than that they are typically plunge divers (Ashmole 1971, Hoyo et al. 1992, Schreiber and
Schreiber 1993). It seems paradoxical that a pelagic feeder would have morphological features
resulting in high cost of flight, although feeding
areas that are predictable in space and time
might explain this wing morphology and consequent performance traits. Red-tailed Tropicbirds rarely feed in flocks in association with
subsurface predators (Schreiber and Schreiber
1993, Ballance et al. 1997), despite the fact that
this is a prevalent foraging strategy for many
tropical seabird species (Au and Perryman 1985,
Au and Pitman 1986). Flock feeding requires the
ability to hover in order to gain access to the
rapidly moving areas at the water surface where
prey is available, and maneuverability in order
to avoid collisions with the numerous other birds
feeding in close proximity. Low wing area, short
wing span, and high wing loading are not features that permit the slow flight necessary for
such maneuverability. Further investigation of
tropicbird feeding behavior and energetic consequences is needed.
GROUPDIVERSITY
Before making valid functional comparisons or
interpretations across taxa, differences in phylogeny should be accounted for, and methods
have been developed to help account for these
differences (Felsenstein 1985, Gittleman and
Kot 1990, Hertel and Lehman 1998). Results
from the three-dimensional group analysis (Fig.
3) suggest there is a phylogenetic component
that needs to be addressed; this will be done in
the future by the inclusion of more species and
by comparing seabirds from Johnston Atoll with
other pelagic groups in the eastern tropical Pacific.
FUTURECONSIDERATIONS
Organisms sometimes are assumed to be optimally adapted to their environment. However,
555
any particular trait is likely to be suboptimal
when viewed in only one context; animals probably exhibit some combination of morphological
traits that potentially reflect a compromise for
multiple functions. An example is the Red-footed Booby; this species is highly pelagic, a niche
that would select for high aspect ratio, yet its
foraging mode of aerial pursuit of flying fish
might select for a comparatively lower aspect
ratio for maneuverability.
Limitations on community structure and the
diversity of functional types will likely change
with different species. For seabirds, breeding assemblages also are determined by other factors
such as available substrates, island size, and stochastic events. Many seabird colonies also have
been affected by human factors within the past
few hundred years (Steadman 1995) and so
these historical disturbances on seabird distribution must also be considered whenever possible. Whether character or competitive displacement occurs among seabirds based on wing
ecomorphology will require more species in
each functional and ecological category described above, and a comparison among established pelagic communities.
ACKNOWLEDGMENTS
We thankD. Jacobs,W. Koenig, R. Pitman,T. Plummer,J. Warham,and an anonymousreviewerfor helpful comments.Fundingfor LTBwas receivedfromthe
American Ornithologists'Union, the Departmentof
Biology at UCLA, the Hawaii/PacificIslandsNational
WildlifeRefugeComplexof the U.S. Fish andWildlife
Service, and the SouthwestFisheries Science Center
of the NationalOceanicand AtmosphericAdministration.
LITERATURE CITED
D. G., ANDR. J. BOEKELHEIDE.
1993. An ecoAINLEY,
logical comparisonof oceanic seabirdcommunities of the south Pacific Ocean. Stud. Avian Biol.
8:2-23.
A. B., JR.,ANDP. C. SHELTON.
1976. The
AMERSON,
naturalhistory of JohnstonAtoll, centralPacific
Ocean. Atoll Res. Bull. No. 192. Smithson.Inst.,
Washington,DC.
N. P 1968. Body size, prey size, and ecoASHMOLE,
logical segregationin five sympatrictropicalterns
(Aves: Laridae).Syst. Zool. 17:292-304.
N. P. 1971. Sea birdecology andthe marine
ASHMOLE,
environment,p. 223-286. In D. S. Farnerand J.
R. King [eds.], Avian biology. Vol. 1. Academic
Press, New York.
1985. Dolphin
Au, D. W K., ANDW. L. PERRYMAN.
habitats in the eastern tropical Pacific. Fishery
Bull. 83:623-643.
Au, D. W. K., ANDR. L. PrITAN.1986. Seabirdinter-
This content downloaded from 130.166.34.124 on Tue, 05 May 2015 23:04:44 UTC
All use subject to JSTOR Terms and Conditions
556
FRITZHERTELANDLISA T. BALLANCE
actionswith dolphinsandtunain the easterntrop129-158. In M. Hildebrand,D. M. Bramble,K. E
ical Pacific. Condor88:304-317.
Liem, and D. B. Wake [eds.], Functionalvertebrate morphology. HarvardUniv. Press, CamL. T 1993. Communityecology and flight
BALLANCE,
bridge,MA.
energeticsin tropicalseabirdsof the easternPaU. M. 1989. Vertebrateflight. Springer-Vercific: energeticcorrelatesof guild structure.Ph.D. NORBERG,
diss., Univ. California,Los Angeles, CA.
lag, New York.
L. T. 1995.Flightenergeticsof free-ranging NORBERG,U. M., ANDR. A. NORBERG. 1988. EcomorBALLANCE,
Red-footedBoobies (Sulasula). Physiol.Zool. 68:
phology of flightand tree-trunkclimbingin birds.
Proc. Int. Ornithol.Congr.19:2271-2282.
887-914.
L. T., AND R. L. PITMAN.1999. Feeding OBST,B. S., ANDK. A. NAGY.1992. Field energy exBALLANCE,
pendituresof the SouthernGiant-Petrel.Condor
ecology of tropical seabirds.Proc. Int. Ornithol.
94:801-810.
Congr.22, in press.
C. J. 1982. The flight of petrels and alL. T., R. L. PITMAN,AND S. B. REILLY. PENNYCUICK,
BALLANCE,
batrosses (Procellariiformes)observed in South
1997. Seabirdcommunitystructurealong a proGeorgia and its vicinity. Phil. Trans. Roy. Soc.
ductivitygradient:importanceof competitionand
Lond. B 300:75-106.
energeticconstraint.Ecology 78:1502-1518.
C. J. 1989. Bird flight performance.OxJ. 1985. Phylogenies and the comparative PENNYCUICK,
FELSENSTEIN,
ford Univ. Press, Oxford.
method.Am. Nat. 125:1-15.
E. N. 1991. Time and energy limits to the for- PITMAN,R. L. 1986. Atlas of seabirddistributionand
FLINT,
relativeabundancein the easterntropicalPacific.
aging radius of Sooty Terns Sternafuscata. Ibis
SouthwestFisheries Center,AdministrativeRep.
133:43-46.
No. LJ-86-02C. Southwest Fisheries Center,La
FLINT,E. N., ANDK. A. NAGY.1984. Flight energetics
of free-livingSooty Terns.Auk 101:288-294.
Jolla, CA.
J. L., ANDM. KOT. 1990. Adaptation:sta- RAYNER, J. V. 1988. Formand functionin avianflight.
GITrLEMAN,
CurrentOrnithol.5:1-66.
tistics and a null model for estimatingphylogenetic effects. Syst. Zool. 39:227-243.
1993. RedSCHREIBER,E. A., ANDR. W. SCHREIBER.
tailed Tropicbird (Phaethon rubricauda. In A.
HARRISON, P. 1983. Seabirds:an identificationguide.
Poole and E Gill [eds.], The birdsof NorthAmerHoughtonMifflin,Boston.
E, ANDN. LEHMAN.1998. A randomizednearHERTEL,
ica, No. 43. The Academy of NaturalSciences,
est-neighborapproachfor assessmentof character
Philadelphia,and the American Ornithologists'
Union, Washington,DC.
displacement:the vulture guild as a model. J.
theor.Biol. 190:51-61.
SPEAR,L. B., ANDD. G. AINLEY. 1997. Flight behaviour of seabirdsin relationto wind directionand
HILDEBRAND,M. 1988. Analysis of vertebrate structure.
3rd ed. John Wiley and Sons, New York.
wing morphology.Ibis 139:221-233.
ANDJ. SARGATAL.
D. W. 1995. Prehistoricextinctionsof Pa1992. Hand- STEADMAN,
HoYo, J., A. ELLIOTT,
book of the birdsof the world. Vol. 1. Lynx Edicific island birds:biodiversitymeets zooarcheoltions, Barcelona.
ogy. Science 267:1123-1131.
ANDJ. SARGATAL.
1996. Hand- STRIKWERDA,T. E., M. R. FULLER,W. S. SEEGAR,P. W.
HoYo, J., A. ELLIOTT,
book of the birds of the world. Vol. 3. Lynx EdiHOWEY,AND H. D. BLACK. 1986. Bird-bornesatellite transmitterand location program. Johns
tions, Barcelona.
JOUVENTIN,
HopkinsAPL Tech. Digest 7:203-208.
P., ANDH. WEIMERSKIRCH.1990. Satellite
J. 1977. Wing loadings, wing shapes, and
trackingof WanderingAlbatrosses.Nature 343: WARHAM,
746-748.
flight capabilitiesof Procellariiformes.New ZeaJ. A., ANDP. W. WALKER.
land J. Zool. 4:73-83.
1993. Pelagic
McGOWAN,
diversity patterns,p. 203-214. In R. E. Ricklefs WARHAM, J. 1996. The behavior,populationbiology
and D. Schluter [eds.], Species diversity in ecoand physiology of the petrels. Academic Press,
New York.
logical communities.Univ. Chicago Press, ChiWILKINSON, L. 1988. SYSTAT: the system for statiscago.
U. M. 1985. Gliding,flying, and soaring,p.
tics. SYSTAT,Inc., Evanston,IL.
NORBERG,
This content downloaded from 130.166.34.124 on Tue, 05 May 2015 23:04:44 UTC
All use subject to JSTOR Terms and Conditions


© Copyright 2026