
Australian Jobs 2015 - Department of Employment
AUSTRALIAN JOBS 2015 CONTENTS INTRODUCTION Jobs by Location National Overview 3 New South Wales 4 Victoria5 Queensland6 South Australia 7 Western Australia 8 Tasmania9 Northern Territory 10 Australian Capital Territory 10 Jobs by Age Youth Overview Mature Age Overview Job search strategies for those entering the labour market Strategies for mature age workers 11 11 12 13 Jobs by Industry Industry Overview 14 Industry Outlook 15 Accommodation and Food Services 15 Administrative and Support Services 16 Agriculture, Forestry and Fishing 16 Arts and Recreation Services 17 Construction17 Education and Training 18 Electricity, Gas, Water and Waste Services 18 Financial and Insurance Services 19 Health Care and Social Assistance 19 Information Media and Telecommunications 20 Manufacturing20 Mining21 Other Services 21 Professional, Scientific and Technical Services 22 Public Administration and Safety 22 Rental, Hiring and Real Estate Services 23 Retail Trade 23 Transport, Postal and Warehousing 24 Wholesale Trade 24 Jobs by Occupation and Qualification Occupational Overview 25 Occupational Outlook 26 Managers26 Professionals27 Technicians and Trades Workers 28 Community and Personal Service Workers 29 Clerical and Administrative Workers 30 Sales Workers 30 Machinery Operators and Drivers 31 Labourers31 Education and Employment 32 Graduate Employment Outcomes 32 Graduate Salaries 33 Graduate Outcomes (Selected Fields) 34 Occupation Profiles (Selected Case Studies) 34 Guide to the Occupation Matrix 35 Occupation Matrix 36 Additional Information Data Sources and Useful Links 2 AUSTRALIAN JOBS 2015 43 The 2015 Australian Jobs publication presents an overview of the labour market to meet the need for industry, occupation and location information for a range of users. The report is based largely on Australian Bureau of Statistics (ABS) figures but also uses data from other Government and related agencies. More detailed information is available and the report includes links to help you explore the labour market further. The Australian labour market is currently subdued, with unemployment at a relatively high level. Mature age and young workers face particular difficulty in the labour market. There is, though, lots of support to help people find real jobs, and the outlook is bright, with more than 1.1 million new jobs expected to be created over the next five years. To deliver better outcomes for job seekers and employers, the Government is committed to a new approach to employment services. The Government is investing $5 billion over three years from 1 July 2015 in new employment services called jobactive. More information is at employment.gov.au/jobactive. If you are planning for training or work it’s helpful to understand where the jobs are and what employers look for when recruiting. The labour market is, though, complex and many factors influence job prospects. A positive attitude, a willingness to learn and participating in entry-level jobs or volunteer positions to gain experience and work skills can all help. The forward-looking information in this report provides some guidance about which industries and occupations will have the largest numbers of new jobs in the next five years. Sometimes, though, even in occupations that are in high demand, applicants can face significant competition for vacancies. Conversely, employers sometimes have difficulty recruiting for occupations which have low growth or for which employment is falling. Employment and training decisions should be based on an assessment of all relevant issues, including aptitude, interests, expectations about pay and working conditions, training requirements and goals. Some examples of the type of information to consider are provided on page 34. Good candidates are valued regardless of labour market conditions, and you are more likely to succeed if you have a passion for the job. People who complete post-school study are generally less likely to be unemployed and have higher pay than those who do not study after they leave school. Apprenticeships and traineeships allow you to earn and gain work skills as you learn and employment outcomes are strong (see page 33). Millions of Australians also find rewarding, long-term careers in occupations for which post-school qualifications are not required. In fact, the largest occupation in Australia is Sales Assistant, which employs more than half a million people. Most employers of these workers do not seek highly qualified staff, but they do place a priority on skills such as teamwork, good communication and presentation, and customer service. Inquiries about Australian Jobs should be directed to [email protected] The contents of Australian Jobs 2015 are based on information available at the time of publication. Over time, the reliability of the data and analysis may diminish. The Commonwealth, its officers, employees and agents do not accept responsibility for any inaccuracies contained in the report or for any negligence in the compilation of the report and disclaim liability for any loss suffered by any person arising from the use of this report. Labour market information must be used cautiously as employment prospects can change over time and vary by region. It is important in making and assessing career choices to consider all factors, including interest and aptitudes, remuneration and expectations, and the requirements of occupations. JOBS BY LOCATION NATIONAL OVERVIEW Unemployment Rate and Annual Employment Growth, Australia Australia 11,613,900 4.0 7.0% 6.0 3.5 Aged 45 years or older 39% Regional 32% 1.5 2.0 1.0 1.0 0.5 There are more than 11.6 million people aged 15 or older in Australia who are employed. Around 70% of those work full-time, with slightly more than half (55%) being male and almost two in every five workers (4.5 million) being 45 years or older. More than one in seven (1.7 million) workers are aged 15 to 24 years. 0.0 0.0 Feb-15 15% Feb-14 Aged 15 to 24 years 2.0 3.0 Feb-13 46% Feb-12 Female 2.5 4.0 Feb-11 30% Feb-10 Working part-time 3.0 5.0 Feb-05 Employment Profile Feb-09 10.0% Feb-08 5 year change projected to Nov 2019 7.0 Annual Employment Growth (%) 5 year change to Nov 2014 1.2% Feb-07 1 year change to Nov 2014 Unemployment Rate (%) Employment Nov 2014 Feb-06 Employment Unemployment Rate (%) (LHS) Annual Employment Growth (%) (RHS) 10-year annual average employment growth rate (%) (RHS) Source: ABS, Labour Force Over the five years to November 2014, a net 756,700 new jobs were created nationally. The largest number of new jobs was in New South Wales (220,800, a rise of 6.5%), although employment growth was strongest in Western Australia (up by 17.4% or 205,600), reflecting the impact of the mining boom on jobs growth in that State during the earlier part of the period, which is now abating. Youth (15 to 24 years) labour market conditions Young people are particularly vulnerable during periods of economic and labour market softness, as they tend to have less education, skills and experience than their prime-age (25 to 44 years) counterparts and are therefore often the first to be retrenched by employers in times of economic difficulty. Recent labour market developments Indeed, youth labour market conditions deteriorated significantly at the onset of the Global Financial Crisis (GFC) in September 2008 and have struggled to recover since. Over the year to February 2015, the level of youth employment decreased by 0.9%, while the level of youth unemployment increased by 13.3%. Against this backdrop, the youth unemployment rate has also risen, from 12.4% in February 2014 to 13.9% in February 2015. Youth accounted for 29.8% of the long-term unemployment pool in February 2015, well above the 22.6% recorded in September 2008. Underlying labour market conditions in Australia remain reasonably subdued. For instance, the level of employment increased by 1.3% over the year to February 2015, below the annual average rate of 1.8% over the last decade, while the unemployment rate has increased from 5.9% in February 2014 to 6.3% in February 2015, although it remains below that of the Euro Area (11.2%), the OECD average (7.0%), and Canada (6.8%). Looking ahead, the labour market is likely to remain reasonably soft, as the Australian economy continues to transition away from the job-intensive construction phase of the mining boom, to the less-labour intensive production phase. Young people also tend to increase their participation in education (or stay in study longer) if they have been unable to secure employment in a difficult economic climate, in an attempt to improve their job prospects for the future when labour market conditions eventually improve. To illustrate, youth participation in full-time education has risen from 47.2% in September 2008 to 51.8% in February 2015, the equal highest rate on record. Employment by Location Employment Employ’t Nov 2014 States and Territories New South Wales Victoria Queensland South Australia Western Australia Tasmania Northern Territory Australian Capital Territory Australia % of total workforce ‘000 3,625.9 2,894.1 2,323.3 803.3 1,384.9 240.8 128.5 212.4 11,613.9 31.2 24.9 20.0 6.9 11.9 2.1 1.1 1.8 100 Employment Profile 5 year change to Nov 2014 Workforce Educational Profile Female Aged 15 to 24 years Aged 45 years or older Regional With a bachelor degree or higher qual With a cert III or higher VET qual Without a postschool qual ‘000 % % % % % % % % 220.8 172.9 119.2 9.4 205.6 6.8 8.1 11.4 756.7 6.5 6.4 5.4 1.2 17.4 2.9 6.7 5.7 7.0 46 46 47 46 44 47 45 49 46 15 15 17 15 16 15 15 15 15 39 39 38 42 38 45 37 36 39 33 23 51 22 22 56 39 0 32 32 32 24 25 27 22 28 45 29 30 28 34 29 31 34 33 24 30 33 33 37 37 36 38 34 27 34 Sources: ABS, Labour Force (trend and 4 quarter averages); ABS, Education and Work; Department of Employment, Employment Projections 3 AUSTRALIAN JOBS 2015 JOBS BY LOCATION NEW SOUTH WALES Employment NSW Australia 3,625,900 11,613,900 1 year change to Nov 2014 1.2% 1.2% 5 year change to Nov 2014 6.5% 7.0% Working part-time 30% 30% Female 46% 46% Aged 15 to 24 years 15% 15% Aged 45 years or older 39% 39% Employment Nov 2014 Construction provided the largest number of new jobs (up by 55,400), followed by Health Care and Social Assistance (52,700) and Education and Training (43,000). Employment in Manufacturing fell by 20,000. Around 67% of workers in this state have a post-school qualification (compared with 66% nationally) and they are more likely to have studied at university than the national average (32% compared with 29%). Employment Profile About 15% of workers are aged 15 to 24 years but in Central West, Coffs Harbour – Grafton and Hunter Valley (excluding Newcastle) they make up 19%. In the Southern Highlands and Shoalhaven, 52% of workers are aged 45 years or older. New South Wales has the largest population of any state. Almost one in three Australians lives and works in New South Wales. Over the five years to November 2014, employment rose by 220,800 or 6.5%, slightly below the national growth rate of 7.0%. Sydney accounts for about two thirds of employment across the state. Employment by Industry, New South Wales Employment The largest employing industries in New South Wales are Health Care and Social Assistance, Retail Trade and Construction. Collectively, they account for almost one third of this state’s employment. Employ’t Nov 2014 % of total ‘000 % ‘000 % 258.2 113.5 96.5 59.2 342.1 290.0 34.0 189.7 427.4 84.0 281.4 27.9 139.4 311.9 188.4 76.6 387.8 210.6 134.9 7 3 3 2 9 8 1 5 12 2 8 1 4 9 5 2 11 6 4 8.1 0.6 3.3 7.0 55.4 43.0 -2.1 20.1 52.7 3.7 -20.0 -4.9 0.1 29.2 -10.7 18.4 27.8 33.5 -6.8 3.3 0.5 3.6 13.3 19.3 17.4 -5.8 11.9 14.1 4.6 -6.6 -15.0 0.0 10.3 -5.4 31.6 7.7 18.9 -4.8 Industries Over the five years to November 2014, employment increased in 14 of the 19 industries. The strongest growth was in Rental, Hiring and Real Estate Services (up by 31.6%) and Construction (19.3%). Accommodation and Food Services Administrative and Support Services Agriculture, Forestry and Fishing Arts and Recreation Services Construction Education and Training Electricity, Gas, Water and Waste Services Financial and Insurance Services Health Care and Social Assistance Information Media and Telecommunications Manufacturing Mining Other Services Professional, Scientific and Technical Services Public Administration and Safety Rental, Hiring and Real Estate Services Retail Trade Transport, Postal and Warehousing Wholesale Trade Youth in New South Wales 2nd highest incidence of youth long-term unemployment (behind Tasmania) 5 year change to Nov 2014 Source: ABS, Labour Force Population and Employment by Region, New South Wales Population Population June 2013 Regions Greater Sydney Capital Region Central West Coffs Harbour - Grafton Far West and Orana Hunter Valley (excluding Newcastle) Illawarra Mid North Coast Murray New England and North West Newcastle and Lake Macquarie Richmond - Tweed Riverina Southern Highlands and Shoalhaven New South Wales Employment Employ’t Nov 2014 Employment Profile 5 year change to Nov 2014 Aged 15 to 24 years Aged 45 years or older Workforce Educational Profile With a bachelor degree or higher qual With a cert III or higher VET qual Without a postschool qual ‘000 ‘000 ‘000 % % % % % % 4,757.1 219.3 207.8 135.7 119.0 260.4 294.1 211.1 114.9 185.2 364.7 240.0 156.7 144.5 7,410.4 2,427.6 103.2 100.3 60.4 52.5 119.1 133.2 78.1 43.5 80.0 172.8 95.9 85.8 59.0 3,625.9 172.9 -6.0 2.7 10.1 -3.6 5.3 12.2 3.3 -6.5 1.0 15.5 -2.9 7.3 1.9 220.8 7.7 -5.5 2.7 20.2 -6.3 4.7 10.1 4.4 -13.0 1.3 9.9 -2.9 9.3 3.3 6.5 14 15 19 19 15 19 17 16 14 17 17 18 16 16 15 37 46 41 41 46 42 45 51 42 42 42 47 47 52 39 38 22 20 13 10 11 21 21 15 16 21 23 21 14 32 26 47 40 36 34 41 36 27 43 47 35 33 39 54 30 31 29 33 36 49 40 40 37 26 33 38 35 36 24 33 Sources: ABS, Labour Force (state level data are trend, regional data are 12 month averages); ABS, Education and Work; ABS, Regional Population Growth 4 AUSTRALIAN JOBS 2015 For more information see lmip.gov.au JOBS BY LOCATION VICTORIA Employment VIC Australia 2,894,100 11,613,900 1 year change to Nov 2014 1.1% 1.2% 5 year change to Nov 2014 6.4% 7.0% Working part-time 32% 30% Female 46% 46% Aged 15 to 24 years 15% 15% Aged 45 years or older 39% 39% Employment Nov 2014 Over the five years to November 2014, employment increased in 13 of the 19 industries. The strongest growth was in Rental, Hiring and Real Estate Services (up by 38.6%), Public Administration and Safety (28.7%) and Arts and Recreation Services (18.4%). Manufacturing employment fell by 7,100 or 2.3%, but it remains Victoria’s third largest employing industry, and there was some jobs growth in this sector over the year to November 2014 (a rise of 18,400 or 6.6%). Employment Profile Victorian workers are more likely to work part-time than those in other states and a relatively high proportion hold a bachelor degree or higher qualification. The age profile of workers in Victoria is very similar to the national average, but there is marked variation by region. In Shepparton, for instance, a high proportion of workers are young (20% are aged 15 to 24 years) but in Hume just 11% of workers are in this age group. In Ballarat, half the workers are aged 45 years or older. Victoria is the second most populous state and is home to more than 5.7 million people, of whom almost 2.9 million have a job. Over the five years to November 2014, employment increased by 6.4% or 172,900 (slightly below the national average rate of 7.0%). Melbourne accounts for around three quarters of the state’s employment. Employment by Industry, Victoria Health Care and Social Assistance is the largest employing industry in Victoria followed by Retail Trade and Manufacturing. Together, these three industries account for one third of employment across the state. Employment Employ’t Nov 2014 % of total ‘000 % ‘000 % 198.9 86.2 84.5 74.0 230.7 235.4 34.5 111.8 337.0 66.6 295.8 11.0 104.1 238.2 157.2 48.6 334.3 149.9 107.5 7 3 3 3 8 8 1 4 12 2 10 0 4 8 5 2 12 5 4 20.5 -10.8 4.0 11.5 1.7 23.5 5.1 -4.8 36.3 3.4 -7.1 -0.5 -0.5 20.3 35.0 13.5 33.8 12.3 -7.2 11.5 -11.2 5.0 18.4 0.8 11.1 17.4 -4.1 12.1 5.4 -2.3 -4.2 -0.5 9.3 28.7 38.6 11.2 9.0 -6.3 Industries Youth in Victoria Accommodation and Food Services Administrative and Support Services Agriculture, Forestry and Fishing Arts and Recreation Services Construction Education and Training Electricity, Gas, Water and Waste Services Financial and Insurance Services Health Care and Social Assistance Information Media and Telecommunications Manufacturing Mining Other Services Professional, Scientific and Technical Services Public Administration and Safety Rental, Hiring and Real Estate Services Retail Trade Transport, Postal and Warehousing Wholesale Trade Highest youth participation in full-time education Source: ABS, Labour Force 5 year change to Nov 2014 Population and Employment by Region, Victoria Population Regions Greater Melbourne Ballarat Bendigo Geelong Hume Latrobe - Gippsland North West Shepparton Warrnambool and South West Victoria Employment Population June 2013 Employ’t Nov 2014 ‘000 ‘000 ‘000 4,348.0 152.8 146.4 264.9 163.6 263.9 149.4 128.4 122.1 5,739.3 2,212.1 72.6 74.2 116.4 82.3 122.9 76.2 56.3 60.3 2,894.1 164.2 -2.3 6.1 -3.1 15.7 6.2 15.9 1.1 -1.9 172.9 Employment Profile 5 year change to Nov 2014 Workforce Educational Profile Aged 15 to 24 years Aged 45 years or older With a bachelor degree or higher qual With a cert III or higher VET qual Without a postschool qual % % % % % % 8.0 -3.1 9.0 -2.6 23.5 5.3 26.4 2.0 -3.0 6.4 15 17 16 13 11 18 15 20 12 15 37 50 47 42 48 48 49 46 49 39 36 28 24 27 18 14 10 15 25 32 26 32 43 39 43 37 27 32 30 28 32 35 27 26 30 37 53 41 39 33 Sources: ABS, Labour Force (state level data are trend, regional data are 12 month averages); ABS, Education and Work; ABS, Regional Population Growth 5 AUSTRALIAN JOBS 2015 For more information see lmip.gov.au JOBS BY LOCATION QUEENSLAND Employment QLD Australia 2,323,300 11,613,900 1 year change to Nov 2014 0.0% 1.2% 5 year change to Nov 2014 5.4% 7.0% Working part-time 30% 30% Female 47% 46% Aged 15 to 24 years 17% 15% Aged 45 years or older 38% 39% Employment Nov 2014 Together, these three industries accounted for more than 123,800 new jobs, but these gains were partly offset by falls in industries such as Agriculture, Forestry and Fishing (down by 30,100 or 36.3% over the past five years and by 5,200 or 9.0% over the past year) and Manufacturing. Employment Profile Although employment in Mining rose strongly over the five years to November 2014, there have recently been job losses, with a fall of 16,200 (or 20.1%) over the year to November 2014. Workers in this state are slightly less likely to have completed post-school study than those in other states (63% have post-school qualifications compared with 66% nationally). Around 2.3 million people are employed in Queensland (or one in five of the nation’s workers). Employment growth (5.4%) was slightly lower than the national average (7.0%) over the five years to November 2014, but 119,200 new jobs were created. A relatively high proportion of workers in Queensland are aged 15 to 24 years (17% compared with 15% nationally). One in five workers in Townsville is in this age group. The proportion of workers aged 45 years or older is similar to the national average, but there are marked differences across regions. Close to half the workers in Cairns are mature age compared with just 36% in Brisbane. Employment is regionally diverse, with about 40% of the state’s workers employed outside the Brisbane – Gold Coast area. The largest employing industries in Queensland are Health Care and Social Assistance, Retail Trade and Construction which collectively comprise around one third of total employment. Employment by Industry, Queensland Employment Over the five years to November 2014, employment increased in 12 of the 19 industries. The largest gains were in Health Care and Social Assistance (up by 53,600), Professional, Scientific and Technical Services (41,400) and Accommodation and Food Services (28,800). Employ’t Nov 2014 % of total ‘000 % ‘000 % 184.1 89.1 53.0 40.8 220.9 170.3 33.8 58.6 293.4 34.1 153.1 64.7 113.9 191.6 158.9 48.1 241.0 116.4 68.3 8 4 2 2 9 7 1 3 13 1 7 3 5 8 7 2 10 5 3 28.8 11.7 -30.1 3.0 -8.8 13.0 5.2 0.5 53.6 4.0 -27.4 23.8 17.8 41.4 28.1 -0.9 0.0 -12.1 -13.8 18.6 15.2 -36.3 8.0 -3.8 8.3 18.3 0.9 22.4 13.1 -15.2 58.4 18.5 27.5 21.5 -1.8 0.0 -9.4 -16.8 Industries Accommodation and Food Services Administrative and Support Services Agriculture, Forestry and Fishing Arts and Recreation Services Construction Education and Training Electricity, Gas, Water and Waste Services Financial and Insurance Services Health Care and Social Assistance Information Media and Telecommunications Manufacturing Mining Other Services Professional, Scientific and Technical Services Public Administration and Safety Rental, Hiring and Real Estate Services Retail Trade Transport, Postal and Warehousing Wholesale Trade Youth in Queensland Youth in full-time education, lowest of all states Source: ABS, Labour Force 5 year change to Nov 2014 Population and Employment by Region, Queensland Population Population June 2013 Regions Greater Brisbane Cairns Darling Downs - Maranoa Fitzroy Gold Coast Mackay Queensland - Outback Sunshine Coast Toowoomba Townsville Wide Bay Queensland Employment Employ’t Nov 2014 Employment Profile 5 year change to Nov 2014 Aged 15 to 24 years Aged 45 years or older Workforce Educational Profile With a bachelor degree or higher qual With a cert III or higher VET qual Without a postschool qual ‘000 ‘000 ‘000 % % % % % % 2,238.4 240.2 128.3 229.5 551.7 180.2 88.3 330.5 149.1 233.9 286.7 4,656.8 1,153.0 109.0 65.4 120.1 290.6 102.8 50.6 164.2 68.5 110.1 104.4 2,323.3 64.2 -7.8 0.7 18.3 31.5 6.5 11.8 23.2 -0.1 -5.0 -10.7 119.2 5.9 -6.6 1.0 17.9 12.2 6.7 30.5 16.4 -0.1 -4.4 -9.3 5.4 17 13 15 19 16 16 13 19 16 20 15 17 36 46 41 40 39 38 41 43 41 37 49 38 30 15 14 17 19 17 17 16 25 18 20 24 31 38 40 36 37 44 47 32 34 28 36 34 34 40 42 33 38 35 29 43 33 49 38 37 Sources: ABS, Labour Force (state level data are trend, regional data are 12 month averages); ABS, Education and Work; ABS, Regional Population Growth 6 AUSTRALIAN JOBS 2015 For more information see lmip.gov.au JOBS BY LOCATION SOUTH AUSTRALIA Employment SA Australia 803,300 11,613,900 1 year change to Nov 2014 0.7% 1.2% 5 year change to Nov 2014 1.2% 7.0% Working part-time 33% 30% Female 46% 46% Aged 15 to 24 years 15% 15% Aged 45 years or older 42% 39% Employment Nov 2014 Over the past five years, the largest employment losses were in Manufacturing (down by 11,900) and Wholesale Trade (10,100). Despite this, Manufacturing continues to be an important employing industry in South Australia, ranking third in employment size. There have also been some employment gains over the past five years in sectors such as Beverage and Tobacco Product Manufacturing and Machinery and Equipment Manufacturing. Employment Profile Workers in this state are less likely to hold post-school qualifications (63%) than those nationally (66%). About a quarter of workers across the state hold a bachelor degree or higher qualification, below the national rate of 29%. In regional locations, for example in South Australia – South East, relatively few workers have completed post-school studies. South Australia has a relatively small workforce, with around 7% of national employment or 803,300 workers. Employment increased by 1.2% or 9,400 over the five years to November 2014, well below the national average growth rate of 7.0%. Workers in South Australia are more likely to be older and to work part-time than those in other states. Only Tasmania has a higher proportion of its workers aged 45 years or older. Regional workers in South Australia also tend to be older than those in Greater Adelaide. The proportion of workers aged 15 to 24 years in South Australia is the same as the average for Australia, and there is little variation across the regional areas of the state. Employment is quite highly concentrated in Greater Adelaide (it has about three quarters of the state’s employment) and around 94,000 young workers (around 80% of South Australian workers aged 15 to 24) are employed in this city. The largest employing industries in South Australia are Health Care and Social Assistance, Retail Trade and Manufacturing. Together, they account for one in every three jobs. A slightly higher proportion of state workers are employed in Agriculture, Forestry and Fishing (5%) and Health Care and Social Assistance (14%) than the average for Australia (3% and 12%, respectively). Employment by Industry, South Australia Employment Employment increased in 11 of the 19 industries over the five years to November 2014. The largest gains were in Health Care and Social Assistance (up by 14,700), Mining (8,900) and Agriculture, Forestry and Fishing (8,100). Together, these industries accounted for half of all new jobs in the state. Employment in Mining has continued to rise over the past year (up by 18.1% or 2,400). Employ’t Nov 2014 % of total ‘000 % ‘000 % 53.6 28.0 43.1 17.3 58.9 68.0 11.5 20.7 115.9 12.3 71.0 15.8 33.7 52.2 46.7 12.2 92.8 37.3 20.2 7 3 5 2 7 8 1 3 14 2 9 2 4 6 6 2 11 5 2 5.5 -1.5 8.1 5.5 -5.2 6.9 0.6 -2.8 14.7 1.4 -11.9 8.9 5.8 -1.7 -3.8 -1.0 1.0 1.3 -10.1 11.4 -5.0 23.1 46.1 -8.1 11.3 5.2 -11.7 14.5 12.6 -14.3 126.6 20.7 -3.2 -7.5 -7.5 1.0 3.6 -33.2 Industries Accommodation and Food Services Administrative and Support Services Agriculture, Forestry and Fishing Arts and Recreation Services Construction Education and Training Electricity, Gas, Water and Waste Services Financial and Insurance Services Health Care and Social Assistance Information Media and Telecommunications Manufacturing Mining Other Services Professional, Scientific and Technical Services Public Administration and Safety Rental, Hiring and Real Estate Services Retail Trade Transport, Postal and Warehousing Wholesale Trade Youth in South Australia 2nd highest youth unemployment rate (behind Tasmania) 5 year change to Nov 2014 Source: ABS, Labour Force Population and Employment by Region, South Australia Population Population June 2013 Regions Greater Adelaide Barossa - Yorke - Mid North South Australia - Outback South Australia - South East South Australia Employment Employ’t Nov 2014 Employment Profile 5 year change to Nov 2014 Aged 15 to 24 years Aged 45 years or older Workforce Educational Profile With a bachelor degree or higher qual With a cert III or higher VET qual Without a postschool qual ‘000 ‘000 ‘000 % % % % % % 1,291.7 109.2 87.7 182.3 1,670.8 626.6 49.4 39.5 86.7 803.3 20.0 -3.4 0.0 -2.3 9.4 3.3 -6.3 -0.1 -2.6 1.2 15 14 15 14 15 41 48 52 45 42 29 16 17 9 25 28 31 30 32 29 35 47 44 49 37 Sources: ABS, Labour Force (state level data are trend, regional data are 12 month averages); ABS, Education and Work; ABS, Regional Population Growth 7 AUSTRALIAN JOBS 2015 For more information see lmip.gov.au JOBS BY LOCATION WESTERN AUSTRALIA Employment WA Australia 1,384,900 11,613,900 1 year change to Nov 2014 3.4% 1.2% 5 year change to Nov 2014 17.4% 7.0% Working part-time 29% 30% Female 44% 46% Aged 15 to 24 years 16% 15% Aged 45 years or older 38% 39% Employment Nov 2014 strongest growth (46.1%). There have, though, been some job losses in Mining in Western Australia over the past few years (down by 15.0% or 17,500 over the two years to November 2014). Over the five years, there were job losses in Manufacturing (down by 9,200) and Information Media and Telecommunications (3,200), but thousands of jobs were created in some sectors of Manufacturing, such as Food Product Manufacturing and Machinery and Equipment Manufacturing, which partially offset losses in others. Employment Profile Workers in Western Australia are slightly less likely to hold a bachelor degree or higher qualification but are more likely to hold a certificate III or higher vocational education and training qualification than the national average. About 1.4 million people are employed in Western Australia, making it the fourth largest employing state. This state’s employment growth is the strongest in Australia, up by 17.4% (or 205,600) over the five years to November 2014, more than double the national average rate of 7.0%. Employment has continued to rise strongly over the past year (up by 3.4% compared with the national average of 1.2%). Perth has the youngest age profile of any region in Western Australia, and around three quarters of workers aged 15 to 24 years in the state are employed in Perth. Few young people are employed in Western Australia - Wheat Belt, but this region has a higher proportion of its workers in the 45 years and older age group than any other in Australia (53%). Employment is highly concentrated in Greater Perth, which has more than three quarters of workers, although significant numbers of workers fly-in and fly-out of Perth for jobs in regional locations. Employment by Industry, Western Australia The largest employing industries are Health Care and Social Assistance, Construction and Retail Trade which together represent more than 30% of total employment in the state. Mining is the sixth largest employing industry in Western Australia and around 45% of national Mining employment is in this state. Employment Employ’t Nov 2014 % of total ‘000 % ‘000 % 86.8 43.9 36.7 34.2 148.9 105.2 15.6 32.3 150.0 13.7 87.0 98.7 56.2 113.9 80.2 30.8 142.7 67.3 46.7 6 3 3 2 11 8 1 2 11 1 6 7 4 8 6 2 10 5 3 13.7 4.3 2.7 15.8 23.4 7.5 2.5 3.5 31.3 -3.2 -9.2 31.2 4.2 31.1 13.3 12.5 20.7 6.2 5.1 18.7 10.9 8.0 86.0 18.7 7.7 19.1 12.2 26.3 -18.8 -9.5 46.1 8.1 37.5 19.9 68.5 16.9 10.1 12.3 Industries Employment increased in 17 of the 19 industries over the five years to November 2014. Health Care and Social Assistance, Mining and Professional, Scientific and Technical Services each contributed around 31,000 new jobs to the state. Of these, Mining had the Accommodation and Food Services Administrative and Support Services Agriculture, Forestry and Fishing Arts and Recreation Services Construction Education and Training Electricity, Gas, Water and Waste Services Financial and Insurance Services Health Care and Social Assistance Information Media and Telecommunications Manufacturing Mining Other Services Professional, Scientific and Technical Services Public Administration and Safety Rental, Hiring and Real Estate Services Retail Trade Transport, Postal and Warehousing Wholesale Trade Youth in Western Australia Youth average duration of unemployment, shortest of all states 5 year change to Nov 2014 Source: ABS, Labour Force Population and Employment by Region, Western Australia Population Regions Greater Perth Bunbury Western Australia - Outback Western Australia - Wheat Belt Western Australia Employment Population June 2013 Employ’t Nov 2014 ‘000 ‘000 ‘000 1,972.4 173.5 235.9 137.5 2,519.3 1,066.4 93.4 137.8 63.9 1,384.9 146.7 8.6 30.3 -3.0 205.6 Employment Profile 5 year change to Nov 2014 Workforce Educational Profile Aged 15 to 24 years Aged 45 years or older With a bachelor degree or higher qual With a cert III or higher VET qual Without a postschool qual % % % % % % 16.0 10.2 28.2 -4.5 17.4 17 16 14 11 16 37 45 34 53 38 30 20 9 17 27 30 35 40 32 31 35 37 44 42 36 Sources: ABS, Labour Force (state level data are trend, regional data are 12 month averages); ABS, Education and Work; ABS, Regional Population Growth 8 AUSTRALIAN JOBS 2015 For more information see lmip.gov.au JOBS BY LOCATION TASMANIA Employment TAS Australia 240,800 11,613,900 1 year change to Nov 2014 4.4% 1.2% 5 year change to Nov 2014 2.9% 7.0% Working part-time 37% 30% 46% Employment Nov 2014 The largest job losses were in Public Administration and Safety, Agriculture, Forestry and Fishing and Construction. There has been some growth, though, in Construction employment over the past few years, with 1,500 new jobs created in this industry over the year to November 2014 (a rise of 8.4%). Despite job losses in Agriculture, Forestry and Fishing, it continues to be an important employer, accounting for 5.4% of state employment, compared with 2.8% of national employment. Employment Profile Female 47% Aged 15 to 24 years 15% 15% Aged 45 years or older 45% 39% A high proportion of Tasmania’s workers are employed part-time (37%) compared with the national average (30%). Workers in Tasmania are less likely than those in most other states to have completed post-school education (38% do not hold post-school qualifications compared with 34% nationally). A relatively large proportion of workers have vocational education and training qualifications (34% hold a certificate III or higher VET qualification, compared with 30% nationally), but few have a bachelor degree or higher qualification (22% compared with the national average of 29%). Tasmania is Australia’s smallest employing state (although both the territories have smaller labour markets), with around 2% of national employment. Employment growth was low over the five years to November 2014 (up by 2.9% or 6,800), but it has been strong over the past year (up by 4.4% or 10,200). Employment is regionally dispersed, with just 43% of jobs being in Hobart. The largest employing industries in Tasmania are Health Care and Social Assistance, Retail Trade and Education and Training. Combined, they employ around 80,000 workers, accounting for one third of the state’s employment. Tasmania’s workforce has a relatively old age profile. Around 45% of workers are aged 45 years or older (the highest of any state or territory). South East Tasmania has the highest proportion of older workers, with half aged 45 years or older, and it has relatively few workers aged 15 to 24 years. Over the five years to November 2014, employment increased in most industries. Administrative and Support Services recorded the strongest growth (up by 46.9%) followed by Rental, Hiring and Real Estate Services (40.0%) and Other Services (34.6%). Employment by Industry, Tasmania Employment Education and Training, though, contributed the most new jobs over the five years, followed by Retail Trade and Other Services. Together they added 10,200 jobs. Youth in Tasmania Highest youth unemployment rate Source: ABS, Labour Force Employ’t Nov 2014 % of total 5 year change to Nov 2014 Industries ‘000 % ‘000 % Accommodation and Food Services Administrative and Support Services Agriculture, Forestry and Fishing Arts and Recreation Services Construction Education and Training Electricity, Gas, Water and Waste Services Financial and Insurance Services Health Care and Social Assistance Information Media and Telecommunications Manufacturing Mining Other Services Professional, Scientific and Technical Services Public Administration and Safety Rental, Hiring and Real Estate Services Retail Trade Transport, Postal and Warehousing Wholesale Trade 18.2 8.2 13.3 4.0 18.9 21.1 4.7 4.8 29.8 3.9 18.6 3.3 11.2 11.7 19.2 3.4 29.5 11.6 8.7 7 3 5 2 8 9 2 2 12 2 8 1 5 5 8 1 12 5 4 2.2 2.6 -2.0 -0.7 -1.7 4.0 0.0 -0.6 1.3 0.0 -1.2 -0.3 2.9 0.5 -2.3 1.0 3.3 1.3 1.8 13.9 46.9 -13.3 -14.9 -8.1 23.5 -1.0 -10.4 4.6 0.3 -5.9 -9.4 34.6 4.7 -10.8 40.0 12.5 12.7 25.2 Population and Employment by Region, Tasmania Population Population June 2013 Regions Hobart Launceston and North East South East West and North West Tasmania Employment Employ’t Nov 2014 Employment Profile 5 year change to Nov 2014 Aged 15 to 24 years Aged 45 years or older Workforce Educational Profile With a bachelor degree or higher qual With a cert III or higher VET qual Without a postschool qual ‘000 ‘000 ‘000 % % % % % % 218.0 143.5 37.6 114.0 513.2 103.0 66.0 17.1 50.2 240.8 0.3 -2.0 0.5 0.8 6.8 0.3 -2.9 3.3 1.7 2.9 15 16 10 16 15 42 45 50 47 45 27 19 19 13 22 32 36 35 39 34 35 40 49 39 38 Sources: ABS, Labour Force (state level data are trend, regional data are 12 month averages); ABS, Education and Work; ABS, Regional Population Growth 9 AUSTRALIAN JOBS 2015 For more information see lmip.gov.au JOBS BY LOCATION NORTHERN TERRITORY AUSTRALIAN CAPITAL TERRITORY Employment NT Australia 128,500 11,613,900 1 year change to Nov 2014 -1.0% 1.2% 5 year change to Nov 2014 6.7% 7.0% Employment Nov 2014 Employment Profile Employment ACT Australia 212,400 11,613,900 1 year change to Nov 2014 0.0% 1.2% 5 year change to Nov 2014 5.7% 7.0% Employment Nov 2014 Employment Profile Working part-time 18% 30% Working part-time 25% 30% Female 45% 46% Female 49% 46% Aged 15 to 24 years 15% 15% Aged 15 to 24 years 15% 15% Aged 45 years or older 37% 39% Aged 45 years or older 36% 39% With a bachelor degree or higher qual 28% 29% With a bachelor degree or higher qual 45% 29% With a cert III or higher VET qual 33% 30% With a cert III or higher VET qual 24% 30% Without a post-school qual 34% 34% Without a post-school qual 27% 34% Workforce Educational Profile Workforce Educational Profile The Northern Territory (NT) has Australia’s smallest labour market, with 128,500 workers or about 1% of the national total. Over the five years to November 2014, employment grew by 6.7% or 8,100, slightly below the national growth rate of 7.0%. There are 212,400 workers in the Australian Capital Territory (ACT). Over the five years to November 2014, employment rose by 5.7% or 11,400. Youth in the NT About 60% of employment is in Darwin, but there are more than 50,000 jobs in other areas of the NT. Highest rate of youth disengagement Four industries each employ more than 10,000 workers in the NT, Public Administration and Safety (22,200), Construction (16,000), Health Care and Social Assistance (15,700) and Education and Training (10,600). Source: ABS, Labour Force Public Administration and Safety (up by 4,400) contributed the most new jobs over the five years to November 2014, followed by Construction (3,600). Workers in the NT are more likely to hold a certificate III or higher VET qualification than the national average, and are more likely to work full-time. The workforce is slightly younger than the national average, with 37% of workers aged 45 years or older compared with 39%. Population and Employment by Region, Northern Territory Population Population June 2013 Regions Darwin Northern Territory - Outback Northern Territory Employment Employ’t Nov 2014 Employment Profile 5 year change to Nov 2014 Aged 15 to 24 years Aged 45 years or older ‘000 ‘000 ‘000 % % % 136.2 79.4 9.1 13.0 15 35 104.5 51.8 2.8 5.7 15 39 240.8 128.5 8.1 6.7 15 37 Youth in the ACT The ACT has a relatively high proportion of the national Public Administration and Safety Lowest workforce (around 9% compared youth with its share of total national unemployment employment of 6%), and this rate industry employs almost one in every three workers (66,100). This industry also contributed the largest number of new jobs over the past five years (up by 6,600 or 11.1%), but there have been some job losses over the past year (down by 5,200 or 7.3%). The ACT workforce is highly skilled. About 73% of workers hold Source: ABS, Labour Force post-school qualifications, and they are much more likely to hold a bachelor degree or higher qualification than those in other locations. Fewer ACT workers hold a certificate III or higher vocational education and training qualification (24% compared with 30% nationally), reflecting the low share of ACT’s employment in industries in which trades employment is significant, such as Manufacturing (2% compared with 8% nationally) and Construction (7% compared with 9%). Workers in the ACT are more likely to work full-time and to be female than the national averages. The ACT has relatively few workers aged 45 years or older (36% of its workers are in this age group, compared with 39% nationally). Young people in the ACT are highly engaged in education or employment. Around 81% of people aged 15 to 24 years are either in full-time work or non-school study (compared with the national average of 74%). Sources: ABS, Labour Force (territory level data are trend, regional data are 12 month averages); ABS, Education and Work; ABS, Regional Population Growth 10 AUSTRALIAN JOBS 2015 For more information see lmip.gov.au JOBS BY AGE YOUTH OVERVIEW MATURE AGE OVERVIEW There are around 3.1 million Australians aged 15 to 24 years. Around 1.8 million of these young people are employed, representing 15% of the Australian workforce. Many people in this age group are enrolled in school or tertiary education, sometimes combining work with study. There are around 9.1 million Australians aged 45 years or older. About 4.5 million are in employment, accounting for 39% of the Australian workforce. In which industries do young people work? There are young workers in every industry, however, some industries offer more opportunities for workers aged 15 to 24 years. The industry with the highest proportion of its workers aged 15 to 24 years is Accommodation and Food Services (43%), followed by Retail Trade (33%). The industries with the largest numbers of young workers are • Retail Trade (406,300 or 22.8% of all young workers) • Accommodation and Food Services (335,400 or 18.8%) • Construction (176,500 or 9.9%) • Health Care and Social Assistance (137,200 or 7.7%) • Manufacturing (105,900 or 5.9%). In which occupations do young people work? Young workers are predominantly employed in occupations which offer entry-level opportunities which do not generally require post-school qualifications. Consistent with the industry profile above, the five largest employing occupations for young people are • Sales Assistants, General (266,900) • Checkout Operators and Office Cashiers (81,700) • Waiters (73,600) • Kitchenhands (61,700) • Carers, Child (41,700). In some occupations, the majority of workers are aged 15 to 24 years, such as • Fast Food Cooks (76% of workers are young) • Sportspersons (69%) • Waiters (64%) • Checkout Operators and Office Cashiers (60%) • Sports Coaches, Instructors and Officials (60%). Share of youth employment by industry (% of young workers) Other 21.1% Accommodation and Food Services 18.8% Other Services 4.9% Manufacturing 5.9% Health Care and Social Assistance 7.7% Construction 9.9% In which industries do mature age people work? Mature age workers represent a significant proportion of employment in each industry. Even in the industry with the youngest age profile, Accommodation and Food Services, more than one in every five workers is aged 45 years or older. Agriculture, Forestry and Fishing has the highest proportion of its workers aged 45 years or older (59%), followed by Education and Training and Transport, Postal and Warehousing (both 48%). The five industries with the largest numbers of mature age workers are • Health Care and Social Assistance (634,000 or 14.0% of all mature age workers) • Education and Training (439,700 or 9.7%) • Manufacturing (398,500 or 8.8%) • Construction (370,000 or 8.1%) • Retail Trade (355,100 or 7.8%). In which occupations do mature age people work? Workers aged 45 years or older are employed in all occupations. The five occupations with the largest numbers of jobs for mature age workers are • Sales Assistants, General (115,500) • Nurses, Registered (108,300) • Clerks, General (106,500) • Drivers, Truck (94,600) • Managers, Retail (89,700). Share of mature employment by industry (% of mature age workers) Other 22.1% Retail Trade 22.8% Education and Training 4.3% Professional, Scientific and Technical Services 4.7% In view of Australia’s ageing population, the participation of older workers is crucial to the labour market. Education and Training 9.7% Other Services 4.1% Agriculture, Forestry and Fishing 4.2% Transport, Postal and Warehousing 6.3% Professional, Scientific and Technical Services Public 7.4% Administration and Safety 7.6% Source: ABS, Labour Force Source: ABS, Labour Force Sources: ABS, Labour Force (four quarter average); ABS, Population by Age and Sex 11 AUSTRALIAN JOBS 2015 Health Care and Social Assistance 14.0% Manufacturing 8.8% Construction 8.1% Retail Trade 7.8% JOBS BY AGE JOB SEARCH STRATEGIES FOR THOSE ENTERING THE LABOUR MARKET Employers use a wide range of recruitment methods to fill vacancies, so it is important to adopt a variety of job search strategies to avoid missing out on potential employment opportunities. Research by the Department of Employment indicates that • more than half of all vacancies are advertised on the Internet or in a newspaper • one in ten vacancies is filled using an employment agency • one third of vacancies are not formally advertised. employment.gov.au/jobactive What do employers look for when recruiting? Employers who do not advertise use informal methods to fill their vacancies, including word of mouth, being approached directly by job seekers or placing a sign in their shop window. Employers’ recruitment strategies can vary depending on the region and the position for which they are recruiting. Over recent years, there has been a move to online advertising of many vacancies, and this is evident across much of the labour market. Some small employers, though, prefer to keep their advertising local and they continue to use newspapers and local contacts. Employers recruiting for apprentices and trainees generally advertise their vacancies online through job search websites or industry specific sites. Some combine online advertising with other approaches, including contacting TAFEs, recruitment agencies, training organisations or schools. Despite the propensity for jobs to be advertised online, just one in four employed bachelor degree graduates first found out about their jobs this way, the other three quarters found employment using many different means. How graduates found full-time employment (%) How bachelor degree graduates first found out about their position From 1 July 2015, jobactive will provide job seekers with access to tailored help from a jobactive organisation, based on their assessed needs. This can include support to complete Work for the Dole or other eligible activities to provide work-like experiences, helping job seekers learn new skills and improve their chances of finding a job. % Advertisement on the Internet 25.7 Family or friends 13.9 University or college careers service 12.4 Approached employer directly 8.9 Approached by an employer 7.6 Work contacts or networks 7.1 Other university or college source (such as faculties or lecturers) 5.3 Careers fair or information session 4.5 Employment agency 2.5 Advertisement in a newspaper or other print media 2.0 Via résumé posted on the Internet 1.4 Other 8.6 Source: GCA, Gradstats Workplace experience is valuable Employability skills are non-technical or generic skills which contribute to your ability to gain and keep a job. They are sometimes referred to as core, life, essential or soft skills. Unlike many technical skills, employability skills are transferable between jobs. Employers value people who can communicate effectively; have teamwork and problem-solving skills; show initiative and enterprise; can plan and organise work; and have good capabilities in working with technology. The Department’s Skill Shortage Research shows that if applicants do not have these attributes employers often reject them, even if they hold relevant qualifications. These skills can be developed in entry-level jobs or pre-vocational courses and extracurricular activities. It is now a requirement of nationally recognised vocational education and training packages to embed employability skills into course content. While employers consider all of these to be important, particular jobs may require some more than others. Employers also seek people who have a range of other personal attributes including: loyalty, commitment, honesty and integrity, enthusiasm, reliability, good personal presentation, common sense, positive self-esteem, an ability to deal with pressure, motivation and adaptability. Support is available If you are unemployed and looking for work, jobactive can offer you personalised support to find a job. employment.gov.au/jobactive If you have just found work or are about to start work in a new job and have been on Newstart or Youth Allowance for at least 12 months, you may be eligible to receive the Job Commitment Bonus for Young Australians. employment.gov.au/job-commitment-bonus-young-australians-0 Resources are available through Generation Success, which is an industry led initiative aimed at drawing employers’ attention to youth unemployment and providing tips and advice to support employers, young people, parents and educators. employment.gov.au/generation-success-resources-youngjob-seekers One of the most difficult challenges, that even the most highly educated person can face, is breaking into the labour market with little or no workplace experience. There are Australian Government initiatives that contribute to increased participation in education and training by young people. An entry-level job can provide an opportunity to gain workplace skills and experience, which is valued by employers and which will help for future employment. The Department of Employment has launched a Career Quiz app. to help job seekers better understand their work preferences and learn more about the kinds of jobs they might enjoy or be good at. Students may have the chance to undertake a placement to gain workplace experience as part of their course. Those undertaking an apprenticeship or traineeship benefit from a combination of training and employment. The Career Quiz app can be downloaded free from the iTunes app store and Google Play by searching for ‘Career Quiz Australia’. education.gov.au/school-work-transitions Sources: Department of Employment, Survey of Employers’ Recruitment Experiences; Department of Employment, Skill Shortage Research; Department of Employment, The Labour Market for Apprentices; GCA, GradStats; ACCI and BCA, Employability Skills for the Future 12 AUSTRALIAN JOBS 2015 For more information see lmip.gov.au JOBS BY AGE STRATEGIES FOR MATURE AGE WORKERS Re-entering the workforce or transitioning to another job Re-entering the workforce or moving to another job can be difficult for many workers, but the following strategies can help. • Consider a wide range of job opportunities. There may be limited opportunities to find a job that is identical to the one in which you have experience. Be receptive to a broad range of employment opportunities and be prepared to ‘try something different’. Roles that increase exposure to potential employers or which develop new skills could be a stepping stone to other opportunities. • Re-training could be required. Consider broadening and diversifying your skill set. In addition to providing additional skills and qualifications, training demonstrates a commitment to a particular career direction. Training can also be used to improve general skills, such as undertaking a short course in computing or technology. • Promote your adaptability. Having résumés that are up-to-date, comprehensive and which highlight transferable skills are essential to properly ‘sell yourself’ to employers. • Act quickly. Most employers understand that sometimes good workers leave the labour market for a number of reasons. Some lose their jobs as firms restructure, and redundancy is not a reflection of the workers’ performance. For others, caring commitments require an extended break from work. It might be tempting to wait and see if the perfect job comes up, but it is generally better to get your foot-in-the-door. • Be positive and enthusiastic. Job seekers who can demonstrate that they have a positive attitude about a position are more likely to demonstrate their willingness to adapt to changing conditions. Job seekers should also approach employers about potential job opportunities. Support is available There are programmes and incentives that encourage employers to take on mature age people. The Restart Wage Subsidy provides financial assistance to employers who provide jobs to people aged 50 years or older. Employers may be able to receive payments over 24 months if they hire a full-time mature age job seeker who has been unemployed and on income support for six months. employment.gov.au/restart-wage-subsidy The Corporate Champions programme helps large employers to attract and retain mature age workers. The programme supports employers who commit to moving towards best practice in the recruitment and retention of mature age staff aged 45 years or over. Eligible employers can receive tailored support and assistance from an industry expert. employment.gov.au/corporate-champions Building your skills can improve your prospects Undertaking training can improve the prospects of workers re-entering the workforce or transitioning to another job. Age is not an impediment to study. In 2013, large numbers of people aged 50 years or older were enrolled in post-school education. The vast majority (more than 250,000) were in vocational education and training (VET), but more than 40,000 were undertaking higher education. Education and training can vary significantly, including • starting a degree or course in a field in which you have not previously studied or been employed • a short course for certification in areas such as Responsible Service of Alcohol or for a heavy vehicle licence • furthering your qualifications in a particular field by undertaking a postgraduate degree or higher level certificate. The three fields with the largest numbers of mature VET students enrolled for a qualification are • Management and Commerce (36,000 enrolled) • Society and Culture (32,500) • Engineering and Related Technologies (30,400). Student Enrolments in VET by Field of Education, Aged 50 Years or Older, 2013 (‘000) Management and Commerce 36.0 Society and Culture 32.5 Engineering and Related Technologies 30.4 Mixed Field Programmes 26.7 Education 14.8 Health 11.1 Food, Hospitality and Personal Services 8.9 Agriculture, Environmental and Related Studies 8.2 Architecture and Building 5.3 Creative Arts 3.7 Information Technology 3.5 Natural and Physical Sciences 1.0 0 5 10 15 20 25 30 35 40 Source: NCVER, Students and Courses, AQF qualification Significant numbers of students aged 50 years or older are also enrolled in higher education. The three fields with the largest numbers of mature age students studying for a qualification are • Society and Culture (16,000 enrolled) • Health (6,600) • Education (6,600). Student Enrolments in Higher Education by Field of Education, Aged 50 Years or Older, 2013 (’000) Society and Culture 16.0 Health 6.6 Education 6.6 Management and Commerce 4.5 Creative Arts 2.9 Natural and Physical Sciences 1.5 Engineering and Related Technologies 0.9 Agriculture, Environmental and Related Studies 0.7 Information Technology 0.6 Architecture and Building 0.5 0 5 10 15 20 Source: Department of Education and Training, Higher Education Student Data Collection, AQF qualification Sources: Department of Employment, Survey of Employers’ Recruitment Experiences; Department of Education and Training, Higher Education Student Data Collection; NCVER, Students and Courses 13 AUSTRALIAN JOBS 2015 JOBS BY INDUSTRY INDUSTRY OVERVIEW There are 19 broad industries. Three of these industries each employ more than one million Australians. Combined, the largest six employ around 56% of all workers. These are • Health Care and Social Assistance (12% of workforce) • Retail Trade (11%) • Construction (9%) • Professional, Scientific and Technical Services (8%) • Education and Training (8%) • Manufacturing (8%). The industry distribution of the labour market is changing. Slightly more than a decade ago, Manufacturing was Australia’s largest employing industry, now it is the sixth. As some industries lose jobs, others grow. In November 2014, there were 756,700 more jobs in the Australian labour market than five years earlier. The largest numbers of new jobs were in • Health Care and Social Assistance (up by 190,700) • Professional, Scientific and Technical Services (124,600) • Education and Training (92,700) • Construction (76,500) • Retail Trade (74,200). The educational profiles of industries are diverse. Some industries rely on the higher education sector for their skilled workers (for example, many workers in Health Care and Social Assistance and Education and Training have a bachelor degree or higher qualification) while others have large numbers of workers who have undertaken vocational education and training (like Construction). Which industries provide apprenticeship and traineeship opportunities? Many of the skilled workers who have completed vocational education and training have done so as an apprentice or trainee. Apprenticeships and traineeships are offered in every industry and are available to people of all ages, but most of these workers are aged 15 to 24 years. Employment outcomes for apprenticeship or traineeship graduates are good (see page 33). Apprenticeships and Traineeships, Enrolments by Industry (‘000) Construction 76.8 Manufacturing Over the five years to November 2014, employment gains in the growth industries were partially offset by falls in the following three industries (although some sectors of these rose). • Manufacturing (down by 79,200) • Wholesale Trade (27,900) • Agriculture, Forestry and Fishing (24,100). 46.5 Administrative and Support Services 33.1 Accommodation and Food Services 32.8 Other Services 29.6 Health Care and Social Assistance 27.8 Retail Trade 23.7 Transport, Postal and Warehousing 17.0 Public Administration and Safety Mining 12.4 10.5 Other industries 55.3 0 10 20 30 40 50 60 70 80 Source: NCVER, Apprentices and Trainees Employment by Industry Employment Employ’t % of total Nov 2014 workforce Industry Employment Profile 5 year change to Nov 2014 Projected employ’t change 5 year to Nov 2019 Female Aged 15 to 24 years Aged 45 years or older Regional % % % % ‘000 % ‘000 % ‘000 % Accommodation and Food Services 808.8 7 70.1 9.5 55 43 22 36 112.4 13.9 Administrative and Support Services 380.9 3 11.6 3.1 53 10 42 32 30.5 8.0 Agriculture, Forestry and Fishing 322.0 3 -24.1 -7.0 30 10 59 84 12.0 3.7 13.8 Arts and Recreation Services 226.5 2 31.2 16.0 47 30 29 24 31.3 1,057.9 9 76.5 7.8 11 17 36 34 137.9 13.0 Education and Training 912.1 8 92.7 11.3 70 8 48 32 142.7 15.6 Electricity, Gas, Water and Waste Services 139.5 1 13.4 10.6 21 7 43 40 5.4 3.8 Construction Financial and Insurance Services Health Care and Social Assistance Information Media and Telecommunications 411.7 4 8.2 2.0 50 8 33 15 46.4 11.3 1,383.1 12 190.7 16.0 78 10 45 32 258.0 18.7 216.8 2 5.9 2.8 38 13 33 18 8.6 4.0 Manufacturing 911.5 8 -79.2 -8.0 27 11 43 30 -26.2 -2.9 Mining 228.9 2 62.2 37.3 14 8 32 55 -40.7 -17.8 Other Services 476.0 4 33.6 7.6 43 18 38 34 36.0 7.6 Professional, Scientific and Technical Services 947.1 8 124.6 15.2 43 9 36 18 136.6 14.4 Public Administration and Safety 726.6 6 59.6 8.9 49 6 47 30 51.0 7.0 Rental, Hiring and Real Estate Services 220.9 2 41.5 23.1 50 15 40 27 27.8 12.6 1,246.3 11 74.2 6.3 56 33 29 34 111.1 8.9 10.2 Retail Trade Transport, Postal and Warehousing 599.7 5 32.7 5.8 23 9 48 30 61.0 Wholesale Trade 394.0 3 -27.9 -6.6 33 8 45 25 24.8 6.3 11,613.9 100 756.7 7.0 46 15 39 32 1,166.4 10.0 All Industries Sources: ABS, Labour Force (trend and 4 quarter averages); Department of Employment, Industry Employment Projections; NCVER, Apprentices and Trainees 14 AUSTRALIAN JOBS 2015 For more information see lmip.gov.au JOBS BY INDUSTRY INDUSTRY OUTLOOK ACCOMMODATION AND FOOD SERVICES Which industries will have the most new jobs over the next five years? Seventeen of the 19 industries are projected to increase their employment over the five years to November 2019. Health Care and Social Assistance is expected to provide the largest contribution (258,000 or one in every five new jobs), followed by Education and Training (142,700), Construction (137,900) and Professional, Scientific and Technical Services (136,600). Together, these four industries are projected to provide around half of all new jobs. The industries projected to grow most strongly are Health Care and Social Assistance (up by 18.7%), Education and Training (15.6%) and Professional, Scientific and Technical Services (14.4%). The two industries which are expected to have lower employment are Mining (down by 40,700 or 17.8%) and Manufacturing (26,200 or 2.9%). The decline in Manufacturing is a long-term structural change in the labour market, while Mining employment has peaked after strong rises in the ten years to 2013. Projected Employment Growth, Industry Share (% of total growth) Other 18.1% Education and Training 11.6% Professional, Scientific and Technical Services 11.1% Source: Department of Employment, Industry Employment Projections The chart below provides more disaggregated information about sectors where the new jobs will be. It shows the diversity of employment growth, but highlights the importance of services sectors. Projected Employment Growth, Top 10 Industry Sectors (‘000) Professional, Scientific and Technical Services 109.5 (Except Computer System Design and Related Services) Construction Services 108.9 Food and Beverage Services 100.7 90.3 66.8 Preschool and School Education 57% 55% 43% 22% 36% 30% 46% 15% 39% 32% 12% 24% 57% 29% 31% 34% 107,100 86,500 77,600 77,000 66,900 121,300 128,000 82,000 507,900 89,600 Employment Profile Working part-time Female Aged 15 to 24 years Aged 45 years or older Regional Workforce Educational Profile With a bachelor degree or higher qual With a cert III or higher VET qual Without a post-school qual Top 5 Occupations Waiters Kitchenhands Bar Attendants and Baristas Sales Assistants, General Chefs Jobs are available in almost every location, with more than 280,000 in regional areas. Construction 11.2% Social Assistance Services 11,613,900 1.2% 7.0% 10.0% Reflecting the dominance of the Food and Beverage Services sector (which has about 85% of employment in the industry), almost one in four jobs is for Waiters and Kitchenhands. Retail Trade 9.0% Medical and Other Health Care Services All industries 808,800 5.2% 9.5% 13.9% Over the next five years, employment is projected to continue to increase strongly (up by 13.9% or 112,400). Almost all of the new jobs are expected to be in the Food and Beverage Services sector (up by 100,700 or 14.4%). Public Administration and Safety 4.1% Accommodation and Food Services 9.1% This industry Accommodation and Food Services represents 7% of Australia’s workforce. This industry experienced strong growth (up by 9.5%) over the five years to November 2014, with 70,100 new jobs. Health Care and Social Assistance 20.9% Transport, Postal and Warehousing 4.9% Employment Employment Nov 2014 1 year change to Nov 2014 5 year change to Nov 2014 5 year projected change to Nov 2019 Accommodation and Food Services has the youngest age profile of any industry, with the lowest proportion of workers aged 45 years or older and the highest proportion of workers aged 15 to 24 years. This industry provides good entry-level opportunities to the labour market. Almost three in every five workers do not hold post-school qualifications, but around 24,000 of the young workers in this industry are apprentices or trainees. Workers in this industry are more likely to be employed part-time than those in other industries, with many people combining work with study. Age Profile Accommodation and Food Services (% of industry total) 15 - 24 years 25 - 34 years 35 - 44 years 45 - 54 years 55 years and over 62.4 Hospitals 53.9 Other Store-Based Retailing 43 22 13 13 9 48.4 Residential Care Services 46.7 Adult, Community and Other Education Source: ABS, Labour Force 40.8 0 20 40 60 80 100 120 Source: Department of Employment, Industry Employment Projections For more detailed employment projections see lmip.gov.au, including for where employment is increasing or decreasing by industry. Sources: ABS, Labour Force (trend and 4 quarter averages); ABS, Education and Work; Department of Employment, Industry Employment Projections; NCVER, Apprentices and Trainees 15 AUSTRALIAN JOBS 2015 For more information see lmip.gov.au JOBS BY INDUSTRY ADMINISTRATIVE AND SUPPORT SERVICES AGRICULTURE, FORESTRY AND FISHING Employment Employment Nov 2014 1 year change to Nov 2014 5 year change to Nov 2014 5 year projected change to Nov 2019 This industry All industries 380,900 -2.3% 3.1% 8.0% 11,613,900 1.2% 7.0% 10.0% 43% 53% 10% 42% 32% 30% 46% 15% 39% 32% 22% 25% 46% 29% 31% 34% 69,800 26,600 22,900 22,200 19,800 147,200 29,500 44,900 79,300 23,900 Employment Profile Employment Nov 2014 1 year change to Nov 2014 5 year change to Nov 2014 5 year projected change to Nov 2019 Workforce Educational Profile All industries 322,000 4.8% -7.0% 3.7% 11,613,900 1.2% 7.0% 10.0% Working part-time Female Aged 15 to 24 years Aged 45 years or older Regional 27% 30% 10% 59% 84% 30% 46% 15% 39% 32% 12% 29% 49% 29% 31% 34% 80,200 42,900 30,100 27,300 19,300 89,300 38,100 39,700 27,300 20,100 Workforce Educational Profile With a bachelor degree or higher qual With a cert III or higher VET qual Without a post-school qual Top 5 Occupations With a bachelor degree or higher qual With a cert III or higher VET qual Without a post-school qual Top 5 Occupations Cleaners, Commercial Cleaners, Domestic Human Resource Professionals Gardeners Tourism and Travel Advisors Administrative and Support Services is a small industry with 3% of national employment (380,900). Employment increased at a relatively low rate over the five years to November 2014 (up by 3.1% or 11,600), and there were some job losses in 2014. Employment growth is projected to be stronger over the next five years (up by 8.0% or 30,500) but still below the average across all industries (10.0%). Labourers make up a higher proportion of workers in Administrative and Support Services than in any other industry (38.1% compared with the all industries average of 9.4%). One in four workers is a Cleaner (Commercial or Domestic). Almost one third of this industry’s jobs (around 122,500) are in regional areas. Compared with the all industries averages, workers in this industry are more likely to be female and be employed part-time. The workforce has a relatively old age profile. Just 10% of workers are aged 15 to 24 years (compared with 15% across all industries) and around 42% are 45 years or older (compared with the all industries average of 39%). Relatively few workers in Administrative and Support Services have post-school qualifications (54%), but more than 24,000 of its young workers are apprentices or trainees. Age Profile Administrative and Support Services (% of industry total) 25 - 34 years 35 - 44 years 45 - 54 years Farmers, Livestock Farmers, Crop Farm Workers, Livestock Farmers, Mixed Crop and Livestock Farm Workers, Crop Agriculture, Forestry and Fishing employs 322,000 workers and accounts for 3% of national employment. Employment fell by 7.0% or 24,100 over the five years to November 2014 but there was some growth in jobs in 2014. Over the five years to November 2019 employment is expected to rise (up by 3.7% or 12,000), but at a lower rate than the average for all industries. The vast majority of jobs in this industry are in the Agriculture sector (284,200). Around 21,000 people work in Aquaculture, Forestry and Logging, and Fishing, Hunting and Trapping combined. Around 84% (270,500) of jobs are in regional areas, so there are good opportunities for employment in this industry outside the capital cities. Employment is concentrated in a small number of occupations. Farmers and Farm Managers account for almost half of the workforce. Almost half the workers do not hold post-school qualifications, and those who do are significantly more likely to have completed vocational education and training than university studies. Agriculture, Forestry and Fishing has the oldest age profile of any industry. About 59% of workers are aged 45 years or older and just 10% are aged 15 to 24 years (compared with the all industries averages of 39% and 15%, respectively). Age Profile Agriculture, Forestry and Fishing (% of industry total) 15 - 24 years 25 23 24 25 - 34 years 35 - 44 years 45 - 54 years 55 years and over 55 years and over 10 10 This industry Employment Profile Working part-time Female Aged 15 to 24 years Aged 45 years or older Regional 15 - 24 years Employment 13 18 21 38 18 Source: ABS, Labour Force Source: ABS, Labour Force Sources: ABS, Labour Force (trend and 4 quarter averages); ABS, Education and Work; Department of Employment, Industry Employment Projections; NCVER, Apprentices and Trainees 16 AUSTRALIAN JOBS 2015 For more information see lmip.gov.au JOBS BY INDUSTRY ARTS AND RECREATION SERVICES Employment CONSTRUCTION This industry All industries 226,500 9.9% 16.0% 13.8% 11,613,900 1.2% 7.0% 10.0% 50% 47% 30% 29% 24% 30% 46% 15% 39% 32% 30% 22% 44% 29% 31% 34% 18,300 9,900 8,700 8,400 7,800 45,100 27,600 14,000 13,800 12,700 Employment Nov 2014 1 year change to Nov 2014 5 year change to Nov 2014 5 year projected change to Nov 2019 Employment Profile Employment Nov 2014 1 year change to Nov 2014 5 year change to Nov 2014 5 year projected change to Nov 2019 This industry All industries 1,057,900 4.7% 7.8% 13.0% 11,613,900 1.2% 7.0% 10.0% 15% 11% 17% 36% 34% 30% 46% 15% 39% 32% 10% 50% 34% 29% 31% 34% 105,900 87,900 73,600 67,800 43,700 128,000 141,700 86,000 80,700 51,300 Employment Profile Working part-time Female Aged 15 to 24 years Aged 45 years or older Regional Workforce Educational Profile Working part-time Female Aged 15 to 24 years Aged 45 years or older Regional Workforce Educational Profile With a bachelor degree or higher qual With a cert III or higher VET qual Without a post-school qual Top 5 Occupations With a bachelor degree or higher qual With a cert III or higher VET qual Without a post-school qual Top 5 Occupations Sports Coaches, Instructors and Officials Fitness Instructors Music Professionals Sportspersons Managers, Amusement, Fitness and Sports Centre Arts and Recreation Services is a small employing industry with 226,500 workers, or 2% of national employment. It covers a diverse range of activities including the operation of casinos, museums, parks and gardens, creative and performing arts, and professional and recreational sports. Over the five years to November 2014, employment rose strongly (up by 16.0% or 31,200). Employment is projected to continue to increase strongly over the next five years (up by 13.8% or 31,300), well above the average growth rate across all industries (10.0%). Employment is concentrated in the Sports and Recreation Activities sector (129,700) and the largest employing occupations tend to be related to these activities. About three quarters of the jobs in Arts and Recreation Services are in capital cities, but the industry employs around 54,400 people in regional areas. Half the workers are employed part-time and about 30% of workers are aged 15 to 24 years (compared with 15% across all industries). A relatively small proportion of workers are aged 45 years or older. Around 44% of workers do not hold post-school qualifications, compared with 34% across all industries. Age Profile Arts and Recreation Services (% of industry total) 15 - 24 years Employment 25 - 34 years 30 35 - 44 years 22 45 - 54 years 20 55 years and over 16 13 Carpenters and Joiners Electricians Plumbers Managers, Construction Painting Trades Workers Construction is the third largest employing industry in Australia, with 9% of national employment. More than one million people are employed in the industry. Employment growth was slightly stronger than the all industries average over the five years to November 2014 (7.8%) with 76,500 new jobs created. Growth was particularly strong in 2014 (4.7% compared with the all industries average of 1.2%). Employment is projected to continue to rise strongly over the five years to November 2019 (up by 13.0% or 137,900). The Construction workforce is dominated by Technicians and Trades Workers. Four of the five largest employing occupations are Technicians and Trades Workers, and Carpenter and Joiner comprises around 10% of employment in the industry. Construction has the lowest proportion of females of any industry and workers are predominantly employed full-time. This large industry offers many jobs in regional areas (around 360,000). The workforce is younger than the all industries average, with a slightly higher proportion of workers aged 15 to 24 years and a lower proportion of workers aged 45 years or older. Consistent with its occupational profile, half the workers in Construction hold vocational education and training qualifications at the certificate III or higher level. More than 53,000 young workers in this industry are employed as apprentices or trainees. Age Profile Construction (% of industry total) 15 - 24 years 25 - 34 years 35 - 44 years 45 - 54 years 55 years and over Source: ABS, Labour Force 17 26 22 20 16 Source: ABS, Labour Force Sources: ABS, Labour Force (trend and 4 quarter averages); ABS, Education and Work; Department of Employment, Industry Employment Projections; NCVER, Apprentices and Trainees 17 AUSTRALIAN JOBS 2015 For more information see lmip.gov.au JOBS BY INDUSTRY EDUCATION AND TRAINING Employment This industry All industries 912,100 2.5% 11.3% 15.6% 11,613,900 1.2% 7.0% 10.0% 40% 70% 8% 48% 32% 30% 46% 15% 39% 32% 63% 20% 13% 29% 31% 34% 142,400 117,600 66,200 49,500 30,900 143,800 118,100 71,700 50,900 32,100 Employment Nov 2014 1 year change to Nov 2014 5 year change to Nov 2014 5 year projected change to Nov 2019 Employment Profile Working part-time Female Aged 15 to 24 years Aged 45 years or older Regional Workforce Educational Profile With a bachelor degree or higher qual With a cert III or higher VET qual Without a post-school qual Top 5 Occupations Teachers, Primary School Teachers, Secondary School Education Aides University Lecturers and Tutors Tutors and Teachers, Private Education and Training is a large, strongly growing industry, with 912,100 workers or 8% of national employment. Employment increased by 11.3% (or 92,700) over the five years to November 2014, and by 2.5% (or 22,400) over the past year. Adult, Community and Other Education accounted for the largest number of new jobs. Over the five years to November 2019, employment is projected to continue to increase strongly (up by 15.6% or 142,700), well above the all industries average (10.0%). The proportion of the Education and Training workforce employed in regional areas is the same as the all industries average, but its large workforce size means there are almost 300,000 jobs outside the capital cities. ELECTRICITY, GAS, WATER AND WASTE SERVICES Employment Employment Nov 2014 1 year change to Nov 2014 5 year change to Nov 2014 5 year projected change to Nov 2019 This industry All industries 139,500 -8.5% 10.6% 3.8% 11,613,900 1.2% 7.0% 10.0% 9% 21% 7% 43% 40% 30% 46% 15% 39% 32% 25% 39% 29% 29% 31% 34% 11,700 8,100 7,800 4,700 4,500 189,300 141,700 10,800 123,800 193,000 Employment Profile Working part-time Female Aged 15 to 24 years Aged 45 years or older Regional Workforce Educational Profile With a bachelor degree or higher qual With a cert III or higher VET qual Without a post-school qual Top 5 Occupations Drivers, Truck Electricians Electrical Distribution Trades Workers Metal Fitters and Machinists Accountants Electricity, Gas, Water and Waste Services is Australia’s smallest industry, with around 139,500 workers, or 1% of national employment. Although employment growth was strong over the five years to November 2014 (up by 10.6% or 13,400), employment fell by 8.5% in the year to November 2014. Below average employment growth is expected over the five years to November 2019 (3.8% or 5,400). This industry has a slightly larger proportion of its workforce in regional areas than the national average (40% compared with 32%), providing around 55,800 jobs outside capital cities. About 55% of this industry’s workers are Professionals (compared with the all industries average of 21%), with teachers being the largest occupations. Reflecting this, the industry is highly skilled. The majority of workers hold a bachelor degree or higher qualification and only around one in ten workers does not have a post-school qualification. Almost all workers in this industry are employed full-time and the workforce is male dominated (around four in five workers are male). In light of the time required to gain relevant qualifications, few of the workers are aged 15 to 24 years, but Education and Training has the second highest proportion of workers aged 45 years or older across all industries. The occupational profile is diverse, with Machinery Operators and Drivers, Technicians and Trades Workers and Professionals represented in the five largest employing occupations. This industry’s workforce is female dominated (70% of workers are female) and part-time employment is common. Age Profile Education and Training (% of industry total) 15 - 24 years 8 25 - 34 years 21 35 - 44 years 23 Source: ABS, Labour Force 45 - 54 years 25 55 years and over 23 The workforce is skilled, with more than 70% of workers holding post-school, mainly vocational education and training, qualifications. Around two in every five have a certificate III or higher level vocational education and training qualification. A slightly higher proportion of Electricity, Gas, Water and Waste Services workers are aged 45 years or older compared with all industries (43% compared with 39%) and relatively few are young (7% of the workforce is aged 15 to 24 years). Age Profile Electricity, Gas, Water and Waste Services (% of industry total) 15 - 24 years 7 25 - 34 years 23 35 - 44 years 27 45 - 54 years 55 years and over 25 18 Source: ABS, Labour Force Sources: ABS, Labour Force (trend and 4 quarter averages); ABS, Education and Work; Department of Employment, Industry Employment Projections 18 AUSTRALIAN JOBS 2015 For more information see lmip.gov.au JOBS BY INDUSTRY FINANCIAL AND INSURANCE SERVICES Employment Employment Nov 2014 1 year change to Nov 2014 5 year change to Nov 2014 5 year projected change to Nov 2019 HEALTH CARE AND SOCIAL ASSISTANCE This industry All industries 411,700 -1.1% 2.0% 11.3% 11,613,900 1.2% 7.0% 10.0% 17% 50% 8% 33% 15% 30% 46% 15% 39% 32% 48% 23% 24% 29% 31% 34% 52,400 40,200 26,600 24,600 22,300 52,500 49,100 29,300 28,800 26,400 Employment Profile Employment Employment Nov 2014 1 year change to Nov 2014 5 year change to Nov 2014 5 year projected change to Nov 2019 This industry All industries 1,383,100 -0.4% 16.0% 18.7% 11,613,900 1.2% 7.0% 10.0% 44% 78% 10% 45% 32% 30% 46% 15% 39% 32% 45% 32% 18% 29% 31% 34% 224,600 124,300 104,500 83,300 77,600 231,500 141,000 130,200 89,800 162,200 Employment Profile Working part-time Female Aged 15 to 24 years Aged 45 years or older Regional Workforce Educational Profile Working part-time Female Aged 15 to 24 years Aged 45 years or older Regional Workforce Educational Profile With a bachelor degree or higher qual With a cert III or higher VET qual Without a post-school qual Top 5 Occupations With a bachelor degree or higher qual With a cert III or higher VET qual Without a post-school qual Top 5 Occupations Bank Workers Financial Investment Advisers and Managers Clerks, Insurance, Money Market and Statistical Credit and Loans Officers Financial Brokers Nurses, Registered Carers, Aged and Disabled Carers, Child Nursing Support and Personal Care Workers Receptionists Financial and Insurance Services is a relatively small employing industry with around 411,700 workers (or 4% of national employment). Over the five years to November 2014, employment rose by 8,200 (or 2.0%). Employment fell, though, in 2014. Health Care and Social Assistance is Australia’s largest employing industry and one of the strongest growing. Its almost 1.4 million workers account for 12% of national employment. It is also the largest employing industry in regional Australia, with around 442,600 jobs. Employment growth is expected to be strong over the five years to November 2019 (up by 11.3% or 46,400). This industry has been the primary provider of new jobs in the Australian labour market since the 1990s. Over the five years to November 2014, employment increased by 16.0% (or 190,700). Employment is highly concentrated in the capital cities (85%), particularly in Sydney and Melbourne where many financial institutions have their head offices. Over the five years to November 2019, employment is expected to increase by 258,000 (or 18.7%). Relatively few people work part-time (17%) compared with the all industries average (30%). Half the workforce is female, higher than all industries (46%). The industry’s workforce is female dominated (reflecting the profile of many of the largest occupations), and there are good opportunities for part-time employment. This industry employs a relatively narrow range of occupations. Clerical and Administrative Workers and Professionals dominate, accounting for almost four in every five workers, markedly higher than their share of total national employment (35%). Workers in the Health Care and Social Assistance industry are generally highly skilled. More than four in five have completed post-school study and 45% have a bachelor degree or higher qualification, reflecting the requirements for entry to many of the major occupations in this sector. A high proportion of workers are Professionals (almost twice the national average). Given the significant employment of Professionals, the higher education sector plays an important role in the provision of skills. Almost half of this industry’s workers hold a bachelor degree or higher qualification. Reflecting this, few young workers are employed (8% of the workers are aged 15 to 24 years compared with the all industries average of 15%). Age Profile Financial and Insurance Services (% of industry total) 15 - 24 years 25 - 34 years 35 - 44 years 45 - 54 years 55 years and over Consistent with the time required to gain relevant qualifications, a relatively small proportion of workers are aged 15 to 24 years (10% compared with 15% across all industries). Despite this, Health Care and Social Assistance is the fourth largest employer of young workers. The industry has a higher proportion of workers in the 45 years and older age groups than the all industries average (45% compared with 39%). Age Profile Health Care and Social Assistance (% of industry total) 15 - 24 years 8 30 29 20 25 - 34 years 35 - 44 years 45 - 54 years 55 years and over 13 10 23 22 24 21 Source: ABS, Labour Force Source: ABS, Labour Force Sources: ABS, Labour Force (trend and 4 quarter averages); ABS, Education and Work; Department of Employment, Industry Employment Projections 19 AUSTRALIAN JOBS 2015 For more information see lmip.gov.au JOBS BY INDUSTRY INFORMATION MEDIA AND TELECOMMUNICATIONS Employment Employment Nov 2014 1 year change to Nov 2014 5 year change to Nov 2014 5 year projected change to Nov 2019 MANUFACTURING Employment This industry All industries 216,800 11.4% 2.8% 4.0% 11,613,900 1.2% 7.0% 10.0% 20% 38% 13% 33% 18% 30% 46% 15% 39% 32% 38% 25% 31% 29% 31% 34% 16,900 13,400 9,000 7,700 6,700 28,000 24,400 60,200 7,900 12,200 Employment Profile Working part-time Female Aged 15 to 24 years Aged 45 years or older Regional Workforce Educational Profile With a bachelor degree or higher qual With a cert III or higher VET qual Without a post-school qual Top 5 Occupations Telecommunications Trades Workers Journalists and Other Writers Managers, ICT Directors, Film, Television, Radio and Stage Directors, Artistic, and Media Producers and Presenters Information Media and Telecommunications is a diverse industry and includes newspaper and Internet publishing, radio and broadcasting. It is a small employing industry with 216,800 workers, or 2% of national employment. Employment increased by 5,900 (or 2.8%) over the five years to November 2014. Most new jobs were created in Telecommunications Services, with some job losses in other sectors. Employment Nov 2014 1 year change to Nov 2014 5 year change to Nov 2014 5 year projected change to Nov 2019 This industry All industries 911,500 -2.3% -8.0% -2.9% 11,613,900 1.2% 7.0% 10.0% 17% 27% 11% 43% 30% 30% 46% 15% 39% 32% 16% 36% 42% 29% 31% 34% 44,000 35,600 33,300 28,300 27,700 71,700 123,800 52,500 53,000 30,700 Employment Profile Working part-time Female Aged 15 to 24 years Aged 45 years or older Regional Workforce Educational Profile With a bachelor degree or higher qual With a cert III or higher VET qual Without a post-school qual Top 5 Occupations Structural Steel and Welding Trades Workers Metal Fitters and Machinists Managers, Production Packers Factory Workers, Food and Drink Over the five years to November 2014, employment in Manufacturing decreased by 79,200 (or 8.0%), the largest fall of any industry. Nonetheless, it is still a large employer of Australian workers, with around 8% of total employment, or more than 910,000 jobs. Manufacturing is a large and diverse industry. While employment over the five years to November 2014 fell in 12 of the 15 sectors, there were employment gains in the Petroleum and Coal Product Manufacturing, Basic Chemical and Chemical Product Manufacturing, and Furniture and Other Manufacturing sectors. Over the five years to November 2019, employment is expected to rise at a slightly stronger rate (up by 4.0% or 8,600) than it has in the past five, but still well below the all industries average. The long-term decline in Manufacturing is expected to continue, with employment projected to decrease by 26,200 (or 2.9%) over the five years to November 2019, driven, in part, by a projected fall of 23,800 (or 47.5%) in Motor Vehicle and Motor Vehicle Part Manufacturing. Greater Sydney has a relatively high concentration of this industry’s jobs (34%) and relatively few jobs are located in regional areas (18%). Most Manufacturing workers are male (73%), and the vast majority of employment is full-time (83%). More than one third of the workers in Information Media and Telecommunications are Professionals, however, the top five occupations demonstrate the diversity of jobs offered in this industry. Technicians and Trades Workers is the largest occupational group and vocational education and training is a key provider of skills to this industry. More than 19,000 young workers are employed as apprentices or trainees. A relatively high proportion of workers hold a certificate III or higher vocational education and training qualification, but few have a bachelor degree or higher qualification. Reflecting the concentration of workers in skilled occupations, a high proportion of workers hold a bachelor degree or higher qualification. The workforce has a relatively old age profile, with 43% of workers aged 45 years or older (compared with 39% across all industries) and a low proportion aged 15 to 24 years (11% compared with the all industries average of 15%). Relatively small proportions of the workers in this industry are in the younger and mature age groups. Age Profile Information Media and Telecommunications (% of industry total) 15 - 24 years 25 - 34 years 35 - 44 years 45 - 54 years Age Profile Manufacturing (% of industry total) 55 years and over 15 - 24 years 13 30 24 20 35 - 44 years 45 - 54 years 55 years and over 13 11 Source: ABS, Labour Force 25 - 34 years 22 23 24 19 Source: ABS, Labour Force Sources: ABS, Labour Force (trend and 4 quarter averages); ABS, Education and Work; Department of Employment, Industry Employment Projections; NCVER, Apprentices and Trainees 20 AUSTRALIAN JOBS 2015 For more information see lmip.gov.au JOBS BY INDUSTRY MINING OTHER SERVICES Employment Employment Nov 2014 1 year change to Nov 2014 5 year change to Nov 2014 5 year projected change to Nov 2019 This industry All industries 228,900 -15.8% 37.3% -17.8% 11,613,900 1.2% 7.0% 10.0% 3% 14% 8% 32% 55% 30% 46% 15% 39% 32% 20% 45% 30% 29% 31% 34% 50,600 24,900 13,000 12,300 10,900 52,700 123,800 25,000 189,300 141,700 Employment Profile Employment This industry All industries 476,000 0.4% 7.6% 7.6% 11,613,900 1.2% 7.0% 10.0% 30% 43% 18% 38% 34% 30% 46% 15% 39% 32% 14% 49% 29% 29% 31% 34% 65,000 63,100 22,200 21,500 16,200 101,700 63,400 24,500 123,800 16,600 Employment Nov 2014 1 year change to Nov 2014 5 year change to Nov 2014 5 year projected change to Nov 2019 Employment Profile Working part-time Female Aged 15 to 24 years Aged 45 years or older Regional Workforce Educational Profile Working part-time Female Aged 15 to 24 years Aged 45 years or older Regional Workforce Educational Profile With a bachelor degree or higher qual With a cert III or higher VET qual Without a post-school qual Top 5 Occupations With a bachelor degree or higher qual With a cert III or higher VET qual Without a post-school qual Top 5 Occupations Drillers, Miners and Shot Firers Metal Fitters and Machinists Technicians, Other Building and Engineering Drivers, Truck Electricians Motor Mechanics Hairdressers Beauty Therapists Metal Fitters and Machinists Panelbeaters Mining is a small industry, with employment of 228,900 or 2% of the national total. The industry recorded the strongest growth of any industry over the five years to November 2014 (up by 37.3% or 62,200). Employment in Mining has peaked, though, and there have been some job losses in the past few years. Employment fell by 43,000 (or 15.8%) over 2014. Other Services, which has employment of 476,000 and accounts for 4% of the national total, is a diverse industry which includes personal care, funeral and religious services, machinery and automotive repair and maintenance activities. This diversity is highlighted by the range of the occupations employed (see the top 5 occupations listed above). Employment is projected to fall further (down by 40,700 or 17.8%) over the five years to November 2019, with lower employment expected in all sectors. The largest number of job losses is projected for Exploration and Other Mining Support Services. Employment rose by 33,600 (or 7.6%) over the five years to November 2014. New jobs were almost evenly split between the Personal and Other Services sectors (15,400) and Repair and Maintenance (up by 15,200). Western Australia (42%) and Queensland (29%) have high concentrations of Mining employment, and the industry is a significant employer in some regional areas. Around 125,900 workers (or 55% of the workforce) are employed in regional Australia. Employment growth over the five years to November 2019 is expected to continue at the same rate as it has over the past five (up by 7.6% or 36,000). Most workers in Mining are male (86%), and almost everyone works full-time (97%). The workforce is relatively skilled, with the vocational education and training sector being a key provider of skills. About 45% of the workers hold a certificate III or higher vocational education and training qualification. Employment is dominated by Machinery Operators and Drivers (33%) and Technicians and Trades Workers (28%), compared with the all industries averages (6% and 14%, respectively). There are few jobs in this industry for young workers (just 8% of workers are aged 15 to 24 years). Age Profile Mining (% of industry total) 15 - 24 years 8 25 - 34 years 29 Around 57% of workers in this industry are male (slightly above the all industries average of 54%) and employment is generally full-time (70%). A relatively high proportion of the workforce holds post-school qualifications, but few workers have a bachelor degree or higher qualification. Technicians and Trades Workers comprise almost half the workforce in this industry and, reflecting this, almost half its workers hold a certificate III or higher vocational education and training qualification. Workers aged 15 to 24 years make up a slightly larger proportion of this industry’s workforce than they do across all industries (18% compared with 15%). Almost 23,000 young workers are employed as apprentices or trainees. Age Profile Other Services (% of industry total) 35 - 44 years 31 45 - 54 years 55 years and over 21 15 - 24 years 25 - 34 years 18 25 35 - 44 years 45 - 54 years 55 years and over 11 19 20 18 Source: ABS, Labour Force Source: ABS, Labour Force Sources: ABS, Labour Force (trend and 4 quarter averages); ABS, Education and Work; Department of Employment, Industry Employment Projections; NCVER, Apprentices and Trainees 21 AUSTRALIAN JOBS 2015 For more information see lmip.gov.au JOBS BY INDUSTRY PROFESSIONAL, SCIENTIFIC AND TECHNICAL SERVICES Employment Employment Nov 2014 1 year change to Nov 2014 5 year change to Nov 2014 5 year projected change to Nov 2019 PUBLIC ADMINISTRATION AND SAFETY Employment This industry All industries 947,100 6.3% 15.2% 14.4% 11,613,900 1.2% 7.0% 10.0% 22% 43% 9% 36% 18% 30% 46% 15% 39% 32% 59% 20% 17% 29% 31% 34% 92,500 46,400 45,900 27,200 25,400 193,000 56,900 85,600 49,400 53,700 Employment Profile Working part-time Female Aged 15 to 24 years Aged 45 years or older Regional Workforce Educational Profile With a bachelor degree or higher qual With a cert III or higher VET qual Without a post-school qual Top 5 Occupations Accountants Solicitors Software and Applications Programmers Graphic and Web Designers, and Illustrators Management and Organisation Analysts Professional, Scientific and Technical Services is Australia’s fourth largest employing industry, with 947,100 workers or 8% of national employment. It includes a diverse range of activities, such as legal and accounting services, veterinary services and computer system design. Over the five years to November 2014, this industry experienced strong growth (up by 15.2% or 124,600). Strong growth is expected to continue over the five years to November 2019 (up by 14.4% or 136,600). Architectural, Engineering and Technical Services and Legal and Accounting Services combined are expected to add around 80,000 new jobs. This industry has a highly skilled workforce. Four in five workers hold post-school qualifications, three of whom hold a bachelor degree or higher qualification. Consistent with this, more than half the jobs in this industry are for Professionals. Young workers and older workers comprise relatively low proportions of this industry’s workforce (9% of the workforce is aged 15 to 24 years and 36% of workers are 45 years or older). Employment Nov 2014 1 year change to Nov 2014 5 year change to Nov 2014 5 year projected change to Nov 2019 This industry All industries 726,600 -4.1% 8.9% 7.0% 11,613,900 1.2% 7.0% 10.0% 18% 49% 6% 47% 30% 30% 46% 15% 39% 32% 39% 30% 24% 29% 31% 34% 53,500 53,600 40,900 32,500 22,300 53,500 252,100 55,900 125,000 30,700 Employment Profile Working part-time Female Aged 15 to 24 years Aged 45 years or older Regional Workforce Educational Profile With a bachelor degree or higher qual With a cert III or higher VET qual Without a post-school qual Top 5 Occupations Police Clerks, General Security Officers and Guards Contract, Programme and Project Administrators Inspectors and Regulatory Officers This industry includes government administration and services that maintain or enforce public order and regulations. Public Administration and Safety employs 726,600 Australians or 6% of the national total. Over the five years to November 2014, employment rose strongly (up by 8.9% or 59,600), but there have been some job losses over the past year. Employment is expected to rise, albeit at a relatively low rate (up by 7.0% or 51,000) over the five years to November 2019. The ACT has a relatively high share of the jobs in this industry (66,100 or about 9% of the industry total) reflecting the location of most of the Australian Government’s administration. The workforce is highly skilled, with a relatively large proportion of workers holding post-school qualifications. Almost two in five hold a bachelor degree or higher qualification. Reflecting the skill profile, a significant proportion of workers in this industry are Professionals, although the largest occupational group is Clerical and Administrative Workers. Employment is concentrated in capital cities, but there are around 170,500 jobs in regional areas. This industry’s workforce has a relatively old age profile. About 47% of the workers are aged 45 years or older (compared with 39% across all industries) and just 6% are aged 15 to 24 years (compared with 15%). Age Profile Professional, Scientific and Technical Services (% of industry total) Age Profile Public Administration and Safety (% of industry total) 15 - 24 years 15 - 24 years 25 - 34 years 35 - 44 years 45 - 54 years 6 9 29 26 20 25 - 34 years 35 - 44 years 45 - 54 years 55 years and over 55 years and over 22 25 27 20 16 Source: ABS, Labour Force Source: ABS, Labour Force Sources: ABS, Labour Force (trend and 4 quarter averages); ABS, Education and Work; Department of Employment, Industry Employment Projections 22 AUSTRALIAN JOBS 2015 For more information see lmip.gov.au JOBS BY INDUSTRY RENTAL, HIRING AND REAL ESTATE SERVICES Employment Employment Nov 2014 1 year change to Nov 2014 5 year change to Nov 2014 5 year projected change to Nov 2019 RETAIL TRADE Employment This industry All industries 220,900 13.1% 23.1% 12.6% 11,613,900 1.2% 7.0% 10.0% 24% 50% 15% 40% 27% 30% 46% 15% 39% 32% 25% 33% 35% 29% 31% 34% 75,600 11,900 8,400 8,400 7,500 87,100 69,100 12,400 252,100 162,200 Employment Profile Working part-time Female Aged 15 to 24 years Aged 45 years or older Regional Workforce Educational Profile With a bachelor degree or higher qual With a cert III or higher VET qual Without a post-school qual Top 5 Occupations Real Estate Sales Agents Managers, Other Hospitality, Retail and Service Land Economists and Valuers Clerks, General Receptionists Rental, Hiring and Real Estate Services is a small employing industry with 220,900 workers or 2% of national employment. Over the five years to November 2014, employment grew strongly (up by 23.1% or 41,500). The increase was driven by strong growth in Property Operators and Real Estate Services (up by 24.2%), and Rental and Hiring Services (except Real Estate) (17.1%). This industry All industries 1,246,300 1.5% 6.3% 8.9% 11,613,900 1.2% 7.0% 10.0% 49% 56% 33% 29% 34% 30% 46% 15% 39% 32% 13% 23% 58% 29% 31% 34% 385,500 162,200 113,500 56,200 44,100 507,900 220,500 139,200 50,000 39,200 Employment Nov 2014 1 year change to Nov 2014 5 year change to Nov 2014 5 year projected change to Nov 2019 Employment Profile Working part-time Female Aged 15 to 24 years Aged 45 years or older Regional Workforce Educational Profile With a bachelor degree or higher qual With a cert III or higher VET qual Without a post-school qual Top 5 Occupations Sales Assistants, General Managers, Retail Checkout Operators and Office Cashiers Shelf Fillers Sales Assistants, Pharmacy Retail Trade is Australia’s second largest employing industry with more than 1.2 million workers, or around one in ten working Australians. It provides jobs in almost every location, with around 423,700 employed in regional Australia. Employment is expected to increase at an above average rate over the five years to November 2019 (up by 12.6% or 27,800), with the vast majority of new jobs expected to be created in Property Operators and Real Estate Services. Although employment growth over the five years to November 2014 (6.3%) was lower than the all industries average, around 74,200 jobs were created in this industry. Large numbers of new jobs are in Food Retailing (up by 29,200 or 8.0%) and Other Store-Based Retailing (13,900 or 2.2%), which includes store based retailing which is not food, fuel or motor vehicle related. These increases were, however, partially offset by lower employment in Fuel Retailing (down by 4,100 or 13.1%). The industry’s workforce has a slightly higher proportion of females than the national average, and workers are more likely to be employed full-time. Retail Trade employment growth is projected to strengthen, but remain slightly below the all industries average over the five years to November 2019 (up by 8.9% or 111,100). The proportion of workers who do not hold a post-school qualification is similar to the all industries average, but a lower proportion holds a bachelor degree or higher. The workforce is predominantly female and almost half the workers are employed part-time. More than half the jobs in this industry are for Sales Workers. Sales Workers are key to Rental, Hiring and Real Estate Services, with about one in every three workers being a Real Estate Sales Agent, but Clerical and Administrative Workers are also important, accounting for more than one in every five jobs. One in three workers in the industry is aged 15 to 24 years, representing 411,300 jobs for young people. The industry’s age profile is very similar to that for all industries. Age Profile Rental, Hiring and Real Estate Services (% of industry total) 15 - 24 years 25 - 34 years 35 - 44 years 45 - 54 years More than half the industry’s workers do not hold post-school qualifications, making Retail Trade a good entry point to the labour market. The high availability of part-time employment also makes it ideal for combining work and study. Age Profile Retail Trade (% of industry total) 55 years and over 15 - 24 years 15 24 22 21 25 - 34 years 45 - 54 years 22 16 55 years and over 19 33 Source: ABS, Labour Force 35 - 44 years 15 14 Source: ABS, Labour Force Sources: ABS, Labour Force (trend and 4 quarter averages); ABS, Education and Work; Department of Employment, Industry Employment Projections 23 AUSTRALIAN JOBS 2015 For more information see lmip.gov.au JOBS BY INDUSTRY TRANSPORT, POSTAL AND WAREHOUSING Employment Employment Nov 2014 1 year change to Nov 2014 5 year change to Nov 2014 5 year projected change to Nov 2019 This industry All industries 599,700 2.0% 5.8% 10.2% 11,613,900 1.2% 7.0% 10.0% 20% 23% 9% 48% 30% 30% 46% 15% 39% 32% 13% 32% 48% 29% 31% 34% 101,500 40,600 37,400 34,800 28,400 189,300 45,900 47,900 36,300 120,300 Employment Profile WHOLESALE TRADE Employment This industry All industries 394,000 0.3% -6.6% 6.3% 11,613,900 1.2% 7.0% 10.0% 17% 33% 8% 45% 25% 30% 46% 15% 39% 32% 21% 30% 42% 29% 31% 34% 28,100 25,700 23,400 19,100 17,200 90,000 120,300 140,900 85,100 20,000 Employment Nov 2014 1 year change to Nov 2014 5 year change to Nov 2014 5 year projected change to Nov 2019 Employment Profile Working part-time Female Aged 15 to 24 years Aged 45 years or older Regional Workforce Educational Profile Working part-time Female Aged 15 to 24 years Aged 45 years or older Regional Workforce Educational Profile With a bachelor degree or higher qual With a cert III or higher VET qual Without a post-school qual Top 5 Occupations With a bachelor degree or higher qual With a cert III or higher VET qual Without a post-school qual Top 5 Occupations Drivers, Truck Drivers, Automobile Couriers and Postal Deliverers Drivers, Bus and Coach Storepersons Sales Representatives Storepersons Managers, Advertising and Sales Clerks, Purchasing and Supply Logistics Importers, Exporters and Wholesalers The industry is dominated by activities such as the transportation of passengers and freight by road, rail, water and air. Less than one in four workers in this industry is employed in postal and warehousing activities. Wholesale Trade is a relatively small industry, with 394,000 workers or 3% of Australian employment. Over the five years to November 2014, employment fell by 27,900 (or 6.6%), although there were some small gains in the year to November 2014 (up by around 1,000 or 0.3%). Transport, Postal and Warehousing employs 599,700 Australians and accounts for 5% of national employment, with around 179,900 jobs in regional areas. Over the five years to November 2014, employment increased by 32,700 or 5.8%. Employment is projected to increase by 6.3% (or 24,800) over the five years to November 2019, a lower growth rate than the all industries average of 10.0%. Employment growth is expected to strengthen over the five years to November 2019, rising at a similar rate to the all industries average (up by 10.2% or 61,000). This workforce has a relatively low skill profile. Around half the workers do not hold post-school qualifications and few have a bachelor degree or higher qualification compared with the national average. More than three quarters of the workers in this industry are male and about 80% of workers are employed full-time. A large proportion of workers are Machinery Operators and Drivers (more than two in every five), which account for three of the top five occupations. The industry employs more than 100,000 truck drivers and large numbers of other drivers. There are also significant numbers of Clerical and Administrative Workers. The workforce has an older age profile than the all industries average. Almost half its workers are aged 45 years or older and a relatively low proportion is aged 15 to 24 years. Age Profile Transport, Postal and Warehousing (% of industry total) 15 - 24 years 9 25 - 34 years 20 35 - 44 years 23 45 - 54 years 26 55 years and over 22 The industry’s employment is concentrated in metropolitan areas, with three in four workers located in capital cities. Two thirds of workers are male and full-time employment is usual. The workforce is relatively low skilled, two in five workers do not hold post-school qualifications. Although the proportion of workers in this industry who hold vocational education and training qualifications is similar to the all industries average, relatively few have a bachelor degree or higher qualification. More than half the workers are Clerical and Administrative Workers, Sales Workers or Machinery Operators and Drivers. It is interesting to note that, despite the concentration of employment in relatively low skilled occupations, Wholesale Trade has the third smallest proportion of workers aged 15 to 24 years of any industry. Workers aged 45 years or older, though, have a higher share of jobs in this industry than they do across all industries. Age Profile Wholesale Trade (% of industry total) 15 - 24 years 8 25 - 34 years 23 35 - 44 years 25 45 - 54 years 24 55 years and over 21 Source: ABS, Labour Force Source: ABS, Labour Force Sources: ABS, Labour Force (trend and 4 quarter averages); ABS, Education and Work; Department of Employment, Industry Employment Projections 24 AUSTRALIAN JOBS 2015 For more information see lmip.gov.au JOBS BY OCCUPATION AND QUALIFICATION OCCUPATIONAL OVERVIEW The previous pages examine the labour market by industry. It is also useful to look at the occupational dimension. An occupation involves the performance of a common set of tasks at a similar level of skill. There is a close relationship between some occupations and industries (such as Nurses, Registered in Health Care and Social Assistance) but some occupations have a wide spread of jobs across all industries (such as Clerks, General). The largest occupational group in Australia is Professionals with almost one in four workers employed as a Professional. Professionals generally hold a post-school qualification, with occupations in this group usually requiring a bachelor degree or higher qualification. The next two largest occupational groups each account for more than 1.6 million workers (or more than 14% of national employment). They are • Technicians and Trades Workers • Clerical and Administrative Workers. In terms of specific occupations, 25 of the approximately 350 occupations included in the Occupation Matrix (from page 36) employ more than 100,000 people. The five largest are • Sales Assistants, General (507,900 employed) • Clerks, General (252,100) • Nurses, Registered (231,500) • Managers, Retail (220,500) • Accountants (193,000). Which occupations have grown? Over the five years to November 2014, the largest number of new jobs was for Professionals (311,600 or a rise of 13.3%). More than two in every five new jobs created in the Australian labour market were for a Professional. In percentage terms, employment growth was strongest for Community and Personal Service Workers (up by 14.1% or 141,900). This reflects, in part, the strong growth in the Health Care and Social Assistance industry where almost two in every five of these workers are employed. The four most highly skilled occupational groups (they generally require post-school qualifications) recorded the largest jobs growth. The relatively low skilled group of Labourers was the only occupational group to experience a fall in employment. Employment Change, 5 years to November 2014, Occupational Group (‘000) Professionals Technicians and Trades Workers 141.9 Managers 98.2 Sales Workers 88.3 Machinery Operators and Drivers 71.2 Clerical and Administrative Workers Managers 13.1% 6.1 Labourers Machinery Operators and Drivers 6.4% -35.1 -50 0 50 100 150 200 250 300 350 Source: ABS, Labour Force Sales Workers 9.4% The five specific occupations which recorded the largest numbers of new jobs over the five years to November 2014 were • Clerks, General (up by 91,400) • Carers, Aged and Disabled (32,700) • Sales Assistants, General (29,300) • Contract, Programme and Project Administrators (29,100) • Carers, Child (25,600). Professionals 22.8% Clerical and Administrative Workers 14.0% Community and Personal Service Workers 9.8% 162.4 Community and Personal Service Workers Employment Share at November 2014, Occupational Group (% of total) Labourers 9.6% 311.6 Technicians and Trades Workers 14.8% The Occupation Matrix on page 36 has detailed information for specific occupations. Source: ABS, Labour Force Employment by Occupational Group Employment Employ’t % of total Nov 2014 workforce Occupational Group ‘000 Managers Professionals Technicians and Trades Workers Community and Personal Service Workers Clerical and Administrative Workers Sales Workers Machinery Operators and Drivers Labourers All Occupations 1,532.9 2,657.4 1,724.9 1,147.3 1,630.4 1,100.5 751.4 1,121.4 11,613.9 13 23 15 10 14 9 6 10 100 Employment Profile 5 year change to Nov 2014 Female Aged 15 to 24 years Qualifications Aged 45 years or older With a bachelor degree or higher qual With a cert III or higher VET qual Without a postschool qual ‘000 % % % % % % % ‘000 % 98.2 311.6 162.4 141.9 6.1 88.3 71.2 -35.1 756.7 6.8 13.3 10.4 14.1 0.4 8.7 10.5 -3.0 7.0 35 53 14 69 75 62 9 35 46 4 6 18 25 11 40 10 24 15 50 39 34 34 44 27 47 39 39 36 74 8 17 23 12 5 6 29 30 15 59 43 29 20 30 23 30 30 8 25 33 40 62 57 63 34 146.2 376.3 159.8 205.5 121.4 110.4 25.5 21.3 1,166.4 9.5 14.2 9.3 17.9 7.4 10.0 3.4 1.9 10.0 Sources: ABS, Labour Force (trend and 4 quarter averages); ABS, Education and Work; Department of Employment, Occupational Employment Projections 25 AUSTRALIAN JOBS 2015 Projected employ’t change 5 years to Nov 2019 JOBS BY OCCUPATION AND QUALIFICATION OCCUPATIONAL OUTLOOK MANAGERS Which occupational groups will have the most new jobs? Over the five years to November 2019, there are expected to be new jobs created in every major occupational group. Consistent with the strong growth expected in the Health Care and Social Assistance industry, occupational employment growth is projected to be strongest for Community and Personal Service Workers and Professionals (up by 17.9% and 14.2%, respectively). The Professionals group is expected to contribute the largest number of new jobs (376,300), followed by Community and Personal Service Workers (205,500). Together they will contribute half of all new jobs. The skill level of the Australian workforce is rising. That is, a higher proportion of workers now have post-school qualifications than they did in the past, and this trend is continuing. Consistent with this, the occupational profile of the workforce is changing, with lower skilled occupational groups expected to offer relatively few new jobs over the next five years. • Machinery Operators and Drivers and Labourers, combined, will contribute only around 4% of new jobs. Share of Projected Employment Growth by Occupational Group, five years to November 2019 (% of total growth) Employment This group All occupations Employment Nov 2014 1 year change to Nov 2014 5 year change to Nov 2014 5 year projected change to Nov 2019 1,532,900 3.2% 6.8% 9.5% 11,613,900 1.2% 7.0% 10.0% 13% 35% 4% 50% 33% 30% 46% 15% 39% 32% 36% 30% 30% 29% 30% 34% Employment Profile Working part-time Female Aged 15 to 24 years Aged 45 years or older Regional Workforce Educational Profile With a bachelor degree or higher qual With a cert III or higher VET qual Without a post-school qual Top 5 Manager Occupations Managers, Retail Managers, Advertising and Sales Farmers, Livestock Managers, Construction Managers, Other Hospitality, Retail and Service 220,500 140,900 89,300 80,700 69,100 Managers plan, organise, control and coordinate the operations of government, commercial and other organisations and departments. Their employment is widely dispersed across industries, but the largest numbers are in Retail Trade. Managers make up around 13% of Australia’s workforce. Employment growth was similar to the all occupations average over the five years to November 2014 (up by 6.8% or 98,200). Machinery Operators Labourers and Drivers 1.8% Managers 2.2% 12.5% Sales Workers 9.5% Employment is expected to increase at a rate similar to that for all occupations over the five years to November 2019, adding 146,200 jobs. Clerical and Administrative Workers 10.4% Managers have the lowest share of part-time employment of any occupational group (13%) and two thirds of Managers are male. Professionals 32.3% Community and Personal Service Workers 17.6% Technicians and Trades Workers 13.7% Source: Department of Employment, Occupational Employment Projections The ten occupations with the largest numbers of new jobs expected over the five years to November 2019 are • Clerks, General (up by 75,600) • Sales Assistants, General (58,300) • Nurses, Registered (41,400) • Carers, Aged and Disabled (26,100) • Accountants (25,700) • Carers, Child (22,800) • Education Aides (20,900) • Managers, Retail (20,800) • Chefs (20,000) • Carpenters and Joiners (18,700). For more detailed employment projections see lmip.gov.au, including for where employment is increasing or decreasing by occupation. This is a skilled occupational group and most Managers have a certificate III or higher qualification. Managers who do not hold formal qualifications generally have many years of experience. In fact, experience is a prerequisite for most Manager jobs. The need for significant workplace experience for most Manager jobs is reflected in the age profile. Half of all Managers are aged 45 years or older and just 4% are aged 15 to 24 years. Industry Profile, Managers (% of occupation total) Other 17.6% Retail Trade 13.5% Financial and Insurance Services 4.2% Agriculture, Forestry and Fishing 11.8% Health Care and Social Assistance 4.5% Education and Training 4.5% Manufacturing 9.5% Public Administration and Safety 5.1% Wholesale Trade 5.8% Professional, Construction Scientific and 7.2% Technical Services 7.2% Accommodation and Food Services 9.1% Source: ABS, Labour Force Sources: ABS, Labour Force (trend and 4 quarter averages); ABS, Education and Work; Department of Employment, Occupational Employment Projections; ABS, Australian and New Zealand Standard Classification of Occupations 26 AUSTRALIAN JOBS 2015 For more information see lmip.gov.au JOBS BY OCCUPATION AND QUALIFICATION PROFESSIONALS Employment This group All occupations Employment Nov 2014 1 year change to Nov 2014 5 year change to Nov 2014 5 year projected change to Nov 2019 2,657,400 4.2% 13.3% 14.2% 11,613,900 1.2% 7.0% 10.0% 25% 53% 6% 39% 23% 30% 46% 15% 39% 32% 74% 15% 8% 29% 30% 34% While jobs growth for Professionals is strong, there is also strong growth in bachelor degree completions (up by 17% or 18,100 over the five years to 2013). In the five years to 2013, 583,500 domestic students completed a bachelor degree. Employment is quite concentrated in a small number of industries (although Professionals are employed in every industry). Almost two thirds of Professionals are employed in just three industries: Health Care and Social Assistance, Education and Training and Professional, Scientific and Technical Services. Employment Profile Working part-time Female Aged 15 to 24 years Aged 45 years or older Regional Industry Profile, Professionals (% of occupation total) Workforce Educational Profile With a bachelor degree or higher qual With a cert III or higher VET qual Without a post-school qual Health Care and Social Assistance 22.3% Other 22.5% Top 5 Professional Occupations Nurses, Registered Accountants Teachers, Primary School Teachers, Secondary School Software and Applications Programmers 231,500 193,000 143,800 118,100 85,600 Financial and Insurance Services 5.8% Professionals perform analytical, conceptual and creative tasks in the fields of the arts, media, business, design, engineering, the physical and life sciences, transport, education, health, information and communication technology, law, social sciences and social welfare. More Australians are employed as a Professional than any other group. More than half these workers are female, although there is significant variation by subgroup. Employment growth has been very strong for Professionals. Over the five years to November 2014, employment increased by 13.3% or 311,600. This group is expected to dominate future employment growth, providing more new jobs than any other over the five years to November 2019 (up by 376,300 or 14.2%). Most Professional jobs require a bachelor degree or higher qualification, so university study is the main pathway. Consistent with this, only a small proportion of Professionals (8%) do not have post-school qualifications. Around three in every four Professionals hold a bachelor degree or higher qualification. Public Administration and Safety 7.1% Education and Training 22.0% Professional, Scientific and Technical Services 20.3% Source: ABS, Labour Force Reflecting the number of years of post-school education usually required to become a Professional, very few workers are aged between 15 and 24. The proportion of Professionals aged 45 years or older is consistent with the all occupations average. Age Profile, Professionals (% of occupation total) 15 - 24 years 6 25 - 34 years 35 - 44 years 29 45 - 54 years 26 55 years and over 18 21 Source: ABS, Labour Force Employment by Occupational Subgroup, Professionals Employment Employ’t Nov 2014 Occupational Subgroup Arts and Media Professionals Business, Finance and Human Resource Professionals Information Professionals Sales, Marketing and Public Relations Professionals Transport and Design Professionals, and Architects Engineers Science Professionals and Veterinarians Education Professionals Health Diagnostic and Therapy Professionals Medical Practitioners and Nurses ICT Professionals Legal, Social and Welfare Professionals All Professionals Employment Profile 5 year change to Nov 2014 Female Aged 15 to 24 years Aged 45 years or older Projected employ’t change 5 years to Nov 2019 ‘000 % ‘000 % % % ‘000 % 104.0 395.8 137.6 119.4 139.8 139.7 117.3 516.3 163.4 352.4 229.3 213.6 2,657.4 10.9 9.8 11.6 6.7 11.8 20.3 25.2 10.8 28.4 11.7 4.3 17.6 13.3 10.2 35.3 14.3 7.5 14.7 23.6 23.6 50.4 36.2 37.0 9.4 32.0 311.6 48 48 48 51 37 8 45 71 61 77 17 63 53 9 6 3 7 9 7 5 7 9 6 3 4 6 36 33 43 26 31 38 33 47 35 47 31 44 39 6.6 56.9 30.3 21.4 19.5 9.6 8.4 50.8 33.7 63.3 36.8 38.9 376.3 6.4 14.4 22.0 17.9 14.0 6.9 7.2 9.8 20.6 18.0 16.1 18.2 14.2 Sources: ABS, Labour Force (trend and 4 quarter averages); ABS, Education and Work; Department of Employment, Occupational Employment Projections; Department of Education and Training, Higher Education Student Data Collection; ABS, Australian and New Zealand Standard Classification of Occupations 27 AUSTRALIAN JOBS 2015 For more information see employment.gov.au/skill-shortages JOBS BY OCCUPATION AND QUALIFICATION TECHNICIANS AND TRADES WORKERS Employment This group All occupations Employment Nov 2014 1 year change to Nov 2014 5 year change to Nov 2014 5 year projected change to Nov 2019 1,724,900 2.8% 10.4% 9.3% 11,613,900 1.2% 7.0% 10.0% 14% 14% 18% 34% 37% 30% 46% 15% 39% 32% 8% 59% 25% 29% 30% 34% Gallery, Library and Museum Technicians, Florists and Hairdressers, have high levels of female employment (all with more than 85% female employment). The Construction industry is a major source of demand for these workers, employing almost one third. Manufacturing and Other Services also employ large numbers of Technicians and Trades Workers. Employment Profile Working part-time Female Aged 15 to 24 years Aged 45 years or older Regional Industry Profile, Technicians and Trades Workers (% of occupation total) Workforce Educational Profile With a bachelor degree or higher qual With a cert III or higher VET qual Without a post-school qual Other 19.5% Construction 31.7% Top 5 Technicians and Trades Worker Occupations Electricians Carpenters and Joiners Metal Fitters and Machinists Motor Mechanics Chefs Mining 4.2% 141,700 128,000 123,800 101,700 89,600 Retail Trade 4.4% Professional, Scientific and Technical Services 5.3% Accommodation and Food Services 5.7% More than 1.7 million Australians (around 15% of total employment) work as Technicians and Trades Workers. They perform a variety of skilled tasks, applying broad or in-depth technical, trade or industry specific knowledge in construction, manufacturing, scientific, engineering and other activities. Employment growth for Technicians and Trades Workers has been above average over the last five years (10.4% compared with the national average of 7.0%), with gains in each of the subgroups. Source: ABS, Labour Force Further employment increases are expected over the five years to November 2019 (rises are projected for each subgroup), with the growth rate projected to be similar to that for all occupational groups. Above average growth is expected for Food Trades, Skilled Animal and Horticultural Workers, and Construction Trades, with the largest number of new jobs likely to be for Construction Trades (47,800). Particularly large employing occupations in this group include Electricians, Carpenters and Joiners, Metal Fitters and Machinists, and Motor Mechanics (each with more than 100,000 workers). Manufacturing 15.3% Other Services 13.8% The age profile for Technicians and Trades Workers is slightly younger than the all occupations average. Around 18% of workers are aged 15 to 24 years (compared with 15%). Many younger workers in this group are employed as they train, with around 134,000 being apprentices or trainees. Around 34% of workers are aged 45 years or older (compared with 39% across all occupations). Age Profile, Technicians and Trades Workers (% of occupation total) 15 - 24 years This workforce is male dominated and most jobs are full-time. Some occupations, though, such as Veterinary Nurses, 25 - 34 years 18 35 - 44 years 27 45 - 54 years 21 55 years and over 15 19 Source: ABS, Labour Force Employment by Occupational Subgroup, Technicians and Trades Workers Employment Employ’t Nov 2014 Occupational Subgroup Engineering, ICT and Science Technicians, Inspectors Automotive and Engineering Trades Workers Construction Trades Workers Electrotechnology and Telecommunications Trades Workers Food Trades Workers Skilled Animal and Horticultural Workers Hairdressers, Printing, Clothing and Wood Trades Workers Jewellers, Arts and Other Trades Workers All Technicians and Trades Workers Employment Profile 5 year change to Nov 2014 Female Aged 15 to 24 years Aged 45 years or older Projected employ’t change 5 years to Nov 2019 ‘000 ‘000 % % % % ‘000 % 225.7 379.9 365.9 236.6 174.5 130.7 138.2 54.5 1,724.9 9.5 36.2 24.1 23.8 28.9 26.0 5.2 1.0 162.4 4.4 10.5 7.1 11.2 19.9 24.9 3.9 1.9 10.4 25 1 1 2 30 26 46 33 14 9 18 22 21 18 18 20 10 18 37 36 31 31 28 37 36 39 34 22.0 16.8 47.8 19.8 28.8 18.7 1.6 4.4 159.8 9.8 4.4 13.1 8.4 16.5 14.3 1.1 8.0 9.3 Sources: ABS, Labour Force (trend and 4 quarter averages); ABS, Education and Work; Department of Employment, Occupational Employment Projections; NCVER, Apprentices and Trainees; ABS, Australian and New Zealand Standard Classification of Occupations 28 AUSTRALIAN JOBS 2015 For more information see employment.gov.au/skill-shortages JOBS BY OCCUPATION AND QUALIFICATION COMMUNITY AND PERSONAL SERVICE WORKERS Employment Employment Nov 2014 1 year change to Nov 2014 5 year change to Nov 2014 5 year projected change to Nov 2019 This group All occupations 1,147,300 0.8% 14.1% 17.9% 11,613,900 1.2% 7.0% 10.0% 53% 69% 25% 34% 34% 30% 46% 15% 39% 32% 17% 43% 33% 29% 30% 34% Employment is concentrated in a small number of industries. More than one in three Community and Personal Service Workers is employed in the Health Care and Social Assistance industry, and Accommodation and Food Services is also a major employer (almost one in five workers). Employment Profile Working part-time Female Aged 15 to 24 years Aged 45 years or older Regional A high proportion of workers hold a certificate III or higher VET qualification (43% compared with 30% across all occupations). Relatively few Community and Personal Service Workers hold a bachelor degree or higher qualification. Industry Profile, Community and Personal Service Workers (% of occupation total) Workforce Educational Profile With a bachelor degree or higher qual With a cert III or higher VET qual Without a post-school qual Other 16.9% Top 5 Community and Personal Service Worker Occupations Carers, Aged and Disabled Carers, Child Waiters Care Workers, Nursing Support and Personal Bar Attendants and Baristas 141,000 130,200 121,300 89,800 82,000 Health Care and Social Assistance 38.0% Education and Training 11.7% Community and Personal Service Workers provide a wide range of services, in the areas of aged and disability care, health and social welfare, childcare, hospitality, policing, tourism and sports. Public Administration and Safety 13.8% More than 1.1 million Australians (or one in ten workers) are Community and Personal Service Workers. This group is very diverse, and includes Carers, Nurses (Enrolled), Waiters and Bar Attendants, Security Guards, Police, Fitness Instructors, Sportspersons and Beauty Therapists. Accommodation and Food Services 19.5% Source: ABS, Labour Force One in every four Community and Personal Service Workers is aged 15 to 24 years. These younger workers, though, are mainly employed in the Hospitality and Sports, Travel and Personal Service Worker subgroups, with workers in the Health and Welfare Support and Protective, Defence, Emergency Service positions generally being in the older age groups. Community and Personal Service Workers recorded the strongest growth rate of any occupational group over the five years to November 2014 (up by 14.1%, twice the national rate). It contributed 141,900 new jobs (ranking third behind the more highly skilled Professionals and Technicians and Trades Workers groups in the number of new jobs). Reflecting strong demand and the ageing population, the largest numbers of new jobs were for Carers and Aides (up by almost 69,800 or 18.0%). Age Profile, Community and Personal Service Workers (% of occupation total) Over the five years to November 2019, employment of Community and Personal Service Workers is expected to continue to increase strongly (up by 17.9% or 205,500). 15 - 24 years This occupational group is female dominated (more than two in every three workers are female) and more than half the workforce is employed part-time. 25 - 34 years 25 35 - 44 years 22 45 - 54 years 20 55 years and over 15 19 Source: ABS, Labour Force Male full-time employment, though, is common for Protective, Defence, Emergency Service Workers. Employment by Occupational Subgroup, Community and Personal Service Workers Employment Employ’t Nov 2014 Occupational Subgroup Health and Welfare Support Workers Carers and Aides Hospitality Workers Protective, Defence, Emergency Service Workers Sports, Travel and Personal Service Workers All Community and Personal Service Workers Employment Profile 5 year change to Nov 2014 Female Aged 15 to 24 years Aged 45 years or older ‘000 ‘000 % % % % ‘000 % 110.0 456.7 251.6 142.4 183.8 1,147.3 12.0 69.8 11.8 17.5 34.7 141.9 12.3 18.0 4.9 14.0 23.2 14.1 72 87 70 19 62 69 7 16 53 7 33 25 47 42 14 39 26 34 18.3 87.6 33.1 21.8 44.7 205.5 16.6 19.2 13.1 15.3 24.3 17.9 Sources: ABS, Labour Force (trend and 4 quarter averages); ABS, Education and Work; Department of Employment, Occupational Employment Projections; ABS, Australian and New Zealand Standard Classification of Occupations 29 AUSTRALIAN JOBS 2015 Projected employ’t change 5 years to Nov 2019 JOBS BY OCCUPATION AND QUALIFICATION CLERICAL AND ADMINISTRATIVE WORKERS SALES WORKERS Employment This group All occupations Employment Nov 2014 1 year change to Nov 2014 5 year change to Nov 2014 5 year projected change to Nov 2019 1,630,400 -1.3% 0.4% 7.4% 11,613,900 1.2% 7.0% 10.0% 35% 75% 11% 44% 27% 30% 46% 15% 39% 32% 23% 29% 40% 29% 30% 34% Employment Profile Working part-time Female Aged 15 to 24 years Aged 45 years or older Regional Workforce Educational Profile With a bachelor degree or higher qual With a cert III or higher VET qual Without a post-school qual Top 5 Clerical and Administrative Worker Occupations Clerks, General Receptionists Contract, Programme and Project Administrators Managers, Office Clerks, Accounting 252,100 162,200 125,000 124,900 121,700 Clerical and Administrative Workers provide support to businesses by organising, storing, manipulating and retrieving information. Few workers hold post-school qualifications, and those who do are more likely to have vocational education and training qualifications than a bachelor degree or higher. Employment is widely dispersed across industries. This is the third largest of the eight occupational groups, with around 14% of total employment. There was little change in the number of people employed in this industry over the five years to November 2014, but 121,400 new jobs are projected over the five years to November 2019. Three in every four Clerical and Administrative Workers are female (the highest proportion of any group). The workforce is older than the all occupations average (44% of workers are aged 45 years or older and a relatively small proportion of workers are aged 15 to 24 years). Industry Profile, Clerical and Administrative Workers (% of occupation total) Public Administration and Safety 13.2% Other 23.7% Health Care and Social Assistance 11.8% Employment This group All occupations Employment Nov 2014 1 year change to Nov 2014 5 year change to Nov 2014 5 year projected change to Nov 2019 1,100,500 1.7% 8.7% 10.0% 11,613,900 1.2% 7.0% 10.0% 57% 62% 40% 27% 33% 30% 46% 15% 39% 32% 12% 20% 62% 29% 30% 34% Employment Profile Working part-time Female Aged 15 to 24 years Aged 45 years or older Regional Workforce Educational Profile With a bachelor degree or higher qual With a cert III or higher VET qual Without a post-school qual Top 5 Sales Worker Occupations Sales Assistants, General Checkout Operators and Office Cashiers Sales Representatives Real Estate Sales Agents Retail Supervisors Sales Workers sell goods, services and property, and provide sales support in areas such as operating cash registers and displaying and demonstrating goods. This group recorded strong employment growth over the five years to November 2014 (up by 8.7% or 88,300), and 110,400 new jobs are expected to be created for Sales Workers over the next five. Few jobs in this group require post-school qualifications (62% of current Sales Workers have not completed post-school study). More than half the workers are employed part-time and 40% are aged 15 to 24 years. Sales Workers jobs are the first employment for many people as they present good entry-level opportunities, and the availability of part-time hours and seven day trading for many Retail Trade businesses allow workers to combine employment with study. Employment is concentrated in the Retail Trade industry (61.3%) but there are more than 420,000 jobs in other industries. For example, some tourist attractions have their own shops which employ Sales Workers. Industry Profile, Sales Workers (% of occupation total) Other 11.2% Manufacturing 4.6% Wholesale Trade 6.1% Rental, Hiring and Real Estate Services 7.8% Retail Trade 5.3% Financial and Insurance Services 11.0% Education and Training 5.4% Manufacturing 5.6% Construction 6.0% Transport, Postal and Warehousing 7.9% Professional, Scientific and Technical Services 10.1% Accommodation and Food Services 9.0% Source: ABS, Labour Force Source: ABS, Labour Force Sources: ABS, Labour Force (trend and 4 quarter averages); ABS, Education and Work; Department of Employment, Occupational Employment Projections; ABS, Australian and New Zealand Standard Classification of Occupations 30 507,900 139,200 90,000 87,100 46,300 AUSTRALIAN JOBS 2015 Retail Trade 61.3% JOBS BY OCCUPATION AND QUALIFICATION MACHINERY OPERATORS AND DRIVERS Employment Employment Nov 2014 1 year change to Nov 2014 5 year change to Nov 2014 5 year projected change to Nov 2019 This group All occupations 751,400 -1.6% 10.5% 3.4% 11,613,900 1.2% 7.0% 10.0% 15% 9% 10% 47% 41% 30% 46% 15% 39% 32% 5% 30% 57% 29% 30% 34% Employment Profile LABOURERS Employment Employment Nov 2014 1 year change to Nov 2014 5 year change to Nov 2014 5 year projected change to Nov 2019 This group All occupations 1,121,400 0.1% -3.0% 1.9% 11,613,900 1.2% 7.0% 10.0% 46% 35% 24% 39% 42% 30% 46% 15% 39% 32% 6% 23% 63% 29% 30% 34% Employment Profile Working part-time Female Aged 15 to 24 years Aged 45 years or older Regional Workforce Educational Profile Working part-time Female Aged 15 to 24 years Aged 45 years or older Regional Workforce Educational Profile With a bachelor degree or higher qual With a cert III or higher VET qual Without a post-school qual Top 5 Machinery Operator and Driver Occupations With a bachelor degree or higher qual With a cert III or higher VET qual Without a post-school qual Top 5 Labourer Occupations Drivers, Truck Storepersons Drivers, Forklift Drillers, Miners and Shot Firers Drivers, Automobile 189,300 120,300 61,600 52,700 45,900 Cleaners, Commercial Kitchenhands Labourers, Other Miscellaneous Labourers, Building and Plumbing Packers 147,200 128,000 62,900 54,700 53,000 Machinery Operators and Drivers operate machines, plant, vehicles and other equipment to perform a range of agricultural, manufacturing and construction functions, and transport passengers and freight. Labourers perform routine tasks using hand and power tools, and machines, often assisting more skilled workers such as Technicians and Trades Workers. This is the smallest employing occupational group, with 751,400 workers, or 6% of national employment. Employment rose strongly over the five years to November 2014 (up by 10.5% or 71,200). Almost all the new jobs were for Drivers and Storepersons. One in ten Australian workers (more than one million) is a Labourer. This lower skilled occupational group experienced a loss of jobs (down by 35,100 or 3.0%) over the five years to November 2014. Although there are expected to be some new Labourers jobs created over the next five years, employment growth will be low (up by 1.9% or 21,300). Over the next five years, employment is expected to rise slightly (up by 3.4% or 25,500). Post-school qualifications are not generally required for Machinery Operators and Drivers jobs, but tickets or licences are mandatory for many positions. Transport, Postal and Warehousing and Manufacturing are the main employing industries. The workforce is male dominated and the vast majority of workers are employed full-time. A high proportion of workers are aged 45 years or older (47%) and relatively few are 15 to 24 years (10%). Industry Profile, Machinery Operators and Drivers (% of occupation total) Other 14.3% Retail Trade 6.2% Labourers do not generally require post-school qualifications, but more than 250,000 Labourers hold a certificate III or higher vocational education or training qualification. Almost one in every four Labourers is aged 15 to 24 years. Close to half the Labourers positions are part-time which may present opportunities to combine valuable work experience with study. Labourers work in a variety of industries, but the largest numbers are in Manufacturing, Accommodation and Food Services and Construction. Industry Profile, Labourers (% of occupation total) Manufacturing 15.7% Other 18.9% Health Care and Social Assistance 5.9% Transport, Postal and Warehousing 35.4% Accommodation and Food Services 14.6% Agriculture, Forestry and Fishing 7.6% Wholesale Trade 8.0% Retail Trade 8.7% Construction 14.5% Administrative and Support Services 14.2% Construction 10.5% Mining 11.0% Manufacturing 14.6% Source: ABS, Labour Force Source: ABS, Labour Force Sources: ABS, Labour Force (trend and 4 quarter averages); ABS, Education and Work; Department of Employment, Occupational Employment Projections; ABS, Australian and New Zealand Standard Classification of Occupations 31 AUSTRALIAN JOBS 2015 JOBS BY OCCUPATION AND QUALIFICATION EDUCATION AND EMPLOYMENT GRADUATE EMPLOYMENT OUTCOMES Post-school education or training is worthwhile University graduates in the labour market People who hold higher level qualifications generally have better labour market outcomes and higher earnings than those who have not studied after leaving school. The chart below highlights the almost direct relationship between higher levels of qualification and better employment outcomes. While higher level qualifications ultimately improve employment prospects, employment outcomes for students immediately after graduation have weakened in recent years. Graduate Careers Australia’s (GCA) data show that 68.1% of bachelor degree and 80.4% of masters degree graduates who were available for full-time work had found full-time employment within four months of completing their studies in 2013 (the lowest level since the series began). Workers who hold a bachelor degree or higher have • the lowest unemployment rate (3.3% in 2014) • the highest labour force participation rate (86.1%). Employed Full-time Four Months after Graduation Those who hold vocational education qualifications at the advanced diploma/diploma or certificate III or IV level also have • relatively low unemployment (5.2% and 5.0% respectively) • high participation rates (83.6% and 85.7% respectively). 2014 2013 2012 2011 2010 For Australians who do not hold post-school qualifications • unemployment rates are markedly higher • participation rates are relatively low, especially for those who did not study beyond Year 10 (56.3%, the lowest rate). Higher qualifications often lead to increased real wages. The Occupation Matrix (from page 36) indicates that higher skilled jobs generally have better pay. Some lower skilled occupations, though, also have relatively high pay, sometimes to compensate for unsociable working hours or difficult working conditions. For young people the impact of workplace experience and qualifications is especially apparent. LSAY reports that the average full-time weekly wage of 15 year olds (who are predominantly employed as Sales Workers and Labourers) is around $330. However, by age 24 when qualifications have generally increased and employment opportunities are more varied, the average full-time weekly wage is around $900. Labour Market Outcomes by Highest Level of Educational Attainment, Working Age Population (aged 15 to 64 years) Participation Rate - RHS (%) 83.6 90 85.7 74.1 10 8.9 56.3 6.8 6 5.2 60 50 40 5.0 30 3.3 20 2 0 80 70 65.9 8 4 73.3 10.5 10 Bachelor Advanced Certificate Year 12 degree or diploma/ III or IV higher diploma Year 11 Certificate Year 10 I or II or below Participation Rate (%) Unemployment Rate (%) 12 100 13.2 86.1 80.4% 81.2% 83.4% 83.6% 84.6% Bachelor degree graduates in Health, and Engineering and Related Technologies generally have the best employment outcomes. High level qualifications are not immediately attainable for some people, but there are pathways to these qualifications. Findings from the Longitudinal Survey of Australian Youth (LSAY) suggest that for students who would not otherwise be able to enrol in further education or training, completing a certificate I or II qualification can be a successful pathway to a higher qualification. Unemployment Rate - LHS (%) Masters degree graduates 68.1% 71.3% 76.1% 76.3% 76.2% Source: GCA, Graduate Destinations Those who hold a certificate I or II level qualification have • a relatively high participation rate (73.3%) but • the highest level of unemployment (13.2%). 14 Bachelor degree graduates Employment Outcomes by Selected Field of Education, Bachelor Degree Graduates (% employed full-time) Health 80.1 Engineering and Related Technologies 72.2 Management and Commerce 70.9 Education 70.0 Architecture and Building 68.6 Information Technology 67.2 Society and Culture 62.6 Agriculture, Environmental and Related Studies 59.9 Natural and Physical Sciences 51.1 Creative Arts 50.0 Food, Hospitality and Personal Services 33.3 0 20 40 60 80 100 Source: GCA, Graduate Destinations Specific disciplines with the strongest employment outcomes for bachelor degree graduates at the time of the 2014 survey were • medicine and pharmacy (97.5% and 94.1% respectively, but these figures are influenced by registration year requirements, for which the health sector provides places) • surveying (83.9%) • mining engineering (82.8%) • veterinary science (80.7%) • nursing – initial (80.5%). Some disciplines, though, have relatively weak employment outcomes, such as • visual/performing arts (44.7%) • life sciences (48.0%). These figures relate to graduates in full-time employment in any occupation, not necessarily in occupations related to those in which they trained. 0 Source: ABS, Education and Work Sources: ABS, Education and Work; GCA, GradStats and Graduate Destinations; NCVER, LSAY Papers 2546 and 2761 32 AUSTRALIAN JOBS 2015 For more information see graduatecareers.com.au JOBS BY OCCUPATION AND QUALIFICATION GRADUATE EMPLOYMENT OUTCOMES GRADUATE SALARIES Employment outcomes for vocational education and training graduates How much do higher education graduates earn? Outcomes in the vocational education and training (VET) system are strong, although the proportion of apprentices and trainees finding employment has dropped slightly in recent years, consistent with the subdued labour market conditions. In 2014, the median annual starting salary for bachelor degree graduates aged younger than 25 years and in their first full-time job was $52,500 (or 74.0% of the annual average male earnings). National Centre for Vocational Education Research (NCVER) figures for 2014 show that 77.6% of VET graduates were employed (full-time or part-time) six months after completing their training. For apprentices and trainees, employment outcomes are very strong, with 85.5% employed six months after graduation. Apprentices and trainees in a Technician and Trade Workers occupation (for example, Electrician, Bricklayer or Panelbeater) have even stronger outcomes, with 91.4% employed. Employed Six Months after Graduation 2014 2013 2012 2011 2010 Apprentice and Trainee graduates 77.6% 78.2% 77.8% 78.7% 77.5% 85.5% 85.4% 85.7% 86.7% 86.3% Employment Outcomes by Field of Education VET Graduates (% employed) 89.1 86.5 83.6 80.7 79.7 40.0 40.8 2005 2006 43.0 49.0 50.0 2009 2010 2011 52.0 52.5 52.5 2012 2013 2014 30 76.7 72.9 64.8 56.4 60 10 2004 2007 2008 80 The highest starting salaries were for • Dentistry ($75,000) • Optometry ($70,000) • Engineering ($62,000) • Earth Sciences ($60,000) • Mathematics ($60,000) • Medicine ($60,000). What about vocational education and training graduates? The average annual income after training for VET graduates aged 20 to 24 years was $46,000, but for those aged 45 to 64 years, the average was considerably higher, $65,500. 77.7 100 Source: NCVER, Student Outcomes The level of qualification makes a difference Employment outcomes vary depending on the level of qualification. VET graduates with a diploma or higher are the most likely to find employment. Employment outcomes are relatively low for those with a certificate I, but many students who gain a certificate I go on to further study, using this as a pathway to a higher qualification. Employed Six Months after Graduation by Qualification All VET graduates Apprentice and Trainee graduates 84.2% 82.3% 79.3% 60.4% 55.1% 85.5% 82.9% 86.6% 63.8% 50.0% Diploma or higher Certificate IV Certificate III Certificate II Certificate I 38.0 48.0 The average annual salary for VET graduates in 2014 working full-time after training was $57,400 (includes graduates of all ages). 81.1 40 40 45.0 Source: GCA, Graduate Salaries Vocational education or training graduates in Education; Architecture and Building; Engineering and Related Technologies; and Health have the strongest employment outcomes. 20 50 0 Source: NCVER, Student Outcomes 0 60 20 All VET graduates Education Architecture and Building Engineering and Related Technologies Health Agriculture, Environmental and Related Studies Management and Commerce Society and Culture Food, Hospitality and Personal Services Natural and Physical Sciences Creative Arts Information Technology Median Starting Salaries, Bachelor Degree Graduates (under 25 years) ($’000) Just as employment outcomes vary depending on the level of qualification attained, there is a difference in graduate salaries by VET qualification level for those in full-time employment six months after completion of their training. • Diploma or higher vocational qualification ($63,500) • Certificate IV ($62,600) • Certificate III ($52,200) • Certificate II ($47,900) • Certificate I ($51,600). The highest average salaries for VET graduates in 2014 were for • Education ($75,300) • Engineering and Related Technologies ($61,400) • Natural and Physical Sciences ($60,500) • Information Technology ($58,500) • Health ($58,400). Source: NCVER, Student Outcomes Sources: NCVER, Student Outcomes; GCA, GradStats and Graduate Salaries; NCVER, LSAY Papers 2546 33 AUSTRALIAN JOBS 2015 For more information see graduatecareers.com.au and ncver.edu.au JOBS BY OCCUPATION AND QUALIFICATION GRADUATE OUTCOMES (SELECTED FIELDS) OCCUPATION PROFILES (SELECTED CASE STUDIES) Labour market conditions can change quickly, and it is hard to know what graduates will face in terms of demand in the future, but good candidates are always highly sought after by employers. It is best to look for training and employment in an occupation in which you are interested and have an aptitude, rather than to try to pick ‘winners’ in terms of opportunities and pay. There are many things to consider when thinking about which occupation might be best for you. The Occupation Matrix (from page 36) and the case studies below give examples of how diverse occupational labour markets can be. People who hold post-school qualifications generally have better employment outcomes than those who have not studied after leaving school, but the labour market is complex and many factors need to be considered in any decisions about employment and training. For some courses, there is a close match between the field of study and occupation of employment, other courses are more general and can lead to employment in a range of occupations. The following case studies outline the labour market outcomes for graduates in selected fields. Dentistry (bachelor degree graduates) Starting salary 2014 Starting salary 2013 % in full-time employment 2014 % in full-time employment 2013 $75,000 $80,000 79.6% 83.3% Most common destinations of employed graduates Dental Practitioners Dental Hygienists, Technicians and Therapists 93% 5% Law (bachelor degree graduates) Starting salary 2014 Starting salary 2013 % in full-time employment 2014 % in full-time employment 2013 $53,000 $55,000 75.3% 78.5% Most common destinations of employed graduates Clerical and Administrative Workers 34% Solicitors23% 8% Other Judicial and Legal Professionals Carpenters and Joiners (all VET graduates) Starting salary % in full-time employment % in part-time employment $48,600 88.1% 5.8% Most common destinations of employed graduates Carpenters and Joiners 76% Carers, Child (all VET graduates) Starting salary % in full-time employment % in part-time employment $39,200 28.9% 47.0% Most common destinations of employed graduates Carers, Child 59% You may also want to know about a range of other factors, such as whether particular occupations require you to work outdoors, are physically demanding or do shift work, as lifestyle factors may influence your choice. These issues are not included in this publication, but careers advisers and employment services organisations may be able to assist and Job Guide 2015 is a useful resource. The following sites may help: employment.gov.au/jobactive; cdaa.org.au; education.gov.au/job-guide. Carers, Aged and Disabled (part of Community and Personal Service Workers) • This is a large occupation with 141,000 workers. Employment rose strongly over the five years to November 2014 (up by 30.2%), with 32,700 new jobs. • Employment is expected to increase strongly over the next five years (up by 18.5% or 26,100) as the Australian population ages. • This workforce has a relatively old age profile (54% are aged 45 years or older). In addition to the new jobs created, there are likely to be many vacancies as people retire over the next decade or so. • Employers generally seek applicants who hold relevant qualifications at the certificate III or higher level. Around 70% of current workers have this level of qualification. ICT Professionals (part of Professionals) • There are 229,300 ICT professionals employed in various ICT specialisations across Australia. • ICT professionals are relatively young (the median age is 38 years compared with 40 across all occupations). • Over the five years to November 2014, there were 9,400 new jobs (up by 4.3%), with stronger growth expected over the next five years (up by 16.1% or 36,800). • Employment is across a broad range of industries, and employers require a diverse range of skills and experience. • Entry generally requires a bachelor degree, but employers also value certifications in software packages and relevant experience. They can be very specific in their requirements. Waiters (part of Community and Personal Service Workers) • This is a large employing occupation (121,300) with opportunities in almost every location. • Waiters are generally young (the median age is 22 years), and most work part-time (75%), with hours sometimes being unsociable. Some people combine work as a waiter with study. • Turnover is high and, as a result, there are likely to be large numbers of job openings. However, there are often large numbers of applicants for advertised vacancies. • Employers prefer workers who have waiting experience (even if they have formal training), have relevant licences (such as a RSA) and exceptional customer service skills. The need for previous experience can make it difficult to enter this occupation. Sources: GCA, Gradstats and Graduate Destinations; NCVER, Student Outcomes; ABS, Labour Force (trend and four quarter average); ABS, Labour Mobility; Department of Employment, Skill Shortage Research; ABS, Education and Work 34 AUSTRALIAN JOBS 2015 For more information see graduatecareers.com.au; ncver.edu.au and joboutlook.gov.au JOBS BY OCCUPATION AND QUALIFICATION GUIDE TO THE OCCUPATION MATRIX How do I use the Matrix? Employment Profile – Part-time Employment Share Information in the Occupation Matrix is as up-to-date as possible, but the labour market can change quickly and conditions vary by location and sector. These data can be highly variable, and should be used with caution. This column shows the proportion of workers who work part-time. The information uses the ABS definition of part-time, which is working less than 35 hours per week. Data Source: ABS, Labour Force The Matrix gives information about the labour market aspects of occupations, which is useful background. More detailed information for each occupation is available on the Job Outlook website (joboutlook.gov.au). Employment Profile – Female Employment and training decisions should be based on a balanced assessment of all relevant issues, including aptitude, interests, expectations about pay and working conditions, training requirements and goals. Titles in the Matrix are arranged in alphabetical order and some are duplicated to make them easier to find. Similar occupations may also be clustered together with their titles reversed, for example Secondary School Teacher is listed under Teacher, Secondary School. The relevant occupation major group is listed in brackets after each title. These refer to the groups on pages 25 to 31. Key Occupation M P TT CP CA SW MO L Managers Professionals Technicians and Trades Workers Community and Personal Service Workers Clerical and Administrative Workers Sales Workers Machinery Operators and Drivers Labourers Data Source: ABS, Labour Force Employment Profile – Median Age The median age is expressed in years for all workers (part-time and full-time). Half the workers are younger than this age and half are older. Data Source: ABS, Labour Force Employment Profile – Median Earnings Median weekly earnings uses five categories. Key Median Weekly Earnings $ $$ $$$ $$$$ $$$$$ ≤ $920 $921 to $1,050 $1,051 to $1,300 $1,301 to $1,700 > $1,700 Median weekly earnings are before tax and are for full-time workers. The median earnings ranges are for all ages and levels of experience. They are indicative only and cannot be used to determine what a worker will actually earn. Employment and Employment Change Data Source: ABS, Employee Earnings, Benefits and Trade Union Membership The Employment information gives the total number of people employed in the occupation at November 2014. It includes both full-time and part-time workers. Job Openings Employment Change shows the change in the number employed as well as the percentage change in employment over the five years to November 2014. Employment change refers to levels of employment increasing or decreasing. Data Source: ABS, Labour Force Unemployment The Unemployment Rate is the number of unemployed persons as a percentage of the labour force (employed plus unemployed). Unemployment is presented in three categories: below average, average and above average. These categories are based on the occupation’s average Unemployment Rate over 2014 relative to the average across ‘all occupations’. An occupation may have high unemployment but also be experiencing shortages for particular skills. Occupational Unemployment Rates do not reflect underutilised skills (such as an Accountant working as a Clerk, Accounting), and does not include first job seekers or those who have not worked in the past two years. Data Source: ABS, Labour Force 35 This shows the proportion of those employed in the occupation who are female. AUSTRALIAN JOBS 2015 This column presents an estimate of the number of job opportunities likely to be available over the five years to November 2019 using five categories. Key Job Openings, 5 years to Nov 2019 ≤ 5,000 5,001 to 10,000 10,001 to 25,000 25,001 to 50,000 > 50,000 Job Openings count both the number of new jobs expected to be created over the five years and the number of vacancies likely due to job turnover (workers leaving their occupation group for other employment or leaving the workforce). These estimates do not provide any guidance about the number of job seekers in each occupation. Although there may be a large number of job openings, there may be an even larger numbers of job seekers. Occupations with small numbers of job openings may offer better prospects for suitably skilled applicants. Data Source: Calculated from Department of Employment, Occupational Employment Projections and ABS, Labour Mobility JOBS BY OCCUPATION AND QUALIFICATION OCCUPATION MATRIX Employ’t Nov 2014 OCCUPATION Employ’t 5 year change to Nov 2014 ‘000 ‘000 ‘% 193.0 9.8 5.1 58.6 2.6 13.0 12.4 21.3 12.7 11.3 3.5 12.0 1.7 29.3 56.3 8.1 3.5 18.8 11.0 9.8 23.0 3.6 -2.0 6.4 -0.1 1.0 2.9 -1.1 -2.8 2.2 1.2 0.2 1.0 8.5 1.6 0.8 0.2 1.5 3.2 2.3 13.5 58.1 -27.9 12.2 -3.1 8.2 30.2 -4.9 -18.1 24.2 50.3 1.9 41.0 3.0 11.2 6.5 8.4 41.3 30.1 30.9 52.5 82.0 11.1 24.5 3.7 4.2 111.3 28.8 18.6 5.9 -4.2 2.1 4.1 1.4 -0.8 0.5 -4.5 1.9 -0.5 28.6 24.1 27.9 3.1 11.1 89.8 3.1 141.0 130.2 6.0 128.0 139.2 89.6 9.7 4.6 147.2 29.5 13.2 5.1 121.7 3.9 12.5 5.2 -0.7 -9.7 0.1 -4.1 8.0 0.3 32.7 25.6 -1.0 15.1 13.2 24.6 -1.6 -3.1 -16.4 7.2 1.0 -5.0 -11.5 0.8 0.1 Unemploy’t 2014 Working Median Median Female Part-time Age Earnings Future Job Openings % % Key on page 35 average above average below average average average average average average below average below average below average above average above average below average average above average below average below average average below average 15 74 15 19 0 16 21 6 3 9 11 44 27 18 11 25 10 11 52 6 50 47 50 61 51 14 6 1 1 32 23 69 23 26 11 70 12 50 67 3 38 36 44 34 43 40 39 35 44 41 48 36 31 39 41 42 44 38 45 40 $$$$ $$$$$ $$$ $$ $$ $$$$ $$$ $$ $$ $$$$ $$$$ $$$$ $$$ $$$$ $$$ $$$ 23.5 -7.4 2.7 58.8 6.1 -18.0 13.0 -3.9 7.2 -2.7 above average average above average below average average above average average below average below average above average 23 30 64 16 51 27 18 68 6 11 29 71 58 34 99 21 0 93 0 7 32 38 25 47 33 40 40 47 40 32 $ $$ $ $$$$ $ $$ $$$ $$ $ $$ 22.1 -2.9 -25.8 2.6 -27.2 9.8 12.2 30.2 24.4 -13.8 13.3 10.5 37.9 -14.2 -40.5 -10.0 32.5 7.9 -49.3 -8.6 24.3 1.1 below average above average above average below average above average below average below average average above average below average average above average above average average below average above average above average average above average average above average below average 9 75 28 18 31 59 36 60 49 46 8 83 19 16 40 65 80 39 28 34 77 32 3 82 61 21 13 77 62 81 95 18 0 73 26 39 42 60 85 14 45 81 71 64 38 28 32 52 32 43 33 47 31 57 33 21 34 35 36 46 45 46 41 42 64 37 $$ $ $$ $ $ $$$ $ $ $$ $$$ $ $$ $$$$ $ $$ $$ $$$ $$ $$$ A Accountants (P) Actors, Dancers and Other Entertainers (P) Actuaries, Mathematicians and Statisticians (P) Advertising and Marketing Professionals (P) Agricultural Technicians (TT) Agricultural, Forestry and Horticultural Operators (MO) Air Transport Professionals (P) Airconditioning and Refrigeration Mechanics (TT) Aircraft Maintenance Engineers (TT) Ambulance Officers and Paramedics (CP) Anaesthetists (P) Animal Attendants and Trainers (TT) Aquaculture Workers (L) Architects and Landscape Architects (P) Architectural, Building and Surveying Technicians (TT) Archivists, Curators and Records Managers (P) Auctioneers, and Stock and Station Agents (SW) Auditors and Company Secretaries (P) Authors, and Book and Script Editors (P) Automotive Electricians (TT) B Bakers and Pastrycooks (TT) Bank Workers (CA) Bar Attendants and Baristas (CP) Barristers (P) Beauty Therapists (CP) Binders, Finishers and Screen Printers (TT) Boat Builders and Shipwrights (TT) Bookkeepers (CA) Bricklayers and Stonemasons (TT) Butchers and Smallgoods Makers (TT) C Cabinetmakers (TT) Cafe Workers (CP) Call or Contact Centre Workers (CA) Canvas and Leather Goods Makers (TT) Car Detailers (L) Care Workers, Nursing Support and Personal (CP) Care Workers, Special (CP) Carers, Aged and Disabled (CP) Carers, Child (CP) Caretakers (L) Carpenters and Joiners (TT) Checkout Operators and Office Cashiers (SW) Chefs (TT) Chemists, and Food and Wine Scientists (P) Chiropractors and Osteopaths (P) Cleaners, Commercial (L) Cleaners, Domestic (L) Cleaners, Other (L) Clerical and Office Support Workers, Other (CA) Clerks, Accounting (CA) Clerks, Betting (CA) Clerks, Court and Legal (CA) 36 AUSTRALIAN JOBS 2015 For more information see joboutlook.gov.au JOBS BY OCCUPATION AND QUALIFICATION Employ’t Nov 2014 Employ’t 5 year change to Nov 2014 Unemploy’t 2014 Working Median Median Female Part-time Age Earnings Future Job Openings OCCUPATION ‘000 ‘000 ‘% % % Clerks, Filing and Registry (CA) Clerks, General (CA) Clerks, Human Resource (CA) Clerks, Inquiry (CA) Clerks, Insurance, Money Market and Statistical (CA) Clerks, Payroll (CA) Clerks, Purchasing and Supply Logistics (CA) Clerks, Transport and Despatch (CA) Clothing Trades Workers (TT) Commissioned Officers, Management (M) Complementary Health Therapists (P) Computer Network Professionals (P) Concreters (L) Conference and Event Organisers (M) Contract, Programme and Project Administrators (CA) Cooks (TT) Counsellors (P) Couriers and Postal Deliverers (CA) Crane, Hoist and Lift Operators (MO) Credit and Loans Officers (CA) 16.8 252.1 7.8 79.9 29.3 33.6 85.1 34.4 7.4 2.0 2.8 24.3 33.6 26.3 125.0 35.8 19.2 47.9 15.4 28.8 -0.8 91.4 -2.7 4.1 3.9 -0.1 1.1 2.9 -2.5 0.0 -6.8 -7.4 -0.2 5.9 29.1 -2.3 -6.0 -1.2 3.4 -0.8 -4.6 56.9 -25.4 5.5 15.3 -0.3 1.3 9.3 -25.2 -0.9 -70.6 -23.2 -0.7 28.7 30.3 -6.0 -23.7 -2.3 27.9 -2.5 above average average above average average average average average average above average above average below average average above average above average average above average below average average below average below average 46 41 5 31 19 31 15 10 54 6 56 5 13 28 17 46 34 23 1 13 76 85 75 70 59 85 43 33 84 2 71 9 0 71 58 55 75 16 3 59 38 42 33 37 38 40 41 41 49 50 48 38 34 34 42 35 47 47 47 38 Key on page 35 $$ $$ $$$ $$ $$ $$ $$ $$$ $ $$$$ $$$ $$$ $$$$ $ $$$ $$ $$$$ $$$ 9.8 8.4 8.5 22.0 8.7 10.4 6.4 12.2 7.9 6.1 52.7 45.9 36.3 45.7 61.6 7.6 189.3 5.0 3.6 -5.9 1.2 3.1 5.1 -0.6 1.3 1.5 -4.3 1.2 12.7 6.3 5.3 9.7 3.3 -2.7 23.6 0.1 58.1 -41.2 16.8 16.5 145.4 -5.6 25.4 13.7 -35.1 23.8 31.8 15.9 17.0 27.1 5.7 -26.4 14.3 1.8 above average below average above average below average below average below average below average average average below average average average below average above average above average below average above average average 74 25 27 44 44 31 45 14 13 55 1 33 37 37 10 4 8 50 47 68 5 98 63 30 96 46 29 95 2 5 14 8 3 7 3 16 36 35 52 29 41 41 33 40 36 58 38 48 56 42 39 49 45 48 $$$ $$$ $ $$$$ $$$$ $$$$ $$$ $$ $$$$$ $ $$$ $$ $$ $$$$ $$$ $ 5.9 12.4 11.4 71.7 10.8 141.7 31.0 25.0 11.9 9.5 2.2 5.7 17.1 5.9 41.7 19.9 7.7 10.5 1.7 2.9 1.2 4.0 1.7 18.0 -3.7 5.8 1.3 -1.3 -3.2 0.2 -7.0 0.4 4.1 1.4 1.4 3.2 39.1 30.9 11.5 6.0 18.8 14.5 -10.7 30.4 12.0 -12.2 -59.6 2.7 -29.2 7.8 10.9 7.4 22.1 43.2 below average below average above average average below average average average average below average average above average average average average average average above average above average 10 18 38 81 3 5 15 4 10 7 18 3 4 2 6 4 17 7 32 30 66 92 1 1 5 9 15 12 12 7 3 12 10 4 9 39 43 41 50 46 35 33 38 42 35 38 50 44 41 35 36 41 48 33 $$$$$ $$$$$ $$$$$ $ $$$$ $$$$ $$ $$$$$ $$$$$ $$$$ $$$ $$$$ $$$ $$$$ $$$$$ $$$$$ $$$$ $$$$ D Dancers, Actors and Other Entertainers (P) Debt Collectors (CA) Deck and Fishing Hands (L) Dental Assistants (CP) Dental Hygienists, Technicians and Therapists (CP) Dental Practitioners (P) Dietitians (P) Directors, Artistic, and Media Producers and Presenters (P) Directors, Film, Television, Radio and Stage (P) Diversional Therapists (CP) Drillers, Miners and Shot Firers (MO) Drivers, Automobile (MO) Drivers, Bus and Coach (MO) Drivers, Delivery (MO) Drivers, Forklift (MO) Drivers, Train and Tram (MO) Drivers, Truck (MO) Driving Instructors (CP) E Economists (P) Economists, Land and Valuers (P) Education Advisers and Reviewers (P) Education Aides (CP) Electrical Distribution Trades Workers (TT) Electricians (TT) Electronics Trades Workers (TT) Engineering and Building Technicians, Other (TT) Engineering Draftspersons and Technicians, Civil (TT) Engineering Draftspersons and Technicians, Electrical (TT) Engineering Draftspersons and Technicians, Electronic (TT) Engineering Draftspersons and Technicians, Mechanical (TT) Engineering Production Systems Workers (MO) Engineers, Chemical and Materials (P) Engineers, Civil (P) Engineers, Electrical (P) Engineers, Electronics (P) Engineers, ICT Support and Test (P) 37 AUSTRALIAN JOBS 2015 For more information see joboutlook.gov.au JOBS BY OCCUPATION AND QUALIFICATION Employ’t Nov 2014 Employ’t 5 year change to Nov 2014 Unemploy’t 2014 Working Median Median Female Part-time Age Earnings Future Job Openings OCCUPATION ‘000 ‘000 ‘% % % Engineers, Industrial, Mechanical and Production (P) Engineers, Mining (P) Engineers, Other (P) Engineers, Telecommunications (P) Environmental and Occupational Health Professionals (P) Event and Conference Organisers (M) 30.6 13.2 7.4 10.4 30.0 26.3 6.3 5.0 0.6 -0.1 7.1 5.9 26.2 60.5 9.6 -0.6 31.1 28.7 above average above average below average average average above average 7 7 12 9 15 28 7 8 10 17 38 71 42 37 37 42 45 34 Key on page 35 $$$$ $$$$$ $$$$ $$$$ $$$$ $$$ 10.3 30.7 6.0 20.1 39.7 7.1 11.1 2.5 38.1 89.3 27.3 9.5 35.4 8.5 26.4 24.6 49.1 18.5 27.6 8.9 5.6 6.5 1.4 16.2 4.3 -0.5 1.6 2.0 -3.7 3.2 3.0 3.1 1.6 -11.3 -3.1 -12.5 -2.7 0.8 -3.4 2.3 0.4 11.2 4.9 2.2 -3.0 0.3 1.4 -2.0 3.3 0.0 -4.3 5.6 51.2 -15.5 8.9 71.8 38.4 -22.9 -3.4 -31.4 -21.9 2.2 -28.6 9.4 1.8 29.6 35.7 8.6 -24.9 5.8 26.8 -60.2 25.3 -0.1 above average above average above average above average above average below average below average below average below average below average below average average above average average below average average average below average below average above average above average above average above average above average above average 28 22 6 33 44 34 17 3 22 26 16 27 83 20 8 11 16 9 68 19 35 58 21 24 17 16 27 24 35 39 23 7 7 23 30 24 60 35 4 37 22 28 3 56 0 92 60 14 10 57 43 42 34 39 30 31 44 35 50 57 56 35 18 40 42 38 42 44 32 35 35 32 41 31 56 $$ $$ $ $ $ $$ $$$ $$ $$ $$$ $ $$ $$$ $$$$ $$$$ $$$$ $ $ $ $$$ $$$ 9.8 4.6 79.3 14.3 7.6 49.4 4.2 19.6 7.6 3.1 4.5 -3.5 25.0 6.9 -4.0 10.3 1.2 7.2 0.9 2.2 84.3 -43.1 46.2 94.0 -34.6 26.5 37.8 58.4 13.5 - below average below average average average average average above average average average above average 58 31 28 12 9 24 43 29 52 42 95 61 9 11 1 52 22 6 28 57 49 37 38 43 41 34 49 46 42 32 $$$ $$ $$ $$$$$ $$$ $$ $$ $ $$ - 63.4 36.4 5.4 18.7 7.7 28.0 56.1 9.1 -4.9 0.5 -1.7 -0.9 5.9 1.6 16.8 -11.8 11.0 -8.4 -10.0 26.7 2.9 average average above average above average above average average above average 45 39 21 13 23 67 19 85 3 65 49 65 88 70 30 52 45 46 36 44 36 $ $$ $$$$ $$ $ $ $$$ 25.9 16.0 43.1 10.5 54.5 3.0 1.8 2.4 11.9 3.2 10.6 -1.6 7.3 17.7 38.3 43.2 24.0 -34.3 average average below average above average average above average 9 8 9 7 14 24 26 23 17 39 25 50 41 39 40 33 35 44 $$$$ $$$$ $$$$ $$$$ $$$ - F Factory Process Workers, Other (L) Factory Workers, Food and Drink (L) Factory Workers, Plastics and Rubber (L) Farm Workers, Crop (L) Farm Workers, Livestock (L) Farm Workers, Mixed Crop and Livestock (L) Farm, Forestry and Garden Workers, Other (L) Farmers, Aquaculture (M) Farmers, Crop (M) Farmers, Livestock (M) Farmers, Mixed Crop and Livestock (M) Fashion, Industrial and Jewellery Designers (P) Fast Food Cooks (L) Fencers (L) Financial Brokers (P) Financial Dealers (P) Financial Investment Advisers and Managers (P) Fire and Emergency Workers (CP) Fitness Instructors (CP) Floor Finishers (TT) Florists (TT) Food Trades Assistants (L) Forestry and Logging Workers (L) Freight and Furniture Handlers (L) Funeral Workers (CP) G Gallery, Library and Museum Technicians (TT) Gaming Workers (CP) Gardeners (TT) Geologists and Geophysicists (P) Glaziers (TT) Graphic and Web Designers, and Illustrators (P) Graphic Pre-Press Trades Workers (TT) Greenkeepers (TT) Guides, Gallery, Museum and Tour (CP) Guides, Outdoor Adventure (CP) H Hairdressers (TT) Handypersons (L) Health Diagnostic and Promotion Professionals, Other (P) Hotel and Motel Managers (M) Hotel Service Managers (CP) Housekeepers (L) Human Resource Professionals (P) I ICT Business and Systems Analysts (P) ICT Sales Professionals (P) ICT Security, Database and Systems Administrators (P) ICT Support and Test Engineers (P) ICT Support Technicians (TT) ICT Trainers (P) 38 AUSTRALIAN JOBS 2015 For more information see joboutlook.gov.au JOBS BY OCCUPATION AND QUALIFICATION Employ’t Nov 2014 Employ’t 5 year change to Nov 2014 Unemploy’t 2014 Working Median Median Female Part-time Age Earnings Future Job Openings OCCUPATION ‘000 ‘000 ‘% % % Importers, Exporters and Wholesalers (M) Indigenous Health Workers (CP) Industrial Spraypainters (MO) Information and Organisation Professionals, Other (P) Inspectors and Regulatory Officers (CA) Insulation and Home Improvement Installers (L) Insurance Agents (SW) Insurance Investigators and Loss Adjusters (CA) Intelligence and Policy Analysts (P) Interior Designers (P) Internal Medicine Specialists (P) 20.0 1.8 4.3 22.2 30.7 15.6 13.1 3.8 19.4 10.8 8.1 -1.3 0.0 -2.2 5.0 -0.5 -4.6 3.2 -3.1 -1.5 3.0 3.4 -6.1 -33.6 29.1 -1.6 -22.9 32.1 -45.1 -7.0 39.3 72.0 below average above average below average below average average above average below average below average below average below average below average 18 19 7 18 15 14 16 8 17 30 15 27 64 3 53 46 3 47 37 58 82 42 49 41 34 37 43 38 36 41 40 39 43 Key on page 35 $$$ $$$ $$$ $$ $$$ $$$ $$$$ $$$ - 5.1 24.4 0.5 0.0 10.0 -0.1 below average average 28 28 50 47 41 36 $$$$ 43.0 128.0 -28.0 10.4 -39.4 8.8 above average above average 44 80 86 57 40 24 $$ $ 54.7 32.0 4.3 5.0 14.6 3.1 14.3 12.0 6.9 5.8 -2.7 -4.1 -2.5 -0.6 0.1 5.2 -1.4 -6.9 11.8 -7.9 -48.6 -33.4 -4.2 2.6 57.6 -10.1 -49.8 above average above average above average above average above average below average above average below average average 15 40 6 4 54 18 33 32 82 2 12 7 3 77 21 91 81 81 33 43 34 42 49 52 37 51 44 $$$ $ $$$$ $$$ $ $$$ $$$$ $$ 0.1 7.9 4.3 9.5 1.9 14.2 53.7 140.9 12.7 63.4 35.6 3.3 8.3 80.7 9.1 22.0 51.8 52.4 21.8 18.7 7.7 44.9 60.2 7.0 124.9 8.2 16.6 69.1 46.1 23.6 -4.5 0.9 0.5 1.9 -1.7 -1.5 9.8 11.4 4.2 16.3 -7.3 1.7 -2.2 -2.0 -22.8 5.4 6.1 -0.1 7.1 -1.7 -0.9 3.0 22.6 0.7 0.0 -1.7 8.3 15.7 4.5 2.8 -97.2 13.0 14.2 25.7 -47.6 -9.8 22.3 8.8 49.6 34.7 -17.1 -21.3 -2.4 -71.5 32.8 13.5 -0.2 48.2 -8.4 -10.0 7.1 60.0 11.2 0.0 -16.9 100.8 29.4 10.9 13.4 above average above average above average average below average average average average above average average below average average below average below average average below average average average average above average above average average average below average below average below average average below average average below average 15 34 5 4 30 42 18 8 24 17 11 5 23 7 6 3 11 10 17 13 23 11 6 11 31 33 19 12 8 10 3 51 12 15 50 49 36 37 42 49 44 49 91 6 46 10 39 31 77 49 65 56 19 37 81 57 65 33 30 54 43 40 47 41 45 48 43 40 35 42 39 48 41 45 48 45 43 46 47 46 36 41 42 41 46 52 47 45 43 44 $$$ $ $$ $$ $$$$ $$$$ $$ $$ $$$ $ $$$ $$$$ $$$$$ $$$$$ $$$$$ $$$$$ $$$$ $$ $ $$$$$ $$$$$ $$$ $$$ $$$$$ $$$$ $$$$ $$$$$ J Jewellers (TT) Journalists and Other Writers (P) K Keyboard Operators (CA) Kitchenhands (L) L Labourers, Building and Plumbing (L) Labourers, Garden and Nursery (L) Labourers, Other Construction and Mining (L) Labourers, Paving and Surfacing (L) Laundry Workers (L) Leather and Canvas Goods Makers (TT) Legal Executives and Conveyancers (CA) Librarians (P) Library Assistants (CA) M Machine Operators, Clay, Concrete, Glass and Stone (MO) Machine Operators, Other (MO) Machine Operators, Paper and Wood Processing (MO) Machine Operators, Plastics and Rubber Production (MO) Machine Operators, Textile and Footwear Production (MO) Mail Sorters (CA) Management and Organisation Analysts (P) Managers, Advertising and Sales (M) Managers, Amusement, Fitness and Sports Centre (M) Managers, Cafe and Restaurant (M) Managers, Call, Contact Centre and Customer Service (M) Managers, Caravan Park and Camping Ground (M) Managers, Child Care Centre (M) Managers, Construction (M) Managers, Corporate Services (M) Managers, Engineering (M) Managers, Finance (M) Managers, General (M) Managers, Health and Welfare Services (M) Managers, Hotel and Motel (M) Managers, Hotel Service (CP) Managers, Human Resource (M) Managers, ICT (M) Managers, Licensed Club (M) Managers, Office (CA) Managers, Other Accommodation and Hospitality (M) Managers, Other Education (M) Managers, Other Hospitality, Retail and Service (M) Managers, Other Specialist (M) Managers, Policy and Planning (M) 39 AUSTRALIAN JOBS 2015 For more information see joboutlook.gov.au JOBS BY OCCUPATION AND QUALIFICATION Employ’t Nov 2014 Employ’t 5 year change to Nov 2014 Unemploy’t 2014 Working Median Median Female Part-time Age Earnings Future Job Openings OCCUPATION ‘000 ‘000 ‘% % % Managers, Practice (CA) Managers, Production (M) Managers, Research and Development (M) Managers, Retail (M) Managers, Supply and Distribution (M) Managers, Transport Services (M) Managing Directors and Chief Executives (M) Manufacturers (M) Marine Transport Professionals (P) Massage Therapists (CP) Mathematicians, Statisticians and Actuaries (P) Meat Boners and Slicers, and Slaughterers (L) Media Producers and Presenters, and Artistic Directors (P) Medical Imaging Professionals (P) Medical Practitioner, General (P) Medical Practitioner, Other (P) Medical Technicians (TT) Metal Casting, Forging and Finishing Trades Workers (TT) Metal Fitters and Machinists (TT) Metal Trades Workers, Precision (TT) Midwives (P) Miners, Drillers and Shot Firers (MO) Ministers of Religion (P) Models and Sales Demonstrators (SW) Motor Mechanics (TT) Motor Vehicle Parts and Accessories Fitters (L) Multimedia Specialists and Web Developers (P) Music Professionals (P) 18.3 52.5 11.4 220.5 45.0 22.3 45.4 16.9 7.1 15.5 5.1 13.1 12.2 16.7 49.9 9.8 21.9 3.5 123.8 6.0 15.8 52.7 17.8 11.5 101.7 12.7 6.5 14.0 6.1 -0.8 1.0 -5.2 12.5 3.2 -9.6 -2.3 -4.7 5.6 -2.0 -1.3 1.5 4.0 11.1 -4.2 2.1 0.2 13.8 -2.4 1.8 12.7 0.2 2.3 19.1 4.1 -1.7 4.3 49.8 -1.5 9.3 -2.3 38.4 17.0 -17.4 -12.0 -39.9 56.4 -27.9 -8.8 13.7 31.8 28.7 -29.7 10.4 5.2 12.5 -28.4 12.5 31.8 0.9 24.9 23.1 48.1 -21.2 45.1 below average below average above average average average below average below average below average above average average below average above average average below average below average below average below average above average average above average below average average below average above average below average above average below average average 30 4 13 16 3 11 12 13 9 63 15 2 14 26 22 24 42 13 5 14 57 1 26 71 6 3 15 63 90 16 33 46 19 18 20 16 5 72 50 7 46 72 43 47 78 1 1 1 99 2 28 86 2 1 20 28 48 43 45 40 45 45 50 48 50 40 44 34 40 35 44 43 40 44 39 43 42 38 46 42 36 31 34 38 Key on page 35 $$$$ $$$$ $$$$ $ $$$$ $$$ $$$$$ $$$$ $$$ $$$$$ $$$ $$$$ $$$$ $$$$$ $$$$$ $ $$$ $$ $$$ $$$$$ $$ $ $$ $ $$$ $$$ 7.3 13.6 3.3 17.5 231.5 89.8 3.8 -6.7 -1.9 -7.3 22.7 8.0 107.5 -33.0 -35.8 -29.5 10.9 9.8 below average below average above average below average below average below average 39 29 53 52 45 59 96 91 43 88 88 77 47 49 52 46 43 43 $$$$ $$$$ $$ $$ $$$ $ 12.8 5.6 5.4 3.5 73.9 169.5 below average below average 50 26 88 61 35 40 $$$ $$$$ 53.0 51.3 16.6 11.3 63.3 89.8 2.8 15.1 33.7 13.0 0.7 23.7 9.8 9.2 43.2 15.3 18.4 29.6 86.0 -9.8 5.7 3.0 -2.8 7.4 8.0 -1.4 3.8 11.4 0.7 -2.2 7.8 -1.6 1.6 -11.2 4.2 -0.7 -2.3 15.1 -15.6 12.5 22.1 -20.0 13.3 9.8 -33.1 34.0 51.5 5.9 -76.8 49.4 -13.8 21.1 -20.7 37.4 -3.8 -7.3 21.3 above average average average above average average below average average average average average above average below average average average average average average above average average 43 16 13 36 24 59 69 60 32 55 51 33 29 2 7 23 5 15 7 53 2 1 27 98 77 70 68 57 60 71 71 37 6 1 8 11 1 0 38 40 37 38 42 43 43 47 34 40 37 33 39 43 43 33 43 34 35 $ $$ $$ $$$ $$$ $ $$$ $$$$ $$$ $$$$$ $$$ $$$ $$$$ $$ $$$ N Nurse Educators and Researchers (P) Nurse Managers (P) Nurserypersons (TT) Nurses, Enrolled and Mothercraft (CP) Nurses, Registered (P) Nursing Support and Personal Care Workers (CP) O Occupational Therapists (P) Optometrists and Orthoptists (P) P Packers (L) Painting Trades Workers (TT) Panelbeaters (TT) Performing Arts Technicians (TT) Personal Assistants (CA) Personal Care and Nursing Support Workers (CP) Personal Care Consultants (CP) Personal Service Workers, Other (CP) Pharmacists (P) Photographers (P) Photographic Developers and Printers (MO) Physiotherapists (P) Planners, Urban and Regional (P) Plant Operators, Chemical, Gas, Petroleum and Power (TT) Plant Operators, Earthmoving (MO) Plant Operators, Other Mobile (MO) Plant Operators, Other Stationary (MO) Plasterers (TT) Plumbers (TT) 40 AUSTRALIAN JOBS 2015 For more information see joboutlook.gov.au JOBS BY OCCUPATION AND QUALIFICATION Employ’t Nov 2014 Employ’t 5 year change to Nov 2014 Unemploy’t 2014 Working Median Median Female Part-time Age Earnings Future Job Openings OCCUPATION ‘000 ‘000 ‘% % % Podiatrists (P) Police (CP) Policy and Intelligence Analysts (P) Postal Deliverers and Couriers (CA) Primary Products Inspectors (TT) Printers (TT) Printers and Photographic Developers (MO) Printing Assistants and Table Workers (L) Prison Officers (CP) Process Workers, Meat, Poultry and Seafood (L) Process Workers, Metal Engineering (L) Process Workers, Timber and Wood (L) Product Assemblers (L) Product Quality Controllers (L) Psychiatrists (P) Psychologists (P) Public Relations Professionals (P) 3.9 53.5 19.4 47.9 2.7 14.8 0.7 4.4 15.9 16.4 8.8 5.7 26.9 18.2 6.6 25.0 17.8 2.7 8.2 -1.5 -1.2 -1.5 -3.5 -2.2 -1.7 -0.5 -2.2 -8.5 -3.3 -10.9 3.3 6.1 4.1 0.6 18.1 -7.0 -2.3 -34.9 -19.3 -76.8 -27.5 -2.8 -12.0 -48.9 -36.7 -28.7 22.0 19.6 3.6 below average below average below average average below average average above average above average below average above average above average above average above average above average below average below average average 12 6 17 23 4 10 51 53 3 15 8 4 16 23 22 41 20 46 24 58 16 41 13 71 45 29 38 4 5 24 46 27 79 67 31 39 40 47 38 43 37 44 48 35 37 38 41 42 48 42 35 Key on page 35 $$$$ $$$$ $$ $$$ $$$ $ $$$$ $ $$ $ $ $$ $$$$ $$$ 3.4 87.1 162.2 2.2 4.4 46.3 -1.4 17.8 -10.4 -0.8 0.4 15.8 -29.3 25.7 -6.0 -26.9 10.9 51.8 above average below average average below average below average average 3 17 51 33 18 28 2 51 94 4 58 58 41 43 40 44 38 33 $$ $ $$$ $$ 5.8 6.4 507.9 17.1 39.2 16.0 90.0 27.3 27.1 7.4 13.7 29.3 8.7 11.8 5.7 25.5 9.7 12.9 23.4 3.7 51.0 55.9 6.2 8.3 4.9 8.8 50.0 7.6 12.7 34.0 85.6 56.9 6.4 3.7 -3.3 29.3 -1.8 3.7 2.4 -17.0 -0.6 -9.5 -3.0 -4.3 5.8 2.8 -7.3 -2.0 4.6 -1.6 4.4 1.6 -0.8 -35.1 7.6 0.4 -1.6 0.9 0.7 -32.1 1.5 3.9 16.1 -0.4 5.6 1.6 171.2 -33.8 6.1 -9.5 10.3 17.7 -15.9 -2.3 -25.9 -29.0 -23.8 24.4 47.0 -38.2 -26.2 22.1 -14.2 51.1 7.4 -18.0 -40.7 15.8 6.4 -16.5 23.5 9.3 -39.1 25.1 43.9 89.4 -0.4 10.9 34.4 average average above average above average average average average average average above average above average below average below average above average below average average average below average average above average average above average above average above average above average above average above average below average above average average average below average below average 5 47 71 30 67 8 14 7 7 62 51 3 15 21 14 18 16 27 29 27 56 29 57 27 10 0 76 4 60 34 9 12 44 26 45 67 28 93 23 36 32 12 60 66 56 20 49 24 47 39 55 69 21 97 17 44 85 4 0 40 11 57 84 15 52 88 52 35 24 30 24 39 41 42 38 43 30 51 34 36 41 37 35 35 36 40 48 39 31 53 41 38 24 33 43 40 36 40 40 $ $ $$ $ $$$$ $$$ $$$$ $$ $ $$$ $$$$$ $$$$ $$ $$$$ $$$$ $$$$ $$$$ $$$$ $$ $$ $$$ $ $ $$$ $ $$ $$$ $$$ $$$$ $$$$ $$ R Railway Track Workers (L) Real Estate Sales Agents (SW) Receptionists (CA) Recycling and Rubbish Collectors (L) Retail and Wool Buyers (SW) Retail Supervisors (SW) S Safety Inspectors (TT) Sales Assistants and Salespersons, Other (SW) Sales Assistants, General (SW) Sales Assistants, ICT (SW) Sales Assistants, Pharmacy (SW) Sales Professionals, ICT (P) Sales Representatives (SW) Sales Representatives, Technical (P) Salespersons, Motor Vehicle and Vehicle Parts (SW) Salespersons, Street Vendors and Related (SW) Salespersons, Ticket (SW) School Principals (M) Science Professionals, Other Natural and Physical (P) Science Technicians (TT) Scientists, Agricultural and Forestry (P) Scientists, Environmental (P) Scientists, Food and Wine, and Chemists (P) Scientists, Life (P) Scientists, Medical Laboratory (P) Screen Printers, Binders and Finishers (TT) Secretaries (CA) Security Officers and Guards (CP) Service Station Attendants (SW) Sewing Machinists (MO) Shearers (TT) Sheetmetal Trades Workers (TT) Shelf Fillers (L) Signwriters (TT) Social Professionals (P) Social Workers (P) Software and Applications Programmers (P) Solicitors (P) Speech Pathologists and Audiologists (P) 41 AUSTRALIAN JOBS 2015 For more information see joboutlook.gov.au JOBS BY OCCUPATION AND QUALIFICATION Employ’t Nov 2014 Employ’t 5 year change to Nov 2014 Unemploy’t 2014 Working Median Median Female Part-time Age Earnings Future Job Openings OCCUPATION ‘000 ‘000 ‘% % % Sports Coaches, Instructors and Officials (CP) Sportspersons (CP) Storepersons (MO) Structural Steel and Welding Trades Workers (TT) Structural Steel Construction Workers (L) Surgeons (P) Survey Interviewers (CA) Surveyors and Cartographers (P) Switchboard Operators (CA) 45.1 13.8 120.3 71.7 30.8 6.3 1.7 12.3 4.4 18.9 5.1 17.8 3.2 8.9 0.3 -0.8 0.5 -1.2 71.7 58.9 17.4 4.7 40.5 5.2 -31.2 4.6 -21.7 average below average above average above average above average below average above average below average below average 75 66 22 5 6 16 75 12 44 47 27 20 0 0 19 56 7 77 22 23 38 36 33 42 46 40 48 Key on page 35 $$$ $$$$ $ $$$ $$$$ $$$$$ $$$ $ 36.2 1.9 143.8 118.1 23.0 30.1 3.2 11.9 9.5 2.2 5.7 2.6 56.3 54.5 21.9 25.0 11.8 5.0 28.0 8.5 5.3 21.6 4.8 23.9 3.0 26.8 10.3 32.1 22.3 0.7 8.9 -20.1 5.4 -6.5 -3.7 1.3 -1.3 -3.2 0.2 -0.1 1.6 10.6 2.1 5.8 -7.3 -0.5 7.0 -2.5 -3.2 2.7 -0.5 0.7 -1.6 0.5 1.3 -3.2 160.6 6.6 -14.5 30.8 -17.7 -53.9 12.0 -12.2 -59.6 2.7 -3.1 3.0 24.0 10.4 30.4 -38.2 -9.4 33.7 -23.0 -37.9 14.3 -9.1 3.1 -34.3 1.9 14.6 -9.0 average below average below average average below average above average above average below average average above average average average average average below average average above average below average above average above average below average above average below average average above average above average below average average 46 24 32 20 43 43 54 10 7 18 3 0 11 14 42 4 21 2 7 55 8 14 12 25 24 15 36 78 97 68 83 61 81 52 84 15 12 12 7 51 11 25 78 9 49 14 3 65 0 1 0 79 50 55 78 74 40 34 40 43 50 49 44 35 38 50 44 43 41 35 40 42 36 43 38 33 32 36 54 35 44 40 37 40 $$ $$$$ $$$$ $$$$ $$$$ $$$ $$$$$ $$$$ $$$ $$$$ $$ $$$$ $$$ $ $$$$$ $$ $$$$ $$$ $ $ $$ $$$ $$ $$$$ $ $$$ 50.9 0.2 9.0 -4.6 21.6 -95.8 above average above average 37 14 50 6 47 42 $$$$$ $ 12.4 5.1 8.1 6.5 10.0 8.6 9.6 10.9 2.9 -1.4 -3.1 0.5 3.2 -1.8 0.2 2.3 30.9 -21.9 -27.4 9.2 47.3 -17.5 2.5 26.8 below average below average above average above average below average average average below average 18 6 4 59 22 44 64 54 30 3 4 55 64 99 70 84 41 45 31 31 38 26 49 33 $$$$$ $ $$ $ $$$$ $ $ 121.3 6.5 71.7 49.6 24.7 7.4 8.5 -1.7 3.2 6.3 4.0 -0.5 7.5 -21.2 4.7 14.6 19.3 -5.8 above average below average above average average average above average 75 15 5 32 31 22 77 20 0 74 77 10 22 34 36 43 39 51 $ $$$ $$$ $$$ $$$ $ T Teachers, Early Childhood (Pre-primary School) (P) Teachers, Middle School (P) Teachers, Primary School (P) Teachers, Secondary School (P) Teachers, Special Education (P) Teachers, Vocational Education (P) Teachers of English to Speakers of Other Languages (P) Technicians and Draftspersons, Civil Engineering (TT) Technicians and Draftspersons, Electrical Engineering (TT) Technicians and Draftspersons, Electronic Engineering (TT) Technicians and Draftspersons, Mechanical Engineering (TT) Technicians, Agricultural (TT) Technicians, Architectural, Building and Surveying (TT) Technicians, ICT Support (TT) Technicians, Medical (TT) Technicians, Other Building and Engineering (TT) Technicians, Science (TT) Telecommunications Technical Specialists (TT) Telecommunications Trades Workers (TT) Telemarketers (SW) Tilers, Roof (TT) Tilers, Wall and Floor (TT) Toolmakers and Engineering Patternmakers (TT) Tourism and Travel Advisers (CP) Trainers, ICT (P) Training and Development Professionals (P) Travel Attendants (CP) Tutors and Teachers, Private (P) U University Lecturers and Tutors (P) Upholsterers (TT) V Valuers and Land Economists (P) Vehicle Body Builders and Trimmers (TT) Vehicle Painters (TT) Vending Machine Attendants (L) Veterinarians (P) Veterinary Nurses (TT) Visual Arts and Crafts Professionals (P) Visual Merchandisers (SW) W Waiters (CP) Web Developers and Multimedia Specialists (P) Welding Trades and Structural Steel Workers (TT) Welfare Support Workers (CP) Welfare, Recreation and Community Arts Workers (P) Wood Machinists and Other Wood Trades Workers (TT) 42 AUSTRALIAN JOBS 2015 For more information see joboutlook.gov.au ADDITION INFORMATION DATA SOURCES Some graduate destinations data are from customised tables produced for the Department of Employment. Australian Bureau of Statistics (ABS) abs.gov.au • Labour Force, various data sets • Employee Earnings, Benefits and Trade Union Membership, Australia, August 2013 • Regional Population Growth 2012-13, June 2013 • Population by Age and Sex, Regions of Australia, June 2013 • Education and Work, May 2014 • Labour Mobility, February 2013 • Australian and New Zealand Standard Classification of Occupations • Australian and New Zealand Standard Industrial Classification • Students and Courses, 2013 • Student Outcomes, various issues • Longitudinal Survey of Australian Youth Publications (Papers 2546 and 2761) • VOCSTATS, tables generated February and March 2015. Student data are for domestic students with a publicly funded training provider. Graduate outcomes data are for all graduates six months after completing their training. Throughout Australian Jobs 2015, employment data at the national and state level are trend (where possible). Trend data do not add and are adjusted with each data release. USEFUL LINKS Employment data at the regional level are 12 month averages. Employment data for occupations at the industry level are four quarter averages. Help if you are looking for work For many small occupations, standard errors are large. Although trend data are used for occupation employment estimates, employment growth trends are variable for small occupations and should be used with caution. For consistency across data sets, employment is ‘total’ and includes full-time and part-time workers of all ages. Educational attainment data relate to the working age population (15 to 64). Regional areas are defined as those outside Greater Sydney, Greater Melbourne, Greater Brisbane, Greater Adelaide, Greater Perth, Hobart, Darwin and the Australian Capital Territory. Some data are from customised tables produced for the Department of Employment. Commentary in state maps Source is ABS Labour Force, Australia, Detailed - Electronic Delivery, February 2015 and data are 12 month averages of original estimates. The statements are based on decade averages. Unless otherwise specified, the statements refer to comparisons between all the states and territories. The incidence of youth long-term unemployment refers to the proportion of unemployed youth who are long-term unemployed (i.e. unemployed for 12 months or longer). Youth disengagement refers to the proportion of all youth who are not in employment and not attending full-time education. Department of Employment • 2015 Employment Projections lmip.gov.au • Skill Shortage Research employment.gov.au/skill-shortages • Survey of Employers’ Recruitment Experiences employment.gov.au/regionalreport There is a wide range of Australian Government assistance available to help you find the right job. The following is summary in nature and cannot fully explain the large number of policies and programmes available, but the websites listed below can direct you to more information. Centrelink humanservices.gov.au Centrelink delivers a range of payments and services for people at times of major change. Centrelink is part of the Department of Human Services. Jobactive employment.gov.au/jobactive From 1 July 2015, new employment services called jobactive will better meet the needs of job seekers and employers and improve job outcomes. Job seekers will have access to tailored help from a jobactive organisation, based on their assessed needs. Australian JobSearch jobsearch.gov.au JobSearch is funded by the Australian Government as a free service to help job seekers find jobs and employers find staff. It lists thousands of vacancies, as well as links to a range of other employment websites. Youth youth.gov.au/sites/youth Some information about programmes available for young people is included on page 12 of this publication. Mature Age business.gov.au (search for employing mature age workers) [email protected] Some information about programmes available for older workers is included on page 13 of this publication. Help in the workplace Department of Education and Training Fair Work Ombudsman Graduate Careers Australia (GCA) The Fair Work Ombudsman is a single point of contact for advice and help on workplace rights and responsibilities, including pay and conditions. For further information call 13 13 94. Higher Education Student Data Collections education.gov.au • GradStats, 2014 graduatecareers.com.au • Graduate Destinations Tables and Figures • Graduate Salaries Tables and Figures Bachelor and masters degree employment outcomes are a proportion of those who were available for full-time employment four months after graduation. Salary data refer to median starting salary of Australian bachelor degree graduates in first full-time employment and aged less than 25 years. 43 National Centre for Vocational Education Research ncver.edu.au AUSTRALIAN JOBS 2015 fairwork.gov.au Help if you have lost your job Fair Entitlements Guarantee employment.gov.au/feg This scheme provides financial assistance to employees who have lost their job as a result of their employer going bankrupt or into liquidation. It is a safety net that covers a range of unpaid employment entitlements. EM15_0008 AUSTRALIAN JOBS 2015 44 ISSN 1832-7230 AUSTRALIAN JOBS 2015


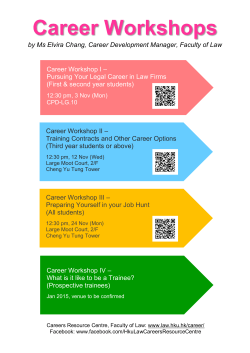

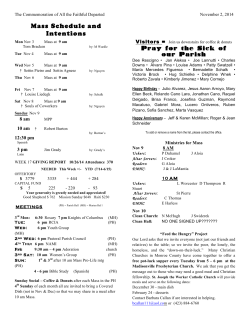


© Copyright 2026