
Investigating the Function of the Arabidopsis thaliana
Investigating the Function of the
Arabidopsis thaliana INDETERMINATE DOMAIN2 gene
by
Tylar Meeks
A Thesis
presented to
The University of Guelph
In partial fulfilment of requirements
for the degree of
Master of Science
in
Molecular and Cellular Biology
Guelph, Ontario, Canada
© Tylar Meeks, April, 2015
ABSTRACT
INVESTIGATING THE FUNCTION OF THE
ARABIDOPSIS THALIANA INDETERMINATE DOMAIN2 GENE
Tylar Kathleen Meeks
University of Guelph, 2015
Advisor:
Dr. Joseph Colasanti
The INDETERMINATE DOMAIN (IDD) genes in Arabidopsis thaliana encode a
transcription factor family found in all higher plants. IDD2, one of 16 IDD family genes in
Arabidopsis, is highly expressed in hypocotyls, shoot apices and petioles. Loss-of-function idd2
mutants show no obvious differences in growth and development under a variety of conditions,
suggesting that IDD2 may function redundantly. Constitutive overexpression of IDD2 causes
altered seed coat morphology and defects in early growth. 35S::IDD2 overexpression seedlings
show a constitutive response to the phytohormone auxin. Elucidation of IDD2 expression in
IDD2::GFP:GUS reporter plants revealed a highly specific pattern, including expression in leaf
and cotyledon vasculature, petioles, hypocotyl, shoot apex, root tip and emerging lateral roots,
which all correspond to areas with high levels of auxin. Taken together, analysis of loss-offunction mutants, overexpression lines and the IDD2 expression pattern suggests that IDD2 has a
redundant role in auxin sensing and response.
Acknowledgements
Firstly, I would like to thank my advisor, Dr. Joe Colasanti, for taking me into his lab, being a
great mentor, helping me to grow as a scientist and a person throughout my time in his lab and
providing insights and optimism when things weren’t proceeding as planned. I am lucky to have
had him as my advisor.
I would like to thank Dr. Annette Nassuth, who took me into her lab after my second year of
undergrad when I had no lab experience at all. I am grateful to her for giving me the opportunity
to discover my scientific curiosity and for teaching me many skills important for a scientist.
Thank you to my advisory committee, Dr. Istvan Rajcan and Dr. Elizabeth Lee, for their guidance
and helpful suggestions in preparing this thesis and throughout my MSc.
I would like to acknowledge the Ontario Ministry of Agriculture, Food and Rural Affairs –
University of Guelph partnership, both for providing me with the Highly Qualified Personnel
scholarship and for giving me the opportunity to be an intern in the Knowledge Translation and
Transfer department.
Thank you to Mike Mucci and Tannis Slimmon for their help in setting up highly time-sensitive
experiments and always being friendly and ready to help.
I would like to thank my friends and colleagues in the Molecular and Cellular Biology department,
in particular the past and current members of the Colasanti and Rothstein labs for their guidance,
advice and co-operation and for making the lab a pleasant place to be.
I would like to especially thank my family for always being there for me and believing in me and
for their love and guidance.
Lastly, I would like to thank Alex, for his endless support and love and for always believing in me.
Thank you for teaching me how to have fun in the midst of a stressful time and always making me
laugh.
I feel extremely grateful to these people for their support in this endeavor and I hope they accept
my heartfelt thanks.
iii
Table of Contents
Acknowledgements ........................................................................................................................ iii
List of Tables ............................................................................................................................... viii
List of Figures ................................................................................................................................ ix
List of Abbreviations and Acronyms ........................................................................................... xiv
Chapter 1:
Literature Review and Background .......................................................................... 1
1.1
Transition to flowering in Arabidopsis ............................................................................. 1
1.2
Arabidopsis INDETERMINATE DOMAIN family genes are largely uncharacterized ..... 4
1.3
Oil production and hydrolysis in Arabidopsis seeds ........................................................ 5
1.4
Seed dormancy and germination are controlled by antagonistic hormones ..................... 9
1.5
Root development and growth are complex processes ................................................... 12
1.6
Vasculature formation in roots, hypocotyl and leaves follows specific patterns ........... 16
1.7
Leaf development is a multi-stage process ..................................................................... 18
1.8
Starch metabolism is a highly regulated process ............................................................ 19
1.9
Sucrose is transported from source to sink ..................................................................... 22
1.10
Sugar metabolism enzymes have a signaling role ...................................................... 23
1.11
Hypothesis .................................................................................................................. 25
1.12
Objectives ................................................................................................................... 25
Chapter 2:
2.1
Materials and Methods ............................................................................................ 26
idd2 Mutant Lines ........................................................................................................... 26
iv
2.2
Plant Growth Conditions ................................................................................................ 26
2.3
Media .............................................................................................................................. 27
2.4
Use of Gateway® Technology to make Recombinant DNA Constructs........................ 29
2.5
Floral Dip Agro-infiltration to Create Transgenic Plants ............................................... 31
2.6
Genetic Crosses of Arabidopsis Plants ........................................................................... 32
2.7
DNA Extraction .............................................................................................................. 32
2.8
PCR Amplification and Product Analysis ...................................................................... 33
2.9
RNA Extraction and cDNA Synthesis ............................................................................ 34
2.10
Quantitative PCR ........................................................................................................ 35
2.11
Starch, Glucose and Sucrose Extraction and Quantification ...................................... 36
2.12
GUS Assay for Gene Expression Analysis................................................................. 39
2.13
Mucilage Staining ....................................................................................................... 40
2.14
Qualitative Comparison of Relative Seed Oil Concentrations ................................... 40
2.15
Image Capture and Analysis ....................................................................................... 40
2.16
Statistical Tests ........................................................................................................... 41
Chapter 3:
3.1
Results ..................................................................................................................... 42
IDD2 expression in transgenic plants ............................................................................. 42
3.1.1
Analysis of putative idd2 loss-of-function mutants ............................................................ 42
3.1.2
Analysis of IDD2 overexpression transgenic plants ........................................................... 44
3.2
IDD2 expression throughout development ..................................................................... 47
v
3.3
IDD1 expression throughout development ..................................................................... 53
3.4
Root and Hypocotyl Growth Assays .............................................................................. 57
3.4.1
idd2 mutant plants do not show a difference in germination or root growth ...................... 57
3.4.2
Allelism test shows that the idd2-1 allele phenotype is due to a possible second, linked
insertion ............................................................................................................................................ 64
3.4.3
3.5
IDD2 overexpression does not affect hypocotyl elongation or root growth ....................... 67
Morphology of idd2 and 35S::IDD2 plants .................................................................... 72
3.5.1
Petiole lengths and leaf size in idd2 plants do not differ from Col-0 .................................. 72
3.5.2
Lateral roots of idd2 and 35S::IDD2 plants do not differ from Col-0 ................................ 72
3.5.3
35S::IDD2 plants have pale leaves ..................................................................................... 73
3.5.4
35S::IDD2 seeds have altered morphology ........................................................................ 74
3.6
Leaf Starch, Sucrose and Glucose Concentrations ......................................................... 76
3.6.1
Pre-floral transition leaf starch, sucrose and glucose concentrations do not differ in idd2
mutants.............................................................................................................................................. 76
3.6.2
idd2-3 mutants sometimes show reduced post-floral transition leaf starch and glucose
concentrations ................................................................................................................................... 78
3.6.3
idd2 and 35S::IDD2 plants do not show differences in post-floral transition leaf starch,
glucose and sucrose concentrations .................................................................................................. 80
3.7
Flowering Time .............................................................................................................. 83
3.7.1
idd2 mutants do not differ in long day flowering time ....................................................... 83
3.7.2
idd2 and 35S:IDD2 mutants do not differ in short day flowering time .............................. 83
Chapter 4:
Discussion ............................................................................................................... 84
vi
4.1
IDD2 is expressed at auxin maxima ............................................................................... 84
4.2
IDD2 expression patterns differ from previous reports .................................................. 86
4.3
Tissues with high IDD2 expression are not phenotypically different in idd2 loss-of-
function mutants ....................................................................................................................... 88
4.4
IDD2 and IDD1 show similar expression patterns ......................................................... 89
4.5
Comparisons to a recent IDD2 paper suggest inconsistencies ....................................... 91
4.6
IDD family members may function redundantly ............................................................ 92
4.7
Is IDD2 involved in auxin sensing or regulating seed oil hydrolysis? ........................... 94
4.8
Conclusions................................................................................................................... 103
4.9
Perspectives .................................................................................................................. 103
Appendix ..................................................................................................................................... 105
References .............................................................................................................................. 105
PCR Primers ........................................................................................................................... 112
qPCR Primers ......................................................................................................................... 113
Mutant Line Information ........................................................................................................ 113
vii
List of Tables
Table 2.1 Antibiotic selection criteria for constructs used. .......................................................... 29
Table 4.1: Summary of ID1 binding sites found in AUXIN RESPONSE FACTOR family genes
using Athamap (Steffens et al., 2005). .................................................................................. 95
Table 0.1: Names, sequences and annealing temperatures for primers used in polymerase chain
reactions (PCR). .................................................................................................................. 112
Table 0.2: Names, sequences, optimal dilutions and expected amplicon sizes for primers used in
quantitative real-time PCR. ................................................................................................. 113
Table 0.3: Gene number, names and insert information for T-DNA insertion mutants. ............ 113
viii
List of Figures
Figure 1.1: Oil body in an Arabidopsis seed................................................................................... 7
Figure 1.2 An overview of Arabidopsis post germinative seed oil hydrolysis. .............................. 8
Figure 1.3: Germination involves a) two phases of water uptake and b) radical emergence. ...... 10
Figure 1.4: Hormonal interactions in seed germination................................................................ 12
Figure 1.5: a) Zones of a developing Arabidopsis root and b) schematic diagram of interactions
between various proteins that control root hair development. .............................................. 14
Figure 1.6: Arabidopsis root cross section showing a) diarch arrangement of xylem and b)
emerging lateral root primordium. ........................................................................................ 16
Figure 2.1: Schematic diagram showing IDD2 gene structure and T-DNA insertions for idd2-1,
idd2-2 and idd2-3 lines. ........................................................................................................ 26
Figure 3.1: Schematic diagram showing IDD2 gene structure, T-DNA insertions for idd2-1,
idd2-2 and idd2-3 mutant lines and qPCR primer locations. ................................................ 43
Figure 3.2: IDD2 expression in idd2-1, idd2-2 and idd2-3 mutants relative to expression in Col0............................................................................................................................................. 43
Figure 3.3: IDD2 expression in idd2-1, idd2-2 and idd2-3 mutants relative to expression in Col0............................................................................................................................................. 44
Figure 3.4: IDD2 overexpression construct containing the IDD2 ORF constitutively driven by a
35S promoter. ........................................................................................................................ 45
Figure 3.5: IDD2 expression in 35S::IDD2 lines relative to expression in Col-0. ....................... 47
Figure 3.6: IDD2 reporter construct contains the IDD2 promoter up to 1.8 kb upstream of the
start codon driving expression of a GFP:GUS fusion reporter. ............................................ 48
ix
Figure 3.7: GUS staining of different tissues of IDD2∷GFP:GUS reporter plants at various
developmental time points. ................................................................................................... 51
Figure 3.8: GUS staining of IDD2∷GFP:GUS reporter seedlings early in development. ............ 52
Figure 3.9: GUS staining of IDD2∷GFP:GUS reporter seedlings grown on 1 μM IAA. ............ 53
Figure 3.10: IDD1 reporter construct contains the IDD1 promoter up to 2.5 kb upstream of the
start codon driving expression of a GFP:GUS fusion reporter. ............................................ 54
Figure 3.11: GUS staining of different tissues of IDD1∷GFP:GUS reporter plants at various
developmental time points. ................................................................................................... 56
Figure 3.12: Time to germination of Col-0, idd2-1, idd2-2 and idd2-3 seedlings. ....................... 57
Figure 3.13: Time to first root hair emergence of Col-0, idd2-1, idd2-2 and idd2-3 seedlings.... 58
Figure 3.14: Root growth of Col-0, idd2-1, idd2-2 and idd2-3 on 1/2 MS media made with 1%
agar. ....................................................................................................................................... 59
Figure 3.15: Root growth of Col-0, idd2-1, idd2-2 and idd2-3 on 1/2 MS media made with 2%
agar. ....................................................................................................................................... 60
Figure 3.16: Root growth of Col-0, idd2-1, idd2-2 and idd2-3 on 1/2 MS media made with 3%
agar. ....................................................................................................................................... 60
Figure 3.17: Root growth of Col-0, idd2-1, idd2-2 and idd2-3 on 1/2 MS media with 2% sucrose
added. .................................................................................................................................... 62
Figure 3.18: Root growth of Col-0, idd2-1, idd2-2 and idd2-3 on 1/2 MS media with 5% sucrose
added. .................................................................................................................................... 62
Figure 3.19: Root growth of Col-0, idd2-1, idd2-2 and idd2-3 on 1/2 MS media with 2% glucose
added. .................................................................................................................................... 63
x
Figure 3.20: Root growth of Col-0, idd2-1, and Col-0 x idd2-1 crosses on 1/2 MS media with 2%
sucrose added. ....................................................................................................................... 64
Figure 3.21: Root growth of Col-0, idd2-1, idd2-2 and idd2-1 x idd2-2 on 1/2 MS media with 2%
sucrose added. ....................................................................................................................... 66
Figure 3.22: Root growth of Col-0, idd2-1, idd2-3 and idd2-1 x idd2-3 on 1/2 MS media with 2%
sucrose added. ....................................................................................................................... 66
Figure 3.23: Root growth of Col-0, idd2-2, idd2-3 and idd2-2 x idd2-3 on 1/2 MS media with 2%
sucrose added. ....................................................................................................................... 67
Figure 3.24: Hypocotyl lengths at 3 days after germination of Col-0, idd2-2, idd2-3 and
35S::IDD2 seedlings grown on ½ MS media supplemented with 0, 1 or 10 µM gibberellic
acid. ....................................................................................................................................... 69
Figure 3.25: Hypocotyl lengths of Col-0, idd2-2, idd2-3 and 35S:IDD2 seedlings grown on 1/2
MS media 0, 1 or 10 µM gibberellic acid (GA) in the dark for 6 days after germination. ... 69
Figure 3.26: Col-0, idd2-2, idd2-3 and 35S::IDD2 15-1 seedlings grown on seedlings grown on
½ MS media supplemented with 0, 1 or 10 µM gibberellic acid for 6 days after germination.
............................................................................................................................................... 70
Figure 3.27: Proportion of Col-0, idd2-3, 35S::IDD2 5-4, 15-1, 19-1 and 21-4 experiencing
normal or delayed growth on ½ MS media for 6 DAG. ....................................................... 71
Figure 3.28: Root growth of Col-0, idd2-1, idd2-2, idd2-3 and 35S::IDD2 seedlings on 1/2 MS
media with 2% sucrose added. .............................................................................................. 72
Figure 3.29: Col-0, 35S::IDD2 5-4 and 35S::IDD2 19-1 seedlings grown on 0 and 10 μM IAA
for 8 DAG. ............................................................................................................................ 74
xi
Figure 3.30: Col-0, idd2-3, 35S::IDD1, 35S::IDD2 5-4, 15-1 and 19-1 seeds viewed with
scanning election microscope. .............................................................................................. 75
Figure 3.31: Starch concentration in Col-0 and idd2 Arabidopsis leaves harvested prior to the
floral transition at dawn (ZT0) and nightfall (ZT16). ........................................................... 77
Figure 3.32: Glucose concentration in Col-0 and idd2 Arabidopsis leaves harvested prior to the
floral transition at dawn (ZT0) and nightfall (ZT16). ........................................................... 77
Figure 3.33: Sucrose concentration in Col-0 and idd2 Arabidopsis leaves harvested prior to the
floral transition at dawn (ZT0) and nightfall (ZT16). ........................................................... 78
Figure 3.34: Starch concentrations in Col-0 and idd2 Arabidopsis leaves harvested after the floral
transition at ZT0, ZT8 and ZT16. ......................................................................................... 79
Figure 3.35: Glucose concentrations in Col-0 and idd2 Arabidopsis leaves harvested after the
floral transition at ZT0, ZT8 and ZT16. ............................................................................... 79
Figure 3.36: Sucrose concentrations in Col-0 and idd2 Arabidopsis leaves harvested after the
floral transition at ZT0, ZT8 and ZT16. ............................................................................... 80
Figure 3.37: Starch concentrations in Col-0, idd2-3, 35S∷IDD2 5-4, 35S∷IDD2 21-4 and
35S∷IDD2 x idd2-3 leaves harvested after the floral transition at ZT0, ZT8 and ZT16. ..... 81
Figure 3.38: Glucose concentrations in Col-0, idd2-3, 35S∷IDD2 5-4, 35S∷IDD2 21-4 and
35S∷IDD2 x idd2-3 leaves harvested after the floral transition at ZT0, ZT8 and ZT16. ..... 82
Figure 3.39: Sucrose concentrations in Col-0, idd2-3, 35S∷IDD2 5-4, 35S∷IDD2 21-4 and
35S∷IDD2 x idd2-3 leaves harvested after the floral transition at ZT0, ZT8 and ZT16. ..... 82
Figure 4.1: Immature and mature siliques showing various tissues. ............................................ 85
Figure 4.2: Developmental expression heat map for IDD2 from BioAnalytical Resource (Winter
et al., 2007). .......................................................................................................................... 87
xii
Figure 4.3: Developmental expression heat map for IDD2 created from examining
IDD2::GFP:GUS reporter plants........................................................................................... 88
Figure 4.4: Developmental expression heat map for IDD1 created from examining
IDD1::GFP:GUS reporter plants........................................................................................... 91
Figure 4.5: Proposed model for the role of IDD2 in auxin sensing and regulating auxin
responses. .............................................................................................................................. 98
Figure 4.6: a) Col-0 and sdp1 loss-of-function mutant seedlings at 5 DAG and b) Col-0 and
35S::IDD2 seedlings at 6 DAG grown on media with and without sucrose. ..................... 100
Figure 4.7: Proposed model for IDD2 in regulating the expression of seed oil lipase genes. .... 102
xiii
List of Abbreviations and Acronyms
35S
constitutive cauliflower mosaic virus promoter
3-PGA
3-phosphoglycerate
6-BAP
6-benzylaminopurine
A. thaliana
Arabdopsis thaliana
ABI4
ABSCISIC ACID INSENSITIVE4
ABA
abscisic acid
ACC
1-aminocyclopropane-1-carboxylic acid
ACCase
acetyl-CoA carboxylase
ADP-glucose
adenosine diphosphoglucose
AGPase
ADP-glucose pyrophosphate
ANOVA
analysis of variance
ARF
AUXIN RESPONSE FACTOR
BAC
bacterial artificial chromosome
BASTA
glufosinate ammonium
bp
base pairs
CDF
CYCLIN DOF FACTOR
cDNA
complimentary DNA
CEI
cortex epidermal initial
CMT
COMATOSE
CO
CONSTANS
CO2
carbon dioxide
CoA
Coenzyme A
Col-0
Arabidopsis thaliana Columbia-0 ecotype
CPC
CAPRICE
xiv
CTR1
CONSTITUTIVE TRIPLE RESPONSE1
DAG
days after germination
DGAT1
DIACYLGLYCEROL ACYLTRANSFERASE1
DNA
deoxyribonucleic acid
DNase
deoxyribonuclease
EDTA
Ethylenediaminetetraacetic acid
ER
endoplasmic reticulum
EtOH
ethanol
ETR
ETHYLENE RESISTANT1
FD
FLOWERING LOCUS D
FKF1
FLAVIN-BINDING, KELCH REPEAT, F-BOX1
Fru6P
fructose-6-phosphate
FT
FLOWERING LOCUS T
G3P
glyceraldehyde-3-phosphate
GA
gibberellic acid
GFP
Green Fluorescent Protein
GI
GIGANTEA
Glc1P
glucose-1-phosphate
GL2
GLABRA2
GOPOD
Glucose Determination Reagent
GUS
β-glucuronidase
GWD1
α-glucan water, dikinase
HXK
hexokinase
IAA
indole-3-acetic acid
ID1
INDETERMINATE1
xv
IDD
INDETERMINATE DOMAIN
INV
invertase
kb
kilo base pairs
LB
Luria broth
MS
Murashige and Skoog
NLS
nuclear localization signal
NPA
N-1-napthylphthalemic acid
PCR
polymerase chain reaction
PIN
PIN-FORMED
PLT
PLETHORA
QC
quiescent centre
qPCR
quantitative polymerase chain reaction
RAM
root apical meristem
RNA
ribonucleic acid
RQ
relative quantity
SAIL
Syngenta Arabidopsis Insertion Library
SALK
Salk Institute Genomic Analysis Laboratory
SAM
shoot apical meristem
SCM
SCRAMBLED
SCR
SCARECROW
SDP1
SUGAR DEPENDENT1
SDP1L
SUGAR DEPENDENT1 LIKE
SHR
SHORTROOT
STM1
SHOOT MERISTEMLESS1
SUS
sucrose synthase
xvi
TAG
triacylglycerol
T-DNA
transfer DNA
WER
WEREWOLF
WOX
WUSCHEL-related homeobox
WRI1
WRINKLED1
X-GlcA
5-bromo-4-chloro-3-indolyl-ß-D-glucuronic acid
Zm
Zea mays
ZT
Zeitgeber Time
xvii
Chapter 1:
Literature Review and Background
1.1 Transition to flowering in Arabidopsis
The floral transition in higher plants is an important step in the plant lifecycle (Bernier et
al., 1993). During this transition, the shoot apical meristem (SAM) changes from a vegetative
meristem, which produces leaves, into a reproductive meristem, which produces inflorescences.
After the transition, most of the energy produced by the plant is devoted to reproductive tissues
and the timing of this transition is crucial, as it can affect agronomically important traits such as
seed yield and biomass accumulation. Consequently, understanding the mechanisms that control
this transition is an important area of plant research. We know that most plants use a combination
of endogenous and exogenous signals to flower under optimal conditions (Bernier et al., 1993;
Mouradov et al., 2002; Srikanth and Schmid, 2011). Plants use internal factors such as plant size,
nutrient availability and plant age as indicators of overall plant health, while day length and air
temperature are environmental factors that contribute to the timing of the floral transition.
Different species require different environmental conditions to flower and conditions that may
induce flowering in one species, such as long day lengths, may repress flowering in another species
(Bernier, 1988; Srikanth and Schmid, 2011). For example, the model plant Arabidopsis thaliana
(Arabidopsis) is a facultative long day plant, meaning that flowering is greatly accelerated under
long day conditions (Koornneef et al., 1998), whereas Oryza sativa (rice) flowers under short day
conditions (Yano et al., 2001).
While finding conditions that are favorable to flowering in various species was relatively
simple, uncovering the mechanisms that control the floral transition posed a greater challenge.
-1-
Pioneering this effort in 1936, Mikhail Chailakhyan grafted leaves of a flowering tobacco plant
onto a tobacco plant grown in a non-inductive photoperiod, which resulted in the second plant
flowering (Chailakhyan, 1936). These grafting experiments showed that the signal to induce
flowering actually originates in mature leaves and is transmitted to the SAM. This mobile
inductive signal was named ‘florigen’ (Chailakhyan, 1936) and its identity remained a mystery for
many decades. Finally, in 2007, the FLOWERING LOCUS T (FT) protein was identified as
florigen in Arabidopsis (Corbesier et al., 2007; Mathieu et al., 2007; Jaeger and Wigge, 2007). FT
travels from mature leaves through the phloem to the SAM, where it interacts with the
FLOWERING LOCUS D (FD) to activate expression of genes that cause the SAM to transition to
a reproductive meristem (Abe et al., 2005; Imaizumi and Kay, 2006). FT expression is controlled
via a pathway that combines photoperiod information and circadian clock rhythm called the
external coincidence model (Suárez-López et al., 2001).
In the external coincidence model, the circadian rhythm-regulated GIGANTEA (GI) and
FLAVIN-BINDING, KELCH REPEAT, F-BOX1 (FKF1) proteins regulate expression of the
CONSTANS (CO) gene through interactions with CYCLIN DOF FACTOR (CDF) family proteins
(Fornara et al., 2009; Imaizumi et al., 2005; Sawa et al., 2007). CO expression levels oscillate
throughout the day with peak expression levels occurring in late afternoon. The stability of the
CO protein depends on the amount of light the plant receives; a longer day length leads to a more
stable protein (Valverde et al., 2004). Under long day conditions, the CO expression peak and the
peak in CO protein stability coincide, allowing CO to activate expression of FLOWERING LOCUS
T (FT) in mature leaves (Valverde et al., 2004) so that the FT protein can travel to the SAM to
induce flowering. Whereas numerous genes involved in controlling the floral transition have been
characterized in Arabidopsis, very few are identified in Zea mays (maize). The first floral regulator
-2-
gene identified in maize was INDETERMINATE1 (Colasanti et al., 1998) (hereafter referred to as
ZmID1).
The ZmID1 protein contains an N-terminal putative nuclear localization signal (NLS) and
four zinc finger domains, which make up the INDETERMINATE DOMAIN (IDD) (Colasanti et
al., 1998). Interestingly, it was discovered through site-directed mutagenesis that the two outer
zinc fingers are not involved in binding the consensus sequence, despite the finding that one of
them shows typical DNA-binding characteristics. Instead, the inner zinc fingers are responsible
for binding the target sequence (Kozaki et al., 2004). Zmid1 loss-of-function mutants do not
undergo the transition to flowering and continue to produce leaves long after their wild-type
siblings have flowered and senesced (Colasanti et al., 1998). Recently, it was shown that Zmid1
mutants have similar photosynthetic abilities to wild type plants but have higher levels of sucrose
and other soluble sugars and lower levels of tricarboxylic acid cycle organic acids (Coneva et al.,
2012). These differences in carbohydrate profile suggest that ZmID1 is involved in controlling
carbon allocation in mature leaves in addition to its function as a floral regulator (Coneva et al.,
2012).
Phylogenetic analysis comparing ZmID1 to genes from maize, rice and Arabidopsis
identified numerous genes showing the characteristic zinc finger pattern and putative NLS that
make up the INDETERMINATE DOMAIN (Colasanti et al., 2006). These genes make up the IDD
gene family, which is conserved among all higher plants (Colasanti et al., 2006). Many IDD genes
are currently uncharacterized, however, several seem to be involved in regulating carbon flow and
assimilation (Coneva et al., 2007, 2012).
-3-
1.2 Arabidopsis INDETERMINATE DOMAIN family genes are largely
uncharacterized
The Arabidopsis IDD gene family contains 16 genes named IDD1 to IDD16 (Colasanti et
al., 2006). Several members have been characterized using loss-of-function and constitutive
overexpression transgenic plants and have functions related to diverse stages of development. For
example, 35S::IDD1 overexpression transgenic plants show an array of phenotypes involving the
seed. 35S::IDD1 mutants have altered seed coat morphology, altered mucilage deployment and
delayed endosperm degradation (Feurtado et al., 2011; LeBlanc, 2012). Seeds are also able to
germinate successfully on media containing the phytohormone abscisic acid (ABA), which
represses germination in wild type seeds (Feurtado et al., 2011). These findings suggest that IDD1
is involved in seed dormancy and germination and controlling carbon allocation in seeds (Feurtado
et al., 2011; LeBlanc, 2012). The idd8 loss-of-function mutant also shows a difference in carbon
assimilates, measured in whole seedlings rather than in the seed (Seo et al., 2011). The idd8 mutant
has higher endogenous sucrose, glucose and starch levels and shows late flowering in inductive
long day conditions compared to wild type seedlings, suggesting that IDD8 is involved in
controlling sugar transport and metabolism and regulating flowering (Seo et al., 2011).
Interestingly, IDD8 is the only IDD gene characterized to date that has a function related to
flowering time. The idd15 mutant exhibits a completely different set of phenotypes, including
reduced gravitropic responses in the inflorescence stems, reduced circumnutation and lateral
branches that emerge at an increased angle relative to the primary inflorescence compared to wild
type plants (Morita et al., 2006; Tanimoto et al., 2008). Gravity sensing amyloplasts in idd15
endodermis cells sediment more slowly and iodine/potassium iodide staining suggests that idd15
amyloplasts contain less starch than those in wild type plants. These phenotypes suggest that
IDD15 is involved in promoting starch accumulation in amyloplasts used to sense gravity
-4-
(Tanimoto et al., 2008). IDD15 is closely related to IDD14 and IDD16, as they clade together in
phylogenetic reconstructions of the IDD family (Colasanti et al., 2006). Triple loss-of function
idd14 idd15 IDD16i transgenic plants were made and had enlarged, infertile flowers, increased
angles between primary and secondary inflorescences and accumulated less auxin in leaves and
inflorescences (Cui et al., 2013). Therefore, these results suggest that IDD14, IDD15 and IDD16
work together to regulate auxin biosynthesis and control organ development in aboveground
tissues (Cui et al., 2013). As well as acting in aboveground tissues, IDD family genes also play a
role in root development. IDD10 controls patterning in root epidermal cells through interactions
with the root cell division regulators, SHORTROOT (SHR) and SCARECROW (SCR) (Welch et
al., 2007) and IDD10 is implicated specifically in determining hair cell fate (Hassan et al., 2010).
An emerging understanding of the IDD family suggests that many members are involved
in linking carbon assimilation with growth and development (Coneva et al., 2012). Carbon flow
and the way carbon is partitioned in plants are important processes to understand, since they affect
how energy is stored in different parts of the plant, which is important for agronomical traits such
as yield. Overall, a better understanding of the IDD family could help to enhance our knowledge
of carbon partitioning.
1.3 Oil production and hydrolysis in Arabidopsis seeds
Energy in Arabidopsis seeds is stored mainly as triacylglycerol (TAG) (Hsieh and Huang,
2004). While the seed is maturing, many genes are involved in TAG synthesis in the endoplasmic
reticulum (ER) (Graham, 2008). Seeds of the wrinkled1 (wri1) loss-of-function mutant have
reduced oil compared to wild type seeds (Focks and Benning, 1998). WRI1 is the major regulator
of oil production in seeds and is only expressed in developing seeds (Fukuda et al., 2013). WRI1
transcriptionally regulates the expression of downstream genes encoding enzymes such as acetyl-5-
CoA carboxylase (ACCase), pyruvate dehydrogenase and other fatty acid synthesis genes.
ACCases catalyze the first committed step of fatty acid synthesis and directly affect the amount of
oil produced in the seed (Fukuda et al., 2013). Seeds with a mutation in the TAG1 locus, which
codes for the DIACYLGLYCEROL ACYLTRANSFERASE1 (DGAT1) enzyme, have only 5575% of the oil that wild type seeds accumulate and contain more sucrose than wild type seeds
(Katavic et al., 1995), showing that DGAT1 is an important enzyme in oil synthesis.
TAG is stored as oil bodies surrounded by a layer of phospholipids and oleosins (Figure
1.1). Oil bodies are spherical and have a diameter of approximately 0.5 µm in Arabidopsis, which
is smaller than the diameter of 1 µm found in most plants (Hsieh and Huang, 2004).
Oleosins
are structural proteins that are important for preventing oil bodies from aggregating in the seed.
The oil to oleosin ratio helps determine the size and shape of the oil bodies in a seed. The small
size of Arabidopsis seed oil bodies relative to other species is due to a low oil to oleosin ratio; the
increased amount of oleosin means that more surface area can be covered, thus, oil bodies are
made smaller. Oil bodies are synthesized in the ER and oleosin is targeted to the ER shortly after
translation. During germination, lipases can easily bind to the oil bodies because of their large
surface area to volume ratio (Hsieh and Huang, 2004). At this time, the energy stored in the seed
needs to be quickly converted into metabolites and transported throughout the developing seedling,
as energy demands are high. It is imperative that this is done in a timely manner to ensure that the
first true leaves are deployed and photosynthesis begins before energy reserves are completely
depleted (Graham, 2008).
-6-
Figure 1.1: Oil body in an Arabidopsis seed. Triacylglycerol is surrounded by a single layer of
phospholipids and structural proteins called oleosins. Created based on Hsieh and Huang, 2004.
Seed oil mobilization begins with the breakdown of stored oil (Figure 1.2). Lipases, such
as SUGAR DEPENDENT1 (SDP1) catalyze the first step in breaking down TAG for energy.
The SDP1 protein binds oleosins and hydrolyzes TAGs into fatty acids and glycerol. The sdp1
loss-of-function mutants have reduced TAG hydrolysis, however, the process is not completely
eliminated (Eastmond, 2006). Interestingly, once plants have reached maturity, sdp1 mutants
have higher TAG concentrations in stems and roots and lower TAG concentrations in leaves
compared to wild type plants, suggesting opposing roles in these tissues (Kelly et al., 2013). The
sdp1 mutants were crossed with loss-of-function mutants for the SUGAR DEPENDENT1 LIKE
(SDP1L) gene and sdp1 sdp1L double mutants were viable but severely retarded in growth after
germination (Kelly et al., 2011). The viability of sdp1 sdp1L double mutants demonstrates that
while TAG hydrolysis is a major part of germination and seedling growth, it is not essential.
Together, SDP1 and SDP1L are responsible for more than 90% of the TAG hydrolysis that
occurs in germinating seeds (Kelly et al., 2011).
After TAG hydrolysis, fatty acids are transported into the peroxisome by the COMATOSE
(CMT) protein and undergo the β-oxidation cycle, followed by the glyoxylate cycle to produce
-7-
oxaloacetate (Graham, 2008).
Oxaloacetate along with glycerol from the cytoplasm are
transported to the mitochondria, where gluconeogenesis occurs and sucrose is produced. Sucrose
can then be transported throughout the seedling via the phloem to provide energy until the plant
begins to photosynthesize (Graham, 2008). During early seedling growth, exogenous sugars and
ABA inhibit storage oil mobilization. Exogenous sugars alter the carbon to nitrogen ratio in the
developing seedling and ABA exposure causes a transcription factor called ABSCISIC ACID
INSENSITIVE4 (ABI4) to be expressed. The ABI4 protein is involved in regulating the ABA
response and has downstream targets important in storage oil processing (Graham, 2008).
SDP1
β
Figure 1.2 An overview of Arabidopsis post germinative seed oil hydrolysis. Triacylglycerol in
oil bodies is broken down into fatty acids and glycerol by enzymes such as SUGAR
DEPENDENT1. Glycerol is exported to the cytoplasm and then into the mitochondria, where it
is processed into sucrose. In peroxisomes, fatty acids are processed into oxaloacetate, which
undergoes gluconeogenesis in the mitochondria to produce sucrose. Adapted from Quettier and
Eastmond, 2009 and Graham, 2008.
-8-
1.4 Seed dormancy and germination are controlled by antagonistic
hormones
Seed germination refers to the process in which a dry seed takes up water, in a mechanism
called imbibition, and the embryonic axis elongates (Bewley, 1997). The point at which the radicle
emerges from the seed is typically used as a marker for the completion of germination since it is
the first visible sign. By contrast, seed dormancy is the opposing state in which a seed is
temporarily prevented from germinating even though environmental conditions are optimal. A
dormant seed can undergo all of the metabolic processes that an imbibing seed goes through except
that the radicle does not elongate and push through the testa. Little is known about how the
embryonic axis is prevented from elongating in dormant seeds (Bewley, 1997). When a seed is
imbibed, two phases of water uptake occur (see Figure 1.3). The first phase is characterized by
rapid uptake of water followed by a plateau in water uptake in the second phase. During the first
phase, cell membranes become leaky due to the rapid flow of water into the seed and solutes are
released into the surrounding area. The cell membranes quickly regain their structural integrity,
while damaged organelles and DNA are repaired in ways that are currently unknown. Respiration
and other metabolic activities resume to allow the radicle to elongate and rupture the seed coat.
There are three possible causes for the commencement of radicle elongation. The first is that the
osmotic potential of the radicle drops and causes it to take up more water and push through the
seed coat. The second is that the walls of radicle cells become looser to allow the radicle to stretch
and emerge through the surrounding tissues and the third is that the seed coat around the root tip
weakens and allows the radicle to push through. Evidence exists for each of these possible
explanations and it is likely that a combination of the phenomena is occurring to promote radicle
elongation. For the radicle to push past the endosperm and seed coat, existing radicle cells inside
the seed only need to elongate. No cell division is required until the radicle is outside the seed
-9-
coat. After radicle emergence, stored energy in the form of seed oil is mobilized (Bewley, 1997)
as described in Section 1.3.
Figure 1.3: Germination involves a) two phases of water uptake and b) radical emergence. There
are three hypotheses for how radicle emergence occurs: the water potential of the radicle lowers
and the radicle absorbs water, or the cells of the radicle become ready for elongation, or the cells
of the seed coat become weak and break apart. Adapted from Kucera et al., 2005.
Plant hormones play a key role in the balance between dormancy and germination and have
a profound effect on plants even at low concentrations (see Figure 1.4). ABA accumulates in seeds
as they mature and desiccate, where it keeps the seed dormant and improves the desiccation
tolerance of the seed (Kucera et al., 2005). ABA synthesis is associated with the carotenoid
synthesis pathway and higher levels of carotenoids correspond with higher levels of ABA. When
a carotenoid synthesis gene, called phytoenesynthase, was cloned into a vector driven by a seedspecific promoter and transformed into Arabidopsis, transformed plants had higher levels of
carotenoids and ABA and severe delays in germination compared to control plants. This showed
that dormancy was favoured by the increased ABA levels (Lindgren et al., 2003). ABA can be
produced from maternal or embryonic tissues, however only embryo-derived ABA is necessary
for inducing and maintaining dormancy. Maternally-derived ABA is important for other aspects
of seed development (Kucera et al., 2005). Plants that are deficient in ABA synthesis genes exhibit
- 10 -
a phenotype called vivipary, in which non-dormant seeds germinate while still on the mother plant,
lending further evidence to the role ABA plays in promoting seed dormancy (Karssen et al., 1983).
ABA also inhibits endosperm rupture, water uptake after germination and seedling growth perhaps
by regulating aquaporin abundance (Kucera et al., 2005).
Gibberellin (GA) has opposing functions to ABA as GA promotes dormancy release,
germination and embryo growth. Active forms of GA accumulate in provascular tissues and in
the cortex and endodermis of the root just before radicle emergence (Kucera et al., 2005). Since
GA is synthesized in the radicle (Yamaguchi et al., 2001) and GA-responsive genes are expressed
in tissues that do not synthesize GA (Ogawa et al., 2003), it is hypothesized that GA is transported
from where it is originally synthesized. It is likely that GA is transported into the seed coat tissues
surrounding the root tips and helps to weaken them to allow the radicle to emerge. Mutants
deficient in GA biosynthesis genes require exogenous GA application during imbibition in order
to germinate, indicating that GA is essential for breaking dormancy in wild type plants. In plants
that do not produce ABA or have had their seed coat and endosperm removed, GA is not necessary
for radicle emergence. This provides evidence that GA has a key role in softening the seed coat
to allow the radicle to penetrate and that the ABA:GA ratio is probably more important for
controlling germination than the actual concentrations of each of these hormones (Kucera et al.,
2005).
Ethylene also acts in opposition to ABA and both ethylene synthesis and signaling are
important for promoting seed germination. Treating dormant seeds with an ethylene precursor
called 1-aminocyclopropane-1-carboxylic acid (ACC) can work as an antagonist to ABA and
cause germination to occur earlier than normally expected. In Arabidopsis, ethylene receptors
belong to the ETHYLENE RESISTANT1 (ETR1) family. The etr1 mutant is insensitive to ethylene
- 11 -
and hyper-sensitive to ABA compared to wild type plants because ethylene is not able to counteract
the effects of ABA. The etr1 mutant seeds also have poor germination rates. The ETR1 protein
activates CONSTITUTIVE TRIPLE RESPONSE1 (CTR1) when ethylene is not present, which
begins a MAPK signaling pathway, that helps link hormonal signals and environmental conditions,
such as light and osmolarity, with the appropriate plant growth response (Kucera et al., 2005).
Figure 1.4: Hormonal interactions in seed germination. ABA promotes dormancy and inhibits
germination. GA and ethylene act antagonistically to ABA and promote germination. Adapted
from Kucera et al., 2005.
1.5 Root development and growth are complex processes
Early in the development of an embryo, the founder cell for root tissue, the hypophysis,
divides to produce a cell that will give rise to the quiescent centre (QC) and a cell that will become
the columella (Petricka et al., 2012).
Transcription factors encoded by WUSCHEL-related
homeobox (WOX) genes are expressed at different times and locations throughout embryogenesis
and help to control the initial patterning of the root. The root apical meristem (RAM) is a collection
of stem cells that is developed during embryogenesis and contains the QC and the stem cells
surrounding the QC.
The PLETHORA (PLT) and SHR/SCR pathways are responsible for
controlling development of the QC. The PLT proteins induce elevated rates of cell division in the
stem cells of the RAM, while SHR activates SCR expression in the QC, which is essential for
maintaining QC identity. The QC releases a factor that causes the stem cells surrounding it to
remain undifferentiated. Researchers suspect that this factor could be WOX5 or a downstream
- 12 -
target since mutants in which WOX5 expression is limited to the QC have a smaller stem cell niche
(Petricka et al., 2012). The IDD10, or JACKDAW, gene is also important for RAM patterning,
since it regulates SCR expression (Welch et al., 2007).
The developing root can be divided into three zones: the meristematic zone, the elongation
zone and the differentiation zone (see Figure 1.5a). The meristematic zone, located at the tip of
the root, is where division and differentiation occur. Cells lengthen in the elongation zone located
above the meristematic zone. The differentiation zone is the rest of the root, where different types
of tissues form. Root hairs only form in the differentiation zone. Each epidermal cell can become
a hair cell or a non-hair cell depending on the position of the adjacent cortical cells. An epidermal
cell that is in contact with only one cortex cell not develop a root hair, while an epidermal cell that
touches two cortex cells develops a root hair (see Figure 1.5b). In non-hair cells, two genes called
GLABRA2 (GL2) and CAPRICE (CPC) are activated by a protein complex. The GL2 protein is
necessary for non-hair cell fate. The CPC protein is transported to neighboring epidermal cells,
where it replaces a member of the protein complex called WEREWOLF (WER) to prevent GL2
from being expressed, which leads to hair formation. SCRAMBLED (SCM), a receptor-like
kinase, aids in this pathway by repressing WER expression in hair cells (Petricka et al., 2012). It
is suspected that there is a mobile signal produced in cortical cells that may be a downstream target
of IDD10, since IDD10 is expressed in cortical cells (see Figure 1.5b) (Hassan et al., 2010). If an
epidermal cell is adjacent to two cortical cells, it may be exposed to more signal and become a hair
cell (Petricka et al., 2012).
- 13 -
a)
b)
Figure 1.5: a) Zones of a developing Arabidopsis root and b) schematic diagram of interactions
between various proteins that control root hair development. Adapted from Hassan et al., 2010
(b) and Petricka et al., 2012 (a and b).
Root growth is largely controlled by two opposing hormones: auxin and cytokinin. Auxin
promotes cell division while cytokinin promotes cell differentiation (Petricka et al., 2012). Auxin
can act as a stimulator of root initiation or an inhibitor of root elongation, depending on its
concentration. PIN-FORMED (PIN) transporters create an auxin gradient with an auxin maximum
at the root stem cell niche (Petricka et al., 2012). Along the gradient, auxin maintains stem cells
and controls cell division, elongation and differentiation based on its concentration (Petricka et al.,
2012). Conversely, cytokinin controls root meristem size by inhibiting cell division and promotes
differentiation in the transition zone between the meristematic and elongation zones (Petricka et
al., 2012). Gibberellic acid mediates the auxin-cytokinin antagonism by interacting with both
hormones and promotes division in the meristematic zone upstream of auxin and represses the root
growth inhibition activity of cytokinin (Petricka et al., 2012). Another class of phytohormones,
brassinosteroids, affect differentiation and organization of the stem cell niche by regulating the
- 14 -
expression of SCR and WOX5, while ABA and ethylene regulate division in the quiescent centre
of the root (Petricka et al., 2012). The interactions between brassinosteroids, ABA and ethylene
are not well understood and further research needs to be done in this area.
Lateral roots are important for expanding the underground reach of the plant and securing
it in an upright position in the soil. Lateral root initiation begins with a periclinal division in the
pericycle adjacent to the two xylem poles (xylem are arranged in a diarch pattern, as discussed in
Section 1.6) (Casimiro et al., 2001). Auxin is very important in this division. Auxin is transported
basipetally from the growing root tip towards the shoot apex in order to promote lateral root
primordia initiation and the first periclinal division (Casimiro et al., 2001). The daughter cells
divide transversely and periclinally, eventually leading to the protrusion of the lateral root through
the surface of the main root (see Figure 1.6). Treating seedlings with N-1-naphthylphthalamic
acid (NPA), a polar auxin transport inhibitor, inhibits even the first pericycle division when applied
at 10 μM, demonstrating how important auxin is for initiating lateral root development (Casimiro
et al., 2001). While basipetal auxin transport is necessary for lateral root initiation, acropetal (shoot
apex to root tip) auxin transport may only be required for proper lateral root development after
initiation. shoot meristemless1 (stm1) mutants lack the ability to produce leaf primordia, which
are the primary source of shoot-derived auxin, yet these mutants are still able to produce lateral
roots. However, when the length and length pattern of their lateral roots are compared to that of
wild type seedlings, mutants show shorter lateral roots that lack the usual pattern of longest towards
the shoot and shortest towards the root tip. These results suggest a role for shoot-derived auxin
in helping lateral roots develop properly (Casimiro et al., 2001). Overall, root development is a
complicated process that requires the cooperation of many genes and the influence of several key
hormones.
- 15 -
Figure 1.6: Arabidopsis root cross section showing a) diarch arrangement of xylem and b)
emerging lateral root primordium. Primordium originates in the pericycle at one of the xylem
poles. Created based on Casimiro et al., 2001 and Petricka et al., 2012
1.6 Vasculature formation in roots, hypocotyl and leaves follows specific
patterns
Vasculature tissue consists of the xylem and phloem, which are responsible for transporting
water and minerals, and sugars, respectively. The vasculature of the hypocotyl is arranged with
the xylem forming a line between two poles (called a diarch pattern) and the phloem placed on
either side of the line at the opposite poles (Turner and Sieburth, 2003). Vasculature is surrounded
by endodermis, cortex and epidermis layers. Hypocotyl vasculature is formed from pre-existing
procambium cells whose differentiation is pausing during embryogenesis. This pause occurs by
an unknown mechanism but is believed to be related to the seed maturation process (Turner and
Sieburth, 2003).
Vasculature in roots also follows a diarch pattern and arises from the root apical meristem,
where procambium cells are formed via asymmetric divisions (Turner and Sieburth, 2003). As the
root grows, vasculature extends and eventually secondary growth occurs to add girth to the root.
A vascular cambium forms between the primary xylem and phloem and lays down secondary
- 16 -
xylem towards the centre of the root and secondary phloem towards the exterior (Turner and
Sieburth, 2003).
In the rosette and inflorescence, vasculature is arranged in 5 to 8 veins around a central
pith, with phloem towards the outside and xylem towards the inside (Turner and Sieburth, 2003).
This vein arrangement is advantageous for connecting vasculature between shoots and lateral
tissues, such as leaves and flowers. Each ring of vasculature and associated cells is surrounded by
a starch sheath that is similar to the endodermis in the root and hypocotyl. The starch sheath
divides to form the interfascicular region, which produces secondary phloem and lignified cells
for structural support, while the vascular cambium produces secondary xylem and secondary
phloem (Turner and Sieburth, 2003).
Arabidopsis leaves show a reticulate or netted vein pattern, with xylem on the adaxial side
and phloem on the abaxial side (Turner and Sieburth, 2003). A primary vein runs down the middle
of the leaf. Secondary veins branch off the primary vein and form loops by connecting with other
secondary veins.
Tertiary and quaternary veins branch from secondary and tertiary veins,
respectively, and act to maximize the reach of the vascular system. Vein formation and patterning
is believed to be influenced by auxin transport, as evidenced by examining vein patterns in auxin
transport mutants and plants grown in the presence of auxin transport inhibitors (Turner and
Sieburth, 2003). Experiments that quantify auxin suggest that areas with high levels of auxin
correspond with future veins (Avsian-Kretchmer et al., 2002). There are several theories to explain
how auxin maxima form in leaves. The up-the-gradient theory suggests that cells sense the auxin
concentration of nearby cells and pump auxin towards the cells with the highest auxin
concentrations, creating local maxima (Vernoux et al., 2010). Conversely, the canalization theory
states that by being exposed to auxin, some cells develop an increased ability to transport auxin,
- 17 -
which leads to auxin drainage from the surrounding cells and a vein forms at the auxin maximum.
Some aspects of leaf vasculature development are not explained by the canalization theory, such
as the way in which minor veins form, since they are connections between major veins and do not
have polarity (Turner and Sieburth, 2003). Further research is needed in this area to prove or
disprove these theories.
1.7 Leaf development is a multi-stage process
Leaves synthesize sugars from light energy to fuel all of the energy needs of the plant and,
as such, leaf development is one of the most important developmental processes.
Leaf
development proceeds through three stages; primordium initiation, abaxial/adaxial identity
determination and further growth from a marginal meristem (Tsukaya, 2002). Leaf primordia arise
from the shoot apical meristem (SAM) via local auxin maxima in a spiral phyllotaxy. Rapid cell
division and elongation in the leaf primordia enlarge the leaf bulge and abaxial/adaxial identity is
established. The first step in defining abaxial/adaxial identity is carried out by an unknown signal
believed to originate in the SAM. There is evidence to suggest that a number of genes expressed
preferentially in the future adaxial, middle and abaxial regions control the identity of these areas,
however, this theory has not been proven yet. After abaxial/adaxial identity is established, cells
in the basal portion of the primordia become long and parallel to eventually form the petiole, while
cells in the apical portion remain small and less organized to eventually form the leaf blade. The
junction between these tissues becomes the marginal meristem, which provides new cells for
further development of the leaf blade and petiole (Tsukaya, 2002). Vascular development in leaves
is discussed in the Vasculature section.
- 18 -
1.8 Starch metabolism is a highly regulated process
Starch constitutes about 50% of our daily caloric intake. Thus, it is incredibly important
to understand starch metabolism and the mechanisms that control it. Plants accumulate transitory
starch during the day, in order to degrade it during the subsequent night so that they can continue
to grow during darkness (Streb and Zeeman, 2012).
Starch accumulation must be tightly
controlled to produce sufficient starch to last through the upcoming night, so rates of starch
synthesis and degradation are altered in response to day and night length (Streb and Zeeman,
2012). Arabidopsis produces ellipsoid-shaped starch granules, which are 1-2 µm in diameter and
are made up of the glucose polymers amylopectin and amylose. Both amylopectin and amylose
have α-1,4-glucosidic bonds between glucosyl units, which form linear chains. At branch points,
α-1,6-glucosidic bonds connect linear chains to form complex branched structures. Amylopectin
has a highly branched structure and makes up most of the mass of a starch granule, while amylose
has a more linear structure and accounts for less of the mass (Streb and Zeeman, 2012).
During the day, starch is produced largely in the spongy and palisade mesophyll cells of
the leaf, but is made in lower quantities in the endodermis layer of the shoot and in columella cells
of the root. Transitory starch plays an essential role in allowing plants to continue their growth
during the night (Streb and Zeeman, 2012). Mutants deficient in starch synthesis or degradation
display an extremely slow growth pattern when grown on a diurnal cycle but this phenotype is
mostly rescued when plants are grown in constant light (Caspar et al., 1985). In general, there is
a trade-off between plant growth rate and starch accumulation; mutants or accessions that grow
faster have less starch, while those that grow slower contain more (Sulpice et al., 2009). Reduced
starch mutants flower at a later time and developmental stage compared to wild type plants,
- 19 -
showing that proper starch accumulation is important for inducing the floral transition (Bernier et
al., 1993; Corbesier et al., 1998).
Fixed carbon use is split between sugar synthesis and starch synthesis. In chloroplasts,
carbon dioxide (CO2) is fixed into triose-phosphates via the Calvin cycle, which are exported into
the cytosol and converted into sucrose (Streb and Zeeman, 2012). To make starch, an intermediate
of the Calvin cycle called fructose-6-phosphate (Fru6P) is converted into starch though a series of
enzymatic reactions. The amount of carbon used for starch synthesis is controlled by regulation
of ADP-glucose pyrophosphate (AGPase), an enzyme that activates ADP-glucose, which is the
substrate for starch synthesis. AGPase is a heterotetramer with two small subunits and two large
subunits encoded for by six genes and is activated by 3-phosphoglycerate (3-PGA) and inhibited
by inorganic phosphate.
Since 3-PGA is produced during the Calvin cycle, when carbon
assimilation is occurring at high rates, starch synthesis will occur at high rates, allowing the plant
to take advantage of optimal photosynthetic conditions (Streb and Zeeman, 2012).
During the night, Arabidopsis degrades almost all of the starch it has stored the previous
day. Starch is degraded primarily into maltose with some glucose and glucose-1-phosphate
(Glc1P). It is suggested that maltose and glucose are exported to the cytosol via membrane
transporters, while Glc1P remains in the chloroplast to provide the organelle with energy (Streb
and Zeeman, 2012). Starch excess (sex) mutants in Arabidopsis, also called gwd1, since they do
not contain a functional α-glucan water, dikinase (GWD1), do not degrade starch as efficiently as
wild type plants and gradually accumulate more starch in their leaves as the leaf ages (Zeeman and
Rees, 1999). These mutants also export carbon assimilate to the roots at a slower rate compared
to wild type plants (Zeeman and Rees, 1999). GWD1 is one of the first enzymes involved in
initiation of starch degradation (Streb and Zeeman, 2012). GWD1 phosphorylates amylopectin
- 20 -
glucosyl residues on the surface of starch granules, which disrupts their structure to make them
more susceptible to further breakdown. However, phosphorylated glucans are problematic for βamylases that are also involved in breakdown, so enzymes called STARCH EXCESS 4 and LIKE
SEX FOUR 2 dephosphorylate amylopectin after the granule structure has been disrupted (Streb
and Zeeman, 2012). Next, α-amylases break down amylose and amylopectin by catalyzing the
hydrolysis of α-1,4 glucan bonds (Karrer and Rodriguez, 1992).
Starch metabolism is tightly regulated, as evidenced by the ability of the plant to produce
sufficient starch to last through the upcoming night and when photoperiods change, the plant will
quickly adapt its starch synthesis and degradation rates to match the new photoperiod (Streb and
Zeeman, 2012). Starch synthesis does not start as soon as the day begins and starch degradation
does not start as soon as the night begins, suggesting that starch metabolism is not simply regulated
by presence or absence of light. Instead, concentrations of metabolic intermediates or other
signaling methods may be involved (Streb and Zeeman, 2012). As discussed earlier, the rate at
which carbon is fixed into starch is largely controlled by changes in AGPase activity. Since this
enzyme is mostly inactive at night, starch synthesis is halted. During the day, it is hypothesized
that starch granules assume their insoluble form and are not able to be degraded, perhaps because
enzymes that phosphorylate amylopectin are inactive (Streb and Zeeman, 2012). This has yet to
be demonstrated. Little research has been done to explore whether hormones control starch
biosynthesis and breakdown in Arabidopsis, but in cereal grains, α-amylase gene expression is
enhanced by gibberellic acid (GA) and repressed by abscisic acid (ABA). For example, the αamylase genes of barley contain GA and ABA response elements, indicating that these genes are
directly controlled by these antagonistic hormones (Chrispeels and Varner, 1967; Jacobsen and
- 21 -
Beach, 1985; Skriver et al., 1991). Overall, starch metabolism is a highly regulated process that
we do not yet fully understand.
1.9 Sucrose is transported from source to sink
Plants photosynthesize to produce energy in the form of various sugars that are
transported from photosynthetic tissues to non-photosynthetic tissues. To begin, CO2 is fixed in
chloroplasts as glyceraldehyde 3-phosphate (G3P) (Ludewig and Flügge, 2013). The G3P can
either be exported from the chloroplast to the cytoplasm and converted into sucrose or be converted
into starch and stored in the chloroplast until night. During the night, the starch is converted to
glucose or maltose and transported to the cytoplasm where it is made into sucrose as previously
discussed. Although several types of sugars exist in plants, most sugars are converted to sucrose
for transport. Sucrose is transported from source tissues, such as leaves, through the phloem to
sink tissues, such as roots and flowers. In Arabidopsis, sucrose is usually loaded apoplastically
into the phloem; sucrose is moved into vacuoles by tonoplast monosaccharide transporters and
then exported into the apoplast, likely by symporters or facilitated diffusion. Members of the
SWEET gene family transport sucrose into the phloem companion cells, where it is loaded into the
phloem by energy-dependent sucrose/H+ cotransporters. When the sucrose reaches the destination
sink tissue, it is released from the companion cells into the apoplast and is taken up into sink tissue
cells by sucrose/H+ cotransporters. After this, sucrose may be transported apoplastically or
symplastically until reaching its final destination (Ludewig and Flügge, 2013). Here, sucrose can
be broken down into hexoses by invertases (INVs) and sucrose synthases (SUSs).
compounds are further metabolized to provide energy for the sink tissue (Ruan, 2012).
- 22 -
These
1.10 Sugar metabolism enzymes have a signaling role
Hexoses and their metabolic products are important for several functions including
providing energy, making up structural compounds like starch and cellulose and reducing sucrose
concentrations in certain tissues to allow for facilitated diffusion (Ruan, 2012). When sucrose
reaches a sink tissue, it must be cleaved into hexoses before further metabolism can occur, a
reaction that is done by INVs and SUSs. INV converts sucrose into fructose and glucose, whereas
SUS cleaves sucrose into uridine diphosphate (UDP) glucose and fructose (Ruan, 2012). In
addition to their enzymatic roles, there is evidence to suggest that INV and SUS also play a
signaling role. For example, in tomato, repressing the INV that localizes to the cell wall caused
an increase in petal and sepal number that could not be explained by the altered hexose levels,
suggesting that loss of INV activity led to the loss of a signaling pathway affecting division. When
the activity of a similar INV in maize was suppressed, seeds lacked a fully developed endosperm
and were much smaller than wild type seeds. This seed phenotype could not be rescued by treating
the plants with exogenous glucose or fructose or a combination of both, indicating that it was not
a reduction in glucose or fructose levels that caused the phenotype but rather a result of the lack of
cell wall INV activity (Ruan, 2012). Cell wall INV mediates glucose signaling, which is
implicated in controlling cell division and auxin biosynthesis. Additionally, cell wall INVmediated signaling also affects leaf development and aging by regulating the effects of cytokinin
and ABA on the leaf (Ruan, 2012). Research regarding INV signaling is still in its preliminary
stages and many questions remain unanswered, such as how plants sense extracellular glucose and
- 23 -
fructose produced by cell wall INVs and how the auxin biosynthesis and glucose signaling
pathways are linked. Further research needs to be done in order to explore these questions.
Once sucrose is converted into hexoses, these hexoses must be phosphorylated by
hexokinases (HXKs) and fructinases before the plant can metabolize them. HXKs are able to
phosphorylate glucose, fructose, mannose and glucosamine but not galactose. There is also
evidence that HXKs have a signaling role that allows them to control gene expression and the
interactions of phytohormones during development (Granot et al., 2013). When maize protoplasts
were exposed to sugars that are substrates of HXKs, expression of photosynthetic genes was
repressed, while upon exposure to sugars that are not substrates for HXKs, no repression was
observed (Jang and Sheen, 1994). Plants were also treated with a glucose analog called 2deoxyglucose that has its 2’OH group replaced with a hydrogen atom such that it can be
phosphorylated and activate HXK signaling but not be metabolized.
Treatment with 2-
deoxyglucose led to reduced expression of photosynthetic genes, showing that HXKs play a
signaling role. HXKs help the plant sense the amount of sugar present and downregulate
photosynthesis genes accordingly (Jang and Sheen, 1994). An Arabidopsis mutant called glucose
insensitive2 has been engineered such that the main HXK enzyme is catalytically inactive and is
unable to phosphorylate hexoses.
These mutants were still able to regulate expression of
photosynthetic and growth-related genes without any phosphorylation activity, implying that
HXKs have a role in signaling separate from their catalytic function (Moore et al., 2003). The way
in which this signal is transported through the plant and how gene expression is controlled remain
to be elucidated.
- 24 -
1.11 Hypothesis
This project aims to investigate three main hypotheses.
Hypothesis One: Loss of IDD2 function will result in differences in growth and
development compared to wild type plants.
Hypothesis Two: The IDD2::GFP:GUS reporter plants show that IDD2 is expressed in
diverse tissues throughout the plant.
Hypothesis Three: IDD2 has a function related to auxin or gibberellic acid response.
1.12 Objectives
Stable, homozygous IDD2 loss-of-function T-DNA insertion lines will be obtained and
examined when grown under various conditions, including in the presence of exogenous sugars,
in the presence of exogenous hormones and in the dark. 35S∷IDD2 overexpression transgenic
plants will be created and analyzed for morphological differences from Col-0, as well as
differences in their response to hormones, sugars and darkness compared to Col-0.
IDD2∷GUS:GFP reporter transgenic plants will be created and analyzed throughout the plant
lifecycle to visualize the expression pattern of IDD2. These objectives will help to elucidate the
function of IDD2.
- 25 -
Chapter 2:
Materials and Methods
2.1 idd2 Mutant Lines
Two T-DNA insertion mutants with insertions in IDD2 were ordered from the SALK
institute (Alonso et al., 2003) and one was ordered from the SAIL/GARLIC project (Sessions et
al., 2002). These mutants were genotyped and backcrossed to wild type Col-0 plants at least three
times. Inserts were sequenced so their exact location could be mapped and this information along
with SALK and SAIL identification numbers is shown in the Appendix in Table 0.3 and in the
schematic diagram shown in Figure 2.1.
Figure 2.1: Schematic diagram showing IDD2 gene structure and T-DNA insertions for idd2-1,
idd2-2 and idd2-3 lines. Boxes represent exons and lines represent introns.
2.2 Plant Growth Conditions
The Arabidopsis ecotype Columbia-0 (Col-0) was used as a wild type control in all
experiments. For plants grown on plates, seeds were sterilized using the following protocol. To a
1.5 ml microfuge tube containing about 100 seeds, 1 ml of 10% bleach and 0.1% Triton X solution
was added and incubated for 5 minutes, mixing by inversion three times throughout. The solution
was removed and 1 ml of 70% ethanol was added and tubes were mixed by inversion for two
minutes. Four rinses with ddH2O were done. Sterilized seeds were placed on plates using a P1000
- 26 -
pipette. Six to eight seeds each of wild type and mutant plants were placed near the top of each
plate for root growth experiments and plates were oriented vertically. Many seeds were scattered
throughout the plate for selection plates and plates were oriented horizontally. Plates were
wrapped in parafilm or micropore tape, covered with foil and kept at 4°C for two days to imbibe
the seeds. Plated Arabidopsis seedlings were grown in a growth chamber at approximately 21°C
and a light intensity of 45 µmol/m2s on a schedule of 16 hour days and 8 hour nights.
Plants to be grown in soil were placed on damp filter paper in petri dishes, wrapped in foil
and kept at 4°C for 2-3 days to imbibe the seeds. Seeds were planted in SUNSHINE MIX soil in
3” pots and placed in a growth chamber in the University of Guelph Phytotron facility at 23.0°C.
Clear plastic lids were placed on trays for 5 days to increase humidity to promote germination.
Sprouted seedlings were thinned so that each pot held a single seedling. For normal, long day
treatment, growth chambers were kept at a light intensity of 130 µmol/m2s on a schedule of 16
hour days and 8 hour nights. For short day treatments, the chambers had 10 hour days and 14 hour
nights and for low light treatments, chambers were kept at a light intensity of 40 µmol/m2s. Plants
were watered every 3-4 days by adding water to trays underneath pots to allow the soil in the pots
to absorb the water. Fertilized water was used approximately once weekly.
2.3 Media
Plant media consisted of 2.2% Murashige and Skoog powder (Murashige and Skoog, 1962)
(Caisson Labs), 0.5% 2-(N-morpholino)-ethanesulfonic acid monohydrate (BioShop) and 0.1%
phytagel (Sigma) or 0.8% agar (Fisher). All media was adjusted to a pH of 5.7 to 5.8 using 3 M
KOH and autoclaved for 20 minutes to sterilize before it was poured into sterile petri plates. Plant
media for sugar response experiments was made with either 1% to 8% sucrose (Fisher), 1% to 8%
glucose (Fisher), or no added sugar. Plant media for hormone response experiments was made the
- 27 -
same as sugarless plant media above supplemented with filter-sterilized 1 µM GA (Sigma), 10 µM
GA, 1 µM ABA (Sigma), 10 µM ABA, 1 µM IAA (Sigma), 10 µM IAA, 1 µM 6-BAP (Sigma) or
10 µM 6- BAP after autoclaving when media cooled to approximately 50°C. Plant media for
selecting transgenic lines was made the same as sugarless media above supplemented with 15 µg/L
glufosinate ammonium (Bayer Crop Science) after autoclaving when media cooled to
approximately 50°C.
For E.coli growth, Luria Broth (LB) media with appropriate antibiotics added was used.
1L of LB contained 10 g NaCl (Fisher), 10 g tryptone (Fisher), 5 g yeast extract (Fisher) and 15 g
agar (Fisher), if making plates. Concentrations of antibiotics used for various selections are shown
in Table 2.1.
For Agrobacterium tumefaciens growth, 2xYT media with appropriate antibiotics was
used. 1L of 2xYT contained 5 g NaCl (Fisher), 16 g tryptone (Fisher), 10 g yeast extract (Fisher)
and 8 g agar (Fisher), if making plates. Concentrations of antibiotics used for various selections
are shown in Table 2.1.
- 28 -
Table 2.1 Antibiotic selection criteria for constructs used. The appropriate antibiotic(s) was/were
added to LB or 2xYT media for growing each construct. All constructs were from Gateway
(Life Technologies) (Karimi et al., 2002).
Antibiotic Selection
Construct
Purpose
E. coli
A. tumefaciens
pDONR 221
entry vector for
all constructs
Kanamycin – 50 µg/µl
n/a
pBGWFS7
destination
vector for
reporter
constructs
Spectinomycin – 50 µg/µl
Spectinomycin – 50 µg/µl
destination
vector for
overexpression
constructs
Spectinomycin – 50 µg/µl
pB7WG2D
Rifampicin – 25 µg/µl
Gentamycin – 50 µg/µl
Spectinomycin – 50 µg/µl
Rifampicin – 25 µg/µl
Gentamycin – 50 µg/µl
2.4 Use of Gateway® Technology to make Recombinant DNA Constructs
The Gateway® cloning method (Invitrogen) was used to create reporter constructs for
IDD1 and IDD2 and an overexpression construct for IDD2. AtIDD1pro-F and AtIDD1pro-R
primers were used to amplify 2518 bp of the IDD1 promoter. AtIDD2proB1-F and AtIDD2proB1R primers were used to amplify 1787 bp of the IDD2 promoter. AtIDD2OE-F and AtIDD2OE-R
primers were used to amplify the IDD2 coding region (1885 bp) from a BAC called U67269.
Primers contained recombination sites for the Gateway BP reaction which uses specific
recombinases to put the amplified sequences into the pDONR221 entry plasmid. To do this, 1575 ng of PCR-amplified, gel-extracted fragment was added to 150 ng purified pDONR221 vector
and 1X TE buffer pH 8.0 (10 mM Tris-HCl pH 8.0, 1 mM EDTA pH 8.0) up to 8 μl and 2 μl BP
Clonase II. Samples were incubated at 25°C for 1 hour and enzyme was deactivated by adding 1
μg Proteinase K and incubating at 37°C for 10 minutes. Plasmids were then transformed into
- 29 -
Subcloning Efficiency DH5α Competent Cells (Invitrogen). Next, 5 μl of reaction product was
added to 50 μl of competent cells and cells were kept on ice for 30 minutes, then heat shocked for
30 seconds in a 42°C water bath and returned to ice for 2 minutes. 950 μl pre-warmed SOC media
was added to each tube of cells and tubes were incubated at 37°C for one hour before being plated
on pre-warmed LB plates with 50 μg/μl kanamycin and placed at 37°C overnight. Colony PCR
was done on surviving colonies with AtIDD1proF and AtIDD1proR for pDONR221/IDD1pro,
AtIDD2pro SF and AtIDD2pro SF primers for pDONR221/IDD2pro and AtIDD2For1 and
AtIDD2Rev2 for pDONR/IDD2. The same colonies were also grown in liquid media overnight
and plasmids were extracted using the GeneJET Plasmid Miniprep kit (Thermo Scientific)
according to manufacturer’s instructions.
After all plasmids were checked by sequencing with the above primers at University of
Guelph Lab Services, LR reactions were performed to recombine fragments into desired
destination vectors: pBGWFS7 for reporter constructs and pB7WG2D for the overexpression
construct. To do this, 10 fmoles of pDONR221 with desired fragment transformed into it were
added to 20 fmoles of destination vector and 1X TE buffer pH 8.0 up to 8 μl, 2 μl LR Clonase II
was added and samples were incubated for 16 hours at 25°C. Reaction was stopped by adding 1
μg Proteinase K and incubating at 37°C for 10 minutes. 2 μl of reaction product was transformed
into DH5α competent cells as previously described, except that plasmids were plated on LB plates
with 50 μg/μl spectinomycin. Plasmids were sequenced again with the same primers as mentioned
before to confirm that reaction was successful.
Plasmids with confirmed inserts were transformed into Agrobacterium tumefaciens. Then,
1 μg of purified plasmid was added to 50 μl competent A. tumefaciens GV3101 cells (Invitrogen),
tubes were frozen in liquid nitrogen for 45 seconds and heated at 37°C for 5 minutes. One ml of
- 30 -
pre-warmed LB was added to cells and they were incubated for 4 hours at 28°C. Next, 500 μl of
this media was plated on 2xYT media with 50 µg/µl spectinomycin, 50 µg/µl gentamycin and 25
µg/µl rifampicin and placed at 28°C for 2 days. Colony PCR was done with primers mentioned
above to double-check for plasmid presence and colonies were transferred to liquid culture and
grown at 28°C for 2 days.
2.5 Floral Dip Agro-infiltration to Create Transgenic Plants
The floral dip method was used to introduce reporter and overexpression constructs into
Arabidopsis plants (Clough and Bent, 1998; Desfeux et al., 2000) 50 ml of liquid 2xYT media
was inoculated with A. tumefaciens containing the construct of interest and grown for about 2 days
to stationary phase (OD600 > 2.0). Cells were pelleted and resuspended in a 5% sucrose solution
containing 500 µl Silwet/1 L solution to an OD600 of about 1.5. Approximately 48 plants were
dipped for each construct. Siliques were removed from plants, then plants were inverted and
dipped into the sucrose and bacteria solution. The shoots were fully submerged and swirled for
10 seconds. After all plants were done, they were tilted on their side to prevent sucrose from
dripping onto leaves and placed in low light for one day. The next day, plants were returned to
normal light and upright position. A second dip was done 5 days later in the same way except that
no siliques were removed, as these siliques could contain transformed seeds. Seeds were harvested
when mature and planted in soil.
Transformants were selected by spraying with 200 g/L
glufosinate ammonia (BASTA, Bayer Crop Science) at 10 days after germination. This spraying
was repeated every 2 days for 3 more sprayings. In later generations, BaRF and BaRR primers
were used to genotype reporter and overexpression plants if spraying needed to be avoided.
- 31 -
2.6 Genetic Crosses of Arabidopsis Plants
The idd2 loss-of-function mutants were backcrossed to wild type Columbia plants and
idd2-1, idd2-2 and idd2-3 mutants were crossed to each other. Crossing was done by emasculating
closed buds on the mother plant, brushing pollen from the father plant on to the stigma of the
mother plant and isolating the exposed stigma using pieces of Saran wrap. Reciprocal crosses
were always done. The idd2-2 and idd2-3 mutants were backcrossed to Col-0 plants three times.
2.7 DNA Extraction
DNA was extracted from Arabidopsis plants using the following protocol. A leaf piece of
about 1 cm2 was taken from a mature leaf and placed in a 1.5 ml tube. Tubes were either placed
in liquid nitrogen and tissue was homogenized with a chilled mini-pestle or a chrome bead was
added to each tube along with 100 µl of PCR extraction buffer without detergent (200 mM TrisHcl pH 7.5, 250 mM NaCl and 25 mM EDTA pH 8) and tissue was homogenized with a
Beadbeater MM301 (Retsch) for 30 seconds at a frequency of 1/30s. For the Beadbeater method,
300 µl of PCR extraction buffer (200 mM Tris-Hcl pH 7.5, 250 mM NaCl, 25 mM EDTA pH 8
and 0.5 % SDS) was added after homogenization and tubes were inverted to mix. For the minipestle method, 400 µl of PCR extraction buffer was added after homogenization. Samples were
spun down at 15 000 rpm in a table-top centrifuge for 5 minutes and the supernatant was drawn
off and placed in a new tube. To this new tube, 400 µl of 100% isopropanol was added and the
tube was inverted 6 times. The tube was centrifuged at 15 000 rpm for 10 minutes and the
supernatant was poured off. Then, 500 µl of 70% ethanol was added and the tube was flicked to
mix the contents. The tube was centrifuged at 15 000 rpm for 1 minute and the supernatant was
poured off. The sample was allowed to air-dry for several minutes and then resuspended in 50 µl
ddH2O. Samples were stored at -20°C for up to one year.
- 32 -
2.8 PCR Amplification and Product Analysis
Most PCR was done using GOTaq Green Master Mix (Promega). For a 20 µl reaction, 10
µl of master mix, 0.2 µl of 10 µM forward and reverse primer, 1 µl of DNA template and 8.6 µl
of nuclease-free water were added to a PCR tube, vortexed briefly and collected at the bottom of
tubes using a small centrifuge. Next, the following protocol was run in a Bio-rad T100 thermo
cycler: an initial denaturation step of 95°C for 3:00, 35 cycles of 95°C for 0:30, annealing
temperature (45-60°C) for 0:30 and 72°C for 1:20 and a final elongation step of 72°C for 5:00. In
instances where a high fidelity product was needed, such as for sequencing or cloning, Phusion
High-Fidelity DNA Polymerase (New England Biolabs) was used. For a 25 µl reaction, 5 µl of
5X Fusion HF buffer, 0.5 µl of 10 mM dNTPs (Invitrogen) 1.25 µl of 10 µM forward and reverse
primers, 0.25 µl of Phusion DNA polymerase, 1 µl of DNA template and 15.75 µl of nuclease-free
water were added to a PCR tube, vortexed briefly and collected at the bottom of tubes using a
small centrifuge. Then, the following protocol was run in a Bio-rad T100 thermo cycler: an initial
denaturation step of 98°C for :30, 35 cycles of 98°C for 0:10, annealing temperature (45-60°C) for
0:30 and 72°C for :30 and a final elongation step of 72°C for 5:00.
PCR products were run on 1.5% agarose (BioShop) gels in 1x TAE buffer (40 mM Tris
acetate, 1 mM EDTA, pH 8.0) with a 1 kilo base pair DNA ladder (Fermentas). Gels were analyzed
using a Bio-rad Gel doc and Image Lab software version 2.01 (Bio-rad).
To extract PCR products from gels, a Purelink Quick Gel Extraction kit (Invitrogen) was
used according to manufacturer’s instructions. The quality of the extracted PCR product was
analyzed using a Nanodrop 2000 (Thermo Scientific). If the product needed to be sequenced, it
was sequenced by the Genomics Facility at the University of Guelph.
- 33 -
2.9 RNA Extraction and cDNA Synthesis
To prepare for quantitative polymerase chain reaction (qPCR), RNA was extracted from
Arabidopsis leaves, quantified, standardized, treated with DNase and synthesized into cDNA.
Four mature leaves from each plant were harvested in liquid nitrogen and the EZ-10 Spin
Column Plant RNA Minipreps kit (Biobasic) was used to extract RNA. Frozen tissue was ground
using one chrome bead per tube and the Beadbeater MM301 (Retsch). Next, 450 µl Buffer R
Lysis-PG extraction buffer was added to lyse cells. Samples were centrifuged and supernatant was
transferred to a new tube and mixed with 100% ethanol to precipitate RNA. The supernatant and
ethanol solution was transferred to a column and centrifuged, then two washes with 500 µl of
Universal GT solution, then Universal NT solution were done. Samples were centrifuged a final
time to remove residual ethanol. RNA was eluted in 50 µl RNase-free water and stored at -80°C
if necessary, for no longer than 2 weeks.
Extracted RNA was quantified using a NanoDrop 2000 machine (Thermo Scientific). For
each sample, either 500 ng or 1 µg of RNA was treated with DNase I (Fermentas) by mixing
sample with 1 µl DNase I, 1 µl reaction buffer and RNase-free water up to a total volume of 10 µl.
Samples were incubated at 37°C for 30 minutes. 1 μl of 50 mM EDTA (Invitrogen) was added to
each sample and samples were incubated at 65°C for 10 minutes to stop the reaction. This DNasetreated RNA was transformed into cDNA using the qScript cDNA SuperMix kit (Quanta
Biosciences). The entire 11 μl was mixed with 4 μl of cDNA SuperMix and 5 μl nuclease-free
water. Samples were gently flicked, briefly spun to collect solution and incubated at 25°C for 5
minutes, 42°C for 30 minutes and 85°C for 5 minutes. cDNA samples were stored at -20°C and
used within 2 weeks of extraction.
- 34 -
2.10 Quantitative PCR
Quantitative PCR (qPCR) was used to quantify expression of IDD2 and IDD1 in wild-type
and mutant plants. A reaction mix with SYBR green as the fluorescent dye and Rox as an inert
control called PerfeCTa SYBR Green Supermix with Rox (Quanta Biosciences) was used. SYBR
is a dye that produces a strong fluorescent signal when it binds to double-stranded DNA.
Fluorescence is measured at each PCR cycle, as the amount of product increases exponentially.
Eventually, one reagent will become limited and the reaction will plateau. In the exponential
phase, the cycle at which the fluorescence level passes a certain threshold is measured and is called
the Ct. Rox is also a fluorescent dye in the reaction mix but its fluorescence does not change as
amplification occurs. Instead, Rox controls for slight well-to-well variation that can arise from
differences in illumination or condensation amount. The fluorescence of SYBR is divided by the
fluorescence of Rox at each cycle to make the amplification curve and find the Ct. 7300 System
SDS software (Applied Biosystems) was used for these analyses.
Primers were designed and optimized for the target gene, IDD2, and an endogenous control
house-keeping gene, ACTIN7. These primers, their optimal dilutions and their expected amplicon
size can be found in the Appendix in Table 0.2. For each reaction, 5 μl cDNA, 12.5 μl PerfeCTa
SYBR Green Supermix, 1 μM each forward and reverse primer (1 μl of each of 10 μM stock) and
5.5 μl nuclease-free water were mixed for a 25 μl reaction volume. Samples were loaded into a
96-well plate and qPCR was done in 7300 Real-Time PCR system (Applied Biosystems). Data
was analyzed with the 2-ΔΔCt method (Livak and Schmittgen, 2001). This method involves the
following equation:
- 35 -
𝑅𝑄 = 2−𝛥𝛥𝐶𝑡 = 2−(𝛥𝐶𝑡 𝑚𝑢𝑡𝑎𝑛𝑡 − 𝛥𝐶𝑡 𝑤𝑖𝑙𝑑𝑡𝑦𝑝𝑒)
−((𝐶𝑡 𝑚𝑢𝑡𝑎𝑛𝑡,𝑡𝑎𝑟𝑔𝑒𝑡 − 𝐶𝑡 𝑚𝑢𝑡𝑎𝑛𝑡,𝑒𝑛𝑑𝑜)−(𝐶𝑡 𝑤𝑖𝑙𝑑𝑡𝑦𝑝𝑒,𝑡𝑎𝑟𝑔𝑒𝑡−𝐶𝑡 𝑤𝑖𝑙𝑑𝑡𝑦𝑝𝑒,𝑒𝑛𝑑𝑜))
=2
where RQ (relative quantification) is expression of the target gene (IDD2) in the mutant compared
to the expression of the target gene in the wild-type after taking into account the expression of the
endogenous control. Since RQ is related to Ct in an exponential way, this complicates how
standard deviations (s) are calculated. The exponential transformation means that the standard
deviations above and below the mean will not be equal; the standard deviation above the mean
will be larger than the standard deviation below the mean. To calculate the standard deviations,
an interval of ΔΔCt ± s was transformed into an interval of (RQ – s lower, RQ + s upper). To make
results more intuitive, RQ values were converted to percentage of expression in wild-type Col-0
by multiplying RQ by 100%.
2.11 Starch, Glucose and Sucrose Extraction and Quantification
Starch, glucose and sucrose were extracted from mature leaves pre- and post-floral
transition to investigate differences in concentrations of these compounds. Tissue of interest
(usually 3 mature leaves) was collected into pre-weighed screw-cap tubes containing a metal ball
at ZT0, ZT8 and ZT16, frozen in liquid nitrogen and stored at -80°C until needed. Starch and
sugars were extracted the Total Starch Assay kit (Megazyme) with a modified protocol. Tissue
was weighed and freeze-dried overnight in a FreeZone 6 Plus freeze-dryer (Labconco) and a
CentriVap Concentrator (Labconco) and ground with the Beadbeater for 30s at 30s-1. 1 mL of
80% EtOH with 3 mM HEPES (Sigma) and lightly vortexed to mix. Tubes were stored on ice and
metal balls were removed with a magnet. Samples were shaken at 800 rpm and 50°C for 15
minutes, then centrifuged at 14 000 g for 5 minutes. Supernatant was transferred to a 15 ml Falcon
- 36 -
tube. Another 1 ml of ethanol and HEPES was added and subsequent steps were repeated until 4
ml of supernatant has been transferred. Supernatant was stored at -80°C for sugar extraction at a
later date.
To extract starch, the following protocol was used. The pellet from above was freeze-dried
for 2 hours, 400 μl of ddH20 was added and tubes were lightly vortexed to break up pellet before
being shaken at 99°C at 800 rpm for 20 minutes. Tubes were stored on ice and 400 μl of α-amylase
and MOPS solution (1 ml α-amylase mixed with 14mL 50 mM MOPS with 5 mM calcium
chloride, pH 7.0) was added. Tubes were shaken at 99°C for 10 minutes. 400 μl of sodium acetate
buffer (200 mM, pH 4.5) and 26.6 μl amyloglucosidase was added to tubes and samples were
vortexed and shaken at 50°C and 800 rpm for 5 minutes. To quantify starch, 50 μl of solution was
mixed with 450 μl water and 500 μl GOPOD. A blank sample with 500 μl water and 500 μl
GOPOD was also made. Samples were shaken at 50°C and 800 rpm for 30 minutes. Three
technical replicates of 200 μl each were taken from each sample and placed into a 96-well plate.
Absorbance at 510 nm was measured using a Multiskan GO Microplate spectrophotometer
(Thermo Scientific) and the SkanIt software (Thermo Scientific). Technical replicates were
examined and averaged and absorbance of the blank sample was subtracted from all sample
absorbances. A standard curve with the following equation was used to convert absorbance to
glucose.
[1]
𝐺𝑙𝑢𝑐𝑜𝑠𝑒 (𝜇𝑔) =
𝐴𝑏𝑠𝑜𝑟𝑏𝑎𝑛𝑐𝑒 𝑎𝑡 510 𝑛𝑚 − 0.0083
0.0244
- 37 -
Glucose was then converted to starch concentration (measured in mg glucose per g fresh weight)
using the following equation:
[2]
𝑔𝑙𝑢𝑐𝑜𝑠𝑒 (µ𝑔)
1 𝑚𝑔
× 1226.6 𝜇𝑙 × 1000 𝜇𝑔
50 𝜇𝑙
𝑆𝑡𝑎𝑟𝑐ℎ (𝑖𝑛 𝑔𝑙𝑢𝑐𝑜𝑠𝑒 (𝑚𝑔/𝑔)) = (
)
𝑓𝑟𝑒𝑠ℎ 𝑤𝑒𝑖𝑔ℎ𝑡 (𝑔)
Sugar extraction was done using the supernatant mentioned earlier. After vortexing, 2.25
ml of supernatant was transferred to a new 15 ml tube and 1.5 ml of chloroform was added.
Samples were incubated in a 37°C water bath for 10 minutes. 3.45 ml of ddH20 was added and
tubes were vortexed for 15 seconds, then centrifuged at 3000 rpm for 7 minutes. 2 ml of
supernatant was transferred to a microfuge tube, freeze-dried overnight and re-hydrated with 200
μl of ddH20. Both glucose and sucrose were quantified from this solution.
To measure glucose, the same procedure as that of starch was used, except that after
converting absorbance to glucose using equation 1, a different equation was used to convert
glucose to glucose concentration:
[3]
𝑔𝑙𝑢𝑐𝑜𝑠𝑒 (µ𝑔)
1 𝑚𝑔
5 𝑚𝑙
4 𝑚𝑙
× 200 𝜇𝑙 ×
×
× 1000 𝜇𝑔
50 𝜇𝑙
2 𝑚𝑙
2.25 𝑚𝑙
𝐺𝑙𝑢𝑐𝑜𝑠𝑒 (𝑚𝑔/𝑔) = (
)
𝑓𝑟𝑒𝑠ℎ 𝑤𝑒𝑖𝑔ℎ𝑡 (𝑔)
To measure sucrose, 50 μl of sugar solution was added to 20 μl of invertase and 30 μl
ddH20 and shaken at 50°C for 30 minutes to convert sucrose to glucose and fructose. Next, 500
μl GOPOD and 400 μl of ddH20 were added to this and absorbances were measured as before.
- 38 -
The value from the conversion of absorbance to glucose actually represents both the glucose in the
sample and the sucrose that was converted to glucose, so to obtain the amount corresponding to
the sucrose, the glucose value from the glucose measurement for the same plant is subtracted from
the glucose value for the sucrose measurement. Then, equation 3 was used to obtain the amount
of glucose in mg/g leaf tissue that corresponded to sucrose. Finally, equation 4 was used to account
for the molecular weight difference between sucrose and glucose.
[4]
𝑔
𝑔𝑙𝑢𝑐𝑜𝑠𝑒 (𝑚𝑔/𝑔) × 342.2965
𝑠𝑢𝑐𝑟𝑜𝑠𝑒
𝑚𝑜𝑙
𝑆𝑢𝑐𝑟𝑜𝑠𝑒 (𝑚𝑔/𝑔) =
𝑔
180.16
𝑔𝑙𝑢𝑐𝑜𝑠𝑒
𝑚𝑜𝑙
2.12 GUS Assay for Gene Expression Analysis
β-glucuronidase (GUS) assays are useful to visualize gene expression in plants transformed
with a reporter construct (Jefferson et al., 1987). When tissues are treated with X-GlcA, GUS
cleaves X-GlcA to produce a dichloro-di-bromo-indigo precipitate that is water insoluble and bluecoloured. Plant samples at various stages of growth were prepared according to a protocol
modified from Jefferson et al. (1987). Briefly, samples are covered with Standard GUS staining
solution (50 mM sodium phosphate buffer pH 7.0, 10 mM EDTA pH 8.0, 0.1% (v/v) Triton X100 and 0.5 mg/ml X-GlcA) and placed under a weak vacuum for 5 minutes to encourage tissue
penetration. Samples are then incubated at 37°C for approximately 24 hours. Stain is removed
and samples are covered with 70% ethanol and incubated at room temperature for at least 2 hours
to clear the tissue and remove residual staining solution. Samples are viewed, with a microscope
if necessary, and pictures are taken.
- 39 -
2.13 Mucilage Staining
Ruthenium red stain (Sigma) was used to view mucilage extruded from soaked seeds.
Individual seeds were placed in wells of a 96-well plate with 10 μl dH2O and incubated at room
temperature for 10 minutes to allow seeds to take up water. Then, 200 μl of 0.001% ruthenium
red stain (pH 6.5-7.5) was carefully added to the side of each well to avoid disrupting the
emerging mucilage and samples were incubated at room temperature for 25 minutes. Seeds and
mucilage were viewed under a dissecting microscope.
2.14 Qualitative Comparison of Relative Seed Oil Concentrations
A seed sedimentation assay using solutions with different densities was used to determine
whether seeds had different oil concentrations compared to Col-0 (adapted from Focks and
Benning, 1998). Solutions with various ratios of 1,6-dibromohexane to 1-bromohexane to
mineral oil were carefully layered in order of density into 2 ml microfuge tubes. The ratios, from
most dense to least dense, were 1:1:0, 0:1:0 and 0:1:1. Approximately 10 to 20 seeds were added
to each tube and tubes were centrifuged at 16 000 g for 2 minutes. Sedimentation patterns were
compared to Col-0 seeds, which settled at the bottom of the middle layer. If seeds were in the
top layer, this suggested that they had more oil than wild type seeds and if seeds were in the
bottom layer, this suggested that they had less oil than wild type seeds.
2.15 Image Capture and Analysis
Macroscopic images were captured using a Nikon D5000 camera or Canon Rebel 2ti.
Microscopic images were captured using a Q Imaging Retiaga 1300R camera or Canon Rebel 2ti
with a microscope adapter. Microscopes used in this study were a Leica MZ6, a Leica MZ FLIII
and a Hitachi Tabletop Scanning Election Microscope. Images were analyzed using Image J
software.
- 40 -
2.16 Statistical Tests
Student’s t-tests with α=0.05 were used to compare measurements of various properties of
wild type and mutant plants for experiments in which one time point or set of data was collected.
Experiments with repeated measurements of root or hypocotyl lengths were analyzed using
repeated measures multivariate analysis of variance (MANOVA) in Statistical Analysis System
(SAS) 9.2 (SAS Institute Inc.).
All significant differences are shown with means and p-values from a Student’s t-test,
unless otherwise noted. In experiments where multiple comparisons were done, a modified pvalue is reported to reflect the increased chance of committing a Type I error. The Bonferroni
method for reducing family-wise error in multiple comparisons involves dividing the original α by
k, where k is the number of comparisons done (Dunn, 1961). For example, if 5 comparisons are
done, α* =
𝛼
𝑘
=
0.05
5
= 0.01, so p-values would be compared to 0.01 instead of the standard 0.05.
To avoid having to keep track of different α* values throughout this manuscript, original p-values
have been multiplied by k and will be compared to the standard α of 0.05. This is equivalent to
the above correction.
- 41 -
Chapter 3:
Results
3.1 IDD2 expression in transgenic plants
3.1.1 Analysis of putative idd2 loss-of-function mutants
T-DNA insertion mutants for IDD2 were obtained from the SALK institute (Alonso et al.,
2003) and the SAIL/GARLIC project (Sessions et al., 2002) and referred to as idd2-1, idd2-2 and
idd2-3. Information about SALK and SAIL numbers and insertion locations is found in Table 0.3.
To check whether each mutant had reduced IDD2 expression, RNA was extracted from leaves and
qPCR was done to detect IDD2 expression levels.
RNA was extracted from leaves 4, 5 and 6 of Col-0, idd2-1, idd2-2 and idd2-3 plants that
were grown under normal conditions except that they were given 40 µmol/m2s of light instead of
130 µmol/m2s to induce growth of the petiole and leaf blade. IDD2 expression is reported to be
highest in the petiole (Winter et al., 2007), therefore, RNA was extracted from the petiole and leaf
blade to ensure that wild type expression would be high enough to prove knock-out in the mutant
lines. qPCR was done with six biological replicates for each mutant line and seven biological
replicates for Col-0 and three technical replicates for each biological replicate. Each sample was
amplified with an endogenous control set of primers for ACTIN7 and two sets of primers in IDD2;
one spanning Intron 2 that is upstream of all inserts and one within Exon 4, which is downstream
of the insert in idd2-2 and upstream of the inserts in idd2-1 and idd2-3 (see Figure 3.1). The idd21 mutants did not have significantly different expression for either primer set. The idd2-2 mutants
had an IDD2 expression level of 533% relative to Col-0 for the first primer set amplifying between
Exon 2 and 3 and an expression level of 5% relative to Col-0 for the second primer set in Exon 4
(p=0.00248 and p=0.0348, respectively), suggesting that idd2-2 produces increased amounts of a
- 42 -
truncated transcript. The idd2-3 mutants had an expression level of 0.37% relative to Col-0 for
the first primer set and an expression level of 1% relative to Col-0 for the second primer set
(p=0.0333 and p=0.0202, respectively), suggesting that idd2-3 is an idd2 loss-of-function mutant.
See Figure 3.2 and Figure 3.3 for expression data.
Gene Expression Relative to Columbia
(%)
Figure 3.1: Schematic diagram showing IDD2 gene structure, T-DNA insertions for idd2-1,
idd2-2 and idd2-3 mutant lines and qPCR primer locations. Boxes represent exons and lines
represent introns. Primers labelled 1 and 2 are AtIDD2E2F and AtIDD2E3R, respectively, and
primers labelled 3 and 4 are AtIDD2E4F and AtIDD2E4R, respectively.
*
1400
1200
1000
800
533
600
400
200
*
164
0.37
0
idd2-1
idd2-2
idd2-3
Figure 3.2: IDD2 expression in idd2-1, idd2-2 and idd2-3 mutants relative to expression in Col0. Six biological replicates were used for each line and IDD2 expression in Col-0 is shown by
the dashed line at 100%. Primers used were in exon 2 and exon 3 of IDD2. Stars indicate a
significant difference in expression from Col-0.
- 43 -
Gene Expression Relative to Columbia
(%)
800
700
600
500
400
300
200
*
34
*
100
5
1
0
idd2-1
idd2-2
idd2-3
Figure 3.3: IDD2 expression in idd2-1, idd2-2 and idd2-3 mutants relative to expression in Col0. Six biological replicates were used for each line and IDD2 expression in Col-0 is shown by
the dashed bar at 100%. Primers used were in exon 4 of IDD2. Stars indicate a significant
difference in expression from Col-0.
3.1.2 Analysis of IDD2 overexpression transgenic plants
To investigate the effects of overexpressing IDD2 at all developmental stages and in all
tissues, transgenic plants expressing IDD2 under the control of a constitutive cauliflower mosaic
virus 35S promoter were created using Gateway cloning and the floral dip procedure. The IDD2
cDNA sequence was amplified and cloned into the pB7WG2D vector from Gateway (Life
Technologies) (see Figure 3.4).
The finished vector was transformed into Agrobacterium
tumefaciens and into Arabidopsis via the floral dip method. Potential positive transformants were
selected by spraying seeds from floral dipped plants with glufosinate ammonium (BASTA) (Bayer
CropScience). Seed was collected from potential positive plants and planted out. These plants
were sprayed with BASTA to identify plants with the insert and seed was collected. Finally, this
seed was planted out to determine the zygosity of the corresponding parent.
- 44 -
35S∷IDD2
Figure 3.4: IDD2 overexpression construct containing the IDD2 ORF constitutively driven by a
35S promoter. This construct was created using Gateway cloning with pB7WG2D as a
destination vector (Karimi et al., 2002)
Sixteen potential overexpression lines were isolated. To ensure that these lines were
expressing elevated levels of IDD2 transcript, qPCR was done to quantify IDD2 expression. For
lines that were homozygous, RNA was extracted from leaves 5, 6 and 7 from three biological
replicates for each line. qPCR was done on these replicates, as well as three biological replicates
for Col-0 that was grown with these plants. Three technical replicates were done for each
biological replicate. Each sample was amplified with an endogenous control set of primers for
ACTIN7 and the primers in IDD2 exon 2 and 3 described above and in Figure 3.1. Twelve of the
sixteen potential overexpressing lines showed overexpression of IDD2 compared to Col-0, as
shown in Figure 3.5. Since only three replicates of each line were used and 16 comparisons were
done, t-tests are somewhat unreliable. Therefore, p-values are given without a Bonferroni
correction first. The lines with significantly higher expression are as follows: 35S::IDD2 1-4, 16, 5-4, 5-6, 8-6, 9-4, 15-1, 15-3, 19-1, 19-4, 21-4 and 22-3 (with p-values of 0.00374, 0.000496,
0.000874, 0.00175, 0.0232, 0.00122, 0.00675, 0.0121, 0.00636, 0.00352, 0.000521 and 0.0173,
- 45 -
respectively). These lines are considered overexpression transgenic plants from this point forward
and used in various phenotypic analyses. After Bonferroni corrections, only 35S::IDD2 1-6, 5-4,
5-6, 9-4 and 21-4 remained significant (with p-values of 0.00793, 0.0140, 0.0280, 0.0195 and
0.00833, respectively, shown by double stars in Figure 3.5). These lines were used preferentially
in further analysis but the other lines were not discounted because only three replicates were used
and the mean expression levels of these lines were so much higher than Col-0. The IDD2
expression of the 12 lines ranged from 1052% to 10375% of Col-0 expression and the average
expression among the twelve lines was 4961% of Col-0 expression. The lines that did not have
significantly different expression were 35S::IDD2 1-1, 9-4, 15-2 and 22-4 and these lines were not
used after this point.
- 46 -
30000
Expression relative to Col-0 (%)
25000
*
*
20000
15000
*
10000
*
*
*
*
*
5000
*
*
*
*
*
*
*
*
*
8-6
9-4
0
1-1
1-4
1-6
5-4
5-6
Col
9-5
15-1 15-2 15-3 19-1 19-4 21-4 22-3 22-4
35S::IDD2
Figure 3.5: IDD2 expression in 35S::IDD2 lines relative to expression in Col-0. Three biological
replicates were used for each line and primers used were in exons 2 and 3 of IDD2. Stars
indicate a difference in expression from Col-0 and are considered overexpression mutants from
this point forward.
3.2 IDD2 expression throughout development
IDD2 expression patterns were studied using the β-glucuronidase (GUS) assay to pinpoint
where IDD2 is expressed and help elucidate its function. A reporter construct with the IDD2
promoter driving expression of a GFP:GUS fusion protein (see Figure 3.6) was used to visualize
IDD2 expression patterns throughout development.
- 47 -
IDD2∷GFP:GUS
Figure 3.6: IDD2 reporter construct contains the IDD2 promoter up to 1.8 kb upstream of the
start codon driving expression of a GFP:GUS fusion reporter. This construct was created using
Gateway cloning with pBGWFS7 as a destination vector (Karimi et al., 2002).
A total of seven IDD2∷GFP:GUS lines from independent insertion events and wild-type
Col-0 plants were examined at 3, 6, 10, 15, 21, 30, 35, 37 and 49 days after germination (DAG).
Figure 3.7 shows two lines at each of the developmental time points studied. Col-0 plants never
showed any staining, so only one picture of Col-0 is included. Pictures from the 49 DAG time
point were not included since none of the lines showed any staining in the senesced leaves.
In vegetative tissues, reporter lines showed IDD2 expression in leaf vasculature,
hypocotyls, petioles and emerging lateral roots. In reproductive tissues, reporter lines show
expression in developing seeds, in the funiculus, and in branch points where pedicels join
inflorescences and siliques.
- 48 -
3 DAG – whole seedlings
- 49 -
Observations:
Staining appears in early
vasculature of cotyledons, hypocotyl and at nodes
and growing tip of the root. An image of control
Col-0 seedling is shown on the right. Scale bars
represent 0.5 mm.
6 DAG – whole seedlings
Observations: Same as 3 DAG. Staining
also appears at nodes of the root where lateral
roots will emerge. Scale bars represent 0.5
mm
15 DAG – aboveground tissue
Observations: Staining is very dark at the shoot apex and in petioles of leaves. Major and minor
veins are stained in young and older leaves. Scale bars represent 2 mm
- 49 -
10 DAG – whole seedlings
Observations: Staining appears very dark in petioles of
emerging true leaves, as well as in leaf vasculature and in tips
of newly formed lateral roots. Scale bars represent 2 mm.
21 DAG – aboveground tissue
30 DAG – siliques and flowers
- 50 -
Observations: Staining appears in vasculature and petioles as noted before. Scale bars represent
10 mm.
35 DAG – cauline leaves
Observations: Staining appears in leaf vasculature as noted before. In some lines, staining
becomes more diffuse in cauline leaves. Scale bars represent 2 mm.
- 50 -
Observations: Staining appears at nodes where
individual
flowers
emerge
from
the
inflorescence, where the pedicel joins the silique,
as well as in developing flowers and some
developing seeds. Scale bars represent 2 mm.
37 DAG – immature siliques
Observations: Staining appears at top and bottom of siliques as well as in
the funiculus (arrowheads) where seeds attach to the septum of the silique.
Scale bars represent 2 mm.
Observations: Staining appears in some
developing seeds and where silique attaches
to pedicel. Scale bars represent 0.5 mm.
- 51 -
35 DAG – maturing siliques
Figure 3.7: GUS staining of different tissues of IDD2∷GFP:GUS reporter plants at various developmental time points. Images of two
or three separate lines of reporters are shown here, however seven lines were used in the analysis and trends were the same in all lines.
Col-0 seedlings were stained at each step to check for non-specific staining. No staining was ever observed in Col-0 and one control
image is included at 3 DAG. Some final images have been stitched together from multiple pictures.
- 51 -
Later, IDD2:GFP:GUS were grown on ½ MS media as before and looked at just 1.5 DAG
to examine early growth (see Figure 3.8). Staining appears in cotyledons, at the shoot apical
meristem, in vasculature of the hypocotyl and at the root tip.
1.5 DAG – very early growth
Observations: Staining appears in the cotyledons, at
the shoot apex, in the vasculature of the hypocotyl and
at the root tip. Scale bar represents 0.5 mm
Figure 3.8: GUS staining of IDD2∷GFP:GUS reporter seedlings early in development. Images
of two separate lines of reporters are shown here, however seven lines were used in the analysis
and trends were the same in all lines. Col-0 seedlings were stained to check for non-specific
staining and no staining was observed.
Expression of IDD2 was also examined when IDD2∷GFP:GUS lines were grown on ½ MS
media with 1 μM IAA (indole-3-acetic acid or auxin) to see if the hormone had an effect on IDD2
expression patterns (see Figure 3.9). Seedlings were smaller and had more lateral roots at 7 DAG
due to the effect of exogenous auxin, but staining patterns resemble those observed on ½ MS media
in Figure 3.7.
- 52 -
7 DAG – 1 μM IAA
3 DAG – 1 μM IAA
Observations: Staining appears in vasculature, shoot apex,
hypocotyl and root tip. Scale bar represents 0.5 mm.
Observations: Staining appears in vasculature,
new leaves, shoot apex, hypocotyl, developing
lateral root primordia and root tip. Scale bar
represents 1 mm.
Figure 3.9: GUS staining of IDD2∷GFP:GUS reporter seedlings grown on 1 μM IAA. Six lines
were used in this analysis and trends were similar in all lines. Col-0 seedlings were stained at
each step to check for non-specific staining. No staining was ever observed in Col-0. Some
final images have been stitched together from multiple pictures.
It is important to note that when these reporter lines were examined for GFP
fluorescence, no fluorescence was observed.
3.3 IDD1 expression throughout development
Expression patterns of IDD1 were also studied using the β-glucuronidase (GUS) assay to
see if IDD1 expression patterns overlapped with IDD2 expression patterns, since IDD1 and IDD2
are closely related (Colasanti et al., 2006). A reporter construct with the IDD1 promoter driving
expression of a GFP:GUS fusion protein (see Figure 3.10) was used to visualize IDD1 expression
patterns throughout development.
- 53 -
IDD1∷GFP:GUS
Figure 3.10: IDD1 reporter construct contains the IDD1 promoter up to 2.5 kb upstream of the
start codon driving expression of a GFP:GUS fusion reporter. This construct was created using
Gateway cloning with pBGWFS7 as a destination vector (Karimi et al., 2002).
A total of seven IDD1∷GFP:GUS lines from independent insertion events and wild-type
Col-0 plants were examined at 3, 6, 10, 15, 21, 30, 35, 37 and 49 days after germination (DAG).
Figure 3.11 shows two lines at each of the developmental time points studied. Col-0 plants never
showed any staining, so only one picture of Col-0 is included in Figure 3.7. Pictures from the 49
DAG time point were not included since none of the lines showed any staining in the senesced
leaves.
In vegetative tissues, reporter lines showed IDD1 expression throughout cotyledons, at the
root tip, at the SAM and in midveins of leaves. In reproductive tissues, reporter lines show
expression in flowers and inflorescences, in developing seeds, and where siliques join pedicels.
- 54 -
3 DAG – whole seedlings
- 55 -
Observations:
Diffuse staining
throughout
the
cotyledons and at
the root tip. Scale
bars represent 0.5
mm.
6 DAG – whole seedlings
10 DAG – whole seedlings
Observations: Staining appears in cotyledons
and roots. Vasculature appears to be staining in
the cotyledons.
Scale bars represent 0.5 mm.
15 DAG – aboveground tissue
Observations: Staining is darkest in SAM and midvein of the leaf.
Scale bars represent 2 mm.
Observations: Staining appears in leaves, SAM and
root tips. Scale bars represent 2 mm.
21 DAG – aboveground tissue
Observations: Staining appears to be darkest in the midvein of leaves
and is also spread diffusely throughout leaves. Scale bars represent
10 mm.
- 55 -
30 DAG – siliques and flowers
35 DAG – maturing siliques
35 DAG – cauline leaves
- 56 Observations: Some staining at top and
bottom of siliques. Scale bars represent 2 mm.
Observations: Staining in vasculature and at tips of
cauline leaves. Scale bars represent 2 mm.
37 DAG – immature siliques
Observations:
Staining appears in the
inflorescences, flowers and siliques. Scale bars
represent 2 mm.
Observations: Staining in developing seeds, in the pedicel and where the silique joins the pedicel.
Scale bars represent 0.5 mm.
Figure 3.11: GUS staining of different tissues of IDD1∷GFP:GUS reporter plants at various developmental time points. Images of
two separate lines of reporters are shown here, however seven lines were used in the analysis and trends were the same in all lines.
Col-0 seedlings were stained at each step to check for non-specific staining. No staining was ever observed in Col-0. Some final
images have been stitched together from multiple pictures.
- 56 -
3.4 Root and Hypocotyl Growth Assays
3.4.1 idd2 mutant plants do not show a difference in germination or root growth
Since GUS staining revealed that IDD2 is expressed in hypocotyls and cotyledons early in
development, idd2 mutants were examined for differences in germination and early growth.
Twelve seeds each of Col-0, idd2-1, idd2-2 and idd2-3 were plated on ½ MS media with 2%
sucrose and photographed every 10 minutes for 72 hours. The photos were made into a time-lapse
video with 6 frames/second, such that 1 second of video is 1 hour of pictures. There was no
difference in germination times for any of the mutants compared to Col-0 (see Figure 3.12) but the
first root hairs of idd2-1 emerged significantly slower (p=0.00000587) as shown in Figure 3.13.
400
350
Time (minutes)
300
250
200
150
100
50
0
Col-0
idd2-1
idd2-2
idd2-3
Figure 3.12: Time to germination of Col-0, idd2-1, idd2-2 and idd2-3 seedlings. Seeds were
sown on 1/2 MS media with 2% sucrose and pictures were taken every 10 minutes for 72 hours.
Photos were examined and a time-lapse video was created with 1 second of video equal to 1 hour
in real time. Error bars represent standard deviation. Stars indicate a statistically significant
difference from Col-0.
- 57 -
1600
*
1400
Time (minutes)
1200
1000
800
600
400
200
0
Col-0
idd2-1
idd2-2
idd2-3
Figure 3.13: Time to first root hair emergence of Col-0, idd2-1, idd2-2 and idd2-3 seedlings.
Seeds were sown on 1/2 MS media with 2% sucrose and pictures were taken every 10 minutes
for 72 hours. Photos were examined and a time-lapse video was created with 1 second of video
equal to 1 hour in real time. Error bars represent standard deviation. Stars indicate a statistically
significant difference from Col-0.
To investigate whether loss of IDD2 expression affected root growth, wild type and idd2
mutant seedlings were grown on various concentrations of agar, sucrose, glucose and sorbitol.
Col-0, idd2-1, idd2-2 and idd2-3 seeds were sown on ½ MS media made with either 1%, 2% or
3% agar. Plates and seeds were imbibed at 4°C for 2 days and grown under standard conditions
in a vertical orientation. Root length was measured daily for 5 days starting one day after
germination. Root growth rates of mutants were compared to that of the wild-type by testing for
a type*time interaction with repeated measures ANOVA at each treatment. The idd2-1 plants
grew slower than Col-0 plants at 1%, 2% and 3% agar (p=0.00960, p=0.0156 and p=0.00120,
respectively). The growth rates for idd2-3 did not differ from Col-0 at any of the agar treatments
and only the growth rate on 3% agar differed between idd2-2 and Col-0 (p=0.0174) with the
- 58 -
idd2-2 plants growing slightly faster. See Figure 3.14, Figure 3.15 and Figure 3.16 for visual
representations.
1.4
Root length (cm)
1.2
1
0.8
*
Col-0
idd2-1
0.6
idd2-2
0.4
idd2-3
0.2
0
1
2
3
4
5
Days after Germination
Figure 3.14: Root growth of Col-0, idd2-1, idd2-2 and idd2-3 on 1/2 MS media made with 1%
agar. Root lengths were measured over 5 days starting one day after germination. Standard
deviation bars are shown. Stars represent a statistically significant difference in root growth rate
compared to Col-0.
- 59 -
1.4
Root length (cm)
1.2
1
0.8
Col-0
*
0.6
idd2-1
idd2-2
0.4
idd2-3
0.2
0
1
2
3
4
5
Days after Germination
Figure 3.15: Root growth of Col-0, idd2-1, idd2-2 and idd2-3 on 1/2 MS media made with 2%
agar. Root lengths were measured over 5 days starting one day after germination. Standard
deviation bars are shown. Stars represent a statistically significant difference in root growth rate
compared to Col-0.
1.4
Root length (cm)
1.2
1
*
0.8
Col-0
0.6
*
idd2-1
idd2-2
0.4
idd2-3
0.2
0
1
2
3
4
5
Days after Germination
Figure 3.16: Root growth of Col-0, idd2-1, idd2-2 and idd2-3 on 1/2 MS media made with 3%
agar. Root lengths were measured over 5 days starting one day after germination. Standard
deviation bars are shown. Stars represent a statistically significant difference in root growth rate
compared to Col-0.
- 60 -
Col-0, idd2-1, idd2-2 and idd2-3 seeds were sown on ½ MS media either without
supplemental sugar, with 2% sorbitol, with 5% sorbitol, with 2% sucrose, with 5% sucrose or with
2% glucose. Sorbitol treatments were included to alter the osmotic pressure of the media without
providing the seedlings with an energy source. Plates and seeds were imbibed at 4°C for 2 days
and grown under standard conditions in a vertical orientation. Root length was measured daily for
5 days starting one day after germination. Root growth rates were compared between mutants and
wild-type on each sugar treatment by testing for a type*time interaction term using repeated
measures ANOVA. On ½ MS media without supplemental sugar, the growth rates of idd2-1, idd22 and idd2-3 were not significantly different from Col-0 (data not shown). On ½ MS media with
2% sorbitol, only idd2-2 had a significantly different growth rate (p=0.0342. However, overall
root growth on sorbitol was almost negligible, so this finding was not interesting (data not shown).
On ½ MS media with 5% sorbitol, the growth rates of idd2-1, idd2-2 and idd2-3 were not
significantly different from Col-0 (data not shown). On ½ MS media with 2% sucrose, idd2-1
seedlings grew significantly slower than Col-0 (p<0.0001), while the growth rates of idd2-2 and
idd2-3 were not significantly different (see Figure 3.17). On ½ MS media with 5% sucrose, idd21 seedlings grew slower than Col-0 (p<0.0001) while idd2-3 growth rates did not differ from Col0 (see Figure 3.18). On ½ MS media with 2% glucose, idd2-1 and idd2-2 seedlings grew slower
than Col-0 (p<0.0001 and p<0.0001, respectively) while the growth rate of idd2-3 did not differ
from Col-0 (see Figure 3.19).
- 61 -
Root Length (cm)
2.5
2
*
1.5
Col-0
idd2-1
1
idd2-2
idd2-3
0.5
0
1
2
3
4
5
Days after Germination
Figure 3.17: Root growth of Col-0, idd2-1, idd2-2 and idd2-3 on 1/2 MS media with 2% sucrose
added. Root lengths were measured over 5 days starting one day after germination. Standard
deviation bars are shown. Stars represent a statistically significant difference in root growth rate
compared to Col-0.
Root Length (cm)
2.5
2
*
1.5
Col-0
idd2-1
1
idd2-2
idd2-3
0.5
0
1
2
3
4
5
Days after Germination
Figure 3.18: Root growth of Col-0, idd2-1, idd2-2 and idd2-3 on 1/2 MS media with 5% sucrose
added. Root lengths were measured over 5 days starting one day after germination. Standard
deviation bars are shown. Stars represent a statistically significant difference in root growth rate
compared to Col-0.
- 62 -
Root Length (cm)
2.5
2
1.5
*
*
1
Col-0
idd2-1
idd2-2
idd2-3
0.5
0
1
2
3
4
5
Days after Germination
Figure 3.19: Root growth of Col-0, idd2-1, idd2-2 and idd2-3 on 1/2 MS media with 2% glucose
added. Root lengths were measured over 5 days starting one day after germination. Standard
deviation bars are shown. Stars represent a statistically significant difference in root growth rate
compared to Col-0.
To investigate the dominance of the idd2-1 phenotype, seeds from a cross between Col-0
and idd2-1 were sown on ½ MS media with 2% sucrose. Root growth was examined to see if a
plant that was heterozygous for the idd2-1 allele would still have the slower growth phenotype as
previously observed.
Col-0, idd2-1 and Col-0 x idd2-1 cross seeds were sown on ½ MS media with 2% sucrose.
Plates and seeds were imbibed at 4°C for 2 days and grown under standard conditions in a vertical
orientation. Root length was measured daily for 5 days starting one day after germination. Root
growth rates were compared between mutants and wild-type by testing for a type*time interaction
term using repeated measures ANOVA. The idd2-1 seedlings’ roots grew slower compared to
those of Col-0 (p<0.0001), while Col-0 x idd2-1 seedlings’ roots grew at the same rate as Col-0
(see Figure 3.20), meaning that the idd2-1 allele is recessive.
- 63 -
4
3.5
Root Length (cm)
3
2.5
Col-0
2
*
1.5
idd2-1xCol-0
idd2-1
1
0.5
0
1
2
3
4
5
Days after Germination
Figure 3.20: Root growth of Col-0, idd2-1, and Col-0 x idd2-1 crosses on 1/2 MS media with 2%
sucrose added. Root lengths were measured over 5 days starting one day after germination.
Standard deviation bars are shown. Stars represent a statistically significant difference in root
growth rate compared to Col-0.
3.4.2 Allelism test shows that the idd2-1 allele phenotype is due to a possible
second, linked insertion
Mutants with the idd2-1 allele show slower root growth compared to Col-0 under a variety
of growth conditions, but do not have a difference in IDD2 expression. We suspected that the
idd2-1 mutants might have a second insertion located close to the IDD2 gene, such that the second
insertion was not lost during backcrossing. An allelism test was done by crossing idd2 mutants to
each other and testing for a difference in root growth rates.
Col-0, idd2-1, idd2-2, idd2-3, idd2-1 x idd2-2, idd2-1 x idd2-3 and idd2-2 x idd2-3 seeds
were sown on ½ MS media supplemented with 2% sucrose. Crosses were included to see whether
they showed the slower root growth phenotype previously observed in idd2-1. Plates and seeds
were imbibed at 4°C for 2 days and grown under standard conditions in a vertical orientation. Root
length was measured daily for 5 days starting one day after germination. Root growth rates were
- 64 -
compared between mutants and wild-type by testing for a type*time interaction term using
repeated measures ANOVA. The idd2-3 seedlings only had 4 days of measurements collected as
the plate they were growing on became contaminated. Only idd2-1 showed a difference in root
growth rate (p<0.0001). Since crosses showed normal growth and idd2-1 did not show a difference
in IDD2 expression, this indicates that the phenotype of the idd2-1 mutant is likely due to a second
T-DNA insertion close to the insertion in the 3’-UTR of IDD2.
In addition, when F2 progeny from a cross between Col-0 and idd2-1 were genotyped,
some plants that did not have the idd2-1 insertion did have the KanR gene (included in the T-DNA
insert), indicating that there is likely a second, linked T-DNA insertion. A second insertion close
to the insertion in IDD2 may not have been removed during back crossing, if it was near the IDD2
insertion, which was selected for at each generation. The second insertion is in an unknown gene
with an unknown function and it is likely that the slow root growth phenotype observed in idd2-1
plants is due to disruption of expression of the unknown gene rather than IDD2.
- 65 -
4
3.5
Root Length (cm)
3
2.5
Col-0
2
*
1.5
idd2-1
idd2-2
1
idd2-1 x idd2-2
0.5
0
2
3
4
5
6
Days after Germination
Figure 3.21: Root growth of Col-0, idd2-1, idd2-2 and idd2-1 x idd2-2 on 1/2 MS media with 2%
sucrose added. Root lengths were measured over 5 days starting two days after germination.
Standard deviation bars are shown. Stars represent a statistically significant difference in root
growth rate compared to Col-0.
4
3.5
Root Length (cm)
3
2.5
Col-0
2
*
1.5
idd2-1
idd2-3
1
idd2-1 x idd2-3
0.5
0
2
3
4
5
6
Days after Germination
Figure 3.22: Root growth of Col-0, idd2-1, idd2-3 and idd2-1 x idd2-3 on 1/2 MS media with 2%
sucrose added. Root lengths were measured over 5 days starting two days after germination.
Standard deviation bars are shown. Stars represent a statistically significant difference in root
growth rate compared to Col-0.
- 66 -
4
3.5
Root Length (cm)
3
2.5
Col-0
2
idd2-2
1.5
idd2-3
1
idd2-2 x idd2-3
0.5
0
2
3
4
5
6
Days after Germination
Figure 3.23: Root growth of Col-0, idd2-2, idd2-3 and idd2-2 x idd2-3 on 1/2 MS media with 2%
sucrose added. Root lengths were measured over 5 days starting two days after germination.
Standard deviation bars are shown. Stars represent a statistically significant difference in root
growth rate compared to Col-0.
3.4.3 IDD2 overexpression does not affect hypocotyl elongation or root growth
Recently, it was reported that a 35S::IDD2 line created by another lab showed longer
hypocotyls especially when grown on gibberellic acid (GA) in normal light conditions (Fukazawa
et al., 2014). To see if this phenomenon occurred in the overexpression lines created here, Col-0,
idd2-2, idd2-3 and 35S::IDD2 15-1 seeds were sown on ½ MS media with 0, 1 or 10 µM GA and
placed in the growth chamber with light for three days after germination. Later, Col-0, 35S:IDD2
5-4, 19-1 and 21-4 seeds were sown on the same media but left to grow for 6 days instead of 3
days. In both experiments, no significant differences in hypocotyl length were observed (see
Figure 3.24).
Additionally, Col-0, idd2-2, idd2-3, 35S::IDD2 5-4, 15-1, 19-1 and 21-4 seeds were grown
on ½ MS media with 0, 1 or 10 µM GA in the growth chamber in darkness for six days after
germination to examine whether darkness exaggerated any hypocotyl phenotype. Seedlings from
- 67 -
one 35S::IDD2 line (15-1) had significantly shorter hypocotyls compared to Col-0 at 1 and 10 µM
of GA (p=0.0297 and 0.000220, respectively) (see Figure 3.25). For all other 35S::IDD2 lines, no
differences in hypocotyl lengths in dark grown plants were observed, therefore, this is not
considered a true phenotype for IDD2 overexpression plants.
During these experiments, another phenotype was observed. 35S::IDD2 seedlings seemed
to be weaker compared to Col-0, idd2-2 and idd2-3. Many 35S::IDD2 seedlings did not progress
past their cotyledons opening and did not see full cotyledon expansion or root elongation. While
there are often a few seedlings in any line that will experience this failure to continue growth, in
the case of the overexpression seedlings, almost all of the seedlings showed this phenotype. When
35S::IDD2 5-4, 15-1, 19-1, and 21-4 seedlings were grown on ½ MS media, a significantly higher
proportion of 35S::IDD2 15-1 and 19-1 seedlings showed difficulty in postgerminative growth
compared to Col-0 seedlings (p=0.00497 and p=0.0451, respectively) (Figure 3.27). Photos are
shown in Figure 3.26.
- 68 -
0.25
Hypocotyl Length (cm)
0.2
0.15
0 µM GA
1 µM GA
0.1
10 µM GA
0.05
0
Col-0
idd2-2
idd2-3
35S::IDD2 15-1
Figure 3.24: Hypocotyl lengths at 3 days after germination of Col-0, idd2-2, idd2-3 and
35S::IDD2 seedlings grown on ½ MS media supplemented with 0, 1 or 10 µM gibberellic acid.
Error bars indicate standard deviation and a star shows a significant difference from Col-0 at the
same treatment.
1.6
Hypocotyl length (cm)
1.4
1.2
1
*
0.8
*
0 µM GA
0.6
1 µM GA
0.4
10 µM GA
0.2
0
Col-0
idd2-2
idd2-3
15-1
Col-0
35S::IDD2
5-4
19-1
21-4
35S::IDD2
Experiment 1
Experiment 2
Figure 3.25: Hypocotyl lengths of Col-0, idd2-2, idd2-3 and 35S:IDD2 seedlings grown on 1/2
MS media 0, 1 or 10 µM gibberellic acid (GA) in the dark for 6 days after germination. This
experiment was grown at two separate times; Col-0, idd2-2, idd2-3 and 35S::IDD2 15-1 were
grown together in Experiment 1 and Col-0, 35S::IDD2 5-4, 19-1 and 21-4 were grown together
in Experiment 2. Error bars represent standard deviation and stars indicate a significant
difference from Col-0 at the same treatment and in the same experiment.
- 69 -
A) 0 µM GA
B) 1 µM GA
C) 10 µM GA
Col-0
idd2-2
- 70 -
idd2-3
35S::IDD2
Figure 3.26: Col-0, idd2-2, idd2-3 and 35S::IDD2 15-1 seedlings grown on seedlings grown on ½ MS media supplemented with 0, 1 or 10
µM gibberellic acid for 6 days after germination. Column A) shows 0 µM GA, column B) shows 1 µM GA and column C) shows 10 µM
GA. Col-0, idd2-2, idd2-3 and 35S::IDD2 seedlings are shown in Rows 1, 2, 3 and 4, respectively. Note weakness of 35S::IDD2
seedlings at all treatments.
- 70 -
*
1.00
Proportion of Seedlings
0.90
0.80
*
0.70
0.60
0.50
normal
0.40
delayed
0.30
0.20
0.10
0.00
Col-0
idd2-3
5-4
15-1
19-1
21-4
35S::IDD2
Figure 3.27: Proportion of Col-0, idd2-3, 35S::IDD2 5-4, 15-1, 19-1 and 21-4 experiencing
normal or delayed growth on ½ MS media for 6 DAG. Proportion of seedlings with normal
growth is in blue, while proportion of seedlings with delayed growth is in red. Stars indicate a
difference in proportion compared to Col-0 seedlings.
After observing the stunted growth of many 35S::IDD2 seedlings, overexpression
seedlings were grown on media containing sucrose to see whether sucrose would help the seedlings
to progress past the cotyledon stage. The Col-0, idd2-1, idd2-2, idd2-3 and 35S::IDD2 15-1 seeds
were sown on ½ MS media supplemented with 2% sucrose. Plates and seeds were imbibed at 4°C
for 2 days and grown under standard conditions in a vertical orientation. Root length was measured
daily for 5 days starting one day after germination. Root growth rates were compared between
mutants and wild-type by testing for a type*time interaction term using repeated measures
ANOVA. The idd2-1 seedlings had a significantly slower root growth rate compared to Col-0
(p<0.0001), while the root growth rate idd2-2, idd2-3 and 35S:IDD2 seedlings did not (see Figure
3.28). The 35S::IDD2 seedlings were able to grow normally and did not experience the reduced
growth observed on ½ MS media, suggesting that sucrose was able to rescue the stunted growth
of the overexpression seedlings.
- 71 -
4
3.5
Root Length (cm)
3
2.5
Col
idd2-1
2
*
1.5
idd2-2
idd2-3
1
35S::IDD2 15-1
0.5
0
2
3
4
5
6
Days after Germination
Figure 3.28: Root growth of Col-0, idd2-1, idd2-2, idd2-3 and 35S::IDD2 seedlings on 1/2 MS
media with 2% sucrose added. Root lengths were measured over 5 days starting two days after
germination. Standard deviation bars are shown. Stars represent a statistically significant
difference in root growth rate compared to Col-0.
3.5 Morphology of idd2 and 35S::IDD2 plants
3.5.1 Petiole lengths and leaf size in idd2 plants do not differ from Col-0
Since GUS assays showed high IDD2 expression in the petioles, possible differences in
petiole lengths, leaf lengths and leaf emergence angles were investigated. The Col-0, idd2-2 and
idd2-3 seeds were sown on soil and grown under a low light condition of 40 μmol/m2s to
exacerbate any possible petiole phenotypes. Petiole lengths, leaf lengths and leaf emergence angle
were measured at 10 DAG. No differences were observed between idd2-2 or idd2-3 compared to
Col-0 (data not shown).
3.5.2 Lateral roots of idd2 and 35S::IDD2 plants do not differ from Col-0
Since IDD2::GFP:GUS reporter plants showed an interesting IDD2 expression pattern in
lateral root primordia, loss-of-function and overexpression mutants were examined for differences
- 72 -
in lateral root growth. It was hypothesized that there would be a difference in the number or length
of lateral roots in knockout or overexpression mutants. The Col-0, idd2-3, 35S::IDD2 5-4, 19-1
and 21-4 seeds were sown on ½ MS media and grown for 10 days. Lateral roots per plant were
counted and the longest lateral root was measured for each seedling. No significant differences
between mutants and Col-0 plants were observed (data not shown).
3.5.3 35S::IDD2 plants have pale leaves
The Col-0, idd2-2, idd2-3, 35S::IDD2 5-4, 19-1 and 21-4 seeds were sown on ½ MS media
supplemented with 0 or 10 µM indole-3-acetic acid (IAA), a plant-derived auxin. At 8 DAG,
seedlings were examined for differences in their response to auxin, particularly their leaf colour
(see Figure 3.29). Col-0 seedlings have green cotyledons and appear to have abundant root growth
on ½ MS media and have yellow cotyledons on media with auxin. 35S::IDD2 seedlings appear to
have smaller, yellow cotyledons and reduced root growth compared to Col-0 and often did not
progress past the cotyledon stage on ½ MS media. On auxin media, 35S::IDD2 seedlings look
similar to Col-0.
- 73 -
35S::IDD2 5-4
35S::IDD2 19-1
10 µM IAA
0 µM IAA
Col-0
Figure 3.29: Col-0, 35S::IDD2 5-4 and 35S::IDD2 19-1 seedlings grown on 0 and 10 μM IAA
for 8 DAG. White arrowheads point to examples of seedlings that have failed to progress past
the cotyledon stage. Scale bars represent 1 cm.
3.5.4 35S::IDD2 seeds have altered morphology
Since 35S::IDD2 lines seem to have trouble progressing past the cotyledon stage of growth,
Col-0, idd2-3, 35S::IDD1, 35S::IDD2 5-4, 15-1 and 19-1 seeds were examined with a scanning
electron microscope to see if there were any differences in seed morphology (see Figure 3.30).
35S::IDD1 seeds were included as it was determined previously that they showed altered seed coat
patterning (LeBlanc, 2012). The idd2-3 seeds did not show any visible differences compared to
- 74 -
Col-0. The 35S::IDD2 lines showed altered seed coats with some cells appearing crumpled.
Col-0
35S::IDD2 5-4
idd2-3
35S::IDD1
35S::IDD2 15-1
35S::IDD2 19-1
Figure 3.30: Col-0, idd2-3, 35S::IDD1, 35S::IDD2 5-4, 15-1 and 19-1 seeds viewed with
scanning election microscope. Scale bars represent 300 μm.
To investigate whether the altered seed coat in 35S::IDD2 seeds was due to differences in
mucilage deposition, imbibed seeds were stained with ruthenium red stain. 35S::IDD2 seeds did
not appear to have more or less mucilage compared to Col-0 (data not shown).
We also hypothesized that the altered seed coat in 35S::IDD2 seeds might be due to a
difference in seed oil content, so a sedimentation assay was done (adapted from Focks and
Benning, 1998). The assay sediments seeds based on their oil content in layers of varying ratios
of 1,6-dibromohexane, 1-bromohexane and mineral oil (described in Materials and Methods
section). The 35S::IDD2 overexpression seeds sedimented to the same layer as Col-0 seeds,
indicating that there was no difference in seed oil content (data not shown). Siliques of
- 75 -
35S::IDD2 plants were also examined for differences in morphology that might explain the
altered seed phenotype, but no differences from Col-0 siliques were found (data not shown).
3.6 Leaf Starch, Sucrose and Glucose Concentrations
Several members of the IDD gene family have been implicated in regulating carbon flow
and assimilation (Coneva et al., 2007, 2012), thus we wondered whether IDD2 also played a role
in controlling carbon flow. Starch, glucose and sucrose were quantified from leaves of idd2 lossof-function mutants and 35S::IDD2 overexpression lines before and after the floral transition to
see whether differences were present or not.
3.6.1 Pre-floral transition leaf starch, sucrose and glucose concentrations do not
differ in idd2 mutants
Starch, glucose and sucrose were extracted from three plants each of Col-0, idd2-1, idd2-2
and idd2-3 lines. The plants were grown under standard conditions and above-ground tissue was
collected just before the floral transition. Samples were collected when the day began and the
lights in the growth chamber turned on (ZT0) and when the night began and the lights turned off
sixteen hours later (ZT16). The idd2-1, idd2-2 and idd2-3 did not show any significant differences
from Col-0, at the same time point, in pre-floral transition leaf starch concentrations (Figure 3.31).
Glucose was extracted from the same plants as mentioned above. The idd2-1, idd2-2 and
idd2-3 did not show any significant differences from Col-0, at the same time point, in pre-floral
transition leaf glucose concentrations (Figure 3.32).
Sucrose was extracted from the same plants as mentioned above. The idd2-1, idd2-2 and
idd2-3 did not show any significant differences from Col-0, at the same time point, in pre-floral
transition leaf sucrose concentrations (Figure 3.33).
- 76 -
Starch concentration (mg
glucose/g leaf fresh
weight)
12
10
8
6
ZT0
4
ZT16
2
0
Col-0
idd2-1
idd2-2
idd2-3
Figure 3.31: Starch concentration in Col-0 and idd2 Arabidopsis leaves harvested prior to the
floral transition at dawn (ZT0) and nightfall (ZT16). Aboveground tissue was harvested for each
of three biological replicates and three technical replicates per biological replicate were used for
absorbance readings. Error bars indicate standard deviation of the biological replicates and a star
indicates a significant difference from Col-0 at that time point.
Gucose (mg glucose/g fresh
weight)
0.45
0.4
0.35
0.3
0.25
ZT0
0.2
ZT16
0.15
0.1
0.05
0
Col-0
idd2-1
idd2-2
idd2-3
Figure 3.32: Glucose concentration in Col-0 and idd2 Arabidopsis leaves harvested prior to the
floral transition at dawn (ZT0) and nightfall (ZT16). Aboveground tissue was harvested for each
of three biological replicates and three technical replicates per biological replicate were used for
absorbance readings. Error bars indicate standard deviation of the biological replicates and a star
indicates a significant difference from Col-0 at that time point.
- 77 -
Sucrose Concentration (mg
sucrose/g fresh weight)
0.3
0.25
0.2
ZT0
0.15
ZT16
0.1
0.05
0
Col-0
idd2-1
idd2-2
idd2-3
Figure 3.33: Sucrose concentration in Col-0 and idd2 Arabidopsis leaves harvested prior to the
floral transition at dawn (ZT0) and nightfall (ZT16). Aboveground tissue was harvested for each
of three biological replicates and three technical replicates per biological replicate were used for
absorbance readings. Error bars indicate standard deviation of the biological replicates and a star
indicates a significant difference from Col-0 at that time point.
3.6.2 idd2-3 mutants sometimes show reduced post-floral transition leaf starch
and glucose concentrations
Starch was extracted from six plants each of Col-0, idd2-1, idd2-2 and idd2-3 lines. The
plants were grown under standard conditions and three mature leaves were collected just after the
floral transition when inflorescences were just visible (19 days after germination). Samples were
collected when the day began and the lights in the growth chamber turned on (ZT0), 8 hours later
(ZT8) sixteen hours later when the night began (ZT16).
At ZT0, idd2-1, idd2-2 and idd2-3 did not show significant differences in starch
concentration compared to Col-0. At ZT8, idd2-3 had a lower leaf starch concentration compared
to Col-0 (p=0.0139) and idd2-1 and idd2-2 were not significantly different from Col-0. At ZT16,
none of the lines were significantly different from Col-0. Data is shown in Figure 3.34.
At ZT0, idd2-1, idd2-2 and idd2-3 did not show significant differences in glucose
concentration compared to Col-0. At ZT8, idd2-3 had a significantly lower glucose concentration
- 78 -
compared to Col-0 (p=0.0155), while idd2-1 and idd2-2 were not significantly different. At ZT16,
none of the lines were significantly different from Col-0 (Figure 3.35). At ZT0, ZT8 and ZT16,
leaf sucrose concentrations of the mutants were not different from Col-0 (Figure 3.36).
Starch concentration (mg
glucose/g leaf fresh weight)
12
10
8
ZT0
6
*
4
ZT8
ZT16
2
0
Col-0
idd2-1
idd2-2
idd2-3
Figure 3.34: Starch concentrations in Col-0 and idd2 Arabidopsis leaves harvested after the floral
transition at ZT0, ZT8 and ZT16. Three mature leaves were harvested for each of six biological
replicates and three technical replicates per biological replicate were used for absorbance
readings. Error bars indicate standard deviation of the biological replicates and a star indicates a
significant difference from Col-0 at the corresponding time point. Starch is measured as mg
glucose/ g leaf fresh weight.
Glucose concentration (mg
glucose/g leaf fresh weight)
0.25
0.2
*
0.15
ZT0
ZT8
0.1
ZT16
0.05
0
Col-0
idd2-1
idd2-2
idd2-3
Figure 3.35: Glucose concentrations in Col-0 and idd2 Arabidopsis leaves harvested after the
floral transition at ZT0, ZT8 and ZT16. Three mature leaves were harvested for each of six
biological replicates and three technical replicates per biological replicate were used for
absorbance readings. Error bars indicate standard deviation of the biological replicates and a star
indicates a significant difference from Col-0 at the corresponding time point.
- 79 -
Sucrose concentration (mg
glucose/g leaf fresh weight)
0.3
0.25
0.2
ZT0
0.15
ZT8
ZT16
0.1
0.05
0
Col-0
idd2-1
idd2-2
idd2-3
Figure 3.36: Sucrose concentrations in Col-0 and idd2 Arabidopsis leaves harvested after the
floral transition at ZT0, ZT8 and ZT16. Three mature leaves were harvested for each of six
biological replicates and three technical replicates per biological replicate were used for
absorbance readings. Error bars indicate standard deviation of the biological replicates and a star
indicates a significant difference from Col-0 at the corresponding time point.
3.6.3 idd2 and 35S::IDD2 plants do not show differences in post-floral
transition leaf starch, glucose and sucrose concentrations
Since a previous experiment showed a difference in leaf starch and leaf glucose at the ZT8
time point, another experiment to measure these compounds was done to confirm the previous
result and to investigate whether 35S∷IDD2 lines had altered starch, glucose and sucrose levels.
Starch, glucose and sucrose were extracted from ten plants each of Col-0, idd2-3, 35S∷IDD2 5-4
and 35S∷IDD2 21-4 lines and eight plants from a 35S∷IDD2 x idd2-3 cross. The plants were
grown under standard conditions and three mature leaves were collected after the floral transition
when inflorescences were just visible (19 days after germination). Samples were collected at dawn
when the lights in the growth chamber turned on (ZT0), 8 hours later (ZT8) sixteen hours later
when the night began (ZT16).
At ZT0, the starch concentrations of all of the lines were not different from Col-0. At ZT8,
the 35S∷IDD2 x idd2-3 cross had significantly higher starch compared to Col-0 (p=0.00165).
- 80 -
However, the magnitude of this difference in starch concentrations was quite small, so the
biological relevance of this difference is questionable. At ZT16, there was no difference in starch
concentrations between the lines and Col-0 (Figure 3.37).
At ZT0, ZT8 and ZT16, the glucose concentrations of all of the lines were not different
from Col-0 (Figure 3.38). At ZT0, ZT8 and ZT16, the sucrose concentrations of all of the lines
were not different from Col-0 (Figure 3.39).
Starch concentration (mg
glucose/ g leaf fresh weight)
14
12
10
ZT0
8
6
*
ZT8
ZT16
4
2
0
Col-0
idd2-3
35S::IDD2 5-4
35S::IDD2 21-4
35S::IDD2 x idd2-3
Figure 3.37: Starch concentrations in Col-0, idd2-3, 35S∷IDD2 5-4, 35S∷IDD2 21-4 and
35S∷IDD2 x idd2-3 leaves harvested after the floral transition at ZT0, ZT8 and ZT16. Three
mature leaves were harvested for each of ten biological replicates and three technical replicates
per biological replicate were used for absorbance readings. Error bars indicate standard
deviation of the biological replicates and a star indicates a significant difference from Col-0 at
the corresponding time point. Starch is measured as mg glucose/ g leaf fresh weight.
- 81 -
Glucose concentration (mg
glucose / g leaf fresh weight)
0.6
0.5
0.4
ZT0
0.3
ZT8
0.2
ZT16
0.1
0
Col-0
idd2-3
35S::IDD2 5-4
35S::IDD2 21-4
35S::IDD2 x idd2-3
Figure 3.38: Glucose concentrations in Col-0, idd2-3, 35S∷IDD2 5-4, 35S∷IDD2 21-4 and
35S∷IDD2 x idd2-3 leaves harvested after the floral transition at ZT0, ZT8 and ZT16. Three
mature leaves were harvested for each of ten biological replicates and three technical replicates
per biological replicate were used for absorbance readings. Error bars indicate standard
deviation of the biological replicates and a star indicates a significant difference from Col-0 at
the corresponding time point. Glucose is measured as mg glucose/ g leaf fresh weight.
Sucrose concentration (mg
sucrose / g leaf fresh weight)
0.4
0.35
0.3
0.25
ZT0
0.2
ZT8
0.15
ZT16
0.1
0.05
0
Col-0
idd2-3
35S::IDD2 5-4
35S::IDD2 21-4 35S::IDD2 x idd2-3
Figure 3.39: Sucrose concentrations in Col-0, idd2-3, 35S∷IDD2 5-4, 35S∷IDD2 21-4 and
35S∷IDD2 x idd2-3 leaves harvested after the floral transition at ZT0, ZT8 and ZT16. Three
mature leaves were harvested for each of ten biological replicates and three technical replicates
per biological replicate were used for absorbance readings. Error bars indicate standard
deviation of the biological replicates and a star indicates a significant difference from Col-0 at
the corresponding time point. Sucrose is measured as mg sucrose/ g leaf fresh weight.
In this experiment, idd2-3 mutants did not have reduced leaf starch and glucose
concentrations at ZT8, as previously observed, suggesting the difference observed was due to
random chance and is not due to loss of IDD2 expression.
- 82 -
3.7 Flowering Time
3.7.1 idd2 mutants do not differ in long day flowering time
Since the founding member of the IDD gene family is a floral regulator in Zea mays
(Colasanti et al., 1998), we wondered whether IDD2 had a role in flowering time regulation. To
investigate this possibility, time to flowering was recorded for idd2 mutants and wild type plants
by counting both the number of leaves to be produced before inflorescence emergence and the
number of days from germination until inflorescence emergence. These plants were grown under
standard conditions and 16-hour days. Mutants did not differ from wild type plants in days to
flowering or leaf number at flowering (data not shown).
3.7.2 idd2 and 35S:IDD2 mutants do not differ in short day flowering time
A recent study reported 35S::IDD2 plants exhibiting an early flowering phenotype under
short day conditions, both in days to flowering and leaf number at flowering (Fukazawa et al.,
2014). This study used only one overexpression line and did not quantitatively test an idd2 lossof-function line. To examine flowering time in idd2 mutants and 35S::IDD2 lines, 16 seeds each
of Col-0, idd2-2, idd2-3, 35S::IDD2 5-4, 8-6, 9-4, 15-1, 19-1, 21-4, and 22-3 were sown on soil
and grown under standard conditions except that they received 10 hours of light and 14 hours of
darkness each day. Days to flowering was considered the day that an inflorescence bud appeared
and was measured in days after germination (DAG). Rosette leaves were counted at this point as
well. Flowering time did not differ from Col-0 for idd2-2, idd2-3 for any of the 35S∷IDD2 lines
tested.
- 83 -
Chapter 4:
Discussion
4.1 IDD2 is expressed at auxin maxima
Examining IDD2::GFP:GUS reporter lines revealed a highly specific and interesting
expression pattern corresponding with areas of high auxin concentrations. Staining was observed
in the hypocotyl, petioles of all leaves, leaf vasculature, the shoot apex, the root tip, lateral root
primordia, the pedicel where it joins the inflorescence and silique, developing seeds and the
funiculus (see Figure 4.3 for a schematic representation). Auxin is produced or transported to each
of these tissues to promote division or elongation. For example, in the roots, auxin is transported
from the root tip to the two lateral root founder cells of the pericycle to promote divisions required
to form the lateral root primordia (Casimiro et al., 2001). This maxima matches the pattern
observed in the IDD2∷GFP:GUS lines, which showed intense staining in the growing root tip and
the lateral root primordia as early as 6 DAG before the lateral root primordia broke through the
surface of the main root (Figure 3.7). While auxin promotes division in roots, it promotes
hypocotyl elongation in the shoot. When seedlings are treated with the auxin transport inhibitor
NPA, hypocotyl elongation is severely compromised (Jensen et al., 1998). The IDD2 reporter
lines showed staining in hypocotyls at 3, 6 and 10 DAG, suggesting that IDD2 expression matches
the auxin maximum in the hypocotyl. Just above the hypocotyl, the SAM also has high auxin
concentrations, especially in the central zone and primordia (Vernoux et al., 2010).
The
IDD2∷GFP:GUS reporter lines showed staining in the shoot apex, although seedlings were too
small to determine whether staining localized specifically to the central zone and primordia or not.
In leaves, auxin is involved in vasculature development with auxin maxima marking future vein
locations (Avsian-Kretchmer et al., 2002; Turner and Sieburth, 2003) and while auxin has not been
proven to be involved in petiole growth, auxin resistance1 mutants do not respond to auxin stimuli
- 84 -
and have shorter petioles compared to wild type plants, suggesting a role in petiole growth (Lincoln
et al., 1990). The IDD2 reporter lines showed staining in both petioles and leaf vasculature,
corresponding with these auxin maxima. Lastly, auxin is involved in post-fertilization fruit
growth. Once fruit is mature, valve margins (between valves and replum; see Figure 4.1) require
a reduction in auxin levels or response in order for dehiscence and seed dispersal to occur (Sorefan
et al., 2009). IDD2 expression was observed in some areas at the top and bottom of siliques while
seeds were developing but signal reduced as development progressed, similar to the way auxin
would become reduced in these areas. During seed development, expression was also present in
another silique structure called the funiculus, which attaches seeds to the silique septum (Figure
4.1). While this was not discussed in literature, it is logical to suppose that the funiculi would have
auxin present while seeds are maturing and then also experience an auxin minimum to allow seeds
to separate from the replum. Overall, it is evident that IDD2 expression patterns correspond with
areas of high auxin concentration.
Figure 4.1: Immature and mature siliques showing various tissues. Created based on Dardick
and Callahan, 2014.
- 85 -
4.2 IDD2 expression patterns differ from previous reports
Examination of the IDD2::GFP:GUS reporter lines showed a similar expression pattern to
the patterns obtained from microarrays on the Arabidopsis eFP Browser from the BioAnalytical
Resource, shown in Figure 4.2 (Winter et al., 2007), but also revealed several key differences
(Figure 4.3). The eFP Browser shows highest IDD2 expression in the hypocotyl, petioles of a fullgrown stage 7 leaf and the vegetative shoot apex, while rosette leaves, cauline leaves, senescent
leaves, cotyledons, roots and the root apex during and after the floral transition are reported to
have moderate expression. The IDD2::GFP:GUS reporter lines examined in this study provide a
more detailed look at IDD2 expression in different tissues throughout plant development. High
expression was observed in hypocotyl, petioles of all leaves and the shoot apex, as previously
reported, but expression was also high in leaves, specifically in vasculature, and in roots at the root
tip and lateral root primordia. Staining was not observed in senescing leaves, contrary to previous
reports, but was observed in floral organs such as the pedicel where it joins the inflorescence and
silique, developing seeds and the funiculus. These observations were useful in pinpointing an
expression pattern to give a more specific idea of where IDD2 acts in the plant. It is important to
remember that this expression pattern should be confirmed with a more reliable method, such as
mRNA in situ hybridization, since creating a reporter construct relies on the assumption that the
promoter region is chosen to drive the reporter is the correct promoter length. The expression
pattern observed with GUS staining provides a good idea of tissues that might be altered in idd2
loss-of-function and 35S::IDD2 overexpression lines.
- 86 -
Figure 4.2: Developmental expression heat map for IDD2 from BioAnalytical Resource (Winter
et al., 2007). Yellow indicates low expression, while red indicates high expression.
- 87 -
Figure 4.3: Developmental expression heat map for IDD2 created from examining
IDD2::GFP:GUS reporter plants. Darker blue corresponds to darker staining in original
experiments.
4.3 Tissues with high IDD2 expression are not phenotypically different in
idd2 loss-of-function mutants
Based on the expression patterns observed with the reporter lines, idd2 knockout mutants
and 35S::IDD2 overexpression lines were tested for phenotypic differences in the areas of high
IDD2 expression. Petioles were examined for differences in length and the angle between leaves
but no differences were found. No differences were observed in germination times, root hair
- 88 -
emergence or root growth rates. Since high IDD2 expression was observed in lateral root
primordia, loss-of-function and overexpression mutants were examined for differences in lateral
root numbers and lengths, but no consistent differences were observed. Some overexpression lines
had less lateral roots compared to Col-0 but the phenotype was not consistent. Overexpression
lines also showed delayed postgerminative growth compared to wild-type plants. When grown on
½ MS plates, they would often arrest growth after cotyledons expanded, however, normal growth
was observed when seedling were grown on ½ MS media supplemented with 2% sucrose,
indicating that providing an alternative carbon source can complement the retarded growth.
4.4 IDD2 and IDD1 show similar expression patterns
IDD2 and IDD1 are both members of the INDETERMINATE DOMAIN family and make
up the ENHYDROUS clade in phylogenetic reconstructions of the family (Colasanti et al., 2006).
When IDD2 and IDD1 nucleotide sequences are aligned using the EMBOSS Water pairwise
sequence alignment tool (www.ebi.ac.uk/Tools/psa/emboss_water/nucleotide.html), they show
59.6% identity and similarity with 27.7% gaps, while their protein sequences show 68.1% identity,
75.8% similarity and 12.5% gaps. IDD1 also shows a similar expression pattern to IDD2 as
evidenced by the GUS assays performed (Figure 4.4 and Figure 4.3). IDD1 was expressed in
cotyledons, root tips and developing seeds similar to IDD2. There were some differences in the
expression patterns though, as IDD1 was expressed in inflorescences and flowers much more than
IDD2. IDD1 also seemed to have more diffuse expression throughout leaves, whereas IDD2 was
expressed strictly in vasculature and petioles. In addition, IDD1 did not have expression in lateral
root primordia in the same way that IDD2 did. Nevertheless, expression patterns were generally
similar. This expression overlap combined with the relatively similar protein sequences lead to a
speculation that IDD2 and IDD1 may have similar functions and that one may be able to
- 89 -
complement the functions of the other in loss-of-function mutants. This would explain why idd2
knockout mutants do not have obvious phenotypes. It is suspected that an idd1 idd2 double lossof-function mutant would have more obvious phenotypes, as this was observed in the idd14 idd15
IDD16i triple mutant. Each single mutant had a subtle phenotype, but the triple mutant had more
obvious deficiencies (Cui et al., 2013). An insertional mutant with a T-DNA insertion within the
coding region of IDD1 is not available, so an IDD1i RNA interference knockdown construct was
created by a previous graduate student and was transformed into Col-0, idd2-2 and idd2-3 plants.
Positive transformants were obtained, however, when IDD1 expression was quantified by qPCR,
IDD1 was still being expressed at wild type levels. Thus, a double mutant could not be made
successfully in this project. Fukazawa et al. (2014) state that they have an idd1 idd2 double mutant
(under the name idd1 gaf1) but the idd1 mutant has a T-DNA insertion in its promoter and only
has partially reduced expression levels. Little information is given as to which tissues expression
was tested in as well. The double mutant discussed in Fukazawa et al. (2014) had a late flowering
time phenotype and had slightly shorter hypocotyls when grown on GA and the researchers
concluded that IDD1 and IDD2 are involved in GA signaling. A critical review of this study is
presented in the next section.
- 90 -
Figure 4.4: Developmental expression heat map for IDD1 created from examining
IDD1::GFP:GUS reporter plants. Darker blue corresponds to darker staining in original
experiments.
4.5 Comparisons to a recent IDD2 paper suggest inconsistencies
Recently, Fukazawa et al. (2014) published a paper about the association of DELLA
proteins and GAI-ASSOCIATED FACTOR1 (GAF1), also known as IDD2, and their role in
gibberellic acid homeostasis and signaling. They show that IDD2 associates with GIBBERELLIC
ACID INSENSITIVE (GAI) through bimolecular fluorescence complementation (BiFC) in
Arabidopsis culture cells. They also show a single IDD2::GFP:GUS reporter line showing IDD2
expression in root tips, shoot apices and petioles, however, the pattern does not match the
distinctive expression at auxin maxima pattern that was observed in this study (Figure 3.7). A
- 91 -
possible explanation for this is that Fukazawa et al. (2014) used the region 1.5 kb upstream of the
start codon for the promoter in their reporter construct, whereas this study used 1.8 kb upstream
of the start codon, which might more accurately capture the entire promoter. In addition, the
researchers only presented one reporter line at 3, 6 and 10 DAG, whereas this study used seven
lines from independent insertion events and looked at expression throughout development.
Fukazawa et al. (2014) also looked at flowering time of an idd2 mutant, which they report to be a
transcriptional knockout. The mutant line they are using is the same as the idd2-2 line used in this
study, which was shown to have a higher amount of a truncated transcript rather than having very
low transcript levels like the idd2-3 line. The researchers show that the idd2-2 line flowers slightly
later than Col-0 under short day conditions and that their one 35S∷IDD2 overexpression transgenic
plant flowers much earlier than Col-0 (Fukazawa et al., 2014). When this experiment was redone
in this study with Col-0, idd2-2, idd2-3 and seven 35S∷IDD2 lines from independent insertion
events, none of the lines had a significant difference in flowering time compared to Col-0. Lastly,
the paper reported that the 35S∷IDD2 line had longer hypocotyls than Col-0 when grown on 1 and
10 μM GA. When four 35S∷IDD2 lines were grown on 0, 1 and 10 μM GA, no significant
differences in hypocotyl length were observed. When seedlings from the same lines were grown
on the same media in the dark, one of the 35S∷IDD2 lines had shorter hypocotyls at 1 and 10 μM
GA, but this phenotype was not observed in the other three lines, so it has been ignored. Overall,
it is suggested that findings from Fukazawa et al. (2014) be re-investigated.
4.6 IDD family members may function redundantly
In the IDD gene family, several members are able to self-regulate, as well as regulate other
transcription factors. For example, the IDD3 and IDD10 proteins are involved in regulating the
transcription factors SCARECROW (SCR) and SHORTROOT (SHR), which are involved in
- 92 -
creating proper root structure (Ogasawara et al., 2011; Welch et al., 2007). IDD3 also shows
feedback inhibition in Arabidopsis cell culture experiments. When the IDD10 protein is present,
transcriptional activity from the IDD3 promoter increases but when the IDD3 protein is added,
transcriptional activity returns to basal levels (Ogasawara et al., 2011), indicating that IDD3
regulates its own expression. IDD family genes are also able to work together to regulate gene
expression as shown in the SHR/SCR pathway, for example.
SCR is expressed in
cortex/endodermal initial cells (CEI), endodermal cells and the quiescent centre where it helps
define endodermal identity by preventing differentiation in adjacent cells (Di Laurenzio et al.,
1996). SHR is expressed in the stele and then moves outward to the endodermis. IDD3 and IDD10
help control where SCR and SHR move (Welch et al., 2007). IDD3, IDD10 and SCR are all
expressed in the endodermis and CEI cells and IDD3, IDD10, SHR and SCR proteins are found
together in these cells, even though SHR is only expressed in the stele (Ogasawara et al., 2011).
The four transcription factors work together to activate SCR (Ogasawara et al., 2011), showing an
example of IDD proteins working together to regulate gene expression. It is possible that IDD2
could work with IDD1 and/or other IDD family proteins to perform its regulatory function. This
would explain the lack of phenotypes observed in idd2 loss-of-function mutants; the other
transcription factor(s) might be performing their function(s) without IDD2, although perhaps to a
lesser degree (Figure 4.5).
If IDD2 is working in concert with other transcription factors, this would mean that a
double or triple mutant would be needed to show a phenotype. This is common in transcription
factor families (Riechmann and Ratcliffe, 2000) and has been previously observed in the IDD
family in several cases. The idd3 mutant and even the idd3 idd8 double mutant show no obvious
root phenotypes, but reducing IDD3 expression in an idd10 mutant background reveals that IDD10
- 93 -
and IDD3 might compete for the same binding site in the SHR-SCR complex. IDD3 seems to
redundantly facilitate the role the SHR-SCR complex plays in promoting asymmetric cell division
in the root (Welch et al., 2007). Thus, an idd3 single mutant does not show a phenotype since
SHR and SCR can function without IDD3. In another example mentioned earlier, single loss-offunction mutants idd14 and idd15 show some phenotypic differences, but these phenotypes are
greatly exacerbated in the idd14 idd15 IDD16i triple mutant (Cui et al., 2013). The triple mutant
has enlarged floral organs, reduced fertility, decreased auxin content and decreased auxin transport
ability but the single mutants do not show any of these phenotypes. Through phenotypic analysis
of the triple mutants, Cui et al. (2013) concluded that IDD14, IDD15 and IDD16 work together to
regulate auxin biosynthesis and transport. It appears that when one of the proteins in this trio is
missing, the other two are able to carry out most of the functions of the missing protein, since the
single loss-of-function mutants have subtle or no phenotypic differences.
Overall, the aforementioned findings support the theory that IDD2 functions in concert
with one or more other genes, possibly from the IDD family. Future research should include
creating double loss-of-function mutants with other IDD family genes. This was attempted by
crossing the idd2-2 and idd2-3 mutants with an IDD1i line, however the IDD1i line did not have
reduced IDD1 expression, so this was unsuccessful. Further attempts to create an IDD1i idd2
double mutant should be pursued.
4.7 Is IDD2 involved in auxin sensing or regulating seed oil hydrolysis?
Examination of IDD2 expression patterns using IDD2::GFP:GUS reporter lines and
determining that IDD2 is expressed at auxin maxima raised the possibility that the IDD2 protein
might be involved in synthesizing or sensing auxin or in regulating the auxin response.
- 94 -
To check whether auxin could be regulating IDD2 or if the IDD2 protein could be
regulating AUXIN RESPONSE FACTOR family genes (ARF), promoter analysis was done with
Athamap (Steffens et al., 2005) to look for potential transcription factor targets. The IDD2
promoter contained 2 auxin response elements (with the sequence TGTCTC) that were 458 bp and
354 bp upstream of the start codon, suggesting that it is possible for the presence of auxin to
regulate IDD2. However, when IDD2::GFP:GUS seedlings were grown on media with 1 μM
IAA, the staining pattern did not change compared to seedlings grown on ½ MS media, which
suggests that IDD2 expression is not directly regulated by auxin. It is still possible that auxin
might change the shape or binding ability of the IDD2 protein so that it might have a role in sensing
auxin, however, further experiments are warranted to investigate this possibility. The IDD proteins
are hypothesized to bind to the 11-bp (TTTGTCGTATT) consensus sequence to which the
founding member of the family, ID1, binds (Kozaki et al., 2004). Of the 23 ARF genes in
Arabidopsis, four contained between one and four ID1 binding sites (summarized in Table 4.1). It
is possible that IDD2 targets auxin response genes and regulate the auxin response pathways by
binding to these sites or that IDD2 forms a complex with other transcription factors that bind auxin
response genes.
Table 4.1: Summary of ID1 binding sites found in AUXIN RESPONSE FACTOR family genes
using Athamap (Steffens et al., 2005).
Gene name
Atg #
ID1-binding site(s)
Relative distance(s) (bp)
ARF5
At1g19850
1
-37
ARF9
At4g23980
3
-1395, -1054, -19
ARF18
At3g61830
4
-1389. -1287, -915, -54
ARF19
At1g19220
2
-509, -862
Several experimental observations also support the theory that IDD2 might be involved in
sensing auxin and regulating auxin response pathways (proposed model in Figure 4.5). When
- 95 -
IDD2::GFP:GUS seedlings were grown on 1 µM auxin (Figure 3.9), the expression pattern of
IDD2 did not change; IDD2 was still expressed in the shoot apex, vasculature, hypocotyl, lateral
root primordia and root tip. If IDD2 were being directly regulated by the presence of auxin, its
expression would likely change when exogenous auxin was added. In addition, 35S::IDD2
seedlings resemble Col-0 seedlings when grown on 10 μM auxin; they both have yellow
cotyledons and reduced root growth (Figure 3.29). However, on ½ MS media without auxin,
35S::IDD2 seedlings still had yellow leaves and reduced root growth and looked very similar to
Col-0 seedlings grown on auxin, suggesting that overexpression seedlings could be sensing auxin
in the absence of auxin. The model proposed in Figure 4.5 suggests that IDD2 is part of a complex
of other transcription factors that are involved in sensing auxin and regulating auxin response
genes. Perhaps high levels of auxin enhance the ability of IDD2 to bind with the transcription
factor complex and turn on genes associated with the auxin response, but when auxin levels are
low, IDD2 could be outcompeted by an alternative transcription factor and auxin response genes
would be turned off. In 35S::IDD2 seedlings exposed to high auxin levels, IDD2 would bind with
the transcription factor complex as in wild-type seedlings, and the auxin response phenotype would
be shown. However, when low levels of auxin are present, perhaps IDD2 is still able to outcompete
the alternate transcription factor simply because there is such a high amount of IDD2 protein
present and the seedlings exhibit an auxin response phenotype even though the auxin level is low.
In idd2 seedlings where IDD2 is not present, it is possible that a transcription factor in the IDD
family or otherwise binds the complex instead of IDD2 when auxin levels are high, leading to an
auxin response and is outcompeted when auxin levels are low, leading to normal growth. To
validate this model, the expression of auxin regulated genes should be quantified in 35S::IDD2
plants using qPCR, when plants are grown with and without exogenous auxin. Chromatin
- 96 -
immunoprecipitation could also be done to see whether the IDD2 protein binds auxin regulated
genes.
The 35S::IDD2 seeds have altered seed coat patterning and appear crumpled when viewed
under the SEM (Figure 3.30). It is possible that the embryo inside is affected by this difference
and this is why so many of the 35S::IDD2 seedlings have difficulty progressing past the cotyledon
stage. If IDD2 is involved in auxin sensing, too much or mis-expressed IDD2 might cause the
plants to react as if there is a lot of auxin present when it is not actually there (Figure 4.5).
Interestingly, 35S::IDD2 seedlings do not show this difficulty growing past the two cotyledon
stage when grown on ½ MS media supplemented with 2% sucrose. Perhaps, even though the
35S::IDD2 seedlings are sensing excess auxin, which would normally stunt growth, the extra
energy provided by the sucrose allows the roots to grow to normal lengths anyway. Recent
research has led to speculation about auxin and sugars both being involved in signaling for various
processes, such as bud burst (Van den Ende, 2014), so the sugars might overcome the auxin sensing
happening in 35S::IDD2 seedlings, if sugar signaling is upstream of auxin signaling. Additionally,
since reduced auxin is required in the valve margins for seed dehiscence (Sorefan et al., 2009),
perhaps the 35S::IDD2 seedlings are still sensing auxin when there is an auxin reduction and
causing a difference in the amount of time the seeds stay in the silique, which might lead to the
crumpled seed phenotype. Future research should include sectioning 35S::IDD2 seeds and looking
for differences in morphology, specifically in the outer and inner integument and the endosperm.
- 97 -
Figure 4.5: Proposed model for the role of IDD2 in auxin sensing and regulating auxin responses.
- 98 -
An alternate explanation for the difficulty that many 35S::IDD2 overexpression seedlings
experience in growing past the cotyledon stage is a reduction in β-oxidation or seed oil hydrolysis
activity, which could be linked to auxin sensing in an unknown way. Loss-of-function mutants
for SUGAR-DEPENDENT genes, which encode patatin-like TAG lipases (Eastmond, 2006), show
a very similar postgerminative growth phenotype to 35S::IDD2 seedlings. The sdp1 loss-offunction mutants are able to germinate properly but growth is severely delayed. At five days after
germination, sdp1 seedlings have small, pale cotyledons and short roots compared to Col-0
seedlings that have large, green cotyledons and long roots (Figure 4.6). When sdp1 seedlings are
grown on media with 1 % sucrose, the mutants resemble wild type seedlings (Eastmond, 2006).
The growth behaviour of sdp1 seedlings is very similar to that of 35S::IDD2 seedlings, which also
show retarded growth that is rescued by providing sucrose as an alternate carbon source, raising
the possibility that 35S::IDD2 plants could have a reduced ability to hydrolyze seed oil upon
germination. In order to confirm a reduction is oil hydrolysis, 35S::IDD2 seedlings would need
to be examined five days after germination when most oil bodies should be degraded in wild type
plants (Quettier and Eastmond, 2009). Since this has not been done, the following model is largely
speculative and requires experimental validation.
- 99 -
Figure 4.6: a) Col-0 and sdp1 loss-of-function mutant seedlings at 5 DAG and b) Col-0 and
35S::IDD2 seedlings at 6 DAG grown on media with and without sucrose. Note the similarities
between sdp1 and 35S::IDD2 seedlings on media with and without sucrose. In this figure, a) is
from Eastmond, 2006 and b) is from this study.
A model for a role IDD2 might play in regulating postgerminative β-oxidation or oil
hydrolysis is proposed in Figure 4.7. In this model, we hypothesize that the presence of sucrose
enhances the ability of IDD2 to bind a transcription factor complex that regulates genes involved
in β-oxidation or oil hydrolysis. In wild type seedlings grown on media without sucrose, IDD2
might be outcompeted in binding the complex by an alternate transcription factor, which would
cause the complex to activate hydrolysis genes, leading to normal seedling growth. When wild
type plants are treated with sucrose, either IDD2 or the alternate transcription factor could bind the
complex, since oil mobilization would not be needed; seedlings would use the exogenous sucrose
as an alternative energy source. In 35S::IDD2 overexpression seedlings, whether treated with
sucrose or not, IDD2 would outcompete the alternative transcription factor simply because there
is a large amount of IDD2 present. Expression of genes involved in β-oxidation or oil hydrolysis
would be reduced and seedlings grown without sucrose would resemble sdp1 mutants and have
severely delayed growth. Seedlings grown with sucrose would use the sucrose as an energy source
- 100 -
and grow normally. In idd2 loss-of-function seedlings, the alternative transcription factor would
bind the complex in the presence or absence of sucrose and hydrolysis genes would be expressed,
leading to normal seedling growth.
Expression of genes important in postgerminative oil
hydrolysis should be quantified with qPCR in Col-0, idd2 and 35S::IDD2 seedlings to help validate
this hypothesis. Chromatin immunoprecipitation could also be done to see if the IDD2 protein
binds genes involved in seed oil hydrolysis. As there are many possible causes for difficulty in
postgerminative growth, such as nutrient deficiency, chloroplast defects and differences in seed
protein or starch levels, it would be important to consider these alternate explanations in future
studies.
- 101 -
Figure 4.7: Proposed model for IDD2 in regulating the expression of seed oil lipase genes.
- 102 -
4.8 Conclusions
During this project, many discoveries about IDD2 were made. Firstly, IDD2 is expressed
at auxin maxima, including the shoot apex, root tip, leaf vasculature, lateral root primordia and
nodes in the stem. The idd2-3 T-DNA insertion transgenic plants are transcriptional loss-offunction mutants for IDD2, as confirmed by qPCR. Despite their lack of IDD2 expression, idd23 transgenic plants do not show any obvious phenotypic differences from Col-0 plants. No
phenotypic differences were observed between idd2-3 and Col-0 in the following areas:
germination rate or timing; root growth on various concentrations of sucrose, glucose, sorbitol,
auxin, cytokinin, gibberellic acid or abscisic acid; number of lateral roots; length of the longest
lateral root; petiole length; leaf blade length; leaf starch, sucrose and glucose concentrations; and
flowering time in long and short day conditions. It is suspected that this lack of obvious phenotypic
differences is because IDD2 functions redundantly, as is common in transcription factor families
(Riechmann and Ratcliffe, 2000). Lastly, 35S::IDD2 overexpression transgenic plants experience
a constitutive auxin response and experience difficulty in postgerminative growth, however, this
difficulty is rescued by the addition of exogenous sucrose. Also, 35S::IDD2 seeds have crumpled
seed coats, however, the reason for this has not been identified.
4.9 Perspectives
While idd2 mutants have been thoroughly examined and models for IDD2 function have
been suggested, characterization of IDD2 is far from complete. The IDD2::GFP:GUS reporter
lines were made and IDD2 expression patterns were examined throughout the life cycle of the
plant, but further work could focus on quantifying IDD2 expression in various tissues with qPCR
or using mRNA in situ hybridization to verify the presence of IDD2 mRNA in the tissues stained
in the GUS assay. In addition to the reporter lines, 35S::IDD2 lines were also made and several
- 103 -
aspects of growth and development have been examined under various conditions. Future
characterization of these 35S::IDD2 plants could include dissecting seeds to check for
morphological differences and quantifying starch, sugars and oil in seeds to try to explain the
altered seed coat phenotype observed in this study. The activity of various seed oil lipases, such
as SUGAR-DEPENDENT1 should be examined to determine whether the 35S::IDD2 seedlings
have a reduction in oil hydrolysis ability. Since the model proposed in this study suggests that
IDD2 works in concert with another transcription factor, double mutants with other transcription
factors of interest should be made to see if any obvious phenotypes present themselves. IDD1 is
an obvious choice, but other possible choices could include various auxin response factor (ARF)
genes, which might provide insight into the possible auxin sensing function of IDD2.
In Arabidopsis, it is common for the members of a transcription factor family to function
redundantly (Riechmann and Ratcliffe, 2000), however, we might ask ourselves why are multiple
transcription factors required to perform the same function? Why has IDD2 remained in the
Arabidopsis genome when loss-of-function idd2 mutants do now show any phenotypic differences
or deficiencies? There are several possible explanations for this phenomenon. Firstly, perhaps
IDD2 and a redundant transcription factor have not evolved separate functions yet and are actually
functioning redundantly. Second, maybe the loss of IDD2 function creates a very subtle phenotype
that we have been unable to observe in idd2 mutants so far. Third, it is possible that IDD2 functions
in response to a particular environmental condition that we have not yet grown the idd2 mutants
under in the laboratory, but that Arabidopsis might encounter in its natural habitat, which would
justify the presence of IDD2 in the genome. Further investigation into the IDD family and other
transcription factor families will help to explore these possibilities.
- 104 -
Appendix
References
Abe, M., Kobayashi, Y., Yamamoto, S., Daimon, Y., Yamaguchi, A., Ikeda, Y., Ichinoki, H.,
Notaguchi, M., Goto, K., and Araki, T. (2005). FD, a bZIP protein mediating signals from the
floral pathway integrator FT at the shoot apex. Science 309, 1052–1056.
Alonso, J.M., Stepanova, A.N., Leisse, T.J., Kim, C.J., Chen, H., Shinn, P., Stevenson, D.K.,
Zimmerman, J., Barajas, P., Cheuk, R., et al. (2003). Genome-Wide Insertional Mutagenesis of
Arabidopsis thaliana. Science 301, 653–657.
Avsian-Kretchmer, O., Cheng, J.-C., Chen, L., Moctezuma, E., and Sung, Z.R. (2002). Indole
Acetic Acid Distribution Coincides with Vascular Differentiation Pattern during Arabidopsis
Leaf Ontogeny. Plant Physiol. 130, 199–209.
Bernier, G. (1988). The control of floral evocation and morphogenesis. Annu. Rev. Plant
Physiol. Plant Mol. Biol. 39, 175–219.
Bernier, G., Havelange, A., Houssa, C., Petitjean, A., and Lejeune, P. (1993). Physiological
signals that induce flowering. Plant Cell 5, 1147.
Bewley, J. (1997). Seed germination and dormancy. Plant Cell 9, 1055–1066.
Casimiro, I., Marchant, A., Bhalerao, R.P., Beeckman, T., Dhooge, S., Swarup, R., Graham, N.,
Inzé, D., Sandberg, G., Casero, P.J., et al. (2001). Auxin Transport Promotes Arabidopsis Lateral
Root Initiation. Plant Cell 13, 843–852.
Caspar, T., Huber, S.C., and Somerville, C. (1985). Alterations in Growth, Photosynthesis, and
Respiration in a Starchless Mutant of Arabidopsis thaliana (L.) Deficient in Chloroplast
Phosphoglucomutase Activity. Plant Physiol. 79, 11–17.
Chailakhyan, M.K. (1936). New facts in support of the hormonal theory of plant development. C.
R. Acad. Sci. URSS 13, 79–83.
Chrispeels, M.J., and Varner, J.E. (1967). Gibberellic Acid-Enhanced Synthesis and Release of
α-Amylase and Ribonuclease by Isolated Barley and Aleurone Layers. Plant Physiol. 42, 398–
406.
Clough, S.J., and Bent, A.F. (1998). Floral dip: a simplified method for Agrobacterium-mediated
transformation ofArabidopsis thaliana. Plant J. 16, 735–743.
Colasanti, J., Yuan, Z., and Sundaresan, V. (1998). The INDETERMINATE gene encodes a zinc
finger protein and regulates a leaf-generated signal required for the transition to flowering in
maize. Cell 93, 593–603.
- 105 -
Colasanti, J., Tremblay, R., Wong, A.Y.M., Coneva, V., Kozaki, A., and Mable, B.K. (2006).
The maize INDETERMINATE1 flowering time regulator defines a highly conserved zinc finger
protein family in higher plants. BMC Genomics 7, 158–174.
Coneva, V., Zhu, T., and Colasanti, J. (2007). Expression differences between normal and
indeterminate1 maize suggest downstream targets of ID1, a floral transition regulator in maize. J.
Exp. Bot. 58, 3679–3693.
Coneva, V., Guevara, D., Rothstein, S.J., and Colasanti, J. (2012). Transcript and metabolite
signature of maize source leaves suggests a link between transitory starch to sucrose balance and
the autonomous floral transition. J. Exp. Bot. 63, 5079–5092.
Corbesier, L., Lejeune, P., and Bernier, G. (1998). The role of carbohydrates in the induction of
flowering in Arabidopsis thaliana: comparison between the wild type and a starchless mutant.
Planta 206, 131–137.
Corbesier, L., Vincent, C., Jang, S., Fornara, F., Fan, Q., Searle, I., Giakountis, A., Farrona, S.,
Gissot, L., Turnbull, C., et al. (2007). FT Protein Movement Contributes to Long-Distance
Signaling in Floral Induction of Arabidopsis. Science 316, 1030–1033.
Cui, D., Zhao, J., Jing, Y., Fan, M., Liu, J., Wang, Z., Xin, W., and Hu, Y. (2013). The
Arabidopsis IDD14, IDD15, and IDD16 cooperatively regulate lateral organ morphogenesis and
gravitropism by promoting auxin biosynthesis and transport. PLoS Genet. 9, e1003759.
Dardick, C., and Callahan, A.M. (2014). Evolution of the fruit endocarp: molecular mechanisms
underlying adaptations in seed protection and dispersal strategies. Plant Evol. Dev. 5, 284.
Desfeux, C., Clough, S.J., and Bent, A.F. (2000). Female Reproductive Tissues Are the Primary
Target ofAgrobacterium-Mediated Transformation by the Arabidopsis Floral-Dip Method. Plant
Physiol. 123, 895–904.
Dunn, O.J. (1961). Multiple Comparisons among Means. J. Am. Stat. Assoc. 56, 52–64.
Eastmond, P.J. (2006). SUGAR-DEPENDENT1 Encodes a Patatin Domain Triacylglycerol
Lipase That Initiates Storage Oil Breakdown in Germinating Arabidopsis Seeds. Plant Cell
Online 18, 665–675.
Van den Ende, W. (2014). Sugars take a central position in plant growth, development and, stress
responses. A focus on apical dominance. Plant Physiol. 5, 313.
Feurtado, J.A., Huang, D., Wicki-Stordeur, L., Hemstock, L.E., Potentier, M.S., Tsang, E.W.T.,
and Cutler, A.J. (2011). The Arabidopsis C2H2 Zinc Finger INDETERMINATE
DOMAIN1/ENHYDROUS Promotes the Transition to Germination by Regulating Light and
Hormonal Signaling during Seed Maturation. Plant Cell Online 23, 1772–1794.
Focks, N., and Benning, C. (1998). wrinkled1: A novel, low-seed-oil mutant of Arabidopsis with
a deficiency in the seed-specific regulation of carbohydrate metabolism. Plant Physiol. 118, 91–
101.
- 106 -
Fornara, F., Panigrahi, K.C.S., Gissot, L., Sauerbrunn, N., Rühl, M., Jarillo, J.A., and Coupland,
G. (2009). Arabidopsis DOF Transcription Factors Act Redundantly to Reduce CONSTANS
Expression and Are Essential for a Photoperiodic Flowering Response. Dev. Cell 17, 75–86.
Fukazawa, J., Teramura, H., Murakoshi, S., Nasuno, K., Nishida, N., Ito, T., Yoshida, M.,
Kamiya, Y., Yamaguchi, S., and Takahashi, Y. (2014). DELLAs function as coactivators of
GAI-ASSOCIATED FACTOR1 in regulation of gibberellin homeostasis and signaling in
Arabidopsis. Plant Cell 26, 2920–2938.
Fukuda, N., Ikawa, Y., Aoyagi, T., and Kozaki, A. (2013). Expression of the genes coding for
plastidic acetyl-CoA carboxylase subunits is regulated by a location-sensitive transcription factor
binding site. Plant Mol. Biol. 82, 473–483.
Graham, I.A. (2008). Seed storage oil mobilization. Annu. Rev. Plant Biol. 59, 115–142.
Granot, D., David-Schwartz, R., and Kelly, G. (2013). Hexose kinases and their role in sugarsensing and plant development. Front. Plant Sci. 4, 44: 1–17.
Hassan, H., Scheres, B., and Blilou, I. (2010). JACKDAW controls epidermal patterning in the
Arabidopsis root meristem through a non-cell-autonomous mechanism. Development 137, 1523–
1529.
Hsieh, K., and Huang, A.H.C. (2004). Endoplasmic reticulum, oleosins, and oils in seeds and
tapetum cells. Plant Physiol. 136, 3427–3434.
Imaizumi, T., and Kay, S.A. (2006). Photoperiodic control of flowering: not only by
coincidence. Trends Plant Sci. 11, 550–558.
Imaizumi, T., Schultz, T.F., Harmon, F.G., Ho, L.A., and Kay, S.A. (2005). FKF1 F-Box Protein
Mediates Cyclic Degradation of a Repressor of CONSTANS in Arabidopsis. Science 309, 293–
297.
Jacobsen, J.V., and Beach, L.R. (1985). Control of transcription of α-amylase and rRNA genes in
barley aleurone protoplasts by gibberellin and abscisic acid. Nature 316, 275–277.
Jaeger, K.E., and Wigge, P.A. (2007). FT Protein Acts as a Long-Range Signal in Arabidopsis.
Curr. Biol. 17, 1050–1054.
Jang, J.C., and Sheen, J. (1994). Sugar sensing in higher plants. Plant Cell 6, 1665–1679.
Jefferson, R.A., Kavanagh, T.A., and Bevan, M.W. (1987). GUS fusions: beta-glucuronidase as a
sensitive and versatile gene fusion marker in higher plants. EMBO J. 6, 3901.
Jensen, P.J., Hangarter, R.P., and Estelle, M. (1998). Auxin Transport Is Required for Hypocotyl
Elongation in Light-Grown but Not Dark-Grown Arabidopsis. Plant Physiol. 116, 455–462.
Karimi, M., Inzé, D., and Depicker, A. (2002). GATEWAYTM vectors for Agrobacteriummediated plant transformation. Trends Plant Sci. 7, 193–195.
- 107 -
Karrer, E.E., and Rodriguez, R.L. (1992). Metabolic regulation of rice α-amylase and sucrose
synthase genes in planta. Plant J. 2, 517–523.
Karssen, C.M., Brinkhorst-van der Swan, D.L.C., Breekland, A.E., and Koornneef, M. (1983).
Induction of dormancy during seed development by endogenous abscisic acid: studies on
abscisic acid deficient genotypes of Arabidopsis thaliana (L.) Heynh. Planta 157, 158–165.
Katavic, V., Reed, D.W., Taylor, D.C., Giblin, E.M., Barton, D.L., Zou, J., MacKenzie, S.L.,
Covello, P.S., and Kunst, L. (1995). Alteration of Seed Fatty Acid Composition by an Ethyl
Methanesulfonate-Induced Mutation in Arabidopsis thaliana Affecting Diacylglycerol
Acyltransferase Activity. Plant Physiol. 108, 399–409.
Kelly, A.A., Quettier, A.-L., Shaw, E., and Eastmond, P.J. (2011). Seed storage oil mobilization
is important but not essential for germination or seedling establishment in Arabidopsis. Plant
Physiol. 157, 866–875.
Kelly, A.A., van Erp, H., Quettier, A.-L., Shaw, E., Menard, G., Kurup, S., and Eastmond, P.J.
(2013). The SUGAR-DEPENDENT1 lipase limits triacylglycerol accumulation in vegetative
tissues of Arabidopsis. Plant Physiol. 162, 1282–1289.
Koornneef, M., Alonso-Blanco, C., Peeters, A.J.M., and Soppe, W. (1998). Genetic Control of
Flowering Time in Arabidopsis. Annu. Rev. Plant Physiol. Plant Mol. Biol. 49, 345–370.
Kozaki, A., Hake, S., and Colasanti, J. (2004). The maize ID1 flowering time regulator is a zinc
finger protein with novel DNA binding properties. Nucleic Acids Res. 32, 1710–1720.
Kucera, B., Cohn, M.A., and Leubner-Metzger, G. (2005). Plant hormone interactions during
seed dormancy release and germination. Seed Sci. Res. 15, 281–307.
Di Laurenzio, L., Wysocka-Diller, J., Malamy, J.E., Pysh, L., Helariutta, Y., Freshour, G., Hahn,
M.G., Feldmann, K.A., and Benfey, P.N. (1996). The SCARECROW Gene Regulates an
Asymmetric Cell Division That Is Essential for Generating the Radial Organization of the
Arabidopsis Root. Cell 86, 423–433.
LeBlanc, Z. (2012). Functional Characterization of AtIDD1, a putative Arabidopsis thaliana
transcription factor.
Lincoln, C., Britton, J.H., and Estelle, M. (1990). Growth and development of the axr1 mutants
of Arabidopsis. Plant Cell Online 2, 1071–1080.
Lindgren, L.O., Stålberg, K.G., and Höglund, A.-S. (2003). Seed-specific overexpression of an
endogenous Arabidopsis phytoene synthase gene results in delayed germination and increased
levels of carotenoids, chlorophyll, and abscisic acid. Plant Physiol. 132, 779–785.
Livak, K.J., and Schmittgen, T.D. (2001). Analysis of Relative Gene Expression Data Using
Real-Time Quantitative PCR and the 2−ΔΔCT Method. Methods 25, 402–408.
- 108 -
Ludewig, F., and Flügge, U.-I. (2013). Role of metabolite transporters in source-sink carbon
allocation. Front. Plant Sci. 4, 231: 1–16.
Mathieu, J., Warthmann, N., Küttner, F., and Schmid, M. (2007). Export of FT Protein from
Phloem Companion Cells Is Sufficient for Floral Induction in Arabidopsis. Curr. Biol. 17, 1055–
1060.
Moore, B., Zhou, L., Rolland, F., Hall, Q., Cheng, W.-H., Liu, Y.-X., Hwang, I., Jones, T., and
Sheen, J. (2003). Role of the Arabidopsis glucose sensor HXK1 in nutrient, light, and hormonal
signaling. Science 300, 332–336.
Morita, M.T., Sakaguchi, K., Kiyose, S.-I., Taira, K., Kato, T., Nakamura, M., and Tasaka, M.
(2006). A C2H2-type zinc finger protein, SGR5, is involved in early events of gravitropism in
Arabidopsis inflorescence stems. Plant J. Cell Mol. Biol. 47, 619–628.
Mouradov, A., Cremer, F., and Coupland, G. (2002). Control of Flowering Time Interacting
Pathways as a Basis for Diversity. Plant Cell Online 14, S111–S130.
Murashige, T., and Skoog, F. (1962). A revised medium for rapid growth and bioassays with
tobacco tissue culture. Physiol Plant 15, 473–497.
Ogasawara, H., Kaimi, R., Colasanti, J., and Kozaki, A. (2011). Activity of transcription factor
JACKDAW is essential for SHR/SCR-dependent activation of SCARECROW and MAGPIE and
is modulated by reciprocal interactions with MAGPIE, SCARECROW and SHORT ROOT.
Plant Mol. Biol. 77, 489–499.
Ogawa, M., Hanada, A., Yamauchi, Y., Kuwahara, A., Yuji, K., and Yamaguchi, S. (2003).
Gibberellin biosynthesis and response during Arabidopsis seed germination. Plant Cell 15, 1591–
1604.
Petricka, J.J., Winter, C.M., and Benfey, P.N. (2012). Control of Arabidopsis Root Development.
Annu. Rev. Plant Biol. 63, 563–590.
Quettier, A.-L., and Eastmond, P.J. (2009). Storage oil hydrolysis during early seedling growth.
Plant Physiol. Biochem. 47, 485–490.
Riechmann, J.L., and Ratcliffe, O.J. (2000). A genomic perspective on plant transcription
factors. Curr. Opin. Plant Biol. 3, 423–434.
Ruan, Y.-L. (2012). Signaling role of sucrose metabolism in development. Mol. Plant 5, 763–
765.
Sawa, M., Nusinow, D.A., Kay, S.A., and Imaizumi, T. (2007). FKF1 and GIGANTEA Complex
Formation Is Required for Day-Length Measurement in Arabidopsis. Science 318, 261–265.
Seo, P.J., Ryu, J., Kang, S.K., and Park, C.-M. (2011). Modulation of sugar metabolism by an
INDETERMINATE DOMAIN transcription factor contributes to photoperiodic flowering in
Arabidopsis. Plant J. 65, 418–429.
- 109 -
Sessions, A., Burke, E., Presting, G., Aux, G., McElver, J., Patton, D., Dietrich, B., Ho, P.,
Bacwaden, J., Ko, C., et al. (2002). A High-Throughput Arabidopsis Reverse Genetics System.
Plant Cell Online 14, 2985–2994.
Skriver, K., Olsen, F.L., Rogers, J.C., and Mundy, J. (1991). cis-acting DNA elements
responsive to gibberellin and its antagonist abscisic acid. Proc. Natl. Acad. Sci. U. S. A. 88,
7266–7270.
Sorefan, K., Girin, T., Liljegren, S.J., Ljung, K., Robles, P., Galván-Ampudia, C.S., Offringa, R.,
Friml, J., Yanofsky, M.F., and Østergaard, L. (2009). A regulated auxin minimum is required for
seed dispersal in Arabidopsis. Nature 459, 583–586.
Srikanth, A., and Schmid, M. (2011). Regulation of flowering time: all roads lead to Rome. Cell.
Mol. Life Sci. 68, 2013–2037.
Steffens, N.O., Galuschka, C., Schindler, M., Bülow, L., and Hehl, R. (2005). AthaMap web
tools for database-assisted identification of combinatorial cis-regulatory elements and the display
of highly conserved transcription factor binding sites in Arabidopsis thaliana. Nucleic Acids Res.
33, W397–W402.
Streb, S., and Zeeman, S.C. (2012). Starch Metabolism in Arabidopsis. Arab. Book Am. Soc.
Plant Biol. 10.
Suárez-López, P., Wheatley, K., Robson, F., Onouchi, H., Valverde, F., and Coupland, G.
(2001). CONSTANS mediates between the circadian clock and the control of flowering in
Arabidopsis. Nature 410, 1116–1120.
Sulpice, R., Pyl, E.-T., Ishihara, H., Trenkamp, S., Steinfath, M., Witucka-Wall, H., Gibon, Y.,
Usadel, B., Poree, F., Piques, M.C., et al. (2009). Starch as a major integrator in the regulation of
plant growth. Proc. Natl. Acad. Sci. 106, 10348–10353.
Tanimoto, M., Tremblay, R., and Colasanti, J. (2008). Altered gravitropic response, amyloplast
sedimentation and circumnutation in the Arabidopsis shoot gravitropism 5 mutant are associated
with reduced starch levels. Plant Mol. Biol. 67, 57–69.
Tsukaya, H. (2002). Leaf Development. Arab. Book e0072.
Turner, S., and Sieburth, L.E. (2003). Vascular Patterning. Arab. Book Am. Soc. Plant Biol. 2.
Valverde, F., Mouradov, A., Soppe, W., Ravenscroft, D., Samach, A., and Coupland, G. (2004).
Photoreceptor regulation of CONSTANS protein in photoperiodic flowering. Science 303, 1003–
1006.
Vernoux, T., Besnard, F., and Traas, J. (2010). Auxin at the Shoot Apical Meristem. Cold Spring
Harb. Perspect. Biol. 2, a001487.
- 110 -
Welch, D., Hassan, H., Blilou, I., Immink, R., Heidstra, R., and Scheres, B. (2007). Arabidopsis
JACKDAW and MAGPIE zinc finger proteins delimit asymmetric cell division and stabilize
tissue boundaries by restricting SHORT-ROOT action. Genes Dev. 21, 2196–2204.
Winter, D., Vinegar, B., Nahal, H., Ammar, R., Wilson, G.V., and Provart, N.J. (2007). An
“Electronic Fluorescent Pictograph” Browser for Exploring and Analyzing Large-Scale
Biological Data Sets. PLoS ONE 2, e718.
Yamaguchi, S., Kamiya, Y., and Sun, T. (2001). Distinct cell-specific expression patterns of
early and late gibberellin biosynthetic genes during Arabidopsis seed germination. Plant J. 28,
443–453.
Yano, M., Kojima, S., Takahashi, Y., Lin, H., and Sasaki, T. (2001). Genetic Control of
Flowering Time in Rice, a Short-Day Plant. Plant Physiol. 127, 1425–1429.
Zeeman, S.C., and Rees, T.A. (1999). Changes in carbohydrate metabolism and assimilate export
in starch-excess mutants of Arabidopsis. Plant Cell Environ. 22, 1445–1453.
- 111 -
PCR Primers
Table 0.1: Names, sequences and annealing temperatures for primers used in polymerase chain
reactions (PCR).
Name
Sequence
Annealing
Temperature (°C)
AtIDD2OE-F
GGGGACAAGTTTGTACAAAAAAGCAGGCTATGCCGGTAGATTTAGATAACT
55
AtIDD2OE-R
GGGGACCACTTTGTACAAGAAAGCTGGGTTTATGATTTTCTTCTACTAATGTC
TTTCC
55
AtIDD1pro-F
GGGGACAACTTTGTATAGAAAAGTTGAGGATTTCGTATGATAAAATAA
48
AtIDD1pro-R
GGGACTGCTTTTTTGTACAAACTTGGTTTCAAAGATACTAAATTCCA
48
AtIDD1proF
GGGGACAAGTTTGCAATGTGTACGGA
48
AtIDD1proR
GGGGACCACTTTGGAACACAAAAAGG
48
AtIDD2-For1
GGATAGTTTTATAACGCATAGAGCTT
49
AtIDD2-Rev2
TCTCACACTAACCTATTGAAC
49
AtIDD2proB1-F
GGGGACAAGT TTGTACAAAAAAGCAGGCTCACTACCTACAAAAGAAATGG
48
AtIDD2proB2-R
GGGGACCACTTTGTACAAGAAAGCTGGGTCTTTTTTTTTAGTCTCACTCTG
48
AtIDD2pro SR
CTCGTGAGATTTCGTGTG
45
AtIDD2pro SF
CAACAAATAACACGATCAAT
42
Salk/Lba1
TGGTTCACGTAGTGGGCCATCG
49
LB3
TAGCATCTGAATTTCATAACCAATCTCGATACAC
46
M13F
GTAAAACGACGGCCAG
41
M13R
CAGGAAACAGCTATGAC
40
Kan R For
ATACTTTCTCGGCAGGAGCA
52
Kan R Rev
ACAAGCCGTTTTACGTTTGG
52
BaRF
CCGAATTGAATTAGCTTGCATGCCGG
55
BaRR
CGTTTTACGTTTGCTGACAGAACCGC
55
- 112 -
qPCR Primers
Table 0.2: Names, sequences, optimal dilutions and expected amplicon sizes for primers used in
quantitative real-time PCR.
Name
Sequence
Optimal Dilution
qrtATIDD1F
TGGCACCAAGGAGTATAAATGC
1/16
qrtATIDD1R
AAAAGGCTCTATGCGTTATAAAGC
1/16
AtIDD2E2F
ACCCTTCACGTGCTTTAGGA
1/16
AtIDD2E3R
TCTCGCATTTTCTTCAGCCA
1/16
AtIDD2E4F
AGCAGCTTCTTCAGGAGGTT
1/16
AtIDD2E4R
TTCCGTTACCAACCGCTCTA
1/16
Actin7F
TGCACCGCCAGAGAGAAAAT
1/16
Actin7R
TGAGGGATGCAAGGATTGATC
1/16
gDNA/mRNA size
328/245
224/224
58/58
Mutant Line Information
Table 0.3: Gene number, names and insert information for T-DNA insertion mutants.
Location in base pairs is given as the base pair where the insert starts counting from the
beginning of the AtIDD2 open reading frame.
Mutant Line
Gene #
Official Name
SALK/SAIL #
Insert Location
Confirmed?
Location (bp)
2S3
At3g50700
idd2-1
SALK 059 657
3’ end of exon 4
yes
2420
2S14
At3g50700
idd2-2
SALK 070 916
Intron 3
yes
1690
2G11
At3g50700
idd2-3
CS873095/
45 bp from end of
exon 4
yes
2375
SAIL 315G02
- 113 -

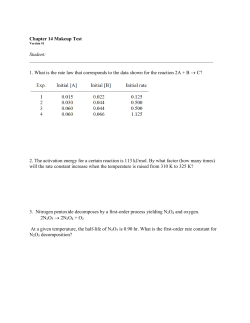


© Copyright 2026