
SSSA Malawi Post Flood 2015
Mala awi Po ost‐Floo od Rap pid Seeed Sysstem Seecurityy Assesssmentt Chikwa C awa, N Nsanje, and Ph halomb be Disttricts FIN NAL DR RAFT REPORTT 21 A April 2015 Un ndertaken byy Catholic Re elief Servicess in collaborration with: Th he District Aggriculture De evelopmentt Offices of C Chikwawa, N Nsanje, and P Phalombe; Concern Worldwide;; Catholic De evelopment Commissionn (CADECOM M) of Chikwaawa and Blan ntyre Funded by the UN Food and Agricuulture Organ nization Report autho ored by Ed W Walters and eedited by Jim m Ashman Contents Executive Summary ...................................................................................................................................... 3 Introduction .............................................................................................................................................. 3 Main Findings and Recommendations ...................................................................................................... 4 Need for a Seed System Security Assessment .......................................................................................... 5 Methodology ............................................................................................................................................. 6 The Selected Zones ................................................................................................................................... 7 The Seed Market ..................................................................................................................................... 10 Prices and Supply .................................................................................................................................... 11 Results ........................................................................................................................................................ 12 District Level Results ............................................................................................................................... 20 Chikwawa ............................................................................................................................................ 20 Nsanje ................................................................................................................................................. 25 Phalombe ............................................................................................................................................ 30 Gender Differences ................................................................................................................................. 35 Recommendations for the Acute Seed Security Crisis .............................................................................. 39 Recommendations for Longer Term Seed System Security ...................................................................... 41 Conclusions ................................................................................................................................................. 41 Annex 1: Participants ............................................................................................................................. 43 Annex 2: Bibliography ............................................................................................................................ 44 2 Executive Summary Tens of thousands of households lost assets including housing and grain stocks from severe floods in Southern Malawi in early 2015. While those affected have a wide variety of needs, the great majority are farmers: regaining access their means to production – particularly to planting materials – is one of the most crucial requirements to allow them to start rebuilding their livelihoods. CRS, jointly with the District Agricultural Development Offices of the Government of Malawi, Concern Worldwide, and the Catholic Development Commissions of Chikwawa and Blantyre, undertook this assessment to better understand the seed security – availability, access, and utilization of seed – both under normal conditions, and as affected by the recent floods. The assessment verified that flood‐ affected farmers had indeed lost their seed, and that with the simultaneous loss of the crops they had hoped to sell, have also lost the purchasing power with which to replenish this critical livelihood input. However, it was ascertained that sufficient seed was available on local markets and with agro input dealers, both of whom sourced from outside the flood‐affected districts. At the time the field work was done, farmers were already reporting an increase in the percentage of sweet potato planting material accessed through aid (government, FAO and NGO) this season over the previous winter season (from 6.5 to 8.3%). While there was a reported decrease in the percentage of maize seed accessed through aid (from 16.3 to 10.6%), this may be reflective of the timing of the assessment (second week of March), which would have been before the bulk of winter season maize seed would have been distributed. As the planting of winter crops needs to take place in April 2015, timely provision of seed to farmers is essential. As the number of those affected is large, some agencies may be planning to implement direct seed distribution to ease logistics. However, it must be emphasized that circumventing the local markets and agro dealers would undermine the livelihoods of the traders critical to maintaining a viable and sustainable seed system. While the “first choice” recommendation of the assessment team is implementation of seed fairs, we urge that any intervention, be it through vendor coupons or using local procurement, fully involve local seed sources as much as feasible. Introduction Unusually heavy rainfall in January 2015 led to severe flooding in 15 of Malawi’s 28 districts. The Government of Malawi estimated that 1.15 million people were affected nationwide, prompting the the President of the Republic of Malawi to declare a State of Emergency on January 13, 2015. Chikwawa, Nsanje, and Phalombe Districts were identified by an interagency assessment led by UNDAC in January as the three districts most severely affected by the floods. Over 385,000 people were affected in the Lower Shire Valley (Chikwawa and Nsanje), and 120,000 in Phalombe. Nationwide, 64,000 hectares of land, half of which been planted with crops at the time, were flooded. Maize crops planted in December (due to the delayed start of season) would have been nearing the stage of green harvest in March. If timely winter planting cannot occur, affected farmers face the prospect of losing the two successive cropping seasons. Along with other organizations, CRS would like to ensure that farmers can resume agricultural activities as early as practical. CRS conducted a rapid seed system security analysis in Chikwawa, Nsanje, and Phalombe Districts in order to determine an appropriate response to the crisis. The assessment examined traditional seed 3 channels, the post‐flood functioning of the formal and informal seed market, immediate seed needs of the affected population, and developed recommendations for responses for the winter cropping season. Main Findings and Recommendations Most cropping is done in the main season with the rains, which normally start in November. Maize, sorghum, millet, cassava, sweet potatoes, and cotton are all planted during this season. Shorter cycle crops are planted during the dry winter season starting in April either under irrigation or through recession planting as the water level recedes. These crops consist of maize, beans, sweet potatoes, and vegetables. Most farmers normally access seed through informal sources – own saved seed, social networks, or the local market. Farmers in lowland areas bordering rivers lost most of their crops in the flooding. Crops in the upland areas, particularly maize, will experience significant drops in production due to two major factors: late onset of rains, and leaching of nutrients by the heavy rainfall when the rains finally began. The loss of crops combined with the drop in upland production will result in reduced availability of own saved seed. Meanwhile, the reduction in crop sales will reduce farmers’ power to purchase seed. As their neighbors will have experienced similar losses, the social networks that normally serve as a backup source will not be functioning. Farmers plan to compensate for the lack of available seed from own saved seed and social networks by increasing their purchases in the local market and from agro‐dealers. Overall, farmers are planning to plant – or at least hoping to plant – more seed this upcoming season. Reasons given by farmers for the increased planting are having access to more land or more fertile land (37%), and deciding to give more priority to agriculture (36%). For those planning to plant less, the overwhelming reason is lack of financial resources to purchase seed. The three districts surveyed report similar overall results with minor variations. Chikwawa farmers are planning to plant more sweet potato during the winter season and less rice and beans. In Nsanje, farmers are cultivating larger areas in order to take advantage of recession planting, and plan to plant more beans, rice, and maize, but less sweet potato. In Phalombe, farmers plan to plant more maize and rice, but less Irish potato and beans. In all three districts farmers are planning on maintaining or increasing areas of maize planted. Many more farmers in Chikwawa plan to rely on agro‐dealers (for 16% of all seed: 30% of maize seed, 12% each of rice and cowpea seed, and 100% of vegetable seed needs). In the other two districts farmers plan to purchase only 4% of their seed needs – the great majority of that maize – from agro‐ dealers for the upcoming winter season. Prices of locally sourced maize are higher in Nsanje and Phalombe this season because of low supply. In contrast, prices in Chikwawa have fallen due to lower demand caused by a drop in purchasing power of farmers combined with emergency maize distributions. Bean prices have risen due to lower supply, except in Nsanje where supply has increased with the recent bean harvest. Results from interviews with seed suppliers, agro‐dealers, and in the market show that there is sufficient grain and seed available for sale in the three districts. However, the problem from the perspective of flood‐affected farmers is that do not have the financial resources to purchase this seed to replace their lost planting materials. The issue is clearly access rather than availability 4 In order to reduce the access constraint and help quickly restore agricultural livelihoods, seed fairs are recommended, preferably diversity fairs (DiNER – Diversity and Nutrition for Enhanced Resilience) with vouchers. Given Malawians focus on maize for food security, the risk is that the entire value of the voucher will be spent on maize seed. DiNERs set a ceiling on maize purchases, thus encouraging farmers to purchase crop seed of nutritional importance such as legumes, vegetables, and sweet potatoes. While the seed fairs will help alleviate immediate seed needs, they do little to address the systemic problems in seed security. Repeated weather‐related crises have led to successive seed distributions by NGO’s and the government. In addition, the government’s FISP program provides coupons for seed and fertilizer. Provision of free planting materials creates a disincentive to more sustainable systems. Expectations for distributions discourage farmers from saving seed. Repeated distributions of free seed discourage local seed production for the market. Seed companies and agro‐dealers ignore the small farmer market, and relationships with small farmers are not cultivated because the FISP program dominates sales. Need for a Seed System Security Assessment Traditional responses to natural disasters in an agricultural context include direct seed distributions. The logic of this strategy is that the distributed seed will replace seed lost in the disaster and will enable farming populations to rapidly regain their livelihoods. Nevertheless, these strategies frequently weaken the very livelihoods the activities are meant to sustain. In many cases, local sources of seed remain undamaged by the disaster. The direct distribution of external seed undermines the local market and negatively affects those producers and sellers participating in these markets. Repeated distributions can have profound negative long‐term effects on the local markets and producers. The complexity of seed systems and the diverse contexts in which emergencies unfold require a range of responses. There is no single ideal response. The context is changing, especially as the prevalence of repeated shocks and protracted emergencies increases. Appropriate seed‐based interventions can have impacts beyond seed delivery, including strengthening of the local seed system; stimulating entrepreneurial activity; empowering farmers, traders and rural communities, including women; and making use of and maintaining agricultural biodiversity. Effective seed relief activities should build on the coping capacities of communities and avoid creating dependency on repeated input‐based relief. There are a number of possible seed‐related interventions. These include food aid to protect seed, direct seed distribution (including the variant of local commodity purchasing), provision of vouchers or cash to farmers, seed fairs (with or without vouchers), local seed production, support to local grain traders and markets, access to or development of better varieties, and improving farmers’ seed quality. Selection of the appropriate intervention should be guided by objective criteria. The purposes of this Rapid Seed System Security Assessment are to: 1. Develop a clear understanding of the immediate seed system needs and demands of flood‐affected smallholder farmers in Southern Malawi; 2. Monitor the post‐flood functioning of formal and informal seed supply and marketing channels; and determine how farmers are procuring seed for key food and income‐generating crops; 3. Through discussion with stakeholders, develop targeted action plans to ensure that immediate seed system needs of smallholder farmers are met for 2015, including the winter season and main 5 2015/16 rainy season. Any contemplated interventions will be based on an analysis of whether seed interventions are appropriate, given the current demand as well as supply chain constraints in the wake of the flooding, and/or whether fertilizer or other input support is appropriate. CRS had collaborated with CIAT in 2011 to perform an SSSA in Southern Malawi covering Chikwawa, Balaka, and Zomba Districts, which provides additional baseline information. The household characteristics found in the present survey are very similar to the 2011 results. The 2011 survey noted that seed availability per se was not a major problem, although access to (having funds to purchase) seed was a critical constraint. Methodology The methodology for the Rapid Seed Security Assessment was adapted from the seed security assessment guide When Disaster Strikes by Louise Sperling. Data collection tools were adapted from those found on the seed system website, http://seedsystem.org/. The rapid seed security assessment focused on seed security in the three target districts looking at flood‐affected communities and local seed/grain markets. The national level seed system was only tangentially examined. Much information on the national situation can be found in the 2011 Seed Security Assessment: Southern Malawi. Table 1: Assessment Methods Method Literature Review Key informant interviews (3) Focus group discussions (10) Community meeting Women’s groups Farmer interviews (N=217) Transect walk (10) Agro‐dealer visits Seed/grain market analysis Content/Source Flood emergency reports Seed System Security Assessment methodology Malawi seed system studies Seed companies, Research organizations Community and separate women’s FGD aimed at: Agriculture and variety use and trends Seed sources by crop Women’s crop/seed constraints and opportunities Livelihood/coping strategies Seed source patterns Manure fertilizer use Seed aid and new variety access Farming systems Flood losses Seed types and other input supplies Pricing Assessment of: Crop variety supplies on the market Sourcing areas and pricing patterns Seed quality management Three separate multi‐disciplinary teams were formed to assess the three target districts. Various organizations were represented on the teams including CRS, the District Agricultural Development Offices, Concern Worldwide, and the Catholic Development Commission (CADECOM). Each team consisted of four core members, and was assigned a data entry operator. A three day preparatory 6 workshop was held prior to field work. In addition to review of the SSSA methodology and tools, a field test was conducted in Sani Village, Rural Blantyre District. Teams spent six full days in each of the target districts from the 8th through the 14th of March 2015, visiting a minimum of three communities each. In each community, a general meeting was held, a women’s focus group conducted, a transect walk undertaken, and a minimum of 20 household interviews held. The community work focused on gathering quantitative data on seed sourcing and seed use for the last winter season as well as plans for the upcoming winter season. Further qualitative information was gathered on crop profiles and trends, evaluation of seed sources, perceptions of seed security, and crop and seed innovations. In addition, local market visits were conducted with interviews of small and larger grain traders and agro‐dealers. The aim of the market visits was to quickly comprehend the local grain/seed market and trends in price and supply. Purposeful sampling was used to select participants in the household survey. In order to facilitate access to households, volunteers were selected from the community meeting. This probably introduced a certain bias to the process by selecting people who were eager to be interviewed. Nevertheless, communities were assumed to be relatively homogenous. Other biases introduced into the data include the potential of people to over report losses or under report assets. Rural households in Malawi have been on the receiving end of emergency assistance of one sort or another for over a generation now and many have learned how to manipulate the relief system. Table 2: Household Sample Characteristics (N=217) Feature Type of HH Sex of HH Head Area cultivated by HH Description % Sample Adult headed Grandparent headed Male Female 96% 4% Below 1/2 acre 1/2 ‐ 1 Acre 1 ‐ 2 Acres 54% 30% 12% Over 2 acres 5% 56% 44% The Selected Zones The teams focused their Seed System Security Assessment in the three districts most affected by the flooding. These were Chikwawa, Nsanje, and Phalombe Districts. 7 Figure 1: Map of Southern Malaawi (Note thaat subsequen nt figures for d displacementt for these disstricts have in ncreased – seee narrative below for morre recent figures for the ta rgeted districcts.) Together,, Chikwawa and a Nsanje Districts D consttitute the Loower Shire Vaalley Liveliho ood Zone, wh hich is located att the southernmost end off Malawi and d borders Mozzambique. Th he most impo ortant compo onents of the fo ood economyy are food crops, c ganyu (labor), cas h crops and livestock. C Cross‐border trade between the two coun ntries is quite e common an nd the zone relies on maiize imports from Mozamb bique. The averaage rainfall raanges from 900mm 9 to 1,2 200mm and rain falls mainly from November to M March. The zone has two types of cultivattable land; upland and w etland (dimb ba land) main nly along the Shire ere is substan ntial winter prroduction in tthe dimba lannds borderingg the Shire Rivver. The main n food River. The crops grow wn in upland fields are maaize, sorghum m, and millet, while in dimba lands maize, rice, tomaatoes, vegetable es, cowpeas and pigeon pe eas are grown n.1 1 Malawi Livelihoods profile 2005 8 er Shire Valle ey is divided d by the Shirre River. Thee west bank forms a relaatively level plain. The Lowe However, several kilom meters to the e east of the river the terrrain encounteers a steeply rising escarpment, from whicch a series off rivers and sstreams eman nate from thee mountains.. During the eextreme rains, the force from m the waterss of these rive ers destroyed d or damagedd much of th he main road as well as seeveral bridges, le eaving the eaast bank difficcult to accesss. Nsanje Dist rict, the soutthernmost paart of Malawi,, bore the full brrunt of the flo ooding, as all the floodwatters accumulaated there as they drained d through thee Shire River. As of Februaryy 11, there were w 29,839 displaced inn camps in C Chikwawa District and 8 80,387 2 displaced people in cam mps in Nsanje e District. Figure 2: Flood Leve els in Chikwaawa and Nsaanje Districtts – 10 and 113 January 2 2015 Phalombe e District is lo ocated in souttheastern Maalawi on the ssouthern sidee of Lake Chilw wa and the b border with Mozambique. It rreceives an annual rainfalll of about 7000‐1000mm, and crop prod duction is relaatively pecially on the e Lake Chilwaa basin becau use of poor qquality sandyy soils. The m main crops thaat are poor, esp grown forr food are maaize, cassava, sorghum and d rice. Generaally, most of the households in the zon ne are subsistence farmers w who sell part o of their produ uce in order tto access otheer basic need ds.3 While flo ooding along the courses of riivers was cau used as high w water levels bburst the rein nforced bankks of the Phalombe River, the e excessive raainfall also caaused flooding in other low w‐lying areass of the district. As of Feb bruary 11, 32,259 94 displaced p people were d displaced in ccamps in Phallombe Districct. 2 THE IDP SSITUATION IN TTHE SOUTHERN N REGION OF M MALAWI DISPLLACEMENT TRA ACKING MATRIX (DTM) REPO ORT, 6 March 201 15, IOM 3 Malawi Livelihoods Profile 2005 4 THE IDP SSITUATION IN TTHE SOUTHERN N REGION OF M MALAWI DISPLLACEMENT TRA ACKING MATRIX (DTM) REPO ORT, 6 March 201 15, IOM 9 The Seed Market The seed development process is initiated either by government research stations in Malawi or seed companies bringing in new varieties from SADC countries to test here. Once breeder seed is received/developed it goes through the following process: Multiplication Certification Research trials Registration Field Demonstrations Release In all cases, a new variety needs to be tested, evaluated, and formally released by the Agriculture Technology Release Committee (ATRC). There is a variety of seed companies in Malawi. These include: 1. Seed‐Co 2. Monsanto 3. Panner 4. Chemicals and Marketing (carrying Pioneer seed) 5. SeedTech 6. FUNWE farms (producing OPVs) 7. Demeter 8. Pantochi 9. ASSMAG Seed sold by companies is predominately maize. The seed is packaged and sold through agro‐dealers. Some agro‐dealers have large networks like Kulima Gold, ATC, AGORA, and Farmers’ World. Others are independent. Generally, seed companies only deal with agro‐dealers approved by the Seed Traders Association of Malawi. Sweet potatoes follow a similar process. New varieties are developed and tested at the Bvumbwe Research Station near Blantyre. Once the initial multiplication stage has been completed, planting material is further multiplied and distributed through a small network of certified sweet potato multipliers; two exist in Chikwawa. Farmers obtain the new varieties from these certified multipliers. Some farmer groups do additional multiplication. Sweet potato vines are not handled through the formal agro‐dealer network. The government Farm Input Supply Program is a prime mover in the certified seed market. According to a Seed‐Co representative, over 70% of Seed‐Co sales are through the FISP program. FISP is an agricultural input supply subsidy program aimed at enhancing small‐holder farmer food security. The program provides coupons that can be redeemed at agro‐dealers. Theoretically, a basket of inputs are supplied to farmers including 5kg of hybrid maize seed (or 7.5 of OPV), 2kg of legume seed, a 50 kg bag of fertilizer at discounted prices, and grain storage chemicals. Despite the size of the program, coverage is inconsistent; many targeted farmers receive nothing and others only receive some of coupons. An active coupon black market has developed as many cash‐strapped farmers sell their coupons at a discount. This has led to a situation where often fertilizer procured with FISP coupons is sold at local markets at less than the price it can be found at the agro‐dealers. 10 In addition to the FISP program, seed distributions have been a regular response to various food security crises over the past decade. Over half of all survey respondents (53%) had received seed aid in the last five years, with those having received reporting an average of 1.5 distributions during the period. 53% of the seed aid had been through vouchers, particularly the FISP program. 46% of the seed aid had been through direct distribution, primarily from NGOs. The table below shows an assessment by communities of the various seed sources. Ganyu is labor provided to other farmers, usually for land preparation, and is often paid in‐kind with grain/seed. Utilizing social networks, existing non‐seed quality grain is frequently exchanged with neighbors for seed quality grain. Table 3: Community Assessment of Seed Sources SOURCE Own source Social network (exchange) Local market Ganyu Agro‐dealers Government NGO ADVANTAGES Convenient‐since the seed is readily available as needed DISADVANTAGES ‐Quality is sometimes compromised. They sometimes keep on recycling the same seed ‐The system is unreliable when there are huge losses of seeds in a given community due to disaster e.g. sweet potato vines are scarce in most communities in Nsanje. ‐There is a high likelihood of breeding diseases Convenient‐since the seed is ‐Same as above readily available as needed Convenience‐since the seed is ‐Farmers cannot be assured of readily available as needed the seed quality ‐Sometimes prices are high Convenient‐since the seed is ‐Same as above readily available as needed Seed quality is good ‐Expensive to purchase ‐Transport is a burden Seed quality is good ‐This is unreliable because High yield sometimes seed is not distributed on time ‐It is only a few who benefit through this system Seed quality is good ‐Same as above High yield Prices and Supply According to one seed company source, the flood is a blessing in disguise, because now farmers will be actively seeking short cycle varieties with a good yield. This demand for short cycle varieties applies to the shorter cropping period winter season, but also the summer season as farmers attempt to get an early harvest and avoid the periodic dry spells that routinely affect maize production. 11 Seed produced by Chemicals and Marketing, supplier of Pioneer seed, is produced on non‐irrigated land, and the pendulum of heavy rains and dry spells have reduced production considerably. As such, their seed will be in short supply this season. However, Seed‐Co, Malawi’s largest supplier of seed, produces seed under irrigation which is less susceptible to variations in the weather. SeedCo is confident that its supply can satisfy demand. Prices for certified maize seed have generally risen since last year at the retail level. At Mphadso Agro‐ dealer in Nchalo, the price of 1 kg of seed has risen from MKW 850 last year to MKW 1,200 currently. In Bereu the price of a 2 kg bag of seed has risen from MKW 1,500 last year to MKW 2,000 presently. Much of farmers’ seed, particularly maize and beans, comes from the local market. Discussions with traders revealed that they will source locally during the harvest period in September and October, but main sources of grain come from elsewhere. In the Nchalo market in Chikwawa, most larger traders are procuring their maize from Dedza, in Central Malawi. For beans, much seed is being procured from Nsanje or Dedza. Prices for maize have dropped recently in Chikwawa. Prices are said to have gone down because of decreased demand due farmers’ loss of income during the flood, but also because of large amounts of maize distributed to victims. The price of beans, on the other hand, has gone up as overall supply has decreased. Farmers will purchase grain as seed in the local market, although many vendors do not make the distinction between grain and seed. Some dealers will consciously purchase varieties that are in demand, select the best grain as seed, and sell the seed at higher prices. Others do not separate out the seed. Vendors report when supplies are high, farmers are more selective, but when supplies are low, they buy whatever is on the market. Results The assessment focused on last winter season (April – July 2014) and plans for the upcoming 2015 winter season (April – July 2015). Planting for the main cropping season in Southern Malawi corresponds to the rainy season, which normally starts in November, with harvest in May. In the Lower Shire Valley (Chikwawa and Nsanje districts) and Phalombe districts, many farmers in the flood plain can cultivate during the winter (dry) season by taking advantage of recession planting, residual moisture, and irrigation. These zones were the areas most affected by the flooding. Targeting the winter season for a seed intervention in these zones would allow households to recover more rapidly from the disaster. 12 Figure 3: Number of Farmers Growing Each Crop Major Crops (by % of farmers growing) in Winter Season 100% 90% 80% 70% 60% 50% 40% 30% 20% 10% 0% In Malawi, maize is the staple crop. Farmers plant it both in the main (summer) and winter seasons. The above chart shows the main crops grown last winter season in the assessment area and the number of farmers growing the crop. Maize, is grown by virtually all farmers. Vegetables are grown by around half the farmers, followed by beans and sweet potatoes. Table 4: Seed planted by source in last winter season (% of all seed) % of total Crop Maize Total kg sowed Home saved /own stock Carryover friends, ‐ maize neighbors, local hybrids relatives market agro‐ input dealer community‐ based seed groups government NGO / FAO contract seed growers Other 1791.0 15.9 2.5 8.7 39.3 16.1 0.1 8.0 8.3 0.0 1.2 314.0 30.3 0.0 12.4 55.7 0.0 0.0 0.0 1.6 0.0 0.0 2988.5 28.7 0.0 30.9 32.8 0.0 1.1 1.2 5.3 0.0 0.0 55.0 0.0 0.0 0.0 54.5 0.0 0.0 0.0 45.5 0.0 0.0 717.5 10.0 0.0 18.0 64.2 0.0 0.0 0.1 2.9 0.7 4.2 Cowpea 48.0 14.6 0.0 0.0 56.3 6.3 0.0 0.0 2.1 0.0 20.8 Vegetables 16.1 15.1 0.0 0.7 79.0 3.8 0.0 0.2 1.2 0.0 0.0 Chickpeas 7.0 0.0 0.0 28.6 71.4 0.0 0.0 0.0 0.0 0.0 0.0 5937.1 22.2 0.7 21.0 40.3 4.9 0.6 3.1 6.0 0.1 1.0 Rice Sweet potato Irish potato Common beans TOTAL, all crops The above table shows the main crops planted by kg during the last winter season and their main sources. Maize, the primary crop, is principally sourced through the local market, followed by own stock and agro dealers. The local market, own stock, and social networks (friends, neighbors, and relatives) provide local, non‐certified seed varieties. Agro dealers, the government, and NGOs provide certified seed. 68% of maize seed planted consists of local varieties and 32% is certified. Maize and vegetable seed are the only seed sourced from agro dealers. It is interesting to note that 16% of all maize planted 13 comes from NGOs and the government (through the FISP program) indicating a high level of dependence on donated or subsidized seed. Rice and sweet potato have the highest level of home sourced seed. Sweet potato is vegetatively propagated and 93% of the planting material is locally sourced from own stock, social networks, the local market and community based seed groups. In Chikwawa, local multipliers of sweet potato planting material have been established. The only formal sources of sweet potato vines have been distributions from the government and NGOs and a handful of certified multipliers in the districts. Most rice seed is obtained at the local market. This includes rice purchased from growers in the irrigation schemes in the area. A substantial amount of rice is from saved seed. Bean, probably the second major crop, shows very little seed retained at home. Most is purchased in the market. The crop is self‐pollinating and retains its characteristics, so farmers can rely on what they find in the local market. The reliance on the local market for seed stock (40% of all seed in the current season came from the local market), demonstrates that farmers have difficulty retaining enough quality seed to plant the next season. This indicates that seed may be consumed or lost in storage. However, the ability to purchase seed in the market shows that farmers are usually able to obtain cash to purchase needed seed. Table 5: Seed to be planted by source in the coming winter season (% of all seed) % of total Crop Maize Rice Sweet potato Irish potato Total kg sowed Home saved /own stock Carryover ‐ maize hybrids friends, neighbors, relatives local market 2095.5 8.8 2.8 1.2 52.1 355.0 9.9 0.0 3.9 3987.0 22.0 0.0 29.4 agro‐ input dealer community‐ based seed groups government NGO / FAO contract seed growers Other 22.0 0.0 3.6 7.0 0.0 2.6 79.2 7.0 0.0 0.0 0.0 0.0 0.0 36.0 0.0 1.4 5.3 3.0 1.5 1.4 99.0 15.2 0.0 0.0 84.8 0.0 0.0 0.0 0.0 0.0 0.0 826.3 9.5 0.0 6.5 77.1 0.7 0.0 0.1 3.0 0.0 3.0 Cowpea 53.0 5.7 0.0 7.5 62.3 5.7 0.0 0.0 0.0 0.0 18.9 Vegetables 69.2 5.2 0.0 0.1 21.2 73.1 0.0 0.2 0.2 0.0 0.0 Chick peas 2.0 0.0 0.0 0.0 100.0 0.0 0.0 0.0 0.0 0.0 0.0 7486.9 16.0 0.8 17.0 47.8 7.3 0.7 3.8 3.9 0.8 1.9 Common beans TOTAL all crops For the upcoming winter season, farmers plan to increase the total amount sown. Families are trying to rebound from the crop losses brought on by flooding and drops in production due to late and excessive rains, and planting more is one strategy to accomplish this. However, the source of the seed is changing considerably. Total seeds from own stock will fall from 22% to 16%, with maize seeds from own stock falling from 16% to 9%. For rice, generally planted on the floodplain, the decrease will be even more dramatic, falling from 30% to 10%. The percentages from social networks will decrease as well, as people realize their neighbors have suffered similar crop losses. For bean seed, planting from own stock will remain at 10%, but seed from social networks will fall from 18% to 7%. Farmers will increasingly plan to resupply through the local market, increasing from 40% to 48% of sourcing across all seed. The local 14 market will be supplemented by agro‐input dealers with their share of maize increasing from 16% to 22%. The data shows a significant drop in own saved seed and social networks of about 10%, reflecting losses in the field. Purchases in the local market will have grown by 8%. With the crop losses, the question arises, what resources will be used to obtain the seed from the market? Under normal circumstances, many households sell labor (ganyu) either in exchange for grain or seed, or for cash. Table 6: Availability of Seed: Evaluation by number of Communities CROP Own stock/social networks Low Normal High 8 1 2 1 6 2 1 2 1 Local market Agro‐dealers Low Normal High Low Normal High Maize 1 4 3 3 3 3 Beans 3 2 1 Sweet Potato 5 3 1 1 Rice 1 1 Vegetables 1 1 1 1 Irish Potato 1 1 Community meetings confirm the results of the household findings. Eight out of nine communities reported that own saved seed was low to non‐existent. However, maize could generally be found in the local market. Sweet potatoes also were neither available from local stocks nor in most local markets. In Chikwawa, farmers are relying on sweet potato seed multiplier farmers in the irrigation scheme to source their planting material. Farmers also intend to procure rice seed from farmers in the irrigation schemes. Beans are reported to have limited availability from saved stock and the market (although market visits showed that beans were available there). Agro‐dealers generally do not carry bean seeds. In Phalombe, one community planting Irish potatoes had adequate saved stock to replant, although household interviews showed most planned on sourcing from the local market. Table 7: Households planning to plant more, same, or less quantities in the coming winter season compared to the last winter season, by crop % of households SAME LESS Crop Number of farmers MORE Maize Rice Sweet potato Irish potato Common beans Cowpea Vegetables Chickpeas TOTAL 215 26 85 6 96 18 98 1 545 20.0 23.1 22.4 0.0 14.6 0.0 9.2 0.0 16.7 15 65.1 61.5 56.5 66.7 71.9 88.9 79.6 0.0 68.3 14.4 15.4 21.2 33.3 12.5 11.1 10.2 100.0 14.7 Figure 4: % Change in Seed Quantities for Coming Winter Season % Change in Seed Quantities for Coming Winter Season (crops with at least 10 farmers reporting) 20 15 10 5 0 ‐5 Maize Vegetables Common beans Sweet potato Rice Cowpea For the upcoming season, many farmers are planting more to try to recoup the losses from the heavy rains and flooding. For the main crops, maize, beans, rice, and sweet potato, a larger percentage of farmers will plant more than those who plant less with consequent increase in total amount of seed planted. The percent of households planting more and planting less is roughly equal with the total quantity to be planted next season growing by 8%. This indicates that better off households are able to substantially increase their planting, whereas households with few resources will have to cut back. 16 Figure 5: Reason for Planting More Next Season Reasons farmers gave for planning to plant MORE than normal of a given crop for next season Other have decided to give more priority to agriculture well‐developed /new markets for crop or crop products good security (peace has arrived) good weather/rainfall have access to irrigation, fertilizer or other inputs (for… have tools/tractor, other machinery to help farm have more land/more fertile land feeling strong/healthy good/increased labor have especially good seed or good variety Seed quality got credit to buy seed more money to buy seed or seed price low Seed access more seed available due to free seed more seed available due to good harvest 0% 5% 10% 15% 20% 25% 30% 35% 40% Percentage of Respondents For those farmers deciding to plant more, 37% give their reason for increased planting as having more land or more fertile land, and 36% give their reason as deciding to give more priority to agriculture. We can consider both these responses as proxies for aiming to increase production in order to recoup losses from the flooding, while high floodwaters have increased the amount of land available for recession planting. 17 Figure 6: Reasons for Planting Less Next Season Reasons Farmers Gave for Planning to Plant Less Than Normal of a Given Crop Next Season Other other priorities than agriculture (e.g. have shop) markets for crop or crop products not well‐developed insecurity poor weather/rainfall lack of other inputs: controlled water supply/irrigation… animals/predator make production not possible plant pests/diseases make production not possible lack of tools/tractor/ other machinery to farm no/insufficient land or land not appropriate/sufficiently… illness/health problems no/insufficient labor seed available is not good quality or the variety is not… Seed quality no money to buy seed/poor finances or seed too high Seed access no seed/cuttings available from neighbors no seed available in market Poor harvest, seed lost in storage, seed consumed 0% 10% 20% 30% 40% 50% 60% 70% 80% 90% Percentage of Respondents The primary reason for planting less in the upcoming season is lack of money. Almost 80% of those growing less cited this reason for not planting as much. This shows that the main problem is not availability of seed, but access to seed. The crop losses from the heavy rains and flooding have left farmers with virtually no saved seed and limited means to purchase seed. Table 8: Use of Mineral Fertilizer Farmers using mineral fertilizer Last winter season Coming winter season Yes No Total N 66.8% 33.2% 217 Yes No Total N 71.2% 28.8% 215 18 Table 9: Crops on which Fertilizer Used If using fertilizer, on which crops? Crop Last winter season n % Coming winter season n % Maize 144 77% 149 80% Rice 2 1% 1 1% Sweet potato 0 0% 0 0% Irish potato 3 2% 3 2% Common beans 6 3% 6 3% Vegetables 31 17% 28 15% Total crops 186 100.0% 187 100.0% Fertilizer use is high among participants, with almost 70% using mineral fertilizer and more planning to use it next season. In the 2011 SSSA, 80% of farmers used mineral fertilizer and 86% planned on using it the following season. Mineral fertilizer is primarily used on maize, with 77% of the farmers using fertilizer applying it to that crop last winter season, and slightly more planning to do so in the coming season. High fertilizer use is probably related to the government FISP program which provides coupons for purchase of maize seed and fertilizer to its beneficiary farmers every year. Vegetables have the next highest use of mineral fertilizer. Oddly, rice received virtually no mineral fertilizer at all although rice is considered a cash crop by most communities. Table 10: Farmers Using Compost or Manure Farmers using compost/manure Last winter season Coming winter season Yes No Total N 59.0% 41.0% 210 Yes No Total N 69.1% 30.9% 217 Table 11: Crops on Which Compost or Manure Used If using compost/manure, on which crops? Crop Maize Rice Sweet potato Irish potato Common beans Vegetables Total crops Last winter season n % Coming winter season n % 115 0 0 1 12 39 167 140 0 0 3 13 48 204 69% 0% 0% 1% 7% 23% 100% 19 69% 0% 0% 2% 6% 24% 100% While only 59% of farmers applied compost or manure last winter season, the amount will increase to 69% for the upcoming season. The rate on each crop will remain the same but the total number of farmers planning to use it is increasing. This may be in response to the increased fertility needs of leached or washed soil and/or compensation for reduced financial wherewithal to purchase mineral fertilizer. While those applying mineral fertilizer remains the same, they may be applying reduced amounts and supplementing with compost/manure. District Level Results Chikwawa In Chikwawa, the team visited three communities: Sekela in the Kasisi T/A and Sande in Maseya T/A on the west bank, and Kasitu in Katunga T/A on the east bank. On the east bank, although most riverside communities have land in both the floodplain and upland, Kasitu had minimal upland territory. It had once been situated on the edge of the river and subsequently moved to higher ground because of flooding. On the west bank, although the land is relatively level, land not in the floodplain is considered upland. Table 12: Area Cultivated by % of Farmers ‐ Chikwawa Area cultivated N % Below 1/2 acre 1/2 ‐ 1 Acre 1 ‐ 2 Acres Over 2 acres 29 22 10 8 42.0% 31.9% 14.5% 11.6% TOTAL 69 100.0% Landholdings are quite small in the target area, with 74% of respondents cultivating less than one acre, and 42% cultivating less than one half an acre. Maize, beans, and sweet potatoes are the principal winter season crops. All the crops are considered highly important for food security, but only rice, beans, and sweet potatoes are also considered income earners in the market. The winter season starts with recession planting and continues with irrigation. Many of the irrigation systems (mainly wells with treadle pumps, but also one piped system) were severely damaged during the flood. Sekela on the west bank had lost maize and rice crops in the floodplain. In addition, a piped irrigation system installed by the WALA project lost pipes. It is currently unknown who will repair the system. It was reported that the next village upstream had larger losses of crops and houses. Sande is also on the west bank, along the Mwanza River, and has little upland area. The village lost maize, rice, pigeon peas, cotton, and groundnuts in the flood. Ten cement shallow wells were silted in, and at the moment, only three can be found. 11 out of 15 treadle pumps were lost. About half of the houses in the community were also flooded and two lives were lost. Around 40 residents remain in camps. Kasitu on the east bank cultivates mainly in the floodplain by the Mwambwazi River. Residents say that floodwaters had never reached the levels reached this year. Crop losses included maize, banana, pawpaw, sugarcane, beans, sweet potato, pigeon pea, and rice. Four concrete wells were silted in and 20 one was uprooted completely and washed 50 meters downstream. Much of the cropland is covered by up to 30 cm of sand. Farmers have to dig through the sand to reach the soil. Table 13: Seed planted by source in last winter season (% of all seed) ‐ Chikwawa % of total Crop Total kg sowed Maize Home saved /own stock 815.5 13 Rice 190.0 32 Carryover ‐ maize hybrids friends, local agro‐ community‐ neighbors, market input based seed relatives dealer groups government NGO / FAO contract seed growers Other 5 7 38 24 0 3 8 0 2 0 20 48 0 0 0 0 0 0 Sweet potato 380.0 5 0 80 4 0 8 1 2 0 0 Common beans 511.5 13 0 13 66 0 0 0 1 1 6 22.0 0 0 0 36 14 0 0 5 0 46 2.8 0 0 0 91 6 0 0 3 0 0 1921.8 13 2 24 40 10 2 2 4 0 3 Cowpea Vegetables TOTAL, all crops Maize is the principal crop in Chikwawa during the winter season followed by beans (often intercropped with maize), and sweet potato. Rice is also an important crop. The local market is the main source for seed except for the vegetatively propagated sweet potato. Beans are most heavily purchased in the market followed by rice. Rice has the largest percentage of own/saved seed. A significant amount of maize is sourced from agro‐dealers (24%) as compared to the total for the three districts surveyed (16%). This may reflect a better network of agro‐dealers than in the other districts. Table 14: Seed to be planted by source in coming winter season – (% of all seed) – Chikwawa % of total Crop Total kg sowed Maize Home Carryover saved ‐ maize /own hybrids stock 876 2 3 friends, neighbors, relatives local market agro‐ community‐ input based seed dealer groups 2 57 30 government NGO / FAO contract seed growers Other 0 1 5 0 1 Rice 217 2 0 5 81 12 0 0 0 0 0 Sweet potato 522 7 0 78 3 0 11 0 0 0 2 Common beans 520 13 0 8 77 1 0 0 2 0 0 Cowpea 26 8 0 8 73 12 0 0 0 0 0 Vegetables 50 0 0 0 0 100 0 0 0 0 0 2,210 6 1 22 50 15 2 0 2 0 1 TOTAL all crops For the upcoming season, overall own saved seed use will drop from 13% to 6% with a corresponding increase in local market sourcing from 40% to 50%. Again, this reflects the loss of the previous season’s crop in the flood and heavy rains. While social network sourced seed only drops from 24% to 22%, it is only sweet potato that retains social networks as a principal source, with rice, maize, and beans shifting to other sources. The importance of social networks for sweet potatoes reflects the presence of sweet potato multiplication groups in the area in addition to a certified planting material provider. With the 21 loss of home saved seed, agro‐dealers will increase as a source of maize and vegetable seed. In fact, farmers plan on sourcing 100% of their vegetable seed from agro‐dealers, whereas they had only sourced 6% of vegetable seed there pre‐flood. Table 15: Households planning to plant more, same, or less quantities in the coming winter season compared to the last winter season, by crop ‐ Chikwawa % of households Chikwawa District MORE SAME LESS Crop Number of farmers Maize Rice Sweet potato Common beans Cowpea Vegetables TOTAL 70 14 18 48 8 11 169 12.9 14.3 27.8 0.0 0.0 18.2 10.7 71.4 64.3 72.2 89.6 75.0 72.7 76.3 14.3 21.4 0.0 10.4 25.0 9.1 12.4 Figure 7: % Change in Expected Seed Quantities for the Coming Winter Season ‐ Chikwawa % Change in Seed Quantities for Coming Winter Season ‐ Chikwawa (crops with at least 10 farmers reporting 60 50 40 30 20 10 0 ‐10 ‐20 Maize Rice Sweet potato Common beans Vegetables While there is a net increase in total seed to be planted in the upcoming season, more farmers are planning on planting less than are planning on planting more. The only crop with a significant increase will be sweet potato. The shift toward more sweet potato may reflect the relatively small landholdings available to the farmers and the higher amount of yield from sweet potato. In addition, sweet potato has a short cycle and will be able to harvest relatively quickly filling a gap in food availability. 22 Figure 8: Reasons for Planting Less Next Season – Chikwawa Reasons farmers gave for plannning to plant LESS than normal of a given crop for next season Other other priorities than agriculture (e.g. have shop) markets for crop or crop products not well‐developed insecurity poor weather/rainfall lack of other inputs: controlled water supply/irrigation… animals/predator make production not possible plant pests/diseases make production not possible lack of tools/tractor/ other machinery to farm no/insufficient land or land not appropriate/sufficiently… illness/health problems no/insufficient labor seed available is not good quality or the variety is not liked no money to buy seed/poor finances or seed too high no seed/cuttings available from neighbors no seed available in market Poor harvest, seed lost in storage, seed consumed 0% 10% 20% 30% 40% 50% 60% 70% 80% 90% 100% % of responses Farmers who will plant less have clearly identified that their main reason for planting less next season is lack of money. 23 Figure 9: Reasons for Planting More Next Season, Chikwawa Reasons farmers gave for planting more than normal of a given crop for next season Other have decided to give more priority to… good security (peace has arrived) good weather/rainfall have access to irrigation, fertilizer or other… have tools/tractor, other machinery to… have more land/more fertile land feeling strong/healthy good/increased labor have especially good seed or good variety got credit to buy seed more money to buy seed or seed price low more seed available due to free seed more seed available due to good harvest 0% 10% 20% 30% 40% 50% 60% 70% 80% % of responses For those planning to plant more, the primary reason is access to more land. They are planning on cultivating more in order to make up for crop losses during the flood by using the greater areas of land available for recession planting created by the high floodwaters. However, as shown by the previous chart, many consider themselves unable to do this because of lack of financial resources. Table 16: Community Perception of Seed Security by Crop CROP Maize Beans Sweet potato Rice Out of 100 households, how many grow the crop? 100 100 55 45 Out of those who grow the crop, how many will be secure this upcoming season? 20 10 30 10 % who are seed secure 20% 10% 55% 22% The community assessment of seed security coincides with the results of the household survey. If one can consider the combined own supply and social networks as guaranteed sources, with some households having the wherewithal to procure in the local market, then the estimates given by the communities are fairly close. Households report bean stocks and sweet potato stocks at higher levels than the community perception. Sweet potatoes provide the greatest seed security, while beans provide the lowest. Sweet potatoes also have local groups producing planting material which assure farmers of access. 24 Table 17: Use of Mineral Fertilizer ‐ Chikwawa Farmers using mineral fertilizer Last winter season Coming winter season Yes No Total N 52.9% 47.1% 70 Yes No Total N 50.7% 49.3% 69 Chikwawa has a relatively low rate of chemical fertilizer use – around 50% compared to almost 70% over the three districts surveyed. Almost 90% of people not using chemical fertilizer consider it too expensive, while around 10% consider that the soil is sufficiently fertile. Table 18: Use of Compost or Manure – Chikwawa Farmers using compost/manure Last winter season Coming winter season Yes No Total N 54.3% 45.7% 70 Yes No Total N 65.7% 34.3% 70 Compost and/or manure use is higher than that of chemical fertilizer, but still lower than the total of the three districts. 38% of those not using it consider it unnecessary because the soil is already fertile. 32% have no access to it. Table 19: Seed Aid in Last Five Years ‐ Chikwawa Number of Seed aid in last 5 yrs? (%) farmers Yes No Total 70 49% 51% 100% 49% of households have received seed aid in the past five years with those recipients receiving an average of 1.2 times. 75% of the seed aid has been provided by NGOs with only 25% provided by the government. There was minimal coverage by the government’s FISP program, which may also explain the lower level of chemical fertilizer use in the area. Nsanje In Nsanje, the team visited four villages, Kazingizi in the Ndamera T/A, Gilbert in the Ngabu T/A, Mgona in the Tengani T/A, and Mbenje in the Mbenji T/A. All are located on the west bank. All have both dimba land and upland areas except for Mbenji, which is entirely dimba land. 25 Table 20: Area Cultivated by % of Farmers ‐ Nsanje Area cultivated N % 13 Below 1/2 acre 20.0% 1/2 ‐ 1 Acre 1 ‐ 2 Acres Over 2 acres 36 14 2 55.4% 21.5% 3.1% TOTAL 65 100.0% 80% of farmers interviewed cultivate over one‐half acre of land, indicating that the poorer farmers in Nsanje were able to cultivate more land than those in Chikwawa. Kazingizi is characterized by both upland and dimba land. The entire community was displaced in the flooding. The flood swept through the low lying areas and village, cutting roads, collapsing houses, and even a washing out a graveyard. All stored grain was lost. Crops like maize, vegetables, rice seedlings and sweet potato vines were lost in the fields along with livestock. Canals of the local irrigation scheme were silted up. Gilbert has land primarily in the flood plain. People were displaced and houses and stored grain destroyed. Crops of maize, sorghum, rice seedlings, sweet potato and vegetables were lost along with livestock. Feeder roads and three bridges were destroyed. The irrigation network in the one large area of wet dimba land along the Shire River and its three tributaries was silted up. Mgona has more upland than dimba area. Some people were displaced. Crops of maize and bull rush millet were lost along with livestock. Feeder roads were cut at several points. One small dimba area was silted up and an upland irrigation scheme water collection point was destroyed and its canals silted up. Mbenje is entirely lowland, and the population displaced by the flood. Crops of maize, beans, vegetables, sweet potato and sorghum were lost along with livestock. Roads and bridges were destroyed. Irrigation schemes were silted up and canals were damaged. Table 21: Seed planted by source in last winter recent season (% of all seed) ‐ Nsanje % of total Crop Maize Rice Sweet potato Common beans Total kg sowed Home Carryover friends, local agro‐ community‐ government saved ‐ maize neighbors, market input based seed /own hybrids relatives dealer groups stock 479 16 0 7 52 9 0 7 NGO / FAO contract seed growers Other 9 0 0 86 0 0 1 93 0 0 0 6 0 0 1,422 34 0 24 30 0 0 1 11 0 0 132 3 0 42 45 0 0 1 10 0 0 Cowpea 1 100 0 0 0 0 0 0 0 0 0 Vegetables 6 0 0 0 95 3 0 0 2 0 0 2,125 27 0 21 39 2 0 2 10 0 0 TOTAL, all crops 26 The table shows that formal sources of seed are used rather minimally in Nsanje. 87% of seeds are sourced through local informal channels. A remarkable 12% of all seed is provided by donations from NGO or the government. Maize is primarily sourced through the local market. Unlike Chikwawa, rice farmers do not report saving seed to plant, and source it almost entirely from the local market. Sweet potato has the highest rate of home saved stock use. Table 22: Seed to be planted by source in the coming winter season (% of all seed) ‐ Nsanje % of total Crop Maize Total kg sowed Home saved /own stock 569 18 Carryover ‐ maize hybrids friends, neighbors, relatives local market agro‐ community‐ input based seed dealer groups government NGO / FAO contract seed growers Other 2 1 61 15 0 1 2 0 0 68 15 0 4 81 0 0 0 0 0 0 1,617 24 0 33 38 0 0 0 2 4 0 196 7 0 1 89 0 0 1 3 0 0 Cowpea 6 18 0 0 82 0 0 0 0 0 0 Vegetables 1 77 0 1 3 16 0 0 4 0 0 2,456 21 0 22 49 4 0 0 2 2 0 Rice Sweet potato Common beans TOTAL all crops Looking at the source of seed for next season, social networks will remain essentially the same, but there will be a 6% decrease in own seed. Planned local market sourcing will increase by 10%. Agro dealers should boost sales of maize and, like Chikwawa, benefit from a notable shift of vegetable seed sourcing from the local market to agro‐dealers. Table 23: Households planning to plant more, same, or less quantities in the coming winter season compared to the last winter season, by crop ‐ Nsanje Crop Maize Rice Sweet potato Common beans Cowpea Vegetables TOTAL Nsanje District Number of farmers 64 9 42 38 4 15 172 % of households MORE 33 22 24 34 0 27 29 27 SAME 45 67 45 53 100 40 49 LESS 22 11 31 11 0 33 22 Figure 10: % Change in Expected Seed Quantities for the Coming Winter Season ‐ Nsanje % Change in Seed Quantities for Coming Winter Season ‐ Nsanje (crops with at least 10 farmers reporting) 60 40 20 0 ‐20 Maize Sweet potato Common beans Vegetables For the upcoming season, significant numbers are planning on planting more of beans and maize and less sweet potato. This contrasts with Chikwawa where farmers are planting more sweet potato, less rice and beans, with maize staying relatively stable. This may due to the presence of local sweet potato producer groups in Chikwawa. Figure 11: Reasons for Planting Less Next Season – Nsanje Reasons farmers gave for plannning to plant LESS than normal of a given crop for next season Other other priorities than agriculture (e.g. have shop) markets for crop or crop products not well‐developed insecurity poor weather/rainfall lack of other inputs: controlled water supply/irrigation… animals/predator make production not possible plant pests/diseases make production not possible lack of tools/tractor/ other machinery to farm no/insufficient land or land not appropriate/sufficiently… illness/health problems no/insufficient labor seed available is not good quality or the variety is not… no money to buy seed/poor finances or seed too high no seed/cuttings available from neighbors no seed available in market Poor harvest, seed lost in storage, seed consumed 0% 20% 40% 60% 80% % of responses 28 While lack of financial resources continues to be the main reason for planting less, 15% of respondents cite no seed/cuttings available from neighbors as a reason. This corresponds to the household survey data showing a drop in these sources. Another 5% say that lack of inputs, including irrigation, hampers them. This is probably due to the large amount of irrigation infrastructure lost in the area. Figure 12: Reasons for Planting More Next Season – Nsanje Reasons farmers gave for planning to plant MORE than normal of a given crop for next season Other have decided to give more priority to… good security (peace has arrived) good weather/rainfall have access to irrigation, fertilizer or other… have tools/tractor, other machinery to… have more land/more fertile land feeling strong/healthy good/increased labor have especially good seed or good variety got credit to buy seed more money to buy seed or seed price low more seed available due to free seed more seed available due to good harvest 0% 5% 10% 15% 20% 25% 30% 35% 40% 45% % of respondents Of those planning to plant more of a particular crop, many are now able to cultivate more or more fertile land, and many others reporting that they are giving more priority to agriculture. The extent of the flood has in fact, created more dimba land – a vast area that can be planted using residual moisture as the floodwaters recede. Table 24: Use of Mineral Fertilizers ‐ Nsanje Farmers using mineral fertilizer Last winter season Coming winter season Yes No Total N 47.7% 52.3% 65 Yes No Total N 70.8% 29.2% 65 A large increase in fertilizer use is planned, perhaps in order to fertilize the additional land available. 29 Table 25: Use of Compost or Manure ‐ Nsanje Farmers using compost/manure Last winter season Coming winter season Yes No Total N 63.1% 36.9% 65 Yes No Total N 75.4% 24.6% 65 More farmers are also planning on using compost the upcoming season, mainly on maize, although 27% will be using compost for vegetable production. Table 26: Farmers Receiving Seed Aid in Last 5 Years, Nsanje Number of Seed aid in last 5 yrs.? (%) farmers Yes No Total 64 59% 41% 100% A larger number of households in Nsanje have benefitted from seed aid in the last five years than in Chikwawa (59% compared to 49%). 60% of the aid has been provided by NGOs, with 40% provided by the government. Phalombe In Phalombe, villages visited included Mulambe in the Chiwalo T/A, Romoliwa in the Nazombe T/A, and Chimombo and Phutheya in the Jenala T/A. Main crops in the area include maize, sweet potatoes, beans, rice, and vegetables, particularly tomatoes. Irish potatoes are a newly introduced crop in Mulambe. In the winter season, farmers undertake irrigation farming, mainly using residual moisture as the water recedes, supplemented by irrigation using treadle pumps that are common in the areas and buckets to carry water to their crops. Table 27: Area Cultivated by % of Farmers ‐ Phalombe Area cultivated N % Below 1/2 acre 1/2 ‐ 1 Acre 1 ‐ 2 Acres Over 2 acres 75 6 1 0 91.5% 7.3% 1.2% 0.0% TOTAL 82 100.0% Of the three districts, Phalombe has the smallest sized landholdings, with over 90% of households cultivating less than 1/2 acre during the winter season. This may indicate that holdings in the lowland area with enough moisture or irrigation are simply less available than in the Lower Shire Valley. Of the three communities visited: Mulambe lies at the foot of the hills, Romoliwa is at the foot of mountain ranges, while Chimombo and Phuteya are in the flood plain. The effect of excessive rains differed in each community. 30 In Mulambe and Romoliwa, crops, particularly maize, suffered from waterlogging and much was swept away, as the fields are both in the hills and below the homesteads. Farmers are predicting a small harvest because there has been excessive leaching (loss of nutrients) and waterlogging due to excessive rainfall. ` Chimombo and Phuteya villages have large areas of grasslands growing where their maize crop once stood. The banks of Phalombe River burst, with floodwaters sweeping away all in their path, including most of the houses and livestock. People had to be rescued by boat to the camp in the area. There was no loss of life as the floods happened during the day. Most of the roads to the villages are still passable. Because the land is flat, there are very few bridges and the main bridge/drift on Phalombe River was carried away and people are still using a boat to cross to the other side. In all the communities, the main feature was the poor maize stand, and communities expressed their worry in terms of how food insecure they will be this year. Some people have been forced to harvest grass seed to supplement their diet. Table 28: Seed planted by source in the last winter season (% of all seed) ‐ Phalombe % of total Crop Total kg sowed Maize 497 Home saved /own stock 20 Carryover ‐ maize hybrids friends, neighbors, relatives local market agro‐ input dealer government NGO / FAO contract seed growers Other 11 community ‐based seed groups 0 1 12 29 17 9 0 1 Rice 38 92 0 0 8 0 0 0 0 0 0 Sweet potato 1187 30 0 23 45 0 0 2 0 0 0 Irish potato 55 0 0 0 55 0 0 0 46 0 0 Common beans 74 0 0 12 88 0 0 0 0 0 0 Cowpea 25 24 0 0 76 0 0 0 0 0 0 Vegetables 8 33 0 1 62 4 0 1 0 0 0 Chickpeas 7 0 0 29 71 0 0 0 0 0 0 TOTAL, all crops 1191 26 0 19 43 3 0 6 4 0 0 Maize and sweet potato predominate among crops planted. Both are mainly sourced in the local market with 45% for sweet potato and 29% for maize. 20% of maize seed is from own stock while 30% of sweet potato is own stock. Beans are almost entirely from the local market while 46% of Irish potatoes come from NGO’s reflecting the NGO’s promotion of Irish potato as a cash crop. 31 Table 29: Seed to be planted by source in the coming winter season (% of all seed) ‐ Phalombe % of total Crop Maize Rice Sweet potato Irish potato Common beans Cowpea Vegetables TOTAL all crops Total kg sowed Carryover ‐ maize hybrids friends, neighbors, relatives local market agro‐ input dealer 651 Home saved /own stock 10 government NGO / FAO contract seed growers Other 17 community ‐based seed groups 0 4 0 38 10 14 0 8 70 29 0 0 71 0 0 0 0 0 0 1,848 24 0 13 44 0 0 11 5 0 2 99 15 0 0 85 0 0 0 0 0 0 111 0 0 9 55 3 0 0 11 0 23 22 0 0 9 46 0 0 0 0 0 46 18 15 0 0 83 1 0 1 0 0 0 2,820 20 1 9 45 4 0 10 7 0 5 Own stock will be reduced as a source in the coming winter season, and social networks will drop by 10%. Own stock sourced rice will drop from 92% to 29%. The difference is expected to be covered by purchases from the local market. Agro‐dealers will gain marginally as a source, mainly through a 6% increase as a source of maize. Table 30: Households planning to plant more, same, or less quantities in the coming winter season compared to the last winter season, by crop ‐ Phalombe Crop Maize Rice Sweet potato Irish potato Common beans Cowpea Vegetables Chickpeas TOTAL Number of farmers 81 3 25 6 10 6 72 1 204 % of households MORE SAME 16 75 67 33 16 64 0 67 10 60 0 100 4 89 0 0 11 78 32 LESS 9 0 20 33 30 0 6 100 11 Figure 13:‐ % Change in Seed Quantities Expected for the Coming Winter Season ‐ Phalombe % Change in Seed Quantities for Coming Winter Season ‐ Phalombe (crops with at least 10 farmers reporting) 10 5 0 ‐5 ‐10 ‐15 Maize Sweet potato Common beans Vegetables There is no net difference in farmers planting more or less for all crops. However, there are notable trends in change of choice of crops. 16% of maize farmers are planning on planting more. Bean planting will decrease. Figure 14: Reasons for Planting Less Next Season – Phalombe Reasons farmers gave for plannning to plant LESS than normal of a given crop for next season Other other priorities than agriculture (e.g.… insecurity poor weather/rainfall lack of other inputs: controlled water… animals/predator make production not… plant pests/diseases make production… lack of tools/tractor/ other machinery to… no/insufficient land or land not… illness/health problems no/insufficient labor seed available is not good quality or the… no money to buy seed/poor finances or… no seed/cuttings available from neighbors no seed available in market Poor harvest, seed lost in storage, seed… 0% 20% 40% 60% 80% 100% 120% % of responses 33 95% if respondents cite financial problems as reasons for decreasing planting. Figure 15: Reasons for Planting More Next Season – Phalombe Reasons farmers gave for planning to plant MORE than normal of a given crop for next season Other have decided to give more priority to agriculture well‐developed /new markets for crop or crop products good security (peace has arrived) good weather/rainfall have access to irrigation, fertilizer or other inputs (for… have tools/tractor, other machinery to help farm have more land/more fertile land feeling strong/healthy good/increased labor have especially good seed or good variety got credit to buy seed more money to buy seed or seed price low more seed available due to free seed more seed available due to good harvest 0% 20% 40% 60% 80% 100% 120% % of respondents 96% of respondents say they are giving greater priority to agriculture, particularly as a means of recouping losses from the flooding. Note that there are no responses for having more land or more fertile land, indicating that additional land through recession farming is not an option. Table 31: Use of Mineral Fertilizer ‐ Phalombe Farmers using mineral fertilizer Last winter season Coming winter season Yes No Total N 93.9% 6.1% 82 Yes No Total N 88.9% 11.1% 81 A high percentage ( 94%) of farmers use mineral fertilizer. 76% use the fertilizer on maize while 21% use it on vegetables (including tomatoes). This may be because the government’s FISP program has benefitted more households in Phalombe than in the Lower Shire Valley. Next season, farmers are planning a small reduction in mineral fertilizer use, perhaps because of financial constraints. 34 Table 32: Use of Compost or Manure ‐ Phalombe Farmers using compost/manure Last winter season Coming winter season Yes No Total N 60.0% 40.0% 75 Yes No Total N 67.1% 32.9% 82 60% of farmers use compost and/or manure. 68% use it on maize while 26% use it on vegetables. Compost/manure use will increase this upcoming season as farmers use it as a substitute for reductions in mineral fertilizer. Table 33: Farmers Receiving Seed Aid in Last 5 Years – Phalombe Number of Seed aid in last 5 yrs.? (%) farmers Yes No Total 79 52% 48% 100% While the percentage of seed aid in Phalombe is comparable to the other districts, the source is reversed. The government contributes 65% of seed aid with NGOs providing 31%. Gender Differences In the Lower Shire Livelihood Zone, women’s focus groups reported that there was no difference between men’s and women’s crops, except that sweet potato cultivation was the responsibility of the women. In Phalombe, vegetables, pigeon peas, and ground nuts are mainly grown by women while maize, sweet potatoes, and rice are grown by both men and women. However, in all zones, once any crop is marketed, the proceeds come under the control of men. Women consider maize, sweet potatoes, rice, tomato, and vegetables as the most important crops. For nutritional needs, vegetables, cowpeas, beans and soya are considered as key crops. Flooding, drought, lack of agricultural inputs, poor harvests, and labor constraints are the current stresses affecting these communities, with the communities altering the proportions of crops grown due to lack of money. Women generally perform ganyu in order to obtain seeds, or money for seeds. During periods of stress, they will also sell charcoal, as well as grass for roofing 35 Table 34: Women‐headed Households – last winter season, Total kg sowed, by % total % of total Total kg sowed Home saved /own stock Carryover ‐ maize hybrids friends, neighbors, relatives local market agro‐ input dealer 701.5 16.2 0.3 12.8 43.3 12.8 97.0 0.0 0.0 9.3 85.6 937.5 24.1 0.0 30.9 10.0 0.0 0.0 289.0 6.2 10.0 Vegetables Chickpeas Crop Maize Rice Sweet potato Irish potato Common beans Cowpea TOTAL, all crops community ‐based seed groups government NGO / FAO contract seed growers Other 0.0 6.3 8.3 0.0 0.0 0.0 0.0 0.0 5.2 0.0 0.0 38.1 0.0 3.4 0.7 2.7 0.0 0.0 0.0 50.0 0.0 0.0 0.0 50.0 0.0 0.0 0.0 11.6 77.7 0.0 0.0 0.3 2.4 1.7 0.0 10.0 0.0 0.0 70.0 10.0 0.0 0.0 10.0 0.0 0.0 1.7 4.7 0.0 4.3 79.8 8.6 0.0 1.5 1.2 0.0 0.0 2.0 0.0 0.0 100.0 0.0 0.0 0.0 0.0 0.0 0.0 0.0 2048.7 17.5 0.1 20.7 47.9 4.4 1.6 2.6 5.0 0.2 0.0 The mix of crops grown by women corresponds to the mix of the overall population with maize predominating, followed by sweet potato and beans, and then rice. Current season total seed sourcing levels among women are relatively close to the overall population, except that women depend more on the local market (47% among women vs. 39% overall population). Rice seed is overwhelmingly sourced from the local market, while common beans are sourced there 78% of the time by women, vs. 64% of the time by the overall population. Table 35: Seed to be planted by women by source in the coming winter season (% of all seed) % of total Home saved /own stock Carryove r ‐ maize hybrids friends, neighbors, relatives local market 848.5 10.0 3.9 0.4 55.8 Total kg sowed Crop Maize Rice Sweet potato Irish potato Common beans Cowpea Vegetables TOTAL all crops agro‐ input dealer community‐ based seed groups 15.7 0.0 government NGO / FAO contract seed growers Other 5.7 7.9 0.0 0.7 90.0 5.6 0.0 5.6 88.9 0.0 0.0 0.0 0.0 0.0 0.0 1514.0 5.5 0.0 30.6 39.8 0.0 3.6 13.9 6.6 0.0 0.0 65.0 0.0 0.0 0.0 100.0 0.0 0.0 0.0 0.0 0.0 0.0 309.5 3.2 0.0 6.1 87.1 0.0 0.0 0.0 3.6 0.0 0.0 19.5 15.4 0.0 20.5 59.0 5.1 0.0 0.0 0.0 0.0 0.0 1.0 29.4 0.0 1.8 34.1 15.8 0.0 10.5 8.4 0.0 0.0 2847.5 6.5 1.2 17.4 52.7 4.7 1.9 9.1 6.3 0.0 0.2 As with the overall population, own saved stock will decrease as a source along with social networks, while local markets will increase as a source. However, women start with lower own stock and rely on the local market more. They also appear to be counting on government and NGO distributions for seed. 36 Table 36: Women Farmers planning to plant more, same, or less quantities in the coming winter season compared to the last winter season, by crop % of women SAME LESS Crop Number of farmers MORE Maize Rice Sweet potato Irish potato Common beans Cowpea Vegetables TOTAL 94 10 38 2 42 10 46 255 21 20 16 0 17 0 4 16 63 60 55 100 74 90 87 69 15 20 29 0 7 10 9 15 Figure 16: % Change in Seed Quantities Expected for the Coming Winter Season ‐ Women % Change in Seed Quantities for Coming Winter Season ‐ Women (crops with at least 10 farmers reporting) 15 10 5 0 ‐5 ‐10 Maize Vegetables Common beans Sweet potato Rice Cowpea In the coming season, roughly the same amount of women will be planting more as will be planting less. Although about the same percentage of households will be planting more maize the upcoming season, the increase in the quantity planted will be greater among women than with the overall population. However, while the overall population will be planting more sweet potato, women will be planting less, and women will be planting less vegetables as well. 37 Figure 17: Reasons Women Farmers Plan to Plant Less In the Coming Winter Season Reasons women farmers gave for planting LESS than normal of a given crop in next winter season % of responses 0% 10% 20% 30% 40% 50% 60% 70% 80% 90% no money to buy seed/poor finances or seed too high no seed/cuttings available from neighbors Poor harvest, seed lost in storage, seed consumed no/insufficient land or land not appropriate/sufficiently fertile animals/predator make production not possible As with the general population, the main constraint to planting the upcoming season is monetary (80% of responses). However, the drop in availability through the ocial network is also important, as 11% will plant less because of not being able to obtain seed/cuttings from neighbors. Figure 18: Reasons Women Farmers Plan to Plant More In the Coming Winter Season Reasons women farmers gave for planting MORE than normal of a given crop in the next winter season % of responses 0% 10% 20% 30% 40% 50% 60% have more land/more fertile land have decided to give more priority to agriculture more money to buy seed or seed price low good weather/rainfall good/increased labor feeling strong/healthy Other Women who intend to plant more cited more land / more fertile land as the most common reason for their decision (49%), followed by deciding to give more priority to agriculture (32%). 38 Table 37: Use of Mineral Fertilizer by Women Farmers Women farmers using mineral fertilizer Last winter season Coming winter season Yes No Total N 57.9% 42.1% 95 Yes No Total N 65.3% 34.7% 95 Fewer women farmers use chemical fertilizer than the overall population (58% to 67%) while the rates of compost/manure use are comparable. In conclusion, women depend more on the local market to source their seed. Not only will financial constraints reduce their planting, but the lack of seed/planting material from social networks will force women to plant less. Women will change their planting mix in response to the crisis by planting more maize, rice and beans while reducing sweet potato and vegetable production. Recommendations for the Acute Seed Security Crisis The late onset of rains, followed by heavy rainfall and flooding and then further dry spells, have created a multifaceted seed crisis. Late rains led to late planting. The flooding wiped out many crops and left farmers with no harvest and no seed for the next season. Heavy rainfall has led to considerable leaching of upland crops. Dry spells during tasseling reduced both the quantity and quality of the maize harvest. The loss of crops has left farmers with little saved seed and has also deprived them of the means to purchase new seed. Seed is available both in the local market as grain, and from the formal network of agro‐dealers. The principal problem for affected farmers is one of access. Farmer reports and observations in local markets show no shortage of grain for sale. Interviews with agro‐dealers and seed companies also show that there is sufficient stock of seed to meet anticipated high demand. Essentially, farmers need an injection of cash in order to purchase seed and other inputs for the upcoming season. Farmers need the seed quickly, as the winter season planting will begin in April. Table 38: Average cash needs for planned seed purchases Crop Total planted % local purchase % Agro‐dealer purchase 22% Total Cost (MWK) Maize 9.75 kg 56% 4,875 Sweet Potato 18.5 kg 65% 1,202 Beans 3.8 kg 84% 3,192 TOTAL 9,269 TOTAL US $ (1 $ US = 450 MWK) $ 20.60 The above chart is an estimate of what the cost would be for farmers to make their planned seed purchases for the three main crops in the market today. A bag of fertilizer would cost an additional 15,000. With the sharp decrease in own saved seed and the increase in purchases from both the local market and agro‐dealers, cash requirements have increased. This comes at a time when resources for investing in the next season have been lost due to the flood. 39 Possible responses to the acute flood induced seed access crisis are (in descending order of preference): 1. Diversity Fairs providing a mixed supply of seed and planting material from both local and formal seed sources 2. Standard seed fairs providing farmers unlimited choice of available seed and planting material 3. Coupons to be redeemed at local agro‐dealers and other seed/planting material suppliers 4. Standard distribution of selected seed. Options 1 and 2 – Seed Fairs, are the recommended method to give farmers a choice of seed and also promote the local production and sourcing of seed – stimulating a long‐term solution to the chronic seed crisis. CRS has engaged in Seed Fairs in Malawi since 2003, and more recently in “Diversity fairs” (known as DiNER in the seed fair literature – Diversity and Nutrition for Enhanced Resilience) as an attempt to break the grip that maize has on Malawi as the only source of food security. The DiNERs provide not only maize seed, but also provide vouchers specifically for other crops to balance maize in the diet, such as legumes and sweet potatoes Given Malawians overwhelming focus on maize, the diversity fairs ensure that other crops such as legumes and sweet potatoes are also procured. These additional crops provide not only nutritional benefits, but also benefit the farming system, with legumes fixing nitrogen and the diversity of crops helping to manage risk. Option 3 – Coupons to be redeemed at local agro‐dealers, are probably the simplest method to arrange and manage. However, the approach imposes transport costs on the farmers needing to go to the agro‐ dealer and transport the seed back to the village. It also restricts crop choice largely to maize and an occasional legume. In addition, local informal sources of seed (other farmers) and the local market are excluded. There is also a risk of “monetization” of the coupons – farmers selling the coupons at a discount in order to get cash. This frequently happens with the government FISP program, which is why fertilizer (obtained with discounted FISP coupons) can often be bought in villages at below market rates. Option 4 – Standard seed distribution, is the last alternative. It is a very top‐down process; it undermines the local seed system, and blocks the relationship the agro‐dealers should have with local farmers. It gives the farmers no choice of which type of seed they access. Organization of Diversity Fairs DiNER Fairs should be held at accessible locations, usually existing market centers. Potential vendors should be contacted, both from the informal and formal sector. Although local maize may be difficult to procure, farmers in the upland areas may have stocks of local maize seed on hand and potentially supply the fairs. Agro‐dealers need to be advised in advance in order to procure sufficient stock of both hybrid and OPV maize from their suppliers. Dealers should be advised to sell legume seed in small packets of 1 kg or less enabling purchase of small quantities of seed. There are a limited numbers of sweet potato planting material producers in the zones – a handful of certified producers in the three districts along with some individual and group producers in Chikwawa District. They should be invited to the fairs. Rice may also be difficult to obtain since it is not available in the local market and farmers have lost their crop. Rice farmers from the irrigation schemes may be interested in selling at the fairs. 40 The presence of small livestock would also give farmers additional choices in their livelihood recovery strategies. Participants can be provided with maize specific coupons (if one wants maize, one can only use a maize specific coupon. However, maize coupons can be used for other purchases) and generic coupons good for other crops. Vouchers will be printed in a variety of denominations, to allow the farmers to negotiate with suppliers both on quantity and price. A “bank” may need to be created to exchange larger denomination coupons for smaller ones. The fair vendors should accept either cash or vouchers. The vouchers will not be sufficient to supply farmers with their entire input needs for the winter season. Thus, farmers can benefit from the wide selection of seed and suppliers at the fair to purchase additional inputs. Agro‐dealers can also be encouraged to bring fertilizer and other inputs to sell for cash. The combination of both vouchers and cash enables both seed suppliers and seed consumers to make connections that can lead to building of long‐term commercial relationships. A monitoring system needs to be set up to track all the purchases by supplier in cash and vouchers. Recommendations for Longer Term Seed System Security Successive seed handouts over the years have created a culture of dependency among farmers and an expectation that seeds will be provided in response in any crisis. This has discouraged both local and formal seed systems. In order to enhance local seed system security the assessment team recommends: 1. Encourage formation of producer groups for vegetatively propagated crops such as sweet potatoes. In Chikwawa, the presence of producer groups has facilitated access to sweet potato cuttings post‐flood. These groups can become certified through training provided by the Bvumbwe Research Station. 2. Improve legume marketing channels. Currently, in Southern Malawi agro‐dealers seldom carry legume seed. Virtually the only way of extending improved varieties is through the FISP program and emergency seed distributions. Dissemination of new varieties and insuring availability of seed in the market can be accomplished through a variety of ways: a. Selling legumes in small packages at agro‐dealer shops, encouraging farmers to try the new varieties. b. Selling small packages in other venues such as shops and supermarkets. c. Creating seed loan groups where farmers are loaned seed to pay back at the end of the season d. Developing agro‐enterprise groups of farmers who produce and market seeds. Because access is the principal constraint to seed security, the team proposes the following: 3. Encourage Village Savings and Loans Associations to save for investing in seed and also provide loans for agricultural inputs. 4. Develop local agro‐enterprises in order to increase income. Conclusions Long term seed security may be an elusive goal. While many blame the series of droughts and floods for the chronic seed crisis, these mask profound systemic problems for seed security. The government FISP program pumps thousands of tons of free fertilizer and hybrid maize seed into the rural areas every year. While the program has injected needed resources to rural farmers, some of the main beneficiaries 41 of the subsidy are the seed and fertilizer companies. According to a Seed‐Co representative a remarkable 70% of their sales go through the FISP. This undermines local seed systems and skews the market for seed and fertilizer. Excessive reliance of chemical fertilizer has progressively diminished the organic matter in the soil. This has not only reduced the overall capacity of the soil to generate optimal growth, but has reduced the capacity of the soil to hold moisture. Ironically, the program that was intended to help farmers cope with repeated drought and flooding, has exacerbated their effects. Without adequate soil organic matter, even a short period without rainfall creates serious problems for drought sensitive crops like maize. Heavy rainfall is not absorbed by the soil, but washes the soil away, making flooding like that seen in January even worse. The continued seed and fertilizer donation by NGO’s, faith‐based organizations, and the government erodes local initiative to produce and save seed and warps the formal market for seed. Large seed companies do not target small farmers and farmer demand, but target the government FISP program and its demand. Seed fairs are a way around the reliance on seed and fertilizer distributions. While they enhance the local market and may stimulate local production of seed, they cannot fully address the chronic seed access issue. Seed fairs are not a panacea, in fact, repeated seed fairs will prolong the continued reliance of farmers on handouts. 42 Annex 1: Participants Chikwawa Team Lewis Lipenga Edward Walters Deborah Mwambutsu Elias Dinala Chikwawa District Agriculture Development Office Consultant (CRS) CADECOM Chikwawa CADECOM Chikwawa Nsanje Team Constantine Mulinde Andrew Chiwonda Joel Thom Sidala Mimiriwa Concern Worldwide Nsanje District Development Agriculture Office Concern Worldwide CADECOM Chikwawa Phalombe Team Norias Kayira Henry Moyo Peter Mawere Grace Ndholovu CRS Phalombe District Agriculture Development Office CADECOM Blantyre CADECOM Blantyre Backstopping Jim Ashman Mercy Kayira CRS Data Quality 43 Annex 2: Bibliography CIAT, WALA, CRS and Government of Malawi. Seed System Security Assessment, Southern Malawi. October 2011. Blantyre, Malawi: CRS and International Center for Tropical Agriculture Catholic Relief Services (CRS). 2002. Seed Vouchers and Fairs: A Manual for Seed‐Based Agricultural Recovery in Africa. Catholic Relief Services, developed in collaboration with International Crops Research Institute for the Semi‐Arid Tropics and Overseas Development Institute. Nairobi, Kenya. Department of Disaster Management Affairs of Malawi. 17 February 2015. Malawi: Floods Situation Report no. 9. Department of Disaster Management Affairs of Malawi and United Nations Office of the Resident Coordinator in Malawi Department of Disaster Management Affairs of Malawi and International Organization on Migration. 6 March 2015. The IDP Situation in the Southern Region of Malawi Displacement Tracking matrix (DTM) Report. Department of Disaster Management Affairs of Malawi and International Organization on Migration Malawi National Vulnerability Assessment Committee and SADC FANR Vulnerability Assessment Committee. September 2005. Malawi Baseline Livelihood Profiles, Version 1. Malawi Ministry of Economic Planning and Development Mloza‐Banda, H.R., Kauduzu, G., and Benesi, I., 14 October 2010. Evaluation of the Malawi Seed Sector for the Common Market for Eastern and Southern Africa (COMESA) Harmonized Seed Regulations and Policies. African Seed Trade Association Sperling, Louise. 2008. When Disaster Strikes: A Guide To Assessing Seed System Security. Cali Colombia: International Center for Tropical Agriculture. Sperling, L. and Remington, T. with Haugen, J.M. 2006. Seed aid for seed security: advice for practitioners. Practice Briefs 1‐10. Rome, Italy, International Center for Tropical Agriculture and Catholic Relief Services. UNICEF. 25 February 2015. Malawi Humanitarian Situation Report #11. UNICEF UNICEF. 18 March 2015. Malawi Humanitarian Situation Report #14. UNICEF 44

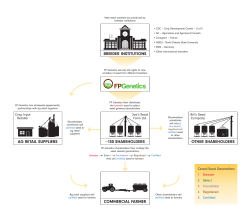
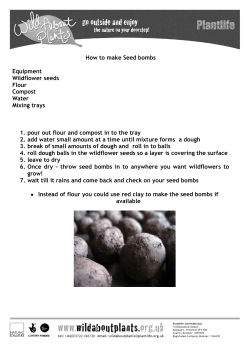
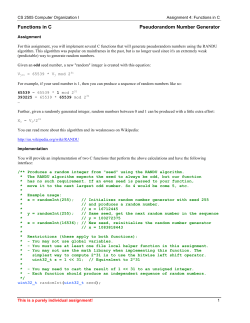

© Copyright 2026