
Diagnosing the dangerous demography of manta rays using life history theory
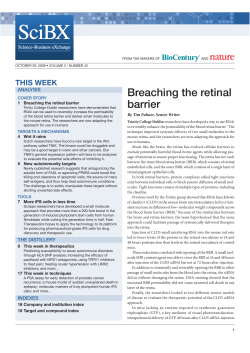
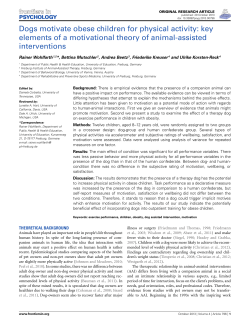
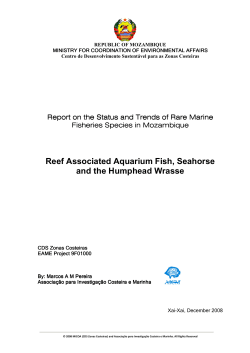
Diagnosing the dangerous demography
of manta rays using life history theory
Nicholas K. Dulvy1 , Sebastián A. Pardo1 , Colin A. Simpfendorfer2 and
John K. Carlson3
1 Earth to Ocean Research Group, Department of Biological Sciences, Simon Fraser University,
Burnaby, British Columbia, Canada
2 Centre for Sustainable Tropical Fisheries and Aquaculture & School of Earth and Environmental
Sciences, James Cook University, Townsville, Australia
3 NOAA/National Marine Fisheries Service, Southeast Fisheries Science Center, Panama City,
FL, USA
ABSTRACT
Submitted 20 December 2013
Accepted 7 May 2014
Published 27 May 2014
Corresponding author
Nicholas K. Dulvy, [email protected]
Academic editor
John Bruno
Additional Information and
Declarations can be found on
page 13
DOI 10.7717/peerj.400
Copyright
2014 Dulvy et al.
Distributed under
CC0
Background. The directed harvest and global trade in the gill plates of mantas, and
devil rays, has led to increased fishing pressure and steep population declines in some
locations. The slow life history, particularly of the manta rays, is cited as a key reason
why such species have little capacity to withstand directed fisheries. Here, we place
their life history and demography within the context of other sharks and rays.
Methods. Despite the limited availability of data, we use life history theory and
comparative analysis to estimate the intrinsic risk of extinction (as indexed by the
maximum intrinsic rate of population increase rmax ) for a typical generic manta ray
using a variant of the classic Euler–Lotka demographic model. This model requires
only three traits to calculate the maximum intrinsic population growth rate rmax : von
Bertalanffy growth rate, annual pup production and age at maturity. To account for
the uncertainty in life history parameters, we created plausible parameter ranges and
propagate these uncertainties through the model to calculate a distribution of the
plausible range of rmax values.
Results. The maximum population growth rate rmax of manta ray is most sensitive
to the length of the reproductive cycle, and the median rmax of 0.116 year−1 95th
percentile [0.089–0.139] is one of the lowest known of the 106 sharks and rays for
which we have comparable demographic information.
Discussion. In common with other unprotected, unmanaged, high-value largebodied sharks and rays the combination of very low population growth rates of
manta rays, combined with the high value of their gill rakers and the international
nature of trade, is highly likely to lead to rapid depletion and potential local extinction unless a rapid conservation management response occurs worldwide. Furthermore, we show that it is possible to derive important insights into the demography
extinction risk of data-poor species using well-established life history theory.
Subjects Aquaculture, Fisheries and Fish Science, Conservation Biology, Ecology, Marine
Biology, Science Policy
Keywords CITES, Data-poor fisheries, Life history invariant, Wildlife trade, Euler–Lotka,
Population growth rate, Accounting for uncertainty, Von Bertalanffy growth function, Ocean
ivory, Chinese medicine
OPEN ACCESS
How to cite this article Dulvy et al. (2014), Diagnosing the dangerous demography of manta rays using life history theory. PeerJ 2:e400;
DOI 10.7717/peerj.400
INTRODUCTION
The rapid rise in demand for plant and animal products that are traded through
international networks has globalised the reach of economically-powerful consumers
causing unsustainable depletion of biological resources (Berkes et al., 2006; Lenzen et al.,
2012). While we have long understood the challenges of poaching for the illegal ivory trade
(Phillis et al., 2013), we are only now just beginning to reveal the enormous scale of trade
in aquatic organisms, such as for the live food fish trade (Sadovy & Vincent, 2002), and the
dried product trade in shark fins (Clarke et al., 2006), seahorses (Foster & Vincent, 2004),
sea cucumbers (Anderson et al., 2011), and fish swim bladders (Clarke, 2004; Sadovy &
Cheung, 2003).
A recent emerging international trade in manta and devil ray gill plates is driving
overexploitation elevating their extinction risk (IUCN/TRAFFIC, 2013). The high value
of gill plates and the international nature of the trade are driving roving bandit dynamics,
incentivising serial depletion and a globalized tragedy of the commons (Berkes et al., 2006).
If the population growth rate of manta rays is low, this pattern of exploitation could lead
to rapid depletions and local extinction of manta populations. There are two described
species of manta ray: Manta birostris (Walbaum, 1792), and M. alfredi (Krefft, 1868).
These mantas, and at least some of the nine devil rays and at least some of the nine devil
rays (Mobula spp.), are reported in national catch statistics and appear in international
trade (CITES, 2007; Couturier et al., 2012; Ward-Paige, Davis & Worm, 2013). Manta and
devil rays are taken in targeted fisheries and also as a valuable retained bycatch in China,
Ghana, India, Indonesia, Mexico, Peru, Philippines, Sri Lanka and Thailand (Couturier et
al., 2012; IUCN/TRAFFIC, 2013). Over the past decade the landings of manta and devil
rays have risen more than ten-fold from less than 200 tonnes (t) per year in 1998 to a
peak of over 5,000 t in 2009 (Ward-Paige, Davis & Worm, 2013). Manta and devil rays are
captured for their gill plates and a single mature animal can yield up to 7 kg of gillrakers
which can be worth as much as $680 per kg in Chinese markets (Heinrichs et al., 2011;
IUCN/TRAFFIC, 2013). Much of the international trade goes to southern China, and to
Chinese communities in other countries (Couturier et al., 2012; Heinrichs et al., 2011).
For example, one of the authors has seen devil ray gill plates for sale for $396.80 per kg
(under the incorrect taxonomic name Dasyatis centroura) in Vancouver, in 2013 (Fig. 1).
The trade is currently difficult to monitor because of a lack of international trade codes and
species-specific catch and landings data. Despite this, ∼21,000 kg of dried Manta spp. gill
plates are traded annually, derived from an estimated >4,500 individual manta rays, and
worth US $5 million (Heinrichs et al., 2011; O’Malley, Lee-Brooks & Medd, 2013).
Many (46%) of chondrichthyans are Data Deficient (Dulvy et al., 2014), and in
comparison to the data-sufficient species we know little of the life history of manta rays
Manta birostris, and M. alfredi. This is particularly problematic when their viability is
threatened by rapidly emerging fisheries driven by international trade demand, and CITES
Non-Detriment Findings are required for continued international trade (Clarke, 2004;
Couturier et al., 2012). Both manta rays were listed as Vulnerable on the International
Union for the Conservation of Nature Red List of Threatened Species in 2011 because
Dulvy et al. (2014), PeerJ, DOI 10.7717/peerj.400
2/19
Figure 1 Image of devil ray gill plates for sale in Vancouver. Gill plates, tentatively identified as from the
sickle-fin devil ray Mobula tarapacana (Philippi, 1892), for public sale in downtown Vancouver, British
Columbia, Canada on 26th April 2013: photo credit Nicholas K. Dulvy.
of the inferred global decline due to directed gill-plate fisheries and their inferred slow
life histories (Marshall et al., 2011a; Marshall et al., 2011b). Moreover, recognizing this
threat, Brazil, Colombia and Ecuador successfully proposed Manta spp. for inclusion
in Appendix II of the Convention on International Trade in Endangered Species of
Wild Fauna and Flora (CITES). These listings will come into force on 14th September
2014, by which time their international trade will only be allowed if: (1) specimens were
legally sourced, and (2) the export is not detrimental to wild populations of the species
(a non-detriment finding, NDF) (Mundy-Taylor & Crook, 2013; Vincent et al., 2013).
Non-detriment findings rely on the ability to assess the sustainability of removals of
individuals for the international trade from national populations. One of the principal
challenges of assessing sustainability is that there is often a high degree of uncertainty
Dulvy et al. (2014), PeerJ, DOI 10.7717/peerj.400
3/19
in the population biology of species, and the pattern and rate of exploitation (Ludwig,
Hilborn & Walters, 1993). However, decisions on the sustainability of fisheries and trade
often have to be made without the benefit of sufficient information. Recent advances have
made it possible to account for sources of uncertainty and this is increasingly an important
part of the decision-making process in fisheries management and conservation (Baker &
Clapham, 2004; Magnusson, Punt & Hilborn, 2013; Peterman, 2004).
One approach to dealing with uncertainty in life histories is to draw upon life history
tradeoff rules that constrain the range of plausible trait values (Beverton & Holt, 1959; Law,
1979). There are fundamental constraints to the acquisition, allocation and metabolism of
energy resulting in a narrow set of rules of life (Dulvy & Forrest, 2010; Jennings & Dulvy,
2008). These rules can be used to choose a plausible range of life history traits, which when
combined with simple methods to propagate the uncertainty in the true trait value, can be
used to provide powerful insights into demography and fisheries sustainability (Beddington
& Kirkwood, 2005). Recent work using a simple life history model suggests manta rays are
intrinsically sensitive and have low capacity to rebound from even low levels of fishing
mortality (Ward-Paige, Davis & Worm, 2013).
Here, we examine the potential risk to manta ray populations from fishing to supply the
dried gill plate trade. Specifically, we calculate the maximum intrinsic rate of population
increase (rmax ) of manta rays, and compare their demography to other sharks and rays.
Our model and approach provides a demographic basis for evaluating the sustainability, or
otherwise, of manta fisheries in the face of considerable uncertainty in their life history.
MATERIALS AND METHODS
We first outline the Euler–Lotka life history model and the three key parameters required to
estimate the maximum rate of population increase (rmax ): the annual rate of production of
female offspring (α̃), age at maturity (αmat ), and the instantaneous natural mortality rate
(M). Second, we describe plausible ranges for each of those parameters for a generic manta
ray life history. Third, we use a Monte Carlo procedure to propagate the uncertainty these
three life history parameters through the Euler–Lotka model to calculate a distribution of
the plausible range of manta ray maximum rate of population increase rmax . Finally, we
compare the demography of the manta ray to the life histories and demography of 106
other sharks and rays.
We chose to estimate the extinction risk of manta rays by calculating the maximum rate
of population increase using a variant of the Euler–Lotka model (Garcı́a, Lucifora & Myers,
2008; Hutchings et al., 2012). This is one of the oldest and simplest life history models and
is founded on the principle that a breeding female only has to produce one mature female
in her lifetime to ensure a stable population size (Charnov & Schaffer, 1973; Charnov & Zuo,
2011; Myers & Mertz, 1998; Simpfendorfer, 2005):
α̃ = (ermax )αmat − p(ermax )αmat−1
where α̃ is the annual rate of production of female offspring. Here we calculated α̃ as
l/i ∗ 0.5, where is l litter size and i is breeding interval, corrected for sex ratio i.e., 0.5).
Dulvy et al. (2014), PeerJ, DOI 10.7717/peerj.400
4/19
αmat is age at maturity, and p is the adult survival rate, where p = e−M , where M is the
instantaneous natural annual mortality rate yr−1 . While local aggregations of manta rays
may be sex-biased we assume an even sex ratio at the, wider, species level. The simple
elegance of the model is that it requires only estimates of three biological parameters:
annual reproductive output (α̃), age at maturity (αmat ), and natural mortality (M). Two
of these parameters are highly uncertain (α̃ and αmat ) and the other (M) is estimated
indirectly, which can also result in uncertainty. Hence, we aim to estimate a range of rmax
to encompass the widest range of life histories that are plausible for manta rays and hence
would encompass the true parameter values.
The existence of more than one species of manta ray was only recently recognized
(Marshall, Compagno & Bennett, 2009); furthermore, with the geographic overlap and
in the absence of sufficient evidence to differentiate the life history traits required by the
model we thought it most defensible to evaluate a generic manta ray life history.
Annual reproductive output (α̃)
One pup is produced per litter (rarely two) and gestation period is approximately one
year (366–374 days in the Okinawa aquarium) (Couturier et al., 2012). This suggests at
least an annual breeding interval, but there may also be a chance of skipped breeding
or multiannual reproductive cycles. There is evidence for a biennial cycle where 1 pup
is produced every two years (Couturier et al., 2012; Marshall & Bennett, 2010). An even
more extreme example is the recent discovery of a complete absence of pregnant females
for four years in the Maldive Islands, following three biennial cycles, which could be
interpreted as one pup every five years (G Stevens, pers. comm., 2013). Similar patterns
of skipped reproduction have been noted in Japanese waters (T Kashiwagi, pers. comm.,
2013). It is worth noting that extended periods of ‘non-pregnancy’ may be an artifact
of occasional sightings and/or poor viewing angles (Bennett, 2014). As is typical in
demographic modeling we assume an even sex ratio. Under these assumptions a plausible
range would be an annual reproductive output averaging 0.25–0.5 female pups per year,
but we considered extremes out to an annual reproductive output 0.1 (1 female pup
every five years). Because of the simple tractable nature of our modeling approach, we
did not have the opportunity to consider juvenile mortality. However, juvenile survival
may not be of overriding importance for overall population growth rate, because they
are likely to have low mortality and contribute relatively little to population growth
rate compared to sub-adults (Heppell, Crowder & Menzel, 1999). We expect manta pups
to have low mortality due to their extremely large size in comparison to other sharks
and rays. Mortality patterns are strongly size-dependent in the ocean and hence larger
individuals are likely to have much higher survival rates (Charnov, Gislason & Pope, 2012;
Gislason et al., 2010; Pope, Shepherd & Webb, 1994). Manta offspring are some of the largest
offspring of any ectotherm in the ocean. The size of birth of manta pups is 130–150 cm
disc width, considering the maximum linear dimension this is one of the largest of any
elasmobranch. The maximum linear dimensions of offspring sizes of 274 elasmobranchs
ranged from 6.8 cm in Cuban pygmy skate (Fenestraja cubensis) to 175 cm in the basking
Dulvy et al. (2014), PeerJ, DOI 10.7717/peerj.400
5/19
Table 1 Growth estimates for tropical rays and whale shark. von Bertalanffy growth parameter estimates for species with similar life styles to the
manta rays; (a) tropical myliobatoid rays larger than 1 m total disc width, and (b) the tropical planktivorous whale shark.
a.
b.
Species
name
IUCN
statusa
Sex
Maximum
length (cm)b
Maximum
age (years)
L∞
k
Reference
Mobula japanica
Myliobatis californicus
Myliobatis californicus
Myliobatis californicus
Aetobatus flagellum
Aetobatus flagellum
Rhinoptera bonasus
Rhincodon typus
NT
LC
LC
LC
EN
EN
NT
VU
both
M
F
F
F
M
both
NA
310
158.7
158.7
158.7
150
100
102
1370
14
6
24
24
19
9
18
NA
NA
199.1
158.7
156.6
152.7
131.8
123.8
1400
0.28
0.0596
0.0095
0.099
0.111
0.133
0.075
0.026–0.051
(Cuevas-Zimbrón et al., 2012)
(Martin & Cailliet, 1988)
(Martin & Cailliet, 1988)
(Martin & Cailliet, 1988)
(Yamaguchi, Kawahara & Ito, 2005)
(Yamaguchi, Kawahara & Ito, 2005)
(Neer & Thompson, 2005)
(Garcı́a, Lucifora & Myers, 2008;
Pauly, 2002)
Notes.
a
IUCN Red List Categories: CR, Critically Endangered; EN, Endangered; VU, Vulnerable; NT, Near Threatened; LC, Least Concern; DD, Data Deficient.
b Disc width (cm) for rays and total length (cm) for whale shark.
shark (Cetorhinus maximus), and the size at birth disc width of a manta ray of 130–150 cm
lies in the upper 95th percentile of the distribution of maximum linear dimension of
size at birth or hatch of these elasmobranchs (Cortés, 2000; Goodwin, Dulvy & Reynolds,
2002; Jennings et al., 2008). As survival information becomes available, future models that
account for age and stage-specific mortality are likely to provide more nuanced insights
into manta ray demography.
Age at maturity (αmat )
Male reef manta rays (M. alfredi) mature at 3–6 years in Hawaii and female maturity is
subject to considerable debate, and for our purposes is inferred to be 8–10 years (Marshall
et al., 2011b).
Natural mortality (M)
Can be estimated indirectly from the von Bertalanffy growth coefficient (k) or can be
assumed to be the reciprocal of lifespan, 1/maximum age (Charnov, Gislason & Pope, 2012;
Dulvy et al., 2004; Pauly, 2002). Here we draw inferences from both approaches.
There is no growth curve available for manta rays, however we can draw some inference
as to the plausible range because fish growth parameters are narrowly constrained and
highly correlated because of fundamental life history tradeoffs (Charnov, Gislason & Pope,
2012). The rate of somatic growth (as indexed by the von Bertalanffy growth coefficient,
k) is negatively-related to the asymptotic maximum size (L∞ ) within a narrow range
(Jensen, 1996). Hence, we review the von Bertalanffy growth curves of larger tropical
batoids (>1 m) to guide the choice of a plausible range of k for manta rays. The available
growth rates for species with similar lifestyles, tropical and subtropical myliobatoid rays
(Table 1) and the tropical planktivorous whale shark, reveals that most k values lie between
0.009 yr−1 and 0.28 yr−1 (Table 1). It might be expected manta rays would have k values
toward the lower end of this range because they reach a considerably larger size than most
Dulvy et al. (2014), PeerJ, DOI 10.7717/peerj.400
6/19
of these myliobatoid rays. While known from temperate regions, they are typically found
in warm tropical and subtropical water. They are planktivores and hence can access a much
larger food resource base and higher growth might be expected at high temperatures.
There is some evidence that planktivores grow quickly because their feeding mode is more
energetically profitable when individuals (and their gape) reach a larger size. Comparisons
to whale shark and the slower growing myliobatoid rays would suggest manta k values
around 0.03–0.04 yr−1 (Wintner, 2000).
The maximum age of manta rays can be inferred from the longest period of resightings
of individuals through photo identification projects (Town, Marshall & Sethasathien,
2013). In Hawai‘i one female has been continuously resighted since 1979, providing a
minimum estimate of longevity of the Manta alfredi of 31 years (Clark, 2010). The inferred
manta ray maximum age of >31 years is considerably higher than the 19 to 25 years for Aetobatis flagellum, Myliobatis californicus and Rhinoptera bonasus, so a more plausible range
for k might be 0.05–0.1 yr−1 . Life history invariants can be used to estimate mortality from
growth rate, assuming an M/k ratio of 0.4 which is more typical for elasmobranch fishes
than the higher ratio of M/k = 1.5 observed in teleost fishes and reptiles (Frisk, Miller &
Fogarty, 2001). For a range of k of 0.03–0.1, then M is between 0.012 and 0.04 yr−1 .
Estimation of maximum intrinsic population growth rate
We model parameters encompassing the following ranges: k = 0.03–0.1, M = 0.012 to 0.04,
age at maturity = 8–10 years and an annual reproductive rate of 0.25 to 0.5 female pups per
year. To propagate the uncertainty inherent in these parameter ranges, we drew 10,000
values of each parameter from a random uniform distribution bounded by the plausible
range of each. While life history traits are typically distributed around a mean value in
a Gaussian manner, we choose a more conservative uniform distribution to explore the
full range of parameter space. Maximum intrinsic population growth rate was calculated
for the 10,000 triplets of α̃, αmat and M by iteratively solving for rmax using the nlminb
optimization function in R statistical software version 2.15 (R Core Team, 2013).
Manta rmax compared to other sharks and rays
We compared the manta ray rmax to all available estimates (n = 106), comprising 105
published estimates for chondrichthyans (Garcı́a, Lucifora & Myers, 2008), to which we
added the filter-feeding CITES-listed basking shark (Cetorhinus maximus) which has an
M of 0.024 (based on a growth coefficient k of 0.067), age at maturity of 10, and an annual
reproductive output of 1.5 females per litter every two years (assuming an 18 month
pregnancy) (Pauly, 2002). For plotting, we extracted all maximum sizes as the total length
in centimeters, except for Myliobatiformes and Chimaeriformes for which we used disc
width and fork length, respectively (Garcı́a, Lucifora & Myers, 2008; Pauly, 2002). There is
wide geographic variation in maximum disc width and many M. alfredi individuals average
around 400 cm increasing to 490 cm DW cm (Marshall, Dudgeon & Bennett, 2011). The
giant manta ray consistently reaches a maximum size of over 700 cm DW with anecdotal
reports of up to 910 cm DW (Marshall, Compagno & Bennett, 2009). Here, for graphical
purposes we assumed a maximum size of 600 cm DW.
Dulvy et al. (2014), PeerJ, DOI 10.7717/peerj.400
7/19
Figure 2 Maximum intrinsic rate of population increase for 106 chondrichthyans, and the manta
ray. (A) Maximum intrinsic rate of population increase for 106 chondrichthyans, including the manta
ray. (B) Sensitivity of manta ray maximum intrinsic rate of population increase to variation in natural
mortality rate, age at maturity and annual reproductive rate.
RESULTS
Assuming that the range of life histories explored encompasses our current knowledge,
then the median maximum intrinsic rate of population increase rmax for manta rays is
0.116 (95th percentile = 0.089–0.139, Fig. 2A). The lowest rmax value of 0.079 corresponds
Dulvy et al. (2014), PeerJ, DOI 10.7717/peerj.400
8/19
to an annual reproductive output, α̃ = 0.25, αmat = 10 years, and natural mortality, M =
0.04, and the highest rmax of 0.15 corresponding to α̃ = 0.5, αmat = 8 years, and M = 0.012.
The rmax decreases considerably when annual reproductive output is lower. The rmax
is most sensitive to annual reproductive output α̃ compared to the age at maturation
αmat , note the difference between each α̃ is greater than among growth rates or ages of
maturation (Fig. 2B). The sensitivity to annual reproductive output α̃ relative to age at
maturation αmat becomes increasingly important when annual reproductive output is low
(Fig. 2B). There is a positive relationship between growth (and hence mortality) and rmax
across species (Fig. 3A), and larger species have lower rmax (Fig. 3B).
Of the 106 species for which we could calculate the maximum intrinsic rate of
population increase, the manta ray had one of the lowest rmax values (0.116). The rmax
of deepwater sharks (n = 14) is significantly lower than for continental shelf and oceanic
pelagic species, as revealed by Garcı́a, Lucifora & Myers (2008). Aside from the deepwater
sharks which are all intrinsically sensitive to overfishing (Simpfendorfer & Kyne, 2009),
in shallower water the species with the lowest rmax were the temperate basking shark
(Cetorhinus maximus) rmax = 0.109, followed by the manta ray (rmax = 0.116).
We compared the maximum population growth rate rmax as calculated from the
modified Euler–Lotka models and the population growth rate r (which equals ln[λ]) as
calculated from age-structured models (Cortés, 2002). We found both measure of population growth significantly related, but the slope of the relationship was 0.26 (±0.09 standard
error) suggesting rmax is typically four times greater than r (F1,27 = 8.09, p = 0.008,
adjusted r2 = 0.2). Hence, in assessing the productivity of species against the criteria of
Food and Agriculture Organization of the United Nations (Musick, 1998), it might be more
precautionary to estimate r as rmax /4 = 0.029 (95th percentile [0.022–0.35]), and hence
manta ray has “very low” productivity (<0.05).
DISCUSSION
We show how life history theory can be used to guide the estimation of an important
demographic parameter—the maximum intrinsic rate of population increase rmax —and
likely sustainability of even the most difficult-to-study marine animals. Manta rays are
data poor but compared to many other chondrichthyans they are still relatively data rich.
Of the 1100+ known species, manta rays are among the 106 species for which we can
calculate rmax . Nevertheless, the paucity of life history data for manta rays is very typical
of the many data-poor fisheries of the world, particularly in the tropics. But the absence
of data should not preclude or delay management. Our analysis shows that manta rays
have one of the lowest maximum intrinsic rates of population increase of any of the
chondrichthyans studied to date. Our approach is designed not to estimate the one true
value of the maximum intrinsic population growth rate but to calculate these values while
understanding the sensitivity to the input parameters and accounting for uncertainty in
those values. Despite some uncertainty in life history traits, the plausible range of manta
ray rmax estimates is narrow (Fig. 2), because life history tradeoffs between maximum
asymptotic size and the growth rate narrow the parameter space. It is likely that the range
Dulvy et al. (2014), PeerJ, DOI 10.7717/peerj.400
9/19
Figure 3 Manta rays have low intrinsic rates of population increase due to their slow growth to a very
large size. Maximum intrinsic rate of population increase versus, (A) von Bertalanffy growth rate k, and
(B) maximum linear dimension (cm) for 106 chondrichthyans on a logarithmic scale. Whale and basking
sharks are highlighted for comparison. Manta ray mean (black diamond) and 95th percentiles.
Dulvy et al. (2014), PeerJ, DOI 10.7717/peerj.400
10/19
is narrower than we show because we could not account for the covariance of life history
traits, if we were able to do so this would further narrow the plausible range of manta ray
rmax estimates.
We find that the maximum rate of population increase is slightly higher than a recent
estimate of the intrinsic rate of population increase, r = 0.042–0.05 (Ward-Paige, Davis
& Worm, 2013), compared to our median rmax = 0.116. The range of parameters we used
encompassed those of Ward-Paige, Davis & Worm (2013) and suggest the difference in r
versus rmax may be due to differences in the method used to estimate natural mortality
and that the rebound potential method consistently provides lower population growth
rate. We used an elasmobranch-specific mortality estimator (Frisk, Miller & Fogarty,
2001), whereas the other used an estimator based on fishes, molluscs and whales (Hoenig,
1983). A more puzzling issue is why our approach reveals that manta rays have one of
the lowest rmax of any chondrichthyan, whereas the other suggests manta rays may have
an intermediate r (Ward-Paige, Davis & Worm, 2013). This issue is beyond the scope of
this paper, and requires a simulation-based performance comparison of these kinds of
models. While close, the difference in demographic estimates underscores the need for a
better understanding of such rule-of-thumb mortality estimators and a comparison of the
performance of different variants of simple scalar unstructured demographic models, such
as the Euler–Lotka model, the rebound potential model , and Pope’s Fjeopardy model (Pope
et al., 2000; Simpfendorfer, 2005; Smith, Au & Show, 1998).
Without the opportunity to consider juvenile survival rate, our estimates of rmax may
be slightly too high. We implicitly assume that juveniles have the same survival rate as
adults. However, a more realistic assumption might be to assume that juvenile survival rate
approaches adult survival rate as described by survival to adulthood raised to the power
of the age of maturity. Such an approach to juvenile survival would result in smaller rmax
values than we present here (EL Charnov, pers. comm., 2013).
One might object to the calculation of rmax given such great uncertainty in basic life
history of these data-poor species. However, the pragmatic reality is that we do not have
the luxury of waiting for more data to become available. And indeed increasing effort
is being paid to understanding safe biological limits for the exploitation of target and
bycatch species (Dulvy et al., 2004; Pardo, Cooper & Dulvy, 2012). At the most recent 16th
Conference of the Parties of the Convention on the International Trade in Endangered
Species both species of manta ray were listed on Appendix II, which includes, “species that
are not necessarily now threatened with extinction but that may become so unless trade is
closely controlled”. Under this regulation Appendix II species can only be traded subject
to three conditions, two of which pertain to the legality of capture and welfare (of live
transported species), and the third relates to the sustainability (or otherwise) of trade—the
so called non-detriment finding (Vincent et al., 2013). A non-detriment finding confirms
that the trade of specimens will not be detrimental to wild populations of the species. A
key condition of the CITES listings of both manta rays has been a delay by 18 months until
14th September 2014 (CITES, 2013). By this date, any nation, that is party to the CITES,
wishing to trade manta ray gill plates (or other products) needs to develop methods for
Dulvy et al. (2014), PeerJ, DOI 10.7717/peerj.400
11/19
assessing that proposed trade is sustainable and not detrimental to wild populations. There
is very little time in which to gather new data and hence our simple modeling demographic
model, constrained by life history tradeoffs and accounting for and propagating biological
uncertainty, provides a much-needed first step toward developing methods to support
the development of methods to assess the sustainability of exploitation and international
trade.
Our analysis reveals that a key parameter to estimate in future field studies are the
growth coefficient k from a von Bertalanffy growth curve, fitted appropriately to size-at-age
data (Pardo, Cooper & Dulvy, 2013; Smart et al., 2013; Thorson & Simpfendorfer, 2009).
Hopefully, the growth coefficient k can be estimated for manta rays, as has been done
for other smaller tropical myliobatoids. However, there is a real possibility that annuli
may not be recoverable from manta rays because mobulid vertebrate tend to be poorly
calcified (WD Smith, pers. comm., 2012). Hence, resighting programmes may be the most
pragmatic method of estimating a growth curve (Town, Marshall & Sethasathien, 2013). As
we have shown, natural mortality rate depends heavily on k and the ratio of M/k, which
is around 0.4 for elasmobranchs (Frisk, Miller & Fogarty, 2001). If it is not possible to
estimate a growth curve for manta rays in the near future then demographic modeling
will be heavily reliant on our understanding of: (1) the overall pattern of maximum size
(L∞ ) and growth coefficient (k) in elasmobranchs, and especially tropical and subtropical
batoids, and (2) the M/k ratio. Future work should concentrate on understanding why
the elasmobranch M/k ratio is around 0.4, by comparison the teleost and reptile M/k
ratio is around 1.5 (Charnov, Berrigan & Shine, 1993). This ratio has a profound influence
on the estimate of population growth rate and the sustainability of species, and hence
understanding the life histories, ecological and environmental correlates of the M/k ratio
can only improve the predictive power of these simple demographic models.
Other parameters that strongly influence the maximum intrinsic rate of population
increase are the age at maturation and the annual reproductive rate. These parameters are
very poorly understood (Marshall & Bennett, 2010). The manta ray annual reproductive
rate estimates of one pup per year are based on aquarium-held specimens under relatively
ideal conditions, and hence these estimates are likely to be optimistic. There is unpublished
evidence suggesting that annual reproductive rates may be much, much lower and variable
among and within individuals. The proportion of pregnant females returning to long-term
(6–8 years) study sites in the Maldives previously suggested a biennial reproductive mode,
but in recent years no pregnant females have returned (G Stevens, pers. comm., 2013). The
absence of returning pregnant females may indicate a spatial shift of returning females, but
also may hint at much lower and more variable annual rates of reproductive output than
we have modeled here. We recommend that the demographic rates of manta rays be revised
as more details of the temporal and geographic variability in reproductive output come
to light. The emerging observations of year-to-year variation in individual reproductive
output may lead to variance in year-to-year population growth rate which can only serve to
depress the long-term population growth rate further elevating extinction risk (Hutchings,
1999). And indeed such observations caution us to initiate and undertake local analyses
Dulvy et al. (2014), PeerJ, DOI 10.7717/peerj.400
12/19
of population structure and reproductive activity and to incorporate local variations
into local demographic models and assessments contribution to CITES Non-Detriment
Findings. Of course the greatest uncertainty, that we have entirely overlooked, is that future
demographic estimates would benefit greatly from species-specific estimates of the key life
history parameters: growth coefficient k, annual reproductive rate and age at maturity.
Notwithstanding the current uncertainty in the life history of manta rays, given their
very low productivity coupled with small localized populations and predictable seasonal
aggregations, the unregulated targeting of local Manta populations for their high-value
gill plates is unlikely to be sustainable. The largest targeted fisheries and highest mortality
occurs in Indonesia, Sri Lanka, India, Peru and Mozambique and these countries have
little fisheries monitoring, regulation or effective enforcement. The time to local extinction
depends on the size of the population and the rate of fishing mortality. The very low
productivity of manta rays mean that even a moderate level of fishing mortality of F = 0.2
(survival = 0.81) would reduce a small population of 100 individuals to fewer than 10
within less than a generation span (11 years). The key challenge this poses is that it leaves
little time to mount an effective conservation management response. These serial depletion
fisheries are operated by low-income subsistence coastal fishers, often against a backdrop
of declining fish stocks. For such fishers the international market demand for valuable
Manta and mobulid ray gill plates is likely to provide a desirable income. Such fisheries
tend to be unregulated and even if there are protections these are difficult to enforce, which
underscores the importance of international trade regulation.
ACKNOWLEDGEMENTS
We thank Thomasina Oldfield and Martin Jenkins for motivating this study. This work
was originally submitted as a working paper to the Fourth United Nations Food and
Agriculture Organization Expert Advisory Panel which met from 3–8th December 2012.
We thank Marı́a José Juan Jordá and Lucy R. Harrison for constructive comments and
Tracy Saxby, Integration and Application Network, University of Maryland Center for
Environmental Science (ian.umces.edu/imagelibrary/) for providing the images. Finally,
we thank John Bruno, Mike Bennett and Alastair Dove for their insightful comments and
critique. Thanks are also due to Eric Charnov who provided unsolicited and welcome
comments on the PeerJ Preprint version.
ADDITIONAL INFORMATION AND DECLARATIONS
Funding
We thank the Natural Science and Engineering Research Council, Canada (NKD, SAP), the
Canada Research Chairs program (NKD), Save Our Seas Foundation project #235 (NKD)
and the US State Department contribution to IUCN (NKD) for funding. The funders had
no role in study design, data collection and analysis, decision to publish, or preparation
of the manuscript. Opinions expressed herein are of the authors only and do not imply
endorsement by any agency or institution associated with the authors.
Dulvy et al. (2014), PeerJ, DOI 10.7717/peerj.400
13/19
Grant Disclosures
The following grant information was disclosed by the authors:
Natural Science and Engineering Research Council, Canada.
Canada Research Chairs program.
Save Our Seas Foundation project: #235.
US State Department Contribution to IUCN.
Competing Interests
The authors declare there are no competing financial interests.
Author Contributions
• Nicholas K. Dulvy conceived and designed the experiments, analyzed the data,
contributed reagents/materials/analysis tools, wrote the paper, prepared figures and/or
tables, reviewed drafts of the paper.
• Sebastián A. Pardo conceived and designed the experiments, contributed
reagents/materials/analysis tools, wrote the paper, reviewed drafts of the paper.
• Colin A. Simpfendorfer conceived and designed the experiments, wrote the paper,
prepared figures and/or tables, reviewed drafts of the paper.
• John K. Carlson conceived and designed the experiments, wrote the paper, reviewed
drafts of the paper.
Data Deposition
The following information was supplied regarding the deposition of related data:
ChondroRmax140429.xls. Nick Dulvy. figshare.
Retrieved 00:53, Apr 30, 2014 (GMT)
http://dx.doi.org/10.6084/m9.figshare.1009215—See more at: http://figshare.com/
preview/ preview/1009215#reserve citation.
REFERENCES
Anderson SC, Flemming JM, Watson R, Lotze HK. 2011. Serial exploitation of global sea
cucumber fisheries. Fish and Fisheries 12:317–339 DOI 10.1111/j.1467-2979.2010.00397.x.
Baker CS, Clapham PJ. 2004. Modelling the past and future of whales and whaling. Trends in
Ecology & Evolution 19:365–371 DOI 10.1016/j.tree.2004.05.005.
Beddington JR, Kirkwood GP. 2005. The estimation of potential yield and stock status using
life-history parameters. Philosophical Transactions of the Royal Society of London, Biological
Sciences 360:163–170 DOI 10.1098/rstb.2004.1582.
Bennett M. 2014. Peer Review #1 of “Diagnosing the dangerous demography of manta rays using
life history theory (v0.1)”. PeerJ DOI 10.7287/peerj.400v0.1/reviews/1.
Berkes F, Hughes TP, Steneck RS, Wilson JA, Bellwood DR, Crona B, Folke C, Gunderson LH,
Leslie HM, Norberg J, Nyström M, Olsson P, Österblom H, Scheffer M, Worm B.
2006. Globalization, roving bandits, and marine resources. Science 311:1557–1558
DOI 10.1126/science.1122804.
Dulvy et al. (2014), PeerJ, DOI 10.7717/peerj.400
14/19
Beverton RJH, Holt SJ. 1959. A review of the life-spans and mortality rates of fish in nature and
their relationship to growth and other physiological characteristics. Ciba Foundation Colloquia
on Aging 5:142–180.
Charnov EL, Berrigan D, Shine R. 1993. The M/k ratio is the same for fish and reptiles. American
Naturalist 142:707–711 DOI 10.1086/285565.
Charnov EL, Gislason H, Pope JG. 2012. Evolutionary assembly rules for fish life histories. Fish
and Fisheries 14:213–224 DOI 10.1111/j.1467-2979.2012.00467.x.
Charnov EL, Schaffer WM. 1973. Life-history consequences of natural-selection—Cole’s result
revisited. American Naturalist 107:791–793 DOI 10.1086/282877.
Charnov EL, Zuo WY. 2011. Human hunting mortality threshold rules for extinction in mammals
(and fish). Evolutionary Ecology Research 13:431–437.
CITES. 2007. Interpretation and implementation of the convention species trade and conservation
issues. Conservation of sharks. The Hague: Convention on the International Trade in Endangered
Species, 62.
CITES. 2013. Amendments to appendices I and II of the convention adopted by the Conference of the
parties at its 16th meeting, Bangkok (Thailand), 3–14 March 2013. Geneva: Convention on the
International Trade in Endangered Species, 8.
Clark T. 2010. Abundance, home range, and movement patterns of manta rays (Manta alfredi,
M. birostris) in. Hawai‘i, PhD, University of Hawai‘i, Manoa.
Clarke SC. 2004. Understanding pressures on fishery resources through trade statistics: a
pilot study of four products in the Chinese dried seafood market. Fish & Fisheries 5:53–74
DOI 10.1111/j.1467-2960.2004.00137.x.
Clarke SC, McAllister MK, Milner-Gulland EJ, Kirkwood GP, Michielsens CGJ, Agnew DJ,
Pikitch EK, Nakano H, Shivji MS. 2006. Global estimates of shark catches using trade records
from commercial markets. Ecology Letters 9:1115–1126 DOI 10.1111/j.1461-0248.2006.00968.x.
Cortés E. 2000. Life history patterns and correlations in sharks. Reviews in Fisheries Science
8:299–344.
Cortés E. 2002. Incorporating uncertainty into demographic modelling: application
to shark populations and their conservation. Conservation Biology 18:1048–1062
DOI 10.1046/j.1523-1739.2002.00423.x.
Couturier LIE, Marshall AD, Jaine FRA, Kashiwagi T, Pierce SJ, Townsend KA, Weeks SJ,
Bennett MB, Richardson AJ. 2012. Biology, ecology and conservation of the Mobulidae. Journal
of Fish Biology 80:1075–1119 DOI 10.1111/j.1095-8649.2012.03264.x.
Cuevas-Zimbrón E, Sosa-Nishizaki O, Pérez-Jiménez JC, O’Sullivan JB. 2012. An analysis of the
feasibility of using caudal vertebrae for ageing the spinetail devilray, Mobula japanica (Müller
and Henle, 1841). Environmental Biology of Fishes 96:907–914 DOI 10.1007/s10641-012-0086-2.
Dulvy NK, Ellis JR, Goodwin NB, Grant A, Reynolds JD, Jennings S. 2004. Methods of assessing
extinction risk in marine fishes. Fish and Fisheries 5:255–275
DOI 10.1111/j.1467-2679.2004.00158.x.
Dulvy NK, Forrest RE. 2010. Life histories, population dynamics, and extinction risks in
chondrichthyans. In: Carrier JC, Musick JA, Heithaus MR, eds. Sharks and their relatives II:
biodiversity, adaptive physiology, and conservation. Boca Raton: CRC Press, 635–676.
Dulvy NK, Fowler SL, Musick JA, Cavanagh RD, Kyne PM, Harrison LR, Carlson JK,
Davisdson LNK, Fordham S, Francis MP, Pollock CM, Simpfendorfer CA, Burgess GH,
Carpenter KE, Compagno LVJ, Ebert DA, Gibson C, Heupel MR, Livingstone SR,
Dulvy et al. (2014), PeerJ, DOI 10.7717/peerj.400
15/19
Sanciangco JC, Stevens JD, Valenti S, White WT. 2014. Extinction risk and conservation of
the world’s sharks and rays. eLIFE 3:e00590 DOI 10.7554/eLife.00590.
FAO. 2013. Fourth FAO expert advisory panel for the assessment of proposals to amend Appendices I
and II of CITES concerning commercially-exploited aquatic species. Rome: Food and Agriculture
Organization of the United Nations, 169.
Foster SJ, Vincent ACJ. 2004. Life history and ecology of seahorses: implications for conservation
and management. Journal of Fish Biology 65:1–61 DOI 10.1111/j.0022-1112.2004.00429.x.
Frisk MG, Miller TJ, Fogarty MJ. 2001. Estimation and analysis of biological parameters in
elasmobranch fishes: a comparative life history study. Canadian Journal of Fisheries and Aquatic
Sciences 58:969–981 DOI 10.1139/f01-051.
Garcı́a VB, Lucifora LO, Myers RA. 2008. The importance of habitat and life history to extinction
risk in sharks, skates, rays and chimaeras. Proceedings of the Royal Society of London, B
275:83–89 DOI 10.1098/rspb.2007.1295.
Gislason H, Daan N, Rice JC, Pope JG. 2010. Size, growth, temperature and the natural mortality
of marine fish. Fish and Fisheries 11:149–158 DOI 10.1111/j.1467-2979.2009.00350.x.
Goodwin NB, Dulvy NK, Reynolds JD. 2002. Life history correlates of the evolution of
live-bearing in fishes. Philosophical Transactions of the Royal Society of London, B 356:259–267
DOI 10.1098/rstb.2001.0958.
Heinrichs S, O’Malley M, Medd H, Hilton P. 2011. Manta ray of hope: global threat to manta and
mobula rays. Available at http://www.mantarayofhope.com.
Heppell SS, Crowder LB, Menzel TR. 1999. Life table analysis of long-lived marine species with
implications for conservation and management. In: Musick JA, ed. Life in the slow lane: ecology
and conservation of long-lived marine animals. Bethesda, Maryland: American Fisheries Society,
137–147.
Hoenig JM. 1983. Empirical use of longevity data to estimate mortality rates. Fisheries Bulletin
81:898–903.
Hutchings JA. 1999. Influence of growth and survival costs of reproduction on Atlantic cod,
Gadus morhua, population growth rate. Canadian Journal of Fisheries and Aquatic Science
56:1612–1623 DOI 10.1139/f99-088.
Hutchings JA, Myers RA, Garcia VB, Lucifora LO, Kuparinen A. 2012. Life-history
correlates of extinction risk and recovery potential. Ecological Applications 22:1061–1067
DOI 10.1890/11-1313.1.
IUCN/TRAFFIC. 2013. IUCN/TRAFFIC analyses of the proposals for CITES CoP15. Available at
http://www.traffic.org/cop16-table/.
Jennings S, Dulvy NK. 2008. Beverton and Holt’s insights into life history theory: influence,
application and future use. In: Payne AI, Cotter AJR, Potter ECE, eds. Advances in fisheries
Science: 50 years on from Beverton and Holt. Oxford: Blackwell Publishing, 434–450.
Jennings S, Mélin F, Blanchard JL, Forster RM, Dulvy NK, Wilson RW. 2008. Global-scale
predictions of community and ecosystem properties from simple ecological theory. Proceedings
of the Royal Society B: Biological Sciences 275:1375–1383 DOI 10.1098/rspb.2008.0192.
Jensen AL. 1996. Beverton and Holt life history invariants result from optimal trade-off of
reproduction and survival. Canadian Journal of Fisheries and Aquatic Sciences 53:820–822
DOI 10.1139/f95-233.
Law R. 1979. Ecological determinants in the evolution of life histories. In: Anderson RM, Turner
BD, Taylor LR, eds. Population dynamics. Oxford: Blackwell Scientific Publications, 81–103.
Dulvy et al. (2014), PeerJ, DOI 10.7717/peerj.400
16/19
Lenzen M, Moran D, Kanemoto K, Foran B, Lobefaro L, Geschke A. 2012. International
trade drives biodiversity threats in developing nations. Nature 486:109–112
DOI 10.1038/nature11145.
Ludwig D, Hilborn R, Walters C. 1993. Uncertainty, resource exploitation, and conservation—
lessons from history. Science 260:17–36 DOI 10.1126/science.260.5104.17.
Magnusson A, Punt AE, Hilborn R. 2013. Measuring uncertainty in fisheries stock
assessment: the delta method, bootstrap, and MCMC. Fish and Fisheries 14:325–342
DOI 10.1111/j.1467-2979.2012.00473.x.
Marshall AD, Bennett MB. 2010. Reproductive ecology of the reef manta ray Manta alfredi in
southern Mozambique. Journal of Fish Biology 77:169–190
DOI 10.1111/j.1095-8649.2010.02669.x.
Marshall A, Bennett MB, Kodja G, Hinojosa-Alvarez S, Galvan-Magana F, Harding M,
Stevens G, Kashiwagi T. 2011a. Manta birostris. Available at http://www.iucnredlist.org/details/
198921/0 (accessed 04 December 2012).
Marshall A, Kashiwagi T, Bennett MB, Deakos M, Stevens G, McGregor F, Clark T, Ishihara H,
Sato K. 2011b. Manta alfredi. Available at http://www.iucnredlist.org/details/195459/0 (accessed
04 December 2012).
Marshall AD, Compagno LJV, Bennett MB. 2009. Redescription of the genus Manta with
resurrection of Manta alfredi (Krefft, 1868) (Chondrichthyes; Myliobatoidei; Mobulidae).
Zootaxa 2301:1–28.
Marshall AD, Dudgeon CL, Bennett MB. 2011. Size and structure of a photographically
identified population of manta rays Manta alfredi in southern Mozambique. Marine Biology
158:1111–1124 DOI 10.1007/s00227-011-1634-6.
Martin LK, Cailliet GM. 1988. Aspects of reproduction of the bat ray Myliobatis california, in
Central California. Copeia (3):754–762 DOI 10.2307/1445398.
Mundy-Taylor V, Crook V. 2013. Into the deep: implementing CITES measures for
commercially-valuable sharks and manta rays. Cambridge: TRAFFIC, 106.
Musick JA. 1998. Endangered marine fishes: criteria and identification of North American stocks
at risk. Fisheries 2:28–30.
Musick JA. 1999. Criteria to define extinction risk in marine fishes. Fisheries 24:6–14
DOI 10.1577/1548-8446(1999)024<0006:CTDERI>2.0.CO;2.
Myers RA, Mertz G. 1998. The limits of exploitation: a precautionary approach. Ecological
Applications 8:S165–S169 DOI 10.1890/1051-0761(1998)8[S165:TLOEAP]2.0.CO;2.
Neer JA, Thompson BA. 2005. Life history of the cownose ray, Rhinoptera bonasus, in the northern
Gulf of Mexico, with comments on geographic variability in life history traits. Environmental
Biology of Fishes 73:321–331 DOI 10.1007/s10641-005-2136-5.
O’Malley MP, Lee-Brooks K, Medd HB. 2013. The global economic impact of manta ray watching
tourism. PLoS ONE 8:e65051 DOI 10.1371/journal.pone.0065051.
Pardo S, Cooper AB, Dulvy NK. 2012. Critical review and analysis of existing risk-based techniques
for determining sustainable mortality levels of bycatch species, DFO Can Sci Advis Sec Res Doc.
Ottawa: Fisheries and Oceans Canada. p v + 30.
Pardo S, Cooper AB, Dulvy NK. 2013. Avoiding fishy growth curves. Methods in Ecology and
Evolution 4:353–360 DOI 10.1111/2041-210x.12020.
Dulvy et al. (2014), PeerJ, DOI 10.7717/peerj.400
17/19
Pauly D. 2002. Growth and mortality of the Basking Shark Cetorhinus maximus and their
implications for management of Whale Sharks Rhincodon typus. In: Fowler SL, Reed TM,
Dipper FA, eds. Proceedings of the international seminar and workshop, Sabah, Malaysia, July
1997. Gland and Cambridge: IUCN Species Survival Commission Shark Specialist Group,
199–208.
Peterman RM. 2004. Possible solutions to some challenges facing fisheries scientists and managers.
ICES Journal of Marine Science 61:1331–1343 DOI 10.1016/j.icesjms.2004.08.017.
Phillis CC, O’Regan SM, Green SJ, Bruce JEB, Anderson SC, Linton JN, Favaro B.
2013. Multiple pathways to conservation success. Conservation Letters 6:98–106
DOI 10.1111/j.1755-263X.2012.00294.x.
Pope JG, MacDonald DS, Daan N, Reynolds JD, Jennings S. 2000. Gauging the vulnerability of non-target species to fishing. ICES Journal of Marine Science 57:689–696
DOI 10.1006/jmsc.2000.0729.
Pope JG, Shepherd JG, Webb J. 1994. Successful surf-riding on size spectra: the secret of
survival in the sea. Philosophical Transactions of the Royal Society of London, B 343:41–49
DOI 10.1098/rstb.1994.0006.
R Core Team. 2013. R: a language and environment for statistical computing. Vienna, Austria: R
Foundation for Statistical Computing.
Sadovy Y, Cheung WL. 2003. Near extinction of a highly fecund fish: the one that nearly got away.
Fish and Fisheries 4:86–99 DOI 10.1046/j.1467-2979.2003.00104.x.
Sadovy Y, Vincent AJ. 2002. Ecological issues and the trades in live reef fishes. In: Sale PF, ed. Coral
reef fishes: dynamics and diversity in a complex ecosystem. San Diego: Academic Press, 391–420.
Simpfendorfer CA. 2005. Demographic models: life tables, matrix models and rebound potential.
In: Musick JA, Bonfil R, eds. Elasmobranch fisheries management techniques. Rome: Food and
Agriculture Organisation of the United Nations, 187–204.
Simpfendorfer CA, Kyne PM. 2009. Limited potential to recover from overfishing raises
concerns for deep-sea sharks, rays and chimaeras. Environmental Conservation 36:97–103
DOI 10.1017/S0376892909990191.
Smart JJ, Harry AV, Tobin AJ, Simpfendorfer CA. 2013. Overcoming the constraints of low
sample sizes to produce age and growth data for rare or threatened sharks. Aquatic
Conservation-Marine and Freshwater Ecosystems 23:124–134 DOI 10.1002/aqc.2274.
Smith SE, Au DW, Show C. 1998. Intrinsic rebound potentials of 26 species of Pacific sharks.
Marine and Freshwater Research 49:663–678 DOI 10.1071/MF97135.
Thorson JT, Simpfendorfer CA. 2009. Gear selectivity and sample size effects on
growth curve selection in shark age and growth studies. Fisheries Research 98:75–84
DOI 10.1016/j.fishres.2009.03.016.
Town C, Marshall A, Sethasathien N. 2013. Manta Matcher: automated photographic
identification of manta rays using keypoint features. Ecolgy and Evolution 3:1902–1914
DOI 10.1002/ece3.587.
Vincent ACJ, Sadovy de Mitcheson YJ, Fowler SL, Lieberman S. 2014. The role of CITES
in the conservation of marine fishes subject to international trade. Fish and Fisheries
DOI 10.1111/faf.12035.
Ward-Paige CA, Davis B, Worm B. 2013. Global population trends and human use patterns of
Manta and Mobula rays. PLoS ONE 8:e74835 DOI 10.1371/journal.pone.0074835.
Dulvy et al. (2014), PeerJ, DOI 10.7717/peerj.400
18/19
Wintner SP. 2000. Preliminary study of vertebral growth rings in the whale shark, Rhincodon
typus, from the east coast of South Africa. Environmental Biology of Fishes 59:441–451
DOI 10.1023/A:1026564707027.
Yamaguchi A, Kawahara I, Ito S. 2005. Occurrence, growth and food of longheaded eagle
ray, Aetobatus flagellum, in Ariake Sound, Kyushu, Japan. Environmental Biology of Fishes
74:229–238 DOI 10.1007/s10641-005-0217-0.
Dulvy et al. (2014), PeerJ, DOI 10.7717/peerj.400
19/19


© Copyright 2026