
How to Combine Customer Equity and Customer Value in an... Tobias J. Donnevert, Maik Hammerschmidt, Hans H. Bauer, University of...
How to Combine Customer Equity and Customer Value in an Online Environment
Tobias J. Donnevert, Maik Hammerschmidt, Hans H. Bauer, University of Mannheim
Abstract
The annual web sales loss due to inadequate Website design amounted to several billion
dollars. Consequently, investigating Website visitors’ needs and targeting the most attractive
segments are two fundamental tasks for relationship marketing. This paper integrates the
established concepts of benefit segmentation and customer valuation. Based on data of 2,161
website users we conduct a hierarchical cluster analysis and combine the results with equity
segmentation. As a result we develop the “user benefit- user equity- framework”. Our results
show, that there is no dominance of one benefit segment regarding user equity. However,
segments with differentiated benefit requirements exhibit significantly higher customer equity
than unfocused segments. Thus, a selective strategy is promising.
Introduction
A company’s Website assumes a pivotal role in relationship marketing. Online marketing
investments will increase by 35% in 2007 (BVDW 2007). Websites are the critical interface
between a buyer and a seller. Furthermore, as the factors “physical facilities” and “appearance
of personnel” are irrelevant on the Internet, the website is the vehicle for delivering valueadding services. Thus, organizational deficiencies and shortfalls in designing and operating
websites are seen as a main source of poor performance of Internet relationship marketing
(Donthu 2001; Zeithaml et al. 2002). Inadequate website design leads to a decrease in the
number of visitors, shorter visiting times, abandoning of Internet shopping carts and lower
intention to revisit and recommend the site (Donthu 2001; Loiacono et al. 2002).
To explore the reasons why many firms struggle to design Internet offerings in a way that
creates good customer appeal and assures profitability, we draw on the Gap model by
Parasuraman et al. (1985). First, there might be a gap between customer expectations and IT
and Marketing manager’s perceptions of customer expectations (information g a p ) . The
information gap becomes particularly crucial in online environments due to the fact that wants
and needs on any given attribute vary heavily across online users and contexts. At the same
time there are limitless possibilities to design a website (Grönroos et al. 2000). Thus, without
an appropriate metric for investigating the needs and requirements of online users the
probability to achieve a match between customer expectations and management perceptions
of these expectations is marginal at best. Second, there might be a gap between the
importance of website elements in view of the customers that should be prioritized and the
management’s assumptions of the importance of website features (implementation gap). Thus,
marketers need a metric to prioritize the needs of online customers.
In order to close the information gap, we highlight customer value/benefit as the appropriate
metric. For closing the implementation gap, decisions should be based on customer
profitability (equity). To address both gaps, this paper transfers the established concepts of
benefit segmentation and customer valuation to the Internet. Moreover, in order to achieve
long term marketing performance both gaps have to be closed simultaneously. Thus, both
metrics must be combined in the analysis. To integrate both metrics we develop the user
3038
benefit- user equity- matrix. Applying this concept, it is possible to unveil the wants and needs
of website visitors ("value to the user") by clustering them into benefit segments. Second, by
assessing the equity of each benefit segment ("value of the user") the website can be designed
according to the benefit expectations of valuable segments.
Conceptual Framework
Benefit segmentation has become the preferred technique for market segmentation because it
segments customers on the basis of their needs. The fulfillment of benefit expectations
through products or services entails the driver of purchasing a product or patronizing
particular suppliers (Loker & Perdue 1992; Tynan & Drayton 1987). But unveiling benefit
segments is only a necessary condition. Marketers need a metric to valuate customers and to
select the “right segment(s)” or to decide which needs to consider as more important if they
are conflicting. The metric to prioritize segments should be customer profitability in order to
target segments that most contribute to the enhancement of firm value. As we aim to support
future marketing decisions we need to predict the profitability potential of the benefit segment
members. Prior research has shown that often a few predictors suffice to get valid estimations
of customer profitability (Malthouse & Blattberg 2005). Here, socio-demographic, economic
and purchase behavior related predictors are suggested in the literature (Venkatesan & Kumar
2004; Berger et al. 2002). Although weaknesses in those ex post measures have been
identified, empirical evidence shows that customers who have bought most recently and more
frequently in the past have the highest monetary value and are more likely to respond
favorably to subsequent offers (Thomas et al. 2004). This belief is consistent with other
research findings. For example, Bolton et al. (2000) find that experience with a product or
service, measured by the number of prior transactions, is strongly associated with a higher
likelihood of repatronage and accelerating repurchases in the future. The high predictive
validity of ex post measures can be explained by the customer’s desire to maintain the status
quo (Bolton et al. 2000). Thus, it can be asserted that previous-period measures drive
customer expectations and intentions and therefore drive future purchase behavior. To predict
future purchases we apply a scoring model because it allows to include such non- monetary
variables (behavioral, socio-demographic), which can be weighted flexibly according to their
importance. Scoring models have been successfully employed for predicting customer
spendings in many industries, e.g. car manufacturers or Internet companies (Rossi et al. 1996,
Yang & Allenby 2003). Nevertheless, there is little academic research to date that examines
their applicability in an online context (Bolton et al. 2004).
Although benefit segmentation and customer valuation are well established concepts, the
usefulness of a combined application of both concepts to segment and valuate visitors of a
website has not been empirically demonstrated so far. This is surprising because the WWW is
a medium very much in line with the fragmented nature of modern markets. This underscores
the marketer’s need for understanding how website users differ in their behavior and in the
value they create for the company (Sen et al. 1998). Therefore, in this paper we cluster
visitors of a website according to their needs and calculate user equity for each benefit
segment. This linkage results in a user benefit- user equity- matrix.
3039
Study Design
Item generation and scale development: To conduct benefit segmentation we first derived
fundamental benefit dimensions of a website. To generate value-creating website features we
followed the framework proposed by Liu & Arnett (2000) and Yoo & Donthu (2001). The
authors suggest four basic categories of features that provide benefit for users: Information
and Service Quality, Usability and Security (System Use), Fun/Playfulness and Design. Based
on an extensive literature review (Barnes & Vidgen 2001; Liu & Arnett 2000; Novak et al.
2000; Para-suraman et al. 2005; Shankar et al. 2003; Srinivasan et al. 2002; Szymanski &
Hise 2000; Yoo & Donthu 2001; Zeithaml et al. 2002; Wolfinbarger & Gilly 2003) a large
quantity of possible website features were obtained for these four categories. This procedure
was supplemented by expert interviews and website analyses. A set of 110 items representing
all facets of a website formed the initial pool of website attributes. Using insights from focus
group discussions and expert interviews we eliminated confusing or redundant items;
reworded some others in order to improve clarity. This procedure resulted in 55 items that
entered the final questionnaire. The importance of website features was used to measure the
perceived benefits delivered by the features (Gustafsson & Johnson 2004). For determining
attribute importance, two general approaches are supposed in the literature: direct importance
ratings and indirect, statistical determination (revealed importance). Counter to the mantra of
the superiority of statistical importance estimation, the results of the meta-analysis conducted
by Gustafsson & Johnson (2004) show that direct importance ratings entail a higher reliability
than indirect measures because they provide more stable weights. Moreover, direct measures
are more correlated with preferences than statistically derived measures. Finally, direct ratings
are more future-related as they show a higher predictive validity for customer loyalty than
statistical estimations. These evidences are consistent with other findings which show that
both types of importance evaluation lead to similar results in most cases (Griffin & Hauser
1993).
Data Collection and analysis: To collect the data we administered the questionnaire to a
random sample of visitors of a large multinational car manufacturer’s website in the USA and
in Germany. This process yielded a total of 2,161 usable questionnaires (1,047 from the USA,
1,114 from Germany). Following the previous argumentation, we asked respondents to judge
the relative importance of each attribute directly on a 7-point scale ranging from 1 (not at all
important) to 7 (extremely important). The frequency distribution for each attribute did not
show a tendency to an “inflation of demands” in the importance ratings. Using exploratory
factor analysis w e extracted 13 benefit dimensions (e.g., product information, multimedia
experiences, shopping possibilities, ease of navigation) which explained 67% of the variance.
All factors displayed high reliability with Cronbachs alpha.
Hierarchical cluster analysis using the 13 standardized benefit dimensions was applied to
identify benefit segments. We chose a three step approach combining different techniques in
order to overcome the problems of outlier sensitivity and subjective determination of the
number of clusters (Green & Krieger 1995). First, we identified and eliminated outliers using
Single-Linkage algorithm (nearest neighbor) whereby Squared Euclidean distances were used
as proximity measure. Second, Ward's procedure identified the optimal number and centroids
of clusters. Third, after optimizing results from Ward's procedure using K-Means five clusters
could be identified.
To predict the revenue potential of each respondent we collected three groups of predictor
variables that have been shown to be valid predictors of customer profitability (Venkatesan &
Kumar 2004; Malthouse 2002; Reinartz & Kumar 2003): socio-demographic (age), socioeconomic (occupation; number of cars owned by customer) and behavioral (recent purchase
3040
[index of brand, type and age of the recently purchased car]; whether it was a new or secondhand car. To calibrate the scoring model we run a regression analysis based on data of 2,182
automobile owners which were contained in the database of the car manufacturer. This
sample contained customers of the manufacturer and buyers of competing brands. The buyers
are distributed equally across different car categories. We used another 2,182 customers of
this database as a holdout sample. We selected the revenue as our dependent variable and the
predictors as independent variables. Even though the firm’s products are durable goods, they
require constant maintenance, which provided the variance required in modeling customer
revenues. For all predictors the coefficients were significant at p < 0.001 with except of
“number of cars owned” (p = 0.1). The model had an R2 of 35.3% in the calibration sample
and 35% in the holdout (validation) sample. As all variables show a high predictive validity
they were included in the scoring model. The Beta coefficients were used to obtain t h e
relative importance weights for the predictors which are as follows: recent purchase (0.40);
occupation (0.24); new/second-hand car (0.18); age (0.12) and number of cars owned (0.06).
For each level of the predictor variables a certain score was assigned. The scoring model was
then applied to predict the revenue potential of the respondents of our survey.
Empirical Results
Benefit segmentation: Table 1 shows the five clusters and their expected benefits in terms of
the website features which are perceived as most important. Obviously, users differ
significantly according to their sought benefits. Not surprisingly only the requirements related
to usability are quite similar across all clusters. We identify two undifferentiated clusters who
either has no demands (cluster 1) or perceives most features as highly important (cluster 5). In
between, we extract three clusters with “differentiated” benefit requirements.
Cluster
Benefits
1. Passionless User (“I want nothing“)
No feature is of significant importance
2. Car Shoppers (“No Frills”)
Straight users, just want information about new cars as well as finance
and leasing; they use owner community
3. Experiential Shoppers
Want information about new and used cars; book trips; use
multimedia elements
4. Symbolic Shoppers
Want information about new cars and buy merchandising accessories
showing the brand logo
5. Fans (“I want everything”)
Nearly all features are important, they love the web site
Table 1: Benefit Cluster
Valuation of website visitors: We use the scoring model to predict the revenue potential of
prospective customers. By multiplying the achieved score with the importance weight for
each variable and summing up over all variables a total revenue score was calculated for each
respondent. Based on the scores respondents were classified into two groups: "hot" users (all
users with scores ranging in the upper third of the scale) and "cold" users (the remaining
users).
Integrating benefit segmentation and valuation: After closing the information gap by
identifying the major benefits relevant for the different user segments and valuating website
visitors using the scoring model we now have to integrate the results so marketers can
3041
prioritize benefit segments. This allows closing the second gap (implementation gap). The
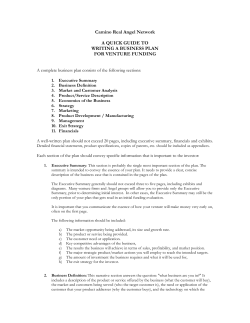
combination of the two metrics leads to the user benefit–user equity–matrix shown in Figure
1. The combination of both dimensions results in nine cells, each representing different
combinations of benefit and equity segments. The top left-hand figures in both equity segment
columns have to be read “vertically” and show the distribution of valuable (hot) and less
attractive (cold) users across the benefit segments. By using this matrix marketers can answer
two central questions: First, are valuable users concentrated on certain benefit segments?
Second, how precisely can each segment be addressed from a value-based perspective, i.e.
what is the share of hot users in each benefit segment? In this context also the size of the
benefit segments (see the down right-hand figures) is relevant which indicates whether
addressing the segment is economically viable.
Concerning the first question the results clearly show that segments with differentiated benefit
requirements and therefore focused usage behavior exhibit above average customer equity.
Contrarily, undifferentiated segments contain significantly less valuable users. Considering
the distribution of hot users across the five benefit segments (column 2) it can be seen that
there is no dominance of one benefit segment with respect to customer equity. Thus, it seems
inappropriate to a priori align the website exclusively to a single segment (e.g., car shoppers).
Obviously, when following this strategy the firm would forgo high economic potential. In
contrast, an undifferentiated “mass strategy” would likewise be inappropriate because there
are features that do not create value for all segments. According to our results a selective
strategy, i.e. addressing segments 2, 3 and 4 is beneficial. Firms should assure that the website
is particularly attractive to these user groups. Concerning the second question, targeting
segment 2 (car shoppers) would yield the most efficient employment of marketing resources,
because this segment contains the highest share of valuable users, resulting in the lowest risk
of spillover effects. Additionally, this segment exhibits a sufficient size (20% of all users).
Finally, the cell of “valuable car shoppers” is the third largest of all cells (12%).
5. Discussion
The following key findings can be derived from our combined benefit segmentation-user
valuation-framework: There is no dominance of one benefit segment regarding user equity.
Thus, by following a single segment strategy, the company would forgo the economic
potential of other segments. Would the website only target the segment “Car Shoppers”, the
needs of 71% of hot users would be ignored.
3042
Figure 1: User Benefit–User Equity–Matrix
Nevertheless, our results clearly show that user equity of a segment depends on how
differentiated their benefit requirements a r e . Thus, unfocused segments which expect
everything or nothing from the website contain significantly smaller shares of valuable users.
Contrary, segments with differentiated usage behavior have a significantly higher revenue
potential. Clearly, the segment of “Car Shoppers”, which consists to 60% of hot users, is the
most attractive one. The “Experiential Shoppers” occur as a second segment to which
marketing resources should be allocated. Targeting these segments entails the highest
probability of addressing a valuable user, and marketing resources can be employed with the
smallest spillover effects. Thus, these segments yield the highest "return on marketing
investments". Targeting both attractive segments could be implemented through
personalization and differentiation. Using guided tours, quick links or virtual shopping agents
(so called avatars), visitors can be directed to their desired website features or information,
without aligning the site exclusively to the needs of one or two clusters. Especially, avatars as
identification figures, website guides, conversation partners or individual recommenders have
the potential to fulfill the consumer’s desire for a more individual and interpersonal shopping
experience ( Holzwarth et al. 2006). The possibility to choose from different avatars (e.g.,
attractive vs. expert avatar) or to configure a personalized avatar makes it possible to fulfill
the needs of different segments simultaneously. In general, this study shows clearly the value
of combining established metrics to solve an e- marketing problem, in our case to ensure not
only customer benefit orientation but additionally marketing efficiency. Conducting an
integrated analysis of user benefits ("value to the user") and user equity ("value of the user")
an optimal allocation of marketing resources can be reached by identifying which benefit
segments to prioritize.
3043
References
Barnes, S.J., Vidgen, R., 2001. An Evaluation of Cyber-Bookshops: The WebQual Method.
International Journal of Electronic Commerce 6 (1), 11-30.
Bolton, R.N., Kannan, P.K., Bramlett, M.D., 2000. Implications of Loyalty Program
Membership and Service Experiences for Customer Retention and Value. Journal of the
Academy of Marketing Science 28 (1), 95–108.
Bolton, R.N., Lemon, K.N., Verhoef, P.C., 2004. The theoretical underpinnings of customer
asset management. Journal of the Academy of Marketing Science 32 (3), 271–292.
BVDW, 2007. OVK Online Report 2007/01. Berlin.
Dibb, S., Simkin, L., Pride, N., Farreil, O.C., 2001. Marketing Concepts and Strategies.
Boston, MA.
Donthu, N., 2001. Does Your Website Measure Up? Marketing Management 10 (4), 29-33.
Green, P., Krieger, A., 1995. Alternative Approaches to Cluster-Based Market Segmentation.
Journal of the Market Research Society 37 (3), 221-239.
Griffin, A., Hauser, J.R., 1993. The Voice of the Customer. Marketing Science 12 (1), 1-27.
Grönroos, Ch., Heinonen, F., Isoniemi, K., Lindholm, M., 2000. The NetOffer model: a case
example from the virtual marketplace. Management Decision 38 (4), 243-252.
Gustafsson, A., Johnson, M.D., 2004. Determining Attribute Importance in a Service
Satisfaction Model. Journal of Service Research 7 (2), 124-141.
Holzwarth, M., Janiszewski, C., Neumann, M.M., 2006. The Influence of Avatars on Online
Consumer Shopping Behavior. Journal of Marketing 70 (4), 19–36.
Novak, T.P., Hoffman, D.L., Yung, Y.F., 2000. Measuring the Customer Experience in
Online Environments: A Structural Modeling Approach. Marketing Science 19 (1), 22-42.
Liu, C., Arnett, K.P., 2000. Exploring the Factors associated With Website Success in the
context of Electronic Commerce. Information & Management 38 (1), 23-34.
Loiacono, E., Watson, R.T., Goodhue, D., 2002. WebQual: A measure of Website Quality.
AMA Marketing Educators Conference Proceedings, 13 (1), 432-437.
Loker, L.E., Perdue, R.R., 1992. A benefit-based segmentation of a non-resident summer
travel market. Journal of Travel Research 31 (1), 30-35.
Malthouse, E.C., 2002. Performance-Based Variable Selection for Scoring Models. Journal of
Interactive Marketing 16 (4), 37–50.
3044
Malthouse, E.C., Blattberg, R.C., 2005. Can we Predict Customer Lifetime Value? Journal of
Interactive Marketing 19 (1), 2-16.
Parasuraman, A., Zeithaml, V.A., Berry, L.L., 1985. A Conceptual Model of SQ and its
Implications for Future Research. Journal of Marketing 49 (Fall), 41-50.
Parasuraman, A., Zeithaml, V.A., Malhotra, A., 2005. E-S-QUAL – A Multiple-Item Scale
for Assessing Electronic Service Quality. Journal of Service Research 7 (3), 213-233.
Reinartz, W.J., Kumar, V., 2000. On the Profitability of Long-Life Customers in a
Noncontractual Setting: An Empirical Investigation and Implications for Marketing. Journal
of Marketing 64 (4), 17-35.
Rossi, P.E., McCulloch, R.E., Allenby, G.M., 1996. The value of purchase history data in
target marketing. Marketing Science 15 (4), 321–340.
Rust, R.T., Lemon, K.N., 2001. E-Service and the Consumer. International Journal of
Electronic Commerce 5 (3), 85-101.
Sen, S., Padmanabhan, B., Tuzhilin, A., White, N. H., Stein, R., 1998. The identification and
satisfaction of consumer analysis-driven information needs of marketers on the WWW.
European Journal of Marketing 32 (7/8), 688-702.
Shankar, V., Smith, A. K., Rangaswamy, A., 2003. Customer satisfaction and loyalty in
online and offline environments. International Journal of Research in Marketing 20 (2), 15375.
Srinivasan, S., Anderson, R., Ponnavolu, K., 2002. Customer loyality in e-commerce: an
exploration of its antecedents and consequences. Journal of Retailing 78, 41-50.
Szymanski, D.M., Hise, R.T., 2000. e-Satisfaction: An Initial Examination. Journal of
Retailing 76 (3), 309-323.
Thomas, J.S., Blattberg, R.C., Fox, E.J., 2004. Recapturing Lost Customers. Journal of
Marketing Research 41 (1), 31-45.
Tynan, A.C., Drayton, J., 1987. Market segmentation. Journal of Marketing Management 2
(3), 301-335.
Venkatesan, R., Kumar, V., 2004. A Customer Lifetime Value Framework for Customer
Selection and Resource Allocation Strategy. Journal of Marketing 68 (4), 106–125.
Wolfinbarger, M., Gilly, M.C., 2003. eTailQ: Dimensionalizing, measuring and predicting
etail quality. Journal of Retailing 79, 183-198.
Yang, S., Allenby, G.M., 2003. Modeling interdependent consumer preferences. Journal of
Marketing Research 40 (3), 282–294.
3045
Yoo, B., Donthu, N., 2001. Developing a scale to measure the perceived quality of an Internet
shopping site (SITEQUAL). Quarterly Journal of Electronic Commerce 2 (1), 31-46.
Zeithaml, V.A., Parasuraman, A., Malhotra, A., 2002. Service Quality Delivery through
Websites: A Critical Review of Extant Knowledge. Journal of the Academy of Marketing
Science 30, 362-375.
3046


© Copyright 2026