
Mapping the Relationship Between Wildfi re and Poverty Kathy Lynn and Wendy Gerlitz
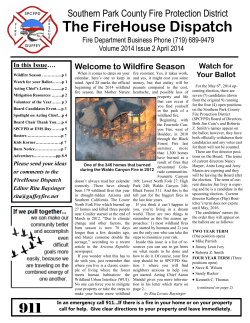
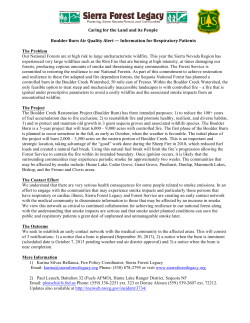
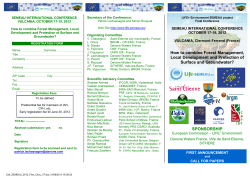
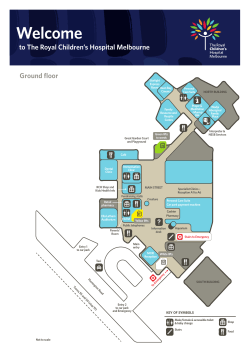
Mapping the Relationship Between Wildfire
and Poverty
Kathy Lynn1 and Wendy Gerlitz2
Abstract—Wildfires and related government roles and responsibilities for federal
wildland management are prominent in our national consciousness because of the
increased severity in the last decade of fires on and around public lands. In recent
years, laws, strategies, and implementation documents have been issued to direct
federal efforts for wildfire prevention, firefighting, and recovery. Reliable national-level
information and monitoring are essential to ensure good decision-making and agency
accountability. Social and economic information about communities at risk from wildfire is critical to these decisions. Despite the indispensable nature of this information
for understanding communities, wildfire risk, and cooperative efforts, there is a void
in policy direction within the federal agencies to collect, understand, and use social
and economic information in wildfire management programs. This study addresses
community capacity and examines socioeconomic indicators as elements of wildfire
risk. The study investigates whether communities most at risk from wildfire are able to
access and benefit from federal programs established to serve these communities. In
other words, are the dollars, assistance, and fuels-reduction projects hitting the ground
in the areas throughout the country that are most at risk to wildfire? This presentation
will provide a forum to discuss the needs of rural and underserved communities in
relationship to fire and fuels management programs.
Introduction
Wildfi res and the related government roles and responsibilities for federal
wildland management are prominent in our national consciousness because of
the increased severity in the last decade of fi res on and around public lands.
In recent years, numerous laws, strategies, and implementation documents
have been issued to direct federal efforts for wildfi re prevention, fi refighting,
and recovery. Reliable national-level information and monitoring are essential
to ensure good decision-making and agency accountability.
Social and economic information about communities at risk from wildfi re is critical to these decisions. Despite the indispensable nature of this
information for understanding communities, wildfi re risk, and cooperative
efforts, there is a void in policy direction within the federal agencies to collect, understand, and utilize social and economic information in wildfi re
management programs.
This research project uses the concept of community capacity – a community’s ability to protect itself, respond to, and recover from wildfi re – and
examines socioeconomic indicators (one component of community capacity)
as elements of wildfi re risk. Utilizing socioeconomic information, as well
as ecological factors, this study set out to investigate, through a geographical-information-systems approach, whether communities most at risk from
USDA Forest Service Proceedings RMRS-P-41. 2006.
In: Andrews, Patricia L.; Butler, Bret W.,
comps. 2006. Fuels Management—How to
Measure Success: Conference Proceedings.
28-30 March 2006; Portland, OR.
Proceedings RMRS-P-41. Fort Collins,
CO: U.S. Department of Agriculture,
Forest Service, Rocky Mountain Research
Station.
1
Resource Innovations, University of
Oregon, Eugene, OR.
[email protected]
2 National Network of Forest Practitioners, Portland, OR.
401
Lynn and Gerlitz
Mapping the Relationship Between Wildfire and Poverty…
wildfi re are able to access and benefit from federal programs established to
serve these communities. In other words, are the dollars, assistance, and fuelsreduction projects hitting the ground in the areas throughout the country
that are most at risk?
This research project found that federal agencies do not have the information and data necessary to answer this question. Spatial data to inform every
aspect of this research – including data regarding the ecological conditions
of federal lands, wildfi re protection capability in and around communities,
and the federal expenditures under the national fi re plan – are unavailable
and/or inadequate.
Using the limited data that are currently available, this research focused
primarily on the relationship between poverty and populated areas at risk to
wildfi re. Our research indicates that there is a relationship between poverty
and federal land ownership, and that more poor households are located in
close proximity to federal lands. Perhaps more significant, the research shows
a higher percentage of poor households in inhabited wildland areas that are
not considered part of the Wildland Urban Interface – the areas that federal
agencies and Congress have prioritized to receive the majority of funds for
activities under the national fi re plan. The research also indicates that, in the
one state analyzed, poor households are more likely in areas with low or no
fi re response capabilities than are non poor households.
This research should be seen as a fi rst step to document the importance of
social and economic information and community capacity in wildfi re policy
and implementation. The lack of information about wildfi re risk, including
ecological conditions, socioeconomic indicators, and resource allocation
convinced us to focus our recommendations on improving federal agency
understanding and use of social and economic factors through national inventory and monitoring efforts. Specific recommendations include developing
a method for measuring community capacity in the context of wildfi re and
using this methodology to redefi ne the concept of risk for implementation
priorities at the national level and in state, regional, and local planning and
risk assessment. Federal land management agencies must also improve systems
for monitoring national fi re plan expenditures and the datasets that support
the prioritization of these funds.
Understanding the social and economic dynamics of communities is critical
for providing federal assistance that will help communities protect themselves
from wildfi re and respond to and recover from an event. We encourage others to build on this effort to understand the complex social, economic, and
ecological factors that influence wildfi re risk. Specifically, we encourage federal
agencies to take steps to understand the social and economic indicators that
are necessary to understand and serve our nation’s communities.
Research Methods
This study examines the relationship between wildfi re and community risk
through the concept of community capacity. The research also attempted to
analyze federal resource allocation in conjunction with data indicating relative risk. To examine these issues, the project team conducted background
research to identify indicators and nationally consistent data for each element
of the project. The team also facilitated internal and external data review,
mapped indicators once data had been collected, and reexamined and reported
fi ndings through the mapping process.
402
USDA Forest Service Proceedings RMRS-P-41. 2006.
Mapping the Relationship Between Wildfire and Poverty…
Lynn and Gerlitz
To illustrate the study elements, we sought data to use as indicators of community capacity and wildfire risk. This process was iterative, investigating potential
datasets, summarizing the benefits and drawbacks of each, and obtaining feedback
from an advisory committee. We also presented preliminary findings of the study
at two community meetings in southern Oregon and central Oregon.
This section provides a description of the data we initially sought to examine community capacity, wildfi re risk, and federal resource allocation. It
includes the limitations of the best available data, and a summary of how we
use the data in this study.
National-Level Data
This report is a national-level analysis that seeks to provide information on
a national scale. The spatial information included in this report is provided at
the county and census-block levels. Therefore, the visual analysis is, in many
cases, more meaningful on a state level. Consequently, the researchers have
included more detailed maps and analysis for the states of Washington and
Oregon, as state-level examples. The maps and analysis shown for these two
states are also available, upon request, for other states.
Identifying indicators that provide consistent and meaningful information
for a nationwide study became the fi rst challenge. Although some poverty data
exist on a national scale (from the Census and Department of Housing and
Urban Development), it was more difficult to fi nd consistent national data on
community capacity, protection capacity, wildfi re risk, and federal resource
allocation. The researchers encountered major challenges in fi nding spatial
data, especially in a format conducive to national-level modeling. Specifically,
there is a lack of suitable data in the areas of: (1) community capacity/protection capability (2) ecological conditions on federal lands/populated areas at
risk from wildfi re; and, (3) federal resource allocation.
Indicators and Data
The following section provides information about the purpose of each
indicator, the data initially sought, the limitations encountered, and the data
ultimately selected.
Community Capacity
Examining community capacity requires understanding a complex set of
issues and indicators that are not easily summarized by a single set of data.
Below, we explain the purpose for using the concept of community capacity, existing defi nitions of community capacity found in published research,
the limitations we encountered in identifying data, and the indicators we
ultimately chose for this research.
Community capacity can be used to assess the relative risk that a community
faces from wildfi re. Well defi ned, community capacity will provide the social
information to tell us which communities are at a greater risk—less ready to
protect themselves from wildfi re, and less able to recover from the impacts of
a fi re. Understanding the capacity of a community to address the economic,
social, and environmental costs of wildfi re will lead to more directed policies
and programs and a more efficient use of resources. Following are two defi nitions of capacity that we used to help frame the study and the indicators we
sought to use for the research.
USDA Forest Service Proceedings RMRS-P-41. 2006.
403
Lynn and Gerlitz
Mapping the Relationship Between Wildfire and Poverty…
• Kusel (1996) defi nes community capacity as “the collective ability of
residents to respond…to external and internal stresses; to create and
take advantage of opportunities; and to meet the needs of residents,
diversely defi ned.”
• A response by American Forests to the 2001 Federal Register notice
Urban Wildland Interface Communities within the Vicinity of Federal
Lands that are at High Risk from Wildfire, defi nes community capacity
as the collective ability of residents in a community to respond to external and internal stresses, to create and take advantage of opportunities,
and to meet local needs. Community capacity in relation to wildfi re
addresses a community’s ability to mitigate wildfi re threats, respond to
active wildfi re, and mitigate post fi re damage. This includes the ability
to implement risk-reduction strategies, including hazardous fuels reduction, fi refighting, and restoration activities (American Forests 2001).
For purposes of this research (and because of limited data), two indicators were used as a fi rst step to measure community capacity as it relates to
wildfi re: (1) socioeconomic elements that influence a community’s ability to
respond to and recover from wildfi re and (2) protection capability - systems
that are in place that influence a community’s ability to protect itself from
an actual wildfi re. As previously stated, a true assessment of community
capacity would include a much broader array of social and cultural information; however, this information was not readily available at the time that this
research was undertaken.
The study uses 2003 Housing and Urban Development (HUD) Income
Limits, at a comparable census block group level, as the primary layer for
poverty. HUD Income Limits reflect income, earnings and employment,
and housing affordability. The Median Family Income Limit estimates are
based on the U.S. Census Bureau median family income estimates with an
adjustment using a combination of earnings and employment data, median
family income data, and fair market rents. Data are available nationally. HUD
Income Limits describe family sizes of one to eight persons, and a formula is
provided to calculate income limits for larger family sizes. Income limits are
adjusted for family size and areas with unusually high or low family income
or housing-cost-to-income relationships (Housing and Urban Development).
Income limit groups include families whose incomes do not exceed 80 percent of the median family income for the area (low-income), families whose
incomes do not exceed 50 percent of the median family income for the area
(very low-income), and families whose incomes do not exceed 30 percent of
the area median income (very, very low-income).
This report also utilizes fi re hazard ratings, used by both public and private
sector organizations around the nation, as indicators of the capabilities of fi re
districts to protect their communities from wildfi re. The Fire Suppression
Rating Schedule is a common method used by the insurance industry in reviewing the fi refighting capabilities of individual communities. The schedule
measures the major elements of a community’s fi re suppression system and
develops a numerical grading called a “Public Protection Classification.” Ten
percent of the overall grading is based on how well the fi re department receives
and dispatches fi re alarms. Fifty percent of the overall grading is based on the
number of engine companies and the amount of water a community needs to
fight a fi re. Forty percent of the grading is based on the community’s water
supply, which focuses on whether the community has sufficient water supply
for fi re suppression beyond daily maximum consumption.
404
USDA Forest Service Proceedings RMRS-P-41. 2006.
Mapping the Relationship Between Wildfire and Poverty…
Lynn and Gerlitz
This report uses data from the Washington State Independent Fire Hazard
Rating Bureau to assess the relationship between fi re hazard ratings, poverty,
and potential wildfi re risk. The Washington State Rating Bureau provides data
for all of the fi re protection ratings for fi re districts in Washington State.
Ecological Risk/ Populated Areas at Risk from Wildfire
The research intended initially to examine ecological wildfi re risk—the
likelihood of fi re occurring in different areas and the potential damage such
a fi re would pose—through spatial data that would indicate, on a national
level, the relative risk status of wildlands across the country. This indicator
was intended to provide information about the ecological condition of lands.
When it became apparent that there was insufficient consistent and up-todate data on the ecological conditions of lands, we focused the study on the
potential risk of fi re to populated areas.
This study focuses on two distinct elements of the Forest Service study
and data on wildland urban interface. The fi rst data set that we examine is
the Wildland Urban Interface as defi ned above. The second set of data that
we use is the Wildland Intermix —less densely populated areas in wildlands,
which enabled the study to include significant portions of inhabited land in
areas vulnerable to wildfi re.
Federal Resource Allocation
Initially, this study intended to include data detailing all federal expenditures under the National Fire Plan, including grants to communities and
hazardous fuel reduction projects on private and public lands and spatial
information that would indicate where the activities took place. These data
would provide a roadmap to track where federal funding was being spent,
which would allow researchers to examine these data with the data layers
indicating capacity and wildfi re risk. The combination of these layers would
provide information about how well the federal agencies were serving the
areas most at risk from wildfi re.
National Fire Plan Grants—National Fire Plan data for Region 6 are
available in a multi-agency database (projects funded by BLM, Bureau of
Indian Affairs, USDA Forest Service, and Fish and Wildlife Service). They
include zip code and latitude/longitude information for each grant, based on
the location of the grant recipient, and a designation for the type of project
funded (fuels reduction, fi re prevention, planning and education, small-diameter marketing and utilization). Because of the limitations of the grants data,
the decision was made not to analyze the data numerically. This report does
include maps that illustrate the allocation of National Fire Plan Community
Assistance grants in Oregon and Washington in comparison with poverty
and WUI and Inhabited Wildland areas.
Findings
When we began this study, we anticipated that fi ndings would focus on
the provision of services (or gaps in services) to at-risk communities. Actual
fi ndings are considerably different from this original intent, due largely to
the limited availability of data and lack of monitoring information.
USDA Forest Service Proceedings RMRS-P-41. 2006.
405
Lynn and Gerlitz
Mapping the Relationship Between Wildfire and Poverty…
Overall, the fi ndings indicate that using national datasets to illustrate the
complex social and ecological factors influencing wildfi re risk is limited by
the very nature of these elements. Datasets available for social, economic and
ecological factors are more refi ned and meaningful on smaller scales. Locally
specific data and information provide a better indication of the relationship
between wildfi re and poverty and how well services for fi re protection are
being provided to at-risk communities. This is apparent in the data we reviewed, as well as from comments from public meetings held in southwest
and central Oregon and through dialogue with national partners. Despite
these challenges, specific research fi ndings include:
1) a slightly higher percentage of poor households in inhabited wildland
areas that are not considered part of the WUI;
2) poor households in Washington State are more likely to be in areas with
low or no fi re response capabilities than are non poor households;
3) federal land management agency information about grants to communities and hazardous fuels reduction projects is insufficient to allow an
analysis of areas served or improved.
The following section describes these fi ndings in more detail.
Poverty and Wildland Urban Interface and Inhabited Wildland Areas
The fi rst set of fi ndings is related to the incidence of poverty in the wildland urban interface and other inhabited forested land areas. Initial analysis
using the WUI dataset resulted in maps that showed a small portion of the
total forested land area, particularly in the western United States. Further
investigation indicated that the federally defi ned “Wildland Urban Interface”
is based on residential density that excludes many inhabited forest areas. Expanding the analysis to include wildland intermix, the less densely populated
areas that are not included in the WUI, which we refer to from here on as
“Inhabited Wildlands,” allowed us to include significant portions of rural,
inhabited land in areas vulnerable to wildfi re.
Table 1 illustrates the percentage of households in Oregon, Washington,
and nationally in WUI and Inhabited Wildland areas and compares non-poor,
poor, and very poor households. These percentages illustrate a trend in the
Northwest and nationally of a greater number of poverty areas in inhabited
wildland areas than in the states or nation as a whole, or in WUI areas or
non-forested areas.
Results from this analysis indicate that, in general, there are more households in poverty in inhabited wildland areas than there are in the Wildland
Urban Interface or in areas outside of the vegetated wildlands in the rest of
the state. The researchers held regional meetings to share preliminary fi ndings with community organizations, agencies, and citizens in poor areas to
examine data at a local level. These meetings reinforced the fi nding that the
inhabited wildland areas that do not fall within the federal WUI defi nition
are areas with a greater number of households in poverty.
Maps of Oregon, Washington, and the United States on the following pages
illustrate the data described above and provide a visual representation of the
relationship between wildfi re and poverty. The maps illustrate HUD units
where 20% of households or more are low-income households in Wildland
Urban Interface and Inhabited Wildland areas.
The study maps of Oregon and Washington clearly indicate a tremendous
amount of inhabited wildland, particularly in the western United States,
406
USDA Forest Service Proceedings RMRS-P-41. 2006.
Mapping the Relationship Between Wildfire and Poverty…
Lynn and Gerlitz
Table 1—Household Location by Poverty Level and Wildland Urban Interface Designation.
Income level
Fire hazard Designation
Not vegetated
WUI
Inhabited
wildlands
Location
Overall
Non Poor
National
Oregon
Washington
77%
79%
79%
79%
78%
79%
81%
83%
83%
76%
77%
78%
Poor
National
Oregon
Washington
23%
21%
21%
21%
21%
21%
19%
17%
17%
24%
23%
22%
Very Poor
National
Oregon
Washington
12%
10%
11%
10%
10%
10%
9%
8%
8%
12%
11%
11%
that is not considered part of the WUI under the Federal Register defi nition
(figures 1, 2, and 3). There is a relatively high level of poverty in the nonWUI rural areas (areas where the housing density is too low to be included
in the WUI).
The maps of Oregon and Washington illustrate a strong relationship between poor areas and the communities in the Inhabited Wildland areas. The
national numbers support this relationship as well. However, more detail is
evident from the national map, which illustrates that, although there may be
more poverty in the inhabited wildlands in some regions, such as the western
United States, other regions may have more households in poverty in the
WUI, as appears to be the case in the Southeast.
If agencies are following the Federal Register defi nition, the strategy to
prioritize WUI lands for hazardous fuels reduction work and the funding
reserved for those areas means that fewer resources are being allocated in
some regions to the poorest citizens in communities that may need the most
assistance.
Poverty and Protection Capability
This study provides data about the level of fi re district capabilities, which
is only one indicator of the capacity of a community to reduce wildfi re risk.
This information is provided for the state of Washington.
Table 2 illustrates the percentage of poor and non-poor households in each
of four fi re response categories in Washington. A small area in the west-central portion of the state did not fall under a particular response category but
showed that 33.1% of households are poor. Although there are low-income
populations with all levels of fi re protection, the map illustrates the visual
relationship between the Wildland Urban Interface and Inhabited Wildland
areas, as well as poverty and protection capability. In general, a higher percentage of poor households live in areas with no or low fi re response capability
than do non-poor households.
Figure 4 illustrates the level of fi re protection capability in relation to the
Wildland Urban Interface and poverty data in the state of Washington. The
map shows a relationship between high poverty areas that overlap with areas
with limited to no protection capability.
USDA Forest Service Proceedings RMRS-P-41. 2006.
407
Mapping the Relationship Between Wildfire and Poverty…
Figure 1—Oregon: Wildland Urban Interface, Inhabited Wildlands, and Low-Income Areas.
Lynn and Gerlitz
408
USDA Forest Service Proceedings RMRS-P-41. 2006.
Lynn and Gerlitz
Figure 2—Washington: WUI, Inhabited Wildlands, and Low-Income Areas.
Mapping the Relationship Between Wildfire and Poverty…
USDA Forest Service Proceedings RMRS-P-41. 2006.
409
Mapping the Relationship Between Wildfire and Poverty…
Figure 3—National: WUI, Inhabited Wildlands, and Low-Income Areas.
Lynn and Gerlitz
410
USDA Forest Service Proceedings RMRS-P-41. 2006.
Mapping the Relationship Between Wildfire and Poverty…
Lynn and Gerlitz
Table 2—Washington Households, Poverty Level and Fire Protection Capability.
Income Level
Non-Poor
Poor
Very Poor
High Fire
Response
Medium Fire
Response
Low Fire
Response
No Fire
Response
82%
18%
8%
85%
16%
7%
79%
21%
10%
77%
23%
12%
Figure 4—Washington: Fire District Rating and Low-Income Areas.
USDA Forest Service Proceedings RMRS-P-41. 2006.
411
Lynn and Gerlitz
Mapping the Relationship Between Wildfire and Poverty…
Federal Resource Allocation and Grants
The original goal of this study was to examine the provision of fi re-related
services and resources to low-income, low capacity communities in high-risk
wildfi re areas. Because of limited data about actual grant and resource allocation, it is not possible to draw reliable conclusions about resource allocation
in and around poor communities. Consequently, our fi ndings are limited to
the discovery that there is inadequate monitoring of NFP expenditures and
program implementation at the national level to ensure the accountability
of federal programs to the goals and priorities set forth in the National Fire
Plan, Healthy Forest Restoration Act, and related wildfi re programs.
National Fire Plan Grants—Data about fi re and aviation community
assistance grants obtained through the National Fire Plan office in Region
6 (Oregon and Washington), produced maps that reflect areas that have received grants that relate to the poverty data in WUI and Inhabited Wildland
areas.
The limitations of these data, as described in the research methods section,
above, restricted our ability to provide percentages of poor communities that
have received (or benefited from) National Fire Plan grants. The points on
the map illustrate where grant funds have been received, not where grants
were actually expended. In some cases, grants may have been received by
agencies and organizations in county seats or municipalities that have higher
income levels than the more rural areas where the funds were expended. The
point data also lack information on the type and amount of treatment that
occurred and the extent to which fi re and fuel conditions, and community
capacity have changed in low-income areas.
Recommendations
Due to the limited availability of data and the limitations of the existing
data, we have focused our recommendations on improving federal agency
understanding and use of social and economic factors through national inventory and monitoring efforts, and on increasing and improving assistance for
low-income and low capacity communities. A summary of recommendations
is provided below.
1. Redefi ne the areas prioritized for federal assistance to include rural areas
with lower residential density (e.g., inhabited wildlands).
2. Improve systems for monitoring and evaluating the National Fire Plan and
other federal fi re-related program implementation by including social
and economic, as well as ecological, information.
3. Immediately develop nationally consistent standards for monitoring National Fire Plan expenditures that will enable assessment of outcomes
over time.
4. Develop a method for measuring community capacity in the context of
wildfi re.
5. Provide clear direction to federal and state land management agencies
for determining “at risk” communities, giving significant consideration
to social and economic factors. Target assistance and federal programs
based on community needs.
6. Integrate indicators of community capacity into state, regional, and local
planning and risk assessment.
412
USDA Forest Service Proceedings RMRS-P-41. 2006.
Mapping the Relationship Between Wildfire and Poverty…
Lynn and Gerlitz
7. Increase federal support and funding to programs that target assistance
to “at risk” communities.
8. Conduct case studies in high wildfi re risk areas to gain more in-depth
knowledge about the relationship between wildfi re, poverty and community capacity.
Acknowledgments
Several individuals were instrumental to this research. Special thanks to
Dacia Meneguzzo and Ron McRoberts from the Forest Inventory and Analysis, North Central Research Station, USDA Forest Service. Dacia provided
the mapping expertise and labor, and Ron provided knowledge and advice
regarding spatial mapping and datasets. Krista Gebert, Rocky Mountain
Research Station, USDA Forest Service and Susan Odell, National Rural
Community Assistance Coordinator, USDA Forest Service bridged the gap
between the authors and the Forest Service, providing support and assistance.
Bonnie Wood and Lauren Maloney assisted in obtaining data about community assistance grants from the Region 6 National Fire Plan office.
References
American Forests. 2001. Comments on the Federal Register Notice, “Urban
Wildland Interface Communities within the Vicinity of Federal Lands that are
of High Risk from Wildfire.” (February 23rd) http://www.americanforests.org/
downloads/fp/AFpolicyviews/fedregltr.pdf
California Fire Alliance. 2001 Characterizing the fi re threat to wildland-urban
interface areas in California. Sacramento: California Fire Alliance.
Catalog of Federal Domestic Assistance 83.557: Pre-Disaster Mitigation, http://
aspe.os.dhhs.gov/search/cfda/p83557.htm
Center for Watershed and Community Health. 2001. “Wildfire and Poverty: An
Overview of the Interactions Among Wildfires, Fire-related Programs, and Poverty
in the Western States.” Prepared for CWCH by ECONorthwest. http://www.
econorthwest.com/pdf/wild_pov.pdf
The CED Centre Forest Communities Project. 1997. Promoting Community
Economic Development for Forest-based Communities: the Process of
Community Capacity Assessment. http://www.sfu.ca/cedc/forestcomm/
fcbackfi le/assessment/capasproc.html
Council on Environmental Quality. 1997. “Environmental Justice: Guidance Under
the National Environmental Policy Act.” Executive Order 12898.
Council on Environmental Quality. 2000. Managing the Impact of Wildfi res on
Communities and the Environment: A Report to the President in Response to
the Wildfi res of 2000.
Donoghue, E. 2003. Delimiting Communities in the Pacific Northwest. USDA
Forest Service. Pacific Northwest Research Station. General Technical Report
PNW-GTR-570.
Donoghue, E.; and N.L. Sutton. Forthcoming. “Socioeconomic Conditions and
Trends for Communities in the Northwest Forest Plan Region, 1990 to 2000,”
Chapter 2, Volume 3, in Northwest Forest Plan: the fi rst ten years. Rural
communities and economics, ed. S. Charnley, Gen. Tech. Rep. Portland, OR: U.S.
Department of Agriculture, Forest Service, Pacific Northwest Research Station.
USDA Forest Service Proceedings RMRS-P-41. 2006.
413
Lynn and Gerlitz
Mapping the Relationship Between Wildfire and Poverty…
Federal Register, Vol. 66, No. 160, (August 17, 2001), Notices, http://www.fi replan.
gov/communities_at_risk.cfm
Fire Effects Monitoring and Inventory Protocol (FIREMON). http://fi re.org/
fi remon/default.htm
Healthy Forest Restoration Act of 2003. Public Law 108-148. 108th Congress.
Insurance Services Office. 2003. “Public Protection Classification” http://www.
isomitigation.com/fi re1.html
Jakes, P.; Kruger, L.; Monroe, M.; Nelson, K.; and Sturtevant, V. “A Model For
Improving Community Preparedness to Wildfi re.” http://www.ncrs.fs.fed.
us/4803/highlights.htm
Johnson, K.M. “Demographic Trends in National Forest, Recreational, Retirement
and Amenity Areas,” Working Papers on Recreation, Amenities, Forests and
Demographic Change. No. 2. 2002.
Kusel, J. 1996. Well-being in forest-dependent communities, part I: A new approach.
In Sierra Nevada Ecosystem Project: Final Report to Congress, vol. II, Assessments
and Scientific Basis for Management Options, S. Doak and J. Kusel (eds.), 361-74.
Davis: University of California, Centers for Water and Wildland Resources.
Landscape Fire and Resource Management Planning Tools Project, (LANDFIRE).
http://www.landfi re.gov.
McKnight, John L.; Kretzmann, John P. 1996. Mapping Community Capacity.
Institute for Policy Research, Northwestern University. Neighborhood Innovations
Network.
Oregon Economic and Community Development Dept. Economic Data – Distressed
Areas in Oregon. http://www.econ.state.or.us/distarea.htm
Oregon Progress Board. 2003 Benchmark Performance Report to the Oregon
Legislative Assembly. Chap. 3 Communities – Social Support. http://www.econ.
state.or.us/opb/2003report/Report/2003BPR.pdf
National Association of State Foresters. 2003. Field Guidance: Identifying and
Prioritizing Communities at R isk. http://www.stateforesters.org/reports/
COMMUNITIESATRISKFG.pdf
National Fire Plan Operations and Reporting System (NFPORS). http://www.
nfpors.gov
Northwest Area Foundation. NWAF Indicator Website – Indicators for Oregon.
http://www.indicators.nwaf.org/ShowOneRegion.asp?FIPS = 41000
Radeloff, V.C., R.B. Hammer; S.I Stewart; J.S. Fried; S.S. Holcomb; and J.F.
McKeefry. 2005. The Wildland Urban Interface in the United States. Ecological
Applications 15:799-805.
Smith, N.; Littlejohns, L.B.; and Roy, D. May 2003. “Measuring Community
Capacity: State of the Field Review and Recommendations for Future Research.”
David Thompson Health Region Red Deer, Alberta T4N 6H2
Stauber, K.N. 2001. Why Invest in Rural America—And How? A Critical Public
Policy Question for the 21st Century, Northwest Area Foundation
Stone, W. 2001. Measuring Social Capital: Towards a theoretically informed
measurement framework for researching social capital in family and community
life. Research Paper No. 24, February 2001, Australian Institute of Family
Studies.
Sturtevant, V.; Moote, M.A; Jakes, P.; Cheng, A.S. 2005. Social Science to improve
fuels management: a synthesis of research on collaboration. Gen Tech. Rep.
NC-257. St. Paul, MN: U.S. Department of Agriculture, Forest Service, North
Central Research Station.
Teie, W.C., B.F. Weatherford. 2000. Fire in the west: The wildland/urban interface
fi re problem. Report to the Council of Western State Foresters. Rescue, CA: Deer
Valley Press.
414
USDA Forest Service Proceedings RMRS-P-41. 2006.
Mapping the Relationship Between Wildfire and Poverty…
Lynn and Gerlitz
U.S. Census Bureau. The 2003 HHS Poverty Guidelines. U.S. Dept. of Health and
Human Services. http://aspe.hhs.gov/poverty/03poverty.htm
U.S. Department of Agriculture Economic Research Service. Rural Indicators Map
Machine. http://www.ers.usda.gov/data/RuralMapMachine/
U.S. Department of Agriculture Forest Service and US Department of the Interior
Bureau of Land Management. 2004. The Healthy Forests Initiative and Healthy
Forests Restoration Act: Interim Field Guide. FS-799. http://www.fs.fed.us/
projects/hfi/field-guide/documents/haz-fuel-cvr.pdf
U.S. Department of Agriculture Forest Service. 2003. The Principal Laws Relating
to USDA Forest Service State and Private Forestry Programs. FS-758.
U.S. Department of Agriculture Forest Service. 2000a. Interim Strategic Public
Outreach Plan: Reaching Out to America. FS-665. http://www.fs.fed.us/cr/
national_programs/correspondence/spop/fsspop.pdf
U.S. Department of Agriculture Forest Service. 2000b. Protecting People and
Sustaining Resources in Fire Adapted Ecosystems: A Cohesive Strategy. The Forest
Management Team Response to the General Accounting Office Report GAO/
RCED-99-65.
U.S. Department of Agriculture and U.S. Department of the Interior. 2001. Urban
Wildland Interface Communities Within The Vicinity Of Federal Lands That Are
At High Risk From Wildfi re. Federal Register 66: 751.
U.S. Department of Housing and Urban Development. 2003. FY 2003 HUD
Income Limits Briefi ng Material. http://www.huduser.org/datasets/il/fmr03/
BRIEFING-MATERIAL-3-1-03.doc
Vogelmann, J.E.; S.E. Howard; L. Yang; C.R Larson; B.K. Wylie; N. van Driel. 2001.
Completion of the 1990s National Land Cover Data set for the conterminous
United States from Landsat Thematic Mapper data and ancillary data sources.
Photogr. Eng. & Remote Sensing 67, 650-662.
USDA Forest Service Proceedings RMRS-P-41. 2006.
415


© Copyright 2026