
Generation and Evaluation of Scheduling DAGs: How to
CSMR, Vol. 1, No. 1 (2011)
Generation and Evaluation of Scheduling DAGs: How to
provide similar evaluation conditions.
Alexandra Olteanu, Andreea Marin
University POLITEHNICA of Bucharest
Faculty of Automatic Control and Computers, Computer Science Department
Emails: {alexandra.olteanu, andreea.marin}@cti.pub.ro
Abstract
When evaluating the efficiently and robustness of scheduling applications’ tasks in a
large scale distributed system through simulation, usually Directed Acyclic Graphs(DAGs)
are used. While the majority of evaluation studies are based on random DAGs which
do not emphasize real applications DAGs, a more realistic approach should be considered
when generating these synthetic DAGs. It should consider the generation of DAGs with
structures more similar with those resulted from real application workflows in order to
enhance better evaluations of scheduling algorithms. Furthermore metrics, such as task
granularity, communication to computation ratio, parallelism degree and constraints degree,
which are used for evaluating DAGs are presented.
Keywords: DAG Generation, DAG Evaluation, Task Graphs, Scheduling DAGs
1. Introduction
Abstract DAG has been extensively used in distributed systems workflow modeling. In
other words, if a computational problem can be divided into a number of subtasks, the data
dependencies between these subtasks are usually described by means of a directed acyclic
graph (DAG) also called task graph. In general, synthetic DAGs are used for evaluation
and classification of existing scheduling heuristics, proposal of a new scheduling approach
and comparison with existing heuristics. Alas, using different parameters and methods
when generating these DAGs results in a unfair performance comparisons of scheduling algorithms, due to testing under different conditions. As a result, we can identify the need to
provide the appropriate tool that will allow researchers to evaluate their scheduling algorithms under similar conditions, by generating various types of DAGs based on both realistic
parallel algorithms patterns, which can be found in a significant number of applications,
and synthetic patterns.
To address the aforementioned need various techniques have been proposed and used in
order to permit the modeling of a large variety of applications. We argue about the applicability of the resulted models as they should embody real applications’ characteristics and
complexity. We consider necessary the correct identification of some of the most common
patterns that can be found within an application workflow. Thus, this paper aims only to
introduce a DAG generator and to explain why we choose to generate certain patterns, clas-
A. Olteanu, A. Marin
Generation and Evaluation of Scheduling DAGs.
sical testbeds. The main goal is to propose a way for building an appropriate tool for DAGs
generation in order to give the possibility of evaluating scheduling algorithms in almost the
same conditions.
The paper is organized as follows: Section 2 presents related work in the field of generation and evaluation of scheduling DAGs. In Section 3 the DAG model which is used for
this analysis is described. Section 4 highlights for what patterns the DAGs generation are
considered and in Section 5 a series of metrics for DAG evaluation are presented. Finally,
in Section 6 we present the main conclusions.
2. Related Work
As a large number of scheduling algorithms take into account the mapping of application
workflow onto DAG structure, leads to the issue of evaluating these algorithms by using
various DAG structures which have the ability to simulate real application scenarios. Thus,
an efficient and adequate evaluation scheme for characterizing the workflow distribution is
needed for the design of scheduling heuristics. In order to provide a consistent analysis of
scheduling algorithms various methods for DAG generation along with several evaluation
metrics were proposed in the literature.
In [4] Canon proposes a series of comparison metrics for scheduling DAGs on heterogeneous systems and uses them to perform an experimental study with the purpose of showing
how they are correlated to each other in the case of task scheduling, with dependencies between tasks. In addition, a method for precise evaluation of the efficiency and the robustness
of stochastic DAG schedules is presented [3]. They use a dynamic programming method
with a bottom-up approach, since the main problem resides in the characterization of correlations between each random variable and the previous formulation reveals an overlapping
substructure, suboptimal computations occur when determining the correlation coefficient
between two random variables with a classic top-down recursion.
Tobita has designed a standard task graph set for fair evaluation of multi processor
scheduling algorithms with the purpose of making possible the evaluation of scheduling algorithms under the same conditions [11]. In addition, the importance of fairly algorithm
performance comparison is highlighted. Furthermore, others considered the need of having
heterogeneous computing system model in order to simulate different heterogeneous computing environments to allow the study of the relative performance of different scheduling
heuristics under different situations. In order to address this issue, Ali [10] proposed the
using of the expected execution times of the tasks that arrive in the system on the different
machines present in the system for characterizing a simulated heterogeneous computing
environment. The needed information is proposed to be arranged in an “expected time to
compute” matrix as a model of the given heterogeneous computing system, where an entry
(i, j) is the expected execution time of task i on machine j.
3. DAG model
DAGs are often used to model different types of structures in computer science and mathematics. In a DAG, the reachability relation forms a partial order, and any finite partial
order may be represented as a DAG by utilizing reachability [1]. DAGs are often used to
CSMR - Computer Science Master Research, Vol. 1, No. 1 (2011)
model processes in which information flows in a consistent direction through a network of
processors. The DAG model definition that we use within this analysis is presented below:
A DAG – G = (V, E, w, c) - that represents the application to be scheduled
• V = {vi : i = 1, . . . , N } – represents the set of tasks.
• E = {eij : data dependencies between node ni and node nj }
• w(ni ) – represents the node ni ’s computation cost
• (eij ) – represents the communication cost between node ni and node nj .
The relationships between the DAG tasks can be expressed as precedence constraints.
Precedence constraints impose the execution order of the nodes according to their dependencies (mapped into communication edges labeled with (eij ) data transfer cost). A node
can only start execution after all its predecessors, have completed their execution.
Our approach consists of generating DAG patterns taking into consideration a series of
DAG characteristics such as number of nodes, communication to computation ratio (CCR),
number of tasks per level and different applications workflow patterns.
4. DAG Generation
When generating DAGs, one must consider both the generic constraints presented above
and the ones specific to the problem at hand. These specific constraints will be presented
in the current section.
We have chosen to generate a series of specific DAGs that are common for applications’
tasks scheduling as mentioned in literature. First, we selected task graphs representing
various types of parallel algorithms. The selected algorithms used for graph generation are:
LU decomposition, Laplace equation solver, Stencil algorithm and Fast Fourier Transform.
Second, we also considered other types of DAGs, such as random DAGs, leveled DAGs with
a preselected maximum link complexity and balanced DAGs in order to obtain synthetic or
more general DAGs. For each of these approaches, the number of generated nodes depends
on the pattern used as many of the generated types of DAGs satisfy strict patterns. The
task granularity is achieved by varying the communication to computation ratio (CCR).
In addition, CCR is obtained using a ”best effort” approach, by generating random values
from a restricted, defined or computed, interval for the costs of links and nodes and assuring
a balanced distribution of these costs. Next we will give a brief description and motivation
for each of the DAG’s patterns that our generator supports. However a detailed description
of the properties of the DAG patterns for each class of parallel applications is out of the
scope of this paper and can be easily in many papers that evaluate scheduling algorithms
[2] or about numerical methods [9].
4.1 Random DAGs
A large number of papers about scheduling algorithms use for evaluation random generated
DAGs. This types of graphs are generated using a number of parameters that are also
mentioned in the literature:
A. Olteanu, A. Marin
Generation and Evaluation of Scheduling DAGs.
n1
c1
n1
c1
n2
c2
n3
c3
n4
c4
n5
c5
n6
c6
n7
c7
n2
c2
n4
c4
n3
c3
n5
c5
n6
c6
n8
c8
n8
c8
n9
c9
n10
c10
n1
c1
n11
c11
n9
c9
n10
c10
n11
c11
n12
c12
n13
c13
n14
c14
n15
c15
n12
c12
n13
c13
n15
c15
n16
c16
n2
c2
n14
c14
n3
c3
n4
c4
n16
c16
n8
c8
n17
c17
n15
c15
n16
c16
n5
c5
n9
c9
n6
c6
n10
c10
n11
c11
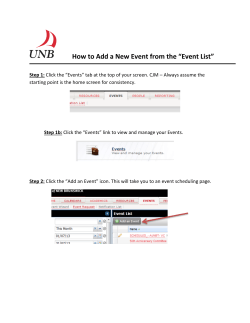
Figure 1: (a) Balanced graph, (b) Laplace graph, (c) Leveled graph with a preselected
maximum link complexity 3
n1
c1
n1
c1
n2
c2
n2
c2
n3
c3
n4
c4
n5
c5
n6
c6
n7
c7
n8
c8
n9
c9
n10
c10
n11
c11
n12
c12
n13
c13
n14
c14
n15
c15
n3
c3
n5
c5
n6
c6
n8
c8
n9
c9
n4
c4
n1
c1
n2
c2
n3
c3
n4
c4
n5
c5
n6
c6
n7
c7
n8
c8
n9
c9
n10
c10
n11
c11
n12
c12
n7
c7
Figure 2: (a) FFT graph, (b) LU graph, (c) Stencil graph
CSMR - Computer Science Master Research, Vol. 1, No. 1 (2011)
• the number of tasks in graph
• communication to computation ratio (CCR)
• the interval from which the costs for communication and processing are randomly
selected
However, for the performance obtained for scheduling algorithms on synthetic randomly
generated DAGs is given less significance, due to the DAG shape and type of tasks in DAG.
In general, a scientific workflow application has a unique shape DAG due to its design,
which is made to accomplish a complex task by means of job parallelism. The DAGs of
many real world workflow applications are well balanced and highly parallel [12]. Moreover,
for these applications a small number of unique operations can be distinguished.
4.2 Balanced DAGs
Given the observations made for randomly generated DAGs, the generation of full balanced
DAGs was considered. For this, two new parameters are used for their generation: the
number of parallel sections, for which the number of concurrent tasks is randomly selected
considering the remained number of tasks, and the minimum number of levels. The general
structure of these types of graphs is presented in Figure 1(a).
4.3 Leveled DAGs with a preselected maximum link complexity
We considered leveled DAGs with a preselected maximum link complexity as it is used in
evaluating scheduling heuristics [8]. This technique defines the construction of tasks graph,
level by level. For each level, excluding the first one, it looks for a number of parents for
each node, which is lower than a predefined threshold for links complexity, in the above
level. Graph construction takes into account the following defined parameters: number of
nodes, number of task levels, processing power, links complexity and communication costs.
Using this method, with small modifications, such as restricting for groups of nodes in one
level to have a single common child in the next level or for groups of nodes in a lower level
to have a single common parent in the previous level, patterns for in and out tree graphs
can also be generated. A small visual example of this graph can be seen in Figure 1(c).
4.4 Parallel Algorithms Mapping DAGs
Furthermore, the generation of task graphs representing various types of parallel algorithms
should also be considered. These types are chosen considering the number of real application
graphs in which these graph patterns can be found. We consider the most common used
types of parallel algorithms in the literature, such as in [2]: LU-decomposition algorithm,
Laplace algorithm, FFT algorithm (Fast Fourier Transform algorithm), Stencil algorithm.
Miniature samples of each of these types are presented in Figure 2. In all these cases, the
generation of different size DAGs is made by varying the number of nodes and CCR values.
Although, the original algorithms require, for some applications, the same costs for all or
just a part of nodes and edges, the costs are randomly selected from a given range and only
the graph structure was restricted to a given pattern at generation.
A. Olteanu, A. Marin
Generation and Evaluation of Scheduling DAGs.
4.4.1 LU algorithm graph
The LU algorithm can be characterized by the size of input data matrix, because the number
of nodes and edges in the task graph depends on the size of this matrix. The LU algorithm
that is used for parallelization in the majority of cases is simply a reorganization of classic
Gaussian elimination algorithm. The major operations are formed of the algorithm detailed
steps presented in [7]. These steps perform factorization, updates of U and matrix updates.
Note that these operations are carried out in a parallel environment. They can execute
concurrently but are, however, subject to a series of constraints highlighted in Figure 2(b).
The motivation for choosing this algorithm pattern is the fact that LU decomposition is
used in solving linear equations systems, matrix inversion, but it can also be used in fields
such as FPGA programming.
4.4.2 Laplace algorithm graph
In the general form of Laplace algorithm tasks graph, a node is constrained by its left and
right upper neighbors. It combines groups of consecutive mesh points and corresponding
values into coarse-grain tasks, yielding p tasks, each with n/p of values. In this way communication is greatly reduced, but the values within each coarse-grain task must be updated
sequentially. So, the number of tasks p can have an important effect on the performance
[2]. A miniature task graph for Laplace algorithm can be seen in Figure 1(b).
The main usage of this algorithm is for the differential equation solving and it can be
extended for use in the engineering field for solving circuit analysis problems.
4.4.3 FFT algorithm graph
For the generation of the FFT task graphs we have considered the Cooley–Tukey FFT
algorithm, which would be used for task decomposition. In our algorithm, the butterfly
diagram was used to generate task dependencies. The usage of FFT when generating
DAGs requires that, on the level where the computation starts, the number of parallel tasks
to be a power of 2. See Figure 2(a).
The method used to generate the DAG after a FFT algorithm is an adaptation of the
Cooley–Tukey FFT algorithm. After the DAG’s root node is generated the nodes on the
first level of the graph are generated. The number of the first level of generated nodes must
be a power of two in order to be able to group them in butterfly pairs. The total number
of generated levels is equal to lnn, where n is the number of nodes on the first level of the
graph. After the next level of nodes is generated the relationship parent child between the
nodes from different levels is set using the relationship between the positions of the nodes.
The child node can have only two parents, one with the same position on the previous level
and one with the position computed from the following formula:
childindex + currentlevel, 2/childindex &&childindex + currentlevel < n
childindex − currentlevel, otherwise
In general, the Fast Fourier Transform is used for signal and image processing and can
be considered as the most ubiquitous algorithm for analyzing and manipulating digital and
discrete data. This algorithm has a wide range of applications: electro-acoustic music and
CSMR - Computer Science Master Research, Vol. 1, No. 1 (2011)
audio signal processing, medical imaging, image processing, pattern recognition, computational chemistry, error correcting codes. Maybe one of the most important usages of the
FFT algorithm is the genfft compiler [5]
4.4.4 Stencil algorithm graph
The motivation for choosing the Stencil parallel algorithm is the usage of this pattern in a
significant number of applications, but most notably in image processing and simulation.
Furthermore, a large variety of linear and non-linear image processing operations are specified using stencils. Among these operations we can find linear convolution and non-linear
noise reduction. Explicit solutions to partial differential equations use iterative applications
of stencil operations. These are used, for example, in image processing and in simulation
and seismic reconstruction.
The graph is generated by first selecting the number of levels and tasks on each level.
Then for each node ni,j we select three consecutive children in the lower level, the node
in the next level with the same index ni−1,j and its’ left and right neighbors, ni−1,j−1 and
ni−1,j+1 . Figure 2(c) highlights the graph pattern on a small example.
5. DAG evaluation
The aim of this analysis is to provide a DAG generator whose implementation is based on
a series of various techniques and to provide a strong motivation for each one of these techniques by identifying a number of concrete applications where the resulted DAG patterns
can be found. Therefore it represents an aggregation of different methods used for generating DAGs in scientific studies in the context of scheduling in distributed environments
and offers a robust and complex tool. In real-life scenarios, a scheduling algorithm needs to
address a significant number of constraints and performance requirements. It should exploit
parallelism by identifying the task graph structure, and take into consideration task granularity (amount of computation with respect to communication), arbitrary computation
and communication costs. Consequently a set of metrics for DAG’s evaluation [6] should
also be defined in order to provide a way for classifying scheduling heuristics by different
application’s characteristics.
5.1 Granularity
Depending on its granularity, which is a measure of the communication to computation
ratio, a DAG can be coarse grained (the computation dominates the communication) or
fine grained (the communication dominates the computation). Granularity of a DAG is
defined as:
g(G) = min(cn(x)/max(c(x, i))),
where cn(x) - is the computation cost of node x
c(x, j) - the communication costs from node x to node j
x, j - represents the node’s and can take values from 1 to the number of nodes
(1)
A. Olteanu, A. Marin
Generation and Evaluation of Scheduling DAGs.
We conclude that: I/O bound term is equivalent with fine-grained and CPU-bound
term is equivalent with coarse-grained. Intuitively a graph is coarse-grained if the amount
of computation is relatively large with respect to communication.
5.2 CCR (Communication to Computation Ratio)
Definitions found in the literature usually assume CCR defined as the average edge weight
divided by the average node weight. With the help of CCR, one can judge the importance of
communication in a task graph, which strongly determines the scheduling behavior. Based
on CCR we classify task graphs in:
• CCR < 1 - coarse grained graph
• CCR = 1 - mixed
• CCR > 1 - fine grained graph
X
c(x, j) ∗ number of nodes
x,j
CCR = X
cn(x) ∗ number of edges
(2)
x
where cn(x) - is the computation cost of node x, c(x, j) - the communication costs from
node x to node j, and x, j - represents the node’s number and can take values from 1 to
the number of nodes.
5.3 Constraints degree
The constraints degree (CD) of a DAG is defined as the number of connections between
nodes. The degree of constraints can be: low, medium, high. The values that separate
these tree classes are recommended to be chosen considering the structure of the resources
network. A variation of the constraints degree metric can be considered the density of a
DAG, which determines the number of dependencies between nodes from two consecutive
DAG levels. Of course, this metric can be applied only to leveled DAGs.
5.4 Parallelism degree
Another important metric that should be considered is the DAG parallelism degree (PD)
which is the maximum number of tasks that can be executed concurrently. Using this
metric, DAGs can be classified in the following way: a small value for PD indicates low task
parallelism and a large value, is indicating a high degree of parallelism among the DAG
tasks. This is computed taking into account the constraints among the tasks. Like for CD,
the value that separates the two classes needs to be chosen accordingly with the number of
processors on which we want to schedule de current application.
6. Conclusions
This paper aims to indicate the correct way of constructing a DAG generator. Its implementation should be based on a series of various techniques and an appropriate motivation
CSMR - Computer Science Master Research, Vol. 1, No. 1 (2011)
for each one of these techniques by identifying a number of concrete applications where the
resulted DAG patterns can be found. In addition, the applications behind this paper represent an useful tool for testing and comparing scheduling algorithms in similar conditions by
means of simulation. Furthermore, a set of evaluation metrics is given for evaluating DAGs
in the context of scheduling in large scale distributed systems.
References
[1] Oded Maler Ahmed Bouajjani, Javier Esparza.
Reachability analysis of pushdown automata application to model checking.
http://wwwverimag.imag.fr/ maler/Papers/pda.pdf, 06/06/2010.
[2] Vincent Boudet. Heterogenous task scheduling: a survey. Research Report RR-6895,
INRIA, 2001.
[3] Louis-Claude Canon and Emmanuel Jeannot. A Comparison of Robustness Metrics
for Scheduling DAGs on Heterogeneous Systems. In Sixth International Workshop on
Algorithms, Models and Tools for Parallel Computing on Heterogeneous Networks HeteroPar’07, page 10 pages, Austin United States, 2007. In conjunction with [Cluster
2007] The 2007 IEEE International Conference on Cluster Computing. The workshop
proceedings will be published through the IEEE Computer Society Press as part of the
Cluster 2007 proceedings.
[4] Louis-Claude Canon and Emmanuel Jeannot. Precise Evaluation of the Efficiency and
the Robustness of Stochastic DAG Schedules. Research Report RR-6895, INRIA, 2009.
[5] Matteo Frigo. A fast fourier transform compiler. Proceedings of the 1999 ACM SIGPLAN Conference on Programming Language Design and Implementation (PLDI),
3:195–207, May 1999.
[6] Udo Honig and Wolfram Schiffmann. A comprehensive test bench for the evaluation
of scheduling heuristics. Proceedings of the 16th International Conference on Parallel
and Distributed Computing and Systems (PDCS),, 2004.
[7] Parry Husbands and Katherine Yelick. Multi-threading and one-sided communication
in parallel lu factorization. SC Conference, 0:1–10, 2007.
[8] Florin Pop, Ciprian Dobre, Gavril Godza, and Valentin Cristea. A simulation model
for grid scheduling analysis and optimization. In Proceedings of the international symposium on Parallel Computing in Electrical Engineering, pages 133–138, Washington,
DC, USA, 2006. IEEE Computer Society.
[9] Singiresu S. Rao. Applied Numerical Methods for Engineers and Scientists. Prentice
Hall Professional Technical Reference, 1st edition, 2001.
[10] Shoukat, Shoukat Ali, Howard Jay Siegel, Muthucumaru Maheswaran, Debra Hensgen, and Sahra Ali. Representing task and machine heterogeneities for heterogeneous.
Journal of Science and Engineering, Special 50 th Anniversary Issue, 3:195–207, 2000.
A. Olteanu, A. Marin
Generation and Evaluation of Scheduling DAGs.
[11] Takao Tobita and Hironori Kasahara. A standard task graph set for fair evaluation of
multiprocessor scheduling algorithms. Journal of Scheduling, 5(5):379–394, 2002.
[12] Zhifeng Yu and Weisong Shi. An adaptive rescheduling strategy for grid workflow
applications. Parallel and Distributed Processing Symposium, International, 0:115,
2007.


© Copyright 2026