
How to Steer Users Away from Unsafe Content
Date of acceptance
Instructor
How to Steer Users Away from Unsafe Content
Jian Liu
Helsinki May 28, 2014
MSc Thesis
UNIVERSITY OF HELSINKI
Department of Computer Science
Grade
HELSINGIN YLIOPISTO — HELSINGFORS UNIVERSITET — UNIVERSITY OF HELSINKI
Laitos — Institution — Department
Tiedekunta — Fakultet — Faculty
Faculty of Science
Department of Computer Science
Tekijä — Författare — Author
Jian Liu
Työn nimi — Arbetets titel — Title
How to Steer Users Away from Unsafe Content
Oppiaine — Läroämne — Subject
Computer Science
Työn laji — Arbetets art — Level
Aika — Datum — Month and year
Sivumäärä — Sidoantal — Number of pages
MSc Thesis
May 28, 2014
66 pages
Tiivistelmä — Referat — Abstract
Online social networks have brought along much convenience to our daily lives. On the other hand,
they also provide platforms for the rapid propagation of unsafe content. Providing easy-to-use
ways for ordinary users to avoid unsafe content online is an open issue. In this thesis, we mainly
study two schemes that are based on social navigation to identify unsafe content. The first one
is crowdsourcing, which has two main drawbacks: (a) a time lag before unsafe content is flagged
as such, and (b) the difficulty of dealing with subjective perceptions of “inappropriateness”. We
propose a machine learning approach to address the time lag problem and get a promising result.
This approach could be used to complement crowdsourcing.
We also study the notion of “groupsourcing”: taking advantage of information from people in a user’s
social circles about potentially unsafe content. Groupsourcing can both address the time lag problem
and identify inappropriate content. To test its effectiveness, we have implemented FAR, which
allows savvy Facebook users to warn their friends about potentially unsafe content, and conducted
a controlled laboratory study. The results show that groupsourced signals can complement other
types of signals and compensate for their weaknesses by countering viral spreading of unsafe content
in a more timely fashion.
The current version of FAR, consisting of a Facebook application and a Firefox browser extension
is publicly available for use.
ACM Computing Classification System (CCS):
Security and privacy → Systems security → Browser security
Security and privacy → Intrusion/anomaly detection and malware mitigation → Malware and its
mitigation
Security and privacy → Software and application security → Social network security
and privacy
Security and privacy → Human and societal aspects of security and privacy → Usability in security
and privacy
Information systems → World Wide Web → Web applications → Crowdsourcing → Reputation
systems
Human-centered computing → Collaborative and social computing → Collaborative
and social computing systems and tools → Social tagging systems
Avainsanat — Nyckelord — Keywords
online social networks, unsafe content, classification, crowdsourcing, groupsourcing, user study
Säilytyspaikka — Förvaringsställe — Where deposited
Muita tietoja — övriga uppgifter — Additional information
ii
Contents
1 Introduction
1
2 Background
2
2.1
Online Social Networks . . . . . . . . . . . . . . . . . . . . . . . . . .
2
2.1.1
Characteristics of Social Graphs . . . . . . . . . . . . . . . . .
3
2.1.2
Examples of OSNs . . . . . . . . . . . . . . . . . . . . . . . .
4
2.2
Unsafe Content . . . . . . . . . . . . . . . . . . . . . . . . . . . . . .
5
2.3
Automated Expert Systems . . . . . . . . . . . . . . . . . . . . . . .
7
2.4
Social Navigation . . . . . . . . . . . . . . . . . . . . . . . . . . . . .
9
2.5
History Systems . . . . . . . . . . . . . . . . . . . . . . . . . . . . . . 10
2.6
Crowdsourcing . . . . . . . . . . . . . . . . . . . . . . . . . . . . . . 11
2.7
2.8
2.6.1
Advantages and Challenges of Crowdsourcing . . . . . . . . . 12
2.6.2
Crowdsourcing and Security . . . . . . . . . . . . . . . . . . . 13
Groupsourcing . . . . . . . . . . . . . . . . . . . . . . . . . . . . . . . 16
2.7.1
Effective Flow of Information . . . . . . . . . . . . . . . . . . 16
2.7.2
Advantages and Challenges of Groupsourcing
2.7.3
Groupsourcing and Security . . . . . . . . . . . . . . . . . . . 18
. . . . . . . . . 17
Statistical Tools . . . . . . . . . . . . . . . . . . . . . . . . . . . . . . 19
3 Problem Statement
22
4 Rating Prediction for Crowdsourcing
23
4.1
Datasets . . . . . . . . . . . . . . . . . . . . . . . . . . . . . . . . . . 24
4.2
Classification . . . . . . . . . . . . . . . . . . . . . . . . . . . . . . . 26
4.3
Classification Performance . . . . . . . . . . . . . . . . . . . . . . . . 27
5 Development of a Groupsourced System
5.1
31
System Architecture . . . . . . . . . . . . . . . . . . . . . . . . . . . 31
5.1.1
Rendezvous Server . . . . . . . . . . . . . . . . . . . . . . . . 32
iii
5.2
5.1.2
Facebook Application . . . . . . . . . . . . . . . . . . . . . . . 37
5.1.3
Firefox Extension . . . . . . . . . . . . . . . . . . . . . . . . . 39
Laboratory Study . . . . . . . . . . . . . . . . . . . . . . . . . . . . . 42
5.2.1
Methodology . . . . . . . . . . . . . . . . . . . . . . . . . . . 42
5.2.2
Result and Analysis . . . . . . . . . . . . . . . . . . . . . . . . 47
6 Conclusion and Future Work
52
References
54
1
1
Introduction
Online social networks (OSNs), such as Facebook1 , Google+2 , Myspace3 , LinkedIn4
and Twitter5 , have become essential in our daily lives. Almost 1.61 billion people
log in at least monthly, from different types of electronic devices [Ema14]. The most
popular OSN is Facebook which has 802 million daily active users and 1.28 billion
monthly active users as of March 2014 [Fac14].
In addition, some OSNs provide developers with APIs so that they can develop third
party applications to enhance user experience. There has been a rapid growth in
the number of OSN related applications. The number of published applications on
Facebook alone is estimated to be more than 9 million [Ins14] in various categories6
with 20 million installs per day [The14]. These applications provide convenience as
well as entertainment to users.
On the other hand, attackers can and do easily utilize such platforms to spread unsafe
content more rapidly than before, by taking advantage of social interaction channels
among users. For example, in May 2009, the Koobface worm spread in Facebook
and stole personal information such as passwords. Later Koobface began to spread
to other OSNs. Obviously OSNs have made it more convenient for attackers to
conduct their attacks. Furthermore, as mobile communication networks are also
kinds of social networks [OSH+ 07], the situation on the mobile application market
is more serious. Malware on mobile platforms can access more sensitive data such
as messages, calls and location data.
As the problem is becoming increasingly serious, nudging users away from unsafe
content turns into a hot topic. One straightforward solution is to provide enough
risk signals to discourage users from making bad decisions (installing a malicious
application or clicking a spam link). Several studies have confirmed that providing risk signals in access control prompts can guide users towards sensible decisions
while installing applications on PCs [KGH+ 12] and smartphones [KCS13], identifying phishing sites from browsers [ECH08].
We study the state of the art and find that most of the current sources of risk
1
https://www.facebook.com/
https://plus.google.com/
3
https://myspace.com/
4
http://www.linkedin.com/
5
https://twitter.com/
6
https://developers.facebook.com/docs/appcenter/categories/ [Accessed 24.04.2014]
2
2
signals are based on objective inputs, which are weak in identifying content that
is benign in a technical sense but malicious in other dimensions. An alternative
source is making use of the contributions from the user base as a whole (also known
as the “crowd”), which is called crowdsourcing. We illustrate the advantages and
disadvantages of this source, and try to complement one of its disadvantages in
this thesis. In addition, we study another approach called groupsourcing, which
identifies unsafe content by gathering inputs from the users’ social circles, and helps
them make proper decisions. We also develop a prototype based on groupsourcing
to help users avoid unsafe content, and then we conduct a user study to verify its
effectiveness.
The rest of the thesis is organized as follows: Section 2 provides a background of our
work. Section 3 presents the problem statement and our contributions. In Section 4,
we propose a method to reduce the time lag of crowdsourcing. In Section 5, we
introduce our groupsourced system together with a laboratory study to evaluate its
effectiveness. We conclude our thesis and identify future work in Section 6.
2
Background
In this section, we introduce the background of this thesis. We first introduce online
social networks (OSNs). Then, we introduce the types of unsafe content we want
to deal with. Next, we introduce the current approaches to identify unsafe content,
i.e., automated expert system and several social navigation systems. Finally, we
introduce the statistical tools that we will be using in the rest of this thesis.
2.1
Online Social Networks
OSNs are usually considered as good vehicles to study the characteristics of social
graphs, because they are able to capture a reasonably large fraction of real offline
relationships and collecting data from OSNs is relatively easier. The relationships
in OSNs can be viewed as social network graphs or social graphs with their users as
nodes, and each “friendship” as an edge between two nodes. In this section, we first
generalize some important characteristics of social graphs, which apply to OSNs as
well. Then, we provide examples of different OSNs which have been analyzed in the
literature.
3
Figure 1: Examples of regular (left), small world (middle) and random (right) networks [WS98].
2.1.1
Characteristics of Social Graphs
Social graphs have many interesting characteristics. However, we only discuss three
important characteristics that are related to our work here.
The first one is called small world networks, where nodes are highly ordered, but
there are still edges that connect randomly chosen nodes [WS98]. Figure 1 shows
that a small world network lies in the middle ground of a regular network and a
random network. Barahona and Pecora show that information propagates faster on
many small world networks [BP02] as two nodes can reach each other by a small
number of hops or steps even through they are not neighbors. Cha et al. find that
the small world property appears on OSNs as well [CMG09]. With the help of this
property, content, whether safe or unsafe, can be propagated virally within social
circles on OSNs. This also implies that meta information about unsafe content, like
risk signals, could also effectively propagate via OSNs.
The second characteristic is called community structure, which means network nodes
are clustered in tightly knit groups, and there are only loose connections between
these clusters [GN02]. Kumar et al. show that OSNs also exhibit community structure [KNT10]. This property ensures that information spreads rapidly within a
social group than between social groups.
The third characteristic is called homophily, which means that people in the same
social group share many sociodemographic, behavioral, and interpersonal characteristics [MSLC01]. Brown et al. show that people within an online community often
have the same interests and psychology [BBL07]. This property implies that people
in the same social group may have similar opinions toward some subjective things.
4
2.1.2
Examples of OSNs
Some OSNs have received considerable attention due to their popularity or importance. We discuss two of the most common OSNs here: Facebook and Twitter.
Facebook
The largest OSN in the world is Facebook, which allows users to set up personal
profiles that include basic information such as name, birthday, marital status, and
personal interests, and establish unidirectional (“following”) or bidirectional (“friending”) social links with other users. Here, we discuss some standard Facebook terminology relevant to our work.
• Post: Posts are the primary methods for users to share information on Facebook. The content of posts can either be only text, a URL with an associated
thumbnail description, or a photo/album shared by a user.
• Wall : Each user has a message board called “wall” that acts as an asynchronous
messaging mechanism between friends. Users’ friends can contact them by
posting messages on their walls. Typically such posts are visible to the user’s
friends, but users are able to make their own privacy settings for certain posts.
In addition, users can upload photos, mark or “tag” their friends, and make
comments besides the photos. All wall posts, photos and comments are labeled
with the name of the user who performed the action and the date/time of
submission.
• Newsfeed: Each user has a newsfeed page, which shows a summary of her
friends’ social activities on Facebook. Facebook continually updates every
user’s newsfeed and the content of a user’s newsfeed depends on when it is
queried.
• App: Facebook allows third-party developers to develop their own applications
for other Facebook users. Each application provides a canvas URL pointing to
the application server, where Facebook dynamically loads the content of the
application. The Facebook platform uses OAuth7 2.0 for user authentication,
application authorization and application authentication. Here, application
authorization ensures that the users grant precise data (e.g., email address)
and capabilities (e.g., ability to post on the user’s wall) to the applications,
7
https://github.com/arsduo/koala/wiki/OAuth/ [Accessed 24.04.2014]
5
and application authentication ensures that a user grants access to her data
to the correct application.
• Like: Each object in Facebook, such as a post, a page, or an app, is associated
with a “Like” widget. If a user clicks the Like widget, the corresponding
object will appear in her friends’ newsfeed and thus allows information about
the object to spread across Facebook. Furthermore, the number of Likes (i.e.,
the number of users who have clicked the Like widget) received by an object
also represents the reputation or popularity of the object.
Twitter
Twitter is a well-known OSN that focuses on information sharing. It allows users to
share tweets, which are messages of fewer than 140 characters.
The relationship between users on Twitter is called “following”. There is no reciprocation requirement for the relationship of following and being followed. Any user
on Twitter can be a follower or a followee, and a user being followed need not follow
back. A follower will receive all tweets sent by her followees. When a followee sends
or shares a tweet, this tweet will be distributed to all of her followers. A user can
also re-sends someone’s tweets by retweeting them (RT), so that her followers can
receive this tweet as well. A user can send a tweet to specific Twitter users by mentioning them in the tweet (adding “@” before the identifier address of the receivers).
This well-defined markup vocabulary combined with a strict limit of 140 characters
per tweet conveniences users with brevity in expression.
2.2
Unsafe Content
As mentioned in Section 2.1.1, two nodes in OSNs can reach each other by a small
number of hops or steps even through they are not neighbors. As a result, information can be propagated virally within social circles. OSNs have been exploited as
platforms for rapidly and efficiently disseminating unsafe content.
In this thesis, we use the term “unsafe” to refer to both “malicious” and “inappropriate”. “Malicious” content means the traditional harmful content such as malware
and spam. In addition, it also includes the content that are benign in technical
sense but malicious in other dimensions, such as the applications that misuse users’
personal information. “Inappropriateness” is not malicious by any objective measure, but it may be considered offensive by some certain social groups. Potentially
6
pornographic, defamatory, or abusive content belong to this category. We use the
term “content” to refer collectively to URLs, posts, applications, and any other information that can be propagated in OSNs. Next, we illustrate these three kinds of
content in detail.
URLs
Malicious code can be distributed rapidly through URLs. Attackers usually utilize
malicious URLs to perform the so called drive-by-download attacks [MSSV09a]. To
perform such attacks, attackers first need to inject the malicious client-side scripting
code into a compromised website or simply put them on a server under their control.
Such code targets a vulnerability in a web browser or in one of the browser’s plugins
and can be downloaded and executed when a victim visits the malicious web page.
Then the victim’s browser will be compromised if it is vulnerable.
Posts
Posts are common vehicles for the spread of malicious URLs in OSNs. Many people
using Facebook or Twitter have encountered posts that contain possibly malicious
URLs from their friends, whose account has been compromised. Such posts are
also called socware [RHMF12a]. Socware that appears on a Facebook user’s wall or
newsfeed usually contains two parts. First, a URL obfuscated with a URL shortening
service (e.g., Bitly8 and Google URL Shortener9 ) can lead to a landing webpage
that hosts either malicious or spam content. Second, a text message (e.g., “two free
iPads”) that entices users to click on the URL. Optionally, socware may contain a
thumbnail image that also leads to the landing page.
Similar with traditional malware, socware often aims at compromising the device
of the user or obtain users’ personal information. In addition, socware exhibits
malicious behaviors that are specific to OSNs [HRM+ 13], for example, luring users
to carry out tasks that help the attacker make profits, or forcing users to ‘Liking’
or ‘Sharing’ the post. Once a user likes or shares the post, the post is able to
propagate itself through the social circles of the user. Thus, the spreading cycle
continues with the friends of that user, who see the post in their newsfeed. As
socware can spread through OSNs at surprising speed, such kind of spreading is
referred to as a cascade [HRM+ 13].
Huang et al. [HRM+ 13] systematically study the socware cascades on Facebook
by analyzing 100K spam posts identified from over 3 million Facebook users’ walls.
8
9
https://bitly.com/
http://goo.gl/
7
First, their results show that socware cascades are quite prevalent, as more than
60% of the monitored users suffer from least one cascade. Second, they find that
users are with high probability to receive socware from their intimate friends. Third,
they find that over 44% of cascades are enabled by Facebook applications, and these
socware enabled Facebook applications form colluding groups. Finally, they identify
two dominant methods used by socware to entice users: (a) seducing users by social
curiosity (e.g., “Check if a friend has deleted you”), and (b) offering fake free or cool
products (e.g., “Click here to get a free iPad!”).
Apps
One reason for the popularity of OSNs is their third-party applications [RHMF12b].
which provide all kinds of services, such as utility, productivity, and even educatioal
applications. Among them, the most popular applications are games [NWV+ 12],
as approximately 230 million people play games on Facebook every month [Mar14].
Popular games such as “Candy Crush Saga” have more than 2.7 million daily active
users [Tec14].
In recent years, attackers have found Facebook applications to be an efficient platform for spreading malware and spam. There are many ways that attackers can
benefit from a malicious application: (a) advertising and phishing under a legitimate user’s name, (b) using social circles to infect more users so that they can let
large numbers of users see their spam posts, (c) using the application developers’
API to obtain users’ personal information such as email address, hometown, and
gender. There is motive and opportunity, and as a result, there are many malicious
applications spreading on Facebook every day [Hac14].
2.3
Automated Expert Systems
Automated expert system is a common method for detecting malicious content. In
this section, we study such systems for detecting malicious content.
Current detection schemes for malicious URLs can be divided into either static or
dynamic detection methods. Static approaches are based on static features, which
are the features that remain unchanged during a session, such as URL content, page
content and Javascript code [MSSV09b], [MG08], [MSSV09a], [CCVK11].
Ma et al. [MSSV09a] explore the use of machine learning methods to classify web
links based on lexical features (e.g., length of the URL, number of dots in the
URL) and host-based features (e.g., IP address, domain name and other data re-
8
turned by a WHOIS query [Dai04]). They evaluate their approach across 20,000
to 30,000 URLs drawn from different sources (benign URLs from DMOZ Open Directory Project10 and Yahoo’s directory11 , malicious URLs from PhishTank and
Spamscatter [AFSV07]), and show that it can obtain a prediction with 14.8% false
positive rate and 8.9% false negative rate. Canali et al. [CCVK11] propose a more
sophisticated static detection system called Prophiler, which also extracts features
from HTML content and JavaScript code to provide better performance (5.46% false
positive rate and 4.13% false negative rate).
However, static detection schemes cannot detect malicious URLs with dynamic content, where code is dynamically generated and executed. Examples of this include
obfuscated JavaScript, Flash, and ActiveX content. Therefore, dynamic detection
schemes are needed to detect the maliciousness of such content. A dynamic detection system uses an instrumented browser to visit web pages so that they can
obtain events (e.g., the instantiation of an ActiveX control or the retrieval of external resource) that occur during the interpretation of HTML elements and the
execution of JavaScript code [CKV10], [WBJR06], [TGM+ 11], [WRN10]. Dynamic
approaches can certainly provide more comprehensive detection than static ones, but
come with the cost of more computational overhead (around 2 minutes to analyze
a page [WBJR06]).
Apart from the static and dynamic detection methods, HTTP redirection chains,
which are the redirections users go through to reach their final destinations, can
also be utilized to detect malicious URLs [LK13], [LPL11]. Redirections are widely
used by attackers to make detection of malicious pages harder. By aggregating
the redirection chains from a group of users, Stringhini et al. build redirection
graphs, which show the paths for a number of users to reach a specific target web
page [SKV13]. Based on the features of the redirection graph (e.g., maximum chain
length, maximum number of edges where the IP address of the referer and referred
are in the same country), the authors are able to tell the malicious web pages from
the benign ones. No information about the content of the destination web page
is required in this approach. Moreover, the data is collected when users browse
the internet, without any additional computation, which improves the running time
of the detection algorithm. Their experiments show a result of 1.2% false positive
rate and 17% false negative rate. However, their approach suffers from several
limitations, one of which is that an attacker often redirects his victim to a popular
10
11
http://www.dmoz.org/
http://random.yahoo.com/bin/ryl/ [Accessed 24.04.2014]
9
and legitimate page after the attack, which will make the malicious links difficult to
be classified.
In addition to the detection schemes for malicious URLs, there are also several
schemes for detecting malicious posts. Gao et al. present an online spam filtering system which can be deployed as a component of the OSN platform [GCL+ 12].
It efficiently inspects the stream of user generated messages and immediately drops
those classified as spam before they appear on a user’s wall or newsfeed. A new message is classified based on all the previously observed messages. Their technique can
only be used by OSN providers. However, there are also some techniques that can
be implemented by third parties. [ANCA11], [WIP11], [RHMF12a]. Rahman et al.
present the design and implementation of a Facebook application, MyPageKeeper,
that can detect socware for its subscribing users [RHMF12a]. Their socware classifier only depends on the social context associated with each post (e.g., the number
of walls and newsfeeds where the post appears, and the similarity of text descriptions), which maximizes its speed of classification. Their experiments show a result
of 0.005% false positive rate, 5% false negative rate and an average of 46 ms to
classify a post [RHMF12a].
Compared with research on detecting malicious links and posts, there is limited existing research on OSN applications specifically. Rahman et al. implement FRAppE
(Facebook’s Rigorous Application Evaluator) to identify malicious applications either using only features that can be obtained on-demand (e.g., the permissions
required by the applications and the posts in the application’s profile page), or
using both on-demand and aggregation-based information (e.g., the posting behaviors of application and the similarity of its name to names of other applications) [RHMF12b]. FRAppE Lite, which only uses information available on-demand,
can identify malicious applications with 0.1% false positives rate and 4.4% false negatives rate. By adding aggregation-based information, FRAppE can detect malicious
applications with no false positives and 4.1% false negatives rate [RHMF12b].
2.4
Social Navigation
The concept of social navigation was introduced by Dourish and Chalmers [DC94].
There are two parties involved in social navigation. One is the navigator, which is
the person seeking navigational advice. The other is the advice provider, which is
the person or artificial agent providing navigational advice to a navigator. In a social
navigation system, a navigator makes decisions based on the actions of one or more
10
advice providers [Sve03]. The actions can be direct advice from an advice provider,
aggregated advice from a crowd of people, or aggregated usage information.
Social navigation has been explored in both research and commercial systems in a
variety of ways. It was believed that many digital information systems would be
improved to a large extent if their designers considered how one user within the
system could help another [DDH+ 00]. Currently, the most common and prominent
social navigation application is recommender systems [JZK08], which help people
make decisions by looking at what other people have done. A recommender system
can suggest a piece of information to a user based on the fact that other users find
that information valuable. A typical example is information provided by Amazon12 :
“people who bought this book also bought...”.
DiGioia and Dourish et al. point out three approaches to use social navigation in
a security context. First, users’ interaction history (e.g., paths followed, objects
used) is important information for security. Second, patterns of conventional use
and deviations from them can be showed based on social navigation. Third, for
systems in which objects are in some sense shared, those objects can be used to
display other users’ activity history [DD05a].
Besmer et al. [BWL10] create a “Social Navigational Prototype”, which is an application container, to conduct an experiment that determines the impact that a
social navigation cue had on application access control policies set by users. In their
experiment, 408 participants were asked to use the application container to review
seven random applications and make decisions about sharing data items with those
applications. The results show that participants would like to follow the behaviors
of the majority. The authors conclude that the navigation cue has an impact on
users’ decision making.
In Sections 2.5 - 2.7, we describe how to leverage the idea of social navigation to
security by introducing three prominent types of social navigation systems.
2.5
History Systems
History systems aim to augment information with traces about the previous interactions on that information. These traces are called interaction history [HHWM92],
which is the records of the interactions between people and objects. If a person gets
lost in the woods and comes upon a trail, it is a good idea to follow that trail. If
12
http://www.amazon.com/
11
a borrowed book has a lot of margin notes, underlines, and easily open pages, it
implies that this book is popular, and thus likely to be worth reading. Wexelblat
and Maes have built a series of tools based on interaction history and conducted a
user study which involved a controlled browsing task [WM99]. Their results show
that interaction history can help users get the same work done with significantly less
effort, and is especially helpful for users who have some familiarity with the type of
problem.
A typical example of a history system is proposed by Maglio and Barrett [MB00]
based on IBM’s WBI toolkit13 . It provides a direct way for people to reach their
destination on the web. For example, Alice might not remember the URL of Bob’s
home page, but Alice knows she can get there from her own home page by looking
for “Bob” in her friend list. If she follows these steps repeatedly, the history system
will insert a link to Bob’s home page at the top of her home page. This system
creates a personalized page for Alice, based on her own browsing history.
The idea of history systems can also be leveraged to security. DiGioia and Dourish
et al. [DD05b] show some examples that illustrate how to help users make proper
decisions based on the history of other user’s actions. One interesting example is
that they found users on Kazaa14 usually find it difficult to determine which files
on their hard drive should be made available for sharing to others. They designed
a system that uses folder icons to exhibit how frequently those folders have been
shared by other users. Specifically, the more “open” a folder appears, the more
commonly it is shared by other Kazaa users. So a user can get an idea of how many
users have shared a folder by looking at how “open” that folder appears, thus make
a proper decision on whether to share that folder.
Users’ interaction history can also be utilized to analyze their preferences, which can
help a malware detection system deal with inappropriate content. Unfortunately,
there is no such system yet.
2.6
Crowdsourcing
Crowdsourcing is a distributed problem-solving model which has become increasingly
popular in recent years. In this section, we discuss the notion of crowdsourcing
together with its advantages and disadvantages. We also illustrate how to leverage
13
14
http://www-01.ibm.com/software/integration/wbisf/features/ [Accessed 18.05.2014]
http://www.kazaa.com/
12
crowdsourcing in malicious content detection.
The name crowdsourcing first appeared in Wired Magazine in June 2006 in an article
by Jeff Howe who defines it as “the act of taking a job traditionally performed by a
designated agent (usually an employee) and outsourcing it to an undefined, generally
large group of people in the form of an open call” [How06].
2.6.1
Advantages and Challenges of Crowdsourcing
Crowdsourcing has several natural advantages [Che12]. We will briefly explore them
below.
First, the potential size of the crowd is much larger than any traditional companies.
For example, YouTube has gathered more than one million creators from over 30
countries around the world [You14] since it was established in 2007. It is hard to
imagine how the same can be achieved by employees of a single company.
Second, the crowd has more advantages in diversity than any company. In some
situations, the power of a diverse group may outperform a group of experts in solving
problems that belong to a certain realm. A successful example is InnoCentive15 ,
which is a company crowdsourcing innovation problems to people around the world.
Lakhani et al. [LJLP07] do a survey by posting 166 challenging problems that
even large corporate R&Ds have trouble with. About 30% of them were solved
by InnoCentive. They also find that participants had a higher chance of solving
problems in fields where they have little expertise [LJLP07].
The third advantage is the relatively low cost. For some tasks that have no strict
requirements on quality, amateurs’ work may be enough, and the cost is reduced
drastically.
Even through crowdsourcing offers so many benefits, it also faces some challenges
that limit its wide deployment.
The first challenge is incentive issues. Companies need to find ways to encourage
the crowd to help out in return for no or relatively low monetary rewards. Some
companies achieve this by building a community, where people in the crowd can
obtain attention and appreciation. For example, Stackoverflow16 is a question and
answer site, where a user can obtain higher reputation if he provides more correct
answers.
15
16
https://www.innocentive.com/
http://stackoverflow.com/
13
The second challenge is that crowdsourcing often suffers from time lag, since it
needs to outsource a task to a large group of people and wait until enough responses
have been returned. If a company wants to outsource a task which is urgent and
requires a huge amount of human resources, there is a risk in outsourcing it to the
crowd, because no one can guarantee that the size of the crowd will be large enough
in a certain period. In contrast, assigning this task to employees or a specialized
company is likely to have more predictable and timely results.
The third challenge is that crowdsourcing suffers from so called Sybil attacks, which
work by creating many pseudonymous entities to influence the results of collaborative activities. For instance, an attacker can generate a large number of accounts in
a recommender system to boost his own product. Without a central identification
server, a Sybil attack is always feasible [Dou02].
2.6.2
Crowdsourcing and Security
In Section 2.3, we introduced some automated expert systems that are based on
machine learning algorithms. The main challenge for such systems is that purely
technical approaches have limited effects due to the lack of large datasets for all
threats. In addition, technical approaches are weak in detecting websites that are
benign in technical sense but malicious in other dimensions. For example, the owners
of some websites misuse users’ personal information, and there are also some socially
questionable sites such as illegal online pharmacies. These limitations have prompted
alternative approaches, and crowdsourcing has been viewed as a good candidate for
web security.
An example service that leverages crowdsourcing to detect malicious links is Web
of Trust (WOT), which is a reputation system that collects users’ inputs into aggregated ratings for different links. It includes a browser extension and a website17
with a number of online community features such as a personal page per registered
user, a wiki as well as some discussion forums.
WOT provides a platform on which users can rate a website in two dimensions:
trustworthiness and child-safety. The aggregated ratings range from very poor (019), poor (20-39), unsatisfactory (40-59) to good (60-79) and excellent (80-100).
WOT signals the ratings of URLs through the browser extension using colored rings
(red for ‘bad’, yellow for ‘caution’, green for ‘good’, grey for ‘unknown’). Figure 2
17
http://mywot.com/
14
shows an example.
Figure 2: URLs that have been tagged by WOT.
Figure 3: The popup window of WOT.
By default, the rings are displayed based on the trustworthiness ratings which describe whether a site can be trusted and is safe to use (i.e., does not have malicious
content). When a user moves her mouse cursor over the ring, the browser extension
will pop up a window to show more information. Figure 3 shows an example of the
popup window. The humanoid figures next to the ring show the confidence levels
of the ratings. The confidence level is computed based on both the number of ratings and the reliability scores of the contributors. WOT weighs the input ratings
differently based on the reliability of individual contributors [WOT14].
15
If a user clicks on a link whose aggregated rating is below the rating threshold and
the confidence level is above the confidence threshold, WOT shows a large warning
dialog to the user. The thresholds are determined by WOT. Figure 4 shows the
warning dialog. The settings for showing the warning dialogs can be configured to
suit the needs of different users.
Figure 4: The warning dialog of WOT.
In addition to numerical ratings, users can also provide textual comments on a site.
Comments do not count into the aggregate ratings, but they act as reasons for users’
ratings. The comments are publicly accessible and can be found on the scorecard
of each evaluated site, which is a uniquely reserved page on mywot.com that shows
the aggregate ratings and user comments given to the site.
WOT ranks the community members as well, starting from rookie, bronze, silver,
gold to the platinum level. The ranking is done based on the activity score which
is computed from the total ratings and comments a member has contributed. Platinum members are given the privilege to use a mass rating tool which allows them
to evaluate (at maximum) 100 sites at the same time. This is also an incentive
mechanisms.
In addition to ratings and comments, WOT also factors in inputs given by trusted
third parties. For example, it receives blacklists of antivirus sits such as PhishTank18 ,
SpamCop19 and LegitScript20 . Inputs from trusted third parties play an important
18
http://www.phishtank.com/
http://www.spamcop.net/
20
http://www.legitscript.com/
19
16
role in improving the coverage and timeliness of WOT in responding to new malicious
sites created by attackers daily. However, the trusted third parties’ blacklists also
have time lag.
As WOT is a crowdsourced system, it suffers from the challenges of crowdsourcing.
In particular it suffers from the time lag problem: a new site will have no ratings
(indicated by a grey ring) until enough users have rated it. We will introduce an
approach to address the time lag problem in Section 4.
2.7
Groupsourcing
Groupsourcing models the delegation of trust to individuals who are in the same
social group. An example from the physical world can be used to illustrate the
difference between crowdsourcing and groupsourcing: when you want to choose a
restaurant in a street, you may consider the one with more customers. This is
crowdsourcing. You may also consult your friends who often come to dinner in this
street. This is groupsourcing.
2.7.1
Effective Flow of Information
After observing the process of decision-making during an election campaign, Lazarsfeld et al. have found that information does not flow from the mass media directly
to the public [LBG44]. Instead, it first reaches “opinion leaders” who pass on what
they read and hear to their associates. From that point forward, several studies
have been conducted to examine this hypothesis and to build conclusions upon it.
These studies include interpersonal influences and communication behaviors in Rovere [Mer48], decision-making in marketing, fashions and movie-going [KL70], and
public affairs and the drug study of the way in which doctors make decisions to
adopt new drugs [MK55].
Katz gives a summary on the results of the above studies, which provides theoretical foundations for groupsourcing [Kat57]. First of all, he finds that interpersonal
influence on decision-making is more effective than any of the mass media in all the
areas mentioned above. This implies that people tend to trust feedback from the
social groups. The second result corresponds with homophily of social networks. In
the election campaign studies, political opinions among family members, co-workers
and friends were found to be very homogeneous. This was also observed in the
drug study, which shows that doctors are likely to prescribe the same drug as their
17
colleagues. This implies that people in the same social group are likely to share opinions. The third result is that opinion leaders are located in almost equal proportions
in every social group. This even distribution ensures that an piece of information
will propagate to every group as long as the opinion leaders receive this information
and they are active.
2.7.2
Advantages and Challenges of Groupsourcing
In addition to the theoretical foundations laid out in the previous section, groupsourcing also has some other advantages related to trust, time lag, traceability and
incentives.
The first advantage is that individuals in the same social group tend to trust each
other. Although the total quantity of information is much smaller compared with
crowdsourcing, groupsourced feedback are from individuals that are trusted in a
social sense. That is to say, social networks are unlikely to contain malicious nodes,
because users within each community have less benefit and motivation for dishonest
behaviors, and they generally refrain from consciously inviting potentially malicious
actors into their personal groups. Furthermore, users are able to decide whether to
trust a a friend based on their offline relationship. In addition, groupsourcing are
less vulnerable to Sybil attacks. Creating arbitrary Sybils does not help an attacker
trying to compromise a groupsourced system. Instead they will need to resort to
compromise a trusted user’s account, or creating a fake account that looks like a
trusted user’s account.
The second advantage is that groupsourcing has an inherently smaller time lag than
crowdsourcing, as a summary can be produced without waiting for multiple users’
feedback. For example, one trusted friend’s opinion is enough for discouraging a
user from clicking a link. On the other hand, trusted friends may not have seen the
link yet when a user needs to decide whether to click on it or not; so delay is not
eliminated in all cases.
The third advantage is the visibility and traceability or groupsourced feedback.
Users are able to draw a conclusion by themselves based on the ratings and reasons
given by individuals within the same social group. They are also able to re-evaluate
the competence and honesty of friends and experts that they have formerly believed
in if they seem to make bad recommendations. This is an effective way to address
potential Sybil attacks.
18
The fourth advantage is the inherent incentives, since people are more willing to
help and share information with other people who are in the same social group with
them.
However, groupsourcing faces its own challenges as well. First, there is a larger
impact of wrongly trusting a friend. The consequence of a wrong rating may go
beyond technical effects in groupsourcing. For instance, the friendship may also be
affected even if a wrong rating was provided unintentionally. The second challenge is
uneven distribution of experts. Even through opinion leaders can be found in every
social group, security experts may not be present in all communities. Although a
user could rely on experts outside his social circles, finding and deciding to follow an
expert in a secure manner is difficult. The third disadvantage is that groupsourcing
is vulnerable to “time-bomb” attacks, where malicious behaviors are configured to
happen after a predetermined period of time.
2.7.3
Groupsourcing and Security
Dourish et al. have examined how people experience security as a facet of their daily
life [DGDdlFJ04]. One of their findings is that people tend to delegate responsibility
of security to four different modalities: technologies (e.g., SSL encryption for data
connections), individuals (e.g., colleague, family member, or roommate), organizations (e.g., technical support group) and institutions (e.g., bank). Groupsourcing
models the delegation of trust to individuals who are in the same social group. It
takes advantage of a user’s social circles (like social contacts, or expert groups) to
“groupsource” information about unsafe content.
Chia et al. [CHA12] conducted an online survey to evaluate the potential power of
social groups in providing relevant and helpful warnings for malicious applications.
The results show that social groups are important sources for risk signals, as 65%
of the subjects thought the first-hand experience by friends and family members as
important. Another interesting result of their survey is that 62% of the subjects
claimed that they tend to inform their friends or family members when they know
about digital risks.
Chia et al. also derive a set of design guidelines for a trustworthy software installation process, one of which is to “incorporate mechanisms to gather and utilize
feedbacks from user’s personalized community” [CHA12]. Based on these guidelines,
they have built a prototype system consists of two main components: (a) a software
19
repository, which maintains a software catalog together with a list of applications
available for installation; (b) a Rendezvous server, which issues identity certificates
and manages the user database, social graph and application reviews. This architecture separate the social rating from the rating targets, and can be reused for
different targets. Based on this prototype, they have conducted a user study, which
shows that opinions of friends have higher impact on user’s decisions than those
expressed by general online community [CHA12].
Following the work of Chia et al. [CHA12], we also implemented a groupsourced
system based on Rendezvous server to indentify unsafe content on Facebook. We
introduce this system in Section 5.
2.8
Statistical Tools
In the following sections, we briefly describe some statistical tools used in this thesis.
Cumulative Distribution Function
Cumulative distribution function (CDF) describes the probability that a random
variable less than or equal to a certain value. A formal definition is given in Equation 1, where the right-hand side represents the probability that the random variable
X takes a value that is less than or equal to x [ZK99].
FX (x) = p(X ≤ x)
(1)
Empirical cumulative distribution function (ECDF) is a CDF associated with the
empirical measure of the samples [VdV00]. Let (x1 , ..., xn ) be independent and
identically distributed (i.i.d) random variables with the common cdf F (x). Then
ECDF is defined as:
Fn (x) =
number of elements in the sample ≤ x
n
(2)
Normality Test
In probability theory, normal distribution is an important concept as many statistical
tests require the sampling data to be normally distributed. “A normal distribution
in a variate X with mean µ and variance σ 2 is a distribution with probability density
20
function as given in Equation 3 on the domain x ∈ (-∞, ∞)” [Kri10]. A normal
distribution is called standard normal distribution when µ = 0 and σ = 1 [Kri10].
Any normal distribution can be transformed to a standard normal distribution by
.
changing each variable to (x−µ)
σ
1
2
2
P (x) = √ e−(x−µ) /(2σ )
σ 2π
(3)
According to the central limit theorem [Rei05], a sampling distribution can be assumed to be normal when a sample data is tested to be approximately normal. So
in order to conduct a statistical test that requires the sampling distribution to be
normal, a normality test for sample data has to be conducted first.
Kolmogorov-Smirnov test is a method for testing if a sample data follow a specific
distribution [CL67], and can be used for normality test. The Kolmogorov-Smirnov
test statistic is defined in Equation 4 [CL67], where F is a CDF of a normal distribution. A significance (p-value), which is used to determine if a result is statistically
significant, can be obtained from a Kolmogorov-Smirnov table21 with D (test statistic) and n (sample size). If the p-value is lower than the alpha level that is set ahead
of time (usually 0.05), we can claim that the sample distribution is significantly
different from normal distribution.
D = max (F (Yi ) −
1≤i≤n
i−1 i
, − F (Yi ))
n n
(4)
Difference Test
In statistics, researchers are often interested in finding mean differences between different populations. They usually design experiments, in which they expose subjects
to different experimental conditions, and then compare the differences of different
groups of results. There are mainly two kinds of difference tests. The first one
is called independent test which is for between-subject experiments where different
subjects participate in different experimental conditions. The second one is called
dependent test which is for within-subjects experiments where the same subjects participate in different experimental conditions. We only use dependent tests in this
thesis.
The dependent t-test is a common method to test the mean difference between two
21
http://onlinelibrary.wiley.com/doi/10.1002/9781119961260.app3/pdf [Accessed 18.05.2014]
21
samples that are matched or “paired”, when both samples follow normal distribution.
The differences between all pairs must be calculated first. Then, we can calculate
¯ D is the average and sD is the
the t-value following Equation 5 [Sei77], where X
standard deviation of those differences. Once the t-value is determined, we can find
the p-value from the t-table22 with the degree of freedom as n -1. If the p-value is
lower than the alpha level, we can claim that there is a significant difference between
two populations.
t=
¯ D − µ0
X
√
sD / n
(5)
When the populations cannot be assumed to be normally distributed, the Wilcoxon
signed-rank test can be used to replace the dependent t-test [Sie56]. Friedman’s
ANOVA test is for the situations that populations cannot be assumed as normally
distributed as well, and it can be used to detect differences for more than two
dependent samples [Fri40].
Correlation Test
Correlation shows whether and how strongly pairs of variables vary together in the
same or opposite direction. Pearson’s correlation coefficient is a measure of the
linear correlation between two underlying variables X and Y . Given two samples,
we can obtain Pearson’s correlation coefficient r by Equation 6 [Gal86]. The result
is between +1 and -1 inclusive, where 1 means total positive correlation, 0 means
no correlation, and -1 means total negative correlation.
Pn
r = pPn
i=1
¯ i − Y¯ )
− X)(Y
pPn
¯ 2
(Xi − X)
(Yi − Y¯ )2
i=1 (Xi
(6)
i=1
If the underlying variables have a bivariate normal distribution [Ste81], we can calculate a t-value by Equation 7. With the t-value, we can obtain a p-value in the
same way explained before. If the p-value is lower than the alpha level, we can claim
that there is a significant relationship between the underlying variables.
r
t=r
22
n−2
1 − r2
http://www.sjsu.edu/faculty/gerstman/StatPrimer/t-table.pdf [Accessed 15.05.2014]
(7)
22
Machine Learning Algorithms
Machine learning refers to the “field of study that gives computers the ability to
learn without being explicitly programmed” [Sim13]. Machine learning algorithms
can be generally classified as supervised learning and unsupervised learning [ZL07].
The objective of a supervised learning algorithm is to generate a function that maps
an unseen input to an output, after being trained on a set of known inputs and
outputs. Unsupervised learning algorithms can directly operate on a set of unseen
inputs, and aim to discover the structure instead of mapping from inputs to outputs.
Classification is a supervised learning algorithm that can assign an input as one
of several classes [Alp04]. A typical classification algorithm is the support vector
machines (SVM) [CV95], which has been developed for binary classifications (i.e.,
whether a sample belongs to a class or not). After being trained by a set of examples
which are labelled as belonging to one of two classes, the SVM training algorithm often makes use of a radial basis function (RBF) kernel [Buh03] to build a probabilistic
binary classifier that assigns new examples into one class or the other.
3
Problem Statement
As introduced in Section 2, there are several kinds of rating systems to provide
warning signals for unsafe content. We can classify these kinds of rating systems
along two dimensions: whether their inputs are objective or subjective, and whether
they produce global or personalized output. An objective rating system calculates
the ratings based on objective features, while a subjective rating system gathers the
ratings based on people’s subjective opinions. A global output rating system always
outputs the same rating for everyone in the system, while a personalized system
enables a person to receive ratings based on his own situation or needs.
With these two dimensions, we can classify the rating systems according to Table 1.
Automated expert systems (e.g. Prophiler [CCVK11] and FRAppE [RHMF12b])
and history systems (e.g. PageRank23 ) are objective rating systems, because the former detect malicious content based on objective features and the latter apply users’
interaction history to produce personalized output. Both crowdsourced systems
and groupsourced systems generate ratings based on people’s subjective opinions,
so they are subjective rating systems. Automated expert systems and crowdsourced
23
http://checkpagerank.net/
23
systems output the same rating to all users, while the outputs of history systems or
groupsourced systems depend on the user’s own actions or social circles.
However, the classification is not strict, as many systems in real life belong to more
than one category. For example, an automated system needs to remove false positives with the help of subjective human experts. WOT24 is a crowdsourced system,
but it also uses potentially objective input from external blacklists.
Output
Input
Objective
Subjective
Global Output
Personalized
Automated Expert System
History System
Crowdsourced System
Groupsourced System
Table 1: Classification of rating systems.
Even though all these rating systems are aiming to provide signals to nudge users
away from unsafe content, there are still no convincing risk signals currently [CYA12].
Namely, the currently available signals about unsafe content are unreliable in indicating the privacy and security risks associated with that content. The main challenge
for global output systems is that they are unable to deal with inappropriate content, because different people have different opinions about inappropriateness. In
addition, crowdsourced systems suffer from time lag.
In this thesis, we ask:
1. Can the time lag problem in crowdsourcing be addressed by augmenting it
with techniques from automated expert systems?
2. (How) can we design a groupsourced system that both addresses the time lag
and signals inappropriate content?
We answer these two questions in Section 4 and Section 5 respectively.
4
Rating Prediction for Crowdsourcing
As mentioned in Section 3.4, one of the disadvantages of crowdsourcing is the time
lag problem, which means that the size of the crowd may not be large enough
within a certain period to produce results with sufficient confidence. This weak
24
http://mywot.com/
24
point has a particular effect on malware detection. For example, WOT requires time
to accumulate user ratings for a new link. During this time users who encounter
the link are potentially exposed to its malicious contents. This situation is serious
especially for some short-lived malicious links such as spams. WOT may not get
sufficient data to rate such a link during the short time when it is operational.
Obviously, the time lag issue can be mitigated if we can predict the rating in advance
with sufficient confidence. To achieve this, we applied a predictive model based on
machine learning techniques in automated expert systems to crowdsourcing. Specifically, we extracted various features of approximately 16,000 links and fetched ratings
of those links from WOT25 . Then we applied SVM to build a classifier with which
we can predict the rating level for a given link.
4.1
Datasets
To derive our detection models, we constructed two datasets, which contain links
with ratings in trustworthiness (TR) and child-safety (CS) respectively. The links
were gathered from WOT database and Alexa’s26 dataset as of January 1st, 2014.
The ratings were obtained from the WOT API, and labelled as one of with Excellent (E), good (G), unsatisfactory (U), poor (P) and very poor (VP) along each
of the two dimensions (TR and CS). The CS data set is a little smaller than TR
dataset, because there are some links have no ratings in child-safety. The datasets
are summarized in Table 2.
Dataset name
E
G
U
P
VP
Total
TR
5,452 2,449 2,889 2,394 3,281 16,465
CS
7,481 1,997
895
935
5,082 16,390
Table 2: The dataset used for our experiments.
In order to predict the rating level for a given link, we need to find a set of features
that are related to the ratings. The previous work introduced in Section 2.2, shows
that static features of a link (URL, HTML and Javascript code) can be utilized to
predict link ratings. So we extracted the same 77 features as Canali et al. [CCVK11]
for each link in the dataset. Then we performed a Pearson’s correlation test between
the features and ratings, which shows that 27 features are correlated to ratings. The
25
26
https://www.mywot.com/wiki/API/ [Accessed 24.04.2014]
http://www.alexa.com/topsites [Accessed 24.04.2014]
25
features are shown in Table 3.
HTML features
(1) number of inline script tags,
(2) number of characters, (3) number of hidden elements,
(4) number of included URLs, (5) number of iframe tags,
(6) presence of a meta tag, (7) percentage of Javascript code,
(8) number of script tags, (9) number of elements with small area,
(10) number of elements containing suspicious content
JavaScript features
(11) number of DOM modification functions,
(12) number of Javascript characters, (13) number of long strings,
(14) number of pieces of code resembling a deobfuscation routine,
(15) maximum length of the script’s strings,
(16) maximum entropy of all the script’s strings,
(17) probability of the script to contain shellcode,
(18) number of occurrences of the setTimeout()
and setInterval() functions,
(19) number of string direct assignments,
(20) number of suspicious objects,
(21) number of string modification functions,
(22) number of suspicious strings,
(23) number of event attachments,
(24) number of strings containing “iframe”,
(25) Number of suspicious tag strings
URL features
(26) number of corresponding IP addresses,
(27) TTL of the first IP address
Table 3: The extracted static features of a link [CCVK11].
In addition, we fetched the ratings of included URLs (we refer to them as included
ratings) for each link, since a malicious page may also contains some URLs with low
ratings. If we directly add those included ratings as features, there will be different
number of features for different links, as the number of included URLs in each page
is different. To address this issue, we first derived an ECDF for each link. Figure 5
shows an example of an ECDF for the included ratings [11 24 31 85 30 73 16 24 25 78
31 4 26 85 85 ] in a specific page of our dataset. The value on y-axis represents the
probability that the included ratings are less than or equal to the corresponding value
on x-axis. Then we estimated the values of the inversion of the ECDF at a fixed
set of 100 points, by means of a piecewise cubic hermite interpolating polynomial
26
(PCHIP) [Wik14a]. As a result, the included ratings are normalized to a common
range without destroying inherent structural dependencies [PHO11], [HKAP13].
Figure 5: ECDF for included ratings [11 24 31 85 30 73 16 24 25 78 31 4 26 85 85 ].
4.2
Classification
We utilize SVM to classify the links into five levels based on the features we extracted. As SVM is for binary classification and there are five classes in our scenario,
we have to reduce our single multiclass problem into multiple binary classification
problems. We adopted the one-versus-all strategy to build a multiclass classifier
based on five binary classifiers, one for each class [Tho12]. Each binary classifier is
trained by taking examples from one of the classes as positive and examples from
all other classes as negative. The final output is activated for the class whose binary
classifier gives the greatest probability value amongst all (winner-takes-all strategy).
A formal representation is shown in Equation 8, where yi is the predicted probability
for class i, based on the feature set f .
y = argmax {yi |f }
(8)
i=1..5
In order to make sure that our model is generalized to an independent data set, we
randomly partitioned the set of links into five folds so that we can use stratified 5fold cross-validation [K+ 95]. Namely, four folds were used to train the classifier and
the remaining fold was used for testing. In training mode, the model learns on the
features of links that are known to be in given levels from 1 to 5. In testing mode,
27
the established models are used to classify the unknown links to certain levels. This
process was repeated five times so that each fold served once as the test set.
4.3
Classification Performance
From each dataset, we recorded and concatenated the predicted results and the
actual results into two arrays. Based on the two arrays, we calculated a 5x5 confusion
matrix [Ste97], in which each column represents the instances in the predicted results,
while each row represents the instances in the actual results. Here the number on
the diagonal show the number of correct predictions, while others represent different
failed predictions. The confusion matrixes for trustworthiness and child-safety are
shown in Table 4 and Table 5. For example, 114 excellent (E) links were mistakenly
predicted as very poor (VP) in terms of trustworthiness.
Prediction
Ground
Truth
VP
P
U
G
E
VP
2,307
358
229
112
114
P
268
1,465
165
52
40
U
241
289
2,097
159
80
G
138
74
227
1,714
234
E
327
208
171
412
4,984
Table 4: Confusion matrix for trustworthiness.
Prediction
Ground
Truth
VP
P
U
G
E
VP
6,580
371
136
158
251
P
163
1,473
70
18
28
U
60
44
580
32
19
G
89
23
35
563
76
E
319
116
74
164
4,708
Table 5: Confusion matrix for child-safety.
Table 6 shows how to calculate the number of true positives (TP), true negatives
(TN), false positives (FP) and false negatives (FN), for binary classification, based
on the confusion matrix. We are able to transfer a confusion matrix for multiclass
classification to that for binary classification. For example, if we want to calculate
28
TP, TN, FP, FN for VP in Table 4, we can treat VP as positive and others as
negative, so that we can obtain Table 7. Confusion for other classes can be obtained
using the same approach.
Prediction
Ground
Truth
Positive Negative
Positive TP
FN
Negative FP
TN
Table 6: Table of Confusion for binary classification.
Prediction
Ground
Truth
VP
Others
VP
Others
2,307 974
813
10,260
Table 7: Binary classification confusion matrix for “very poor” in trustworthiness.
After this, we can calculate precision and recall [Pow11] with Equation 9. Precision
is the fraction of the number of positive records that predicted correctly to the
total number of positive records predicted, while recall is the fraction of the number
of positive records that predicted correctly to the total number of positive records
in ground truth. We take spam filter as an example to illustrate precession and
recall. Precision means “of all emails that have been filtered, how many are actually
spam?”. Recall means “of all the emails that are truly spam, how many have been
filtered?”. So a spam filter with high precision but low recall is conservative and
suitable for people who worry about intrusive filtering, but is ineffective in actually
filtering spam. On the contrary, a spam filter with low precision but high recall is
too aggressive in filtering spam.
precision =
TP
TP
, recall =
TP + FP
TP + FN
(9)
We use F-score, which is the harmonic mean of precision and recall defined in Equation 10 [vR86], as the primary standard to measure the overall classification performance. To overcome class imbalances within the test data, we follow a common
weighted averaging technique and compute the overall precision, recall and F-score
based on class distribution (i.e. how many links with a given rating the dataset
had). The precision, recall and F-score are shown in Table 8 and Table 9.
29
F-score = 2 ∗
precision ∗ recall
precision + recall
(10)
Distribution
Precision%
VP
3281
74.0
70.3
72.1
P
2394
73.6
61.2
66.8
U
2889
73.2
72.6
72.9
G
2449
71.8
70.0
70.9
E
5452
81.7
91.4
86.3
76.0
76.3
76.0
Weighted average
Recall% F-score%
Table 8: Result for trustworthiness.
Distribution
Precision%
VP
7211
87.8
91.2
89.5
P
2027
84.1
72.7
78.0
U
895
78.9
64.8
71.2
G
935
71.6
60.2
65.4
E
5082
87.5
92.6
90.0
85.8
86.1
85.8
Weighted average
Recall% F-score%
Table 9: Result for child-safety.
First, from Table 8 and Table 9, we see that we got similar values for weighted
averages of precision and recall. That is to say, our algorithm finds a balance between
conservatism and liberalism.
We also find that the classification performance for child-safety is better than trustworthiness (with weighted average F-score of 85.8% and 76.0% respectively). This
indicates that the rating levels of child-unsafe links are easier to predict as their web
pages contain more child-unsafe URLs.
Furthermore, the results in Table 9 show especially high F-scores in “very poor” and
“excellent” links. That is to say, our algorithm is stronger in predicting extreme
ratings in the dimension of child-safety: either very poor or excellent. To verify
this claim, we conducted an experiment in the “child-safety” dataset with only two
classes (links with “good” and “excellent” ratings are assigned to one class and those
with “unsatisfactory”, “poor” and “very poor” ratings are assigned to the other class).
The result shown in Table 10 supports our claim, as the weighted average F-score
30
is as high as 91.9%. We conducted the same experiment for the “trustworthiness”
dataset and got a high F-score as well. The result is shown in Table 11. The rating
prediction for good links is better then bad ones in trustworthiness. This need to
be improved, since users care more about the ratings for bad links.
Distribution
Precision%
Bad
9,238
92.7
93.1
92.9
Good
6,912
90.7
90.2
90.5
91.9
91.9
91.9
Weighted average
Recall% F-score%
Table 10: Result for binary classification of child-safety.
Distribution
Precision%
Bad
8,564
87.4
76.3
81.5
Good
7,901
88.3
94.2
91.2
88.0
88.0
87.8
Weighted average
Recall% F-score%
Table 11: Result for binary classification of trustworthiness.
Distribution
Precision%
VP
3281
34.5
38.6
36.4
P
2394
24.0
23.1
23.6
U
2889
31.9
31.1
31.5
G
2449
23.8
20.5
22.0
E
5452
54.8
56.0
55.4
37.7
38.1
37.8
Weighted average
Recall% F-score%
Table 12: Result for trustworthiness without included ratings.
To evaluate the effectiveness of the included ratings, we also conducted an experiment that only with features in Table 3. The result shows a significant reduction
in F-score (in Table 12 and Table 13). So taking included ratings as features into
malware classification, can be viewed as one of our contributions.
However, our approach suffers from the causative attacks [NKS06], in which attackers
are able to alter the training process through influence over the training data. For
example, an attacker can give low ratings to a set of benign links. After learning on
these links, our classifier will produce more false positives (predicting low ratings for
benign links). Similarly, an attacker can also make our classifier produce more false
31
Distribution
Precision%
VP
7211
62.1
72.1
66.8
P
2027
21.5
17.5
19.3
U
895
22.6
17.0
19.4
G
935
8.3
5.3
6.5
E
5082
55.4
52.9
54.1
49.6
52.3
50.7
Weighted average
Recall% F-score%
Table 13: Result for child-safety without included ratings.
negatives by giving high ratings to malicious links. Even through attackers are not
able to alter the training process, they can still passively circumvent our classifier
by exploiting blind spots that allow malicious links to be undetected [HJN+ 11].
In conclusion, the overall performance is good. Now we are able to answer the first
question proposed in Section 3: applying the techniques in automated systems to a
crowdsourced system can successfully address its time lag problem.
5
Development of a Groupsourced System
In order to utilize groupsourcing to identify unsafe content on Facebook, we implemented a groupsourced system called “Friend Application Rating” (FAR), which
allows savvy Facebook users to warn their friends about potentially unsafe content. We chose Facebook as the first target platform because it allows us to get
enough users to conduct user studies that can help to evaluate the effectiveness of
our approach. In this section, we will introduce FAR and our laboratory study.
5.1
System Architecture
Our FAR implementation includes three components. The first component is a
Facebook application for authenticating users via their Facebook accounts and for
retrieving users’ social circles from Facebook server. The second component is a
Firefox extension for gathering and showing ratings. It provides a UI that allows
users to rate content encountered on Facebook and also shows aggregated feedback
about such content. The third component is the Rendezvous server which hosts
the Facebook application and interfaces with the browser extension to receive user
ratings, aggregate them, and provide aggregated feedback to the extension.
32
The architecture of FAR is shown in Figure 6. It also describes the workflow of FAR.
When a user receives a response page from Facebook, the Firefox extension will
parse the page to get the displayed applications and links on the page, on condition
that the user has installed and authenticated FAR. Then the extension will send
the application names and URLs together with user’s identity to the Rendezvous
server, which will call the Facebook application get the friend list of this user. Next,
the Rendezvous server will calculate the ratings based on the rating information it
has stored and the friend list it just got, and send the ratings back to the extension
which will show them to the user.
Figure 6: The architecture of FAR.
5.1.1
Rendezvous Server
The Rendezvous server is a generic service for orchestrating community ratings.
Although the current implementation uses Facebook as the means to define social
groups, and URLs, Facebook posts, and Facebook applications as targets being
rated, it is generic enough to support other OSNs, and other types of targets (e.g.,
mobile applications, browser extensions). It can also independently serve as a rendezvous point where users could follow a friend or an expert, check and give ratings
directly. The Rendezvous server has been implemented based on Rails27 framework.
As a result, it strictly follows Model-View-Controller (MVC) pattern [Wik14b].
27
http://rubyonrails.org/
33
Models
Models represent the data of an application and the rules to manipulate the data.
In the case of Rails, models are primarily used for managing the rules of interaction
with a corresponding database table. In most cases, each model in the application
corresponds to a table in the database.
Figure 7: Database schema for the Rendezvous server.
The database schema of the Rendezvous server is shown in Figure 7. It includes
six tables, namely, users, network, followships, targets, ratings and authentications.
The corresponding models of the Rendezvous server are as follows:
• User : When a person registers as a user with his email address, an entry will
be inserted to the users table through this model. His personal information
(i.e., email, password, name and Facebook URI) will also be recorded in this
table.
• Network : This model represents the online social networks that currently supported by the Rendezvous server. They are maintained by the system administrator.
• Followship: This model enables users to follow friends and experts into their
personalized community and get ratings from their followed friends. When a
user chooses to follow another user, an entry will be inserted to the followships
34
table through this model. The table stores the follower’s ID as well as the
followee’s ID.
• Target: This model represents the applications or links being rated by the
users. When a user rates an application or link, an entry will be inserted to
the targets table through this model.
• Rating: When a user rates an application or a link, the rating will be recorded
in the ratings table through this model.
• Authentication: When a user authenticates to the Rendezvous server via an
OSN (e.g. Facebook), information on that network will be recorded in the
authentications table through this model.
Views and Controllers
Views represent the user interfaces of the application. In Rails, views are often
HTML files with embedded Ruby code that performs tasks related to the presentation of the data. Views provide data to the web browser or other tools that are
used to make requests from the application.
The following screenshots are captured from the user interface of the Rendezvous
server. Figure 8 shows the home page. Before using the whole system, users have to
register using an OSN account (e.g., by clicking the Facebook icon in the upper-right
corner). Users also have the possibility of registering themselves with a valid e-mail
address and a local password.
Figure 9 shows the “All Users” page, where a user can find other users who have
been registered. He can also view the detail information of a certain user by clicking
the “Show” button, and follow a certain user by clicking the “Follow” button. If two
users are friends in an OSN, they follow each other by default.
Figure 10 shows the “All Apps” page, where the user can find the applications and
links rated by other users. He can also view the rating details and give a rating by
clicking the “Review it” button.
Figure 11 shows the “All Networks” page, which lists all the online social networks
that the Rendezvous server supports currently. Currently, the Rendezvous server
only supports Facebook in addition to its own community.
Figure 12 shows the personal page of a user, which lists his personal information,
ratings and followships.
35
Figure 8: Home page of the Rendezvous server.
Figure 9: “All Users” page of the Rendezvous server.
36
Figure 10: “All Apps” page of the Rendezvous server.
Figure 11: “All Networks” page of the Rendezvous server.
37
Figure 12: “My page” page of the Rendezvous server.
Controllers provide the “glue” between models and views. In Rails, controllers are
responsible for processing incoming requests from the web browser, interrogating
the models for data, and passing that data on to the views for presentation. In the
Rendezvous server, each model has a corresponding controller to handle the data.
5.1.2
Facebook Application
The Facebook application acts as a controller on the Rendezvous server. It is responsible for authorizing users’ Facebook accounts and fetching users’ friend lists
from Facebook. Figure 13 shows the permission request windows when a user clicks
the Facebook icon mentioned in Section 5.1.1 to authorize his account.
When visited by a user via Facebook, the Facebook application gets the user’s
Facebook user ID28 and access token29 through OAuth. With these information,
the Facebook application is able to fetch this user’s friend list from Facebook server
through the Facebook Graph API30 .
28
https://developers.facebook.com/docs/graph-api/reference/user/ [Accessed 24.04.2014]
https://developers.facebook.com/docs/facebook-login/access-tokens/ [Accessed 24.04.2014]
30
https://developers.facebook.com/docs/graph-api/ [Accessed 24.04.2014]
29
38
Figure 13: Permission request windows.
In addition, the application also allows the user to specify whose ratings are included
in groupsourced feedback. Namely, through a canvas URL, it provides a page where
users can choose to follow/unfollow their friends. Users follow all their friends by
default. Friends are displayed by groups so that a user can follow/unfollow a certain
group. Figure 14 shows this page. By default, ratings from all Facebook friends are
included. If a user chooses to follow/unfollow a friend, the followship on Rendezvous
server will change correspondingly.
Figure 14: Application page.
39
5.1.3
Firefox Extension
The Firefox extension shows aggregated feedback about content encountered on
Facebook. It inserts a warning glyph to each post that contains a link (Figure 15)
or made by an application (Figure 16) on a user’s wall or newsfeed. If any negative
ratings exist, the colour of the glyph is red, which is a warning to the user. If all
ratings are positive, the colour of the glyph is green. Otherwise, it shows no colour.
Clicking on the glyph allows the user to see groupsourced feedback in detail and
aggregated crowdsourced feedback (Figure 17).
In addition, FAR also allows users to give their own ratings by clicking the “rate”
button next to the glyph (Figure 18). They can choose from a set of pre-defined tags
or add new textual tags to explain their rating. If they select the “post comment”
option, FAR will automatically post a comment after submitting the rating (Figure 19). This can help to warn people who are not yet using FAR and is a potential
method for growing usage of FAR virally.
If a user chooses to install an application, FAR will insert the rating window to the
permission request dialog (Figure 20). When a user browses through applications
on “App Center” page, FAR will insert the same rating window (Figure 21).
Figure 15: Rating for a link.
Figure 16: Rating for an application.
40
(a) Groupsourced feedback. (b) Crowdsourced feedback.
Figure 17: Two feedback types of FAR.
Figure 18: Rating a link.
Figure 19: A comment posted by FAR.
41
Figure 20: Rating window in permission request dialog.
Figure 21: Rating window in “App center”.
42
5.2
Laboratory Study
We conducted a laboratory study to verify the effectiveness of groupsourcing and
FAR on how users decide to click on web links on Facebook. We used a modified
version of FAR to facilitate testing. We describe the details in this section.
5.2.1
Methodology
Our study aimed to replicate a real-world scenario of users making decisions about
clicking on links with the assistance of FAR. In this laboratory study, we conducted
a within-subjects study with three independent variables and 20 participants. Each
participant was presented with 27 links divided randomly into three groups. Links in
each group were shown together with groupsourced rating (represents the feedback
from friends), centrally sourced rating (represents the feedback from both crowd and
experts) and no rating respectively. Then we calculated the click-through rate for
each link.
Participants
We recruited 20 participants drawn from local urban population by posting on Facebook, using a large (200 member) student/staff IRC channel and word of mouth.
Their ages ranged from below 18 to over 63 years old, with 11 in the middle range
(23-32). The gender distribution was even (11 female, 9 male). Four participants
had at most high school education, while 16 had tertiary education. Seven participants were students in computer science and the rest had other backgrounds.
Two of the participants were international and were interviewed in English, and the
remaining 18 spoke Finnish. Roughly half were primarily Windows users, one Mac
user and others are Linux users. All had used Facebook before, and 18 participants
used it daily. Participants received either a 20-euro gift certificate or 2 movie tickets
based on their choices.
Conditions and Task design
We created a Facebook Page31 with 27 links (18 ‘safe’ and 9 “unsafe”) on it. The page
is shown in Figure 22. The “safe” links were randomly selected from links that were
rated as good by WOT. The ‘unsafe’ links were created by ourselves to represent
four different behavior types commonly exploited by malicious posts, as categorized
31
https://www.facebook.com/pages/The-FAR-user-experiment/427413790710030/
24.04.2014]
[Accessed
43
by Huang et al. [HRM+ 13]. The types of “unsafe” links and their number are shown
in Table 14. The “unsafe” pages were made to resemble the look, feel and behavior
of real unsafe links (e.g., asking users to provide personal information or install a
browser extension) but with no actually harmful effects. Among all of these links, 6
safe and 3 unsafe links were left without a thumbnail. All links were shortened using
URL shorteners and displayed in a fixed order. It should be noted that Facebook
may adjust the visual order slightly.
Figure 22: Experiment page.
Types
Number
social-curiosity
2
free-stuff
4
combo-winning
2
psycho-curiosity
1
Table 14: Types of “unsafe” links
For a given participant and a given link, we randomly assigned one of three treatments: centrally sourced ratings (‘central’), groupsourced ratings (‘group’), and no
ratings (‘none’). Figure 23 shows an instance of the three treatments applied to one
link. The colour of the glyph indicates link safety (green is safe and red is unsafe).
Clicking the glyph shows a popup window with more information. “Dismiss” buttons
are displayed next to the links and they were used to explicitly record a decision
of not clicking a link. Participants used the “dismiss” button if they decided not to
click on a link (see the “Procedure” section).
44
In this experiment, link safety remained fixed for all treatments, but a participant
saw only one of three treatments for a given link, assigned randomly. We modified the FAR extension so that during the experiment, a participant saw only the
assigned treatment (specific to that <participant, link> combination) applied to
each of the 27 links. For every <participant, link> combination, The FAR extension recorded the assigned treatments, whether the participant clicked the glyph to
see more information, and whether the participants clicked the link or clicked the
“dismiss” button.
Figure 23: Three treatments (‘central’, ‘group’ or ‘none’) applied to one link.
In addition, we asked participants to name three friends whose opinions on web
links they trust most. Then we configured the system to show those names in
groupsourced feedback and instructed participants to imagine that the ratings came
from those friends. The configuration tool is shown in Figure 24. Participants logged
to this page via their Facebook accounts. Then the configuration tool displayed their
friend lists to let them choose three friends they trust most.
Participants were asked to decide, while thinking aloud, whether they would click
on the links in the postings, and indicate their decisions by either clicking on the
link (yes) or the “dismiss” button (no).
Measures
We used questionnaires, system logs from the FAR browser extension, and interviews
to compare the effectiveness of the three different types of treatments.
We first used Zhang’s Internet attitude questionnaire [Zha07] with 40 questions32 to
test a hypothesis that participants feeling less comfortable online might rely on their
friends more. We used a background questionnaire33 with sections about Facebook
usage and attitudes towards it to collect participant demographics, and a section
about participants’ privacy attitudes [TKD+ 09] to test a hypothesis that concern
for privacy could correlate with link-clicking behaviors.
32
33
https://docs.google.com/file/d/0B8tQH7FZ1mzaUjlwQ1BILVlDcUk/ [Accessed 15.05.2014]
https://docs.google.com/file/d/0B8tQH7FZ1mzaX1RzZ01wWllMRkk/ [Accessed 15.05.2014]
45
Figure 24: Configuration tool of the user study.
The primary quantitative measure in our experiments is the click-through rate (CTR).
X|
,
For a given scenario (e.g., hyperlinks with a certain treatment) X, CT RX = |clicked
|seenX |
where seenX is the set of hyperlinks seen by the participant in X and clickedX is
the subset of seenX that are actually clicked through by the participant.
At the end of the experiment, we conducted an interview with each participant to
ask them whether and how the extension feedback had influenced their decisions,
whether they had prior experience with unsafe content on Facebook and outside
it, and whether they were aware of factors making them act differently in the lab
environment as compared to their normal browsing behaviors.
Procedure
The participants were first asked to fill in the attitude questionnaires online before
we invited them over to our lab (17 cases) or visited them (3 cases). Meetings
were scheduled in whatever way seemed most convenient. 13 participants used their
personal computers and 7 participants used the computers in our laboratory. Before
the formal session, we asked each of them to read and sign a consent form which
did not include any specific reference to security to avoid priming the participants.
Due to the length of the task, we offered to take a break at any time during the
46
experiment. We aimed to encourage the same security behaviors as the participants
would usually exhibit.
We initially informed participants that the study was about how users decide to
click on web links. Our instructions to them were that they should decide whether
they wanted to click on links presented to them as if they were browsing normally.
We installed the modified FAR extension on their browsers and guided them browse
through its features. As a study configuration step, participants were asked to name
3 people whose judgement they trust most when it comes to technology, and in the
case of evaluating links. They were told that because the tool is based on friends’
ratings, we would try to help them imagine that the ratings come from their friends
by showing their friends’ names in the FAR user interface.
The participants had a short training session where they browsed through a set
of sample links34 we had posted in a similar setting as the experiment (18 safe, 2
unsafe), without any artifacts added by FAR except for the “dismiss” buttons. In
order to demonstrate the think-aloud method, we commented on the first three links
as examples and showed how to simulate a link to be clicked or dismissed. Then
the participants were asked to go through all the links on the page, clicking on the
ones they found interesting and thinking out loud about their reasons. During this
round, we occasionally queried for justifications to remind the participants to keep
thinking out loud if needed.
Then the participants were sent to the experiment page of 27 links and asked to go
through them one at a time: “I would like you to pretend that this is a friend of
yours with similar interests. You are browsing Facebook in no hurry, with nothing
better to do, and notice the friend has posted some links since the last time you
visited this page.” This time, the additional “dismiss” button would also provide
feedback for whether a link was processed, by changing into “clicked” or “dismissed”.
This meant that unlike on the first run, participants did not dismiss any links by
accidental omission; the experimenter guided the participant back to any missed
links.
At the end of the experiment we gave them a background questionnaire followed
by the interview. The experiment lasted approximately 90 minutes. At the end,
participants were told the real nature of the experiment and that none of the links
were malicious. They were given the options of withdrawing their data from the
study.
34
https://www.facebook.com/pages/FAR-demo-page/208929655936933/ [Accessed 24.04.2014]
47
5.2.2
Result and Analysis
In this section, we introduce and analyze the results we got from the logging, questionnaires and interviews.
Analysis of CTRs
Table 15 shows the data we got from logging the participants’ actions. Each row represents a scenario and each column represents a participant. So the number in each
cell represents the click-through rate (CTR) of a participant in a certain scenario.
When we calculated the CTRs of links with either ‘group’ or ‘central’ treatments,
we only included the links whose glyphs were really clicked by the participants. But
when we calculated the CTRs of unsafe links that had glyphs of either kind, we
didn’t consider whether the glyphs had been clicked. We used an alpha level of 0.05
for all statistical tests.
participant1 participant2 participant3 participant4 ...
CTR_safe_g%
100
50
100
60
...
CTR_safe_c%
0
40
75
33
...
CTR_safe_n%
50
50
50
17
...
CTR_unsafe%
11
67
22
11
...
CTR_unsafe_g%
0
50
0
0
...
CTR_unsafe_c%
0
50
0
0
...
CTR_unsafe_n%
0
100
67
0
...
50
0
17
...
CTR_unsafe_glygh% 17
CTR_safe_g: CTRs of all safe links that with group treatments.
CTR_safe_c: CTRs of all safe links that with central treatments.
CTR_safe_n: CTRs of all safe links that with no treatment.
CTR_unsafe: CTRs of all unsafe links in general.
CTR_unsafe_g: CTRs of all unsafe links that with group treatments.
CTR_unsafe_c: CTRs of all unsafe links that with central treatments.
CTR_unsafe_n: CTRs of all unsafe links that with no treatment.
CTR_unsafe_glyph: CTRs of all unsafe links that with glyphs.
Table 15: CTRs for a subset of the participants.
We first conducted a Kolmogorov-Smirnov normality test to see whether the CTRs
follow a normal distribution. The results shown in Table 16 indicate that only CTRs
of safe links with no treatment (D(20) = 0.136, p > 0.05) are normally distributed,
while others are not.
Based on the results of the normality test, we first conducted a Wilcoxon Signed
48
Statistic
df
Significance
CTR_safe_g
0.332
20 0.000
CTR_safe_c
0.200
20 0.035
CTR_safe_n
0.136
20 0.200
CTR_unsafe
0.377
20 0.000
CTR_unsafe_g
0.520
20 0.000
CTR_unsafe_c
0.538
20 0.000
CTR_unsafe_n
0.390
20 0.000
CTR_unsafe_glygh
0.336
20 0.000
Table 16: Results of Kolmogorov-Smirnov Normality test.
Ranks Test to see if there are differences between CTRs of unsafe links with different
treatments. The result in Table 17 shows that the CTRs of unsafe links with group
treatments are significantly lower than those with no treatment (Z = -2.214, p =
0.027), which indicates that groupsourcing is effective in discouraging users from
clicking unsafe links. The result in Table 18 shows that CTRs of unsafe links with
central treatments are also significantly lower than those with no treatment (Z =
-2.388, p = 0.017). This indicates that central treatment has an influence on users’
decisions as well.
CTR_unsafe_n - CTR_unsafe_g
z
-2.214
Significance (2-tailed)
0.027
Table 17: Unsafe links with group treatment and unsafe links with no treatment.
CTR_unsafe_n - CTR_unsafe_c
z
-2.388
Significance (2-tailed)
0.017
Table 18: Unsafe links with central treatment and unsafe links with no treatment.
The result in Table 19 shows that there is no significant difference in CTRs between
group treatment and central treatment (Z = -1.00, p = 0.317). This means our
study did not reveal a difference in their effectiveness.
The result in Table 20 shows that overall CTRs in the presence of a red glyph (either
treatment) were lower than when there was no glyph (no treatment) (Z = -1.965, p
= 0.049). This result indicates that passive warnings are effective.
49
CTR_unsafe_g - CTR_unsafe_c
z
-1.000
Significance (2-tailed)
0.317
Table 19: Unsafe links with group treatment and unsafe links with central treatment.
CTR_unsafe_n - CTR_unsafe_glyph
z
-1.965
Significance (2-tailed)
0.049
Table 20: Unsafe links with red glyphs and unsafe links with no glyph.
In order to see if the treatments have an influence on the CTRs of safe links, we
conduced a Friedman’s ANOVA test on CTRs for safe links with group treatments,
central treatments or no treatments. The result in Table 21 shows that no significant
difference was observed (x2 (2) = 0.471, p = 0.79), indicating that positive feedback
from either social group or central source cannot by itself motivate people to click on
links. The interviews support this: participants considered the red warning signal
more valuable than the green positive one.
N
20
Chi-Square
0.471
df
2
Significance
0.790
Table 21: Safe links with group treatment, central treatment and no treatment.
In addition, we conducted Pearson’s correlation tests between CTRs of unsafe links
and either the privacy scores or the Internet attitude scores as measured by the
respective questionnaires. The results are shown in Table 22 and Table 23. There
was no significant relationship between CTRs of unsafe links with either the privacy
scores (r = -0.074, p > 0.05) or the Internet attitude scores (r = -0.206, p > 0.05).
In conclusion, our warning signals (both groupsourced and centrally sourced) are
effective in discouraging users away from clicking unsafe links, while the results on
their differences were inconclusive. On the hand, positive feedback cannot promote
users clicking benign links.
50
ctr_unsafe: Pearson Correlation
Significance
N
privacy: Pearson Correlation
Significance
N
ctr_unsafe
privacy
1
-0.074
0.756
20
20
-0.074
0.756
20
1
20
Table 22: Correlation test between CTRs of unsafe links and privacy scores.
ctr_unsafe attitude
ctr_unsafe: Pearson Correlation
Significance
N
attitude: Pearson Correlation
Significance
N
1
20
-0.206
0.383
20
-0.206
0.383
20
1
20
Table 23: Correlation test between CTRs of unsafe links and attitude scores.
Results of the interviews
The interviews further indicate that our work is promising, as most participants
found the additional information besides the links can help them make decisions,
especially on links that are somewhat suspect but not obviously bad. Some of
them indicated that they need to learn over time to decide whether to trust the
ratings provided by the system, particularly the centralized ratings are came from
a previously unknown source. This is consistent with real life.
From the interviews, we also learned that the primary threat participants associated
with Facebook was spam, as 15 participants expressed concerns about receiving, being tricked by unintentionally spreading spam or misleading advertisements. For
comparison, virus infections were only a concern for four participants and phishing
was explicitly mentioned by five participants, while six participants found Facebook
not entirely trustworthy as a platform for information sharing in general: applications and external services could post as their friends, and the friends could be
tricked or coaxed into sharing something, such as a scam link. In addition, Facebook itself makes advertisements appearing as “recommended postings” within users’
newsfeeds.
51
Only three participants told us they had experiences with offensive content, all
related to their religions. Most participants indicate that they had experiences with
mildly disturbing or annoying content. However, unlike other threats, participants
considered themselves particularly responsible for “personal stupidity” for following
a link even though they expected to be bothered by the result. The potential
offensiveness was deduced for example from the poster’s habits or the website (such
as tabloids discussion of a sensitive topic). These results are likely to be affected by
the demography of the respondents.
Limitations
Laboratory studies have well-known limitations concerning external validity [MWI+ 07].
In our case, forcing participants to make explicit decisions on each link probably
affected their browsing behaviors. Four participants commented that they would
usually just skim through links for something that catches their attentions, and we
observed that occasionally participants would even not notice some links on the
study page, particularly ones without thumbnails. However, deviations in the CTRs
due to the laboratory setting should affect all three cases (treatments and control)
equally, which allows us to compare them fairly.
A second limitation is that we did not test how participants would react to conflicting
ratings, for example in the possible situations that different friends disagree, or the
centrally sourced and groupsourced treatments are in conflict. This is left for future
work.
Guidance for UI design
We found that participants did not always click on the glyphs to learn more information (only 40% of red glyphs were clicked on). Users will not even always notice
the signal glyph unless they look for it. This was also evident from the interviews:
six participants indicated that they would prefer seeing the type and details of feedback up front. Based on this guidance, we decided to use pie charts to replace
the glyphs (Figure 25). From the pie charts, users can get a direct impression on
the percentage of positive (negative) feedback of both group and crowd. When we
publish the application, we only keep the pie chart of the groupsourced data, as we
have suggested the users who install our application to install WOT as well, so that
we can gather enough data on both groupsourcing and crowdsourcing to do further
studies. FAR can be found and downloaded in our project page35 .
35
https://se-sy.org/projects/ruc/
52
Figure 25: Modified UI of FAR.
Now, we are able to answer the second question proposed in Section 3 by having
implemented a groupsourced system and tested it on the users. The results show
that groupsourcing is effective in deterring users from clicking through unsafe links.
So we can conclude that groupsourced signals can complement other types of signals
and compensate for their weaknesses by countering viral spreading of unsafe content
in a more timely fashion.
6
Conclusion and Future Work
As online social networks have become increasingly popular, providing easy-to-use
ways for ordinary users to avoid unsafe content online is an open issue. In this thesis,
we discuss several schemes to identify unsafe content. We classify them along two
dimensions: whether input is objective or subjective, and whether output is global
or personalized. So we generalize four kinds of systems that provide risk signals:
automated expert system, history system, crowdsourced system and groupsourced
system. We point out the advantages of these kinds of systems, as well as the
challenges for them.
We notice that there is a time lag for crowdsourcing, which reduces its effectiveness
against emerging threats or threats that are short-lived (e.g., phishing sites that are
active for a short while before being removed by the attacker). We apply the machine
learning techniques to crowdsourcing to address the time lag problem. Specifically,
we extract a number of features of approximately 16,000 links and fetch ratings of
those links. Then we apply a SVM classification algorithm to build a classifier with
which we can predict the rating level for a given link.
To both identify inappropriate content and address the time lag, we apply the no-
53
tion of groupsourcing, which takes advantage of information from people in a user’s
social circles about potentially unsafe content. We implement a groupsourced system called FAR, which is a functional application that allows savvy Facebook users
to warn their friends about potentially unsafe content. To verify the effectiveness
of both groupsourcing and FAR, we conduct a laboratory study, which shows that
groupsourcing is effective in deterring users from clicking through unsafe links. We
test the effectiveness of both centrally sourced (crowd and experts) and groupsourced
signals, and the results on their differences are inconclusive. We demonstrate that
groupsourced signals can therefore complement other types of signals and compensate for their weaknesses by countering viral spreading of unsafe content in a more
timely fashion.
Due to the limitations of our lab study pointed in Section 5.2, further field studies
are needed to support our findings: we need to improve the external validity and
include conflicting ratings into a field study. As mentioned in Section 2.7.2, security
experts may only appear in some certain communities. How to find and add an
expert in a secure manner is left as future work. Currently, FAR only supports
Facebook and Firefox. It is our future work to improve FAR to support other OSNs
(e.g., Myspace, Twitter) and other front-ends (e.g., Chrome and mobile devices).
Contributions
Revisiting the questions we proposed in Section 3, we summarize our contributions
in the following:
1. Augmenting crowdsourcing with techniques from automated expert
systems can address the time lag problem: We extract various features
of approximately 16,000 links and fetch ratings of those links. Then we apply
SVM to build a classifier with which we can predict the rating level for a given
link. We perform a 5-fold cross-validation, the results of which show a good
classification performance.
2. Groupsourcing can both address the time lag and signal inappropriate content: We implement a groupsourced system, which allows savvy
Facebook users to warn their friends about potentially unsafe content. Then
we conduct a laboratory study, and its results show that groupsourcing is
effective in deterring users from clicking through unsafe links.
54
This thesis is based on the prior work of Pern Hui Chia who has implemented
Rendezvous server and Jo Mehmet Øztarman who has implemented the first version
of FAR. Then Jian Liu completed the implementation, added new features to FAR
and Rendezvous server, and instrumented them for the user study. Sini Ruohomaa
and Jian Liu conducted the laboratory study: the former was in charge of the
interviews, and the latter conducted the quantitative analysis of the results. Sourav
Bhattacharya contributed to the design of WOT rating prediction scheme. Jian Liu
designed and implemented it and conducted the analysis.
Acknowledgements
I would like to thank Professor N. Asokan for being my supervisor and his insightful thoughts and advices. I also would like to thank Sini Ruohomaa and Sourav
Bhattacharya, my instructors, for their constant guidance and valuable comments
throughout this thesis project. In addition, I sincerely thank for the support from
the Intel Collaborative Research Institute for Secure Computing. I also sincerely
thank WOT for their valuable data. I am also grateful to many colleagues at Secure
Systems group of the Univeristy of Helsinki who have helped me in the project. I
would like to thank Pern Hui Chia and Jo Mehmet Øztarman for their prior work.
I also would like to thank the participants involved in our user study.
References
AFSV07
Anderson, D. S., Fleizach, C., Savage, S. and Voelker, G. M.,
Spamscatter:
Characterizing internet scam hosting infrastructure.
Ph.D. thesis, University of California, San Diego, 2007.
URL https://www.usenix.org/legacy/events/sec07/tech/full_
papers/anderson/anderson_html/index.html.
Alp04
Alpaydin, E., Introduction to machine learning. MIT press, 2004. URL
http://dl.acm.org/citation.cfm?id=SERIES10645.1734076.
ANCA11
Abu-Nimeh, S., Chen, T. and Alzubi, O., Malicious and spam posts
in online social networks. Computer, 44,9(2011), pages 23–28. URL
http://cat.inist.fr/?aModele=afficheN&cpsidt=24533852.
55
BBL07
Brown, J., Broderick, A. J. and Lee, N., Word of mouth communication
within online communities: Conceptualizing the online social network.
Journal of Interactive Marketing, 21,3(2007), pages 2–20. URL http:
//dx.doi.org/10.1002/dir.20082.
BP02
Barahona, M. and Pecora, L. M., Synchronization in small-world systems. Phys. Rev. Lett., 89, page 054101. URL http://link.aps.org/
doi/10.1103/PhysRevLett.89.054101.
Buh03
Buhmann, M. D., Radial basis functions: theory and implementations,
volume 12. Cambridge university press, 2003. URL http://adsabs.
harvard.edu/abs/2003rbf..book.....B.
BWL10
Besmer, A., Watson, J. and Lipford, H. R., The impact of social
navigation on privacy policy configuration. Proceedings of the Sixth
Symposium on Usable Privacy and Security, SOUPS ’10, New York,
NY, USA, 2010, ACM, pages 7:1–7:10, URL http://doi.acm.org/
10.1145/1837110.1837120.
CCVK11
Canali, D., Cova, M., Vigna, G. and Kruegel, C., Prophiler: A fast
filter for the large-scale detection of malicious web pages. Proceedings
of the 20th International Conference on World Wide Web, WWW ’11,
New York, NY, USA, 2011, ACM, pages 197–206, URL http://doi.
acm.org/10.1145/1963405.1963436.
CHA12
Chia, P., Heiner, A. and Asokan, N., Use of ratings from personalized communities for trustworthy application installation. In Information Security Technology for Applications, Aura, T., Jarvinen,
K. and Nyberg, K., editors, volume 7127 of Lecture Notes in Computer Science, Springer Berlin Heidelberg, 2012, pages 71–88, URL
http://dx.doi.org/10.1007/978-3-642-27937-9_6.
Che12
Cheung, S., How companies can leverage crowdsourcing. Ph.D. thesis,
Massachusetts Institute of Technology, 2012. URL http://dspace.
mit.edu/handle/1721.1/70819.
CKV10
Cova, M., Kruegel, C. and Vigna, G., Detection and analysis of driveby-download attacks and malicious Javascript code. Proceedings of the
19th International Conference on World Wide Web, WWW ’10, New
56
York, NY, USA, 2010, ACM, pages 281–290, URL http://doi.acm.
org/10.1145/1772690.1772720.
CL67
Chakravarti, I. M. and Laha, R. G., Handbook of methods of applied
statistics. In Handbook of methods of applied statistics, John Wiley &
Sons, 1967, URL http://library.wur.nl/WebQuery/clc/910580.
CMG09
Cha, M., Mislove, A. and Gummadi, K. P., A measurement-driven
analysis of information propagation in the flickr social network. Proceedings of the 18th International Conference on World Wide Web,
WWW ’09, New York, NY, USA, 2009, ACM, pages 721–730, URL
http://doi.acm.org/10.1145/1526709.1526806.
CV95
Cortes, C. and Vapnik, V., Support-vector networks. Machine Learning, 20,3(1995), pages 273–297. URL http://dx.doi.org/10.1007/
BF00994018.
CYA12
Chia, P. H., Yamamoto, Y. and Asokan, N., Is this app safe?: A large
scale study on application permissions and risk signals. Proceedings
of the 21st International Conference on World Wide Web, WWW ’12,
New York, NY, USA, 2012, ACM, pages 311–320, URL http://doi.
acm.org/10.1145/2187836.2187879.
Dai04
Daigle, L., Whois protocol specification. URL http://tools.ietf.
org/html/rfc3912.
DC94
Dourish, P. and Chalmers, M., Running Out of Space: Models of
information navigation. HCI, Glasgow, August 1994, URL http:
//www.dcs.gla.ac.uk/~{}matthew/papers/hci94.pdf.
DD05a
DiGioia, P. and Dourish, P., Social navigation as a model for usable
security. Proceedings of the 2005 Symposium on Usable Privacy and
Security, SOUPS ’05, New York, NY, USA, 2005, ACM, pages 101–
108, URL http://doi.acm.org/10.1145/1073001.1073011.
DD05b
DiGioia, P. and Dourish, P., Social navigation as a model for usable
security. Proceedings of the 2005 Symposium on Usable Privacy and
Security, SOUPS ’05, New York, NY, USA, 2005, ACM, pages 101–
108, URL http://doi.acm.org/10.1145/1073001.1073011.
57
DDH+ 00
Dieberger, A., Dourish, P., Höök, K., Resnick, P. and Wexelblat, A.,
Social navigation: Techniques for building more usable systems. interactions, 7,6(2000), pages 36–45. URL http://doi.acm.org/10.1145/
352580.352587.
DGDdlFJ04 Dourish, P., Grinter, R., Delgado de la Flor, J. and Joseph,
M., Security in the wild: user strategies for managing security as
an everyday, practical problem. Personal and Ubiquitous Computing, 8,6(2004), pages 391–401. URL http://dx.doi.org/10.1007/
s00779-004-0308-5.
Dou02
Douceur, J., The Sybil attack. In Peer-to-Peer Systems, Druschel, P.,
Kaashoek, F. and Rowstron, A., editors, volume 2429 of Lecture Notes
in Computer Science, Springer Berlin Heidelberg, 2002, pages 251–260,
URL http://dx.doi.org/10.1007/3-540-45748-8_24.
ECH08
Egelman, S., Cranor, L. F. and Hong, J., You’ve been warned: An empirical study of the effectiveness of web browser phishing warnings. Proceedings of the SIGCHI Conference on Human Factors in Computing
Systems, CHI ’08, New York, NY, USA, 2008, ACM, pages 1065–1074,
URL http://doi.acm.org/10.1145/1357054.1357219.
Ema14
Emarketer,
India
leads
worldwide
social
networking
growth, 2014.
URL http://www.emarketer.com/Article/
India-Leads-Worldwide-Social-Networking-Growth/1010396/.
Fac14
Facebook Newsroom, Company info, 2014. URL http://newsroom.
fb.com/company-info/.
Fri40
Friedman, M., A comparison of alternative tests of significance for
the problem of m rankings. The Annals of Mathematical Statistics,
11,1(1940), pages 86–92. URL http://dx.doi.org/10.1214/aoms/
1177731944.
Gal86
Galton, F., Regression towards mediocrity in hereditary stature. Journal of the Anthropological Institute of Great Britain and Ireland, pages
246–263. URL http://www.jstor.org/discover/10.2307/2841583?
uid=3737976&uid=2&uid=4&sid=21103778425771.
58
GCL+ 12
Gao, H., Chen, Y., Lee, K., Palsetia, D. and Choudhary, A. N., Towards online spam filtering in social networks. NDSS. The Internet Society, 2012, URL http://dblp.uni-trier.de/db/conf/ndss/
ndss2012.html#GaoCLPC12.
GN02
Girvan, M. and Newman, M. E. J., Community structure in social and
biological networks. Proceedings of the National Academy of Sciences,
99,12(2002), pages 7821–7826. URL http://www.pnas.org/content/
99/12/7821.abstract.
Hac14
Hacktrix,
Stay
away
from
malicious
facebook
apps,
2014.
URL
http://www.hacktrix.com/
stay-away-from-malicious-and-rogue-facebook-applications.
HHWM92
Hill, W. C., Hollan, J. D., Wroblewski, D. and McCandless, T., Edit
wear and read wear. Proceedings of the SIGCHI Conference on Human Factors in Computing Systems, CHI ’92, New York, NY, USA,
1992, ACM, pages 3–9, URL http://doi.acm.org/10.1145/142750.
142751.
HJN+ 11
Huang, L., Joseph, A. D., Nelson, B., Rubinstein, B. I. and Tygar,
J. D., Adversarial machine learning. Proceedings of the 4th ACM Workshop on Security and Artificial Intelligence, AISec ’11, New York, NY,
USA, 2011, ACM, pages 43–58, URL http://doi.acm.org/10.1145/
2046684.2046692.
HKAP13
Hammerla, N. Y., Kirkham, R., Andras, P. and Ploetz, T., On preserving statistical characteristics of accelerometry data using their
empirical cumulative distribution. Proceedings of the 2013 International Symposium on Wearable Computers, ISWC ’13, New York, NY,
USA, 2013, ACM, pages 65–68, URL http://doi.acm.org/10.1145/
2493988.2494353.
How06
Howe, J., The rise of crowdsourcing. Wired magazine, 14,6(2006), pages
1–4. URL http://www.e-fortrade.com/project_eseune/archivos_
hitos/1786/18.crowdsourcing.pdf.
HRM+ 13
Huang, T.-K., Rahman, M. S., Madhyastha, H. V., Faloutsos, M. and
Ribeiro, B., An analysis of socware cascades in online social networks.
Proceedings of the 22Nd International Conference on World Wide Web,
59
WWW ’13, Republic and Canton of Geneva, Switzerland, 2013, International World Wide Web Conferences Steering Committee, pages 619–
630, URL http://dl.acm.org/citation.cfm?id=2488388.2488443.
Ins14
Inside
Facebook,
Facebook
platform
supports
more
than
42
million
pages
and
9
million
apps,
2014.
URL
http://www.insidefacebook.com/2012/04/27/
facebook-platform-supports-more-than-42-million-pages-\
and-9-million-apps/.
JZK08
Jannach, D., Zanker, M. and Konstan, J., Special issue on recommender
systems. AI Communications, 21,2(2008), pages 95–96. URL http:
//iospress.metapress.com/content/E91N3W75160Q5168.
K+ 95
Kohavi, R. et al., A study of cross-validation and bootstrap for accuracy estimation and model selection. IJCAI, volume 14, 1995,
pages 1137–1145, URL http://frostiebek.free.fr/docs/Machine%
20Learning/validation-1.pdf.
Kat57
Katz, E., The two-step flow of communication: An up-to-date report on
an hypothesis. Public Opinion Quarterly, 21,1(1957), pages 61–78. URL
http://poq.oxfordjournals.org/content/21/1/61.abstract.
KCS13
Kelley, P. G., Cranor, L. F. and Sadeh, N., Privacy as part of the
app decision-making process. Proceedings of the SIGCHI Conference
on Human Factors in Computing Systems, CHI ’13, New York, NY,
USA, 2013, ACM, pages 3393–3402, URL http://doi.acm.org/10.
1145/2470654.2466466.
KGH+ 12
Kim, T. H.-J., Gupta, P., Han, J., Owusu, E., Hong, J., Perrig, A. and
Gao, D., Oto: Online trust oracle for user-centric trust establishment.
Proceedings of the 2012 ACM Conference on Computer and Communications Security, CCS ’12, New York, NY, USA, 2012, ACM, pages
391–403, URL http://doi.acm.org/10.1145/2382196.2382239.
KL70
Katz, E. and Lazarsfeld, P., Personal Influence, the Part Played by
People in the Flow of Mass Communications. A Report of the Bureau of
Applied Social Research Columbia University. Collier-Macmillan, 1970.
URL http://books.google.fi/books?id=rElW8D0D8gYC.
60
KNT10
Kumar, R., Novak, J. and Tomkins, A., Structure and evolution of
online social networks. In Link Mining: Models, Algorithms, and
Applications, Yu, P. S., Han, J. and Faloutsos, C., editors, Springer
New York, 2010, pages 337–357, URL http://dx.doi.org/10.1007/
978-1-4419-6515-8_13.
Kri10
Krishnamoorthy, K., Handbook of statistical distributions with applications. CRC Press, 2010. URL http://onlinelibrary.wiley.com/
doi/10.1111/j.1467-985X.2008.00561_10.x/abstract.
LBG44
Lazarsfeld, P. F., Berelson, B. and Gaudet, H., The people’s choice; how
the voter makes up his mind in a presidential campaign. Duell Sloan
and Pearce, New York„ 1944. URL http://www.popline.org/node/
517470.
LJLP07
Lakhani, K. R., Jeppesen, L. B., Lohse, P. A. and Panetta, J. A.,
The Value of Openess in Scientific Problem Solving. Division of Research, Harvard Business School, 2007. URL http://office.x-com.
se/munktellsciencepark/deploy/wp-content/uploads/2011/05/
The-Value-of-Openness-in-Scientific-Problem-Solving..pdf.
LK13
Lee, S. and Kim, J., Warningbird: A near real-time detection system for
suspicious URLs in Twitter stream. IEEE Transactions on Dependable
and Secure Computing, 10,3(2013), pages 183–195. URL http://www.
computer.org/csdl/trans/tq/2013/03/ttq2013030183-abs.html.
LPL11
Lu, L., Perdisci, R. and Lee, W., Surf: Detecting and measuring search
poisoning. Proceedings of the 18th ACM Conference on Computer
and Communications Security, CCS ’11, New York, NY, USA, 2011,
ACM, pages 467–476, URL http://doi.acm.org/10.1145/2046707.
2046762.
Mar14
Marketing Land, Facebook’s mobile & web app hub, app center, officially launches, 2014.
URL http://marketingland.
com/facebooks-mobile-web-app-hub-app-center-officially\
-launches-13609/.
MB00
Maglio, P. and Barrett, R., Intermediaries personalize information
streams. Commun. ACM, 43,8(2000), pages 96–101. URL http:
//doi.acm.org/10.1145/345124.345158.
61
Mer48
Merton, R. K., Patterns of influence: A study of interpersonal influence
and of communications behavior in a local community. Communications
research, 1949, pages 180–219.
MG08
McGrath, D. K. and Gupta, M., Behind phishing: An examination
of phisher modi operandi. Proceedings of the 1st Usenix Workshop on
Large-Scale Exploits and Emergent Threats, LEET’08, Berkeley, CA,
USA, 2008, USENIX Association, pages 4:1–4:8, URL http://dl.acm.
org/citation.cfm?id=1387709.1387713.
MK55
Menzel, H. and Katz, E., Social relations and innovation in the medical
profession: The epidemiology of a new drug. Public Opinion Quarterly,
19,4(1955), pages 337–352. URL http://poq.oxfordjournals.org/
content/19/4/337.abstract.
MSLC01
McPherson, M., Smith-Lovin, L. and Cook, J. M., Birds of a feather:
Homophily in social networks. Annual Review of Sociology, 27, pages
pp. 415–444. URL http://www.jstor.org/stable/2678628.
MSSV09a
Ma, J., Saul, L. K., Savage, S. and Voelker, G. M., Beyond blacklists: Learning to detect malicious web sites from suspicious URLs.
Proceedings of the 15th ACM SIGKDD International Conference on
Knowledge Discovery and Data Mining, KDD ’09, New York, NY, USA,
2009, ACM, pages 1245–1254, URL http://doi.acm.org/10.1145/
1557019.1557153.
MSSV09b
Ma, J., Saul, L. K., Savage, S. and Voelker, G. M., Identifying suspicious
urls: An application of large-scale online learning. Proceedings of the
26th Annual International Conference on Machine Learning, ICML ’09,
New York, NY, USA, 2009, ACM, pages 681–688, URL http://doi.
acm.org/10.1145/1553374.1553462.
MWI+ 07
McCarney, R., Warner, J., Iliffe, S., van Haselen, R., Griffin, M. and
Fisher, P., The Hawthorne effect: a randomised, controlled trial. BMC
medical research methodology, 7,1(2007), page 30. URL http://www.
biomedcentral.com/1471-2288/7/30.
NKS06
Newsome, J., Karp, B. and Song, D., Paragraph: Thwarting signature
learning by training maliciously. In Recent Advances in Intrusion Detection, Zamboni, D. and Kruegel, C., editors, volume 4219 of Lecture
62
Notes in Computer Science, Springer Berlin Heidelberg, 2006, pages
81–105, URL http://dx.doi.org/10.1007/11856214_5.
NWV+ 12
Nazir, A., Waagen, A., Vijayaraghavan, V. S., Chuah, C.-N., D’Souza,
R. M. and Krishnamurthy, B., Beyond friendship: Modeling user activity graphs on social network-based gifting applications. Proceedings of the 2012 ACM Conference on Internet Measurement Conference, IMC ’12, New York, NY, USA, 2012, ACM, pages 467–480, URL
http://doi.acm.org/10.1145/2398776.2398826.
OSH+ 07
Onnela, J.-P., Saramaki, J., Hyvonen, J., Szabo, G., Lazer, D., Kaski,
K., Kertesz, J. and Barabasi, A.-L., Structure and tie strengths in mobile communication networks. Proceedings of the National Academy of
Sciences, 104,18(2007), pages 7332–7336. URL http://www.pnas.org/
content/104/18/7332.abstract.
PHO11
Plötz, T., Hammerla, N. Y. and Olivier, P., Feature learning for activity recognition in ubiquitous computing. Proceedings of the TwentySecond International Joint Conference on Artificial Intelligence - Volume Volume Two, IJCAI’11. AAAI Press, 2011, pages 1729–1734, URL
http://dx.doi.org/10.5591/978-1-57735-516-8/IJCAI11-290.
Pow11
Powers, D. M., Evaluation: from precision, recall and f-measure
to roc, informedness, markedness & correlation. Journal of Machine Learning Technologies, 2,1(2011), pages 37–63. URL http:
//www.flinders.edu.au/science_engineering/fms/School-CSEM/
publications/tech_reps-research_artfcts/TRRA_2007.pdf.
Rei05
Reitzner, M., Central limit theorems for random polytopes. Probability
Theory and Related Fields, 133,4(2005), pages 483–507. URL http:
//dx.doi.org/10.1007/s00440-005-0441-8.
RHMF12a Rahman, M. S., Huang, T.-K., Madhyastha, H. V. and Faloutsos, M.,
Efficient and scalable socware detection in online social networks. Proceedings of the 21st USENIX Conference on Security Symposium, Security’12, Berkeley, CA, USA, 2012, USENIX Association, pages 32–32,
URL http://dl.acm.org/citation.cfm?id=2362793.2362825.
RHMF12b Rahman, M. S., Huang, T.-K., Madhyastha, H. V. and Faloutsos, M.,
Frappe: Detecting malicious Facebook applications. Proceedings of the
63
8th International Conference on Emerging Networking Experiments and
Technologies, CoNEXT ’12, New York, NY, USA, 2012, ACM, pages
313–324, URL http://doi.acm.org/10.1145/2413176.2413213.
Sei77
Seize, T. K., Student’s t-test. Southern Medical Journal, 70,11(1977),
page 1299. URL http://journals.lww.com/_layouts/1033/OAKS.
Journals/Error/decommission.html.
Sie56
Siegel, S., Nonparametric statistics for the behavioral sciences. URL
http://psycnet.apa.org/psycinfo/1957-00089-000.
Sim13
Simon, P., Too Big to Ignore: The Business Case for Big Data. John
Wiley & Sons, 2013. URL http://cds.cern.ch/record/1617292.
SKV13
Stringhini, G., Kruegel, C. and Vigna, G., Shady paths: Leveraging
surfing crowds to detect malicious web pages. Proceedings of the 2013
ACM SIGSAC Conference on Computer & Communications Security, CCS ’13, New York, NY, USA, 2013, ACM, pages 133–144, URL
http://doi.acm.org/10.1145/2508859.2516682.
Ste81
Stein, C. M., Estimation of the mean of a multivariate normal distribution.
The annals of Statistics, pages 1135–1151.
URL
http://www.jstor.org/discover/10.2307/2240405?uid=
3737976&uid=2&uid=4&sid=21103778629091.
Ste97
Stehman, S. V., Selecting and interpreting measures of thematic classification accuracy. Remote Sensing of Environment, 62,1(1997), pages 77
– 89. URL http://www.sciencedirect.com/science/article/pii/
S0034425797000837.
Sve03
Svensson, M., Defining, Designing and Evaluating Social Navigation. DSV, Department of Computer and Systems Sciences, Stockholm University. Department of Computer and Systems Sciences,
Stockholm Univ., 2003. URL http://books.google.fi/books?id=
a5KHtgAACAAJ.
Tec14
Techcruch,
Facebook says it now has 235m monthly
gamers,
app
center
hits
150m
monthly
visitors,
2014.
URL
http://techcrunch.com/2012/08/14/
facebook-says-it-now-has-235m-monthly-gamers-app-center\
-hits-150m-monthly-users/.
64
TGM+ 11
Thomas, K., Grier, C., Ma, J., Paxson, V. and Song, D., Design and
evaluation of a real-time URL spam filtering service. Proceedings of the
2011 IEEE Symposium on Security and Privacy, SP ’11, Washington,
DC, USA, 2011, IEEE Computer Society, pages 447–462, URL http:
//dx.doi.org/10.1109/SP.2011.25.
The14
The
Social
Skinny,
100
social
media
statistics
for
2012,
2014.
URL
http://thesocialskinny.com/
100-social-media-statistics-for-2012/.
Tho12
Thomé, A. C. G., Svm classifiers–concepts and applications to
character recognition.
URL http://cdn.intechopen.com/pdfs/
40722/InTech-Svm_classifiers_concepts_and_applications_to_
character_recognition.pdf.
TKD+ 09
Tsai, J. Y., Kelley, P., Drielsma, P., Cranor, L. F., Hong, J. and Sadeh,
N., Who’s viewed you?: The impact of feedback in a mobile locationsharing application. Proceedings of the SIGCHI Conference on Human Factors in Computing Systems, CHI ’09, New York, NY, USA,
2009, ACM, pages 2003–2012, URL http://doi.acm.org/10.1145/
1518701.1519005.
VdV00
Van der Vaart, A. W., Asymptotic statistics, volume 3. Cambridge university press, 2000. URL http://www.getcited.org/pub/100328880.
vR86
van Rijsbergen, C. J., (invited paper) a new theoretical framework for
information retrieval. Proceedings of the 9th Annual International ACM
SIGIR Conference on Research and Development in Information Retrieval, SIGIR ’86, New York, NY, USA, 1986, ACM, pages 194–200,
URL http://doi.acm.org/10.1145/253168.253208.
WBJR06
Wang, Y., Beck, D., Jiang, X. and Roussev, R., Automated
web patrol with strider honeymonkeys:
Finding web sites
that exploit browser vulnerabilities.
NDSS06, 2006, URL
http://msr-waypoint.com/en-us/um/redmond/projects/strider/
honeymonkey/NDSS_2006_HoneyMonkey_Wang_Y_camera-ready.pdf.
Wik14a
Wikipedia, Cubic hermite spline, 2014. URL http://en.wikipedia.
org/wiki/Cubic_Hermite_spline/.
65
Wik14b
Wikipedia, Model-view-controller, 2014. URL http://en.wikipedia.
org/wiki/Model-view-controller/.
WIP11
Wang, D., Irani, D. and Pu, C., A social-spam detection framework. Proceedings of the 8th Annual Collaboration, Electronic Messaging, Anti-Abuse and Spam Conference, CEAS ’11, New York, NY,
USA, 2011, ACM, pages 46–54, URL http://doi.acm.org/10.1145/
2030376.2030382.
WM99
Wexelblat, A. and Maes, P., Footprints: History-rich tools for information foraging. Proceedings of the SIGCHI Conference on Human Factors in Computing Systems, CHI ’99, New York, NY, USA, 1999, ACM,
pages 270–277, URL http://doi.acm.org/10.1145/302979.303060.
WOT14
WOT, Why wot works, 2014.
support/how-wot-works/.
WRN10
Whittaker, C., Ryner, B. and Nazif, M., Large-scale automatic
classification of phishing pages.
NDSS. The Internet Society,
2010, URL http://dblp.uni-trier.de/db/conf/ndss/ndss2010.
html#WhittakerRN10.
WS98
Watts, D. J. and Strogatz, S. H., Collective dynamics of ‘small-world’
networks. nature, 393,6684(1998), pages 440–442. URL http://dx.
doi.org/10.1038/30918.
You14
YouTube, Statistics, 2014. URL http://www.youtube.com/yt/press/
statistics.html/.
Zha07
Zhang, Y., Development and validation of an Internet use attitude scale. Computers & Education, 49,2(2007), pages 243 –
253. URL http://www.sciencedirect.com/science/article/pii/
S036013150500117X.
ZK99
Zwillinger, D. and Kokoska, S., CRC standard probability and statistics tables and formulae.
CRC Press, 1999.
URL
http://www.jstor.org/discover/10.2307/2681120?uid=
3737976&uid=2&uid=4&sid=21103778629091.
ZL07
Zhao, Z. and Liu, H., Spectral feature selection for supervised and unsupervised learning. Proceedings of the 24th International Conference on
URL https://www.mywot.com/en/
66
Machine Learning, ICML ’07, New York, NY, USA, 2007, ACM, pages
1151–1157, URL http://doi.acm.org/10.1145/1273496.1273641.
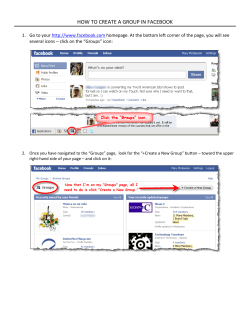


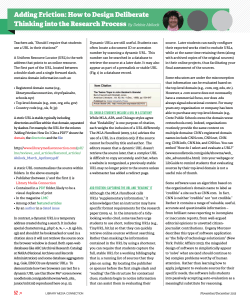


© Copyright 2026