
Resource productivity in 7 steps and improve their material footprint Wuppertal Institute
Wuppertal Institute
for Climate, Environment
and Energy
Michael Lettenmeier
Holger Rohn
Christa Liedtke
Friedrich Schmidt-Bleek
In cooperation with
Katrin Bienge
Dafne Mazo Urbaneja
Jade Buddenberg
Resource productivity in 7 steps
W U P P E R T A L
S P E Z I A L
41
How to develop eco-innovative products and services
and improve their material footprint
Authors:
Michael Lettenmeier, Holger Rohn, Christa Liedtke, Friedrich Schmidt-Bleek
in cooperation with Katrin Bienge, Dafne Mazo Urbaneja and Jade Buddenberg
Contact:
Michael Lettenmeier, Dr. Christa Liedtke
Wuppertal Institute for Climate, Environment and Energy
Research Group 4: Sustainable Production and Consumption
D-42103 Wuppertal, Döppersberg 19, Germany
Phone:
+ 49 202 2492 -175 / -130, Fax -138
E-Mail:
[email protected]
[email protected]
Holger Rohn
Trifolium – Beratungsgesellschaft mbH
D-61169 Friedberg, Alte Bahnhofstraße 13, Germany
Phone:
+ 49 6031 68754 -64, Fax -68
E-Mail:
[email protected]
Prof. Dr. Friedrich Schmidt-Bleek
Factor 10 Institute
F-83660 Carnoules, La Rabassière, Carrère des Bravengues
Phone and Fax: +33 494 332458
Images:
Photos: PhotoDisc
Figures 1 and 3: Wuppertal Institute, Vislab.
Figure 2: Ritthoff et al. 2002
Cover Layout:
VisLab, Wuppertal Institute
Printing:
Hitzegrad, Wuppertal
This booklet has been produced during the Living Lab project in order to show how the
sustainability of product and service innovations can be measured and documented.
The project LIVING LAB – Design Study for the LIVING LAB Research Infrastructure, to research
human interaction with, and stimulate the adoption of, sustainable, smart and healthy innovations
around the home is funded by the Seventh Framework Programme of the European Union
(grant agreement no. 212498). www.livinglabproject.org
© Wuppertal Institute for Climate, Environment and Energy 2009
The authors are responsible fort he content of this booklet.
ISBN: 978-3-929944-80-8
Wuppertal Spezial 41
Resource productivity in 7 steps
How to develop eco-innovative products and services
and improve their material footprint 1
Michael Lettenmeier, Holger Rohn, Christa Liedtke, Friedrich Schmidt-Bleek
in cooperation with Katrin Bienge, Dafne Mazo Urbaneja and Jade Buddenberg
Wuppertal, December 2009
Wuppertal Institute for Climate, Environment and Energy
1 Resource productivity in 7 steps is based on the following sources:
Autio & Lettenmeier (2002), Ritthoff, Rohn & Liedtke (2002), Salmenperä (2002),
Schmidt-Bleek (1993), Schmidt-Bleek (1999), Schmidt-Bleek (2004),
Schmidt-Bleek (2009), Schmidt-Bleek & Manstein (1999),
Schmidt-Bleek & Tischner (1995), and Kuhndt et al. (2001).
For details see references.
4
Content
Content........................................................................................................................4
Foreword.....................................................................................................................5
Introduction ................................................................................................................7
The MIPS Concept....................................................................................................10
The 7 steps for designing eco-innovative products .............................................13
Overview – Resource productivity in 7 steps........................................................................................ 13
Step 1: Form a team............................................................................................................................. 15
Step 2: Choose a product and determine the service it is providing .................................................... 16
Step 3: Identify the product chain ......................................................................................................... 18
Step 4: Assess the current status of the product.................................................................................. 19
Step 5: Estimate the MIPS of the product ............................................................................................ 19
Step 6: Optimize the product and implement eco-innovation ............................................................... 23
Step 7: (Re-)design the product service-oriented................................................................................. 24
References................................................................................................................28
Worksheets...............................................................................................................30
Worksheet 1: Team members .............................................................................................................. 30
Worksheet 2.1: Select a reference product .......................................................................................... 31
Worksheet 2.2: Determine the service unit........................................................................................... 33
Worksheet 3: Identify the product chain ............................................................................................... 34
Worksheet 4: Assess the current status ............................................................................................... 35
Worksheet 5.1: Estimate the material input of the product................................................................... 37
Worksheet 5.2: MI of the whole production process or life cycle and MIPS......................................... 38
Worksheet 6.1: Decrease the material use .......................................................................................... 39
Worksheet 6.2: Improve the service ..................................................................................................... 43
Worksheet 7: Relevant design criteria.................................................................................................. 46
Glossary....................................................................................................................47
MI factors ..................................................................................................................53
WUPPERTAL INSTITUTE
RESOURCE PRODUCTIVITY IN 7 STEPS
5
Foreword
Without radical dematerialization
there will be no economic sustainability
In his book “The Call Girls” Arthur Koestler once noted „About feelings of gloom and warnings of
doom. These two attitudes must not be confused. It is a great mistake to confuse them. A warning
serves a preventive, a positive purpose. A warning must be life-affirming. The geese on the Capitol
were not gloomy, Cassandra was. So the geese succeeded with their warning and Cassandra did
not”.
For many years we in the environmental protection business were considered Cassandras. Unfortunately the climatic changes and Katrina in New Orleans – among many other recent desasters – made
us look more like geese.
It is 20 years since I came to the conclusion that the physical root cause for the ecological failure of
our economy is the extravagant consumption of natural resources. This may sound trivial today, but at
that time I was pretty much alone with this opinion.
Still today, some 90% of the material lifted from nature does not appear in final goods! I proposed a
tenfold dematerialization of western technologies on average as a conditio sine qua non for approaching sustainable conditions, and my co-workers later showed in enterprises throughout Europe and
Japan that very substantial savings in resource inputs are achievable with state of the art technology
without loss of end-use satisfaction.
However, we also learned that industry was – and still is – rather reluctant to move forcefully in this
direction as long as there is no obvious demand for dematerialized goods and services, and as long
as saving resources in manufacturing was no significant help in cutting production costs, compared for
instance to the cost of labor.
By now it is common knowledge and widely accepted that the prices of natural resources do not reflect
„the ecological truth“ (Ernst Ulrich von Weizsäcker). So far, governments have widely failed to respond
to this situation in a systemic and evenhanded sense, e.g. by taxing resources in exchange of lowering levies on labor.
On the other hand, authorities have frequently subsidized new technologies, particularly in the area of
energy savings and cutting emissions of CO2. In other words, costly measures have been taken to
manage the output side of the economy. Unfortunately, this kind of policy – concentrating upon solving
individual problems after they became manifest – does not help to increase the precautionary protection from future “inconvenient truths” (Al Gore). Neither economic nor environmental policies that are
symptom-oriented can lead to sustainability.
The ecosphere is a highly complex system. The economy is a parasitic part of it. Without respecting
natural laws, our technology-based economy cannot function in the long term.
Every product and every service produced by man can only claim to be “bio” or “sustainable” if it fits
into the economic system as a whole, into an economy that functions within the guard rails of the ecosphere.
WUPPERTAL INSTITUTE
RESOURCE PRODUCTIVITY IN 7 STEPS
6
FOREWORD
Irrespective of ecological concerns, however, proactive entrepreneurs are aware of the fact that globalizing the western style of life is not possible because doing so would require the existence of at least
two planets earth as resource basis. They therefore search for resource saving options in their own
interest – increasingly with noticeable results to the bottom line.
Meanwhile the EU Eco-innovation Panel has defined eco-innovation to “mean the creation of novel
and competitively priced goods, processes, systems, services, and procedures that can satisfy human
needs and bring quality of life to all people with a life-cycle-wide minimal use of natural resources (material including energy carriers, and surface area) per unit output, and a minimal release of toxic substances.“ (Reid, Miedzinski 2008). This approach to future technology was recommended in order to
guard against continued further destruction of irreplaceable functions of nature, without which humans
cannot survive. This approach implies also that traditional environmental technology is no longer enough.
This compendium “Resource productivity in 7 steps” in front of you is intended to give practical
advice to designers, engineers, distributors, banks, lawmakers and others how to increase the resource productivity (dematerialization) of goods and services.
Professor Friedrich Schmidt-Bleek
Factor 10 Institute
Carnoules, Provence, November 2009
WUPPERTAL INSTITUTE
RESOURCE PRODUCTIVITY IN 7 STEPS
7
Introduction
The way we handle natural resources is far from efficient. On the average, up to 90 % of the biomass
harvested as well as more than 90 % of the non-renewable materials used are wasted on the way to
making products available to the end-user. From this perspective, humankind is hardly facing real
supply problems. Surprisingly, we seem to be serious when calling this present situation "high tech",
"high chem", "eco-something", or sometimes even “sustainable”.
We have tried to improve the protection of the environment for almost 40 years. For instance, we have
put tremendous efforts on controlling harmful emissions, cleaning up waterways and reducing the
extinction of endangered organisms. However, despite progress being made in individual sectors, the
state of the environmental health as a whole has weakened. Past economic and environmental protection policies have obviously not been able to stop this downward trend.
A basic condition for solving this systemic problem is the understanding that all human material use is
changing natural material flows and biological cycles in eco-systems: removing huge and continuously
growing quantities of materials, timber and water, continuing to cover enormous surface areas with
buildings and infrastructures, have a devastating impact on the life-sustaining functions and services
of the ecosphere.
Sooner or later every material input becomes an output in form of waste, effluent or emissions. Reducing the inputs reduces the overall environmental burden much more effectively than individual measures on the output side (filtering emissions, removing CO2 from smokestacks, recycling waste, reducing the release of toxic substances, etc.). When we reduce the material consumption for manufacturing and using products, and for generating services we desire, we prevent environmental problems
from arising. If products and services are made from fewer materials they are more eco-efficient.
At present, the promise of mainstream economics is to provide people in developing countries with a
lifestyle that equals that of the west. This would require at least a fourfold increase in the use of natural resources, and such quantities of natural resources are not available on the limited planet earth.
That circumstance, too, is a convincing argument for sharply increasing the resource productivity.
But how eco-efficient do we have to become? Is there a certain minimum we have to achieve in order
to reach a reasonable co-existence of commerce and the ecosphere? According to preliminary estimates, the global resource take has to be reduced by half before “coexistance of commerce and the
ecosphere” can be expected. Nowadays 20% of all people, the ones living in industrialised countries,
are using 80% of all natural resources. If consumption “rights” were evenly distributed among the still
world’s rising population, the use of natural resources by the industrialised countries would need to be
reduced on average to around one tenth of its present level (Schmidt-Bleek 1994). This reduction is
known as the “factor 10 goal”.
In order to implement this goal, it is important to benchmark the current eco-efficiency, or resource
productivity, to determine resource efficiency potentials (see e.g. Rohn et al. 2009) and to develop
possible implementation measures to improve the material flow. The tool to monitor this material flow
is called MIPS (Material Input Per unit Service or output). It measures the material and energy input of
a product throughout its life-cycle (production of raw materials, manufacturing, transportation, use,
disposal) and measures the decoupling of the economy from resource use.
WUPPERTAL INSTITUTE
RESOURCE PRODUCTIVITY IN 7 STEPS
8
INTRODUCTION
The “ecological rucksack” denotes the invisible material burden (the “subsidy by nature”), or the total
input of natural resources required by any product “from the cradle to the point of sale”. In a sense, the
ecological rucksack parallels the monetary price of products in physical terms. It is an important
measure for comparing functionally equivalent goods from different competitors at the point of sale
(e.g. tools or cars).
What does this mean for a company? During the last decades, companies have started to reduce the
environmental impacts of their processes, or even of their products. This has often meant a reduction
of their undesired outputs - emissions, wastes, and wastewater. However, this classical environmental
protection remains a costly and rather insufficient answer to the ecological crisis. It typically works at
the “end of the pipe” and implies additional costs and on occasion even the input of additional natural
resources (e.g. the ecological rucksack of a typical catalytic converter weighs about two tonnes).
The concept of resource productivity and factor 10 provides a significant change of focus. Instead of
spending money on technical efforts for cleaning up wastes and emissions, this approach puts the
emphasis on saving money by saving natural resources. This can also be a way out of the economic
crisis we are facing presently (see e.g. Welfens et al. 2008). It can be achieved in two different ways.
First, we can dematerialise existing products and production processes so that they require fewer
natural resources.
But we can go far beyond this and take a totally new viewpoint on product development, design and
innovation. We can increase dramatically the productivity of our resource use when we reconsider
products from a service point of view. We can look at our products as "service delivery machines" and
start to design new solutions to provide the services we need. This will require a totally new input of
know-how, know-when, know-where, and know-who. Thus we can become part of a new, dematerialised and customized economy that focuses on the availability and accessibility of services rather
than on the possession of goods. Examples for this approach are the “Skysail” for propelling ships,
and “lotus-type” surfaces that make walls, toilets, textiles etc. “self-cleaning”.
Ecological rucksack and footprints
The metaphor “ecological rucksack’“ was created by Schmidt-Bleek in the early 90ies to illustrate the
fact that the industrial creation of every object - from mousetraps to infrastuctures – requires more
natural material than is contained in its final form. In a sense, this represents the “value lost” from an
ecological point of view. The rucksack of industrial goods is usually more than 10 kg nature for every
kg of product, implying that more than 90% of the natural material originally mobilized and used is
being wasted on the way to the market. The consumption of water for creating industrial goods or food
can easily surpass 100 or 1000 kg per kg of product.
The ecological rucksack thus denotes the invisible material burden or the total input of natural resources required by any product or service “from the cradle to the point of sale”.
However, a good is only any good, if it is being used to yield a benefit, a value or service. Beyond the
ecological rucksack of a product, additional material, energy and water must in most cases be invested in order to yield a benefit. The material or water input from cradle to cradle for creating a unit of
service or benefit, MIPS, can thus be seen as the measure for “the ecological rucksack of a service”.
The main purpose of defining the rucksack of a product or a service is to allow the quantification and
comparison of the environmental impact potential of goods and services on the market. Rucksacks are
WUPPERTAL INSTITUTE
RESOURCE PRODUCTIVITY IN 7 STEPS
9
INTRODUCTION
the rational and quantifiable bases for eco-innovation – the design of goods, processes, technical systems, services, and procedures for the future.
In metaphoric terms, the ecological footprint is the result of a rucksack: the heavier the rucksack, the
bigger the footprint becomes. In developing the footprint concept, Wackernagel (1997) attempted to
combine the three principal natural resources: material, water and land, into one indicator. The ecological footprint is a measure of how much biologically productive land and water an individual, population or activity requires to produce all the resources it consumes and to absorb the waste it generates
using prevailing technology and resource management practices. The ecological footprint is usually
measured in global hectares. Because trade is global, an individual or country's footprint includes land
or sea from all over the world.
(see http://www.footprintnetwork.org/en/index.php/gfn/page/glossary/#efstandards)
The ecological footprint has been able to illustrate that the current worldwide consumption of natural
resources is already beyond the capacity of the earth. This is one reason for the popularity of the
metaphor footprint as an ecological indicator in the recent years. Using the popularity of the footprint
as a metaphor indicating the life-cycle-wide impacts of products, companies, activities or countries,
new types of “footprints” have been defined although they are not any more directly related to land-use
but to material flows:
The water footprint is an indicator of water use that looks at both direct and indirect water use of a
consumer or producer. The water footprint of an individual, community or business is defined as the
total volume of freshwater that is used to produce the goods and services consumed by the individual
or community or produced by the business. Water use is measured in terms of water volumes consumed (evaporated) and/or polluted per unit of time. A water footprint can be calculated for any welldefined group of consumers (e.g. an individual, family, village, city, province, state or nation) or producers
(e.g.
a
public
organization,
private
enterprise
or
economic
sector).
(See
also
www.waterfootprint.org/?page=files/Glossary.) The category water in the MIPS-concept (also called
“water rucksack”) indicates generally quite similar issues as the water footprint. In detail however,
differences in the calculation rules cause in the case of biotic materials often much higher values for
the water footprint than for the water rucksack.
The carbon footprint is a measure of the impact of our activities in terms of climate change. It relates
to the output of greenhouse gases during the life cycle of goods or activities from burning fossil fuels
for electricity, heating, transportation etc. (see www.carbonfootprint.com/carbonfootprint.html). Its unit
is tonnes (or kg) of carbon dioxide equivalent. Products and services with a smaller carbon footprint
will not necessarily become more sustainable because reducing greenhouse gas emissions may increase resource use due to the technology required (e.g. for carbon capture and storage), and, more
importantly, the environmetal consequence of CO2 emissions is only one of the major reasons for the
man-made environmental crisis.
Attempting to move the metaphors rucksack and footprint into one picture, one could say:
The “material footprint” of a product is its ecological rucksack. The “material footprint“ of a service is
the cradle-to-cradle material input (the MI in MIPS) needed to generate a service or benefit. In the
MIPS concept, the consumption of abiotic and biotic materials, water, air and soil as well as erosion
are usually considered separately (for details, see below). In practice, the sum of biotic and abiotic
material inputs (plus the erosion in the case of agricultural products) for generatig a desired output has
often turned out a reasonable approximation.
RESOURCE PRODUCTIVITY IN 7 STEPS
WUPPERTAL INSTITUTE
10
The MIPS Concept2
The idea behind MIPS
Sooner or later, all material input becomes an output: waste, effluent, or emission. If every input becomes an output anyway (including the increase in material stocks in the technosphere), then by
measuring the input one can arrive at an estimation of the environmental impact potential. Most methods of evaluating the ecological quality of a product investigate a variety of selected outputs, often
those, whose environmental relevance is at least partially known (e. g. “fine dust” or CO2). However,
out of the hundreds of thousands of different substances emitted by human acitivites, only several
hundreds have been comprehensively researched with respect to their eco-toxic effects.
Furthermore, billions of actors emit “useless” material residues continuously at an unknown number of
geographic locations. Therefore, controlling and managing the economy with respect to environmental
impacts in a sytematic and cost-effective way can happen only at its input side. The number of input
points is only a small fraction of the many output points.
MIPS
MIPS stands for the life-cycle-wide “Material Input Per unit of Service“. MIPS allows to estimate the
input oriented environmental impact potential of a product (e.g. a washing machine) used for providing
a specific service or benefit (e.g. receiving 5 kg of clean clothes). MIPS can also be used to assess
the resource efficiency of complex systems like transport systems or private households (see e.g.
Lähteenoja et al. 2006 or Kotakorpi et al. 2008).
The material input (MI) is measured in kilograms or tonnes of material (incl. energy carriers and the
materials invested to harvest solar radiation, or geothermal energy). The unit of service (S) has no
predefined dimension. It depends on and must be defined in each individual case. The following categories of resources are counted separately: biotic (or renewable) raw materials, abiotic (or nonrenewable) raw materials, water, air, and finally earth movement in agriculture and forestry (incl. erosion). The Factor 10 reduction target applies to all categories of natural resources separately. In practice, the sum of biotic and abiotic material inputs and erosion are sometimes considered together. As
the quantities of water consumed for generating a specific service is typically at least ten times higher
than the amount of other resources, water must always be calculated and displayed separately.
The material input (MI)
Calculating the material input for each individual case over the entire life cycle right from the source of
material extraction would be extremely laborous. Therefore, practinioners usually base their first calculations for the resource-intensity of the raw materials used, the energy consumed or the means of
transport used on precalculated, average multiplication factors – the “MI factors” (Ritthoff et al. 2002).
MI factors (also rucksack factors or material footprint factors) are the material intensity values for individual input materials (raw, basic or building materials) and energy quantities. For instance, the abiotic
2
This section is mainly based on Schmidt-Bleek et al. (1993), Schmidt-Bleek (1994), Ritthoff et al. (2002),
Schmidt-Bleek (2009).
WUPPERTAL INSTITUTE
RESOURCE PRODUCTIVITY IN 7 STEPS
11
THE MIPS CONCEPT
MI factor for an average kilogram of primary platinum is 350,000 kg, for a kilogram of primary copper
350 kg, and for a kilogram of polyester yarn 8 kg. Some MI factors are available for complex systems,
for example the primary resource consumption per energy carrier and type of power plant or for using
a certain vehicle on a specific type of road.
The MI factors are expressed in kg / kg (kg of resources per kg of the material used), kg / kWh (kg of
resources per kilowatthour of energy consumed), or kg / tkm (kg of resources per ton kilometre of
transport required). The use of MIPS thus becomes practicable, comprehensible and harmonised.
Many MI factors can be found in the annex of this guideline and also on www.mips-online.info.
The Service Unit (S)
When comparing different solutions for providing a certain service (e.g. using a bike, a car or a train
for moving over a distance of 5 km), it is necessary to establish a measure of comparison. In the MIPS
concept, this measure is called a unit of service (S). The S in MIPS designates the service, the benefit,
the value created with technical systems, the basis of all modern services. Providing such benefits is
the core driving force for having developed civilization over the past 10 000 years. This applies as
much to enjoying art, to acertaining foods supplies, to health care, as well as to providing shelter and
communication. Unlike the MI, S has no predefined dimension and must be stringently defined in each
individual case.
Concentrating on the benefits from utilizing a product rather than on the product itself opens a whole
new dimension of development options. The intellectual focus shifts from improving existing technical
solutions to a potentially infinite variety of approaches for meeting the needs of people under given
boundary conditions. The shift in focus corresponds well to the growing market trend of renting, leasing and sharing instead of owning goods.
This implies new business models, according to which managing technology will play a much more
intensive role in the future than today. Automatic control and management sytems will play a major
role in order to optimize intelligent capacity utilization. For instance, many personal transportation
needs could be dematerialized by a factor of 10 or more when shifting to new kinds of transport solutions (especially in cities) from the present debatable practice of possessing pasenger cars with 5
seats and a maximum speed of 150 km/hr that are occupied on average by 1,2 persons during more
than 85% of their life. This approach would obviously be financially as well as ecologically more prudent than spendig billions on reducing the CO2 emissions by 20 or 30%. MIPS can facilitate the development of totally new transport solutions for providing a certain service instead of focusing solely on
vehicles with a lower material input.
Resource productivity
The MIPS equation (MI / S) can also be turned around. With the reciprocal of MIPS (S / MI), one can
ascertain (and increase) the amount of benefit derived from a given cradle-to-cradle quantity of material. S / MI is thus an expression for the resource productivity. This means that we can compare the
amount of service, or benefit (e.g. the amount of passenger kilometers), that we can achieve by "investing" a certain amount of natural resources (e.g. into alternative transport systems).
The resource productivity of receiving a service cannot only be improved by technical design and by
system management. Individual consumers have the power to dramatically influence the use of nature. The S in MIPS can be improved manifold by entirely personal decisions. For instance, if a hotel
RESOURCE PRODUCTIVITY IN 7 STEPS
WUPPERTAL INSTITUTE
12
THE MIPS CONCEPT
guest uses the towels provided three days rather than freshly cleaned ones every day, the resource
productivity of using towels increases by 300%. On top of that, such personal decisions result always
in saving money. Perhaps you should ask the hotel management next time to repay you for helping to
protect the environment!
Why to use MIPS
MIPS sums up in mass (kg or tonne) units the quantity of materials (and energy in material terms)
needed for performing a specitic service by technical means. MIPS is a quantitative measure for the
"ecological materials and energy price" per unit of utility or per unit of service. MIPS helps to analyse
the resource as well as the financial potential of an entreprise. By using the MIPS concept, futureoriented goods, processes, systems, services, and procedures can be evaluated and designed.
MIPS can be applied on the company level, as well as branch-wide. It is applicable in all areas of production and consumption, on a regional, national and global level. By interlocking the processes on all
these levels, the optimisation of all material inputs contributes to an increase in resource productivity
life-cycle-wide or in terms of the overall economy (see e.g. Schmidt-Bleek 2009, Schmidt-Bleek et al.
1998). Hence, MIPS also facilitates the decoupling of natural resource consumption from wealth generation.
By means of MIPS, enterprises can monitor and control in a timely (and even real time) manner the
life-cycle-wide quality of their input materials, manufacturing process, logistics, products and services.
The crucial difference to those indicators that relate merely to outputs (e.g. emissions) is the active
orientation towards products and services with life-cycle-wide improved environmental impact potentials, rather than just to the reduction of its emissions. For instance, the CO2 emission from automobiles reflects typically only some 15% of the total material consumption per kilometer service, and the
carbon content amounts only to about 30% of the CO2 as the rest of the weight is oxygen (see also
Lähteenoja et al. 2006).
MIPS is a robust and directionally reliable indicator for directly comparing functionally comparable
goods or services regarding their life-cycle-wide material and energy requirements. MIPS is a valid
indicator for all goods, processes, systems, services, and procedures – worldwide.
WUPPERTAL INSTITUTE
RESOURCE PRODUCTIVITY IN 7 STEPS
13
The 7 steps for designing eco-innovative products
Overview – Resource productivity in 7 steps
The following concept “Resource productivity in 7 steps” (see figure 1) is intended to give practical
advice especially to designers, engineers and other resposible persons in companies and organisations how to increase the resource productivity (dematerialization) of goods and services.
The eco-innovative (re-)design of products begins with the definition / description of the benefit, or the
bundle of services, which the user expects from a product. The use of MIPS helps to develop solutions
that can provide this benefit with the least possible quantity of natural resources, from cradle to grave.
Thus, material and energy consumption can be minimised while satisfying the demand. This requires
new ways of utilising maximum intellectual skills such as responsibility, patience,
diligence, experience and know-how. In
addition, information gathering and interdisciplinary cooperation play an important
role. In other words: Intelligent planning
saves money and protects the vital ecosystem services and functions.
This makes good business sense. Japanese businesses have realized this and
emphasize the planning phase while
Europeans and Americans, so far, rather
care about automation and rationalisation
of operational processes, with largest
possible savings in labor. However the
European approach is slowly changing
with the introduction of “Life Cycle Engineering” (LCE). In this principle, the design phase already takes into account all
stages of the product life cycle and possible conflicts of objectives (for example
between profitability, functionality and
environmental quality). Up until now, the
LCE sees environmentally friendly design
mainly in terms of easy-to-dissemble and
recyclable construction. Thus, the ecodesign concept as presented here opens
up a huge range of new options for product design, resource savings and profitability.
RESOURCE PRODUCTIVITY IN 7 STEPS
Figure 1: The 7 steps to develop your eco-innovative
product or service (source: own chart)
WUPPERTAL INSTITUTE
14
THE 7 STEPS FOR DESIGNING ECO-INNOVATIVE PRODUCTS
Step 1: Form a team
In order to cover the different aspects of the life cycle of a product or service, it is useful to create a
team that involves employees from different company units. A team coordinator guides this team towards eco-innovative goals. If possible, a member of the mana-gement should participate in all sessions in order to smoothen the way to eco-intelligent decissions.
Step 2: Choose a product and determine the service it is providing
In order to decide, which product the company would like to improve first, it is useful to compare different products available. Analysing and comparing the economic and environmental performance of
the selected products clarifies, which product is most suitable for a start towards innovative changes.
Step 3: Identify the product chain
The team can achieve a common and holistic understanding of the product or service to be developed
by drawing a diagram of all the processes that are part of the life cycle („from cradle to grave“). This
way an overall picture of the most relevant processes is achieved. Although this kind of illustration
may appear complex In the case of a service-providing company, at least the most relevant products
required to provide the service should also be taken into consideration.
Step 4: Assess the current status of the product
In this step the goal is to get an overall view of the current performance of the product. This is a good
basis to identify the general opportunities for improvement.
Step 5: Estimate the MIPS of your product
MIPS sums up in mass (kg or tonne) units the quantity of materials (and energy in material terms)
needed for performing a specitic service by technical means. In order to estimate MIPS, data of the
different inputs into the product or service have to be gathered to allow the calculation of the material
input „from cradle to grave“. When the calculation is done, the most re-source-intensive aspects of the
life cycle (the “hot spots”) can be assessed and the results compared to the qualitative performance
assessment of step 4.
For estimating the MIPS of a product, its ecological rucksack (or material footprint) is calculated first.
This requires listing the amounts of all materials and other contributions (e.g. electricity) that have
been used for manufacturing the product and then multiplying them with their respective MI factors.
The weights resulting from the multiplication are summed up in order to achieve the total amount of
resources used for the product. If the product requires materials or other inputs also during its use
phase, these resources have to be included in the calculations. Finally, the sum is divided by the total
number of service units (see step 2) the product can deliver during its lifetime (for instance 250,000
km for a medium sized car).
Step 6: Optimise the product and implement eco-innovation
In order to make the selected product, or service, more resource efficient and to improve the benefit
provided, there are plenty of optimization options to be considered. Each life-cycle-related aspect can
be evaluated in order to check the availability and the profitability in the short, medium or long term.
WUPPERTAL INSTITUTE
RESOURCE PRODUCTIVITY IN 7 STEPS
THE 7 STEPS FOR DESIGNING ECO-INNOVATIVE PRODUCTS
15
The assessment of the material input and of the optimisation options of the product or service helps to
develop a holistic basis for implementing eco-innovation. For selecting the optimal forward options, the
training needs and the medium term financial consequences of each option need to be considered.
Step 7: Redesign the product service-oriented
The optimisation of different aspects of the life cycle helps to save money and conserve the environment. The redesign of products or the development of new kinds of services can even open totally
new markets. The result of the whole process can be an optimised product or a new additional service
to be sold together with an existing product and thus decreasing the material share in the turnover of
the company. Even a totally new kind of product-service system can be the outcome of the process
described here. Also service-providing companies can design new services that are less dependent
on material resources.
Step 1: Form a team3
Appoint a team coordinator
From the outset of the project a person is necessary to take responsibility for coordinating and implementing the eco-innovative development process. The coordinator is the most important person behind a successful programme and should be responsible for making sure the development process is
making progress towards its goals.
The tasks and responsibilities of the team coordinator should be:
•
commitment to the programme and capability of motivating people
•
taking care of the overall coordination of the project
•
managing communication between team members
•
taking care of the documentation of results
•
communicating regularly with the management about progress and results
Appoint a team
A team needs to be organized early on. Tell people in the company that you willl start the ecoinnovative development process and what is expected from them. In the case of a small business, the
team could be just the owner/operator and one or two employees. In a larger enterprise, representatives from different departments – such as research&development, maintenance, production, environment, health and safety, purchasing and transportation – as well as plant and executive managers,
should be included in the team. The advantage of doing this is – besides a broad commitment – that
different experience and technical expertise will provide a wider range of inputs and ideas on how to
measure and improve the performance.
3
This section is mainly based on The Efficient Entrepreneur Calendar Assistant (Kuhndt et al. 2001).
RESOURCE PRODUCTIVITY IN 7 STEPS
WUPPERTAL INSTITUTE
16
THE 7 STEPS FOR DESIGNING ECO-INNOVATIVE PRODUCTS
It is important to choose persons who are competent in product development, innovation, production
and marketing processes, but also those persons who are responsible for implementation and know
the internal management processes very well. Also the viewpoints of consumers should be integrated
in the work of the team.
Teamwork is very important for the eco-innovation process. Team-building activities might help in
building up cohesiveness within the group and in the whole company. It is also crucial to create and
distribute a list with the names of the leaders and the team members so that the overall structure is
clear to everyone. Other staff members should be able to know to whom to talk if they have suggestions and ideas.
Further issues to consider:
•
plan informal meetings – for instance the team can meet for coffee, lunch or dinner to discuss
the activities, achievements and problems
•
inform all employees about the team and the programme – let them know that you might need
their help during the process
•
keep people involved during the project by informing them about the results achieved during
the different stages of the programme
•
agree on the frequency and the form of communication to be used to publicise your work and
achievements (such as summaries on a public notice board)
•
start networking: find out what other industries in your area are doing
Worksheet 1: Team members
Step 2: Choose a product and determine the service it is providing4
At the beginning of the eco-innovative development process, it must be clear what the objectives are.
The aim of the analysis and evaluation should be clearly defined. This influences the product or service you are going to choose to be developed.
In order to decide, which product the company would like to improve first, it is useful to compare different products available. Analysing and comparing the economic and environmental performance of
the selected products clarifies, which product is most suitable for a start towards innovative changes.
After evaluating the aspects listed in work sheet 2.1, you sum up the score for the economic and environmental aspects in order to compare the products to each other and make the decision, which product you choose to be developed.
In the MIPS concept, the benefit a product provides is called service unit ("S") and is a key issue. Experience shows that employees may find it rather difficult at the outset to specify the principal service
4
This section is mainly based on Schimdt-Bleek & Manstein (1999), Ritthoff et al. (2002) and Schmidt-Bleek
(2009).
WUPPERTAL INSTITUTE
RESOURCE PRODUCTIVITY IN 7 STEPS
THE 7 STEPS FOR DESIGNING ECO-INNOVATIVE PRODUCTS
17
and the other service-bundle of their product. As the utility of a product is usually much less selfevident than people first believe, the team coordinator should insist in precision and ask for possible
additional service needs the product in question could fulfill.
For the eco-innovation process, the definition of the service unit also helps to develop non-material
product alternatives and innovative services. There are three ways of determining a service unit, depending on the product:
1. The principle service provided by vehicles, e.g. trucks, automobiles, and motorcycles, is measured
in kilom-eters but must also take into consideration the amount of freight or number of people transported per kilometer. The calculation of MIPS includes the total of all service units, from beginning-ofuse until end-of-use.
2. The service provided by equipment, machinery and products that have a built-in use cycle is given
for a particular number of cycles. This applies, for example, to washing machines, dishwashers,
clothes dryers, wind-up clocks, flush toilets, cement mixers, and coffee makers. For such products, the
total number of service units is counted as well, in this case the number of cycles from the beginning
to the end of the product's useful life. In addition, the amount processed per cycle must be given. For
instance, the service of a washing machine can be five kilograms of laundry per cycle. The total number of its service units is the number of loads of laundry that it can clean, e.g. 1500 loads of 5 kg.
3. For equipment, machines, products, and buildings whose duration of use is determined by the users
themselves, the duration of use is employed as the service unit, whereby the number of people benefiting from use during this time period or the capacity must also be taken into account. The capacity
of a building, e.g., is determined by the floor space and the capacity of a refrigerator is usually given in
terms of its volume.
The duration of use can be divided into individual periods of use that last different lengths of time. The
periods of use should correspond to the smallest meaningful time span for an individual instance of
use (e.g. hours for the use of vacuum cleaners, days for cut flowers, years for buildings or furniture).
Determining a service unit always also depends on what is to be compared. When comparing two or
more products, the smallest possible common service unit should be defined, for example transporting
one person for one kilometer (one person-kilometer). This allows the direct comparison of the input of
materials and energy required by different means of transportation (bus, train, automobile) to provide
this unit of service.
Not defining a service unit only makes sense under certain conditions:
•
if there is only one intermediary and unserviceable product to be calculated (e.g. a substance,
or semi-finished product);
•
when products do not need to be compared, but „only“ the process chain needs to be optimised (e.g. cement production);
•
if the products to be compared serve exactly the same purpose (e.g. two disposable cups).
Worksheet 2.1: Select a reference product
Worksheet 2.2: Determine the service unit
RESOURCE PRODUCTIVITY IN 7 STEPS
WUPPERTAL INSTITUTE
18
THE 7 STEPS FOR DESIGNING ECO-INNOVATIVE PRODUCTS
Step 3: Identify the product chain5
A diagram of the life cycle helps to provide a common understanding of the product or service that is
going to be developed. Ideally, all processes are represented in this diagram, which are necessary for
manufacture, use and disposal of the product or for the full functioning of the service in question. In
this way, an overall picture can be achieved of the processes involved. Gaps in the information are
more easily spotted. When setting out the process chain, it is advisable to select varying detailed descriptions (see also figure 2). In this way, it is easier to retain an overall impression of the whole process and simultaneously observe individual processes in detail.
The outcome of this step is a
process chain or a system of
process chains indicating which
processes are necessary for the
manufacture of products or for
providing a service, including the
preceding processing steps.
Figure 2: Example for a product chain
(Ritthoff et al. 2002)
5
Worksheet 3: Identify the product chain
The description of this step is mainly based on: Ritthoff et al. (2002)
WUPPERTAL INSTITUTE
RESOURCE PRODUCTIVITY IN 7 STEPS
THE 7 STEPS FOR DESIGNING ECO-INNOVATIVE PRODUCTS
19
Step 4: Assess the current status of the product
This step helps providing an overall view of the current performance of the product in the different
stages of its life cycle. The review of the processes and activities along the value chain allows to identify opportunities for improvement. Worksheet 4 provides a format to review the most important issues.
Points of weak performance should be considered as priorities for action, and evaluated. The preliminary opportunities for improvement can then be ranked by identifying their technical, economic and
environmental feasibility.
Worksheet 4: Assess the current status
Step 5: Estimate the MIPS of the product6
In the case of non-complex products, the MIPS calculation can be done on the basis of the material
content of the product. In this case, as a first phase a list of all materials that have been used as inputs
for manufacturing the product and of other contributions (e.g. electricity) is established. This list has to
include also the production waste of the manufacturing process because it is part of the material use
for the product although it is not present any more in the finished product. Second, the amount of each
material or other contribution is added in the list. Third, the individual amounts of the contributions are
multiplied with their respective MI factors. Fourth, the weights resulting from the multiplication of the
weights with their MI factors are summed up.
If the product is rather complex or if a service is analysed, the procedure described above must possibly be repeated (and worksheet 5.1 be copied and filled out) several times. In addition, the data may
not always be available easily so that the additional remarks below may be useful.
Compiling of data: what does the product or service consist of
The gathering of data is an important and often time-consuming step. In this stage, the necessary data
are gathered for each process identified in step 3 (see above). All data and their background should
be well documented (source, year of reference, explanatory notes, exact amounts, units, etc.). Sources of information can be:
•
Direct measurements: they give specific data and (mostly) reliable results.
•
Interviews: they often provide firsthand, invaluable experience (interviews with and/or assessments by experts).
•
Literature references: they are sometimes the only possibility of acquiring information about
procedures outside the own company.
Despite all efforts, there are often still gaps in the information, and it may be necessary to carry out
“qualified estimations“. Specialised knowledge of processes is useful for estimation. Theoretical calculations can provide important data in particular where process-engineering procedures are concerned.
6
This section is mainly based on Ritthoff et al. (2002)
RESOURCE PRODUCTIVITY IN 7 STEPS
WUPPERTAL INSTITUTE
20
THE 7 STEPS FOR DESIGNING ECO-INNOVATIVE PRODUCTS
In the case of agricultural products or heating energy consumption, it makes sense to include averages covering several years. General data reflecting a specific branch or national averages can be
used if specific data valid for the product under scrutiny is not available.
When compiling data, it is worth observing several general rules:
•
Material flows have to be stated in an appropriated weight-unit (kg, t, etc.).
•
It is important to state the unit alongside the numeric values. Also the conversion of units must
be done carefully and transparent. Many surprising results can be avoided in this way. Quantitative information without a unit is wrong.
•
The source of data should be recorded for every material, for every form of energy, for every
pre-product, etc.
•
Special information should also be recorded, e.g. additional explanations about data, data
source, etc.
After the compiling of data, one has an overall picture of the material and energetic inputs and outputs
of the individual processes used during the manufacturing of a product or service. Gaps in the information should been recognised and resolved (at least with estimates).
Calculation of the material input “from cradle to product“
The data compiled (see above) are used for these calculations. The material input (MI) is calculated
by multiplying the individual input quantities by the specific material intensities (MIT) of the inputs. MI
factors (also rucksack factors or material footprint factors) express the material intensity of the individual material and energy inputs. Average or typical MI factors have already been calculated for a number of processes, substances and products. A list of these values is displayed in the appendix or can
be downloaded from the website www.mips-online.info.
It is important to remember that the MI calculation must be done separately for each individual category of natural resources (abiotic resources, biotic resources, soil, air, water, see worksheet 5.1). The
worksheets consist of one column for the amount (e.g. 0.5 kg of cotton) of the respective material or
energy and two columns for each of the five categories. The material intensity of the materials, preproducts, energy or other inputs used is inserted in the first of the two columns (e.g. 8.6 kg/kg, which
means 8.6 kg of abiotic natural resources per kg of cotton). In the second column the contribution of
the individual input substances to the material input of the product/process is calculated by multiplying
the material intensity and the input amount (e.g. 0.5 kg of cotton x 8.6 kg abiotic resources per kg of
cotton = 4.3 kg of abiotic resources). The addition of these individual material inputs results in the material input of the whole process or product in the respective categories (see worksheet 5.1).
When the material inputs of the materials and energy used in
the product have been added together, one arrives at the
Resource consumption of a
material input of the process, intermediary or final product.
specific T-shirt (170 grams):
When calculating the intermediary steps and results, it is usually
• abiotic material
2.0 kg
better to still refer to the weight units instead of the service unit.
• biotic material
1.2 kg
The service unit is then integrated into the calculations at the
• erosion
1.2 kg
end when the MI values calculated are conversed into MIPS
• air
values (see below). The Box on the right side shows the result
• water
12.5 kg
1,480.0 kg
for a particular T-shirt when the material input per product has
been calculated.
WUPPERTAL INSTITUTE
RESOURCE PRODUCTIVITY IN 7 STEPS
21
THE 7 STEPS FOR DESIGNING ECO-INNOVATIVE PRODUCTS
The result has to be given in five different categories of resources. The five different results should not
be summed up because otherwise the result and the optimisation considerations would mainly concern water consumption. There is one exception to this: especially on the economy but also on the
product level, the values for abiotic resources, biotic resources and erosion are commonly summed up
to the so-called total material requirement (TMR).
As it can never be completely ruled out that a miscalculation has occurred somewhere, either when
gathering data or when taking measurements, or that inadequate information has been gathered, it is
wise to check particularly good-looking or particularly bad-appearing results.
When calculating the material input, the differentiation between main products and by-products can be
essential. Main products are all the products, for which the process is mainly operated. The material
input of a process is attributed to the main product, or “allocated” to the various main products usually
according to the weight shares. By-products are products that are also marketable, but for which the
process is not mainly operated, perhaps because the market price is too low, or because they accumulate as surplus. The material input of the process is not added to by-products, only the possible
additional expenditure for further processing. The question of main products and by-products takes a
central position in a MIPS or similar analysis, and attention should be paid to it.
Calculation of the material input “from cradle to grave“
The majority of products cause material inputs also during and after use. In addition to designers and
producers, also the users often influence these material inputs. Therefore, the material input of the use
phase should be defined carefully and should first be calculated separately from the production. All
assumptions made should be documented particularly well.
All processes of a product line have been drawn according to worksheet 3. The material input of the
different parts of the life cycle should be calculated in seperate calculation sheets (one or several ones
of worksheet 5.1). Worksheet 5.2 allows to sum up the system-wide material input of services or products. It is important to refer to the same quantitiy of product (e.g. one T-shirt over its total life cycle)
for all the phases included in order to achieve results that can be compared and summed up.
In the case of the T-shirt, the use phase is very important because the T-shirt must be washed and maybe ironed. The use
Resource consumption incl. the
phase could, for instance, be defined as 100 wearing-cycles of
use phase of the specific T-shirt:
abiotic material
41.5 kg
•
biotic materials
1.2 kg
•
erosion
1.2 kg
final results. When adding the material input for use phase of
•
air
the specific T-shirt mentioned earlier, the final result is shown
•
water
a T-shirt = 100 x washing + 100 x ironing. The assumptions for
•
the use phase (e.g. how many T-shirts can be washed at one
time) must be set carefully because they may greatly affect the
32.0 kg
3,700.0 kg
in the Box on the right side.
When the material input over the whole life cycle is calculated, the different parts of the life cycle and
the production process can be compared to each other. This allows to assess the “hot spots” and the
relevance of different aspects in general. On this basis, first considerations can be made in which
parts of the product chain optimisation measures would be especially effective.
RESOURCE PRODUCTIVITY IN 7 STEPS
WUPPERTAL INSTITUTE
22
THE 7 STEPS FOR DESIGNING ECO-INNOVATIVE PRODUCTS
From material input to MIPS
The relation of the material input to the service unit is achieved in this final step of the calculation. The
result of the previous stage is now applied to the service unit. The MIPS (material input per unit of
service) is reached by dividing the material input of the total life cycle by the total number of the service units (for the definition of the service unit, see step 2). The total amount of service delivered by a
product must be estimated on the basis of experience. The number of service units must be defined
carefully and in a realistic way as it greatly influences the results. It makes a difference if, for instance,
the total service performance of a car is assumed 150,000 or 250,000 kilometres.
According to the MI calculation explained above, also the
MIPS values of the specific
MIPS is recorded in five different categories (abiotic material,
biotic material, erosion, air and water). As one wearing-cycle
T-shirt (kg / wearing cycle):
was defined as a service unit of the T-shirt, the calculation of
• abiotic material 0.42 kg
the MIPS value of the result above, which refers to 100 wear-
• biotic material 0.001 kg
ing cycles, has to be divided by 100. The MIPS values for
• water
that particular T-shirt are shown in the Box on the right side.
• air
0.003 kg
• erosion
0.001 kg
With this result, a comparison can be made with a T-shirt
37.0 kg
that, for example, has an expected life span of only 20 wearing cycles. If one takes a service unit of, for example, “being clothed with a T-shirt for 5 years“, then it
is possible to compare T-shirts with different durability. A “long-life“ T-shirt has only one production
process, whereas a “short-life“ T-shirt needs to be produced several times to allow a using time of five
years. The usage-expenditures “washing and ironing“, however, remain the same.
When the MIPS is calculated, considerations can start on how to develop the product or service in an
eco-innovative way. The results calculated for a product or service can be compared to competing
solutions or to the alternative solutions developed in the following steps. However, when assessing
your own product and comparing to competitive or average products or services, make sure not to
unrealistically overestimate the product. For more thorough examinations, minimum and maximum
estimates can be carried out to provide a complete range of results.
Worksheet 5.1: Estimate the material input of your product
Worksheet 5.2: The MI of the whole production process or life cycle and MIPS
WUPPERTAL INSTITUTE
RESOURCE PRODUCTIVITY IN 7 STEPS
THE 7 STEPS FOR DESIGNING ECO-INNOVATIVE PRODUCTS
23
Step 6: Optimize the product and implement eco-innovation7
In order to make the product or service more resource efficient and to improve the benefit provided,
numerous optimization possibilities can be considered. The worksheets 6.1 and 6.2 help to identify
relevant aspects for reducing material use or for improving the service of the product. Each aspect has
to be carefully evaluated in order to check the availability and the profitability in the short, medium or
long term. During this evaluation, take also into account the results of the earlier evaluations (steps 2,
3 and 5). On the basis of this evaluation you can clarify which are the aspects of the life cycle that
provide the best chance for optimization and define targets for the future development of the product
or service.
Dematerializing a product does not mean that it must necessarily become smaller in size. Even though
this may be sensible in certain cases (e.g. a city vehicle), for instance to produce a chair that stands
only 10 cm tall would not be a reasonable product development. Thus, the task is to create a new
service delivery machine, e.g. a chair-like device, which allows to provide an at least equivalent service (sitting conveniently, safely, etc.) with a tenfold smaller consumption of natural resources from
cradle to grave. It’s also worthwhile to consider, how you as a producer can influence the resource
consumption caused by the consumer (e.g. by designing clothes that can be properly washed in less
hot or even cold water).
The use of resources can be reduced by minimising the material-intensity, avoiding harmful substances, optimising packaging, minimising waste, increasing energy efficiency, and/or minimising transportation (for details, see work sheet 6.1). Although some of the options mentioned in work sheet 6.1 may
already be familiar from earlier environmental considerations, it can be worth to recheck them, especially if they are not subject to continous improvement. In many cases, it’s a new idea to replace materials or components with high MI values (e.g. copper) by ones with smaller MI values (e.g. plastics).
This may affect notable changes in terms of production or products but can also provide huge opportunities for innovation and business.
In addition to minimising the material-intensity, the service provided can be improved by increasing
longevity, developing multifunctionality and considering the shared use of products (for details, see
work sheet 6.2). Thus, a redesigned chair may even be very similar to the original chair but could
have, for instance, a much longer lifetime.
Worksheet 6.1: Decrease the material use
Worksheet 6.2: Improve the service
7
This section is mainly based on Autio, Lettenmeier (2002) and Schmidt-Bleek, Manstein (1999).
RESOURCE PRODUCTIVITY IN 7 STEPS
WUPPERTAL INSTITUTE
24
THE 7 STEPS FOR DESIGNING ECO-INNOVATIVE PRODUCTS
Step 7: (Re-)design the product service-oriented8
Step 6 already showed that a product can be optimised not only by decreasing the material input but
also by improving the service provided. However, a successful redesign of a product towards a new
level of service-orientation is a process that requires more efforts than filling one worksheet and evaluating the results of it. Step 7 (see also figure 3) shows how this can be done and gives an example
of the surprising results of redesigning a product we all are using everyday: a refrigerator.
Phase 1: Define the problem
Identify in detail the service set that is to be
provided. In order to accomplish this task, the
underlying basic needs have to be traced back.
What is the principle service the product is providing? Which additional services the product
provides? Are there other kinds of services that
could be provided?
Phase 2: Search for possible solutions
2a) Searching for the least material-intensive
solution
Can the demand be satisfied without the development of new products, for example by applying service concepts replacing the product totally or partly?
2b) If service concepts are not possible,
search for new material solutions like new
products or infrastructures
Techniques like brainstorming, morphological
analysis or analogies may be helpful at this
stage in order to achieve a number of possible
ideas.
Phase 3: Select the realistic and resource
Figure 3: The 6 steps for eco design
productive ideas
(source: Schmidt-Bleek, Tischner 1995)
Evaluate the solutions from phase 2 in terms of
their potential for business and dematerialisation. You can use worksheets 2.1, 3 and 4 in order to
facilitate the evaluation. Eliminate apparently unrealistic and environmentally unfriendly solutions. Select the most promising of the remaining solutions from a resource efficiency point of view.
8
This section is mainly based on Schmidt-Bleek, Tischner (1995) and Schmidt-Bleek (1999)
WUPPERTAL INSTITUTE
RESOURCE PRODUCTIVITY IN 7 STEPS
THE 7 STEPS FOR DESIGNING ECO-INNOVATIVE PRODUCTS
25
Phase 4: Plan the new solutions
Detailed planning of the solutions found in phase 3 using the previously identified service (phase 1)
set as well as resource use features. The priorities of the design need to be firmly agreed upon. For
instance, there is an obvious difference between designing temporary packaging or a long-term product to increase the comfort of sleeping. The former requires emphasis on material extensive production, short functionality and a sensible option for reusability and recycling. The latter focuses on durability, quality of materials, ergonomics and modularity. It is therefore useful to identify the points that
lead to the optimisation of environmental and economical factors, for instance in a spider diagram.
It is important to see the design task as part of the system. Usually the following questions need to be
asked:
•
How can minimal material and energy use be achieved?
•
Which lifespan is reasonable, while satisfying the function?
•
Which material is best considering function and lifespan?
•
How can a sensible recyling take place?
•
How can transport be avoided?
Since some of the resulting targets will conflict with each other, numerous options should be considered in order to find an optimum solution.
Phase 5: Evaluation
In a second round of evaluation, the design drafts are compared with each other using MIPS estimates (see step 5 and worksheets 5.1 and 5.2). The most successful solution in terms of functionality
and resource efficiency will emerge. Furthermore a comparison with already existing solutions is necessary regarding in particular the material and energy intensity and other potential environmental
impacts. Care needs to be taken that important detail solutions and previously achieved optimisation
are not overlooked.
Phase 6: Start realisation or the return to step 2
In the case of positive evaluation during the comparison and after assesment of production feasability,
costs, material availabitily and the adaptations still required, the solution found can be realised. If this
is not the case, a return to step 2 is necessary in order to run through the planning process once
more.
If no better solution than the one previously found emerges, there are two options. For one the design
that is rated equally to market mainstream solution can be realised. Secondly the question could be
asked whether there is any sense in creating this product. Maybe it is more promising to refuse this
product development and to search for a more reasonable planning task in another direction.
Worksheet 7: Relevant design criteria
RESOURCE PRODUCTIVITY IN 7 STEPS
WUPPERTAL INSTITUTE
26
THE 7 STEPS FOR DESIGNING ECO-INNOVATIVE PRODUCTS
Example: FRIA, a resource efficient cooling concept for foodstuffs at home
Phase 1: Defining the Problem
The fundamental service of a refrigerator is the provision of a cool and dark place in order to keep
food and drinks fresh. This should be provided as close as possible to where these are prepared and
consumed. The challenge is to provide this service in the most eco-efficient way possible.
Phase 2: Searching for solutions
2a) Can the need of availability of fresh food and drinks in a home be satisfied without developing a
new product?
In principle yes, if everyone would have the required infrastructure and time to buy fresh food and
drinks close to home night and day or to produce them themselves. However since this is not the
case, the development of a cooling element in the home is reasonable even under ecological aspects:
we avoid waste from food that we can no longer eat.
2b) Brainstorming: new cooling concepts, just to name a few:
•
No mobile refrigerator but a built in cooling chamber with thick insulation etc. that is thoroughly
cleaned by the user before handing it over to the next user.
•
Refrigerators with drawers instead of one big door, so that the opening remains small when
taking out food and drinks.
•
During winter, outside air is sufficient as a cooling medium. During summer ice blocks that are
distributed in homes to cool food and drinks in isolated chambers can be used.
•
A see-through door, so that the contents are visible without having to open the refrigerator.
Phase 3: Selection
After a critical review in regard to the eco-efficiency potential of the ideas from the brainstorming, the
concept of the integrated cooling chamber is chosen for development. It offers the best options to save
material and energy. At the same time the following options are also considerable: exchangeable cooling technologies, leasing of the appliance, variable cooling volume, alternative materials and cooling
using external air in the winter. In order to limit the amount of text, only one possible solution concept
is followed through here.
Phase 4: Planning
How can minimal material and energy use be achieved?
By creating an extremely durable product, by especially effective insulation, by energy saving cooling
(cold external air in winter, an energy efficient cooling aggregate in summer) by the adaption of the
cooling volume to the user’s needs (compartments are controlled and switched off separately).
Which lifespan is reasonable?
A very long lifespan. When the cooling element is built into a wall, all wear and tear parts have to be
exchangeable. However the largest share of the material can remain as long as the home, in which it
WUPPERTAL INSTITUTE
RESOURCE PRODUCTIVITY IN 7 STEPS
THE 7 STEPS FOR DESIGNING ECO-INNOVATIVE PRODUCTS
27
is installed. In the case of extreme durability no fashionable design should be applied. It must be possible to integrate new technology and the external look should allow influence by the user.
Which material is required for such a lifespan?
A material that is as durable and cold, acid and alkaline resistant as possible. At the same time it
needs good thermal insulation for the inside, for example a high quality plastic. A highly heatpreserving material for insulation e.g. mineral cotton, plastic foam, cork, aero gels. A thermal insulating, robust and stable material for the alcove in the wall e.g. insulating bricks, aerated concrete slabs.
Easy cleaning and lasting good appearance (or the possibility to beautify it from time to time) are generally important.
How can the product be recycled?
The aim of durability as well as recycling only emerges at the end of the product life. In order to
achieve reasonable recycling options, the following suggestions are made: For the inside a high
quality cold, acid and alkaline thermoplastic (recyclable) should be chosen. For absorption, e.g. cork
materials out of left overs from cork producing industry can be used. For the door(s), silicon aerogels
can be used as bulk material. All other components should be dismountable, separable and exchangeable. The material variety should be reduced as much as possible. Leasing is an interesting
alterative: If the cooling unit is rented, the production firm can feed back components of the refrigerator
into the production process.
Phase 5: Evaluation
If more than one solution had been planned, they would have to be compared to each other at this
stage. In any case a comparison with the most efficient product on the market should be undertaken.
This can be done through a rough MIPS estimation. This means, the used material and energy
amounts are converted into expected service units and compared with each other. In the case of cooling appliances, the service units could be 100 l cooling volume with a performance of 1-15 degrees for
example.
Then the amount of material and energy of the entire lifespan needs to be estimated, if possible including the production and disposal. These amounts should be multiplied with the MI factors if available (see worksheet 5.1) in order to consider the material streams up to the raw material extraction
incl. the ecological rucksacks (material footprints). The amount of used energy is also converted into
mass (see step 5). Naturally, the process needs to be the same for all options. The result of this calculation is the cumulative material input expressed in tonnes or kilograms. This sum is distributed by the
service unit (see worksheet 5.2): the lifespan of the appliance multiplied by its cooling volume.
A first calculation for the cooling chamber “FRIA” shows it uses less than half the energy and only
1/6th of the resources of a conventional refrigerator (with thick insulation), in order to provide the service “cooling of food and drinks at home”.
Phase 6: Implementation or return to step 2
Since the new solution of the wall-integrated cooling chamber has a higher resource efficiency than
conventional ones, it can be realised.
RESOURCE PRODUCTIVITY IN 7 STEPS
WUPPERTAL INSTITUTE
28
References
Autio, S.; Lettenmeier, M. (2002): Ekotehokkuus – Business as Future. Yrityksen ekoteho-opas. (An
eco-efficiency guide for business. In Finnish.) Dipoli reports C, environmental education. University of
Technology, TKK Dipoli, Espoo.
Fussler C. (1996): Driving EcoInnovation. A Breakthrough Discipline for Innovation and Sustainability.
London: Pitman.
Kaiser, C.; Ritthoff, M.; Rohn, H. (2008): Wie viel Natur kostet unsere Nahrung? Ein Beitrag zur Materialintensität ausgewählter Produkte aus Landwirtschaft und Ernährung. Draft Wuppertal Paper,
Wuppertal Institute.
Kauppinen, T.; Lähteenoja, S.; Lettenmeier, M. (2008): Kotimaisten elintarvikkeiden materiaalipanos –
ElintarvikeMIPS (Material input of Finnish foodstuffs. In Finnish.). Maa- ja elintarviketalous 130, Elintarvikkeet. Available from http://www.mtt.fi/met/pdf/met130.pdf
Kotakorpi, E.; Lähteenoja, S.; Lettenmeier, M. (2008): Household MIPS – natural resource consumption of Finnish households and its reduction. The Finnish Environment 43en, Ministry of Environment,
Environmental Protection Department. Helsinki. Available from www.environment.fi/publications
Kuhndt, M,; Liedtke, C.; de Larderel, J.A.; van der Lugt, C. (2001): The Efficient Entrepreneur Calendar Assistant – Measure and improve your business performance month by month. UNEP / Wuppertal
Institute: Eco-Efficiency and Sustainable Enterprise Group.
Liedtke, C.; Welfens J. M. et al. (2008): Mut zur Nachhaltigkeit – vom Wissen zum Handeln. Didaktische Module „Weltwirtschaft, neue Weltordnung (WIN)“, Otzenhausen.
Lähteenoja, S.; Lettenmeier, M.; Saari, A. (2006): Transport MIPS – Natural resource consumption of
the Finnish transport system. The Finnish Environment 820. Ministry of the Environment. Helsinki.
Available from www.environment.fi/publications
Reid, A.; Miedzinski, M. (2008): Eco-Innovation. Final report for sectoral innovation watch. Europe
Innova. Technopolis group.
Ritthoff, M.; Rohn, H.; Liedtke, C. (2002): Calculating MIPS – Resource productivity of products and
services, Wuppertal Spezial 27e, Wuppertal, 2002. Available from www.mips-online.info
Rohn, H.; Lang-Koetz, C.; Pastewski, N.; Lettenmeier, M. (2009): Identification of technologies, products and strategies with high resource efficiency potential – results of a cooperative selection process. Resource efficiency Paper 1.3, Wuppertal 2009. Available from http://ressourcen.wupperinst.org
Salmenperä, H. (2002): The Waste Prevention Advisory Project. Life99 ENV/FIN/219 Final Report.
Edita Prima Ltd, Helsinki.
Schmidt-Bleek, F. (1994): Wieviel Umwelt braucht der Mensch? MIPS, das Mass für ökologisches
Wirtschaften, Birkhäuser, Basel, Boston, Berlin. English version (The Fossil Makers) available from
www.factor10-institute.org
Schmidt-Bleek, F. (1999): Öko-Desing, vom Produkt zur Dienstleistungsmaschine. Schriftenreihe des
österreichischen Wirtschaftsförderungsinstituts Nr. 303. Wirtschaftskammer Österreichs, Wien.
Schmidt-Bleek, F. (Ed.) (2004): Der ökologische Rucksack, Wirtschaft für eine Zukunft mit Zukunft.
Hirzel, Stuttgart, Leipzig.
RESOURCE PRODUCTIVITY IN 7 STEPS
WUPPERTAL INSTITUTE
REFERENCES
29
Schmidt-Bleek, F. (2009): The Earth. Natural Resources and Human Intervention. Haus Publishing
Ltd, London.
Schmidt-Bleek, F. et al. (1993): Special Issue, Fresenius Environmental Bulletin Vol. 2/No 8., pages
407-490, Birkhäuser, Basel, Boston, Berlin.
Schmidt-Bleek F.; Bringezu, S.; Hinterberger, F.; Liedtke, C.; Spangenberg, J.; Stiller, H.; Welfens,
M.J. (1998): MAIA. Einführung in die Material-Intensitäts-Analyse nach dem MIPS-Konzept. Wuppertal
Texte. Birkhäuser, Basel.
Schimdt-Bleek, F.; Manstein, C. (1999): Klagenfurt Innovation – Neue Wege einer umweltgerechten
Produktgestaltung. Ein Schulungsprogramm mit 50 kleinen und mittleren Unternehmen aus
Kärnten/Österreich. Alekto Verlag, Klagenfurt.
Schmidt-Bleek, F.; Tischner, U. (1995): Produktentwicklung. Nutzen gestalten, Natur schonen.
Schriftenreihe des österreichischen Wirtschaftsförderungsinstitutes Nr. 270. Wirtschaftskammer Österreichs. Wien.
Wackernagel, M.; Rees, W. 1996. Our Ecological Footprint: Reducing Human Impact on the Earth.
New Society Publishers, Gabriola Island, British Columbia.
Weizsäcker, E.U.; Lovins, A. 1997. Factor Four: Doubling Wealth – Halving Resource Use. London:
Earthscan.
Welfens, Maria J. ; Liedtke, Christa ; Schaefer, Ina ; Stengel, Oliver ; Onischka, Mathias (2008):Vom
Wissen zum Handeln : didaktische Module ; Wirtschaft - neue Weltordnung (WIN). Otzenhausen: Stiftung Forum für Verantwortung.
Further information and links:
www.mips-online.info
www.mips-online.fi
www.material-footprint.org
www.resource-footprint.org
www.wupperinst.org
ressourcen.wupperinst.org
www.nachhaltigkeit.de
www.factor10-institute.org
www.onedidit.com
RESOURCE PRODUCTIVITY IN 7 STEPS
WUPPERTAL INSTITUTE
30
Worksheets
Worksheet 1: Team members
Team members (name)
Position
RESOURCE PRODUCTIVITY IN 7 STEPS
Location
Special skills
WUPPERTAL INSTITUTE
31
WORKSHEETS
Worksheet 2.1: Select a reference product
Selection of the product or service
Product
“Product A”
“Product B”
“Product C”
Production quantity per year:
Unit:
Evaluation Criteria for the Economic Success ( 0 = low, 1 = medium, 2 = high )
Share in the total production
Share in the business success
Current Market penetration
Product Competitiveness
Acceptance from Clients
Future significance for the company
Sum
Ranking of Importance
RESOURCE PRODUCTIVITY IN 7 STEPS
WUPPERTAL INSTITUTE
32
WORKSHEETS
Product
“Product A”
“Product B”
“Product C”
Evaluation criteria for the Environmental Success ( 0 = low, 1 = medium, 2 = high )
User-friendly
Reliable
Energy-saving
Durable
Quiet (Noise)
Easily disposable
Locally produced
Easily reparable
Material efficient
Emission prevention
Transport prevention
Convenient packaging
Easy maintenance
Water saving
Sum
Ranking of importance
WUPPERTAL INSTITUTE
RESOURCE PRODUCTIVITY IN 7 STEPS
33
WORKSHEETS
Worksheet 2.2: Determine the service unit
What are the benefits the product/service is providing?
Product
“Product A”
“Product B”
“Product C”
Main benefit(s)
Additional benefit(s)
Best suitable
“service unit” for the
product/service
RESOURCE PRODUCTIVITY IN 7 STEPS
WUPPERTAL INSTITUTE
34
WORKSHEETS
Worksheet 3: Identify the product chain
Design and illustrate the life cycle of the product choosen in step 2:
-
Illustrate the most relevant phases of the life cycle (a flip chart or brown paper may provide
better space for drawing).
-
Specify relevant resources needed along the different phases: (raw) materials, energy, water...
-
Identify the most relevant people that are involved at the different stages.
-
Determine the most relevant ecological and social impacts in the life cycle / value chain.
-
Identify the impacts that different people in your company are able to influence.
WUPPERTAL INSTITUTE
RESOURCE PRODUCTIVITY IN 7 STEPS
35
WORKSHEETS
Worksheet 4: Assess the current status
Evaluate the overall performance of the product
Life cycle phase
Raw Material
extraction
Production
Use phase
Recycling /
disposal
Energy
weak performance: –, medium performance: 0, good performance: +
Amount of energy consumed
Measures taken to save
energy
Material
weak performance: –, medium performance: 0, good performance: +
Amount of material consumed
Storage of raw materials
Storage of products
Measures taken to reduce
material consumption
Water
weak performance: –, medium performance: 0, good performance: +
Amount of water used
Measures taken to save water
RESOURCE PRODUCTIVITY IN 7 STEPS
WUPPERTAL INSTITUTE
36
WORKSHEETS
Life cycle phase
Raw Material
extraction
Production
Use phase
Recycling /
disposal
Non-product output
weak performance: –, medium performance: 0, good performance: +
Amount of solid waste
Treatment of solid waste
Amount of wastewater
Treatment of wastewater
Amount of emissions and
effluents
Treatment of emissions and
effluents
Risk management and prevention
weak performance: –, medium performance: 0, good performance: +
Amount of chemicals used
Product stewardship
weak performance: –, medium performance: 0, good performance: +
Environmental information
about raw materials and
product life cycle
Other environmental issues
WUPPERTAL INSTITUTE
RESOURCE PRODUCTIVITY IN 7 STEPS
RESOURCE PRODUCTIVITY IN 7 STEPS
(h)
a)
b)
c)
d)
Unit
(e)
Amount
(d)
MI factor
(f)
kg/unit
kg/unit
kg
kg
MI
kg/unit
MI factor
kg
MI
Erosion
kg/unit
MI factor
Air
kg
MI
kg/unit
MI factor
kg
MI
Water
e) Information on units, likely in kg. For non-material products, e.g. energy
also kWh or MJ
f) Fill in the MI factors or pre-products MI in kg/kg or kg/other unit
g) Calculation of material input by multiplication of the Materiall Intensity with
input amount (kg)
h) Calculation of overall result per category by addition of part results
MI factor
Biotic
Material
MI (g)
Abiotic
Material
Name of the product
Unit of comparison, 1kg or piece of product, or specific amount of service
Fill in the name of pre-products, material or energy carrier used
Information on input amount, see (e) for unit
Name substance /
pre-product (c)
Data refer to (b):
Calculation sheet (a):
WORKSHEETS
37
Worksheet 5.1: Estimate the material input of the product
WUPPERTAL INSTITUTE
WUPPERTAL INSTITUTE
MI
unit
Abiotic
Material
a) Name of the product
b) Unit of comparisom, 1kg or piece of product, or specific amount of service
c) Fill in the name of pre-products and/or partial processes
MIPS (f)
Total amount of service units (e)
Total MI (d)
Name partial process (c)
Data refer to (b):
Calculation sheet (a):
MI
MI
unit
Erosion
MI
Air
unit
MI
Water
d) Sum up the values of the different parts.
e) Insert the amount of service-units delivered during the life cycle (see
step 2)
f) divide the MI of each resource category by the amount of service units
unit
Biotic
Material
unit
38
WORKSHEETS
Worksheet 5.2: MI of the whole production process or life cycle and MIPS
RESOURCE PRODUCTIVITY IN 7 STEPS
39
WORKSHEETS
Worksheet 6.1: Decrease the material use
Minimize the material-intensity
Target for
development
Check
Medium /Long-term
Profitable
Short-term
No
Check
Yes
Draw a cross under the most suitable option
Done already
Achievable
1. Substitute materials or components with a high MI factor by ones
with a lower MI factor
2. Save materials by simplifying the
manufacturing method
3. Do you know all the materials and
can you label them?
4. Is the weight as low as possible?
5. Is the size of the product as small
as possible?
6. Are the product´s space requirements as small as possible?
7. Are the materials and spare parts
available for many years?
8. Is the construction of the product
simple and the product durable?
9. Optimise the material use of the
production equipment
10. Optimise product storage
11. Does the user of the product
need all the features included in the
product?
12. Is the material use of the building
minimized?
RESOURCE PRODUCTIVITY IN 7 STEPS
WUPPERTAL INSTITUTE
40
WORKSHEETS
Avoid harmful substances
Target for
development
Check
Medium /Long-term
Profitable
Short-term
No
Check
Yes
Draw a cross under the most suitable option
Done already
Achievable
1. Are hazardous substances regulated by law avoided?
2. Have you avoided materials that
might cause toxic compounds in fires
(for example chlorine, bromine) or in
contact with water?
3. Have you avoided harmful emissions from material compounds of the
building?
Optimise packaging
Target for
development
Check
Medium /Long-term
Profitable
Short-term
No
Check
Yes
Draw a cross under the most suitable option
Done already
Achievable
1. Prevent packaging waste (e.g.
orders and deliveries without packaging or reuse of packages)
2. Develop the recyclability of packaging (e.g. simple structure, recyclable materials, material labels)?
3. Are disposable packagings made
of low-backpack materials and are
they as small and light as possible?
WUPPERTAL INSTITUTE
RESOURCE PRODUCTIVITY IN 7 STEPS
41
WORKSHEETS
Minimise waste
Target for
development
Check
Medium /Long-term
Profitable
Short-term
No
Check
Yes
Draw a cross under the most suitable option
Done already
Achievable
1. Can the loss of material be reduced and throughput rates of the
internal circulation minimized?
2. Will the company take back the
products after the use for reusing the
components or recycling the materials?
3. Can the materials be reused internally (packagesm wastes, water,
dissolvents)?
Increase Energy Efficiency
Target for
development
Check
Medium /Long-term
Profitable
Short-term
No
Check
Yes
Draw a cross under the most suitable option
Done already
Achievable
1. Minimise energy consumption
2. Use energy with low MI value
3. Integrate automatic power saving
functions into the product
4. Optimise the power sources of the
product (e.g. plug-in, chargeable,
electric motor)
RESOURCE PRODUCTIVITY IN 7 STEPS
WUPPERTAL INSTITUTE
42
WORKSHEETS
5. Optimise the energy use of the
factory and the equipment
6. Reduce the energy consumption of
cooling and heating
7. Reduce the energy consumption of
air-conditioning and lighting
8. Minimise the energy consumption
during the use of the product
Minimise transportation
Target for
development
Check
Medium /Long-term
Profitable
Short-term
No
Check
Yes
Draw a cross under the most suitable option
Done already
Achievable
1. Consider transport alternatives
with low resource MI values
2. Reduce internal transport distances
3. Reduce transport distances from
suppliers
4. Reduce average transport distances to your clients
5. Reduce the average distance to
end users
6. Reduce transport distances to
recycling enterprises
7. Can local products be favoured?
8. Improve the use of transport capacity (e.g. by renting capacity, utilising return transportation, transporting
full loads)
WUPPERTAL INSTITUTE
RESOURCE PRODUCTIVITY IN 7 STEPS
43
WORKSHEETS
Worksheet 6.2: Improve the service
Increase the longevity of the product or components
Target for
development
Check
Medium /Long-term
Profitable
Short-term
No
Check
Yes
Draw a cross under the most suitable option
Done already
Achievable
1. Develop methods to estimate the
service life of the product
2. Can the product be designed timeless?
3. Increase the durability of the product
4. Prevent the wearing away of
materials and components before it’s
necessary
5. Optimise the surface material of
the product (corrosion resistant,
weather resistant, washable)
6. Design the product more userfriendly in order to prevent misuse
7. Can cleaning be made easier for
the end user of the product?
8. Can maintenance be made easier?
9. Consider the dismanteling of the
product
10. Can a modular structure make
the dismanteling, repairing and
uppgrading easier, quicker and feasible without special tools?
RESOURCE PRODUCTIVITY IN 7 STEPS
WUPPERTAL INSTITUTE
44
WORKSHEETS
11. Are spare parts available also in
the long run?
12. Can separate components be
improved easily also in the future?
13. Can the reuse of components
from used products be increased in
new products?
14. Can the capacity of the product
be improved with additional parts and
features?
15. Do the new parts fit into the old
products?
16. Can you improve the instructions
for use, storing and maintenance?
17. Is the longevity of buildings ensured by covering the materials and
structures during the building and by
letting the materials and structures
dry properly?
(Question for building sector)
18. Are suppliers demanded to offer
lasting products and sufficient instructions for use, storing and maintenance?
Multifunctionality
Target for
development
Check
Medium /Long-term
Profitable
Short-term
No
Check
Yes
Draw a cross under the most suitable option
Done already
Achievable
1. Standardise important components
to make them compatible with components in other products?
WUPPERTAL INSTITUTE
RESOURCE PRODUCTIVITY IN 7 STEPS
45
WORKSHEETS
2. Can the product be combined with
other products?
3. Can the product be used for a
variety of purposes?
4. Is the design of the reusable components optimum (subcomponents,
casing, etc.)?
5. Can the product be used for other
purposes after the end of its original
use (cascade use)?
6. Is the building easily expandable,
is it possible to combine and divide
rooms?
(Question for building sector)
Shared use and selling services
Target for
development
Check
Medium /Long-term
Profitable
Short-term
No
Check
Yes
Draw a cross under the most suitable option
Done already
Achievable
1. Can products be rented or leased
instead of selling?
2. Can maintenance services (e.g.
regular check, maintenace or updating) and advice services for use (like
cleaning services combined to cleaning equipments) be sold?
3. Can the product be manufactured
to suit also to shared use?
4. Could it be possible to sell the
mere service instead of the product in
the future?
RESOURCE PRODUCTIVITY IN 7 STEPS
WUPPERTAL INSTITUTE
46
WORKSHEETS
Worksheet 7: Relevant design criteria
Criteria for product design
Relevant Criteria
Assess your product in terms of the criteria
1. More practical use
2. Adequate reliability
3. Long durability and availability
4. Ergonomic adaptation
5. Technical and formal self-reliance
6. Connection with the surroundings /
environment
7. Environment friendlyness
8. Use-visualization
9. High quality design
10. Mental and spritual stimulation
WUPPERTAL INSTITUTE
RESOURCE PRODUCTIVITY IN 7 STEPS
47
Glossary
Abiotic materials are all materials taken directly and unprocessed from nature and are not renewable
in hundreds of years, e.g. ores in a mine, “unused extraction of raw materials”, excavation of earth and
sediment, peat, etc.
Air is accounted for in the MIPS concept, as long as it is changed chemically or physically (aggregate
state). Most of the air consumption calculated in the MIPS concept is oxygen used in combustion processes.
Auxiliary materials are substances that are involved in a process, but only fulfil a subsidiary function,
e.g. solvents, cleaning agents.
Average products represent a class of products. Single specific products can differ distinctly in their
properties from average products.
Basic, working and building materials are materials or substances that are added in a process (“inputs”), and have been manufactured in previous processes, for that purpose (e.g. steel, PVC or glass).
Biotic materials are all organic materials taken directly from nature, before processing, (e.g. grass,
trees, fish, fruits, cotton).
Carbon footprint is a measure of the impact our products or activities have on the environment, and
in particular climate change. It relates to the amount of greenhouse gases produced through burning
fossil fuels for electricity, heating, transportation etc. The carbon footprint is a measurement of all
greenhouse gases we individually produce and has units of tonnes (or kg) of carbon dioxide equivalent. (See http://www.carbonfootprint.com/carbonfootprint.html)
COPS (COst Per unit of Service) refers to the monetary costs for a defined unit of utility which is rendered either by a person with the help of technology, or by machines directly (for example, dispensing
cash). All services generated in the technosphere require products, energy and infrastructures.
Cycles (material cycles) are natural and technical material flows that return to their original state at
their point of origin. There are no technical cycles without energy and material losses.
Dematerialization is the radical reduction of natural material resources for satisfying human needs by
technical means. Neither environmental nor economic sustainability can be attained without dematerialization.
Earth movement encompasses all movements of earth in agriculture and forestry, all ploughed land
and erosion.
Eco-efficiency means the delivery of competitively priced goods and services which satisfy human
needs and produce quality of life while progressively reducing ecological impacts and resource intensity, through the life cycle, to a level at least in line with the earth's estimated carrying capacity
(Frank Bosshardt, Business Council for Sustainable Development, 1991).
Eco-industry is that part of industry which conducts eco-innovation in a pro-active and verifiable
manner, including businesses that provide new solutions for legal standards, norms, and requirements.
RESOURCE PRODUCTIVITY IN 7 STEPS
WUPPERTAL INSTITUTE
48
GLOSSARY
Eco-innovation means the creation of novel and competitively priced goods, processes, systems,
services, and procedures that can satisfy human needs and bring quality of life to all people with a lifecycle-wide minimal use of natural resources (material including energy carriers, and surface area) per
unit output, and a minimal release of toxic substances. (Reid, Miedzinski 2008).
Eco-intelligent (also eco-efficient) services satisfy needs in a purposeful manner, using technical
means with the highest possible resource productivity (materials, water, space), and involving a minimum of toxic materials.
Ecological backpack: see “ecological rucksack”.
Ecological footprint: The ecological footprint measures how much biologically productive land and
water an individual, population or activity requires to produce all resources it consumes and to absorb
the waste it generates using prevailing technology and resource management practices. The ecological footprint is usually measured in global hectares. Because trade is global, an individual or country's
Footprint includes land or sea from all over the world. Ecological footprint is often referred to in short
as Footprint. (See http://www.footprintnetwork.org/en/index.php/GFN/page/glossary/#EFstandards).
Ecological rucksack denotes the invisible material burden (the “subsidy by nature”), or the total input
of natural resources required by any product “from the cradle to the point of sale”. In a sense, the ecological rucksack parallels the monetary price of products in physical terms. It is an important measure
for comparing functionally equivalent goods from different competitors at the point of sale (e. g. tools
or cars).
Ecosphere is the natural environment of human beings.
Eco-system services and functions (Life-supporting functions of the ecosystem) are essential for all
life on earth. Humans cannot survive without them. They include the availability of liquid fresh water
and unpolluted air; of a range of elements, minerals, and metals; of a high level of biodiversity; of
edible plants and animals; of productive seeds, sperms, and soil; of a moderate temperature range on
the surface of the earth; and of the protection against radiation from outer space. Services of nature
cannot be generated by technology on any noticeable scale. Services of nature are indivisible and
cost-free available to all humans around the globe. If they could be traded on the market, they would
obviously carry an infinitely high price. Services of nature are vulnerable to human economic activities.
The root cause for these changes is the indiscriminate use of natural resources. Already today, consequences thereof can be observed, e.g. massive soil erosion, water shortages, desertification, loss of
species, and climatic changes, including increasing catastrophic events like hurricanes and floods.
Efficiency: The effectiveness, with which means are introduced into an existing process in order to
attain a defined output (see, in contrast: productivity).
Eight Ton Society is the envisioned worldwide civil society, in which the average yearly consumption
of material natural resources (without water) will be less than 8 tons per capita.
Emissions are material contaminations of the air, noises, vibrations, light, heat, radiation, and similar
energetic or material phenomena, which come from a facility, a vehicle or piece of equipment.
Environment encompasses animals, plants, microorganisms, water, air, and soils as well as all the
interactions between them.
Environmental capital: The sum total of all natural resources that can be used in the technosphere to
produce wellfare. This term is somewhat peculiar for non-economists because the ecosphere cannot
be used for economic transactions without changing its eco-systemic services and functions. These
WUPPERTAL INSTITUTE
RESOURCE PRODUCTIVITY IN 7 STEPS
49
GLOSSARY
changes are rarely predictable with scientific methods, and can seldom be measured, stimulated or
qualified, nor can they be localized in all cases.
Environmental media are soil, water, and air.
Environmental stress potential (also environmental damage, impact or pressure potential) is the
capacity of a process, activity, good or service to cause environmental change. It is approximated by
MIPS.
Exhaust air or waste gases are carrier gases of solid, liquid or gas emissions.
Externalized environmental effects (externalities): Unintended and typically negative (cost-inducing)
effects of goods, processes, systems, services, and behaviors, which become effective via environmental media. Frequently, the costs of such external effects must be borne by the general public.
An external effect of smoking, for example, is health problems of non-smokers due to smoke-filled air;
an external effect of fossil fuel use is damage to historic buildings on account of air pollution. Environmental externalities are known and have been quantified/monetarized in only relatively few cases,
where cause and effect links were clearly established.
Factor 10 is the strategic economic goal of generating human well-being in industrialized countries
with (on average) ten times less natural material resources by the middle of the 21st century than was
the case at the turn of the century.
Factor 4 is the global goal of achieving a fourfold increase in global resource efficiency by the middle
of the 21st century by halfing resource use and doubling welfare. This requires at least Factor 10 in
the industrialized countries. Factor 4 can also be seen as an interim step on the way to Factor 10.
Factor X and Factor Y are variations on Factor 10, with the purpose of indicating the unavoidable
uncertainty in individual cases regarding how far dematerialization can and must go.
General data refer to product classes, to typical or average products.
Goods are machines, products, equipment, objects, means of transport, buildings, infrastructures
(also including works of art and musical instruments).
Greenhouse effect: Sunlight falls on the earth's surface, where it is transformed into warmth and
partly reflected towards outer space. Some constituent parts of the earth's atmosphere, especially
water vapor and carbon dioxide, are involved in the process of capturing part of this warmth. If this
natural greenhouse effect did not exist, the earth's average temperature would not be fifteen degrees
centigrade, but as cold as minus eighteen or nineteen degrees centigrade. Mankind is currently changing the relative amounts of important greenhouse gases in the atmosphere. As a result, the manmade greenhouse effect is added to the natural greenhouse effect, changing the earth's climate.
Infrastructure: all production means and machinery, that are necessary for the production of goods,
are summarised here, as infrastructure (e.g. roads, schools, transportation and information networks).
Industrial products are machine-processed foods, medicines, infrastructures, machines, equipment,
tools, instruments, vehicles, and buildings produced with technical means in the technosphere.
Input includes everything that is employed in a process. In the MIPS concept, the inputs are materials
(including energy), measured in kg or tonnes.
Intermediary products are products that are manufactured in the process chain, but that, for the
moment, do not yet perform a service, or, are not yet of use, (e.g. a car battery, in regard of a car).
RESOURCE PRODUCTIVITY IN 7 STEPS
WUPPERTAL INSTITUTE
50
GLOSSARY
Life-cycle-wide (“from cradle to cradle“) involves all life phases of a product or infrastructure for establishing its environmental impact potential; i.e. from the extraction of raw materials, through the production and use, application, to the recycling and disposal. Only “cradle to cradle“ analyses can yield
credible answers when seeking to assess the environmental quality of things.
Main products are commercial products, that are produced in a process, and for which the process is
mainly operated.
Material footprint denotes the invisible material burden (the “subsidy by nature”), or the total input of
natural resources required by any product “from the cradle to the point of sale”. In a sense, the material footprint parallels the monetary price of products in physical terms. It is an important measure for
comparing functionally equivalent goods from different competitors at the point of sale (e. g. tools or
cars). (See also www.material-footprint.org)
Material Input (MI) encompasses all material inputs, which are necessary for the manufacture of
goods or for the provision of a service, expressed in mass units (kg or t).
Material Intensity (MIT) is the material input in relation to a unit of measurement. MI factors are used
to express material intensity of production inputs (materials or energy), expressed in mass unit of resources per unit of input (e.g. kg/kg or kg/kWh).
Maximum estimations are carried out, by recording the maximum possible material inputs. They are
carried out when complete calculations are not possible, and when one wishes to take, as a basis, the
maximum resource use, as a comparison.
MI factors are called the material intensity values for the single/individual materials or modules, expressed in mass unit of resources per unit of input (e.g. kg/kg or kg/kWh).
Minimum estimations are carried out, by recording the minimum possible input. They are carried out,
when complete calculations are not possible, and when one wishes to take, as a basis, the minimum
resource expenditure, as a comparative size.
MIPS is the abbreviation for Material Input Per Service unit. It is the life-cycle-wide input of natural
resources (MI), which is required to fulfill a human desire or need (S) by technical means. The material
input is expressed in mass units, the unit of the services depends on the case. MIPS = MI / S
Modules contain data about the pre-products or the pre-services, which are needed and used frequently. It concerns average values. Modules are relevant for individual regions, branches etc, (transport module, electricity module, etc.)
Natural resources in the MIPS-concept include all naturally available abiotic and biotic raw materials
(minerals, fossil and nuclear energy carriers, plants, wild animals, etc.), flow resources (wind, geothermal, tidal and solar energy), air, water, and soil.
Operating materials are materials, which are necessary for the functioning of a process, but do not
go into the product (e.g. cleaning agents and cloths).
Output encompasses everything that results from a process, a procedure or a behavior. Output need
not be material, enjoyment and pleasure can also be outputs. Emissions and waste are also called
undesired outputs.
Passenger (or person) kilometres: the number of (carried) passengers multiplied by the number of
kilometres covered equals the number of Passenger kilometres.
Pre-product: Products, which are the input of another process.
WUPPERTAL INSTITUTE
RESOURCE PRODUCTIVITY IN 7 STEPS
51
GLOSSARY
Process is the procedure (machine, method, use), during which the inputs are converted into outputs,
by means of an action. By which, at least one intended output is produced, (e.g. shaped metal sheet,
a chemical or the transport of goods).
Process chain is the representation of the process system, with the individual processes and their
links.
Process picture is the schematic representation of the in- and outputs of a single process.
Product is a usable result of a technical or natural process.
Production is the creation of goods by technical or natural means.
Production intensive are products, whose manufacture causes greater resource consumption than
their use.
Production technologies are machinery, plants and tools etc., which are necessary for the execution
of a process, but are not used in the process, itself.
Productivity: yield of production of goods or services. While efficiency describes the effectiveness of
the use of the available means, productivity measures the result, in other words, the yield of products
and services, regardless of which means were employed to obtain the result.
Resource footprint: see “ecological rucksack”.
Resources in the MIPS-concept are materials, water and surface area.
Resource productivity is the amount of goods and services that can be produced per unit of input of
resources (materials, water, surface area, energy). The reciprocal of MIPS (service per material input
= S / MI ) is a measure for resource productivity.
Scope of data (also scope of validity of data) indicates in which framework, and under what conditions, the data can be used and applied.
Service (technically provided service) is the purpose-oriented fulfillment of a need by technical means.
All man-made services require the use of technical infrastructures, equipment, vehicles, and buildings.
Services can be rendered by humans or by machines. From the end consumers' point of view, a provided service service is the ability of goods to satisfy needs or provide utility.
Serviceable products are goods that were produced for use or consumption and that can provide
utility by being used (for example, robots, sundials, automobiles, mousetraps, spoons, oil paintings).
There are also non-serviceable goods, such as bars of gold or aluminum profiles.
Side products are commercial goods, that are produced during a process, but for which the process
is not mainly operated.
Sustainability has several fundamental dimensions: economic, social, ecologic, and institutional. The
ecological dimension determines the corridors for economic and social developments because the
availability of natural resources is limited and the vital services of the ecosphere can be diminished or
annihilated, but not replaced, by human activity. Sustainability is the capacity of the economic system
to provide prosperity for all and, at the same time, to secure the natural, social, and economic foundations that this capacity depends on for the future. Achieving sustainability necessitates overcoming
current challenges today and not shifting the burden to the shoulders of future generations.
Sustainable economic activity is service-oriented and knowledge-intensive. It can be approximated
but not necessarily reached fully. It creates prosperity comparable to the level attained in industrialized
RESOURCE PRODUCTIVITY IN 7 STEPS
WUPPERTAL INSTITUTE
52
GLOSSARY
countries at the beginning of the twenty-first century with extremely little use of natural resources (material, water, space). Dematerialization is a necessary, but not sufficient condition for approaching
sustainability.
Technosphere: the environment created by mankind, using natural resources and energy.
Tonne kilometre: the amount of transported goods (expressed in tonnes), multiplied by the number of
kilometres, equals the number of tonne kilometres. Tonne kilometres are usually the basis for calculating the material input of goods transportation.
Total Material Flow (TMF): see Total Material Requirement (TMR).
Total Material Requirement (TMR) is the sum of the abiotic and biotic raw materials and of erosion
used for a certain purpose. An an economy level, it is a robust economic indicator to measure the
annual total amount of natural materials – including rucksacks – which are processed through an
economic area by technical means. The term TMR is also used on the product level when the abiotic
and biotic material input and the erosion are summed up to one value.
Use-intensive are products, the use of which causes greater resource exploitation than the manufacture.
Utility is a measure for the capacity of goods to satisfy people's needs. MIPS is the ecological price of
utility.
Waste: are substances or products, which can either be recycled or needs to be disposed of.
Waste water is all water, that is soiled, dirtied or polluted by domestic, agricultural, commercial and
industrial use, furthermore, rain water, as well as water seeping through the ground, from drainage
and seepage pipes, and that arrives in the draining ditch via the drainage system.
Water rucksack: according to the MIPS concept, any intervention into the natural water cycles by
technical means is calculated as water consumption. The water rucksack includes the irrigation water
used for agriculture but no other water transpirated by cultivated plants.
Water footprint: The water footprint is an indicator of water use that looks at both direct and indirect
water use of a consumer, producer, community or business. Water use is measured in terms of water
volumes consumed, evapotranspirated and/or polluted.
WUPPERTAL INSTITUTE
RESOURCE PRODUCTIVITY IN 7 STEPS
53
MI factors
The sources for the following MI factors are www.mips-online.info, Kaiser et al. (2008), Kauppinen et al. (2008),
and Lähteenoja et al. (2006). These sources also contain additional and more detailed information.
Material,
product, etc.
specification
abiotic
material
Metals
Aluminum
biotic
material
water
air
erosion
reference
area
Material intensity [kg/kg]
primary
secondary
37,00
1.047,70
10,87
Europe
0,85
30,74
0,95
Europe
35,28
996,84
10,37
Europe
cast alloy
8,11
234,13
2,93
Europe
Europe
wrought alloy
average
18,98
539,21
5,91
Lead
estimated
15,60
n.s.
n.s.
World
Ferrrochromium
low carbon, 60% Cr
21,58
504,86
5,07
World
high carbon, 75% Cr
13,54
221,36
2,30
World
Ferro manganese
high carbon, 75% Mn
16,69
193,76
2,23
World
Ferro molybdenum
estimated
748,00
1.286,00
9,50
World
Ferro nickel
25% Ni
Gold
estimated
Copper
50% primary, 50% secondary
secondary
primary
Nickel
Platinum
60,33
615,88
9,73
World
540.000,00
n.s.
n.s.
World
179,07
236,39
1,16
World
2,38
85,51
1,32
World
348,47
367,16
1,60
World
141,29
233,34
40,83
320.300,00
193.000,00
13.800,00
Germany
World
7.500,00
n.s.
n.s.
World
Silver
estimated
Steel
plate, electrogalvanised,
blast furnace
9,42
75,38
0,65
World
rebar, wire rod, engineering steel; electric arc
furnace route
1,47
58,76
0,52
World
14,43
205,13
2,83
Europe
Europe
Stainless steel
18%Cr; 9%Ni
17%Cr; 12%Ni
17,94
240,33
3,38
8.486,00
10.958,00
149,00
Germany
electrolytic
22,18
343,69
2,28
Germany
high-grade zinc,
(secondary) IS
19,36
86,54
42,29
Germany
mix
21,76
305,12
8,28
Germany
Tin
import-mix germany
Zinc
Material intensity [kg/kg]
Basic materials
Alumina
Al2O3;Bayer-process
7,43
58,62
0,45
Germany
Borax
synthetic
5,75
13,02
0,43
Germany
Boric acid
B2O3*3H2O
7,61
16,15
1,08
Germany
Diabase
crushed
1,42
6,13
0,05
Germany
grinded
1,65
10,28
0,08
Germany
Diamonds
estimated
5.260.000,00
n.s.
n.s.
Fluorspar
CaF2
2,93
7,92
0,06
Europe
Gypsum
grinded
1,83
10,30
0,06
Germany
20,06
306,25
5,70
Canada
5,69
n.s.
n.s.
Graphite
Potassium salt
estimated
RESOURCE PRODUCTIVITY IN 7 STEPS
South Africa
World
WUPPERTAL INSTITUTE
54
Lime
MI FACTORS
Limestone / dolomite;
crushed
1,44
5,56
0,03
Germany
caustic lime; crushed
3,12
12,76
0,10
Germany
calcium hydroxide
2,46
11,65
0,09
Germany
3,05
2,46
0,08
Germany
China clay
Sand
quartz sand
1,42
1,43
0,03
Germany
Soda
heavy, synthetic, Na2CO3
4,46
27,72
1,02
Germany
Rock salt
NaCl
1,24
2,29
0,02
Germany
electrical power
(public network)
4,70
83,06
0,60
Germany
electrical power (industrial
customer generation)
2,67
37,92
0,64
Germany
Energy and fuels
Electricity
Material intensity [kg/kWh]
electrical power, EU
1,72
32,53
0,44
EU25
electrical power, all OECDCountries
1,55
66,73
0,54
World
Energy and fuels
Material intensity [kg/kg] including combustion air
(except steam and crude oil)
Crude oil
Steam
16 bar; 3.117 MJ/kg
1,22
4,28
0,01
Germany
0,39
1,61
0,24
Germany
4 bar; 3.060 MJ/kg
0,39
1,60
0,24
Germany
Lignite
Hu: 8.8 MJ/kg
9,68
9,25
0,68
Germany
Diesel oil
Hu: 42.8 MJ/kg
1,36
9,70
3,22
Germany
Natural gas
Hu: 41 MJ/kg
1,22
0,50
3,64
Germany
Heating oil
lightly; Hu 42,8 MJ/kg
1,36
9,45
3,21
Germany
heavy; Hu 40,7 MJ/kg
1,50
11,45
3,05
Germany
Hard coal
Hu; 29.4 MJ/kg
2,36
9,12
2,36
Germany
German import Mix;
Hu: 27.5 MJ/kg
2,11
9,12
2,66
Germany
17,15
3,66
2,09
Australia
1,47
6,70
2,15
Germany
Hu: 26.37 MJ/kg
Hu: 27 MJ/kg
Hu: 23.25 MJ/kg
5,06
4,58
1,85
World
Hu: 24.9 MJ/kg
7,70
1,86
1,97
South Africa
Hu: 25.2 MJ/kg
6,11
3,11
2,00
USA
Hu: 21.1 MJ/kg
1,64
3,85
1,67
China
Hu: 23.44 MJ/kg
7,40
9,99
1,89
Russia
Hu: 24.9 MJ/kg
2,15
12,88
2,00
Poland
Hu: 20 MJ/kg
1,75
9,60
1,60
Ukraine
Hu: 27.83 MJ/kg
15,32
3,25
2,21
Canada
Hu: 24.1 MJ/kg
5,97
5,31
1,91
UK
Hu: 20.8 MJ/kg
4,90
4,31
1,65
India
Material intensity [kg/kg]
Organic Chemicals
Acetone
3,19
18,72
1,89
Germany
Acrylnitril
2,56
93,23
5,05
Europe
Allyl chloride
6,93
140,71
2,44
Europe
Aluminium chloride
8,61
110,63
1,15
Ammonia
1,85
10,11
5,04
Europe
Liquid ammonium
nitrate urea (LAU)
fertilizer
1,43
58,01
0,99
Germany
Aniline, aminobenzen
C6 H7 N
8,21
148,83
3,83
Germany
Benzene
C6 H6
4,32
28,23
2,19
Germany
WUPPERTAL INSTITUTE
RESOURCE PRODUCTIVITY IN 7 STEPS
55
MI FACTORS
Bisphenol-A
5,00
88,45
2,52
Europe
Chlorine
3,84
100,90
1,09
Europe
7,07
50,84
3,57
Germany
Dimethylform-amide
1,53
5,29
3,72
Europe
Diphenyl-methane
diisocyanate
5,20
440,84
3,89
Europe
15,42
319,47
5,68
Europe
Ethylene benzol
4,45
30,53
2,19
Europe
Ethylene
3,89
25,76
1,96
Germany
Ethylene glycol
2,90
133,46
2,29
Europe
Formaldehyde,
mehtanal
1,11
29,98
0,98
Germany
Diammonium
phosphate
fertilizer
Epichlorhydrin C3H5ClO
Fumaric acid
from Maleic anhydride
Urea
Isobutyral-dehdes
7,28
313,70
0,75
Europe
3,23
140,15
0,90
Europe
3,45
44,60
1,82
Germany
2,21
7,88
1,07
Europe
11,32
10,62
0,07
Germany
5,48
39,25
2,19
Germany
Maleic acid
5,01
216,68
3,54
Europe
Maleic acid anhydrite
2,80
118,29
0,59
Europe
Methane
1,38
1,99
3,90
Europe
Methanol
1,67
4,46
3,87
Europe
Pottassic fertilizer
60% K2O
Calcium ammonium
nitrate
fertilizer (mixture of CaCO3
and NH4NO3)
(Mono)-ammonium
phosphate
fertilizer
7,36
50,57
3,68
Germany
Sodium hydroxid
NaOH
2,76
90,31
1,06
Europe
Naphtha
1,69
13,88
0,05
Germany
Neopentyglycol
1,81
15,77
0,96
Europe
Nitrobenzene
4,95
93,13
2,70
Germany
Pentane
1,98
109,69
2,15
Europe
Phenol
3,19
18,72
1,89
Germany
Phosgene
4,95
125,25
0,61
Germany
Poyacrylonitrile
14,22
351,19
10,52
Europe
Polyether polyole
8,27
465,92
3,51
Europe
Polymethylene
di(phenylisocyanate)
9,53
167,36
2,90
Germany
Propylene oxid
4,61
24,24
3,32
Germany
Propylene
1,74
87,55
1,49
Europe
P-xylole
5,82
50,79
2,94
Europe
Pyrolysis gasoline
3,87
25,35
1,96
Germany
Soot
2,58
7,13
2,54
UK
Hydrochloric acid
37%
3,03
40,66
0,38
Germany
Oxygen
liquid
4,66
1.084,61
2,50
Germany
gas
2,58
137,02
1,70
Europe
H2SO4
Sulfuric acid
0,25
4,10
0,70
Germany
Sorbitol
1,10
22,75
1,61
Germany
Starch
1,07
22,09
1,56
Germany
liquid
0,81
33,18
1,22
Europe
gas
0,19
7,66
1,05
Europe
5,91
41,96
2,86
Germany
Nitrogen
Styrene
RESOURCE PRODUCTIVITY IN 7 STEPS
WUPPERTAL INSTITUTE
56
MI FACTORS
Terephthalic acid
4,85
141,71
2,58
Europe
Toluole diisocyanate
8,56
490,58
4,09
Europe
3,44
23,26
1,29
Germany
Triple superphosphate
fertilizer
Waterglass
solution 35%
1,18
6,30
0,29
Germany
Hydrogen
chlorine-alkali-electrolysis
2,52
93,69
0,70
Europe
Material intensity [kg/kg]
Plastics
ABS
3,97
206,89
3,75
Europe
13,73
289,88
5,50
Europe
2,51
164,04
2,80
Europe
EPS granulate
2,50
137,68
2,47
Europe
high impact; HIPS
2,78
175,26
3,15
Europe
5,51
921,03
4,61
Europe
Epoxy resin
Polysterene
general purpose; GPPS
Polyamid
Polycarbonate
Polyethylene
6,94
212,19
4,70
Europe
foil
3,01
167,60
1,84
Europe
high density HD
2,52
105,85
1,90
Europe
low density LD
2,49
122,20
1,62
Europe
linear low density LLD
2,12
162,13
2,80
Europe
6,45
294,23
3,72
Europe
yarn
8,10
278,00
3,73
World
resin
5,11
188,04
2,89
Europe
granulate
2,09
35,80
1,48
Europe
Polyethylene terephtalat
Polyeste
Polypropylene
injection moulding
4,24
205,50
3,37
Europe
18,81
456,90
6,37
Europe
6,31
505,06
3,56
Europe
foam
7,52
532,39
3,42
Europe
foam
17,34
679,38
11,57
Europe
bulk
3,47
305,29
1,70
Europe
5,70
146,00
1,65
Germany
Polytetrafluor-ethylene
Polyurethane
Polyvinyl chlorid
foam
Styrol butadien rubber;
SBR
Material intensity [kg/kg]
Construction materials
Concrete
1,33
3,42
0,04
Germany
Cellulose flake
1,71
6,74
0,27
Germany
Roofing tile
2,11
5,30
0,07
Germany
portland cement
3,22
16,94
0,33
Germany
blast-furnace cement
2,22
21,31
0,25
Germany
Sheet glass
float glass
2,95
11,65
0,74
Germany
Man made mineral
fibres
glass wool
4,66
45,98
1,80
Germany
rock wool
4,00
39,72
1,69
Germany
Granite
slabs, grinded, polished
1,92
3,36
0,59
Germany
Cement
B25
Sandlime brick
Perlite
Cellular concrete
1,28
2,02
0,01
Germany
estimated
2,04
6,77
0,04
Germany
3
2,51
14,98
0,26
Germany
3
2,37
12,15
0,23
Germany
6,71
152,65
2,80
Europe
lightweight clay brick
(PS)/solid clay brick
2,11
5,74
0,05
Germany
lightweight clay brick (saw
dust)
1,97
5,42
0,04
Germany
400 kg/m
600 kg/m statically reinforced
Foam glass
Brick
WUPPERTAL INSTITUTE
RESOURCE PRODUCTIVITY IN 7 STEPS
57
MI FACTORS
Material intensity [kg/kg]
Others
Aramid fibre
37,03
19,57
6.814,00
2,74
Europe
Cotton
USA west
8,60
Container Glas
primary; special applications
3,04
17,06
0,72
Germany
53% cullet
1,72
13,36
0,58
Germany
88% cullet
0,87
10,93
0,48
Germany
chipboard
0,68
0,65
18,42
0,29
Germany
plywood
2,00
9,13
23,56
0,54
Germany
douglas fir wood (baked;
cut timber)
0,63
4,37
9,24
0,17
Germany
spruce wood (baked; cut
timber)
0,68
4,72
9,40
0,16
Germany
pine wood (baked, cut
timber)
0,86
5,51
9,97
0,13
Germany
fibreboard (average
density)
1,96
32,86
0,48
Germany
E-glass
6,22
94,49
2,09
Europe
Wood
Fibre glass
Carbon fibre
Leather
Paper and board
5,01
USA
R-glass
10,84
296,25
2,01
Europe
PAN
58,09
1.794,90
38,00
Europe
61,12
2.411,47
33,39
Europe
chrome tanned
515,00
2,80
Europe
vegetable tanned leather
12,30
9,20
12,60
446,00
2,40
Europe
bleached
9,17
2,56
302,99
1,28
Europe
not bleached
8,94
2,38
268,06
1,29
Europe
chipboard
0,30
0,22
24,90
0,07
Europe
corrugated cardboard
1,86
0,75
93,56
0,33
Europe
sulphate pulp
(bleached)
2,61
2,64
112,10
0,41
Europe
sulphate pulp
(unbleached)
3,09
2,42
93,27
0,52
Europe
sulphite pulp
(bleached)
4,38
2,64
185,21
0,66
Europe
sulphite pulp
(unbleached)
2,59
2,42
141,87
0,41
Europe
Water
Material intensity [kg/kg]
Drinking water
Deionized water
2,90
940,39
estimated
0,01
1,30
0,00
Germany
0,08
2,20
0,01
Germany
Material intensity [kg/tkm] (only transport, excl. Infrastructure)
Transport
Sea going vessels
average
0,01
0,05
0,01
Germany
Canal boats
average
0,02
0,16
0,04
Germany
Cargo trains
average
0,08
3,59
0,03
Germany
Truck transport of cargo
average
0,22
1,91
0,21
Germany
Transport
Material intensity [kg/tkm] (transport incl. infrastructure)
from Finland to Middleand Southern Europe
0,12
0,70
0,10
Finland
from Finland to outside
Europe
0,08
0,60
0,10
Finland
short distance
4,70
189,00
3,40
Finland
from Finland to Middleand Southern Europe
1,10
33,60
1,40
Finland
from Finland to outside
Europe
0,60
9,10
1,30
Finland
Cargo trains
average
0,54
15,30
0,02
Finland
Truck transport of cargo
average
0,52
6,30
0,09
Finland
Sea going vessels
Air cargo
RESOURCE PRODUCTIVITY IN 7 STEPS
WUPPERTAL INSTITUTE
58
MI FACTORS
Food and agricultural products
Material intensity [kg/kg]
Winter wheat
0,46
1,98
3,11
0,12
1,10
Germany
Wheat flour
0,78
2,97
8,62
0,20
1,65
Germany
Wheat bread
1,68
2,12
42,85
1,76
1,08
Germany
Oat
without drying
0,36
2,53
1,13
0,07
1,74
Germany
Winter barley
without drying
0,29
2,03
2,33
0,08
1,37
Germany
Beer
1,50
0,31
280,00
0,51
0,09
Finland
Beet sugar
8,58
12,63
53,73
4,70
1,15
Germany
Fodder beet
0,05
1,35
0,27
0,01
0,05
Germany
Grain peas
0,80
1,53
9,43
0,15
2,76
Germany
Grain maize
0,89
2,06
25,01
0,21
0,90
Germany
Silage maize
0,06
1,10
0,36
0,01
0,67
Germany
Potatoes
0,10
1,06
0,39
0,01
0,22
Germany
Cucumber
unwashed
7,00
1,00
570,00
4,00
0,00
Finland
Apple
1,00
1,00
7,00
0,01
0,32
Finland
Strawberry
1,00
1,00
18,00
0,20
0,63
Finland
3,15
2,54
51,04
0,73
6,12
Germany
8,30
20,00
170,00
0,56
2,20
Finland
Field bean
0,67
1,07
9,09
0,13
0,74
Germany
Soy
0,96
1,10
10,68
0,19
4,00
Germany
Soy oil
6,47
6,09
104,53
1,38
22,22
Germany
Colza oil
from winter forage rape
Margarine from colza oil
Eggs
1,15
1,98
28,56
0,25
0,93
Germany
Chicken
flesh
8,99
6,67
344,03
2,30
6,64
Germany
Beef meat
33% from milk cow
6,53
27,05
269,95
1,68
9,55
Germany
2,57
6,89
62,33
1,01
6,51
Germany
farmed
2,70
4,70
270,00
0,83
0,17
Finland
0,15
2,46
4,42
0,04
0,80
Germany
Pork meat
Rainbow trout
Unskimmmed fresh milk
Butter
3,42
56,87
105,75
0,79
18,43
Germany
Cream quark
40% FDM
0,72
12,03
21,59
0,17
3,90
Germany
Double cream fromage
frais
60% FDM
0,84
14,24
25,51
0,20
4,62
Germany
Whipping cream
28% fat
0,70
11,47
21,14
0,16
3,72
Germany
0,03
0,42
0,76
0,01
0,14
Germany
Whey
Whey powder
23,15
7,28
929,79
6,22
2,36
Germany
Skim milk powder
16,45
15,26
653,07
4,42
4,95
Germany
0,19
2,75
5,61
0,05
0,89
Germany
Fish flour
1,30
5,00
19,28
3,08
n.s.
Germany
Chicken compound feed
0,77
1,43
12,53
0,18
1,42
Germany
Yoghurt
nature
Wilted silage
bale, from field
0,05
1,25
0,77
0,01
0,25
Germany
Field-dried hay
bale, from field
0,05
1,35
0,40
0,02
0,27
Germany
WUPPERTAL INSTITUTE
RESOURCE PRODUCTIVITY IN 7 STEPS
Wuppertal Institute for
Climate, Environment and Energy
P.O. Box 100 480
42004 Wuppertal
Germany
www.wupperinst.org
ISBN: 978-3-929944-80-8


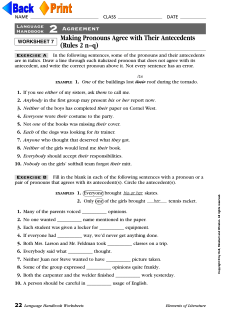

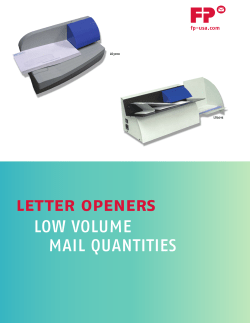
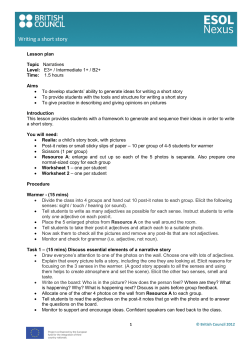


© Copyright 2026