
Long-Term Immigration Projection Methods: Current Practice and How to Improve It
Long-Term Immigration Projection Methods: Current Practice and How to Improve It Neil Howe and Richard Jackson with contributions by Jennifer Blakeslee and Keisuke Nakashima UNCORRECTED DRAFT CSIS Global Aging Initiative* June 2006 * This report was originally published as a Center for Retirement Research at Boston College working paper in February 2006 (CRR WP 2006-3). The research was supported (in part) by the Center pursuant to a grant from the U.S. Social Security Administration funded as part of the Retirement Research Consortium. The opinions and conclusions are solely those of the authors and should not be construed as representing the views of the Social Security Administration or any agency of the federal government. ABOUT THE CSIS GLOBAL AGING INITIATIVE The CSIS Global Aging Initiative (GAI) explores the fiscal, economic, social, and geopolitical implications of population aging and population decline. CSIS established GAI in 1999 to raise awareness of the challenge and to encourage timely reform. Over the past six years, GAI has pursued an ambitious educational agenda—undertaking cutting-edge research projects, publishing high-profile reports, and organizing international conferences in Beijing, Berlin, Brussels, Paris, Tokyo, Washington, and Zurich that have brought together world leaders to discuss common problems and explore common solutions. To learn more about the Global Aging Initiative, please visit its website at http://www.csis.org/gai. © 2006 by Neil Howe and Richard Jackson. All rights reserved. Center for Strategic and International Studies 1800 K Street, NW, Suite 400 Washington, DC 2006 202-887-0200 www.csis.org/gai ACKNOWLEDGMENTS The authors would like to thank the Social Security Administration Office of Policy and the Center for Retirement Research at Boston College for their support. They would also like to acknowledge the contributions of the series of talented research assistants and interns who worked on the project: Jennifer Blakeslee, Erin Haley, Keisuke Nakashima, Rebecca Strauss, and Carlos Tovar. The authors also owe a debt of gratitude to the members of the CSIS Working Group on Long-Term Immigration Projections, whose many insights and suggestions helped improve the current report. They are particularly indebted to the five members who prepared working papers—Jan Hofmann, Wolfgang Lutz, Douglas S. Massey, Anna Maria Mayda, and Oded Stark. A complete list of working group members is included in an appendix to the report. An annex volume containing the working papers can be downloaded from the Global Aging Initiative website at www.csis.org/gai. iii iv TABLE OF CONTENTS EXECUTIVE SUMMARY ............................................................................................ vii INTRODUCTION..............................................................................................................1 CHAPTER 1. INVENTORY OF CURRENT PROJECTION PRACTICE ................8 Global Projections....................................................................................................9 United States ..........................................................................................................11 European Countries................................................................................................14 Other Developed Countries....................................................................................18 CHAPTER 2. AN OVERVIEW OF IMMIGRATION THEORY..............................21 Six Theoretical Frameworks ..................................................................................21 Neoclassical Framework.............................................................................22 World Systems Framework .......................................................................23 New Economics Framework .....................................................................24 Social Network Framework .......................................................................25 Dual Labor Market Framework .................................................................26 Policy Framework ......................................................................................27 The New Empirical Literature................................................................................29 CHAPTER 3. TOWARD A DRIVER-BASED PROJECTION MODEL..................31 Setting the Stage ....................................................................................................31 Defining Types of Migration .................................................................................33 Assessing Migration Data ......................................................................................38 The Basic Migration Model: Structure and Assumptions......................................41 Built-in Demographic and Age-Structure Drivers.................................................47 Modeled Demographic and Foreign-Born Stock Drivers......................................50 Modeled Economic and Development Drivers......................................................54 All Other Modeled Nonpolicy Drivers ..................................................................62 Modeled Destination-Country Policy Drivers .......................................................66 Modeling with Eras and Country-Specific Effects ................................................71 Projecting Voluntary Gross Emigration and Net Involuntary Migration ..............73 Taking the Next Steps............................................................................................76 CONCLUSION ................................................................................................................78 APPENDIX: CSIS WORKING GROUP ON LONG-TERM IMMIGRATION PROJECTIONS ...............................................................................................................81 BIBLIOGRAPHY OF CITED SOURCES....................................................................83 v REFERENCE BIBLIOGRAPHY ..................................................................................95 I. Projection Practice..............................................................................................95 II. Immigration Theory ........................................................................................100 III. Empirical Migration Research .......................................................................112 IV. Data Sources for Selected Model Drivers .....................................................115 V. Miscellaneous..................................................................................................116 vi EXECUTIVE SUMMARY In recent years, policy experts worldwide have come to understand the importance of demographic projections in their efforts to think strategically about long-term challenges, from national security to retirement security. Much progress has been made in improving the fertility and longevity modules of the demographic projection puzzle. Little progress, however, has been made in dealing with immigration. This is a cause for concern. We are now entering a new demographic era in the developed countries in which immigration is likely to be the dominant component of the population projection puzzle for the foreseeable future. On a yearly basis, net immigration now accounts for roughly two-fifths of total population growth in the United States and nearly nine-tenths of total population growth in Western Europe. In this demographic environment, the wide range of uncertainty about future immigration levels can generate a similarly wide range of long-term population outcomes. The spread between the “low” and “high” immigration variants for the U.S. Census Bureau projection for the national population in 2100, for example, is 417 million—from a total of 438 million in the low variant to a total of 854 million in the high variant. The purpose of the present report is threefold: to assess the state of immigration projection practice at projection-making agencies worldwide; to explore theoretical insights and empirical research about immigration; and to discuss how these insights and research could be used to create a superior projection model. The first chapter (Inventory of Current Projection Practice) describes the current projection methods of leading national and international projection-making institutions, from the U.S. Census Bureau and the U.S. Social Security Administration to the United Nations and the World Bank. The inventory makes clear that official projections are largely ad hoc and judgmental. When describing how they make assumptions about future immigration, most agencies offer little more than a vague reference to “expert opinion,” or else they note that their assumptions reflect “historical experience.” Few if any official projections use immigration assumptions that are justified by any explicit reference to a theory of how or why immigration happens. In the second chapter (An Overview of Immigration Theory), we outline the broad theoretical frameworks that could help improve projection practice. The poverty of explanatory models in the current practice of immigration projection contrasts sharply with the abundance of theories proposed and discussed by experts in a variety of social science and policy disciplines. We identify six theoretical frameworks, each having its own unique history and literature: the neoclassical, the world systems, the new economics, the social network, the dual labor market, and the policy frameworks. We also survey the growing body of empirical literature on efforts to statistically test the power of these theories in explaining historical trends in international migration. The third chapter (Toward a Driver-Based Projection Model) describes our proposed framework for a long-term immigration projection model. The model is “driver-based,” meaning that immigration is projected based on observed associations vii between immigration behavior and other conditions. Examples include multinational trends in population, wages and living standards, trade and capital flows, age distribution, education, urbanization, and market orientation or “globalization.” The model is designed to project net migration flows into a large developed country like the United States. The model includes the following driver modules: (1) Built-in demographic drivers. The main built-in driver is the age-structure of the population in origin countries. (2) Modeled demographic drivers. These include the rate of growth in the youth or prime migration-age population in origin countries and the size of the foreignborn stock and the aged dependency ratio in destination countries. (3) Modeled economic and development drivers. These include differentials in wages and living standards between origin and destination countries, differentials in educational and skill levels, and various development indicators, including absolute poverty levels, rates of urbanization, and trends in transportation and communication. (4) Other modeled nonpolicy drivers. These include other factors that may influence incentives to migrate, such as trends in income inequality, trade, technology, and the environment. (5) Modeled destination-country policy drivers. These include factors that may influence public opinion about immigration in destination countries—chiefly, the size and skill level of the immigrant stock relative to native-born workers and voters. The driver modules are introduced in descending order of the presumed certainty of their future values. This order allows projection-making agencies to establish a threshold between more and less plausible conjectures about future changes in independent variables. An agency may want to incorporate demographic modeling into its forecasts without venturing further, in which case it would limit itself to modules (1) and (2). Or it may want to incorporate plausible or best-guess estimates for future economic and development trends, in which case it would include module (3). Or it may want to test and experiment with a full range of social and political drivers and include modules (4) and (5). Developing a driver-based projection model could have enormous payoffs. Reliable projections of the size, age structure, and national origin of the population are crucial to understanding and preparing for many of tomorrow’s most important policy challenges. Demographic trends are at the heart of the current debate over the sustainability of pay-as-you-go retirement and health-care systems in the developed countries. They also directly affect the long-term prospects for economic and living standard growth—and will help shape the geopolitical contours of the twenty-first century in ways that could prove even more fateful. In addition to its potential for viii improving long-term projections, the model’s scenario-building capability could help policymakers better understand a wide array of consequential policy questions, from the long-run impact of trade liberalization on immigration from Mexico to the potential impact of political liberalization on immigration from China. Although the driver-based model we outline could be constructed in stages, with new modules being added over time, building even a minimal functioning model would be a major undertaking that may require bringing together immigration theorists, empirical researchers, and projection experts for a multi-year project. In all likelihood, the project would need to be undertaken by some official agency that already has the responsibility for making long-term projections—or perhaps, as the cooperative effort of several such agencies. These organizations are in the best position to make productive use of the results. And it is their “clients”—namely the public and government policymakers—who have the most to gain from a successful outcome. ix x INTRODUCTION In recent years, policy experts worldwide have come to understand the importance of demographic projections in their efforts to think strategically about long-term challenges, from national security to retirement security. Attention to these projections has in turn inspired a growing effort to study and improve the models, methodology, and assumptions that underlie them. Much progress has been made in improving the fertility and longevity modules of the demographic projection puzzle. Little progress, however, has been made in dealing with cross-border migration or (more specifically, from the point of view of most developed countries) immigration. A projection of population must rest, in part, on a projection of immigration. Yet most official immigration projections, both in the United States and abroad, continue to rely on ad-hoc assumptions based on little theory and virtually no definable methodology. This lack of progress is a cause for concern. For roughly half a century, from the 1930s to the 1980s, it was widely observed that immigration rates were at historically low levels. Even where rates were rising over time (in many developed countries after the early 1960s), it was widely believed that national policy could control them. Compared to the challenge of projecting fertility and longevity, therefore, the challenge of projecting immigration seemed unimportant and attracted little attention. Now the tide has turned. Net immigration rates in most developed countries have recently surged, more than doubling in the United States and Western Europe as a whole since the 1960s and showing few signs of changing direction. On a yearly basis, net immigration now accounts for roughly two-fifths of total population growth in the United States and nearly nine-tenths of total population growth in the EU-15. (See Figures 1 and 2.) One team of demographers, Stephen Castles and Mark J. Miller, claim the world is entering a new “age of migration” (Castles and Miller 1993). According to Douglas S. Massey, “In retrospect, it is clear that the end of the Cold War was a watershed event in the history of global migration, ending a policy regime that had held world migration rates at artificially low levels for more than forty years” (Massey 2003, 20). The upward surge has occurred, moreover, during a period in which both public opinion and immigration policy in most developed countries have grown increasingly restrictive. With undocumented or “illegal” entry growing faster than any other type of immigration, policy experts are no longer confident that total immigration is still subject to the effective control of national policy. The range of plausible assumptions regarding long-term immigration rates is therefore widening. Unbounded by any consensus projection method, this widening range can now generate a similarly widening and often dramatic variety of long-term population outcomes. The spread between the “low” and “high” immigration variants for the U.S. Census Bureau projection for the national population in 2100 (U.S. Census Bureau 2000), for example, is 417 million—from a total of 438 million in the low variant to a total of 854 million in the high variant. (See Figure 3.) This is a very significant difference from almost any policy perspective. Indeed, the spread between the Census Bureau’s low and high immigration assumptions has a larger impact on total projected 1 U.S. population in 2100 than the spread between its low and high fertility and mortality assumptions combined. Figure 1: Natural Increase versus Net Immigration in the United States, in Millions, Decade Averages, 1961-2004 2.5 Millions of People 2.0 1.5 1.0 0.5 0.0 1961-1970 1971-1980 1981-1990 Natural Increase 1991-2000 2001-2004 Net Immigration Source: U.S. Census Bureau (various years), Wilmoth (2003), and authors' calculations Figure 2: Natural Increase versus Net Immigration in the EU-15, in Millions, Decade Averages, 1961-2004 2.5 Millions of People 2.0 1.5 1.0 0.5 0.0 1961-1970 1971-1980 1981-1990 Natural Increase Source: Eurostat (2005a and 2005b) and authors' calculations 2 1991-2000 Net Immigration 2001-2004 Figure 3: Census Bureau Projections of the U.S. Population under Different Migration Assumptions, in Millions, 1998-2100 950 850 Millions of People 750 650 High Migration Series US Population in 2100 under Different Migration Assumptions, in Millions High Series: Middle Series: Low Series: Zero Series: 854 571 438 377 Middle Series 550 450 Low Migration Series 350 250 150 1998 2000 2010 2020 2030 2040 2050 2060 2070 2080 2090 2100 Source: US Census Bureau (2000) Long-term immigration trends are attracting serious new attention from many official agencies. Given Europe’s low fertility rate and the likelihood that immigration will make the difference between population growth or decline in many countries, Eurostat, the European Union’s (EU) statistical unit, in 1994 began commissioning a series of research studies to improve understanding of the trends underlying immigration (Salt and Singleton 1995). In 2000, the United Nation’s Population Division released Replacement Migration: Is It a Solution to Declining and Ageing Populations? in an effort to assess the potential role of immigration in alleviating the fiscal and economic challenges facing many developed countries. In 2003, the Technical Panel on Assumptions and Methods of the U.S. Social Security Advisory Board conducted its first in-depth examination of the immigration assumptions in the long-term projections used by the Social Security trustees and made important recommendations. The purpose of the present report is threefold: to assess the state of immigration projection practice at projection-making agencies; to explore theoretical insights and empirical research about immigration; and to discuss how these insights and research could be used to create a superior projection model. The first chapter (Inventory of Current Projection Practice) describes the current projection methods of leading national and international projection-making institutions worldwide. The second chapter (An Overview of Immigration Theory) scans the wide and varied array of “theoretical frameworks,” which thus far have seldom if ever been incorporated into projection method. The third chapter (Toward a Driver-Based Projection Model) sketches out in some detail our proposed framework for an immigration projection model. 3 The focus of the report is limited to long-term projection—that is, to projecting immigration beyond 10 or 15 years into the future. In recent years, policy experts have developed and refined many quantitative approaches to short-term immigration forecasts (for example, by using time-series trends or by identifying business cycle correlations) that are not useful in the longer term. Near-term forecasts often depend critically on the accuracy of recent immigration data and the lagged impact of current policy (backlogged caseloads, family reunions, asylum events, etc.)—issues that are usually unique to each nation and each year. These issues are of less importance in longer-term projections. When immigration experts collect data on current or past immigration, they may take an interest in many types of information, from distributions by sex, age, and national origin to family status, educational level, and work experience. Efforts to project immigration are typically much less ambitious. Most limit themselves to projecting total numbers: gross in-migration and out-migration or, in many cases, net immigration alone. A few also attempt to project changes in distribution by age and national origin. The scope of our inventory is limited to current practice. The scope of our model-building, however, is necessarily broader and does urge that immigration be tracked by a wider range of attributes (nationality, age, educational level, and possibly others), not as an end in itself, but as a means of improving the accuracy of the projection totals. To better understand the report’s organization—and to anticipate some of its recurring themes—it helps to focus up front on four basic choices that confront any effort to develop or improve immigration projection methods. The first choice is whether to constrain the projection method in any way to official national policy. This may not be an issue for academics and private-sector research organizations, but historically it has been a major consideration for the publicsector agencies that develop and publish most national immigration projections. Simply put, governments do not like to announce futures that contradict current law or official policy objectives. It is no accident that until the 1980s, when rising illegal immigration forced policymakers to reconsider, nearly every national government simply equated projected immigration with current official policy. The trustees of the U.S. Social Security system did not consider “other-than-legal” immigration until 1988 (Social Security Administration 1997). Even today, it is hard for many governments to acknowledge behavior that deviates from law. Eurostat, in its 2002 survey of national projection methods in the EU, reported that only one country (Portugal) admitted that “they made any allowance for illegal immigration in their forecasts” (Eurostat 2002b). Until new projection methods were introduced in 2005, Canada’s official long-term projections were explicitly “based on national policy” (Statistics Canada 2001). Most migration experts worldwide now argue that national policy should only be regarded as one variable among many when making projections—and a growing number of national governments appear to agree. Some seem to be taking illegal migration into account in their projections even if they do not say so publicly, and some are allowing for the possibility not just of immigration that violates current law but of future changes in law itself. One key finding of the 2003 U.S. Social Security Technical Panel is that 4 “legislative limits regarding legal immigration, and their associated enforcement policies, are endogenous to broader social and economic processes, and thus may change in future years” (2003 Technical Panel, 31). Although it might seem obvious that projections extending decades into the future should accept the possibility of legislative change, it remains unclear how broadly the Social Security trustees are supposed to interpret their mandate to make projections based on “current law.” Canada’s position, interestingly, is that the possibility of future legislative change is reflected in its “high” and “low” projection variants (Statistics Canada 2001). Assuming a projection method is free from the constraint of official policy (and can allow for both future enforcement failure and policy change), the second basic choice is whether projections will be based on an explicit explanatory theory or model of immigration. Few if any long-term projections are. When describing how they make assumptions about future immigration, many agencies offer little more than a vague reference to “expert opinion,” or else they say that their assumptions reflect “historical experience.” But no assumption, even a “no-change” assumption, can be turned into a projection without first confronting difficult methodological considerations. Does no change imply future immigration equal to the current year? Or the last decade average? Or the last 50-year average? Does it mean an unchanged number or unchanged rate? If a rate, should it be a rate per capita or per employed person or per age group? Unchanged rates in the origin country as well as the destination country? All projection-making agencies must deal with such questions. More often than not, however, the decision process takes place behind what Dennis A. Ahlburg and Wolfgang Lutz call a “veil of secrecy” (Ahlburg and Lutz 1998, 6). Explanatory models or theories come in many types. Some rely at least in part on qualitative assessments of past trends. Others are strictly quantitative and rely on tested time-series models. Many, perhaps most, theoretical models are based on a presumed association between immigration behavior and other conditions. Examples of such conditions include multinational trends in population, wages and living standards, trade and capital flows, age distribution, education, urbanization, environmental change, and market orientation (“globalization”). A few models posit a causal link between conditions observable today (for example, public attitudes toward immigration) and conditions in the future (for example, immigration policy change, which in this theory is presumed to follow with a lag). What all models have in common is an explanatory argument that can be objectively evaluated and in some manner tested against historical evidence. To the extent that an agency chooses to ground its projections on a theory or model, it necessarily faces a third basic choice. How does it select among models? And if it relies on more than one, how does it weigh the relative importance of competing models? This choice is especially critical for immigration projections because there are such an abundant variety of immigration theories to choose from, many of them originating in very different academic disciplines (from economics and demography to sociology, political science, and comparative anthropology) that rarely speak to each other. Massey concludes, “At present, there is no single, coherent theory of international migration, only a fragmented set of theories that have developed largely in isolation from 5 one another, sometimes but not always segmented by disciplinary boundaries” (Massey et al. 1993, 432). Even integrating the experiences of different nations can be difficult. According to Jeannette Money, the literature on immigration “tends to be country specific rather than comparative, making it difficult to sort between idiosyncratic factors and more generally applicable theories” (Money 1997, 686). The new field of futures studies, which attempts to evaluate and improve methods of investigating the future (including the use of simulations, scenario building, causal modeling, relevance trees, and cross-impact analysis) may offer some creative ways to distill disparate insights into a single projection method. Delphi, for example, is a formal and iterative process of survey and discussion often used in the private sector to bring large groups of experts toward a consensus estimate. Public-sector agencies seldom use such formal processes in developing demographic projection methods; indeed, even when they do explain why they arrive at a given method, which is rare enough, they almost never explain how they arrive at it. One conspicuous exception is the International Institute for Applied Systems Analysis (IIASA), which has developed a multistage “expert- and argument-based forecasting” process to assess the merits of theories (“arguments”) offered by large panels of experts in arriving at the assumptions needed for demographic projection (Lutz 1996; Lutz et al. 2004). In the absence of a formal projection model, the use of the Delphi method for gathering expert consensus might be the only projection method available. It is our view, however, that it is possible to build a formal model that brings different immigration theories together in a systematic and quantitative fashion. The Delphi method would therefore be unnecessary, except perhaps (following IIASA’s example) to arrive at an expert consensus on the underlying drivers and assumptions. A final choice confronting projection-making agencies is whether to assign any likelihood to their assumptions and outcomes. At present, few agencies formally incorporate probabilities into their projection methods. Instead, most create a range of scenarios or variants, each containing a “high” or “low” set of assumptions, and these variants mechanically generate single sets of outcomes. In effect, the traditional variant projection is simply a giant if-then proposition. In recent years, however, growing numbers of experts have begun experimenting with probabilistic demographic projections (sometimes referred to as “forecasts”), and one agency, IIASA, uses an elaborate probabilistic method to generate likelihood values for all of its demographic outcomes, including global migration. Interest in this approach, whetted perhaps by the growing power of computers and statistical software, is clearly on the rise. The argument in favor of the probabilistic approach is that it compels experts to assign likelihood weights at the assumption stage and then manages those weights properly through to the output stage. It also encourages experts to think through the simultaneous or lagged correlations among all of the projection variables—a task that, say supporters of the probabilistic method, enables them to avoid the sorts of logical inconsistencies that plague “variant” projections. (Example: Does it make sense to pair a low total fertility rate with a low immigration rate in the same “low variant” of a nation’s long-term population projection?) Supporters of the traditional variant approach respond 6 that not enough can be known about the probability distributions of long-term variables to quantify them. The probabilistic approach, they argue, adds a spurious precision that masks rather than clarifies the critical role played by the chosen assumptions. This caveat may be especially appropriate for immigration assumptions, since there remains such great uncertainly about how to project a central trend, much less about calculating the likelihood of deviating from that trend. However projection-making agencies handle these four basic choices, they have thus far achieved little progress in developing an immigration projection method that most experts regard as even minimally reliable. As our inventory of current practice makes clear, few official projections use immigration assumptions that are justified by any explicit reference to a theory of how or why immigration happens. “[S]ince no single compelling theory of migration exists, projections are generally based on past trends and current policies” (O’Neill et al. 2001, 250). In this respect, immigration is regarded as uniquely disadvantaged among demographic assumptions. According to Lutz et al., “[I]t is more difficult to forecast future migratory streams than future trends in fertility and mortality” (Lutz et al. 2004, 34). “Among the three major components of national population change…,” concludes a recent report of the U.S. Census Bureau, “international migration is the component for which demographic science offers the least to future projections” (U.S. Census Bureau 2000, 15). Yet if the main theme of the first part of this report is how little progress has yet been made, the main theme of the second and third parts is how much progress might be achievable if the abundance of available explanatory insights about immigration could somehow be consolidated and harnessed. “A variety of theoretical models has been proposed to explain why international migration begins,” writes Massey. Moreover, “…they cannot be assumed, a priori, to be incompatible” since they “conceptualize causal processes at such different levels of analysis—the individual, the household, the national, and the international” (Massey et al. 1993, 432-433). According to a recent Eurostat report, “By now, causes of international migration are well studied and there is more or less agreement with regard to the most important factors determining migration flows between countries. Relatively few attempts have been made, however, to link these theoretical considerations with empirical data” (Eurostat 2002a, 99). The implied message, perhaps, is that more such “attempts” should be made. The 2000 Committee on Population Projections report by the U.S. National Research Council offers similar grounds for optimism. Although “the limitations of migration projections are not easy to remedy” in the short term, it suggests, “a longer-term program of data collection and the appropriate use of theory to build dynamic models of migration may have some potential eventually to produce greater accuracy” (Bongaarts and Bulatao 2000, 177-178). Although experts would surely debate just how much ground there is for optimism, nearly all would agree that agencies can do better than they are now doing. Since demographic projections require some immigration assumption, abandoning the effort is in any case not an option. As Michael S. Teitelbaum puts it simply if enigmatically, “Projecting immigration is impossible, but unavoidable” (personal communication with authors). 7 Chapter1 INVENTORY OF CURRENT PROJECTION PRACTICE The inventory of current projection practice presented here covers major international projection-making agencies, as well as national projection-making agencies in the United States and a selection of other developed countries. The focus is on longterm immigration assumptions—what they are, how they are derived, and how they are justified.1 A few general observations will help orient the reader. Many agencies project net immigration directly without projecting its components: gross immigration and emigration. Among the agencies surveyed here, net immigration is almost always projected as a level, as is gross immigration when projected separately. The only major exception is Canada. In contrast, emigration, when projected separately, is sometimes projected as a level, sometimes as a rate. In the latter case, it is usually assumed to be a fixed share of the “at-risk population”—that is, a country’s foreign-born stock. There is considerable variation in how projection-making agencies handle current immigration policy. Most make at least some allowance for it, especially in the near term. A few explicitly build their projections around it—the case with the U.S. Social Security Administration, and, until its latest projections, Statistics Canada. And a few, like the Federal Statistical Office of Germany, explicitly reject it as a useful guide to long-term (or even near-term) immigration trends. Spain’s National Statistics Institute, contemplating the huge and unexpected surge in migration to Spain that began in the late 1990s, goes so far as to talk about the “inherent clandestine nature of immigration” (National Institute of Statistics 2001, 10). When projections are not based on current policy, they are generally based on “historical experience” or “expert opinion.” Projection assumptions sometimes reflect judgments about how future demographic, economic, or political developments may affect long-term migration flows—and these judgments may in turn be informed by some explanatory theory of immigration. No agency, however, has attempted to quantify these relationships and incorporate them into a long-term projection model. A number of projection-making agencies assume that net immigration will remain constant throughout the projection period. Most of the rest assume that it will be constant once it reaches a “target” or “ultimate” level. Almost none—the U.S. Census Bureau is a notable exception—projects that net immigration levels will vary throughout the projection period. Most agencies publish high and low immigration variants that bracket their central or “best estimate” variant. Although there is considerable interest in probabilistic forecasting among academic demographers, only two projection-making agencies included in this inventory (IIASA and Statistics Netherlands) take this approach. 1 To avoid encumbering the text, references in this chapter are limited to special studies and direct quotations. Please see the Projection Practice section of the Reference Bibliography at the end of the report for a complete (agency by agency) list of the sources consulted in preparing the inventory. 8 As the inventory makes clear, there is a growing interest among agencies in developing better projection methods. Thus far, however, most of the attention has been focused on improving near-term projections—through better data collection, crosscountry harmonization of definitions, time-series analysis of historical trends, and studies of past forecasting errors. The process of setting long-term immigration assumptions remains almost entirely ad hoc and judgmental. GLOBAL PROJECTIONS We begin the inventory by reviewing immigration projection methods at the major agencies producing global population projections. There are four: the United Nations, the World Bank, the International Program Center at the U.S. Census Bureau, and the International Institute for Applied Systems Analysis in Austria. Global population projections, and especially global immigration projections, must overcome enormous data and definitional hurdles. Projection-making agencies therefore make simplifying assumptions. They usually project net immigration rather than its components—and until recently, they often ignored migration altogether. United Nations Population Division The United Nations Population Division produces the most widely cited set of global population projections. The projections, which are published in its World Population Prospects series, are revised every two years. The latest projections, the 2004 Revision, were released in February 2005 and cover the period 2005 to 2050. Periodically, the UN also publishes longer-term projections that extend its regular projection series. In 2004, it released a special set of projections through the year 2300. In developing immigration assumptions, the UN begins by looking at “recent” experience, a timeframe that may vary considerably depending on data availability. In some countries, it projects that net immigration will continue throughout the projection period at close to its recent average. In other countries, where recent experience is deemed to be unusual, net immigration is trended from its current level to an ultimate level that is generally reached within 10 to 20 years. The UN makes these ad hoc adjustments in consultation with experts from national projection-making agencies. Countries that have recently sent or received large numbers of refugees constitute a special case. The UN projects that refugees will return to their home country within 5 to 10 years, after which net immigration is assumed to return to zero—unless the country in question has a well-established tradition as a country of immigration origin or destination. Although the UN has been making population projections since the 1950s, it has only recently begun to pay much attention to projecting international migration. For many years, the UN assumed that net immigration in most countries would be zero— partly because immigration is “less amenable to being reliably projected” than other demographic variables (UN Statistics Division 2004) and partly because, so long as fertility remained high, leaving it out did not have much effect on population growth rates in most countries. As recently as the 1998 Revision, the UN projected that net immigration would be zero in 50 countries throughout the projection period; in 103 others, it assumed that net immigration would rise or fall to zero during the period. Even 9 today in its special long-term projections, the UN makes the radically simplifying assumption that, beyond 2050, all international migration ceases. World Bank The World Bank has prepared global population projections since 1978. The projections are updated annually and published in summary form in the bank’s World Development Indicators. Detailed data tables are available from HNPStats, the online database of the Health, Nutrition, and Population Division of the Human Development Network at the World Bank. The latest projections cover the period 2000 to 2090. Unlike the UN, the World Bank makes no attempt to project country-specific trends in international migration. It simply assumes that net immigration in every country will steadily rise or fall until it reaches zero. Zero net immigration is attained in most countries by the 2030s and everywhere by the 2040s, including traditional origin and destination countries like Mexico and the United States. The World Bank’s published descriptions of its projections offer no rationale for its immigration scenario. A number of projection-making agencies, however, including the UN and the U.S. Census Bureau, calculate illustrative zero net migration scenarios in order to highlight the impact of natural increase on population growth. The purpose of the World Bank scenario is presumably analogous. In any case, it cannot be interpreted as a realistic projection of future trends in international migration. International Program Center, U.S. Census Bureau Many readers will be unaware that the U.S. Census Bureau is a major resource on world population trends. The International Program Center (IPC) at the bureau maintains a large global database of demographic and socioeconomic indicators. It has also published global population projections biannually since 1985 in its Global Population Profile series. The latest projections were released in 2004 and cover the period 2002 to 2050. IPC divides countries into two main groups based on the importance of international migration in their history. If past migration has had a negligible impact on a country’s population growth, future net immigration is assumed to be zero. For countries with a history of significant migration, the level of net immigration over some recent period is usually held constant for the “near future.” The published description of the current projections does not offer any detail on how this near-term level is calculated or how net immigration is assumed to change over the longer-term future. In previous projections, however, the IPC usually assumed that it would eventually become zero. Like the UN, the IPC treats countries that have recently experienced large refugee flows as a special case. Refugees are assumed to return to their countries of origin over the next 5 to 10 years, after which net immigration returns to zero. International Institute for Applied Systems Analysis The International Institute for Applied Systems Analysis (IIASA) is a nongovernmental research organization located in Austria that conducts interdisciplinary research on a wide range of policy issues. The World Population Program at IIASA 10 began producing global population projections in 1994 and has subsequently updated them in 1996 and 2001. The 2001 revision, which was released in final form in 2004, covers the period 2000 to 2100. IIASA projects the population for 13 major regions of the world rather than for individual countries. “By doing so,” it explains, “much of the world’s heterogeneity is taken into account, and we need not bother with national particularities, especially with respect to migration” (IIASA 2004). The United States and Canada together constitute the North American region. To arrive at its projection assumptions, including its immigration assumptions, IIASA uses a version of the Delphi method it terms “expert- and argument-based forecasting.” A panel of “resource” experts is called on to develop high and low assumption values. The experts are instructed to choose values that define a 90 percent confidence interval, meaning that only 5 percent of all possible cases should lie above and 5 percent below the range. They are also instructed to supply “arguments” in support of the values they select. The input of the resource experts is then reviewed by “implementation” experts, who select the final projection assumptions. For North America, the low net immigration assumption is zero and the high net immigration assumption is 2 million. The assumptions are then used to generate 2,000 stochastic projection runs. Whereas most projection-making agencies use high and low variants or scenarios to bracket a plausible range of outcomes, IIASA explicitly tries to quantify the uncertainties involved in its population projections. The actual assumption paths underlying the individual projection runs are derived randomly from the assumptions’ uncertainty distribution. The projection output is thus probabilistic. According to the 2001 IIASA projections, for instance, there is a 95 percent probability that the population of North America in 2050 will be between 329 million and 536 million, while the median projection value is 422 million. Although IIASA pioneered this method, a number of academic demographers and at least one public-sector agency, Statistics Netherlands, now make probabilistic population forecasts as well. UNITED STATES There are two major projection-making agencies in the United States: the U.S. Census Bureau and the Social Security Administration (SSA). Other agencies concerned with population trends use the projections published by one or the other. The Bureau of Labor Statistics’ labor-force projections, for instance, are based on the Census Bureau middle series, while the Congressional Budget Office and Office of Management and Budget use SSA’s long-term demographic scenarios. The Department of Homeland Security, which includes the former Immigration and Naturalization Service, does not make immigration projections. U.S. Census Bureau The Census Bureau is the primary U.S. government agency responsible for making population projections. It projects the population of the individual states through 2030 and of the nation as a whole through 2100. In addition to projecting the population by age and sex, the Census Bureau also projects it by race and Hispanic origin. The latest 11 complete set of national population projections was released in 2000 and covers the period 1999 to 2100. A new set of interim projections based on 2000 Census data was released in 2004. We discuss the 2000 projections, however, since the summary numbers available for the interim projections do not include any detail on immigration levels and since the immigration projection method remains unchanged. The 2000 projections, by contrast, embodied a major shift in the Census Bureau’s immigration projection methods. Prior to 2000, future levels of immigration and emigration were based on recent historical averages and assumed to remain constant throughout the projection period. In the 2000 projections, the Census Bureau took a new approach. It now assumes that immigration policies and levels will change in response to future developments. “While it may be acceptable in the near term to view migration as a consequence of existing immigration law and policy, this assumption loses merit in the longer term” (U.S. Census Bureau 2000, 16). Moreover, it explicitly models one longterm development—the aging of the U.S. population—that it expects will have an impact on migration flows. The Census Bureau anticipates that the aging of the U.S. population will increase immigration “pull” beginning in the 2010s. As growth in the working-age population slows during the retirement of the postwar Baby Boom generation and old-age dependency ratios rise, immigration levels are projected to increase, presumably because labor will be relatively more scarce. Although other projection-making agencies around the world sometimes consider future demographic developments in setting long-term immigration assumptions, the Census Bureau appears to be unique in building a demographic “feedback” into the projections themselves. Demographic shifts in origin countries may also affect future levels of immigration to the United States. The Census Bureau makes no attempt to model the potential impact, plus or minus, of population aging in origin countries on total U.S. immigration. It does, however, assume that population developments abroad will affect the composition of migrant flows. Over time, the Census Bureau projects that relatively fewer immigrants will come from Latin America, where decelerating population growth is expected to ease immigration “push,” while relatively more will come from younger and faster-growing countries in Africa, the Middle East, and South Asia. The Census Bureau projections anticipate a somewhat roller-coaster path for U.S. immigration. Net immigration is initially assumed to fall from some 950,000 in 1999 to 700,000 in 2010, as the surge in family reunification immigration triggered by the Immigration Reform and Control Act of 1986 finally subsides. It then rises sharply to 1.1 million in 2030 as the demographic feedback kicks in. Thereafter, it declines again—not because in-migration is projected to decline, but because out-migration is projected to rise. This is the result of another change in projection methods. Beginning with the 2000 projections, the Census Bureau projects emigration not as a level but as a percentage of the stock of foreign-born residents of the United States. This means that higher immigration ultimately leads to higher emigration as well. 12 In addition to its middle series, the Census Bureau also publishes low and high immigration variants, which it describes as “reasonable maximum and minimum values.” Under the low variant, net immigration drops to 113,000 by 2100, while under the high variant it rises to 3 million. As noted earlier, this large spread in assumptions yields an equally large spread in projected U.S. population totals: from 438 million in 2100 under the low variant to 854 million under the high variant. As the bureau explains, “The margin of uncertainty around the middle-level assumption is, of necessity, relatively wider for international migration than for births or deaths” (U.S. Census Bureau 2000, 19). Social Security Administration The Social Security Administration’s Office of the Actuary prepares its own longterm (75-year) population projections each year. The projections underlie the cost scenarios that the Social Security trustees use to evaluate the system’s finances. The Office of the Actuary currently prepares three sets of population projections and three cost scenarios: the low cost, the intermediate, and the high cost. High immigration is part of the low-cost scenario, while low immigration is part of the high-cost scenario. In contrast to the Census Bureau, SSA assumes that immigration will remain constant over the long run. Current net immigration levels are trended toward ultimate levels, which, once reached, are maintained throughout the rest of the projection period. In the 2005 intermediate scenario, net immigration is projected to attain its ultimate level of 900,000 in 2025. The ultimate levels for the high-cost and low-cost scenarios are 672,500 and 1,300,000, respectively. The ultimate immigration level in SSA’s intermediate scenario is close to the average immigration level in the Census Bureau’s middle series. The range between SSA’s high-cost and low-cost scenarios, however, is much narrower than the range between the Census Bureau variants. This narrower range is explained by SSA’s current-policy projection framework. According to the Office of the Actuary, the intermediate scenario assumption represents its “best guess” of future current-law immigration levels, while the low-cost and highcost scenario assumptions represent upper and lower bounds. The projections include estimates of immigrants admitted under the flexible caps for the family-based, employment-based, and diversity categories of the Immigration Act of 1990, as well as estimates of asylum-seekers and refugees. Although it is not entirely clear that it is consistent with its current-policy framework, SSA also takes illegal immigration into account. Since 1988, its projections have included estimates of net “other-than-legal” immigration, which the Office of the Actuary assumes will continue at substantial levels throughout the projection period. (The ultimate assumption in the intermediate scenario is 300,000.) SSA’s projections are periodically reviewed by an official Technical Panel on Assumptions and Methods. Traditionally, technical panels have passed over SSA’s immigration assumptions with barely a mention. The 2003 Technical Panel, however, devoted considerable attention to the subject. In its report, it concluded that SSA underestimates likely future levels of net immigration. The reason, according to the panel, is that SSA’s current-policy, fixed-number projection framework implies that 13 immigration will steadily shrink in importance in future years relative to the size of the growing U.S. population and economy. “In light of the sustained, rapid increase of net migration over more than five decades, the Panel finds this assumption to be highly implausible” (2003 Technical Panel, 26). The panel goes on to recommend that SSA abandon the fixed-number framework and instead project immigration as a rate. The panel actually raises two entirely distinct questions—first, whether SSA’s net immigration assumption is too low, and second, whether there is any necessary relationship between changes in the size of a population and net immigration. Neither question has an obvious answer. Regarding the first, the panel itself acknowledges that future demographic, economic, and policy developments could exert countervailing pressures. Slower growth in the U.S. working-age population may increase immigration pull—but then again, slower growth in the Mexican working-age population may reduce immigration push. And though it is true that immigration to the United States has risen dramatically over the postwar era, much of the rise was simply a recovery from the unusually low levels of the Great Depression and World War II. As for the rate recommendation, the panel leaves a host of difficult methodological issues unanswered. Even accepting the panel’s premise that over the long run the size of net immigration will rise along with the size of a population, it is not immediately apparent which population is the relevant one—the working-age population or the total population, the population of the destination country or that of the origin country. Nor is it apparent what time period should be considered in determining the rate assumption—recent experience, long-term experience, or something in between. The panel does not really address these issues. It simply assumes that the relevant population is the total U.S. population and that the relevant historical average is the longest feasible historical average, which turns out to be 1821 to 2002. In the end, its approach is no less arbitrary than projecting current law. EUROPEAN COUNTRIES Twenty-five years ago, net immigration was a relatively inconsequential component of population growth in most European countries. Today, it accounts for nearly nine-tenths of the total annual population increase in the EU-15. Not surprisingly, national projection-making agencies are paying closer attention to immigration—as is Eurostat, the EU’s statistical unit. The first set of Eurostat population projections, released in the early 1980s, ignored international migration entirely, while the second set, released in the mid-1980s, ignored it in all counties except Germany and Ireland, where it loomed particularly large. Since the early 1990s, however, Eurostat projections have included immigration for all EU member states. Despite the new attention, projection methods mostly remain rudimentary. According to a 2002 Eurostat survey, roughly half of all countries base their immigration assumptions exclusively on “expert opinion” (Eurostat 2002b). Although a growing number of projection-making agencies employ time-series analysis and other statistical techniques to analyze (and sometimes extrapolate) historical trends, none has developed a long-term projection model based on an overall theory of immigration. Some simply 14 project that immigration will remain constant at or near some recent historical average. Most of the rest trend it to a target or ultimate level typically reached early in the projection period. This inventory looks at Eurostat’s latest projections, as well as the latest projections of four EU countries: France, Germany, the Netherlands, and the United Kingdom. All are significant destination countries—and most are paying increasing attention to projection method. Eurostat Eurostat publishes internationally consistent population projections for the EU countries roughly every five years. The latest set of projections was released in April 2005 and covers the period 2004 to 2050 for the EU’s 25 current member countries, as well as Bulgaria and Romania, which are due to join in 2007. Traditionally, Eurostat outsourced much of its projection work to national agencies, including Statistics Netherlands, the Netherlands Interdisciplinary Demographic Institute, the Netherlands Economic Institute, and the Migration Research Unit of University College London. The 2005 projections are the first set to be prepared internally. Few agencies have devoted as much effort to studying immigration as Eurostat. In the mid-1990s, it launched a research program called “International Migration by Major Groups” designed to improve projection methods. The focus of the research, however, has been exclusively near term. Most of the modeling aims to clarify “the correspondence between the economic business cycle and international migration” (Eurostat 2003, 121). This work has produced some valuable insights. It turns out, for instance, that there is a strong relationship between immigration rates and unemployment rates in countries like Germany and the United Kingdom, where much immigration is labor-market motivated, whereas the relationship is weaker in countries like France, where it is not. Little of the work, however, has much relevance for projecting long-term immigration trends—and indeed, Eurostat’s long-term projection method remains as ad hoc and judgmental as that of most national agencies. Eurostat’s 2005 projections include three immigration variants. In the baseline scenario, net immigration for the EU as a whole averages roughly 850,000 per year over the projection period. The corresponding figures for the low and high scenarios— 425,000 and 1.3 million—are set about 50 percent lower and higher. Eurostat uses different methods in its projections for the EU-15 and the EU-10 “accession countries” of Central and Eastern Europe. The projections for the EU-15 are based on extrapolations of past trends, adjusted as deemed appropriate to take into account differences with national agency projections and to ensure “international consistency”—that is, to make sure that the country extrapolations give rise to a coherent total EU projection. “Due to the different socio-economic path of the two groups of countries” (Eurostat 2004, 7), a different method is adapted for the EU-10. Rather than extrapolate past trends, Eurostat assumes that there will be a “post-accession wave” of emigration that peaks in 2012-13. Thereafter, net immigration for each country is trended from its 2012-13 values to “target values” that Eurostat has established for the year 2050, its projection horizon. Along the 15 way, as wages and incomes converge, the EU-10 gradually shift from being net sending to net receiving countries. France: National Institute for Statistics and Economic Studies France’s National Institute for Statistics and Economic Studies (INSEE) is responsible for preparing long-term population projections. In the past, it has published new projections roughly every 10 years following the decennial census. The latest projections, which are based on the 1999 census, were published in 2003 and cover the period 2000 to 2030 at the regional level and 2000 to 2050 at the national level. Starting in 2004, France began conducting “mini-censuses” at five-year intervals; in the future, new population projections will therefore be published with greater frequency. INSEE publishes two migration scenarios—a baseline scenario and a high scenario. In the baseline scenario, net immigration is assumed to be 50,000 per year throughout the projection period. In the high scenario, it is assumed to rise to 100,000 per year by 2005—that is, to twice the level of the baseline—and thereafter to remain at that higher level indefinitely. The baseline assumption is based on the historical average over the past two decades. The high assumption simply recognizes the possibility that immigration could be higher in the future than it has been in the past. According to communications with INSEE, “there is no economic model to justify the different variants.” As it turns out, France’s 2004 mini-census revealed that net immigration since 1999 has actually been running at about twice the 50,000 level assumed in INSEE’s latest baseline projection. It is too early to say whether the recent surge in immigration— coupled with the widespread unrest in the French “suburbs” during the fall of 2005—will spark greater interest in improving projection methodology. Federal Statistical Office of Germany The Federal Statistical Office of Germany has been preparing national population projections for roughly 40 years. The tenth and most recent set of projections, which was published in 2003, covers the period 2002 to 2050. The Federal Statistical Office publishes three immigration variants (low, medium, and high) and tracks two categories of migrants (ethnic German and non-German). In all of the variants, net immigration of ethnic Germans is assumed to decline steadily and eventually fall to zero as the reserve of potential emigrants in the countries of Central and Eastern Europe is exhausted. In the medium variant, non-German net immigration is assumed to be a constant 200,000 per year throughout the projection period, roughly its average over the past 50 years. The corresponding assumptions in the low and high variants are 100,000 and 300,000. Except for the distinction between ethnic Germans and non-Germans, there is little remarkable about the Federal Statistical Office’s projection method, which resembles that of many other national agencies in Europe. What is perhaps unusual is the candor with which basic assumption choices are discussed. 16 The Federal Statistical Office rejects current immigration policy as a basis for projection. One reason is that in the past Germany has witnessed huge fluctuations in immigration within the span of just a few years as economic and political circumstances have changed—and along with them immigration policies. Net immigration of nonGermans rose to nearly 600,000 per year during the late 1960s and early 1970s as waves of “guest workers” flooded into Germany, only to fall to minus 200,000 per year by the mid-1970s as Germany’s postwar economic miracle stalled. It once more soared to 600,000 in the late 1980s and early 1990s, this time driven by waves of refugees and asylum-seekers, only to plummet again and turn negative in the late 1990s. More fundamentally, the Federal Statistical Office believes that over the long run immigration is determined by broad demographic and economic developments that may lie beyond the ability of governments to control. The Federal Statistical Office sums it up this way: “The balance [net immigration] depends firstly on the migration potential, which is determined in turn by political, economic, demographic or indeed ecological developments in the countries of origin. Secondly, it is influenced by migration policies in Germany, by the situation of the German labor market and by the economic and social attraction of Germany as a destination country” (Federal Statistical Office of Germany 2003, 21). Statistics Netherlands Statistics Netherlands has been producing the official population projections for the Netherlands since the early 1950s. It currently publishes long-term projections every other year. The latest set was released in 2004 and covers the period 2004 to 2050. Like IIASA, Statistics Netherlands makes probabilistic projections. Statistics Netherlands’ projection methods are among the most technically sophisticated in use today. Its projections incorporate 12 different sets of migration assumptions (and probability distributions) for migrant groups from 12 different countries or regions. Like a number of agencies, Statistics Netherlands projects emigration as a share of the foreign-born population stock—or in this case, stocks. But it also goes a step further. Not only does it track the size of 12 different foreign-born populations, it also tracks their “vintage.” Its assumption is that the longer immigrants have lived in the Netherlands the less likely they are to leave again. According to Statistics Netherlands, the projection assumptions for each of the 12 migrant groups are developed separately based on a combination of time-series analysis and expert opinion. The assumptions take into account the fact that different migrant groups have different primary motives for immigration, from labor-market considerations to family reunification. Although the assumption-setting process remains largely judgmental, Statistics Netherlands’ methods are less ad hoc and arbitrary than those used by most projection-making agencies. Statistics Netherlands relies on expert input from a special Advisory Commission for Population Projections that was established in 1975 to provide guidance in developing fertility, mortality, and migration assumptions. It also regularly consults with the Netherlands Interdisciplinary Demographic Institute, one of Europe’s preeminent population research institutes. 17 United Kingdom: Government Actuary’s Department UK population projections are published every two years by the Government Actuary’s Department (GAD). The latest set of projections was issued in October 2005 and covers the period 2004 to 2074. There are separate projections for the United Kingdom as a whole and for its constituent parts (England, Scotland, Wales, and Northern Ireland). The 2005 set of projections will be the final set produced by GAD. Beginning in 2006, the National Statistics Center for Demography, which is to be created under the Office for National Statistics, will take over responsibility for demographic projections. GAD’s projection method is somewhat unusual. Whereas most agencies base their immigration assumptions on historical averages, GAD begins by extrapolating the past decade’s historical trend a decade into the future. It then averages the extrapolated values. The result—145,000 in the latest projections—becomes the immigration assumption used in GAD’s baseline scenario. GAD also calculates high and low variants, whose assumptions are set roughly 40 percent higher and lower than the baseline assumption. According to GAD, the variants are not meant to indicate “extremes,” but merely to illustrate what the future might look like if net immigration is significantly higher or lower than in its central projection. The United Kingdom is now experiencing record levels of net immigration. As recently as the mid-1980s, it was still an origin country. Since then, however, immigration has surged. In no year in UK history before 1998 did net immigration ever exceed 100,000. Yet GAD assumes that in the future it will indefinitely average 145,000. GAD neither discusses the causes of today’s immigration surge nor explains why it thinks today’s higher levels will continue. Indeed, it offers no discussion of the factors driving immigration at all. Its projection method—which interestingly was developed in the early 1990s when immigration was still low—appears to be purely mechanical. OTHER DEVELOPED COUNTRIES The remaining group in the inventory includes three countries: Australia and Canada, both traditional destination countries, and Japan, a country where immigration, though historically unimportant, is now for the first time the focus of growing policy attention. Australian Bureau of Statistics The Australian Bureau of Statistics (ABS) produces a set of official population projections every two to three years. The latest set was released in November 2005 and covers the period 2004 to 2051 for the states and territories and 2004 to 2101 for the nation as a whole. The ABS prepares three variants for “net overseas migration” or NOM, as it is called. In the medium variant, NOM is assumed to be 110,000 per year. Although the assumption is based on a 10-year moving average of annual net immigration over the past 50 years, it turns out to be roughly consistent with the government’s current “target 18 range” of 100,000 to 110,000. The low and high variant assumptions are 80,000 and 140,000—that is, 30,000 lower and higher than the baseline assumption. ABS notes that NOM has risen above its long-term average over the past decade. The high assumption was selected to reflect “this more recent trend, as well as the possibility of increasing demand for skilled labour immigration” as Australia’s population ages (Australian Bureau of Statistics 2005, 27). Under the medium variant, NOM is projected to remain constant at 110,000 throughout the projection period; under the low and high variants, it is projected to reach its assumed level by 2007-08 and remain constant thereafter. Statistics Canada The Canadian population projections are prepared by Statistics Canada. The most recent published projections, which were released in 2001, cover the period 2000 to 2026 at the provincial and territorial level and 2000 to 2051 at the national level. A new set of projections, due to be released in late 2005 or early 2006, will cover the period 2005 to 2031 for the provinces and territories and 2005 to 2056 for Canada as a whole. In its 2001 projections, Statistics Canada explicitly bases the immigration assumption in its central or medium variant projection on current policy. It assumes that gross immigration will remain constant throughout the projection period at 225,000, which is the upper value of the government’s official 1999 target for the year 2000. Unlike the U.S. Social Security Administration’s “current policy” framework, Statistics Canada’s makes no allowance for illegal immigration. According to Statistics Canada, the underlying premise of its approach is that “immigration assumptions tend to be more accurate when based on policy decisions taken by the government, than when based solely on the statistical analysis of past trends” (Statistics Canada 2001, 1). Statistics Canada publishes projection variants that take into account the possibility that future immigration levels will be affected by “socio-economic and political conditions, both within and outside Canada.” Interestingly, however, it justifies these variant projections as alternative policy scenarios. The high variant assumption (270,000) reflects “a convergence of economic, humanitarian, and demographic factors [that] could lead to a policy of continuing high immigration,” while the low variant assumption (180,000) “reflects a possible downward revision of future immigration levels” (Statistics Canada 2001, 1, 3-4). Given the steady increase in immigration since the mid-1980s—and the potential impact of Canada’s aging on future immigration pull— Statistics Canada believes that the high variant represents the more plausible scenario. According to communications with Statistics Canada, it plans to modify its strict current-policy framework in its new set of projections. Rather than assume a constant level of immigration based on government targets, Statistics Canada will project gross immigration as a constant share of the total population. The new medium variant assumption of 7.0 migrants per 1,000 population is based on the average rate over the past 15 years. The low and high assumptions of 5.5 and 8.5 per 1,000 population are based on historical fluctuations around the recent historical average. The rate assumption will translate into a substantial increase in projected immigration in the medium variant. Statistics Canada justifies the departure based on the government’s announced intention to raise immigration targets in the future, as well as on the possible increase in demand 19 for migrant labor when Canada’s large postwar baby boom generation begins to retire. Oddly, the new method is only applied over the first 25 years of the projection period, after which the absolute level of immigration is once again projected to remain constant. Japan: National Institute of Population and Social Security Research The National Institute of Population and Social Security Research (IPSS) prepares the official Japanese population projections. The projections are published every five years following Japan’s quinquennial census. The most recent projections were released in 2002 and cover the period 2001 to 2100. Similarly to Germany, Japan makes separate projections of ethnic Japanese and non-Japanese immigration. IPSS assumes that net ethnic Japanese immigration will continue at its recent (1995-2000) average annual rate. Its projections of net “foreign” immigration are based on an extrapolation of the historical trend since 1970, at least in the near to medium term. Net foreign immigration rises sharply over the first two decades of the projection period, before flattening out at roughly 100,000 per year from the 2020s onward. This method represents a change from earlier practice. In previous projections, IPSS assumed that net foreign immigration (like net ethnic Japanese immigration) would remain constant at its recent historical average. In the 1997 projections, the average used was 1990 to 1995, which turned out to represent an unusual and short-lived downturn in what had for the prior two decades been a generally rising historical trend. The new method was developed in recognition that near-term averages are a problematic basis for long-term projections. What makes it unusual is that projections are based on long-term historical trends rather than the long-term historical averages. 20 Chapter 2 AN OVEVIEW OF IMMIGRATION THEORY The poverty of explanatory models in the current practice of immigration projection contrasts sharply with the abundance of immigration theories proposed and discussed by experts in a variety of social science and policy disciplines. Here we attempt to outline the broad theoretical frameworks that, with effort and research, could help serve to improve projection practice. We also briefly survey the growing body of empirical literature on efforts to statistically test the power of these theories in explaining historical trends in international migration. SIX THEORETICAL FRAMEWORKS We identify six theoretical frameworks, each having its own unique history and literature: the neoclassical, the world systems, the new economics, the social network, the dual labor market, and the policy frameworks. There are many ways to understand how these six frameworks approach migration. One way is to distinguish explanations in terms of “push” factors versus “pull” factors. Push factors, which create migration pressure within an origin country or region, range from poverty and unemployment (labor migrants) to political turmoil (refugees). Pull factors are generated by the attractiveness of the destination country and give a direction to migration flows. The neoclassical framework, since it derives from a supply and demand analysis of economic and demographic conditions in both origin and destination countries, encompasses both push and pull factors in equal measure. Other frameworks tend to lean in practice more toward one or the other. The world systems and new economics frameworks tend to lean more toward push explanations. The dual labor market and policy frameworks tend to lean the other way, toward pull explanations. A second way to distinguish the frameworks is in terms of quantitative versus qualitative models. Here there is a spectrum: At one end, the neoclassical framework describes a body of theory that (along with accompanying statistical tests) is almost entirely quantitative. The new economics and dual labor market frameworks are occasionally quantitative in their approach. The others are almost entirely qualitative. A similar spectrum distinguishes frameworks whose method stresses individual incentives, rational choice, and markets from those whose method stresses social forces, community or cultural values, and history. A third way to sort the frameworks is by whether they tend to argue, most of the time, for a long-term rising or falling trend in global migration. The neoclassical framework tends to point to long-term stability or decline. In the classic formulation, as migrants move from low-wage to high-wage countries wages will fall in the destination country and rise in the origin country until a new equilibrium is reached and net migration ceases. The policy framework could lean either way, but again suggests that decline is a real possibility by its attention to public attitudes, which in recent decades 21 have in many destination countries turned against immigration. The remaining frameworks, on the other hand, tend to suggest that a secular rise in migration rates will continue indefinitely, along with modernization and globalization. Jeffrey Williamson, perhaps the preeminent economic historian of international migration, sums up the former view. Not only will the convergence in wages and living standards between origin and destination countries tend to slow immigration, so will growing political resistance in the destination countries. “Labor-scarce economies have been sensitive in the past to trends of greater inequality in their midst, using restrictive immigration policy to offset, or at least to dampen, those trends. If history repeats itself, policies will become increasingly anti-immigrant, at least as long as unskilled workers continue to lag behind other economic groups” (Timmer and Williamson 1998, 760-1). Massey, who probably belongs in the “social network” camp, sums up the contrary view: “Current theoretical and empirical knowledge…suggests that, if anything, migratory flows will grow throughout the world” (Massey 1999, 318). In its Global Economic Prospects, the World Bank comes to a similar conclusion: “It is likely that the number of people who wish to migrate from developing to high-income countries will rise over the next two decades” (World Bank 2006, 28). As yet, social science has not developed a comprehensive projection model that can tell us what will happen when Massey’s irresistible force meets Williamson’s immovable object. Neoclassical Framework By far the oldest and most venerable theoretical perspective, with origins going all the way back to classical political economy in the early nineteenth century, the neoclassical framework is inspired by a longstanding observation: Large migration streams tend to move from poor countries in which the youthful population is outstripping capital and land to rich countries in which the opposite is true. The insight of neoclassical theory is that there is a global labor market and that migrants will move from low-wage countries to high-wage countries if and when the wage differential is larger than the costs of moving. There are many historical examples, from the mass migration of Europeans to the United States in the late nineteenth and early twentieth centuries to the mass migration of black Americans from the rural south to the industrial north in the early twentieth century. The famous “laws of migration” promulgated by Ernest G. Ravenstein in 1885 were largely based on marketplace incentives. In 1932, John R. Hicks offered perhaps the best-known formulation of the neoclassical framework: “Differences in net economic advantages, chiefly advantages in wages, are the main causes of migration” (Hicks 1932, 76). Neoclassical theorists have devoted considerable attention to how best to define and measure “net economic advantage.” All agree that it is a lifetime calculation—and thus, that the decision to migrate depends not just on current wage differentials, but on expected differentials (e.g., Sjaastad 1962; Todaro 1969, 1976; Harris and Todaro 1970; Borjas 1989, 1990). This distinction helps to explain why anticipated migrations have sometimes failed to occur in the past. When low-wage Greece, Portugal, and Spain joined the EU in the mid-1970s, for example, it was widely feared that unskilled workers would stream north seeking higher wages. Instead, concluding that EU membership 22 would eventually bring about wage parity, most chose to remain at home—and indeed, many of those who had moved to northern Europe in earlier years began to return. The likelihood of finding a job is another crucial factor affecting net economic advantage. High-unemployment (both cyclical and structural) in origin countries can encourage migration even in the absence of large differences in average wages, while high unemployment in destination countries can deter it. Some theorists therefore argue that wage differentials should be adjusted to reflect employment prospects (Todaro 1969). Yet another issue is whether to adjust them for differences in the cost of living in origin and destination counties. If migrants move permanently to a new home abroad, this adjustment is clearly necessary. But if migration is circular—or results in large flows of remittances to family members who remain behind—the relevant price level may be that in the origin country. In this case, it is the nominal difference in wages that is the appropriate one to consider (Clark et al. 2002, 2004). The neoclassical framework has given birth to a vast academic literature in which migrant behavior is described by marketplace and optimization models of increasing sophistication (e.g., Lewis 1954; Ranis and Fei 1961; Todaro 1969, 1976; Borjas 1987, 1989). The framework has been appealing because it formally takes into account both push (supply) and pull (demand). It has been especially attractive to many economists and demographers because it is the most quantifiable. Though still dominant, the neoclassical framework has come under increasing attack in recent decades for its unrealistic “ideal market” assumptions and its disinterest in the role of culture and social ties (except perhaps as an “adjustment cost”). Other theories have been developed largely in reaction—to offer a more complete view that can explain major trends that neoclassical theory alone cannot. World Systems Framework The basic observation of the world systems theorists is that migration rarely comes from the very poorest parts of the world—or, within countries, from the very poorest regions or strata of society—which is what neoclassical theory would predict. Why? According to the world systems framework, large-scale immigration only happens after societies have been incorporated into the capitalist world market. Peoples in very traditional societies (however poor) rarely migrate. Only after a society has been marketized and globalized, and after all of the social and cultural dislocations that accompany this process, do people begin to pick up and move. As Massey puts it, “International out-migration does not stem from lack of economic development, but from development itself” (see Massey’s contribution in the Annex to this report, 9). Of all frameworks, the world systems perspective thus comes closest to encompassing what most experts mean by the general term “globalization.” Based on the historico-structuralist approach of Immanuel Wallerstein (1974) and on earlier Marxist critiques of imperialism, the world systems view maintains that immigration is part of a unidirectional global evolution in which “peripheral” economies become ever more closely integrated into a capitalist world market dominated by “lead” or “core” economies. As the advance of global capitalism transforms traditional societies—creating markets and overturning existing social and economic relationships— 23 populations become deracinated. Large-scale migration typically starts within national boundaries as rural inhabitants move to urban areas in search of employment. A dramatic contemporary example is China, where, over the past decade, at least 100 million peasants have abandoned their villages for the boomtowns of China’s industrial revolution. When international migration begins, it is typically directed toward core countries with which economic, political, and cultural ties were established during their earlier “colonial” expansion phase. Pakistanis and Indians, for example, traditionally migrate to the United Kingdom, Algerians to France, Indonesians to the Netherlands, Filipinos to the United States. Most recent work from this perspective (e.g., Portes and Walton 1981; Sassen 1988, 1991; Castells 1989, 2000; Portes and Rumbaut 1996) looks closely at the attitude shifts that give rise to global migration and the institutions and locales that sustain it—for example, the well-known “world city hypothesis” described in Friedmann 1986. World system theorists stress the crucial importance of trade, transportation, and communication networks in initiating and perpetuating international migration. While the neoclassical school views trade and immigration as substitutes, the world systems school views them as complements. Many world system theorists also believe that, once set in motion, the movement of migrants from poor and traditional societies to rich and modern societies— and the movement of remittances in the other direction—tends to further marketize the origin country, thus accelerating migration. They were among the first to note that more highly educated workers are usually the most likely to move—and to warn of the dangers of the resulting “brain drain” from developing countries to the “global cities” of the developed world (Khoshkish 1966; Kannappan 1968; Adams 1969; Watanabe 1969; Glaser 1978). New Economics Framework The new economics framework begins with another widespread observation that seems anomalous from the neoclassical perspective. Most migrants do not consist of entire families that make one-time permanent moves to a new country. Rather, most consist of family subgroups that spend many years moving back and forth from the “old” to the “new” country. New economics theorists therefore reject the neoclassical assumption that migration is a single decision made by an individual wage earner seeking to maximize his or her lifetime income. They instead propose a model that treats migration as a more complex series of economic decisions made within the context of intrafamily relationships. Families send members abroad not just to maximize income, but to diversify income and insure against risk (Stark and Lucas 1985, 1988; Stark and Rosenzweig 1989). In this perspective, immigration is a means to overcoming specific economic obstacles, especially the missing or failed markets for insurance and credit that are typical of many developing countries (Stark 1991a, 1991b; Massey et al. 1998). A family’s goal may be to protect itself against economic catastrophe in the event of unexpected job loss—or to accumulate capital to invest in a business or purchase a home. Wage differentials are thus only one of many economic drivers of migration behavior. Along with overcoming market failures, new economics theorists sometimes stress another motive for migration—ameliorating what they call “relative deprivation” 24 (Stark and Taylor 1989). The relative deprivation explanation starts with the observation that the well-being of households depends not just on their absolute income, but on their income relative to other households in their community or “reference group.” Totally apart from differences in wage levels between origin and destination countries, new economics theorists argue that income inequality in origin countries can itself give rise to international migration. Once set in motion, the dynamic can become self-perpetuating. By improving the relative economic standing of some families in the community, migration aggravates the relative deprivation of others, increasing the likelihood that they will engage in migration as well (Taylor 1992, 1999; Rozelle et al. 1999; HernándezCoss 2005). Like many other challengers to the neoclassical orthodoxy, the new economics framework first arose in the 1980s and has been gaining attention ever since (e.g., Stark 1982, 1984, 1991a; Stark and Bloom 1985; Stark and Katz 1986). More than world systems theory, it is willing to employ conventional economics—both to identify specific causes of market failure that can give rise to migration, such as the inability of villagers to buy crop insurance or take out a mortgage, and to evaluate the relative importance of wage differentials and income inequality. The new economics theorists emphasize the large size and historical importance of cross-border remittance flows—from Irish men in the United States to families back home in the 1850s, for example, or from Filipino women in the United States to families back home in the 1990s. According to recent studies, 1 in 10 people in the world is currently either sending or receiving remittances (de Vasconcelos 2005, 1-2). Like world systems theorists, new economics theorists have focused considerable attention on the problem of a “brain drain” from origin countries. They were also among the first to study the role of intrafamily ties and travel, research that pioneered the way for social network theory. Social Network Framework If neoclassical theory is correct, migration should be a widely diffuse phenomenon, involving randomly scattered families throughout origin countries and randomly scattered locations throughout destination countries. In fact, migration almost never happens this way. A major “wave” of migration typically originates among large numbers of people from a small number of sending communities—and ends in an equally small number of receiving locations. Why? Because, argue social network theorists, the existence of kin and other social networks in both origin and destination countries makes immigration less costly, less dangerous, and less uncertain. “When someone without prior migration experience has a social tie to someone with current or past experience as an international migrant, his or her odds of moving internationally are dramatically higher compared with those who lack such ties” (see Massey’s contribution in the Annex to this report, 19). Networks reduce the risks and increase the returns of migration. Relatives and friends help new immigrants find jobs. They also provide social and cultural support in an immigrant community with a familiar language, food, religion, and customs. Network theorists (e.g., Hugo 1981; Taylor 1986; Massey 1990a, 1990b; Gurak and Caces 1992) try to explain how all this works. Some of them (e.g., Massey and Zenteno 1999) have combined networks and “social capital” theory to generate models of migration. 25 According to the social network framework, immigration is a highly “path dependent” phenomenon: The choices made by a few early pioneer immigrants often determine the direction of the floodtide that follows. The classic work of Thomas and Znaniecki (1918-1920) on the migration of Polish peasants to the United States is often cited as the initial formulation of the social network theory. Over the last few decades, research on social networks has expanded to encompass a broad range of contexts, from the U.S.-Mexico relationship, where numerous studies have found that they play a key role in perpetuating migration, to the Chinese and Indian Diasporas. Among the more striking findings is the fact that the vast majority of the Chinese “coolies” who built the U.S. transcontinental railroads in the second half of the nineteenth century hailed from a single province (Taishan) in the Pearl River Delta of Southern China, the same region that remains the nexus of Chinese out-migration today (Gyory 1998; Ambrose 2000; Hsu 2000; McKeown 2001). Yet if immigration is hard to get started, this framework also suggests that it is hard to stop, since networks tend to create immigration momentum. Network-induced momentum may explain why migration may continue or accelerate even if the wage differential narrows or government policy tries to shut it down. During the late 1990s, for example, Mexican immigration to the United States accelerated despite large improvements in the Mexican economy during those years and repeated U.S. initiatives to close the borders. This momentum may also mean that government policies that favor family reunification, by helping to strengthen and perpetuate networks, directly undermine efforts to discourage a larger flow. Each new migrant creates a new set of people with ties to the destination country, some of whom in turn decide to migrate, creating a new set of people with ties to the destination country, and so forth. This is sometimes called “cumulative causation,” an idea first developed by Gunnar Myrdal in 1957 to explain the economic divergence of rich and poor countries and later elaborated and applied to international migration by Massey in 1990. Dual Labor Market Framework In its essentials, the neoclassical framework posits a global labor market in which migrants (as labor) respond to global market signals very much like any other mobile factor of production (for example, capital). Yet even allowing for imperfect information and the cost of communication and transportation, such global labor markets are far from perfect. One conspicuous imperfection is that, in most countries having large immigrant stocks, immigrants and native workers tend to fill different job categories. Dual labor market theorists maintain that these job categories in fact belong to two independent and largely noncompetitive “segments” or “sectors” of the labor market. The dual labor market framework (applied originally to different social classes) goes back in England to John Stuart Mill and in the United States to the institutionalist economists of the early twentieth century. Its specific application to immigrant labor is much more recent (e.g., Piore 1975, 1979; Dickens and Lang 1988; Leontaridi 1998; Constant and Massey 2003). Dual labor market theorists often see themselves as providing a “demand-side” perspective on the world systems dynamic of expanding capitalism and globalization. Like the world systems theorists, they argue that international migration arises from the 26 inherent structure of industrial capitalism. The difference in their view is that immigration is not caused by push factors in origin countries, but by pull factors in destination countries—in particular, their chronic need for foreign workers (Piore 1979). According to this framework, the labor market is composed of two sectors—a primary sector characterized by high-wage jobs, high returns to human capital, and high job security and a secondary sector characterized by jobs with the opposite characteristics. In the past, jobs in the secondary sector were often filled by native workers, especially surplus labor moving from agriculture to industry or women in need of temporary employment. Economic and socio-demographic changes in the developed countries, however, have curtailed these traditional labor sources, causing employers to turn to immigrants. If the immigrants aren’t forthcoming, employers often set new migration streams in motion, either by recruiting directly or by promoting government programs that recruit on their behalf. Classic examples include the U.S. Bracero program in the 1940s and 1950s and the German Gästarbeiter or “guest worker” program of the 1950s and 1960s. Dual labor market theorists point out that, once it begins, large-scale immigration tends to reinforce the segmentation of labor markets. Certain low-wage job categories become associated with immigrant job holders and thus are no longer considered by large numbers of potential nonimmigrant workers. This helps explain why many European countries continue to exhibit a high demand for low-skilled immigrants even in the face of high-unemployment among native-born workers. In effect, a social class stigma divides the national labor market into two segments. As potential native workers leave the immigrant job definitions, wages do not fall as far as they otherwise might in the presence of immigration. This encourages still more immigration. Furthermore, the same ethnic or cultural attributes of certain jobs that tend to discourage native job seekers may further encourage immigrant job seekers who may be reassured by the familiar setting of their new employment, especially within so-called enclave communities (Portes and Jensen 1987, 1989; Light et al. 1994; Light and Gold 2000). At the same time, the episodic nature of employment in the secondary sector, which is usually viewed as a drawback by native-born workers, may suit the needs of many immigrants. There is a long-standing debate among economists over the basic wagesegmentation premise of the dual labor market framework, or at least its practical importance (e.g., Cain 1976; Tolbert et al. 1980; Hodson and Kaufman 1982). Yet few would quarrel with its other key insight—namely, that people’s employment choices are often determined, in part, by considerations of class solidarity and cultural familiarity. Policy Framework Until recently, the role of policy as a determinant of international migration was little studied. On the one hand, immigration theorists tended to dismiss its importance. They either assumed that, over the long run, policy reflected, rather than determined, the underlying supply of and demand for immigrants—or else they treated it as an exogenous variable, a given that their models didn’t need to explain. On the other hand, governments tended to assume that they could control migration at will according to the 27 public interest. From the point of view of public policy, the whole question of how to explain and project migration was therefore swept off the table. Over the last generation, however, the surge in illegal immigration to many developed countries, together with heated new policy debates over immigration restrictions, has persuaded many experts to take a fresh interest in the role of public policy. Social scientists are now looking empirically at how peculiarities in policy design and enforcement affect real-world immigration incentives and change immigration behavior (e.g., Cornelius 1989; Espenshade 1990; Espenshade and Hempstead 1996; Castles 2004; Martin 2004; Richter et al. 2005). Some studies have even come to the counterintuitive finding that attempts to implement restrictive policies can end up boosting immigration. Beginning in the mid-1980s, the crackdown on Mexico-U.S. illegal immigration appears to have had this effect. By increasing the cost and risk of each border crossing, stricter enforcement persuaded many short-term or circular migrants who would otherwise have returned to Mexico to remain in the United States once they made it in (Nevins 2002; Eschbach et al. 2003; Massey 2005). Something similar occurred in Western Europe in the 1970s when governments ended guest worker recruitment and attempted to close their borders. At the same time, social scientists are investigating the broader question of how a society chooses its overall immigration policy goals, and in particular, greater or lesser restrictiveness. They note that immigration policy varies greatly from country to country, with enforcement being easiest for authoritarian regimes (for example, Saudi Arabia) or homogenous societies (for example, Japan)—and most difficult for countries like the Untied States that have both strong guarantees of civil rights and a long historical tradition of immigration (Massey 1999). Perhaps most importantly, social scientists are also looking at how overall immigration policies change over time (e.g., Goldin 1994; Timmer and Williamson 1998, 2004; Money 1999; Cornelius et al. 2004). How do interest groups and voters at large determine the direction of policy? Why, in some eras, do laws become more permissive or more restrictive than in others? When do legislators in democratic nations have a genuine incentive to limit immigration, and when is their goal rather to engage in “symbolic” measures to appease opinion? By studying public opinion surveys and legislative patterns, some of these theorists are formulating models in which the very direction of national policy is endogenously determined by other assumed social, economic, or demographic trends (Mayda 2004; Clark et al. 2002). In general, they find that periods of slow economic growth and rising income inequality are associated with more restrictive polices. They have also marshaled evidence that links changes in voter attitudes and national policy to changes in both the size and average skill level of immigrant flows and stocks (Bauer et al. 2000; Scheve and Slaughter 2001; Mayda 2005). Public opinion is typically more anti-immigration than public policy. It is only when immigrants compete directly for jobs with the median voter that these attitudes are translated into more restrictive policies (Benhabib 1996; Ortega 2005). Few if any of the new policy theorists believe that government policy is the single most important determinant of international migration. Rather, they argue that policy can 28 play a decisive role in altering the magnitude and composition of migrant streams. As evidence, they point to the fact that actual immigration to most developed countries, even taking into account illegal arrivals, is typically far less than “potential migration”—that is, the migration movement that would be expected based solely on such considerations as the size of wage differentials or the strength of immigrant networks (see Anna Maria Mayda’s contribution in the Annex to this report). THE NEW EMPIRICAL LITERATURE Over the decades, social scientists have produced a vast empirical literature describing the historical process of immigration and illustrating their insights about everything from wage differentials to the role of income inequality, social networks, and segmented labor markets. Until recent years, however, they were unable to subject their theories to rigorous statistical tests due to the quantity and complexity of the data involved. With the recent acceleration in the power of computer technology and the (related) refinement of statistical testing techniques, especially since the mid-1980s, a growing community of researchers is finally taking up the challenge of systematically evaluating the explanatory power of competing theoretical frameworks. As Borjas notes, “The joint application of economic theory and econometric methods to analyze the many questions raised by immigration has been a distinctive feature of recent research in this field, and is mainly responsible for the research advances” (Borjas 1999, 48). The ongoing work of economic historians Jeffrey Williamson and Timothy Hatton represents the most ambitious attempt to analyze and explain historical migration flows. Beginning in the early 1990s, Williamson and Hatton published a series of ground-breaking empirical studies on the Great Migration of the mid-nineteenth to early twentieth centuries (e.g., Hatton and Williamson 1992, 1993, 1994a, 1994b, 1998). The period provided an ideal laboratory for investigating the causes of international migration, not just because of the huge number of people involved—roughly 50 million Europeans left their homes for the New World between 1850 and 1914—but also because the lack of government restrictions on immigration during this “liberal interlude” makes it easier to untangle the relationships between various drivers. Hatton and Williamson found that rapid population growth, large wage differentials, and immigrant networks were the crucial factors in initiating and perpetuating the Great Migration. Along the way, they reached some stunning conclusions. According to their calculations, immigration explains 70 percent of the convergence in wages between Europe and the United States between 1870 and 1910 and more than all of the convergence between Ireland and Italy and the United States over the same period—making it a more important factor than capital flows or trade (Hatton and Williamson 1998). Hatton and Williamson, together with other collaborators, have since gone on to test what we know about the causes of international migration in a wider variety of countries and time periods. They have investigated the recent immigration experience of the United States (Clark et al. 2002, 2004)—and in particular, the reasons for the dramatic change in the size and composition of U.S. immigration since the 1960s. They have also examined the dynamics driving out-migration in Africa (Hatton and Williamson 2001) and Latin America (Clark et al. 2003). At least one study (Chiswick 29 and Hatton 2002) has attempted to compare and contrast the evidence of different data sets taken from the early nineteenth to the late twentieth centuries. The conclusions of this body of work are synthesized in a number of recent articles (e.g., Hatton and Williamson 2003, 2004; Williamson 2005), as well as in a new book, Global Migration and the World Economy (Hatton and Williamson 2006). One major insight of this statistical research is that, throughout history, there has typically been a hump- or U-shaped relationship between economic development and international migration. As world systems theory predicts, the poorest countries are rarely sources of large-scale emigration: Beneath a certain level of income and development, people do not respond to wage differentials. Once industrialization gets underway, however, and the “poverty constraint” is lifted (Hatton and Williamson 2003), people behave much as neoclassical theory predicts. Rates of emigration rise rapidly until the wage gap between origin and destination countries begins to narrow. Eventually a tipping point is reached, after which emigration slacks off or even reverses direction. The process has unfolded at different paces in different countries and in different historical eras. Over the past few years, many other researchers have joined the effort to improve our macro understanding of what drives migration. A few studies, notably Pedersen et al. (2004) and Mayda (2005), have taken a global approach, analyzing immigration data for the 1980s and 1990s across dozens of origin countries and scores of destination countries. Others have focused on particular countries or regions—for instance, Karemara et al. (2000) on Canada and the United States and Hatton (2003) on the United Kingdom. The interest in macro analysis of migration trends has been particularly intense in Europe, where immigration has surged since the fall of the Iron Curtain. An unusually large number of studies have been devoted to Germany—in part because it has historically been a large destination country and in part because German immigration data are especially rich (Karras and Chiswick 1999; Fertig and Schmidt 2000; Vogler and Rotte 2000; Constant and Zimmermann 2003; Brücker and Siliverstovs 2005). Researchers have also been looking at historical trends in Europe as a whole in order to assess the impact of EU enlargement on East-West migration (e.g., Bauer and Zimmermann 1999a; Dustmann et al. 2003; Brücker and Siliverstovs 2004). All of this effort has begun to pay off. Social scientists have an increasingly sophisticated understanding of the forces that have shaped the size and composition of international migration flows in the past. So far, however, they have remained largely aloof from the task of projecting future migration. 30 Chapter3 TOWARD A DRIVER-BASED PROJECTION MODEL In this chapter, we will outline a framework for a driver-based immigration projection model. The framework, while sketched out in some detail, will be suggestive only. Its purpose is not to specify exact variables or functional forms, and certainly not to test or refine quantitative results. Its purpose, rather, is to discuss the underlying logic of such a driver-based model, explore some of the design suggestions already made in the growing academic literature on migration modeling, and explain some of the limiting assumptions and data challenges posed by any model-building effort. The foregoing chapters have revealed a wide chasm between the rudimentary state of migration projection practice and the explanatory richness of migration theory. The ultimate goal here is to show that, by translating theories into models and assumptions into drivers, it may be possible to start bridging this chasm. Any effort to design a driver-based migration projection model must begin by examining the rapidly growing academic literature on migration models written by demographers and economists who have already been building and testing equations. There is much to be learned here. On a theoretical level, these researchers have identified a variety of dynamic social and economic processes that may explain migration and have devised creative functional forms to test for them. On an empirical level, they have come to some solid conclusions about which causal drivers ultimately matter and which probably don’t. Many of these researchers provide constructive criticism for each other. Over time, as a result, the models have grown rapidly in power and sophistication. The framework presented here will draw heavily on this literature. At the same time, it will adopt a somewhat different perspective and order of presentation. Most academic models are designed to test a specific hypothesis and are only fitted to historical data to check their ability to explain past trends. Our task here is develop a model that is more comprehensive (if less theoretically complex) and to equip it to project future trends. Projecting future trends, rarely an issue for academic models, poses a whole new set of questions about the availability of plausible independent variables. For official projection-making agencies, plausibility is an important concern—which is why, as will be seen, it influences how we prioritize independent variables. SETTING THE STAGE Before getting started, it is useful to address some of the reflexive pessimism that continues to surround the whole projection enterprise. If official agencies have not done more until now to improve their migration projection methods, it is less for lack of time and resources than for the general perception that little improvement is possible. It is said that the theory is too fragmented and the causation too random. While the U.S. Census Bureau observes that migration is the “component for which demographic science offers the least to future projections” (U.S. Census Bureau 2000, 15), many agencies seem to go further and assume that it offers almost nothing at all. 31 At the risk of some repetition, let us clear the stage by dispelling some of the groundless pessimism that surrounds what is, admittedly, a challenging task. First, for all of the diversity of their theoretical perspectives on migration, demographers and economists do in fact broadly agree on the direction and rough magnitude of a large number of causative variables. Nearly all agree, for example, that the “wage gap” (however adjusted) between origin and destination countries is a major causative driver, as is the stock of foreign-born residents in the destination country. Most also agree, in direction at least, on the influence of everything from age structure, urbanization, literacy, and education to distance, inequality, and type of political regime. (Many of these variables are discussed below.) Although different theorists may adopt very different ways of defining and prioritizing causative variables, they agree on the causal impact of a large number of them. Combined into a single model and tested against sample data, these variables are often capable of explaining (as measured by Rsquared) 65 to 85 percent of the variation of migration over time and between countries. Second, long-term projections are often more feasible than short-term projections. Most official agencies (especially national agencies) focus much of their attention on the near term—and, in the near term, immigration is often volatile, even chaotic. Unexpected movements of refugees and asylum-seekers, not to mention the erratic vagaries of the business cycle and geopolitical events, can trigger dramatic year-to-year oscillations in in- and out-migration. If such events cannot be predicted a year in advance, how can they be predicted a decade in advance? Agencies are tempted to conclude that if the near term is so difficult, the long term must be just about impossible. This conclusion, however, would be unwarranted. Nature abounds in phenomena that become more predictable (adjusting for scale) over longer time periods. The weather next season is more predicable than the weather next week. The ocean tide that arrives in twelve hours is more predictable than the ocean wave that arrives in five minutes. Even births and deaths are more predictable year-to-year than they are month-to-month. In all such cases, a longer time frame is required to detect projectable trends that are otherwise buried in near-term “white noise.” Scholars like Timothy Hatton, Barry Chiswick, and Jeffery Williamson (with their research on the Great Migration of the nineteenth and early twentieth centuries) have shown that this is true of migration as well. Their work explains how gradual and projectable shifts in the demographic, economic, and political environment, which do not figure much in near-term fluctuations, dominate any explanation of long-term migration trends. Third, a projection is not a prediction. It is rather an if-then statement, which argues on the basis of logic and research that if event A happens, then (given certain assumptions) event B must follow. This is as true for fertility and mortality projections as it is for migration projections. For some purposes—for example, scenario research— the likelihood of event A is not important. For other purposes, agencies may want to try to attach a probability to event A and thus turn the projection into a forecast. But this is a difficult task that is arguably no easier to accomplish for a mortality or fertility projection (involving, as it does, research into why parents raise children and why societies do or do not grow healthier) than it is for a migration projection. An agency that develops a new 32 migration projection method will naturally want to defend its likelihood. But it need not aim for some unrealistic standard. Its projection does not have to “predict” migration any more than it has to predict any other demographic outcome. Finally, a migration projection cannot be avoided. The bottom line is that any agency charged with projecting population needs to assume something for migration— and that something, given the emerging demographic trends of the twenty-first century, is likely to influence the final population outcome more than any other input variable. Some agencies may try to finesse the projection challenge by suggesting that their migration input represents a “no-change” assumption, a sort of dead-reckoning rule of thumb. But as we have already explained, even the simplest rule of thumb cannot avoid thinking through the causes of migration as a projectable phenomenon. The conclusions of the 2003 Technical Panel on Assumptions and Methods of the U.S. Social Security Advisory Board are an instructive case in point. The panel recommended that the U.S. Social Security trustees abandon their practice of projecting net immigration as a fixed number based largely on current policy. Instead, it suggested that “the most plausible” assumption would be to project it as a fixed share of the U.S. population. Though this new simple rule indeed seems plausible, it is based on no causal model of migration and makes no reference to the academic literature on migration drivers. Those models and that literature, if pressed for a simple rule, would probably suggest something rather different—for example, net immigration as a flow equal to a fixed share of the population of countries supplying U.S. immigrants (to reflect demographic pressure) or as a flow limited by the recent foreign-born stock as a share of the U.S. population (to reflect political pressure). The point here is that there is no easy way out. Even a simple rule needs to be grounded in a fully articulated causal model of migration that is backed by projectable drivers and empirical evidence. DEFINING TYPES OF MIGRATION Let us begin with the main objective: to model and project net immigration (call this MNET) into a large developed country. Since there is a broad consensus among demographers that in- and out-migration are driven by very different sets of causal drivers, we need to model these two flows separately. We also need to allow for special types of migration that must be modeled separately or (perhaps) cannot really be modeled at all. Let us then break down our objective into the following parts: n MNET = IV − EV + ∑ MCATi (a) i=1 where IV is voluntary gross immigration, EV is voluntary gross emigration, and MCAT refers to n number of (net) involuntary or categorical flows. These are, in effect, the dependent variables of our projection model. 33 Voluntary Migration By “voluntary” we mean migration comprised of people who either freely choose to move or who have family ties to those who freely choose to move. Directly or indirectly, therefore, these are all migrants who are responsive to incentives and disincentives about whether or where to move. Their aggregate decision to become immigrants or emigrants can thus be modeled as the result of observable drivers. To be sure, one should not idealize the situation by imagining that most migrants are all “free choosers” who respond spontaneously to job opportunities and relative wages. To the contrary, the majority of migrants are family members who sooner or later accompany the free choosers, a long tail of people whom migration scholars call “tied movers.” In the United States, for example, 66 percent of all individuals gaining legal permanent residency (LPR) status from 1994 to 2003 qualified on the basis of family reunification—a number more than six times larger than the share of individuals (10 percent) who formally qualified based on employment. Most countries in Western Europe show similar (or higher) ratios of family-based immigration to employment-based immigration.2 Yet so long as free choosers attract family “tied movers” in a quantifiably predictable manner, it makes perfect sense to focus on this entire stream of migration as a function of observable choices. Moreover, one should not exaggerate the gap between the two groups, both of which respond to many of the same incentives. Very few jobseeking migrants choose to move without any kinship or network connections at all to the destination country. Likewise, very few “tied movers” are entirely passive agents. They too must make an active choice to migrate—and for most of them economic incentives are critical. Most spouses and adult siblings need jobs, and most parents want a new home that enhances the life opportunities of their children. Even nonworking elder parents have destination preferences, typically for the same kind of income and qualityof-life advantages that attract their grown offspring. Among migrants who marry natives of the destination county, economic motives are frequently acknowledged—and not just in the “mail-order bride” business (which accounts for perhaps 10 percent of the estimated 40,000 to 50,000 annual marriages between foreign nationals and U.S. citizens). Jasso et al. (2000) show that, among those who acquire immigrant visas as husbands of U.S. citizens, their likelihood of actually settling in the United States is determined by the same economic variables as those that drive job-seeking migrants. Following the precedent set by nearly all academic modelers, we will not distinguish between tied and untied movers among voluntary migrants. Immigration versus Emigration Of the two types of voluntary migration identified in equation (a), gross immigration is considerably larger than gross emigration in most developed countries. Over the last decade in the United States, for example, it has been nearly five times 2 For the United States, all official immigration numbers in this report (total and by category) come from the INS/CIS Yearbook. For Europe, unless otherwise noted, immigration numbers are derived from Eurostat’s Reference Database. 34 larger—1,305,000 versus roughly 275,000 annually from 1995 to 2004, including undocumented migrants, according to Passel and Suro (2005). For Western Europe, the ratio is lower, though it is also harder to determine due to poor emigration data in many countries and the extreme variability of recent years. In 2001, for the EU-15, including undocumented migrants and excluding intra-EU movement, a reasonable estimate would be gross immigration of 2.0 million versus emigration of around 0.7 million, for a ratio of just under three to one (Eurostat 2005a; Salt 2005; authors’ calculations). Not only is emigration smaller than immigration, it is also harder to observe and measure directly because certain categories of “gross immigration” (especially short-term residents) are in fact calculated on a net basis. This means that we often cannot count the large number of people who reside in a destination country for a limited period of time before leaving. Emigration is also governed by a very different set of drivers than immigration, and, as we will discuss later, the most important of these emigration drivers are themselves a cumulative function of gross immigration. For all of these reasons— smaller size, measurement challenges, and different and derivative drivers—emigration plays a relatively minor role in the overall projection project. This chapter will therefore focus mostly on gross immigration and defer any discussion of the modeling of gross emigration until near the end. Involuntary Migration Now let’s turn to migration that cannot be modeled with incentive-oriented drivers—that is, involuntary migration. For most developed countries, the largest category is refugees. These are migrants who have been driven from their native country without any prospect of welcome elsewhere and whose ultimate destination is decided by national laws (for example, special U.S. laws for Cuban, Haitian, or Nicaraguan refugees) or by multilateral agencies (for example, the Office of the United Nations High Commissioner for Refugees). Both the laws and the agencies are beyond the migrants’ control. By definition, refugees are migrants whose status has been specifically preapproved before their arrival in the destination country.3 In Europe, such pre-approved entry, except from certain UNHCR refugee camps, is relatively unusual. In the United States, it is very common. Roughly 1.9 million refugees of all types gained LPR status in the United States from 1986 to 2003. That amounts to about 11 percent of all persons gaining LPR status over that period, making the United States the world leader, by rate and by absolute numbers, in refugee acceptance. Like refugees, asylees (or asylum-seekers) are migrants who are fleeing from violence and oppression. Unlike refugees, asylees arrive in the destination country before their status is determined—which makes it less clear whether their move is really involuntary. In the United States, the number of asylees is less than a tenth the number of refugees: They comprise just under one percent of all persons gaining LPR status from 1986 to 2003. In Europe, however, the asylee inflow is quite large. Aside from family reunification, in fact, it is now the dominant route by which non-Europeans enter Europe, and non-Western Europeans enter Western Europe. At its recent peak, from 1998 to 2002, over 400,000 asylees annually were entering Western Europe. But precise 3 This at least is the official definition in the United States. 35 numbers are hard to pin down, not only because the annual flow is erratic (and lately seems to be declining), but also because at least two-thirds of these asylees have their applications turned down. Whether, how soon, and on what terms refused asylees actually leave their destination countries, however, is not well known. It is widely believed that a significant share of those refused asylum become illegal residents. Assuming that the total number of asylees can be approximated, determining whether their moves are genuinely involuntary needs to be examined with greater care than is the case with refugees. Some asylees have no choice at all over the timing and direction of their escape. Most probably do. Indeed, the practice of choosing destinations that offer the most favorable welcome (and even moving through several other countries to get there) has given rise to lopsided arrivals of asylum-seekers in some countries and relatively few arrivals in others. Called “asylum shopping,” this behavior is a contentious political issue in the EU and has triggered calls for common asylum policies across destination countries. Even asylees who travel via “human traffickers” often have more choice (or at least foreknowledge) of their ultimate destination than do most refugees. The bottom line is that many refugees and asylees should be regarded as involuntary, while others should be regarded as voluntary. Whether or what share of these migrants are involuntary needs to be decided on a case by case basis for each pair of origin and destination countries. The application of simple qualitative criteria is likely to determine that the involuntary share of the (mostly “refugee”) migrants to the United States is quite a bit larger than the involuntary share of the (mostly “asylee”) migrants to Europe. Other categories of involuntary migration might be considered, depending upon the destination country. The U.S. Census Bureau, for example, projects the movement of U.S. military personnel and dependents to and from the United States by assuming a fixed number for net movement in all future years. This movement is involuntary by almost any definition. The U.S. Census Bureau also makes certain special projections on a net basis simply for convenience. For example, in order to avoid balancing large inflows and outflows from Puerto Rico, it makes a single net migration projection. For the United States or other destination countries, one can imagine creating other net categories for either of these reasons—lack of migrant choice or (if the net balance is small) convenience. As with emigration, this chapter will defer any discussion of modeling involuntary and other special net migration flows until near the end. Additional Migration Categories Official agencies in charge of migration projections sometimes make more distinctions between types of migration than are shown in equation (a). We should comment briefly on our decision not to follow suit. Agencies frequently distinguish between legal and illegal migration. For the purpose of modeling, however, the distinction makes little sense. Any model needs to account (as we shall see) for major changes in legal regimes. But considered generically, the motivations of illegal voluntary migrants do not differ in any systematic way from the 36 motivations of legal voluntary migrants. Consider two migrants from the same origin country who enter a destination country, find employment, and decide to stay—though one does so legally and the other illegally. We certainly know something about what distinguishes them from others in their country who, legally or not, either decided not to move or, having moved, decided to return home. But we know little about what distinguishes them from each other. Ordinarily, it is true, illegals face greater moving costs than legals, but since most legal immigration quotas for most of today’s developed countries are already full, this greater cost may not introduce any quantitative discontinuity. At the margin, in other words, nearly all of today’s immigrants (excluding family reunification) are illegal. The exact dividing line between legal and illegal is moreover often hard to locate. When the U.S. Social Security trustees, for example, distinguish between “legal” and “other-than-legal” net migration, they deem as legal all those migrants who annually gain LPR status. Yet according to data from the New Immigrant Survey (Massey and Malone 2002), at least 40 percent of these “legal” LPR qualifiers have previously broken immigration laws, either by illegal border crossings (20 percent) or visa abuse (20 percent confirmed, though the actual share may be larger). What’s more, each year roughly 200,000 new arrivals actually consist of foreigners legally residing in the United States with nonimmigrant visas, who oddly are deemed by the Social Security trustees to be other-than-legal simply because they aren’t among the LPR qualifiers.4 To summarize, legality is not an attribute of migrants that systematically sorts them by motivation. And even if it were, few (if any) countries keep administrative records that would enable us to distinguish legals from illegals with reliable accuracy. Academic modelers sometimes distinguish between different official categories under which immigrants are accepted, such as type of employment or skill. To be sure, official categories sometimes matter a great deal—for example, when they are drastically altered by new laws. In such cases, a good model must allow separate parameters for what amounts to a new legal regime. Otherwise, separate modeling is seldom called for, beyond the basic division reflected in equation (a) between voluntary and involuntary. This is especially true when the model’s purpose is to track total migration over long time periods. To begin with, official categories would only make sense as independent drivers for immigrants who are untied, legal, and voluntary. But these comprise only a minority of total immigrants, and even they often switch categories before becoming long-term legal residents. In the United States, for example, migrants belonging to untied, legal, and voluntary categories were awarded 118,000 LPR permits per year on average from 4 Clearly the trustees are aware that their “other-than-legal” category includes legally resident foreigners, but having defined legal immigrants as LPR qualifiers, it is hard for them to come up with a better term to describe them. They estimate on a net basis that 100,000 of the total other-than-legal category consists of such persons (Social Security Administration 2005). 37 1986 to 2003, amounting to 13 percent of all LPR permits.5 Well over half of these were switching from another (unrecorded) nonimmigrant visa status, which means that the original categories used by most of these immigrants are unknown. If we widen our scope to include the U.S. Census count of all new residents having nonimmigrant visas (as was just mentioned, this is about 200,000 annually), our total is likely to incorporate the original arrival category for many future permanent residents. But we have no idea who among them will choose to stay, legally or illegally. What we do know suggests that there is so much category-jumping that the original visa type may not be very informative. According to data from the New Immigrant Survey (Massey and Malone 2002), holders of tourist visas account for no less than 50 percent of all residents with nonimmigrant visas who later qualify for LPR status. For those in this group who gain LPR status specifically on the basis on employment, 25 percent originally arrived with tourist visas and another 27 percent arrived with student visas; only 31 percent actually came to the United States with some kind of temporary employment visa. When closely examined, the data make it clear that many immigrants take very circuitous routes to permanent residency and that, family reunification aside, an entirely legal and single-category transition is the exception rather than the rule. As matters now stand, in the United States at least, modeling by official category just isn’t possible. ASSESSING MIGRATION DATA Now that we have broken down total net migration into a few basic constituent parts that can be separably modeled, we need to address the availability of migration data. Traditionally, model-building scholars have procured annual migration data from official national agencies. In recent years, data from national agencies have been collated and organized into multinational databases, in particular by the OECD (Trends in International Migration, annual, and the related SOPEMI database) and by Eurostat (Population Statistics, annual, and the related Reference Database), whose data is compiled through a collaborative effort with the Economic Commission for Europe, the Council of Europe, the UN Statistical Division, and the International Labor Organization. In concept, gross immigration should track all arrivals and gross emigration should track all departures. In practice, the vast churning of casual and short-term visitors makes such a comprehensive approach entirely unfeasible. Each year, for example, the United States records some 35 million arrivals at airports and 195 million arrivals at land entry points. Even excluding visitors without tourist visas, each year there are nearly 6 million arrivals. Given the understandable errors in counting entrances and (especially) departures of this magnitude, all national governments long ago developed their own shorthand methods of exempting the vast majority of short-term visitors from the “migration” count. 5 This includes all LPR permits based on any kind of employment or eligibility through diversity immigration visa programs. 38 In recent years, the United Nations has tried to standardize the definition of a “migrant” as someone who establishes a “usual residence” in a new country (and a “longterm migrant” as one who establishes a usual residence for at least one year). But most national governments still follow their own tradition, generally adhering to one of two basic methods, the register or the permit. Japan and most European governments (with the conspicuous exception of France) generate their migration data from population registers that all residents, nationals and foreigners, are required by local authorities to fill out and sign. By matching the numbers and dates of entrances and exits, agencies can in theory calculate gross and net immigration with a fair degree of precision. These register data, however, suffer from three major limitations. First, the definition of who is really a long-term immigrant (as opposed to a tourist, student, crossborder commuter, business visitor, and so on) continues to vary across countries. Though most registry systems define long-term migration by intended length of stay, they use different time thresholds (ranging from one week to six or twelve months). Some define certain types of arrivals (such as temporary workers) as nonimmigrants regardless of their intended length of stay. If they renew their status, they may remain nonimmigrants indefinitely. As long-distance travel becomes more convenient, distinguishing between types of nomadic workstyles and lifestyles is growing more difficult. In concept, though registers should allow national agencies to correct the migration count for actual length of stay, most are designed for local administrators and cannot be easily recomputed by national officials. Second, population registries often do a poor job of monitoring emigration. Though residents are required to notify authorities of their decision to emigrate, it is difficult to enforce such regulations. In many countries, the yearly exit numbers are so poor that they are not published—or are only published for occasional years and after making adjustments based on data from the national population census or from the countries receiving the emigrants. Third, the registries fail to record the flow of illegal or “unauthorized” immigration, which by all accounts has risen dramatically in most developed countries over the postwar era. Though estimates vary widely, one often-cited 2005 Europol estimate puts gross illegal immigration into the EU at 500,000 yearly. Another study (Heckmann et al. 2000) puts it at 400,000 yearly. U.S. researchers (INS 2003; Passel and Suro 2005) suggest that gross illegal immigration into the United States has recently run at roughly the same magnitude—that is, 400,000 to 500,000 yearly. Unaccounted flows of this magnitude threaten to introduce a significant bias into the data, especially over the last two decades. They also introduce an awkward disjunction between each country’s official migration data and its overall demographic data, which ultimately need to keep track of the total resident population. Countries that do not keep population registers (notably, France and “settlement countries” like Canada, Australia, and the United States) instead rely on residence visas 39 and/or work permits. In general, these methods share all of the limitations of the registers and then introduce entirely new problems of their own. In the United States, for example, officials count immigrants by adding up the number of LPR (or “greencard”) permits issued each year—a number which, setting aside illegal immigration, has only a tenuous link to legal immigration. Even a poor register is pretty good about recording the date of entry. But LPR permits say nothing about date of entry. A growing share (in recent years, roughly half) of all LPR permits are “adjustments of status” to people already residing in the United States, often for many years. Some others who receive permits do not actually move to the United States. No register country, moreover, offers such a spectacular variety of ways to be a long-term resident without being officially declared an immigrant. We refer, again, to the roughly 200,000 new arrivals (or 25 percent of the official gross legal inflow) consisting of foreigners residing in the United States with nonimmigrant visas, many of them employees or students who will end up making multiple visa renewals. They are legal and they are immigrants according to the common-sense residency definition. But they are not officially considered “immigrants” by the U.S. Citizenship and Immigration Services (CIS). There is a further twist in the U.S. situation. Even of those immigrants categorized as “new arrival” LPRs—immigrants who embody the classic image of migration to the New World—a sizable share in fact have already lived in the United States and are “re-entering” to establish their new LPR status. Analyzing longitudinal data from the New Immigrant Survey, Massey and Malone (2002) calculate that, of all immigrants gaining LPR status in July and August of 1996, only 34 percent were firstever new arrivals. Although the official LPR data, over the passage of many years, eventually include most legal long-term residents who remain in the United States, they are a very poor indicator of year-to-year legal inflow. One should avoid the temptation to overstate these data limitations. After all, the existing data are good enough to enable scholars to design migration models with considerable explanatory power. Measurement errors are indeed a problem. But many of them involve a bias in the overall level of immigration, or randomness in year-to-year timing, rather than bias in the long-term trend over time. Illegal immigration in recent decades is also a problem, but it played a much smaller role in earlier decades, and thus leaves much of the historical data relatively unbiased. Even in recent decades, it is often reasonable to assume that illegal inflows track the trend in legal inflows from most origin countries, which permits models to use the legal number as a trend proxy for the illegal number. It is nonetheless obvious that better data would greatly enhance the results of any model. An important part of any serious effort to build a projection model must therefore be data improvement. To some extent, multilateral organizations have already made significant progress in recent years. The OECD and the Economic Commission for Europe have urged governments that use population registries, with some success, to standardize their definitions. The United Nations Population Division and the International Program Center of the U.S. Census Bureau, which track net migration flows 40 among all nations, have both been helping national agencies to improve their data on emigration. The UN and Census also fully integrate their migration data for each country into the complete reported population data for each country. This integration constitutes an important first step in figuring out the magnitude and direction of illegal inflows, which remains the largest outstanding problem for long-term projection modeling. Future progress on illegal inflows will come with more integration—indeed, it may require the comprehensive melding of official migration numbers with the results of national surveys of the resident population. Several researchers (e.g., Bean et al. 2001; Passel and Suro 2005) are currently attempting this approach with recent U.S. data. They start by collating all of the detailed periodic data gathered by the U.S. Census Bureau on foreign-born residents and then, by demographic adjustment and with the assistance of yearly official immigration data, they generate annual inflows (by country) that include most illegals. In effect, they greatly improve the quality of flow data by linking it to stock data. An added benefit of this approach for the United States is that, for legal immigrants, it largely corrects for the timing mismatch between actual residency and official immigrant status. Though frequent U.S. Census Bureau surveys of foreign-born residents do not go back before the mid-1980s (prior to that period they were limited to the decennial census), they cover the recent period in which illegal entry has accelerated fairly well. Ideally, researchers could create a continuous time series that would merge, in a consistent manner, all of the historical U.S. INS/CIS data with all of the historical U.S. Census data. THE BASIC MIGRATION MODEL: STRUCTURE AND ASSUMPTIONS In the last section, we broke up total net immigration into a few component parts and discussed the limitations of existing migration data as well as some of the opportunities for overcoming them. One of our conclusions was that, for most of today’s large developed countries, voluntary gross immigration (IV) is by far the most important component of the long-term projection puzzle. In this section, we will lay out the basic structure for a projection model that features IV (or more precisely, an immigration rate using IV) as the dependent variable. In the following several sections, we will discuss the kinds of drivers we might choose for this model, along with the kinds of independent variables we might put into the drivers. Structure of the Model The structure of our model is outlined in the following two equations. Equation (b) introduces a population indicator called PN that is projectable without modeling. That indicator is combined as a ratio with IV to serve as the dependent variable of equation (c), which lays out the basic modeling framework. Many functional forms might be used to structure such a model, and many estimation procedures might be used to test and run it. We have designed equation (c) in the simplest way possible—as a linear multivariate model that could easily be estimated by ordinary least-squares (OLS) regression. We have done so because this form is familiar and best enables most readers to grasp the underlying logic, and also because linear models and OLS testing remain very popular among academic modelers. Recently, some modelers have begun to 41 experiment with more sophisticated estimators (e.g., Brücker and Siliverstovs 2005), but we will leave the discussion of alternative statistical techniques to others. For one destination country (d) with immigration from multiple origin countries, we specify that PN jt = (PT jt)(AGE jt)(ADJ jt) (b) and d e o p x i= 1 i= 1 i= 1 i= 1 i= 1 (IV jt/PN jt) = α + ∑ β iD ijt * + ∑ γ iE ijt * + ∑ δ iO ijt * + ∑ ε iP ijt * + ∑ ζ iX ijt * + e jt * (c) where, for origin country j and year t, IV = gross voluntary migration PT = total population AGE = age-weighted probability of migration per capita ADJ = other (presumed) population multipliers PN = population normalized for likelihood of migration D = demographic and foreign-born stock drivers (d in number) E = economic and development drivers (e in number) O = other origin and/or destination-country nonpolicy drivers (o in number) P = destination-country policy drivers (p in number) X = dummy variables for origin country and/or era (x in number) t* = t– l (time lag), where 0 ≤ l ≤ 5 e = random errors To transform this framework into a working projection model, modelers would need to proceed in two stages: First, specify the model and second, set up the specified model to run as a projection. Specifying the model means testing the equations on historical data, estimating the parameters ( βi through ζ i ), and then adjusting or modifying drivers until the best “fit” is achieved. Setting up the specified model to run as a projection means locating or estimating future values for the independent variables within all of the model’s drivers. Given those values for every past and future year t, the projection model is set up to generate immigration results for every future year t. In the rest of this chapter, we will discuss the overall structure of the model, the choice of the drivers, and the theory and evidence underlying both the model and the drivers. We will not attempt to test any data. 42 Figure 4: Long-Term Immigration Projection Model Flow Chart ORIGIN COUNTRIES ( j = 1, 2, 3… J ) Country J Country 3 DESTINATION COUNTRY (d) Country 2 Country 1 Built-in Demographic Drivers e.g., age structure, absolute poverty Modeled Demographic Drivers Modeled Demographic Drivers e.g., foreign-born stock, youth population growth, aged dependency ratio e.g., foreign-born stock, youth population growth, aged dependency ratio Modeled Economic & Development Drivers Modeled Economic & Development Drivers e.g., wages, education, urbanization, media e.g., wages, education, urbanization, media All Other Modeled Nonpolicy Drivers All Other Modeled Nonpolicy Drivers e.g., inequality, environment, trade e.g., inequality, environment, trade Invariant Country-Specific Effects Invariant Country-Specific Effects e.g., distance, language, former colony, political regime e.g., distance, language, former colony, political regime Modeled Destination-Country Policy Drivers e.g., immigration laws & enforcement ForeignBorn Stock IMMIGRATION (Voluntary) 43 Figure 4 offers a schematic view of how the various components of the model join to make a projection. Most (though not all) of the individual drivers include terms that compare origin-country values with destination-country values—for example, wages or educational levels. When the effects of all the drivers are summed, they produce an immigration result. As can be seen, the result for year t* recursively influences certain demographic inputs for year t. While running the model on historical data, these feedbacks are assumed to be inherent in the data. While running the projection, however, they need to be iteratively calculated and used to adjust the yearly values of independent demographic variables. The driver structure is modular, meaning that a working projection model can incorporate some drivers while leaving out others. As can be seen, the driver modules are as follows: (1) built-in demographic and age-structure drivers, introduced in equation (b) in the specification of the migration rate; (2) modeled demographic and foreign-born stock drivers Di, introduced in equation (c); (3) modeled economic and development drivers Ei, introduced in equation (c); (4) all other modeled nonpolicy drivers Oi, introduced in equation (c); (5) modeled destination-country policy drivers Pi, introduced in equation (c). As laid out here, the driver modules are introduced in descending order of the presumed certainty of their future values. This order allows projection-making agencies to establish a threshold between more and less plausible conjectures about future changes in independent variables. An agency may want to incorporate demographic modeling into its forecasts—modules (1) and (2), which certainly rest on the safest assumptions— without venturing further. Or it may want to incorporate plausible or best-guess estimates for future economic and development trends, in which case it would include module (3). Or it may want to test and experiment with a full range of social and political drivers and include modules (4) and (5), which probably cover the riskiest territory of all. Assumptions of the Model In the next several sections, we will discuss each of these sets of drivers in the same order, from the safest to the riskiest. Before moving on, however, we should review the most important methodological assumptions underlying our modeling framework. Most of the assumptions are common to just about any migration model. A few are of special concern to long-term projection models such as this one. Where possible, we suggest steps to limit the restrictiveness of these assumptions. Behavioral Assumptions. We need to make several basic assumptions about the population whose migration behavior we are trying to model. To begin with, we assume 44 that people respond linearly to properly specified drivers—that is, that the dependent variable (probability of migrating) rises proportionally with the given independent variable (say, education). This assumption is not only required by the linear functional form of most migration models, it is also a prerequisite for using averages to aggregate the choices of a diverse population. Thus, for example, if average level of education is a positive driver, we need to assume that its marginal impact is the same at very low levels of education as it is at very high levels of education.6 Although this assumption seems (roughly) plausible in most cases, we do recommend going beyond population averages for some indicators. Also, with several drivers (for example, the “inverted-U” of economic development), we explicitly recommend testing for important nonlinear relationships even if this violates the strict linearity assumption. We also assume that people respond independently to different behavioral drivers—that is, that the impact of one driver does not itself depend on a high or low impact of some other driver. This is equivalent to saying that the impacts of different drivers are additive. We handle certain types of demographic drivers outside the linear model for this very reason in order to get around the independence limitation. Finally, we assume that populations are homogeneous with regard to unobserved influences on their migration behavior. The presence of a systematic migration bias in part of the population, if it is unrelated to any identified driver, is likely to bias the estimators and weaken the model’s ability to project. We will later return to one significant instance where we suggest enhancing the model’s realism by suspending this assumption.7 Finally, we assume that all populations respond continuously to behavioral drivers—that is, that there are no behavior “jumps.” This assumption seems very plausible when the behavior is the voluntary migration rate in a large population. It seems less plausible when the behavior is the political or policy response of a country, since history teaches that national migration policy typically moves in sudden fits and starts. No model, however, can project the exact timing of political events. We thus must assume continuous policy change if we are to include a “policy” driver at all. Global Feedback and Stability Assumptions. The “butterfly effect” assumes that everything that happens in the world is vitally connected to everything else. As we have seen, our model does allow for feedback from certain kinds of demographic changes within the system. But what about other kinds of feedback—such as from the cumulative impact of migration flows on trade and capital flows, productivity growth, and wage levels? A projection must either model these feedbacks on migration drivers or assume that they can be cordoned off and ignored. For the most part, we will regard them as second-order effects8 that can be overlooked so long as the modeled destination country is large (like the United States). 6 form. This is true even when we transform the aggregate result (say, with a logarithm) into a nonlinear 7 See below where we discuss a nonlinear foreign-born stock driver. In this case, we assume an unobserved heterogeneity in willingness to emigrate. 8 See below, however, where we discuss incorporating economic growth models into the projection. 45 The model also has to assume that nothing that happens in the rest of the world— that is, outside of the interaction between origin countries and the destination country— will significantly affect the outcome. One important aspect of this assumption is what Fertig and Schmidt (2000) call the “stability of alternative destinations.” A typical model looks at migration to a destination country as a function of drivers in origin countries. But imagine the bias that might arise if (as is most certainly the case) those origin countries are also sending migrants to other destination countries. What happens, for example, to the level or composition of African migration to the United States if there is a sudden change in the attractiveness of African migration to the EU? Once again, the assumption that we can discount such effects is easier to make for a large destination country than for a small one. Statistical Assumptions. In order to evaluate a model efficiently, any estimation procedure requires certain assumptions about the data. For pooled linear OLS, the assumptions are well known: The data must be homoscedastic, have no autocorrelation over time, and have no correlation across sampled countries. Though real-life migration data always violate these assumptions, rarely is the problem unmanageable. Heteroscedasticity can sometimes be remedied by properly defining the independent variables. Autocorrelation can be controlled by lagging the independent variables (a technique that also eliminates the possibility of reverse causation). As for an inevitable degree of correlation across countries, this must simply be tolerated. Violating these OLS assumptions does not bias the estimators, but does make them less efficient—and may warrant the use of additional estimation procedures. When testing a major destination country, a model is likely to have decades worth of data for dozens of origin countries. With such a large number of observations, underdetermination is not likely to be a problem even for models with many drivers. Other data problems, however, are likely to arise, such as missing values for certain years or countries, that require special statistical techniques.9 Most migration modelers also opt to greatly improve data fit by positing timeless country-specific effects (usually handled by dummy variables). In effect, the modeler assumes there are constant and unobserved differences between the behavior of different countries or regions. We will return to this strategy later in the chapter. Forecasting Assumptions. When a model is used to project future events, certain additional assumptions come into play. Obviously, a projection assumes behavioral stability in all future years, meaning that the behavioral rules defined in the model are not supposed to change. Most projections must also rely on values for independent variables that are themselves projections. In effect, they assume the foreseeability of future driver inputs. For certain kinds of drivers (for example, those in the demographic modules of the model presented here), this assumption may seem tolerable; for others (for example, those in the economic and development or policy modules), it may not. As we mentioned 9 For many of the independent variables proposed for our model, historical data are often episodic or only available at 5 or 10 year intervals. For some origin countries, no data are available at all. The likelihood of missing data rises with earlier years or with smaller and poorer countries. The array of statistical techniques available for handling this problem, some of them very sophisticated, will not be discussed here. 46 in the Introduction, some researchers advocate attaching probability distributions to the inputs and thus nesting random variables within other random variables. The projection can then be transformed into a forecast via stochastic simulations (such as Monte Carlo). We do not discuss this approach. Lastly, a projection must assume the irrelevance of unobserved drivers. In other words, all causal forces not represented in the model are deemed to have no significant impact. This is a heroic assumption indeed for a long-term migration projection, especially if it opts to exclude all political or policy response within the model. When major realms of social change are deliberately left off the table, some experts prefer to talk about “scenarios” rather than “projections.” Let us now turn to the drivers themselves, moving in sequence from module (1) to module (5). BUILT-IN DEMOGRAPHIC AND AGE-STRUCTURE DRIVERS The first module is defined for origin country j and year t by equation (b): PNjt = (PTjt)(AGEjt)(ADJjt) where PT is total population, AGE is the age-weighted probability of migration per capita, ADJ includes other (presumed) population multipliers or “adjusters,” and the result, PN, is the population normalized for the likelihood of emigration. We call this a built-in module because it does not depend upon any model-tested parameters. Age Structure It is well established that migration rates have a very distinct age structure. Migrants tend to be highly concentrated among young people in their late teens and twenties and among the young children they bring with them. This pattern has been observed in regional migration within nations as well as international migration between nations. Researchers have independently confirmed it in countries ranging from England, Sweden, Canada, and Poland to Japan, Korea, Indonesia, and South Africa. After careful examination of INS/CIS immigration records and its own resident surveys, the U.S. Census Bureau found a similar pattern. The migration age structure used in its long-term U.S. population projections assume that over half of all immigrants will be either between ages 15 and 29 or under age 5 (U.S. Census Bureau 1996). According to Andrei Rogers, a noted authority on age patterns of migration, “Age specific rates of migration exhibit remarkably persistent regularities in age profile. These regularities seem to hold all over the world and across time.” (Rogers 1988, 355). The pattern is so regular, in fact, that Rogers, together with researcher Luis Castro, developed the so-called Rogers-Castro “model migration schedule” to describe it (Rogers and Castro 1981). The schedule is a 7-parameter mathematical expression that always features a dominant peak in early adulthood, a secondary peak in early childhood, and (sometimes) a minor bump around age 60 to 65. (See Figure 5.) Economists have meanwhile framed theories that seem to explain this pattern. Very simply, young people 47 are least likely to have sunk costs in their current location and most likely, given their age, to perceive a greater discounted present value in the advantages (such as wage gains) of moving to a new location. Small children go with them. And, in some regions and countries, people past working age move in order to rejoin extended families or to “retire” in the more conventional sense. Figure 5: Rogers-Castro Model Migration Schedule 0.040 Emigration Rate by Age 0.035 Emigration Rate 0.030 0.025 0.020 0.015 0.010 0.005 0.000 0 10 20 30 40 50 60 70 80 90 Age Source: Rogers et al. (2005) Given the regularity and plausibility of this age pattern, one might imagine that it plays a central role in most migration models. Oddly, it does not. Some models are estimated without any age-structure driver. Others do have age-structure drivers, but the typical driver is both crudely defined (as the average age of the population or as the simple share of the population aged 20 to 40) and positioned as just another additive term in the OLS estimator. The crude definition means that much of the information contained in the precise model migration schedule is lost, while the additive positioning distorts the interdependent impact of age structure on migration. A youthful population does not itself motivate people to migrate; rather, by acting as a population multiplier, it enables motivations to translate into actual migration. This is at least one important driver where the assumption of additive independence is clearly inappropriate. Fertig and Schmidt make the same point. Since “we would expect a complex interaction of indicators of demographic structure with economic variables to yield superior explanatory power for understanding emigration activity,” it is best that “the fraction of core age individuals in the origin country do not simply appear as additional regressors” (Fertig and Schmidt 2000, 5). In their own model, accordingly, they explain that “we will deviate from the reviewed literature and move emigration rates from within 48 the core age group into the center of attention. Specifically, we will argue that for purposes of prediction the modeling strategy of choice should be to start from a simple model of emigration rates among individuals of core age” (Fertig and Schmidt 2000, 6). When they specify their model, the population in the prime migration-age bracket shows up within the dependent variable as the denominator of the migration rate. We follow Fertig and Schmidt’s lead. We define a variable, AGE, which is an average of the scheduled migration rates at every age, with each age weighted by the population at that age. It is generated by multiplying, for each country j and year t, the percentage of the population in each age bracket (typically, 5-year intervals) with the emigration rate for that bracket in the model migration schedule. After multiplying AGE by total population PT, we thus end up with PN, which is the “expected” migration projection for future year t given the projected future population and age distribution. The dependent variable in the model, the migration rate Iv/PN, is thus already normalized to age structure. Accordingly, the model is set up to explain deviations from this agenormalized migration rate, which then interacts as a multiplier with each of the other modeled drivers. Allowance can and should be made for demographic feedback. When the immigration projection is run, the annual population PTjt starting at t = 0 (this may be drawn from an outside demographic projection such the UN’s) will provide the basis for calculating PNjt at t = 0. This will allow the calculation of IVjt at t = 1, which then should be used to adjust the outside population projection for the year t = 1, and so on. Each year, this iterative process will adjust the outside population series for the actual migration values generated by the model.10 Two data sets are required to plug in values for AGE. The first is a set of future population projections (including total and age distribution) for every country j and year t. There are several standard sources: the UN Population Division (World Population Prospects and online database), through 2050; the World Bank (World Development Indicators and HNPStats), through 2090; Eurostat (online database), through 2050, but for European countries only; and the U.S. Census Bureau’s International Program Center (online database), through 2050, though data availability varies by country. The second dataset is a model migration schedule. Typically, an exact schedule is parameterized by looking at the historical experience of the destination country. For optimal precision, separate age schedules (presumably, they would not differ by much) could be calculated for each of the major origin countries and regions. The U.S. Census Bureau, for example, calculates separate age schedules for 14 different countries and regions when deriving its long-term projection assumptions. 10 Each year’s migration adjustment in country j would have implications, via fertility and mortality, for future population growth in country j. Allowing for complete feedback effects—which is probably necessary in the long-term projection—would therefore require re-computing the fertility and mortality algorithm for country j after each year’s adjustment. 49 Other Population Multipliers Age structure may not be the only origin country attribute that is best interpreted as a population multiplier rather than as an additive estimator term. There may be others, and these would similarly act on migration by effectively changing the number of people “in play”—like age structure or like the total population itself. One possible attribute is the absolute poverty rate, indicating the share of the population that faces utter destitution or that does not participate at all in the market economy. Some demographers and modelers find evidence that absolute poverty is a driver whose impact is quite independent of related economic drivers like average wages or living standards. The former is always a negative driver (that is, works to suppress migration); the latter, as we shall see in our discussion of development, can sometimes be negative, sometimes positive. If we visualize absolute poverty as effectively putting people “out of the running” for migration—for example, by rendering it unaffordable or unimaginable or both—we would do better to incorporate it as a population multiplier (in ADJ) than as an additive estimator term. With POV as the number in total poverty, the multiplier would be (TPjt−POVjt)/TPjt. Another possible attribute is the rate of illiteracy. It is well known that educational level is a positive driver largely because it enhances opportunities in the destination country. Some modelers believe that illiteracy affects migration behavior differently than a low level of education. Specifically, illiteracy does not simply restrict the opportunities of migration. By making it hard for people to trust strangers and respond to market signals, illiteracy restricts the feasibility of migration. Admittedly, the argument for illiteracy is somewhat less plausible than the argument for absolute poverty. But if illiteracy works similarly as a driver, a similar population adjustment (in ADJ) may be the best was to integrate it into the model. With ILL as the number who are illiterate, the multiplier would be (TPjt−ILLjt)/TPjt. Historical data on total poverty rates ($1 per day and $2 per day income thresholds) are collected and published by the World Bank (World Development Indicators, annual). Historical data on illiteracy rates (for age 15 and older and for age 15-24, which may be more relevant in this context) are collected by UNESCO and published by the World Bank (World Development Indicators, annual). Future projections for these drivers should probably be linked to future projections of GDP per capita, a task which will be discussed below in the Modeled Economic and Development Drivers section. MODELED DEMOGRAPHIC AND FOREIGN-BORN STOCK DRIVERS The second module is defined for origin country j and year t as follows: d ∑βD i ijt * i=1 50 This term describes a number (d) of additive drivers Di, each with a model-tested coefficient β i . Foreign-Born Stock Drivers It has long been observed that migration is a heavily path-dependent phenomenon. It does not flow uniformly from every possible origin region. Rather, like rain drops creating rivulets in fresh soil, each surge tends to follow the route taken by earlier surges in a self-reinforcing cycle. Thus, over time, the size of a community of expatriates from an origin country itself becomes a powerful and independent migration driver. Demographers have given this dynamic many names: the “network effect,” “cumulative causation,” and “self-propelling migration,” among others. The network effect has been observed in a wide variety of contexts. It explains why so many of today’s developed countries receive disproportionate migration flows from former colonies and dependencies. It explains why such a large share of emigrants, in any given origin country, are so often generated by such a disproportionately small number of villages and extended families—and why immigrants, similarly, tend to congregate in very specific neighborhoods in destination countries. It explains the fact that roughly two-thirds of all people who migrate to developed countries already have relatives residing there. Most migration modelers have found that the network effect—typically proxied by some relative measure of the number of foreign-born residents already residing in the destination country—is a statistically powerful driver of recent immigration to nearly all of the developed countries. Pedersen et al. (2004) examined immigration in the 1990s to 27 OECD countries and found that network effects alone raised the R-squared of their model from 0.45 to 0.75. Looking at historical patterns of international migration, several scholars (e.g., Tomaske 1971; Hatton and Williamson 1998) confirm that the network effect was a major determinant of the direction of Old World migration flows to America in the nineteenth century. It even answers otherwise-mysterious historical questions, such as why so many more Irish than Italians migrated to the United States from 1860 to 1890, despite the greater poverty in southern Italy. The reason, according to Chiswick and Hatton (2002), is the earlier Irish famine, which had given Ireland a long head start in creating communities and networks in the United States. Unlike other major migration drivers, the network effect is self-driven and works cumulatively over time—which gives it a lagged momentum that suits it ideally to projection purposes. Phillips and Massey, for example, use this dynamic to describe likely future Mexican migration trends as though the future network driver had already been fueled and ignited: “Our analysis thus suggests that stocks of migration-related human and social capital that have already accumulated in Mexico will continue to serve as powerful engines of emigration for years to come. Unless there are dramatic changes in the binational political economy or shifts in the rules of the game along the border, the United States can expect the continuation of large-scale Mexican immigration well into the next century” (Phillips and Massey 2000, 46). 51 Theoretical explanations of the network effect abound. According to the traditional neoclassical cannon, communities of trust that span origin and destination countries are able to lower the costs and risks of moving, create markets, transmit reliable information, and raise the economic return on the decision to migrate. Present-day network theorists talk more about the creation of social capital. They also describe in detail the self-reinforcing social feedback mechanisms among origin-country towns and families that become accustomed to foreign news, remittances, distant relatives, and seasonally returning migrants. In models, typically, the network driver is defined as (STOCKj,t*/POPj,t*), where STOCKj is the population born in country j residing in the destination country and POPj is the total population of country j. At time t* in any historical sample, the data for STOCKj can be supplied by the official sources of the destination country (for the United States, this would be the U.S. Census Bureau’s annual Foreign-Born Population in the United States and related database). Recent data can also be supplied by the OECD’s Trends in International Migration or its new online Database on Foreign-born and Expatriates. Another source, for European destination countries, is Eurostat’s Population Statistics (and related Reference Database). In a projection, future values of STOCK will be generated in auto-recursive fashion by the model itself. The model will keep a foreign-born inventory (including both the total population and the age distribution) for each country j, and at the end of each year t the model will add the new immigrants and subtract the estimated emigrants and decedents. The inventory in year t will then become an input for a lagged future year in which (STOCKj,t*/POPj,t*) references that t. The only outside variables required to update this inventory indefinitely are the emigration rate (which will be discussed later in the chapter) and the mortality rate (which can be proxied by the projected mortality rate assumed for the entire population of the destination country). So long as the model’s foreign-born inventory is updated yearly, one possible option is to construct a second stock driver that includes only those who have migrated in the last 20 or 10 or 5 years. It is widely believed that recent migrants have a disproportionate impact in persuading new migrants, often through remittances earmarked to fund the transport costs of family members and friends. In many models, perhaps for this reason, lagged migration is itself a significant and positive driver. A “recent stock” driver could fully capture this effect. Some demographers have argued that the foreign-born stock driver is probably not linear when the stock reaches a high value. At some point—for example, when most Mexican residents already have a tie to someone in the United States—the network effect approaches “saturation” and further increases in the stock have a declining marginal impact (Massey and Zenteno 1999). Indeed, when the stock reaches very high values, its impact is likely to turn negative. This will happen if we relax our assumption on population homogeneity and assume, very reasonably, that people have some unobserved variability in their willingness to migrate to the destination country (Brücker and Siliverstovs 2005). As a growing share of the origin country migrates, those who remain will comprise a growing concentration of people who (for whatever reason) are unlikely 52 to choose to migrate. Eventually, this negative and growing “heterogeneity effect” will overwhelm the positive and declining network effect. A standard way to test for nonlinear effects is to include a squared term of the driver. In this case, we would add (STOCKj,t*/POPj,t*)2 as a separate driver. If, as we might suspect, the stock driver becomes an inverted-U at high values of the driver, a statistical test would generate a positive coefficient for the linear term and a negative coefficient for the squared term. Other Demographic Drivers Richard Easterlin (1961) once suggested that the great nineteenth-century European migration to America was triggered by Europe’s historic demographic transition to lower mortality rates, larger completed family size, and faster population growth. In support of Easterlin’s hypothesis, several later modelers (e.g., Chiswick and Hatton 2002; Hatton and Williamson 1994, 2001) note that the historical data show that the annual growth in the child population in origin countries is indeed, after a lag, a positive migration driver. The lag is chosen to be just long enough to enable the growth to affect the prime (young-adult) migration-age bracket. In our model we could specify this driver as (POP0-15j,t*/PTj,t*)/(POP0-15j,t*-15/PTj,t*-15), where POP0-15 is the population under age 15 and PT is total population. Two somewhat different theories might explain this positive impact. The first theory points to the necessary tendency of emigration to raise origin-country wages— which means that the wage variable cannot be regarded as causally exogenous. This in turn suggests that the model’s estimated impact of wages on migration will be biased downward (because wages will not be as low as they would have been without migration). If we look for an unbiased instrumental variable that might track what wages would have been, we might think of population change in the heavy-migration age bracket, but of course this too would be causally endogenous and biased downward due to emigration. A better choice is to track, with a lag, the population change in some younger age bracket before the population matures into the heavy-migration age bracket. In sum, the growth of the child population is chosen as an unbiased variable to supplement wage comparisons. The second theory is more straightforward. It simply says that a rapidly growing “youth bulge” tends to overwhelm public, community, and familial support systems. The result is lower living standards and reduced economic opportunities in the origin country. This would spur migration even if we hold the effect on observed average wages constant—though we might hypothesize, under these labor market conditions, an unobserved relative reduction in youth wages. Another possible driver might track the reaction of migrants or potential migrants to the rapid aging of the developed world. Most destination countries are today much older than most origin countries, and most are expected to continue to age rapidly in 53 future decades. Most also levy large taxes on their working-age populations to fund large pension and health-benefit transfers to the elderly, and this tax burden is expected to climb rapidly in future decades as well. Unlike native residents, immigrants will not be paying for their own parents through these taxes. Many, in fact, are likely to regard them as a total loss11—not just what they pay at the current tax rate but what they are likely to pay in the future. The share who feel this way may be large enough to be of real significance. To specify this driver, we would need to isolate the average share of payroll that currently supports pay-as-you-go benefits to the elderly (at time t) and then perhaps average it with the projected share 20 or 30 years into the future (at time t+20 or t+30). Historical and current shares are available from standard EC and OECD sources (e.g., EPC 2001; Dang et al. 2001; OECD 2004). Since projections of future shares are complex and controversial, however, today’s perceptions might be better captured by a simpler rule of thumb. One might, for example, project a future year by taking the share at time t and then multiplying that by the expected increase in the elderly-to-working age dependency ratio between time t and time t+20 or t+30. Let’s define TRANS% to be the fiscal transfer to the elderly as a share of GDP. One driver could be (TRAN% d,t*/TRAN% j,t*), which is the relative transfer burden of the destination country. Then let’s define DEPGROWTH to be the 30-year growth in the aged dependency ratio, defined as (POP65+t*+30/POP20TO64t*+30)/(POP65+t*/POP20TO64t*), where POP65+ is the population aged 65 and over and POP20to64 is the working-age population. In our model we could specify the forward-looking transfer driver as [TRANS%d,t* * (1+DEPGROWTHd,t*)]/[(TRANS%j,t* * (1+DEPGROWTHj,t*)] These two drivers could be averaged or estimated separately. Future values of TRANS% could be estimated from future dependency ratios. Since future-looking population totals in DEPGROWTH reflect expectations, they need not be dynamically linked to future migration flows. For both drivers, log values (see next section) might be considered. MODELED ECONOMIC AND DEVELOPMENT DRIVERS The third module is defined for origin country j and year t as follows: e ∑γ E i ijt * i=1 11 When policy experts in the developed world discuss increased immigration as a partial “solution” to the rising cost burden of pay-as-you-go transfers to retirees, they are referring to immigrant tax contributions as net gains to the system. The net gain results from the fact that most immigrants will never receive benefits equal to the present value of their tax contributions. What is a net gain to native residents, of course, must also be a net loss to the immigrants themselves. 54 This term describes a number (e) of additive drivers Ei, each with a model-tested coefficient γ i . Wages In his Laws of Migration, E.G. Ravenstein did not deny that migration has many disparate causes. After surveying the extensive evidence, however, he had no doubt that the “promise for remunerative labor” seemed to dominate all other incentives. He concludes: “Having thus placed before you a vast array of facts and figures, I venture to deduce from them certain principles or laws which appear to me to guide all migratory movements… Bad or oppressive laws, heavy taxation, an unattractive climate, uncongenial social surroundings, and even compulsion (slave trade, transportation), have all produced and are still producing currents of migration, but none of these currents can compare in volume with that which arises from the desire inherent in most men to ‘better’ themselves in material respects” (Ravenstein 1889, 286). In the century that followed, most economists who examined the evidence agreed with Ravenstein, starting with leaders of the influential neoclassical school. In recent decades, both economists and demographers have put his hypothesis to a great number of statistical tests, and the results continue to vindicate wages as a dominant explanatory variable. It makes little difference if the study focuses on regional migration within countries or international migration between countries—or on migration over the last decade or on migration in the nineteenth century. In all of these contexts, wages are a powerful driver. In virtually every test, higher relative wages in the destination country are associated with higher rates of migration. In most tests, the association is highly significant. And in many tests, it clearly outranks all other drivers. The theory behind the impact of wages is elementary: People are incentivized to migrate to the degree that they believe they can increase their income. In many models, accordingly, the driver is specified as ln(Wd/Wj), which is the ratio of destination-country wages Wd to origin-country wages Wj. The natural log is a (utility function) transformation that reflects the standard assumption that as the relative wage gap rises its marginal impact on behavior will decline. When their sole interest is to explain historical trends, modelers are free to refine this measure of relative wages in several possible ways. To begin with, they may want to scrutinize exactly what is meant by “wages.” Some economists choose data for national average wages. Others choose data for unskilled labor, on the assumption that they better reflect the pay most new immigrants will earn. Still others use GDP per employed person, since it is easily available and may better track the total compensation (including nonwage items) that workers are receiving. Other adjustments are possible, though each is controversial. Some economists add in an extra driver for the unemployment rate, arguing that the relative reward of a higher wage needs to be qualified, positively or negatively, by the relative probability of getting a job. The problem with this adjustment is that, in the destination country, recent immigrants may have very different (and unobservable) unemployment rates from other residents and a large share of them may work “off the books.” Although many studies do 55 confirm that waves of migration are historically associated with unemployment spikes in the origin country, it is unclear whether these spikes affect the level or just the timing of migration. According to Chiswick and Hatton in their survey of nineteenth-century migration, “while unemployment rates were a powerful short run determinant of emigration, the long run trends are determined more by changes in the wage ratio” (Chiswick and Hatton 2002, 15). Another adjustment to wages is to net out government taxes and transfers. In certain cases, this may be sensible. In the last section, we suggested testing a driver for pay-as-you-go benefits to the elderly because the benefit flow is very large (in some countries, over 15 percent of GDP and growing), the tax incidence is roughly proportional across workers (in large part via payroll taxes), and the benefit target is clear (to others). But in most areas of public spending, there is no such clarity. The flows are generally smaller, the tax incidence less certain, and the transfers often disbursed over the entire population—including benefits ranging from unemployment payments to educational spending that flow to the immigrants themselves. It may even be that tax and transfer policies unrelated to retirement provide a net benefit to immigrants, especially recent immigrants. Indeed, Borjas (2002) among others has suggested that certain developed countries have become “welfare magnets” that attract a disproportionate share of lower-skilled immigrants. No one, however, has demonstrated that welfare-rich states attract more migrants overall. Pedersen et al. (2004) find that the total tax burden in the destination country is actually a mildly negative migration driver, which lends some support to the elder transfer driver described above. Even if making such adjustments on historical data makes sense, making them on data that must be projected into the future may not be feasible. Since there is little that can be plausibly projected in any country about long-term trend deviations between average wages and unskilled wages, we stick in our projection model to the most tractable and projectable measure—and simply make W equal to GDP per worker. One could, optionally, multiply this measure by the historical ratio of compensation to GDP for the country in question. Adjustments for unemployment rates and government taxes and transfers (excepting, again, pay-as-you-go retirement benefits) are similarly too difficult to interpret or project to be easily included in the model. It is hard enough to assess the distribution of most government activities today, let alone predict what they will be in the future. One further adjustment ought to be mentioned, which affects not the definition of wages but rather the question of expectations. Some economists have suggested that we look not only at the relative level of wages (destination country to origin country), but also at the relative growth rate of wages. In theory, workers do not simply compare current wages, but also the present value of all future wages. If they assess likely future growth by looking at past growth, then the recent growth rate may well have a substantial and independent effect. Although relative wage growth has not often been tested, both Vogler and Rotte (2000) and Hatton and Williamson (2001) find GDP growth in the origin country to be a significant negative driver. Whether this driver influences the longterm rate of migration, and not just its timing, is not yet known. We could test it by 56 creating the term WG for the rate of wage growth over a recent time period (perhaps the last five years), and with that create the driver ln(WGd,t*/WGj,t*). All of the historical data for GDP, factor shares, and PPP conversion rates are available from standard sources: the OECD (Economic Outlook Database); the IMF (World Economic Outlook Database); the World Bank (World Development Indicators); or the University of Pennsylvania (Penn World Table). Notwithstanding the importance of remittances, we believe that different currencies should be compared at purchasingpower parities (PPP). Education Workers in origin countries may earn less in wages than workers in destination countries for two reasons: Either they do not possess as much human capital, or their country is economically deficient in other respects (physical capital, technology, functioning markets, secure property rights, and so on). If it is more the latter than the former, they will likely experience a greater boost in wages when they migrate, because they take their human capital with them. Most migration modelers are therefore careful to include a separate driver for the relative educational levels, as well as the relative wage levels, of the two countries. What most of them find is that, for any given wage ratio, a higher level of origin-country education is associated with higher rates of migration. This is to be expected: A population of impoverished engineers can look forward to greater gains from migration than a population of equally impoverished peasants. In their analysis of U.S. immigration from 1972 to 1990, Clark, Hatton, and Williamson found that education was such a powerful driver that a 10 percent rise in a country’s average years of schooling was associated with a greater rise in emigration (15 percent) than a 10 percent decline in its per-capita income (6 percent). “Moving from an education level typical of Western Europe to one typical of South America,” they calculate, “would reduce the immigration rate from a country by about 60 percent” (Clark et al. 2002, 15). Modelers typically define the education driver as ln(EDjt*/EDdt*), where ED is a measure of average educational attainment. Like the wage driver above, it takes a log form and it is positive—meaning that a higher value implies more migration. Alternatively, think of the “return on human capital” as the ability of an economy to deliver a higher wage for a given level of education. If we substitute this worker return into our earlier term for simple cash wages, we get ln[(Wdt*/EDdt*)/(Wjt*/EDjt*)], which reduces to ln(Wdt*/Wjt*) + ln(EDjt*/EDdt*)—in other words, to our earlier wage driver plus our new education driver. ED can be measured by average years of schooling in the population (see BarroLee Dataset: “International Measures of Schooling Years and Schooling Quality”) or by the net enrollment ratio, which refers to students enrolled in primary, secondary, and tertiary education as a share of the population in the corresponding age groups (see World Bank, EdStats; or United Nations, Human Development Report). With a brief (perhaps 5year) lag, the net enrollment ratio might be more appropriate since it would focus better on young adults in the high-migration age bracket. An additional driver, (TERjt*/TERdt*), 57 where TER is the lagged share of the population enrolled in tertiary education alone (see again World Bank, EdStats), could also be useful in capturing those eligible for preferred college or skilled-employment visa status in many developed countries. This is one instance where it might be easy and useful to reflect the policy priorities of the destination country in the model. Economic Development The wage-gap driver, with or without an accompanying education-gap driver, has proven itself to be a powerful explanatory tool whenever it is applied to middle- and upper-income countries. But when it is applied to poorer countries—today, countries whose GDP per capita is under $1,000—the linear relationship linking a larger wage gap with larger emigration breaks down. Instead of more emigration, very poor countries generate less—in what Karras and Chiswick (1999) call “the poverty paradox.” For the most part, these are pre-development societies with high rates of poverty, low levels of education, traditional social structures, large rural population shares, widespread reliance on nonmarket exchange, and often a premodern demographic profile (high fertility and high mortality). For the period 1995 to 2010, the UN projects that the “least developed” countries will experience an overall net emigration rate of 10 per 100,000—versus a rate of 60 per 100,000 for all of the more affluent “less developed” countries. The migration resistance of very poor countries is not just a contemporary phenomenon. It has been observed historically in the eighteenth and nineteenth centuries by researchers such as Hatton and Williamson (1998) and O’Rourke and Williamson (1999), who explain why the largest migrant streams to the New World originated first in northwestern Europe (most notably, in England) and only later shifted progressively further east and south in Europe. This order of migration follows precisely the order of economic development: Only those parts of Europe that were industrializing and experiencing the related social and demographic changes associated with consistent economic growth were able to begin generating large numbers of emigrants. The same pattern has been noticed (albeit in a much-compressed time frame) in rapidly industrializing countries in the twentieth century. Consider the recent history of South Korea. It was very poor until the early 1960s; thereafter its economic development rapidly accelerated, until by 1996 it was invited to become a member of the OECD. Its emigration rate has followed the same curve—very low through 1965, and then rising rapidly in the 1970s and 1980s. By the 1990s, as South Korea’s wages began catching up with those of the developed world, its emigration rate fell and today is again fairly low. (See Figure 6.) At least in part, economists explain the migration “hump” or “curve” or “invertedU” that accompanies development by pointing out that pre-development countries are likely to have high rates of total poverty and illiteracy. This can make migration simply infeasible or unthinkable for large numbers of people. (We tried to capture this effect in an earlier driver module.) Yet most economists also believe that there are broader effects at work. In keeping with the “world systems” framework, they suspect that economic development is usually accompanied by a variety of less tangible social and cultural changes that dispose people more to migration. These include higher levels of education 58 and training, a greater stress on self-development, familiarity with markets and urban lifestyles, knowledge of finance and technology, and contact with global media. Figure 6: Stylized Migration Hump Emigration Rate 6.00 0.00 1800 1825 1850 1875 1900 1925 1950 1975 2000 Emigration Rate of Typical European Country (e.g., Italy) Emigration Rate of Typical Newly Industrialized Country (e.g., South Korea) Source: Authors' calculations In order to account for this inverted-U, migration modelers often resort to the simple expedient of assuming a negative quadratic curve for the wage gap. This can be modeled by introducing the additional driver ln[(Wdt*/Wjt*)2], where we would expect the linear wage-gap driver to have a positive coefficient but the squared wage-gap driver to have a negative coefficient. An alternative approach would be to introduce new drivers that test for economic development directly. Possible candidates would be the urban share of the population, the manufacturing share of the labor force, or various international indexes that track development in transportation, technology, or media. Recent values for all of these indicators are available from the United Nations (Human Development Report) or World Bank (World Development Indicators). In order to gather a long-term historical time series, some of these indicators would no doubt have to be simplified. For any of these additional drivers, the U-shaped effect of development on emigration can be tested by introducing both a linear and quadratic term. To avoid a proliferation of driver terms, however, a better tactic might be to convert these indicators into time rate of change variables. The assumption would be that (say) urbanization or the industrial workforce grows most rapidly at the top of the development “hump”—just when emigration ceteris paribus is expected to peak. This would require only one term per driver. 59 Projecting Wages and Other Development Indicators Projecting future values for the independent variables in these economic and development drivers is of course a critical challenge. Let’s start with GDP per worker— or equivalently, GDP per age-adjusted person12—whose growth rate is assumed to track labor productivity in each country over the long run. Over the first decade of the projection, it makes sense to borrow a short- and medium-term global economic forecast from a well-established global model that mixes both demand-side (Keynesian) and supply-side (neoclassical) methods. The World Bank, for example, relies on a macroeconomic model called LINKAGE, which it uses in conjunction with the input of experts at national agencies to produce a 10-year forecast for every major country and region (Global Economic Prospects, November issue, annual; the current projection is to 2015). There is no substitute for taking advantage of institutional judgment in forecasting, each year, the playing out of the current global business cycle. The U.S. Social Security trustees, when preparing their own economic assumptions, similarly introduce an idiosyncratic near-term “demand-side” transition to their linear long-term trend. Beyond 10 years, we can choose either of two options. The simpler and humbler option would be to hypothesize a stylized long-term GDP trend. One possibility would be the continued growth of global per-worker GDP at its average rate for the past half century. Another would be the gradual convergence of per-worker GDP among all global regions—starting from year 10 to around year 30 with gravitational narrowing of perworker GDP growth rates, and then beyond year 30 with a gradual closing of absolute per-worker GDP levels. Many economists (see summary in Sala-i-Martin 1996) suggest that we even know the rate at which this sort of “absolute” or “beta” convergence takes place—about 2.1 percent per year. This implies 45 years before all global wage gaps are reduced by one-half and 90 years before they are reduced by three-quarters. Even at the end of a very long projection period, these trend rules would still leave some global wage inequality intact. To be sure, such a trend-rule approach could be criticized for “giving up” on the projection challenge and leaning on a weak theory of long-term economic behavior. Most growth theory economists would probably deny that absolute convergence holds for a panel as heterogeneous as the world’s economies. Many would also point out that, in fact, the world has not experienced much obvious convergence in recent decades. Yet the advantages of trend-rules deserve mention. They are easy to understand. They are stable in the long run. And they offer a safe and eventless way to handle future developments that everyone would agree are highly uncertain. The UN Population Division follows a somewhat analogous strategy in the assumed convergence of its long-term total fertility assumptions. For an official agency (like the U.S. Census Bureau or the U.S. Social 12 GDP per worker should be adjusted for age-bracket variation in productivity level and employment rates, both of which (absent any compelling reason to believe otherwise) are assumed to remain constant over time. In the following discussion, “per-worker GDP” is a shorthand for GDP per ageadjusted person. 60 Security Administration), a further advantage of trend rules for the global economy is that it is very easy to make them consistent with fixed assumptions for the national economy. The more challenging option would be to borrow a long-term neoclassical growth model and, after any necessary modification, use its results. Three well-known candidates, expressly designed for global application, are the IMF’s MULTIMOD model and new GEM “Global Economy Model,” the OECD’s Interlink model, and the longterm components of the World Bank’s LINKAGE model. All of these are multi-sector, multi-country (or region) models, whose dynamics are mainly driven by demography, stocks of labor and capital, savings and investment, trade and capital flows, a production function, and technological progress. Given our long-term projection timeframe, it might also be worth considering “overlapping generations” models, which add a retirement, transfer payment, and bequest dimension to the savings and investment side of the equation. Examples are the INGENUE, Tosun, and MSG3 models (see summary in IMF 2004). Borrowed models do not allow us to avoid entirely the convergence question, since they too require regional assumptions about technology growth that will have a large productivity impact in the very long run. But using a model has the advantage of enabling us to isolate long-term technology convergence as a separate assumption, and not have it mingled in with everything else. Models have other advantages as well. They put our knowledge of basic growth dynamics (factors of production, sectoral shifts, capital flows) to work so that our projection actually reflects what economists know. And they can be adjusted on the “input side” to incorporate precisely the same demographic assumptions that we use. They could easily allow for a feedback from our migration results, a feature that would render them truly dynamic. Ideally—though this is probably not yet feasible—an economic growth model could subdivide each country’s labor stock into skilled and unskilled workers and link the size of each group to the flow and stocks of migrants generated by the immigration model.13 Once per-worker GDP for each country is projected, most of the other economic development indicators could be tied in some way to that projection. Trends in absolute poverty are closely linked to per-worker GDP, in a relationship that some economists believe can be fairly precisely quantified (see the annual 10-year poverty forecasts in World Bank, Global Economic Prospects). Trends in several other indictors (urbanization, manufacturing, and development in transportation, technology, or media) could also, without too much effort, be approximately linked to per-worker GDP. Here as well, using a long-term growth model would prove advantageous, since its sectoral projections would help us with projecting urbanization and manufacturing. Although the UN publishes long-term projections for urbanization (World Urbanization Prospects, biennial), it has been criticized for overestimating future urbanization due to 13 This would require much further research, both theoretical and empirical. But if it were accomplished, the dynamism of the model would certainly be enhanced. With the help of labor substitution elasticities, the growth model could then actually generate a skilled and unskilled wage differential, which in turn could be used as a wage-gap immigration driver. One potential problem might be finding adequate historical wage data to estimate its parameters. 61 its failure to take population growth and economic development into account. Simple remedies have been proposed (Bocquier 2004) that could be incorporated in our model. As for projections of educational levels, IIASA has published the results of a cohortaging model for education by country through the year 2030 (Lutz and Goujon 2001). This could be extended further, perhaps with assistance from per-worker GDP in determining the schooling rate for new generations of children. ALL OTHER MODELED NONPOLICY DRIVERS The fourth module is defined for origin country j and year t as follows: o ∑δ O i ijt * i=1 This term describes a number (o) of additive drivers Oi, each with a model-tested coefficient δ i . Inequality Economists have long been intrigued by the impact of inequality on the decision to migrate. Stark and Taylor (1989 and later) introduced the term “relative deprivation” into the lexicon of the growing new economics literature by formally testing the hypothesis that inequality is positively correlated with rates of emigration. Much of their work and later research (e.g., Jewell and Molina 2004) has focused on regional variations in Mexican migration to the United States. The basic argument (see also Stark’s contribution in the Annex to this report) is that, holding the average household income constant, greater inequality incentivizes lower-income households to move more than it incentivizes higher-income households to stay. The argument further implies that such migration may, through the dynamic of remittances and networks, itself generate still more inequality in the origin country. Borjas (1987 and later) has also suggested that inequality may affect the migration rate—but for rather different reasons. For Borjas, what matters is the ratio of the income distribution in the higher-wage destination country over the income distribution in the lower-wage origin country. If the ratio is greater than one, then two results follow: Migration will tend to “positively select” higher-skilled migrants, and the lower-skilled will tend not to move. Conversely, if the ratio is less than one, migration will “negatively select,” and the higher-skilled will tend not to move. As an example of the former, think of migration from the EU-15 to the United States (with all the charges of a collegeeducated “brain drain”).14 As an example of the former, think of migration from the Middle East to the EU-15 (which here plays the role of “welfare magnet”). 14 As much recent journalism has brought to light, the brain drain is not just a problem of the developing world. Jeff Chu, for instance, reports in Time Europe Magazine that “One of the most worrying signs of [the EU leaders’] failure is the continued drain of Europe’s best and brightest scientific brains, who finish their degrees and pursue careers in the U.S. Some 400,000 European scientists and technology graduates now live in the U.S. and thousands more leave each year” (Chu 2004). According to Peri (2005), 62 Yet beyond positive or negative selection, the Borjas theory has implications for the magnitude of migration. In theory, as the “inequality” ratio moves further above or below one, the migration flow will fall—since either the higher- or lower-skilled half of the origin-country workforce will be discouraged. The maximum migration flow should occur, ceteris paribus, when the ratio approaches one. That will happen when the destination and origin countries have roughly the same distribution of income and when migrants will experience no strong degree of (positive or negative) selection. Both of these theories merit testing for possible inclusion in the model, even if neither theory to date has received unequivocal empirical support. Although there is considerable regional and survey evidence for the relative deprivation theory, it has never been fully tested on global migration data. The driver in this case would be (GINIjt*), where GINI is the gini coefficient of the origin country (available for recent years from the United Nations, Human Development Report). One challenging question, which may be answered by future tests, is whether a national measure of income inequality really captures the sort of local or community-level inequality that many of the new economists seem to have in mind. The Borjas theory is based on the classic “Roy model” of wage inequality, which has generated a considerable literature. As a theory of migration, however, it has only been tested a few times in international migration models (e.g., Borjas 1987; Clark et al. 2002). A driver would have to compare two countries and, since the assumed relationship is nonlinear, include both a linear and quadratic term. One term would be (GINIdt*/GINIjt*); the other would be (GINIdt*/GINIjt*)2. The coefficient of the first term is expected to be positive, of the second term negative. Testing either theory would be hampered by the dearth of historical data for GINI going back more than 20 years in most countries. Economists, however, might be able to find creative proxies for inequality that go back much further in time. A more serious challenge would be settling on a method of making long-term future projections for GINI (or its proxy). Perhaps the most durable explanation of how inequality shifts over time is the “Kuznets Inverted U-Curve” hypothesis, so named after Simon Kuznets (1955) suggested 50 years ago that inequality everywhere seems to move through distinct historical stages: It is low in traditional societies, rises rapidly with the onset of economic growth, levels off, and then falls as the society becomes capable of mass affluence. Though the hypothesis has attracted much controversy, it has been extensively tested and, when properly defined, does seem to describe a vast range of modern and historical growth experiences (Moran 2005). Allowing for invariant country differences, we may want to associate future trend-changes in GINI for each country with future changes in each country’s development level (as measured either by transitional values of real GDP per capita or by growth rates in real GDP per capita). Our treatment of the impact of inequality would parallel and perhaps thus compete with our treatment of the impact of economic development as discussed in the last section. the EU actually has slightly fewer foreign-born residents with tertiary degrees than there are EU-born residents abroad with tertiary degrees. 63 Trade Research on the impact of trade on migration has a long and conflicted history. It is long because, from the very beginning, neoclassical theory pointed toward a very definite conclusion. According to the Heckscher-Ohlin model (which dates from the 1920s and is firmly rooted in the neoclassical paradigm), trade should always serve as a substitute for migration. In effect, trade and migration—moving goods and moving bodies—are simply alternative ways of allocating global factors of production to their most efficient use. To the extent that trade becomes easier and grows, it will tend to equalize factor prices (including wages) and thus discourage migration. Conversely, if trade is restrained, migration will be encouraged. The appeal of this theory frequently echoes through modern-day political debates, as when U.S. political leaders argue that expanding regional free trade through NAFTA will naturally suppress immigration from Mexico. Yet the research is also conflicted because most of the empirical evidence, including many efforts to test the theory with modeling, offers little support to the Hecksher-Ohlin expectation. To the contrary, much of it indicates that trade serves as a mild complement to migration—meaning that, historically, the two tend to rise and fall together. This is certainly true, decade by decade, over the broad sweep of global history. It is also very often true for individual countries or for individual country pairs. (See Jan Hoffmann’s contribution in the Annex to this report.) Where did theory go wrong? Most economists would argue that the neoclassical model isn’t really incorrect. It is just that, in real life, its conclusions are overwhelmed by other “network” and “world systems” dynamics that turn trade and migration into mutually reinforcing currents. Many of these dynamics reflect social as well as economic forces—such as the impact of trade in creating business communities in other’s countries, in familiarizing two populations with each other and with each other’s economies, or in introducing many developing countries to the very concept of markets, job choice, and personal mobility. One might consider adding a trade driver (TRADEjt*/GDPjt*) to the projection model. As usually specified, the variable TRADE would refer to country j imports or exports or both added together. Some modelers define TRADE as country j trade with the world; others (advancing a somewhat different causal story) restrict it only to trade with the destination country. One advantage in including trade in historical models is that excellent data are available for most countries going back many decades. Yet making long-term future projections for trade would be quite difficult, especially if we confine it to trade between two countries. Links between trade and GDP are unreliable in the long term. The direction and impact of future trends in transport costs, protectionism, and electronic off-shoring can only be imagined. A TRADE driver coefficient, if estimated against the historical data, would presumably be at least mildly positive. But given the mixed results of empirical research to date, its overlap with other drivers (such as development and inequality), and its uncertain future behavior, we doubt that it holds great promise. 64 Technology Economists have often speculated on the long-term impact of technological change on migration. Most obviously, better technology has dramatically reduced the cost of transportation over time, a trend that ought to have increased the overall likelihood of migration. Around 1650 a passage from England to America cost about ₤6, equivalent to five months wages for an English farm worker; many had to sign up for long periods of indentured servitude just to afford the voyage. By the early 1900s, in the era of the giant turbine steamship, passage was cheap enough to enable over a million impoverished Europeans to travel to America each year. Today, in the era of the discount coach plane ticket, travel is more affordable than ever before. Nor is it just the cost of transport that has fallen. Transport is much safer. Personal communication is much cheaper. News about overseas events through the global media is much more accessible and reliable. In short, one might suppose that technological progress has itself been a significant and positive migration driver. Following on this intuition, several modelers have tried adding a TRENDt driver, consisting simply of the year value t, to test for time as an explanatory variable. They have found only a weak trend or no trend at all. The poor results may reflect their choice of controlling variables or the limited time-scale of their sample. In some models, the positive impact of technology may have been negated in recent decades by the unobserved negative impact of more restrictionist policies in destination countries (a possibility raised by Greenwood et al. 1991). Or it is possible that the costs of transport and communication just do not comprise a large share of the total cost of migration, which may include everything from the financial cost of setting up a new household to the psychological cost of adjusting to a new culture. The TRENDt driver, however, may be worth more testing. If a positive trend is found, it would have to be further tested to determine how stable it is over different time periods before making any assumptions about how reliably the trend can be projected into the future. Political, Social, and Natural Catastrophes Anyone who contemplates making a 75- or 100-year projection into the future will reflect on periods of similar length in our global history and wonder about the impact of catastrophic events—great wars, social upheavals, or national disasters. Needless to say, projecting political and social catastrophes would seem to be an utterly hopeless task. Even if one dared to forecast the nature and timing of the underlying conflict, how such an event would impact the lives of future populations is likely to be determined by an indecipherable web of contingencies. Fortunately for the migration projector, such catastrophes are rarely the immediate cause of mass population movements. History shows that people are much more likely to migrate permanently to another country out of choice than out of compulsion or near-term expediency. This has even been true in the twentieth century, which has featured more than its share of total wars and mass deportations. Looking ahead to the rest of the twenty-first century, many are worried by the specter of environmental catastrophe. Can environmental trends be plausibly included in 65 a long-term projection framework? The task once again seems unmanageable, though there may be some exceptional cases. The most-discussed environment trends are global in scope—global warming, ozone-layer damage, fossil fuel depletion, persistent organic pollutants, and the like. These are the least likely candidates for inclusion. The timing and magnitude of these trends are very unclear (with different researchers defending very different assessments) and are in any case endogenously dependent on other trends (such as global economic growth). Even if the timing and magnitude were clear, how these trends might affect living standards would be open to question, even in the absence of new technologies and new public policies that could arise in response. Most difficult of all would be deciding how the trends would affect different regions and countries. For most of the threats, global markets would likely distribute the costs across countries so that the ultimate economic effect is similar to a falling-off from trend in global wage growth. For all of these reasons, the impact on migration would be unknowable. Environmental trends that are more strictly regional and predictable, however, may be worth investigating. These include land degradation, desertification, and fresh water shortages. Projections of these trends, by country, are made by the United Nations Environment Program. In some cases, the impact on local populations is likely to be large and unavoidable. In Africa and South Asia, where much of the economy will remain agricultural for decades, the lack of arable land and fresh water may leave large numbers of people with few alternatives to moving. (This environmental dynamic may already be prompting emigration, and in particular refugee-flight, from Saharan Africa today.) Modeling this sort of “environmental driver” with historical data, however, will be difficult and perhaps impossible. To incorporate it in a projection, the strength of the driver would probably have to be hypothesized directly by estimating the trend’s potential consequences for the population. MODELED DESTINATION-COUNTRY POLICY DRIVERS The fifth module is defined for origin country j and year t as follows: p ∑ε P i ijt * i=1 This term describes a number (p) of additive drivers Pi, each with a model-tested coefficient ε i . Thus far, we have only been examining drivers that affect the willingness of people in origin countries to migrate to a destination country—the supply drivers, if you will. Now it is time to look briefly at the demand side, namely, the willingness of governments in destination countries to let migrants move in. If we included no destination-country policy driver, our model would be assuming that policy during the period over which the parameters of the supply drivers are estimated (let’s call this current policy) would not change in the future. In effect, the current “cost” of 66 compliance or evasion would be assumed to remain constant throughout the entire duration of the long-term projection. If history is any guide, this assumption hardly seems plausible. All of today’s destination countries have experienced large swings in immigration policy over the decades. In the majority of them, policy was very open through most of the 1800s, became increasingly restrictionist in the 1910s and 1920s, began easing again in the 1950s and 1960s, and since the 1990s seems to be moving once again in a restrictionist direction. There is no question, moreover, that policy shifts in a destination country do affect migration behavior—and do indeed influence the magnitude and direction of flow. This has been confirmed by numerous before-and-after time-series analyses. Many economists, moreover, believe that policy is having an especially restrictive impact in recent years, since the fundamental supply drivers point to a much larger increase in the desire to migrate than the increase in the migration we actually observe. Williamson (2005) points out that the skill gap between immigrants and U.S. native-born residents was in percentage terms five times larger in 2000 than it had been in 1900. Others emphasize that “globalization” has a more widespread appeal today and that transport and communications are much cheaper. Why then do we not observe a much greater migration flow to the developed world today than the flow to America a century ago (as a share of either origin- or destination-country populations)? “Restrictive policies,” according to Mayda (see her contribution in the Annex to this report, 75), “are most likely the answer to the surprisingly small size of international migration.” If policy has a very significant impact on migration and if policy is very likely to change over the long-term projection period, we need to make a choice. One choice would be to concede policy to the realm of “scenario analysis” and go ahead and construct the model without demand-side drivers. Hatton and Williamson (2001), in a study that assesses the potential for future migration from Africa, coin the term “migration pressure” to describe this sort of approach. Migration pressure is future migration assuming no destination-country policy change; presumably, policy can either accede to this pressure or not. Borjas once wrote that “the literature does not yet provide a systematic analysis of the factors that generate the host country’s demand function” (Borjas 1994, 1693). If that is true, then perhaps the migration pressure perspective is the best we can hope for. The other choice would be to try to develop a genuinely endogenous policy driver—a goal which, thanks to recent historical and attitudinal research, may not be so unreachable after all. Admittedly, the path will not be easy. The first hurdle is to untangle the causal chains that determine national immigration policy. Since all of today’s large destination countries are democracies, it might seem natural to look first at public attitudes and then, in turn, at what drives those attitudes. Unfortunately, a quick look at the politics of immigration reveals that the causal chain is not so direct. According to surveys, the public in most of today’s destination countries is overwhelmingly in favor of less 67 immigration. What actually maintains the flow of legal immigration at current or rising levels is a confluence of several decidedly undemocratic forces—such as business lobbies (since capital clearly benefits from an influx of labor), humanitarian lobbies (including interest groups who desire immigrant support), and the judicial system (which often overrides elected officials in granting immigrants due process). If “client politics” on this issue so clearly trumps “majoritarian politics”—to borrow from James Q. Wilson’s typology of policy environments (Wilson 1980)—then we would need some method of forecasting the future of client politics, and this hardly seems possible at all. Yet perhaps we can retrieve the role of public opinion by imagining it (as Wilson often does) as a factor that intervenes decisively only when certain predictable forces trigger it into action. In this view, client politics prevails until certain events or trends empower majoritarian politics, which in turn enables public opinion to reshape the policy regime. Among possible trends, one good candidate is the adverse distributional impact of immigration—namely, the disproportionate fall in unskilled wages (and the rise in household inequality) that typically accompanies a large influx of unskilled labor.15 If the fall were sufficiently large and affected a sufficient share of residents, could it propel a decisive wave of restrictive opinion? In their research on the growing restrictiveness of immigration policy of major destination countries from 1880 to 1930, Williamson and his associates argue that indeed it could (Timmer and Williamson 1996 and 2004; O’Rourke and Williamson 1999; Chiswick and Hatton 2002; Hatton and Williamson 2003). They show that in each country the restrictive turn in immigration policy followed predictably (with a fixed lag) after a migration-induced drop in the ratio of unskilled wages to national average wages. Other variables, such as downturns in overall GDP and wages, also contributed, but large relative declines in unskilled wages played the dominant role. “Over the long haul,” conclude O’Rourke and Williamson, “the New World countries tried to protect the economic position of unskilled workers. Labor became relatively more abundant when immigrants poured in, and governments sought to stop any absolute decline in the wages of the native unskilled with whom the immigrants competed, and often even in their wages relative to the average income recipient” (O’Rourke and Williamson 1999, 205). Other historians have confirmed that electoral politics served as a critical link between wage pressure and restriction. Looking at U.S. congressional votes during the same era, for example, Goldin (1994) shows that representatives from nonimmigrant districts with large shares of low-skilled workers voted heavily in favor of restrictive policy. After first the U.S. southern states and then the upper-Midwest were won over, the protectionist cause ultimately prevailed. 15 The vast majority of immigrant workers are unskilled in every major destination country. In Global Economic Prospects, the World Bank calculates that 89 percent of immigrant workers in all high income countries were unskilled as of 2001 (World Bank 2006). Though the issue is controversial, it is also widely believed that a large influx of unskilled workers pulls down unskilled wages. From 1980 to 2000 in the United States, Borjas (2003) concludes that immigration caused a 9 percent decline in the wages of native workers without a high school degree. 68 Several decades later, in the 1960s, most destination countries relaxed their immigration restrictions. Why? Chiswick and Hatton hypothesize that these liberalizing policy changes were driven by reverse trends among voters. “The rapid growth of real wages, narrowing income distributions, diminishing skill differentials, and falling foreign born shares should all have eased the pressure for restriction,” they write. “This was reflected in broadening access to previously excluded groups. European recruitment policies of the 1960s, the United States Immigration Amendments of 1965, and Australia’s abandonment of its British-only policy were preceded by a slowdown in the most desired source of immigrants” (Chiswick and Hatton 2002, 37). The circle keeps turning. Today, write O’Rourke and Williamson, the public attitude drivers have shifted yet again. “Increases in the real income of the unskilled slowed dramatically after the early 1970s, and some economists argue that there has been little or no growth of unskilled real wages and incomes at all since then. We should therefore not be surprised by the renewed interest in reducing immigration over U.S. and European borders…” (O’Rourke and Williamson 1999, 206). Thanks to recent survey research, we now have a deeper understanding of how the distributional consequences of immigration affect public attitudes toward immigration policy (e.g., Espenshade and Hempstead 1996; Sheve and Slaughter 2001; Kessler 2001; O’Rourke and Sinnott 2004; Mayda 2004, 2005). Nearly all researchers have found that, in the major destination countries, restrictionist opinion is to some degree driven by noneconomic attitudes like ideology and chauvinism (and influenced by gender and race). But a growing number are also finding that restrictionist opinion is strongly and independently driven by skill level and labor-force participation. In affluent countries, low-skilled workers are much more restrictionist than high-skilled workers (who, theory suggests, may actually gain economically from low-skilled immigration). What’s more, the opinion gap declines as either the affluence of the country declines or as the relative skill level of immigrants increases. In sampled poor developing countries, in fact, the gap reverses: The low-skilled favor immigration, while the high-skilled want restriction. All these findings suggest that people’s attitudes are indeed strongly influenced by their economic self interest. Testing these insights for relationships that could be useful in a projection model remains, of course, a difficult proposition. Even if we agreed that public attitudes toward immigration policy are powerfully determined by observable economic and demographic variables, we would still be uncertain that we have identified all the causal links to actual policy change—and to explain them, we would still need variables that can themselves be projected. These variables, moreover, must be investigated and modeled over very long historical periods. Researching a reliable endogenous policy driver—more than the other drivers—will require the preparation of continuous data series stretching well over a century, preferably for a number of destination countries of similar affluence and size. 69 Here are some driver suggestions. Although we have no direct way of projecting the gap between low-skilled and average wages16 (a gap that figures heavily in the historical modeling), it should be possible for us to keep an inventory of the education level of the immigrant stock over time. Recall that we are already tracking the education level in each origin country j and keeping an inventory of the country j stock by birthyear and arrival year. If we assume a fixed (or modeled) relationship between the educational level of country j and the educational level of country j’s yearly migrants to the destination country, we would be able to keep a matching educational level inventory. By aggregating the inventories from all origin countries, we could create an inventory of total immigrant stock by educational level. This in turn could generate such variables as TSTOCKt* (total immigrant stock) and TSTOCKEDt* (average educational level of TSTOCKt*). Assuming (as researchers often do) that the proper measure of educational level is a workable proxy for skill level, we can then construct two driver terms: TSTOCKt* policy term (1) = and PTd,t* TSTOCKt* EDd,t*-TSTOCKEDt* policy term (2) = EDd,t* PTd,t* Both terms are structured to equal zero at neutrality. The first term is simply the total stock of all immigrants as a share of the total population of the destination country. This will capture the extent to which the perceived economic cost due to immigration— as well as the perceived noneconomic cost—can be explained simply by the relative number of resident immigrants. Surprisingly, foreign-born stock measures have not often been tested for their correlation with restrictionist attitudes. The second term is essentially the first term times the education (i.e., skills) gap between the immigrant stock and the entire destination country. This will capture the aggregate impact of the wage gap. Both of these terms may test better in models if they are refined so that they exclude or give lesser weight to immigrants who are younger or older than working-age or who have resided in the destination country for more than a threshold number of years (at which time they may be better assimilated or have acquired more skills and education). We might even imagine a weighted “depreciation schedule” for the stock that would gradually slope down after the year of arrival. We should also be prepared to test for a long lag value for t* on this driver. If the institutional shape of the labor market (for example, a “dual labor market”) concentrates the effect of low immigrant wages on a small and segregated work sector, it may for some time persuade most median and upper-income voters that immigration does indeed work to their economic advantage. Eventually, either the negative wage effect will spill 16 As pointed out earlier, it may eventually be possible to design economic growth models that can project skilled-unskilled wage differentials in major destination countries. The discussion here assumes this is not possible. 70 over into native unskilled work sectors or, as a rising number of immigrants and their children become voters (in a generational dynamic suggested by Ortega 2005), the foreign-born community itself will push for restrictive policies.17 Even after median voters begin to see immigration as an economic penalty, however, it may take time for them to make their views known. And even after their views are known, it may take time for legislators and administrators to respond effectively. For all of these reasons, O’Rourke and Williamson (1999) find long lags between wage trends and policy responses in their research. They take strong issue with historians who see major restrictionist laws in the 1920s (especially in the United States) as a reaction to the global disruption caused by World War I. Actually, they note, the restrictionist mood in America had acquired an alarmist tone by the early 1890s, and by World War I restrictionists had already waged many near-miss efforts to overhaul U.S. immigration law. Finally, when testing these drivers against policy outcomes, we need to settle on a method of measuring the magnitude of those outcomes. The primary method should be to use the intercept values of dummy variables for policy eras (see next section), and then to derive from them an estimate of the total immigration shift due only to change of policy regime. The fit here cannot be expected to be close, since the dependent variable will typically be very discontinuous—flat with sudden jumps.18 A supplementary method would be to construct a more continuous policy response variable out of events that reflect the intensity of political efforts to change policy (see the policy index created for five countries by Timmer and Williamson 1996, 1998). Such an index would allow modelers to check their results for plausibility against an outcome measure that is much more sensitive to underlying political pressure. MODELING WITH ERAS AND COUNTRY-SPECIFIC EFFECTS The sixth module is defined for origin country j and year t as follows: x ∑ζ X i ijt * i=1 This term describes a number (x) of additive drivers Xi, each with a model-tested coefficient ε i . These “drivers” are in fact simply intercept dummy variables. Their purpose is to improve the model’s fit by allowing certain categories of data to generate immigrationrate results that differ from the rest by a fixed value. We introduce them when we have 17 Keep in mind that the negative wage impact of new immigrants falls most heavily on previous immigrants, especially in the presence of a dual labor market. If immigration causes the workforce of the developed world to grow by an extra 3 percent between 2005 and 2025, it is estimated that over half of the aggregate income loss to low-income workers ($88 billion annually by 2025) would be borne entirely by foreign-born workers themselves (World Bank 2006). 18 Special statistical techniques may be called for to handle outcomes that (in this case) share some properties of a continuous variable and others of a discrete variable. 71 good reason to believe that the categories ought to produce different results for some constant reason that we cannot observe or measure directly. One category is groups of years that seem to define separate legal regimes for immigration. When modeling immigration in the United States, for example, we would want to distinguish between results before and after the McCarren Walter Act of 1924, the 1965 amendments to the Immigration and Nationality Act, and the Immigration Reform and Control Act of 1986. We know that the size and direction of immigration flows were suddenly shifted by these laws. Dummy variables corresponding to these periods enable us to model the effects of our other drivers without letting these regime changes disturb our findings. In effect, they “allow for” a fixed shift up or down for each origin country during each regime. Creating dummy variables to reflect abrupt policy change also serves to furnish a dependent variable against which we can model our own endogenous policy drivers (see previous section). For any given origin country, whatever is uniquely caused by policy change will show up in the intercept value. Summed over all origin countries, the results will indicate the total impact of policy change between the two eras. The other category is countries. Most models that focus on one destination country employ intercept dummies to allow the outcome for each origin country or region to differ from the rest by some invariant or “fixed” effect. As Fertig and Schmidt explain, “most empirical studies employ a set of dummy variables to capture (often quite persistent) institutional and/or legal aspects, like e.g. EU membership, or a common border or language” (Fertig and Schmidt 2000, 6). Because the number of dummies should be kept to a minimum (to avoid diluting the data), modelers will sometimes group similar types of countries together into regions. Used judiciously, such dummy variables can greatly improve the fit (R-squared) of the model. They free us from assuming that an Algerian and a Mexican with identical personal characteristics would be equally likely to migrate to the United States—or to France.19 The only other way to account for fixed country differences is to try to model them directly. Some researchers have attempted this fairly successfully, often in studies that group many destination countries (e.g., Mayda 2005 or “gravity models” like Karemera et al. 2000). Examples of fixed-effects drivers with demonstrated statistical power include the following: (1) distance (between destination and origin country): miles (2) landlocked (origin country): yes, no (3) common border: yes, no (4) common language: yes, no (5) former colony: yes, no (6) civil liberties rating: Freedom House Index, 1 to 7 (7) political freedom rating: Freedom House Index, 1 to 7 19 To be sure, part of the greater likelihood of the Mexican coming to the United States or the Algerian coming to France would be captured by our STOCK driver, a proxy for the network effect. But tests show clearly that not all of it is captured. 72 The last two of these drivers are not really “invariant” over long time periods, and many are yes-no dichotomous (which makes them just another kind of dummy variable). But all together, in many models, they explain most of the fixed differences between countries that all of the other drivers leave unexplained. As such, they take the burden off the country dummies—and may allow the modeler to use fewer of them. Modeling invariant country differences may serve another important purpose as well. When these drivers are included, we can try to estimate, for each country, the share of the fixed difference with other countries that is due mainly to political institutions— and not due to geography and history. This enables us, at least in this corner of our projection model, to address questions about policy regimes in origin countries. Let us suppose, for example, that a fully tested model of U.S. immigration with country dummies generates very different (positive or negative) fixed effects for Nigeria, Brazil, India, China, and the Philippines. For each country, how much of the unexplained gap is the statistically predictable result of distance, common language, and former political ties? And how much of it, instead, lies in political (or cultural) imponderables? Modeling the invariant differences helps us answer these questions. No matter how long the projection period, geography and history won’t change—but politics may, dramatically. Even if such insights are not solid enough to provide a basis for quantitative projections, they certainly offer abundant opportunities for informed scenario analysis. PROJECTING VOLUNTARY GROSS EMIGRATION AND NET INVOLUNTARY MIGRATION Early in this chapter, we divided the total net migration projection into three components: Voluntary gross immigration, voluntary gross emigration, and all forms of net involuntary migration. Thus far, we have focused on building a projection model for the first component, which is certainly the most consequential. Now let’s turn briefly to the challenge of projecting the other two components. Voluntary Gross Emigration In most of the large developed countries, the great majority of emigrants consist of foreign-born residents, most of whom (the data are unclear) are presumably moving back to their country of origin. The reason: Native residents in affluent countries have little reason to emigrate, while the evidence is clear that anyone who migrates once is much more likely to migrate again. In the United States, for instance, over 80 percent of all emigrants in recent years have been foreign-born. The emigration rate of foreign-born U.S. residents (around 12.0 per 1,000) is more than 50 times the rate of native U.S. residents (just under 0.2 per 1,000). Jasso and Rosenzweig (1982) estimate that 30 percent of all U.S. immigrants eventually emigrate—sometimes after many years as U.S. residents. In other developed countries, the ratios are similarly skewed. Compared with the United States, a greater share of native EU residents emigrate to non-EU countries for economic reasons, but a greater share of foreign-born EU residents also emigrate back home, leaving total EU emigration as dominated by the foreign-born as U.S. emigration. According to one study 73 (Bohning 1981), two-thirds of all foreign workers admitted to West Germany from 1961 to 1976 eventually returned home, including 9 in 10 Italians, 8 in 10 Spaniards, and 7 in 10 Greeks. It is important to keep in mind, of course, that many (often most) of these returnees eventually migrate back again to the destination country. Indeed, large numbers of people migrate and re-migrate several times over. These facts help explain why the quality of data on emigration is so much worse (even) than the quality of data on immigration. Not only do most countries keep poorer records on emigration, but the very definition of emigration may vary between countries: What one country (for example, the United States) may regard as temporary moves before permanent residency, another (in the EU) may regard as several discrete acts of “immigration” and “emigration.” These facts also explain why any analysis of emigration is so closely bound up with the estimation and projection of immigration. To a large extent, emigrants from developed countries are the immigrants of an earlier year. So how should emigration be modeled and projected? First, the modeler needs to examine carefully the destination country’s migration data. If they include large categories of short-term residents who typically soon become emigrants, it might make sense to “net out” these numbers altogether. If the emigration data are very poor, it might even be better to disregard foreign-born emigration entirely and, with assistance from population censuses, adjust the numbers so that immigration is handled entirely on a “net” basis. (Unfortunately, this radical move comes with an information cost, such as the inability to distinguish a rise in foreign-born backflow from a decline in new arrivals.) Next, assuming the emigration count is preserved, the modeler should assemble a profile of foreign-born emigrants by country of origin, age, and date of arrival. The profile can then be used to project future emigration. Some governments already do this. The U.S. Census Bureau, for instance, currently assembles a profile by major country or region (estimated from resident population surveys over the last decade), which it then applies to the U.S. foreign-born population to generate an emigration projection series through the year 2100 (U.S. Census Bureau 2000).20 The profile takes age, sex, and country of origin into account. Apparently, country of origin makes a big difference. Borjas and Bratsberg, who have analyzed data on the legally immigrated foreign born, find that U.S. emigration rates are higher for near countries (Latin America) than distant countries (Asia), and higher for countries with higher rather than lower GDP-per-capita. “Immigrants tend to return to countries that are not distant and that are not poor,” they conclude (Borjas and Bratsberg 1996, 175). Such correlations suggest that there may be room to create a model with drivers that would project future changes in the emigration rate by country. Assuming constant future rates based on recent historical data, however, ought to be sufficient. 20 This is the only component of the U.S. Census Bureau’s migration projection that uses a rate rather than an absolute number. It is worth noting, as well, that using rates causes the net emigration series in the high and low Census immigration projections to “cross over” in the year 2054. The low projection starts with a higher emigration rate and flow than the high projection. Yet in the high series, the foreignborn stock grows much faster. Eventually, the larger size of the foreign-born stock more than makes up for the smaller rate of emigration. In 2055 and after, the emigration flow is larger in the high projection. 74 Once future emigration rates by country of origin are projected, we need to estimate how many emigrants will in turn re-immigrate to the destination country. This re-immigration rate, which is typically much higher than the rate for the never-migrated population, can be estimated (at least approximately) by detailed immigrant surveys. We will then need to estimate how many of these second-time immigrants will re-emigrate, and so forth. Constant and Zimmerman (2003) show how the steady state for such flows can be easily determined via Markov Chain analysis. In effect, each year of immigration from each origin country will trigger in the model a decaying series of counterflows and reflows out into every future year t, with their size determined by fixed rate parameters. Every future year of counterflow (emigration) needs to be subtracted from the foreignborn stock for that country. And every future year of reflow (re-immigration) needs to be added to the foreign-born stock for that country, as well as to country’s future immigration flow.21 The emigration of native residents from most developed countries is driven by a number of major factors other than employment (leisure, retirement, business) and thus is not easy to model. Fortunately, it is typically small enough—a mere 48,000 annually in the U.S. Census estimate—as to require no elaborate procedure. For the United States, projecting a fixed rate of the native resident population is probably sufficient. For a smaller and less affluent developed country, a more complex projection procedure may be required. Net Involuntary Migration As explained early in the chapter, most net involuntary migration consists of net inflows of refugees and asylees who did not, for the most part, choose either how or when they left their home country or how or where they would find a new country. Identifying the share of involuntary migrants who are in fact voluntary depends, unavoidably, on qualitative judgment. Much will depend on the laws and policies of the destination country and on whether one can distinguish usefully among legal or administrative categories of new arrivals. We suggested earlier that the share of U.S.-style refugees who would qualify as essentially involuntary is probably larger than the share of EU-style asylees, many of whom clearly use their asylum-applicant status as a method of migrating (legally or illegally) to their destination country of choice. Once a flow of involuntary refugees and asylees has been established for an historical base period, there may be no elegant way to project it. One simple rule of thumb would be to express the flow as a share of the total population of all the developing countries (or perhaps of all other countries, developing and developed), and then to apply that rate to the totals in every future year. It would be nice to be able to be more specific about the population at risk. Over a very long projection period, however, it seems practically impossible to discount the likelihood of refugee- and asyleegenerating catastrophes—wars, civil wars, revolutions, insurrections, repressions, or natural disasters—in any part of the world, even the affluent world. If the voluntary 21 When modeling historical data this reflow should be subtracted from later observed immigration totals; it is only the remainder, comprising first-time movers, that needs to be explained by the model for voluntary immigration. 75 immigration model uses an endogenous policy driver, the future outcome of that driver should affect this flow as well. The net flows of other involuntary migrants (such as the movement of government personnel) are likely to be small. Here again, modelers will need to develop simple projection rules appropriate for the particular destination country’s situation. TAKING THE NEXT STEPS As should be obvious from the foregoing discussion, designing, building, and testing a long-term immigration projection model is a large project. Thankfully, it need not be an all-or-nothing project. We have pointed out that agencies can do as little or as much as they like. They could greatly improve their projections even if they were to adopt only the relatively safe (demographic) modules. Going further and taking greater risks—for example, in trying to develop an endogenous policy module—is an option, nothing more. Some agencies may choose it, others not. Nonetheless, no matter how much or little is attempted, building any projection model will require moving through several involved steps of preparation and execution. Each of these steps—we mention five here—will be a sizable task in its own right. Though they are described here as “steps,” the order is only approximate. None of them, in other words, will be entirely complete until the projection model is generating results. The first step is to improve the migration data—which, for many developed countries, are so partial and fragmented as to be practically unusable. We have repeatedly stressed how important it is to analyze and refine the available data so that modelers have at their disposal a reliable, continuous, and long-term data series for bilateral migration flows by country of origin. These should include a best estimate for illegal flows and be accompanied by foreign-born stock data. For modeling certain drivers, especially the policy drivers, the series must cover observations across very long historical periods—going back into the nineteenth century and spanning several major shifts in policy regime. It would help as well to be able to include data on other countries similar (historically and economically) to the destination country under study. The second step is to examine carefully the proposed drivers. Which functional form best fits our theoretical expectation? Which historical data series best fits the independent variable within the driver? Which data series offers the most frequent and most reliable values over the longest time period? Which data series can be most easily projected into future years? Sometimes, these questions can be theoretically difficult. Which of many inequality indices, for example, best embodies the concept described by the new economy school? At other times, the modeler will have to make trade-offs. The best wage-gap measure for historical modeling, for example, may not be one that is projectable into the future. The third step is to evaluate the estimating equations and test results from a statistical perspective. Are any of the drivers likely to be biased? How are missing observations to be handled? Does the chosen estimator generate a maximum likelihood 76 result for the panel data in question? Once the results are in, do they exhibit any of the classic trouble signs such as excessive correlation between independent variables or nonrandom error terms? Statistical methods need to be kept in mind throughout the entire process of projection design, from creating drivers to testing results. The fourth step is to project future values for all of the independent variables required by the drivers. This may involve making entirely new projections, as with our endogenous policy driver. Or it may involve using the projections of other agencies or experts. If modelers rely on the global demographic or economic projections of the UN or the World Bank, they are essentially borrowing the fertility, longevity, and production function assumptions (among others) underlying those projections. Sometimes it will involve a little of both. To project inequality and poverty, for example, we suggested a modeled or hypothesized relationship with real GDP per capita, which may in turn be derived from an outside projection. The fifth step is to assess the compatibility among projected independent variables and the influence of global feedbacks. There is no such thing as a general equilibrium model of all global trends. By and large, we can only handle partial equilibriums—and we have only the most limited understanding of the interaction between trends in broad disciplines such as demographics, economics, and politics. Ultimately, it is up to the modelers to use their qualitative judgment to assess, for example, whether the assumed demographic future for each country is tolerably consistent with its assumed economic future. If not, they will need to intervene and make adjustments. Likewise, it is up to the modelers to reflect on the possible avenues by which these futures could generate rest-of-world feedbacks or by which the migration outcome may itself affect these futures. In some cases, the feedbacks can be integrated into the model. In other cases, they can be dismissed as not quantitatively significant. No one seriously believes that social science is on the verge of constructing a “unified field theory of immigration” that takes into account all the dimensions of this extraordinarily complex phenomenon. Any projection model will be partial and approximate and perhaps less than elegant. It will have to wrestle with questionable data. It will have to splice together or at least reach a compromise between hostile theoretical perspectives. And it will have to cut corners on feedback effects. Even with all this, however, the implementation of a driver-based projection model would constitute a vast improvement over anything now attempted by current projection practice. 77 CONCLUSION A central finding of this report is that there exists a wide chasm between the rudimentary state of immigration projection practice and the rich explanatory potential of theoretical and empirical research into the causes of international migration. What continues to hinder advances in practice are not just the limitations of projection method, but a widespread pessimism about the very possibility of improvement. In our view, this pessimism is mistaken. We have tried to show that, looking at the very long term, it is possible to identify connections between immigration and other social, economic, and political variables that can be projected with some confidence. We have also explained how these insights about the underlying drivers of immigration can be consolidated and integrated into a useable projection model. Developing a driver-based projection model like the one we outline could have enormous payoffs. First and foremost, of course, is the promise of better population projections. We are now entering a new demographic era in the developed countries in which immigration is likely to be the dominant component of the population projection puzzle for the foreseeable future. Even as fertility rates in the developed countries have plunged, net immigration rates have surged, more than doubling in the United States and Western Europe as a whole since the 1960s. On a yearly basis, net immigration now accounts for roughly two-fifths of total population growth in the United States and nearly nine-tenths of total population growth in EU-15. It not only dominates aggregate change in Europe, it also dominates the change in most individual countries. From 2002 to 2003, according to Eurostat, net migration (as opposed to natural increase, or births minus deaths) was the most important component of population change in 26 of the 45 countries in the Council of Europe for which data are available (Salt 2005). In this demographic environment, the wide range of uncertainty about future immigration levels has become a major problem. It bears repeating that the spread between the “low” and “high” immigration variants for the U.S. Census Bureau projection for the national population in 2100 is a colossal 417 million persons—more than the spread between its low and high fertility and mortality assumptions combined. Better population projections can in turn better inform policymaking. After all, projections of the size, age structure, and national origin of the population are crucial to understanding and preparing for many of tomorrow’s most important challenges. Demographic trends are at the heart of the current debate over the sustainability of payas-you-go retirement and health-care systems in the developed countries. They directly affect the long-term prospects for economic and living standard growth. And they will help shape the geopolitical contours of the twenty-first century in ways that could prove even more fateful. Think of how the size and composition of the immigrant population in a country like France is already affecting social cohesion and political stability. Or the ways in which the future size (both relative and absolute) of the youth population in the United States may affect its ability to maintain national and global security. 78 As we stressed earlier, projections are not predictions. No model, no matter how powerful, can actually tell us what future immigration flows will be. It may therefore be desirable to turn the projections into forecasts by assigning confidence intervals to the key assumptions, perhaps with the assistance of the Delphi method to survey the opinion of social scientists and policy experts. The advantage of this approach is that, by making the projections stochastic, it is possible to generate a probability distribution for a range of immigration and population outcomes. The disadvantage is that using confidence intervals can mask rather than clarify the critical role of the chosen assumptions. Another option is to supplement the projections with scenario analysis. Although the model’s drivers are based on empirically well-established relationships, the specification of some will nonetheless involve choices between competing economic theories and visions of the future. Will per-capita GDP in the developing and developed worlds converge—and if so, how fast? What is the likely future trend in the volume of global trade or the pace of technological innovation? There is also the issue of wild cards. What happens if economic growth greatly accelerates in India? Or if China eliminates restrictions on emigration? The model would allow policymakers to plug in alternative assumptions and generate alternative scenarios. Besides producing projections, the model is thus also a powerful analytical tool. Unlike stochastic forecasting, using the projection model for scenario analysis would not require additional development. Taken together, the projection and scenario-building capabilities of the model could help illuminate some of the most consequential policy issues of the twenty-first century. The following list gives an idea of the range of questions the model could address: • Many U.S. policymakers favored NAFTA in part because they assumed that free trade would ultimately reduce Mexican immigration to the United States. Since NAFTA, however, immigration has risen, not fallen. Were policymakers wrong in assuming that trade and immigration are substitutes? Is Mexico an exception to the rule? Or did other developments intervene? The model would be able to isolate the independent impact on immigration of greater trade between the United States and Mexico or other countries in Latin America. • Many policymakers, especially in Europe, similarly favor development aid because they assume that it will reduce migration pressure. The idea is that higher incomes in the Middle East or Africa will reduce incentives to migrate. Whether rising incomes restrain or encourage emigration, however, depends on how developed the country is. As we have seen, the development hump is nonlinear—that is, it slopes up and then down. The model would be able to quantify the impact that higher per capita income, lower absolute poverty, or higher educational attainment is likely to have in countries at different stages of development. • It is often remarked that China today generates very little emigration for a country of its population and living standard. How much of this reality is due to China’s geography, history, and culture—in other words, to factors that will not change— 79 and how much is due to restrictive government policy? The model would be able to isolate the effect of China’s current policy regime—and hence tell us how much emigration is likely to rise if economic reform ultimately leads to political liberalization. • Many policymakers hope that more immigration from younger and faster growing developing countries in the future will help provide economic and fiscal support for aging welfare states throughout the developed world. What they often overlook is that the growth of old-age benefit programs may itself discourage immigration. The model not only projects immigration in a no-change future, it could also tell policymakers how reforms to old-age entitlements might affect the final outcome. • Population aging is not just a phenomenon of the developed world. Falling fertility and rising longevity will soon lead to a dramatic aging of the population in East Asia and much of Latin America—and this in turn could have a dramatic impact on global migration patterns. Will slower population growth in Latin America translate into less emigration in future decades? Will faster growth in Africa translate into more? And among African countries, which are likely to receive a further emigration boost from higher levels of education and economic development? The model could tell policymakers how divergent demographic— and development trends—are likely to affect the size and composition of future migration flows. Developing a driver-based immigration model will not be possible without a great deal of research and effort. Although the model could be constructed in stages, with new modules being added over time, building even a minimal functioning model would be a major undertaking that may require bringing together immigration theorists, empirical researchers, and projection experts for a multi-year project. While the academic community would need to contribute essential expertise, it may not have either the resources or the inclination to launch and manage the overall effort. In all likelihood, the project would need to be undertaken by some official agency that already has the responsibility for making long-term projections—or perhaps, as the cooperative effort of several such agencies. These organizations are in the best position to make productive use of the results. And it is their “clients”—namely the public and government policymakers—who have the most to gain from a successful outcome. 80 APPENDIX CSIS WORKING GROUP ON LONG-TERM IMMIGRATION PROJECTIONS As part of its project on long-term immigration projections, the CSIS Global Aging Initiative convened a working-group made up of roughly 25 immigration experts, including demographers, economists, and representatives of major projection-making agencies. The working group met for two all-day roundtable sessions, the first on March 17, 2005 and the second on September 8, 2005. The discussions provided many valuable insights that helped inform the current report. Five of the working group members were asked to prepare working papers: Jan Hofmann, Wolfgang Lutz, Anna Maria Mayda, Douglas S. Massey, and Oded Stark. Two of the papers—those by Massey and Lutz—deal broadly with the challenges involved in building a long-term immigration projection model. Massey discusses the kinds of drivers that theory suggests should be included, while Lutz focuses more on model design issues. The remaining three papers—those by Hofmann, Mayda, and Stark—explore specific dimensions of the migration dynamic that the authors thought would benefit from additional analysis. Hofmann looks at the role of trade as an immigration driver, taking the case of Germany as an example; Mayda looks at the role of immigration policy, and in particular how it can be made endogenous to a model; Stark looks at the role of income inequality in origin countries. An annex volume containing the working papers can be downloaded from the Global Aging Initiative website at www.csis.org/gai. A complete list of working group members follows here: Barry Edmonston Director Center for Population Research and Census Portland State University Thomas Buettner Chief Estimates and Projection Section UN Population Division David Coleman Professor of Demography Department of Social Policy and Social Work University of Oxford Thomas Espenshade Professor of Sociology Office of Population Research, Woodrow Wilson School Princeton University Nicholas Eberstadt Henry Wendt Chair in Political Economy American Enterprise Institute Stephen Goss Chief Actuary U.S. Social Security Administration 81 Michael Hoefer Director Office of Immigration Statistics Department of Homeland Security Steven Nyce Senior Research Associate Watson Wyatt Worldwide Jeffrey Passel Senior Research Associate Pew Hispanic Center Jan Hofmann Senior Analyst Deutsche Bank Research Jürgen Schaaf Senior Economist Deutsche Bank Research Frederick Hollmann Statistician Population Projections Branch U.S. Census Bureau Sylvester Schieber Vice President and Director Watson Wyatt Worldwide Neil Howe Senior Advisor Global Aging Initiative Center for Strategic and International Studies Oded Stark University Professor and Research Director Universities of Bonn, Klagenfurt, and Vienna Richard Jackson Program Director Global Aging Initiative Center for Strategic and International Studies Michael S. Teitelbaum Program Director Alfred P. Sloan Foundation Alice Wade Deputy Chief Actuary U.S. Social Security Administration Wolfgang Lutz Leader World Population Program International Institute for Applied Systems Analysis Norbert Walter Chief Economist Deutsche Bank Research Anna Maria Mayda Assistant Professor School of Foreign Service and Department of Economics Georgetown University Jeffrey Williamson Laird Bell Professor of Economics Department of Economics Harvard University Douglas S. Massey Professor of Sociology and Public Affairs Woodrow Wilson School Princeton University Hania Zlotnik Director Population Division/DESA United Nation 82 BIBLIOGRAPHY OF CITED SOURCES 2003 Technical Panel on Assumptions and Methods. 2003. Report to the Social Security Advisory Board. Washington, D.C.: Social Security Administration. Adams, W. 1969. The Brain Drain. New York: Macmillan. Ahlburg, D. A., and W. Lutz. 1998. “Introduction: The Need to Rethink Approaches to Population Forecasts.” Population and Development Review 24, Supplement: Frontiers of Population Forecasting: 1-14. Ambrose, S. E. 2000. Nothing Like It in the World: The Men Who Built the Transcontinental Railroad, 1863-1869. New York: Simon & Schuster. Bauer, T. K., and K. F. Zimmermann. 1999a. “Assessment of Possible Migration Pressure and its Labour Market Impact Following EU Enlargement to Central and Eastern Europe.” IZA Research Report no. 3. Bonn: Institute for the Study of Labor. Bauer, T. K., M. Lofstrom, and K. F. Zimmermann. 2000. “Immigration Policy, Assimilation of Immigrants and Natives’ Sentiments towards Immigrants: Evidence from 12 OECD Countries.” IZA Discussion Paper no. 187. Bonn: Institute for the Study of Labor. Bean. F., R. Corona, R. Tuiran, K. Woodrow-Lafield, and J. Van Hook. 2001. “Circular, Invisible, and Ambiguous Migrants: Components of Difference in Estimates of the Numbers of Unauthorized Mexican Migrants in the United States.” Demography 38, no. 3: 411-422. Benhabib, J. 1996. “On the Political Economy of Immigration.” European Economic Review 40: 1737-1743. Bocquier, P. 2004. “World Urbanization Prospects: An Alternative to the UN Model of Projection Compatible with Urban Transition Theory.” Working Paper no. DT/2004/08. Paris: Développement, Institutions & Analyses de Long Terme (DIAL). Bohning, W. R. 1981. “Estimating the Propensity of Guestworkers to Leave.” Monthly Labor Review 104, no. 5: 37-40. Bongaarts, J., and R. A. Bulatao, eds. 2000. Beyond Six Billion: Forecasting the World’s Population. Washington, D.C.: National Academy Press. Borjas, G. J. 1987. “Self-Selection and the Earnings of Immigrants.” American Economic Review 77, no. 4: 531-553. ———. 1989. “Economic Theory and International Migration.” International Migration Review 23, no. 3: 457-485. ———. 1990. Friends or Strangers: The Impact of Immigrants on the US Economy. New York: Basic Books. 83 ———. 1994. “The Economics of Immigration.” Journal of Economic Literature 32, no. 4: 1667-1717. ———. 1999. “The Economic Analysis of Immigration.” In Handbook of Labor Economics, vol. 3A, eds. O. Ashenfelter and D. Card. New York: North-Holland, pp. 1697-1760. ———. 2002. The Impact of Welfare Reform on Immigrant Welfare Use. Washington, D.C.: Center for Immigration Studies. ———. 2003. “The Labor Demand Curve Is Downward Sloping: Reexamining the Impact of Immigration on the Labor Market.” Quarterly Journal of Economics 118, no. 4: 1335-1374. Borjas, G. J., and B. Bratsberg. 1996. “Who Leaves? The Outmigration of the ForeignBorn.” The Review of Economics and Statistics 78, no. 1: 165-176. Brücker, H., and B. Siliverstovs. 2004. “The Macro-Determinants of International Migration in Europe: Evidence from Germany.” Paper prepared for the Immigration Issues in EU-Turkish Relations Conference, October 8-9, Istanbul. ———. 2005. “On the Estimation and Forecasting of International Migration: How Relevant Is Heterogeneity across Countries?” IZA Discussion Paper no. 1710. Bonn: Institute for the Study of Labor. Cain, G. 1976. “The Challenge of Segmented Labor Market Theories to Orthodox Theory: A Survey.” Journal of Economic Literature 14, no. 4: 1215-1257. Castells, M. 1989. The Informational City: Information Technology, Economic Restructuring, and the Urban-Regional Process. Oxford: Blackwell Publishing. ———. 2000. The Rise of the Network Society. Oxford: Blackwell Publishing. Castles, S. 2004. “Why Migration Policies Fail.” Ethnic and Racial Studies 27, no. 2: 205-227. Castles, S., and M. J. Miller. 1993. The Age of Migration: International Population Movements in the Modern World. New York: Guilford Press. Chiswick, B. R., and T. J. Hatton. 2002. “International Migration and the Integration of Labor Markets.” IZA Discussion Paper no. 559. Bonn: Institute for the Study of Labor. Chu, J. 2004. “How to Plug Europe’s Brain Drain.” Time Europe Magazine 163, no. 3 (January 19). Clark, X., T. J. Hatton, and J. G. Williamson. 2002. “Where Do U.S. Immigrants Come From, and Why?” NBER Working Paper no. 8998. Cambridge, MA: National Bureau of Economic Research. ———. 2003. “What Explains Cross-Border Migration in Latin America?” Harvard Institute of Economic Research Discussion Paper no. 2012. Cambridge, MA: Harvard Institute of Economic Research. ———. 2004. “Explaining US Immigration 1971-1998.” World Bank Policy Research Working Paper no. 3252. Washington, D.C.: World Bank. 84 Constant, A., and D. S. Massey. 2003. “Labor Market Segmentation and the Earnings of German Guestworkers.” IZA Discussion Paper no. 774. Bonn: Institute for the Study of Labor. Constant, A., and K. F. Zimmermann. 2003. “The Dynamics of Repeat Migration: A Markov Chain Analysis.” IZA Discussion Paper no. 885. Bonn: Institute for the Study of Labor. Cornelius, W. A. 1989. “Impacts of the 1986 US Immigration Law on Emigration from Rural Mexican Sending Communities.” Population and Development Review 15, no. 4: 689-705. Cornelius, W. A., T. Tsuda, P. L. Martin, and J. F. Hollifield, eds. 2004. Controlling Immigration: A Global Perspective. 2nd ed. Stanford, CA: Stanford University Press. de Vasconcelos, P. 2005. “Improving the Development Impact of Remittances.” Paper prepared for the United Nations Expert Group Meeting on International Migration and Development, July 6-8, New York. Dang, T. T., P. Antolin, and H. Oxley. 2001. “Fiscal Implications of Ageing: Projections of Age-Related Spending.” Economics Department Working Papers no. 305. Paris: OECD. Dickens, W. T., and K. Lang. 1988. “The Reemergence of Segmented Labor Market Theory.” American Economic Review 78, no. 2: 129-134. Dustmann, C., M. Casanova, M. Fertig, I. Preston, and C. M. Schmidt. 2003. “The Impact of EU Enlargement on Migration Flows.” United Kingdom: Home Office Online Report 25/03. Available at http://www.homeoffice.gov.uk/rds/pdfs2/rdsolr2503.pdf . Easterlin, R. 1961. “Influences in European Overseas Emigration before World War I.” Economic Development and Cultural Change 9: 33-51. Economic Policy Committee (EPC), European Commission. 2001. Budgetary Challenges Posed by Ageing: The Impact of Public Spending on Pensions, Health and LongTerm Care for the Elderly. Brussels: Directorate General for Economic and Financial Affairs of the European Commission. Eschbach, K., J. Hagan, and N. Rodríguez. 2003. “Deaths during Undocumented Migration: Trends and Policy Implications in the New Era of Homeland Security.” Paper prepared for the 26th Annual National Legal Conference on Immigration and Refugee Policy, April 3-4, Washington, D. C. Espenshade, T. J. 1990. “Undocumented Migration to the United States: Evidence from a Repeated Trials Model.” In Undocumented Migration to the United States: IRCA and the Experience of the 1980s, eds. F. D. Bean, B. Edmonston, and J. S. Passel. Washington, D.C.: The Urban Institute Press, pp. 159-181. Espenshade, T. J., and K. Hempstead. 1996. “Contemporary American Attitudes toward U.S. Immigration.” International Migration Review 30, no. 2: 535–570. 85 Eurostat. Annual. Population Statistics. Luxembourg: Office for Official Publications of the European Communities. ———. 2002a. “Analysis and Forecasting of International Migration by Gender, Age and Major Groups (Part II).” Eurostat Working Paper 3/1999/E/no. 9. Luxembourg: Eurostat. ——— (Shaw, C.). 2002b. “Latest National Migration Forecasts in Europe.” Working paper prepared for the Eurostat Working Party on Demographic Projections, September 16-17. Luxembourg: Eurostat. ———. 2005a. “European Demography: EU Population Up by 0.5% in 2004.” Eurostat News Release, October 25. ———. 2005b. Reference Database. Available at http://epp.eurostat.cec.eu.int/. Fertig, M., and C. M. Schmidt. 2000. “Aggregate-Level Migration Studies as a Tool for Forecasting Future Migration Streams.” IZA Discussion Paper no. 183. Bonn: Institute for the Study of Labor. Friedmann, J. 1986. “The World City Hypothesis.” Development and Change 17, no. 1: 69–83. Glaser, W. 1978. The Brain Drain: Emigration and Return. Oxford: Pergamon Press. Greenwood, M. J., G. L. Hunt, D. S. Rickman, and G. I. Treyz. 1991. “Migration, Regional Equilibrium, and the Estimation of Compensating Differentials.” The American Economic Review 81, no. 5: 1382-1390. Goldin, C. 1994. “The Political Economy of Immigration Restriction in the United States, 1890-1921.” In The Regulated Economy: A Historical Approach to Political Economy, eds. C. Goldin and G. D. Libecap. Chicago: University of Chicago Press, pp. 223-258. Gurak, D. T., and F. Caces. 1992. “Migration Networks and the Shaping of Migration Systems.” In International Migration Systems: A Global Approach, eds. M. Kritz, L. Lim, and H. Zlotnik. London: Oxford University Press, pp. 150-176. Gyory, A. 1998. Closing the Gate: Race, Politics and the Chinese Exclusion Act. Chapel Hill, NC: University of North Carolina Press. Harris, J. R., and M. P. Todaro. 1970. “Migration, Unemployment and Development: A Two-Sector Analysis.” American Economic Review 60, no. 1: 126-142. Hatton, T. J. 2003. “Explaining Trends in U.K. Migration.” Unpublished paper. Available at http://econrsss.anu.edu.au/Staff/hatton/pdf/UKNTREV.pdf. Hatton, T. J., and J. G. Williamson. 1992. “International Development and World Migration: A Historical Perspective.” NBER Historical Paper no. 41. Cambridge, MA: National Bureau of Economic Research. ———. 1993. “After the Famine: Emigration from Ireland, 1850-1913.” Journal of Economic History 53, no. 3: 575-600. 86 ———. 1994a. “What Drove Mass Migrations from Europe in the Early Nineteenth Century?” NBER Historical Paper no. 43. Cambridge, MA: National Bureau of Economic Research. ———, eds. 1994b. Migration and the International Labor Market, 1850-1939. London: Routledge. ———. 1998. The Age of Mass Migration: Causes and Economic Impact. New York: Oxford University Press. ———. 2001. “Demographic and Economic Pressure on Emigration Out of Africa.” NBER Working Paper no. 8124. Cambridge, MA: National Bureau of Economic Research. ———. 2003. “What Fundamentals Drive World Migration” UNU/WIDER Discussion Paper no. 2003/23. Helsinki, Finland: United Nations University and World Institute for Development Economics Research. ———. 2004. “International Migration in the Long Run: Positive Selection, Negative Selection and Policy.” IZA Discussion Paper no. 1304. Bonn: Institute for the Study of Labor. ———. 2006. Global Migration and the World Economy. Cambridge, MA: MIT Press. Heckmann, F., T. Wunderlich, S. F. Martin, and K. McGrath. 2000. “Transatlantic Workshop on Human Smuggling: Conference Report.” Georgetown Immigration Law Journal 15: 167-182. Hernández-Coss, R. 2005. The U.S.-Mexico Remittance Corridor: Lessons on Shifting to Formal Transfer Systems. Washington D.C.: The World Bank. Hicks, J. R. 1932. The Theory of Wages. London: Macmillan. Hodson, R., and R. L. Kaufman. 1982. “Economic Dualism: A Critical Review.” American Sociological Review 47, no. 6: 727-739. Hsu, M. 2000. Dreaming of Gold, Dreaming of Home: Transnationalism and Migration between the United States and South China, 1882-1943. Stanford, CA: Stanford University Press. Hugo, G. J. 1981. “Village-Community Ties, Village Norms, and Ethnic and Social Networks: A Review of Evidence from the Third World.” In Migration Decision Making: Multidisciplinary Approaches to Microlevel Studies in Developed and Developing Countries, eds. G.F. De Jong and R.W. Gardner. New York: Pergamon Press, pp. 186-225. Immigration and Naturalization Service (INS) (Warren, R.). 2003. Estimates of the Unauthorized Immigrant Population Residing in the United States: 1990 to 2000. Washington, D.C.: Office of Immigration Statistics, Department of Homeland Security. International Monetary Fund (IMF). 2004. World Economic Outlook: The Global Demographic Transition. Washington, D.C.: International Monetary Fund. 87 ———. 2005. World Economic Outlook: Building Institutions. Washington, D.C.: International Monetary Fund. Jewell, R. T., and D. J. Molina. 2004. “Mexican Migration to the US: A Comparison of Income and Network Effects.” UNT Department of Economics Working Papers. Denton, TX: University of North Texas. Jasso, G., and M. R. Rosenzweig. 1982. “Estimating the Emigration Rates of Legal Immigrants Using Administrative and Survey Data: The 1971 Cohort of Immigrants to the United States.” Demography 19, no. 3: 279-90. Jasso, G., M. R. Rosenzweig, and J. P. Smith. 2000. “The Changing Skill of New Immigrants to the United States: Recent Trends and Determinants.” In Issues in the Economics of Immigration, ed. G. Borjas. Chicago: University of Chicago Press, pp. 185-225. Kannappan, S. 1968. “The Brain Drain and Developing Countries.” International Labour Review 98, no. 1: 1-26. Karemara, D., V. I. Oguledo, and B. Davis. 2000. “A Gravity Model Analysis of International Migration to North America.” Applied Economics 32, no. 13: 17451755. Karras, G., and C. U. Chiswick. 1999. “Macroeconomic Determinants of Migration: The Case of Germany, 1964-1988.” International Migration 37, no. 4: 657-677. Kessler, A. 2001. “Immigration, Economic Insecurity, and the ‘Ambivalent’ American Public.” Working Paper no. 41. San Diego, CA: Center for Comparative Immigration Studies. Khoshkish, A. 1966. “Intellectual Migration: A Sociological Approach to ‘Brain Drain.’” Journal of World History 10, no. 1: 178-197. Kuznets, S. 1955. “Economic Growth and Income Inequality.” American Economic Review 45, no. 1: 1-28. Leontaridi, M. R. 1998. “Segmented Labor Markets: Theory and Evidence.” Journal of Economic Surveys 12, no. 1: 63-101. Lewis, W. A. 1954. “Economic Development with Unlimited Supplies of Labour,” The Manchester School 22, no. 2: 139-191. Light, I., G. Sabagh, M. Bozorgmehr, and C. Der-Martirosian. 1994. “Beyond the Ethnic Enclave Economy.” Social Problems 41, no. 1: 65-80. Light, I., and S. Gold. 2000. Ethnic Economies. San Diego, CA: Academic Press. Lutz, W., ed. 1996. The Future Population of the World: What Can We Assume Today? Revised edition. Laxenburg, Austria: IIASA. Lutz, W., and A. Goujon. 2001. “The World's Changing Human Capital Stock: MultiState Population Projections by Educational Attainment.” Population and Development Review 27, no. 2: 323-339. 88 Lutz, W., W. C. Sanderson, and S. Scherbov, eds. 2004. The End of World Population Growth in the 21st Century: New Challenges for Human Capital Formation and Sustainable Development. London: Earthscan in association with IIASA. Martin, P. 2004. “New NAFTA and Mexico-U.S. Migration: The 2004 Policy Options.” Agricultural and Resource Economics Update 8, no.2. Davis, CA: Department of Agricultural and Resource Economics, University of California, Davis. Massey, D. S. 1990a. “The Social and Economic Origins of Immigration.” Annals of the American Academy of Political and Social Science 510: 60-72. ———. 1990b. “Social Structure, Household Strategies, and the Cumulative Causation of Migration.” Population Index 56: 3-26. ———. 1999. “International Migration at the Dawn of the Twenty-First Century: The Role of the State.” Population and Development Review 25, no. 2: 303-322. ———. 2003. “Patterns and Processes of International Migration in the 21st Century.” Paper prepared for the Conference on African Migration in Comparative Perspective, June 4-7, Johannesburg, South Africa. ———. 2005. “Five Myths about Immigration: Common Misconceptions Underlying U.S. Border-Enforcement Policy.” Immigration Policy in Focus 4, no. 6. Washington, D.C.: Immigration Policy Center. Massey, D. S., J. Arango, G. Hugo, A. Kouaouci, A. Pellegrino, and J. E. Taylor. 1993. “Theories of International Migration: A Review and Appraisal.” Population and Development Review 19, no. 3: 431-466. ———. 1998. Worlds in Motion: Understanding International Migration at the End of the Millennium. Oxford: Clarendon Press. Massey, D. S., and N. Malone. 2002. “Pathways to Legal Immigration.” Population Research and Policy Review 21, no. 6: 473-504. Massey, D. S., and R. M. Zenteno. 1999. “The Dynamics of Mass Migration.” Proceedings of the National Academy of Sciences of the United States of America 96, no. 6: 5328–5335. Mayda, A. M. 2004. “Who Is against Immigration? A Cross-Country Investigation of Individual Attitudes toward Immigrants.” IZA Discussion Paper no. 1115. Bonn: Institute for the Study of Labor. ———. 2005. “International Migration: A Panel Data Analysis of Economic and NonEconomic Determinants.” IZA Discussion Paper no. 1590. Bonn: Institute for the Study of Labor. McKeown, A. 2001. Chinese Migrant Networks and Cultural Change: Peru, Chicago, Hawaii, 1900-1936. Chicago: University of Chicago Press. Money, J. 1997. “No Vacancy: The Political Geography of Immigration Control in Advanced Industrial Countries.” International Organization 51, no. 4: 685-720. ———. 1999. Fences and Neighbors: The Political Geography of Immigration Control. Ithaca, NY: Cornell University Press. 89 Moran, T. P. 2005. “Kuznet’s Inverted U-Curve Hypothesis: The Rise, Demise, and Continued Relevance of a Socioeconomic Law.” Sociological Forum 20, no. 2: 209-244. Myrdal, G. 1957a. Rich Lands and Poor. New York: Harper & Row. ———. 1957b. Economic Theory and Underdeveloped Regions. London: Duckworth. National Institute of Statistics. 2001. “Complete Methodological Note.” Available at http://www.ine.es/en/daco/daco42/demogra/proynot91_en.htm. Nevins, J. 2002. Operation Gatekeeper: The Rise of the “Illegal Alien” and the Making of the U.S.-Mexico Boundary. New York: Routledge. Organization for Economic Co-operation and Development (OECD). Annual. Trends in International Migration. Paris: OECD. ———. 2004. Social Expenditure Database (SOCX). Available at http://www.oecd.org/els/social/expenditure. O’Neill, B., D. Balk, M. Brickman, and M. Ezra. 2001. “A Guide to Global Population Projections.” Demographic Research 4, no. 8: 203-288. O’Rourke, K. H., and R. Sinnott. 2004. “The Determinants of Individual Attitudes towards Immigration.” Trinity College Dublin Economic Papers no. 20042. Dublin: Trinity College. O’Rourke, K. H., and J. G. Williamson. 1999. Globalization and History: The Evolution of a Nineteenth Century Atlantic Economy. Cambridge, MA: MIT Press. Ortega, F. 2005. “Immigration Quotas and Skill Upgrading.” Journal of Public Economics 89, no. 9-10: 1841-1863. Passel, J. S., and R. Suro. 2005. Rise, Peak and Decline: Trends in U.S. Immigration, 1992-2004. Washington D.C.: Pew Hispanic Center. Pedersen, P., M. Pytlikova, and N. Smith. 2004. “Selection or Network Effects? Migration Flows in 27 OECD Countries, 1990-2000.” IZA Discussion Paper no. 1104. Bonn: Institute for the Study of Labor. Peri, G. 2005. “International Migration: Some Comparisons and Lessons for the EU.” Paper prepared for the Second Annual Berkeley-Vienna Conference on The US and European Economies in Comparative Perspective, September 12-13, Berkeley. Phillips, J., and D. S. Massey. 2000. “Engines of Immigration: Stocks of Human and Social Capital in Mexico.” Social Science Quarterly 81, no. 1: 33-48. Piore, M. J. 1975. "Notes for a Theory of Labor Market Stratification." In Labor Market Segmentation, eds. R. C. Edwards, M. Reich, and D. M. Edwards. Lexington, MA: D.C. Heath, pp. 125-150. ———. 1979. Birds of Passage: Migrant Labor and Industrial Societies. New York: Cambridge University Press. Portes, A., and L. Jensen. 1987. “What’s an Ethnic Enclave? The Case for Conceptual Clarity.” American Sociological Review 52, no. 6: 768-771. 90 ———. 1989. “The Enclave and the Entrants: Patterns of Ethnic Enterprise in Miami before and after Mariel.” American Sociological Review 54, no. 6: 929-949. Portes, A., and R. G. Rumbaut. 1996. Immigrant America: A Portrait. Berkeley, CA: University of California Press. Portes, A., and J. Walton. 1981. Labor, Class, and the International System. New York: Academic Press. Ranis, G., and J. C. H. Fei. 1961. “A Theory of Economic Development.” American Economic Review 51, no. 4: 533-565. Ravenstein, E. G. 1885. “The Laws of Migration.” Journal of the Statistical Society of London 48, no. 2: 167-235. ———. 1889. “The Laws of Migration.” Journal of the Royal Statistical Society 52, no. 2: 241-305. Richter, S., J. E. Taylor, and A. Yúnez-Naude. 2005. “Impacts of Policy Reforms on Labor Migration from Rural Mexico to the United States.” NBER Working Paper no. 11428. Cambridge, MA: National Bureau of Economic Research. Rogers, A. 1988. “Age Patterns of Elderly Migration: An International Comparison.” Demography 25, no. 3: 355-370. Rogers, A., and L. J. Castro. 1981. “Model Migration Schedules.” Research Report 81-30. Laxenberg, Austria: IIASA. Rogers, A., L. J. Castro, and M. Lea. 2005. “Model Migration Schedules: Three Alternative Linear Parameter Estimation Methods.” Mathematical Population Studies 12, no. 1: 17-38. Rozelle, S., J. E. Taylor, and A. de Brauw. 1999. “Migration, Remittances, and Productivity in China.” American Economic Review 89, no. 2: 287-291. Sala-i-Martin, X. X. 1996. “The Classical Approach to Convergence Analysis.” Economic Journal 106, no. 437: 1019-1036. Salt, J. 2005. “Current Trends in International Migration in Europe.” Strasbourg: Council of Europe. Available at http://www.geog.ucl.ac.uk/mru/docs/current_trends_2004.pdf . Salt, J., and A. Singleton. 1995. Analysis and Forecasting of International Migration by Major Groups. Report prepared on behalf of Eurostat by the Migration Research Unit, University College of London. Luxembourg: Eurostat. Sassen, S. 1988. The Mobility of Labor and Capital: A Study in International Investment and Labor Flow. New York: Cambridge University Press. ———. 1991. The Global City: New York, London, Tokyo. Princeton, NJ: Princeton University Press. Scheve, K., and M. Slaughter. 2001. “Labor Market Competition and Individual Preferences over Immigration Policy.” Review of Economics and Statistics 83, no. 1: 133-145. 91 Sjaastad, L. A. 1962. “The Costs and Returns of Human Capital.” Journal of Political Economy 70, no. 5, Part 2: Investment in Human Beings: 80-93. Social Security Administration (Bell, F.C.). 1997. Social Security Area Population Projections: 1997. Actuarial Study no. 112. Baltimore, MD: Social Security Administration. Stark, O. 1982. “Research on Rural-to-Urban Migration in LDCs: The Confusion Frontier and Why We Should Pause to Rethink Afresh.” World Development 10: 63-70. ———. 1984. “Migration Decision Making: A Review Article.” Journal of Development Economics 14: 251-259. ———. 1991a. The Migration of Labor. Oxford: Blackwell Publishing. ———. 1991b. “Migration in LDCS: Risk, Remittances, and the Family.” Finance and Development 28, no. 4: 39-41. Stark, O., and D. E. Bloom. 1985. “The New Economics of Labor Migration.” American Economic Review 75, no. 2, Papers and Proceedings of the Ninety-Seventh Annual Meeting of the American Economic Association: 173-178. Stark, O., and E. Katz. 1986. “Labor Migration and Risk Aversion in Less Developed Countries.” Journal of Labor Economics 4: 134-149. Stark, O., and R. E. B. Lucas. 1985. “Motivations to Remit: Evidence from Botswana.” Journal of Political Economy 93, no. 5: 901-918. ———. 1988. “Migration, Remittances, and the Family.” Economic Development and Cultural Change 36, no. 3: 465-481. Stark, O., and M. R. Rosenzweig. 1989. “Consumption Smoothing, Migration, and Marriage: Evidence from Rural India.” Journal of Political Economy 97, no. 4: 905-926. Stark, O., and J. E. Taylor. 1989. “Relative Deprivation and International Migration.” Demography 26, no. 1: 1-14. Statistics Canada. 2001. Population Projections for Canada, Provinces and Territories, 2000-2026. Ottawa: Statistics Canada. Taylor, J. E. 1986. “Differential Migration, Networks, Information and Risk.” In Migration Theory, Human Capital and Development, ed. O. Stark. Greenwich, CT: JAI Press, pp. 147-171. ———. 1992. “Remittances and Inequality Reconsidered: Direct, Indirect, and Intertemporal Effects.” Journal of Policy Modeling 14, no. 2: 187-208. ———. 1999. “The New Economics of Labor Migration and the Role of Remittances in the Migration Process.” International Migration 37, no. 1: 63-88. Thomas, W. I., and F. Znaniecki. 1918-1920. The Polish Peasant in Europe and America. 5 vols. Boston: William Badger. 92 Timmer, A., and J. G. Williamson. 1996. “Racism, Xenophobia, or Markets? The Political Economy of Immigration Policy Prior to the Thirties.” NBER Working Paper no. 5867. Cambridge, MA: National Bureau of Economic Research. ———. 1998. “Immigration Policy Prior to the 1930s: Labor Markets, Policy Interactions and Globalization Backlash.” Population and Development Review 24, no. 4: 739-771. ———. 2004. “Refugees, Asylum Seekers and Policy in Europe.” NBER Working Paper no. 10680. Cambridge, MA: National Bureau of Economic Research Todaro, M. P. 1969. “A Model of Labor Migration and Urban Unemployment in Less Developed Countries.” American Economic Review 59, no. 1: 138-148. ———. 1976. Internal Migration in Developing Countries: A Review of Theory, Evidence, Methodology and Research. Geneva: International Labor Office. Tolbert, II., C. M., P. M. Horan, and E. M. Beck. 1980. “The Structure of Economic Segmentation: A Dual Economy Approach.” American Journal of Sociology 85, no. 5: 1095-1116. Tomaske, J. A. 1971. “The Determinants of Intercountry Differences in European Emigration, 1881-1900.” Journal of Economic History 31, no. 4: 840-853. United Nations. Biennial. World Urbanization Prospects. New York: United Nations. United Nations Development Program. 2005. Human Development Report 2005. International Cooperation at a Crossroads: Aid, Trade and Security in an Unequal World. New York: United Nations. United Nations Population Division. 2001. Replacement Migration: Is It a Solution to Declining and Ageing Populations? New York: United Nations. U.S. Census Bureau. 1996. Population Projections of the United States by Age, Sex, Race, and Hispanic Origin: 1995 to 2050. Current Population Reports P25-1130. Washington, D.C.: U.S. Census Bureau. ——— (Hollmann, F.W., T.J. Mulder, and J.E. Kallan). 2000. “Methodology and Assumptions for the Population Projections of the United States: 1999 to 2100.” Population Division Working Paper no. 38. Washington, D.C.: U.S. Census Bureau. Vogler, M., and R. Rotte. 2000. “The Effects of Development on Migration: Theoretical Issues and New Empirical Evidence.” Journal of Population Economics 13, no. 3: 485-508. Watanabe, S. 1969. “The Brain Drain from Developing to Developed Countries.” International Labour Review 99: 401-433. Wallerstein, I. 1974. The Modern World System: Capitalist Agriculture and the Origins of the European World-Economy in the Sixteenth Century. New York: Academic Press. 93 Wilmoth, J. R. 2003. “Theoretical and Technical Aspects of Projecting Net Migration as a Function of Population Size.” Unpublished paper prepared for the 2003 Technical Panel on Assumptions and Methods. Washington, D.C.: Social Security Advisory Board. Wilson, J. Q. 1980. The Politics of Regulation. New York: Basic Books. Williamson, J. G. 2005. The Political Economy of World Mass Migration: Comparing Two Global Centuries. Washington D.C.: American Enterprise Institute Press. World Bank. Annual. World Development Indicators. Washington D.C.: World Bank. Available on CD-ROM. ———. 2005. Global Economic Prospects 2005: Trade, Regionalism, and Development. Washington D.C.: World Bank. ———. 2006. Global Economic Prospects 2006: Economic Implications of Remittances and Migration. Washington, D.C.: World Bank. 94 REFERENCE BIBLIOGRAPHY I. PROJECTION PRACTICE Global Projections United Nations United Nations Population Division. 1999. World Population Prospects: The 1998 Revision. Vols. 1 and 2. New York: United Nations. ———. 2002. World Population Prospects: The 2000 Revision. Vol. 3. New York: United Nations. ———. 2003. World Population Prospects: The 2002 Revision. Vols. 1 and 2. New York: United Nations. ———. 2004. World Population to 2300. New York: United Nations. ———. 2005. World Population Prospects: The 2004 Revision. Vols. 1 and 2. New York: United Nations. United Nations Statistics Division. 2004. United Nations Common Database. New York: United Nations. Available at http://unstats.un.org/unsd/cdb/cdb_help/cdb_quick_start.asp/. World Bank Bos, E., M. T. Vu, E. Massiah, and R. A. Bulatao. 1994. World Population Projections 1994–95 Edition: Estimates and Projections with Related Demographic Statistics. Baltimore, MD.: Johns Hopkins University Press. World Bank. 2005. World Development Indicators 2005. Washington, D.C.: World Bank. Available on CD-ROM. ———. 2005. HNPStats. Available at http://devdata.worldbank.org/hnpstats/. International Program Center, U.S. Census Bureau U.S. Census Bureau (McDevitt, T. M., K. A. Stanecki, and P. O. Way). 1999. World Population Profile: 1998. Report WP/98. Washington, D.C.: GPO. U.S. Census Bureau (Christenson, M., T. M. McDevitt, and K. A. Stanecki). 2004. Global Population Profile 2002. International Population Reports WP/02. Washington, D.C.: GPO. International Institute for Applied Systems Analysis International Institute for Applied Systems Analysis. 2004. “Global Population Projections.” Laxenburg, Austria: IIASA. Available at http://www.iiasa.ac.at/Research/POP/index.html. 95 Lutz, W., ed. 1996. The Future Population of the World: What Can We Assume Today? Revised edition. Laxenburg, Austria: IIASA. Lutz, W., W. C. Sanderson, and S. Scherbov. 1997. “Doubling of World Population Unlikely.” Nature 387: 803-805. ———. 2001. “The End of World Population Growth.” Nature 412: 543-545. ———, eds. 2004. The End of World Population Growth in the 21st Century: New Challenges for Human Capital Formation and Sustainable Development. London: Earthscan in association with IIASA. Lutz, W., P. Saariluoma, W. C. Sanderson, and S. Scherbov. 2000. New Developments in the Methodology of Expert- and Argument-Based Probabilistic Population Forecasting. Laxenburg, Austria: IIASA. Lutz, W., and A. Goujon. 2001. “The World's Changing Human Capital Stock: MultiState Population Projections by Educational Attainment.” Population and Development Review 27, no. 2: 323-339. Lutz, W., B.C. O’Neill, and S. Scherbov. 2003. “Europe’s Population at a Turning Point.” Science 299: 1991-1992. Rogers, A., and L. J. Castro. 1981. “Model Migration Schedules.” Research Report 81-30. Laxenberg, Austria: IIASA. United States U.S. Census Bureau Kolankiewicz, L. 2000. “Immigration, Population, and the New Census Bureau Projections.” Backgrounder, June. Washington, D.C.: Center for Immigration Studies. Mulder, T. J. 2002. “Accuracy of the U.S. Census Bureau National Population Projections and their Respective Components of Change.” Population Division Working Paper no. 50. Washington, D.C.: U.S. Census Bureau. U.S. Census Bureau. 1996. Population Projections of the United States by Age, Sex, Race, and Hispanic Origin: 1995 to 2050. Current Population Reports P25-1130. Washington, D.C.: U.S. Census Bureau. ——— (Hollmann, F. W., T. J. Mulder, and J. E. Kallan). 2000. “Methodology and Assumptions for the Population Projections of the United States: 1999 to 2100.” Population Division Working Paper no. 38. Washington, D.C.: U.S. Census Bureau. ———. 2001. Interim Projections of the U.S. Population by Age, Sex, Race, and Hispanic Origin: Summary, Methodology and Assumptions. Washington, D.C.: U.S. Census Bureau. ———. 2004. U.S. Interim Projections by Age, Sex, Race, and Hispanic Origin. Available at http://www.census.gov/ipc/www/usinterimproj/. 96 ———. 2005. State Interim Population Projections by Age and Sex: 2004-2030. Available at http://www.census.gov/population/www/projections/projectionsagesex.html/. Social Security Administration Lee, R. 2000. “Long-Term Projections and the US Social Security System,” Population and Development Review 26, no. 1: 137-143. Social Security Administration (Bell, F.C.). 1997. Social Security Area Population Projections: 1997. Actuarial Study no. 112. Baltimore, Md.: Social Security Administration. Social Security Administration. 2005. The 2005 Annual Report of the Board of Trustees of the Federal Old-Age and Survivors Insurance and Disability Insurance Trust Funds. Washington, D.C.: Social Security Administration. 1999 Technical Panel on Assumptions and Methods. 1999. Report to the Social Security Advisory Board. Washington, D.C.: Social Security Administration. 2003 Technical Panel on Assumptions and Methods. 2003. Report to the Social Security Advisory Board. Washington, D.C.: Social Security Administration. European Countries Eurostat Eurostat. 2001a. “The Evaluation of Regional Population Projections for the European Union.” Eurostat Working Paper 3/2001/E/no. 9. Luxembourg: Eurostat. ———. 2001b. “Long-term International Migration Scenarios for the European Economic Area.” Eurostat Working Paper E4/1997-6. Luxembourg: Eurostat. ———. 2002a. “Analysis and Forecasting of International Migration by Gender, Age and Major Groups (Part II).” Eurostat Working Paper 3/1999/E/no. 9. Luxembourg: Eurostat. ——— (Shaw, C.). 2002b. “Latest National Migration Forecasts in Europe.” Working paper prepared for the Eurostat Working Party on Demographic Projections, September 16–17. Luxembourg: Eurostat. ———. 2002c. Eurostat Population Projections 1995 and Revision 1999 [online database]. Luxembourg: Eurostat. Available at http://europa.eu.int/comm/eurostat/. ———. 2003. “Analysis and Forecasting of International Migration by Major Groups (Part III).” Eurostat Working Paper 3/2002/E/no. 17. Luxembourg: Eurostat. ———. 2004. “EUROPOP2004: Summary Note on Assumptions and Methodology for International Migration.” Paper prepared for the meeting of the Aging Working Group of the Economic Policy Committee at the European Commission, December 8, Luxembourg. 97 Salt, J., and A. Singleton. 1995. Analysis and Forecasting of International Migration by Major Groups. Report prepared on behalf of Eurostat by the Migration Research Unit, University College of London. Luxembourg: Eurostat. France: National Institute for Statistics and Economic Studies Brutel, C. 2002. “La Population de la France Métropolitaine en 2050: Un Viellissement Ineluctable.” Economie et Statisique no. 355-356: 57-72. Paris: National Institute for Statistics and Economic Studies. Brutel, C., and L. Omalek. 2003. “Projections Démographiques pour la France, ses Régions et ses Départements (Horizon 2030/2050).” Insee Résultats Société no. 16. Paris: National Institute for Statistics and Economic Studies. Robert-Bobée, I. 2005. “The Way Population Projections are Conducted in France.” Paper presented at the Joint Eurostat-UNECE Work Session on Demographic Projections, September 21-23, Vienna. Federal Statistical Office of Germany Federal Statistical Office of Germany (Nagel, J., B. Sommer, and O. Pötzsch). 2003. Population of Germany Today and Tomorrow. Wiesbaden, Germany: Federal Statistical Office. Statistics Netherlands de Beer, J., and M. Alders. 1999. “Probabilistic Population and Household Forecasts for the Netherlands.” Paper prepared for the European Population Conference EPC99, August 30–September 3, The Hague. Gjaltema, T. A. 2003. “Half a Century of Population Forecasting in the Netherlands.” Papers de Demografia no. 236. Barcelona: Centre d’Estudis Demogràfics. Statistics Netherlands. 2004. Population Forecasts of the Netherlands, 2004–2050 [online database]. Available at http://statline.cbs.nl/. United Kingdom: Government Actuary’s Department UK Government Actuary’s Department. 1993. “Population Projections: A New Methodology for Determining Migration Assumptions.” GAD Occasional Paper no. 42. London: GAD. ———. 2005. Projections Database. Available at http://www.gad.gov.uk/population/index.asp/. UK Government Actuary’s Department and Office for National Statistics. 2004. National Population Projections: 2002-based. London: GAD. UK Office for National Statistics. 2004. International Migration: Migrants Entering or Leaving the United Kingdom and England and Wales, 2002. London: Office for National Statistics. 98 Other Developed Countries Australian Bureau of Statistics Australian Bureau of Statistics. 2005. Population Projections, Australia, 2004-2101. Canberra: Australian Bureau of Statistics. Statistics Canada Statistics Canada. 2001. Population Projections for Canada, Provinces and Territories, 2000-2026. Ottawa: Statistics Canada. Japan: National Institute of Population and Social Security Research National Institute of Population and Social Security Research. 2002. Population Projections for Japan: 2001-2050. Tokyo: National Institute of Population and Social Security Research. ———. 2003. Population Statistics of Japan 2003. Tokyo: National Institute of Population and Social Security Research. Takahashi, S., R. Kaneko, A. Ishikawa, M. Ikenoue, and F. Mita. 1999. “Population Projections for Japan: Methods, Assumptions and Results.” Review of Population and Social Policy 8: 75-115. Projection Practice: General Ahlburg, D. A., and W. Lutz. 1998. “Introduction: The Need to Rethink Approaches to Population Forecasts.” Population and Development Review 24, Supplement: Frontiers of Population Forecasting: 1-14. Ahlburg, D. A., W. Lutz, and J. W. Vaupel. 1998. “Ways to Improve Population Forecasting: What Should Be Done Differently in the Future?” Population and Development Review 24, Supplement: Frontiers of Population Forecasting: 191198. Bocquier, P. 2004. “World Urbanization Prospects: An Alternative to the UN Model of Projection Compatible with Urban Transition Theory.” Working Paper no. DT/2004/08. Paris: Développement, Institutions & Analyses de Long Terme (DIAL). Bongaarts, J., and R. A. Bulatao, eds. 2000. Beyond Six Billion: Forecasting the World’s Population. Washington, D.C.: National Academy Press. Brockerhoff, M. 1999. “Urban Growth in Developing Countries: A Review of Projections and Predictions.” Population and Development Review 25, no. 4: 757-778. Brücker, H., and B. Siliverstovs. 2005. “On the Estimation and Forecasting of International Migration: How Relevant is Heterogeneity Across Countries?” IZA Discussion Paper no. 1710. Bonn: Institute for the Study of Labor. de Beer, J. 2000. “Dealing with Uncertainty in Population Forecasting.” Demographic Working Papers, June. The Hague: Statistics Netherlands. 99 Fertig, M., and C. M. Schmidt. 2000. “Aggregate-Level Migration Studies as a Tool for Forecasting Future Migration Streams.” IZA Discussion Paper no. 183. Bonn: Institute for the Study of Labor. Goldstein, J. R., and G. Stecklov. 2002. “Long-Range Population Projections Made Simple.” Population and Development Review 28, no. 1: 121-141. Kielman, N. 1998. “How Accurate Are the United Nations World Population Projections?” Population and Development Review 24, Supplement: Frontiers of Population Forecasting: 15-41. Kielman, N., and H. Cruijsen, eds. 1992. National Population Forecasting in Industrialized Countries. Berwyn, PA: Swets & Zeitlinger Inc. Lee, R. 1998. “Probabilistic Approaches to Population Forecasting.” Population and Development Review 24, Supplement: Frontiers of Population Forecasting: 156190. Lemaitre, G. 2005. “The Comparability of International Migration Statistics: Problems and Prospects.” OECD Statistics Brief no. 9. Paris: OECD. National Institute of Statistics. 2001. “Complete Methodological Note.” Available at http://www.ine.es/en/daco/daco42/demogra/proynot91_en.htm. O’Neill, B., and D. Balk. 2001. “World Population Futures.” Population Bulletin 56, no. 3. Washington, D.C.: Population Reference Bureau. O’Neill, B., D. Balk, M. Brickman, and M. Ezra. 2001. “A Guide to Global Population Projections.” Demographic Research 4, no. 8: 203-288. Passel, J. S., and R. Suro. 2003. The Rise of the Second Generation: Changing Patterns in Hispanic Population Growth. Washington, D.C.: Pew Hispanic Center. Rees, P., and I. Turton. 1998. “Investigation of the Effects of Input Uncertainty on Population Forecasting.” Paper prepared for the 3rd International Conference on GeoComputation, University of Bristol, August 17-19, Bristol, United Kingdom. II. IMMIGRATION THEORY Neoclassical Framework Becker, G. S. 1962. “Investment in Human Capital: A Theoretical Analysis.” Journal of Political Economy 70, Supplement, Part 2: 9-49. Blomquist, G. C., M. C. Berger, and J. P. Hoehn. 1988. “New Estimates of Quality of Life in Urban Areas.” American Economic Review 78, no. 1: 89-107. Borjas, G. J. 1987. “Self-Selection and the Earnings of Immigrants.” American Economic Review 77, no. 4: 531–553. ———. 1989. “Economic Theory and International Migration.” International Migration Review 23, no. 3: 457-485. ———. 1990. Friends or Strangers: The Impact of Immigrants on the US Economy. New York: Basic Books. 100 ———. 1994. “The Economics of Immigration.” Journal of Economic Literature 32, no. 4: 1667-1717. ———. 1999. “The Economic Analysis of Immigration.” In Handbook of Labor Economics, vol. 3A, eds. O. Ashenfelter and D. Card. New York: North-Holland, pp. 1697-1760. ———, ed. 2000. Issues in the Economics of Immigration. Chicago: University of Chicago Press. ———. 2002. The Impact of Welfare Reform on Immigrant Welfare Use. Washington, D.C.: Center for Immigration Studies. ———. 2003. “The Labor Demand Curve is Downward Sloping: Reexamining the Impact of Immigration on the Labor Market.” Quarterly Journal of Economics 118, no. 4: 1335-1374. Borjas, G. J., S. Bronars, and S. Trejo. 1992. “Assimilation and the Earnings of Young Internal Migrants.” Review of Economics and Statistics 74, no. 1: 170-175. Carrington, W. J., E. Detragiache, and T. Vishwanath. 1996. “Migration with Endogenous Moving Costs.” American Economic Review 86, no. 4: 909-930. Chiquiar, D., and G. H. Hanson. 2002. “International Migration, Self-Selection, and the Distribution of Wages: Evidence from Mexico and the United States.” NBER Working Papers no. 9242. Cambridge, MA: National Bureau of Economic Research. Chiswick, B. R. 1984. “Illegal Aliens in the United States Labor Market: An Analysis of Occupational Attainment of Earnings.” International Migration Review 18, no. 3: 714-732. ———. 1999. “Immigration Policy and Immigrant Quality: Are Immigrants Favorably Self-Selected?” American Economic Review 89, no. 2: 181-185. ———. 2000. “Are Immigrants Favorably Self-Selected? An Economic Analysis.” IZA Discussion Paper no. 131. Bonn: Institute for the Study of Labor. Cobb-Clark, D. 1993. “Immigrant Selectivity and Wages: The Evidence for Women.” American Economic Review 83, no. 4: 986-993. Greenwood, M. J. 1975. “Research on International Migration in the United States: A Survey.” Journal of Economic Literature 13, no. 2: 397-433. Greenwood, M. J., J. R. Ladman, and B. Siegel. 1981. “Long-Term Trends in Migratory Behavior in a Developing Country: The Case of Mexico.” Demography 18, no. 3: 369-388. Greenwood, M. J., G. L. Hunt, D. S. Rickman, and G. I. Treyz. 1991. “Migration, Regional Equilibrium, and the Estimation of Compensating Differentials.” The American Economic Review 81, no. 5: 1382-1390. Harris, J. R., and M. P. Todaro. 1970. “Migration, Unemployment and Development: A Two-Sector Analysis.” American Economic Review 60, no. 1: 126-142. Hicks, J. R. 1932. The Theory of Wages. London: Macmillan. 101 Jasso, G., M. R. Rosenzweig, and J. P. Smith. 2000. “The Changing Skill of New Immigrants to the United States: Recent Trends and Determinants.” In Issues in the Economics of Immigration, ed. G. Borjas. Chicago: University of Chicago Press, pp. 185-225. Jewell, R. T., and D. J. Molina. 2004. “Mexican Migration to the US: A Comparison of Income and Network Effects.” UNT Department of Economics Working Papers. Denton, TX: University of North Texas. Lewis, W. A. 1954. “Economic Development with Unlimited Supplies of Labour,” The Manchester School 22, no. 2: 139-191. Ranis, G., and J. C. H. Fei. 1961. “A Theory of Economic Development.” American Economic Review 51, no. 4: 533-565. Ravenstein, E. G. 1885. “The Laws of Migration.” Journal of the Statistical Society of London 48, no. 2: 167-235. ———. 1889. “The Laws of Migration.” Journal of the Royal Statistical Society 52, no. 2: 241-305. Sjaastad, L. A. 1962. “The Costs and Returns of Human Capital.” Journal of Political Economy 70, no. 5, Part 2: Investment in Human Beings: 80-93. Todaro, M. P. 1969. “A Model of Labor Migration and Urban Unemployment in Less Developed Countries.” American Economic Review 59, no. 1: 138-148. ———. 1976. Internal Migration in Developing Countries: A Review of Theory, Evidence, Methodology and Research. Geneva: International Labor Office. World Systems Framework Adams, W. 1969. The Brain Drain. New York: Macmillan. Castells, M. 1989. The Informational City: Information Technology, Economic Restructuring, and the Urban-Regional Process. Oxford: Blackwell Publishing. ———. 2000. The Rise of the Network Society. Oxford: Blackwell Publishing. Champion, A. G. 1994. “International Migration and Demographic Change in the Developed World.” Urban Studies 31, no. 4-5: 653-677. Chase-Dunn, C. and P. Grimes. 1995. “World-Systems Analysis.” Annual Review of Sociology 21: 387-417. Docquier, F. and H. Rappaport. 2004. “Skilled Migration: The Perspective of Developing Countries.” Policy Research Paper no. 3382. Washington D.C.: World Bank. Faini, R. 2002. “Development, Trade, and Migration.” Revue d’Économie et du Développement 1-2, Proceedings from the ABCDE Europe Conference: 85-116. Frank, A. G. 1967. Capitalism and Underdevelopment in Latin America. New York: Monthly Review Press. Friedmann, J. 1986. “The World City Hypothesis.” Development and Change 17, no. 1: 69–83. 102 Glaser, W. 1978. The Brain Drain: Emigration and Return. Oxford: Pergamon Press. Hagopian, A., M. J. Thompson, M. Fordyce, K. E. Johnson, and L. G. Hart. 2004. “The Migration of Physicians from sub-Saharan Africa to the United States of America: Measures of the African Brain Drain.” Human Resources for Health 2: 17. Hopkins, T. K. and I. M. Wallerstein. 1993. World Systems Analysis: Theory and Methodology. Ann Arbor, MI: UMI Books on Demand. Kannappan, S. 1968. “The Brain Drain and Developing Countries.” International Labour Review 98, no. 1: 1-26. Khoshkish, A. 1966. “Intellectual Migration: A Sociological Approach to Brain Drain.” Journal of World History 10, no. 1: 178-197. Massey, D. S. 1988. “Economic Development and International Migration in Comparative Perspective.” Population and Development Review 14, no. 3: 383413. Portes, A., and J. Walton. 1981. Labor, Class, and the International System. New York: Academic Press. Portes, A., and R. G. Rumbaut. 1996. Immigrant America: A Portrait. Berkeley, CA: University of California Press. Robertson, R. and F. Lechner. 1985. “Modernization, Globalization and the Problem of Culture in World-Systems Theory.” Theory, Culture and Society 2, no. 3: 103-118. Rumbaut, R. G. 1991. “Passages to America: Perspectives on the New Immigration.” In America at Century’s End, ed. A. Wolfe. Los Angeles: University of California Press, pp. 208–244. Sassen, S. 1988. The Mobility of Labor and Capital: A Study in International Investment and Labor Flow. New York: Cambridge University Press. ———. 1991. The Global City: New York, London, Tokyo. Princeton, NJ: Princeton University Press. Wallerstein, I. 1974. The Modern World System: Capitalist Agriculture and the Origins of the European World-Economy in the Sixteenth Century. New York: Academic Press. ———. 1996. “The Rise and Future Demise of World-Systems Analysis.” Paper delivered at the 91st Annual Meeting of the American Sociological Association, August 16, New York. Zolberg, A. R., A. Suhrke, and S. Aguayo. 1989. Escape from Violence: Conflict and the Refugee Crisis in the Developing World. New York: Oxford University Press. New Economics Framework Adams, Jr., R. H. 2003. “International Migration, Remittances and the Brain Drain: A Study of 24 Labor-Exporting Countries.” World Bank Policy Research Working Paper no. 3069. Washington D.C.: World Bank. 103 Agarwal, R., and A. W. Horowitz. 2002. “Are International Remittances Altruism or Insurance? Evidence from Guyana Using Multiple-Migrant Households.” World Development 30, no. 11: 2033-2044. Barham, B., and S. Boucher. 1998. “Migration, Remittances, and Inequality: Estimating the Net Effects of Migration on Income Distribution.” Journal of Development Economics 55, no. 2: 307-331. Beine, M., F. Docquier, and H. Rapoport. 2001. “Brain Drain and Economic Growth: Theory and Evidence.” Journal of Development Economics 64, no. 1: 275-289. Conway, D., and J. H. Cohen. 1998. “Consequences of Migration and Remittances for Mexican Transnational Communities.” Economic Geography 74, no. 1: 26-44. de Vasconcelos, P. 2005. “Improving the Development Impact of Remittances.” Paper prepared for the United Nations Expert Group Meeting on International Migration and Development, New York, July 6-8. Durand, J., W. Kandel, E. A. Parrado, and D. S. Massey. 1996. “International Migration and Development in Mexican Communities.” Demography 33, no. 2: 249-264. El-Sakka, M. I . T. and R. McNabb. 1999. “The Macroeconomic Determinants of Emigrant Remittances.” World Development 27, no. 8: 1493-1502. Hernández-Coss, R. 2005. The U.S.-Mexico Remittance Corridor: Lessons on Shifting to Formal Transfer Systems. Washington D.C.: The World Bank. Lauby, J., and O. Stark. 1988. “Individual Migration as a Family Strategy: Young Women in the Philippines.” Population Studies 42, no. 3: 473-786. León-Ledesma, M. and M. Piracha. 2004. “International Migration and the Role of Remittances in Eastern Europe.” International Migration 42, no. 4: 65. Lipton, M. 1980. “Migration from Rural Areas of Poor Countries: The Impact on Rural Productivity and Income Distribution.” World Development 8, no. 1: 1-24. Poirine, B. 1997. “A Theory of Remittances as an Implicit Family Loan Arrangement.” World Development 25, no. 4: 589-611. Rozelle, S., J. E. Taylor, and A. de Brauw. 1999. “Migration, Remittances, and Productivity in China.” American Economic Review 89, no. 2: 287-291. Stark, O. 1991a. The Migration of Labor. Oxford: Blackwell Publishing. ———. 1991b. “Migration in LDCS: Risk, Remittances, and the Family.” Finance and Development 28, no. 4: 39-41. ———. 2004. “Rethinking the Brain Drain.” World Development 32, no. 1: 15-22. Stark, O., and D. E. Bloom. 1985. “The New Economics of Labor Migration.” American Economic Review 75, no. 2, Papers and Proceedings of the Ninety-Seventh Annual Meeting of the American Economic Association: 173-178. Stark, O., and R. E. B. Lucas. 1985. “Motivations to Remit: Evidence from Botswana.” Journal of Political Economy 93, no. 5: 901-918. 104 ———. 1988. “Migration, Remittances, and the Family.” Economic Development and Cultural Change 36, no. 3: 465-481. Stark, O., and M. R. Rosenzweig. 1989. “Consumption Smoothing, Migration, and Marriage: Evidence from Rural India.” Journal of Political Economy 97, no. 4: 905-926. Stark, O., and J. E. Taylor. 1989. “Relative Deprivation and International Migration.” Demography 26, no. 1: 1-14. ———. 1991. “Migration Incentives, Migration Types: The Role of Relative Deprivation.” Economic Journal 101, no. 408: 1163-1178. Stark, O., J. E. Taylor, and S. Yitzhaki. 1986. “Remittances and Inequality.” Economic Journal 96, no. 383: 722-740. Taylor, J. E. 1992. “Remittances and Inequality Reconsidered: Direct, Indirect, and Intertemporal Effects.” Journal of Policy Modeling 14, no. 2: 187-208. ———. 1999. “The New Economics of Labor Migration and the Role of Remittances in the Migration Process.” International Migration 37, no. 1: 63-88. Social Network Framework Aguilera, M. B., and D. S. Massey. 2003. “Social Capital and the Wages of Mexican Migrants: New Hypotheses and Tests.” Social Forces 82, no. 2: 671-701. Bauer, T., Epstein, G. S. and I. N. Gang. 2002. “Herd Effects or Migration Networks? The Location Choice of Mexican Immigrants in the U.S.” IZA Discussion Paper no. 551. Bonn: Institute for the Study of Labor. Boyd, M. 1989. “Family and Personal Networks in International Migration: Recent Developments and New Agendas.” International Migration Review 23, no. 3: 638-670. Carrington, W. J., E. Detragiache, and T. Vishwanath. 1996. “Migration and Endogenous Moving Costs.” American Economic Review 86, no. 4: 909-930. Choldin, H. M. 1973. “Kinship Networks in the Migration Process.” International Migration Review 7, no. 2: 163-175. Coleman, J. S. 1988. “Social Capital in the Creation of Human Capital.” American Journal of Sociology 94, Supplement: Organizations and Institutions: Sociological and Economic Approaches to the Analysis of Social Structure: S95-S120. Epstein, G. S. and I. N. Gang. 2004. “The Influence of Others on Migration Plans.” IZA Discussion Paper no. 1244. Bonn: Institute for the Study of Labor. Fitzgerald, D. 2004. “Beyond ‘Transnationalism’: Mexican Hometown Politics in an American Labor Union.” Ethnic and Racial Studies 27, no. 2: 228-247. Goss, J., and B. Lindquist. 1995. “Conceptualizing International Labor Migration: A Structuration Perspective.” International Migration Review 29, no. 2: 317-351. 105 Gurak, D. T., and F. Caces. 1992. “Migration Networks and the Shaping of Migration Systems.” In International Migration Systems: A Global Approach, eds. M. Kritz, L. Lim, and H. Zlotnik. Oxford: Oxford University Press, pp. 150-176. Hugo, G. J. 1981. “Village-Community Ties, Village Norms, and Ethnic and Social Networks: A Review of Evidence from the Third World.” In Migration Decision Making: Multidisciplinary Approaches to Microlevel Studies in Developed and Developing Countries, eds. G.F. De Jong and R.W. Gardner. New York: Pergamon Press, pp. 186-225. Hsu, M. 2000. Dreaming of Gold, Dreaming of Home: Transnationalism and Migration Between the United States and South China, 1882-1943. Stanford, CA: Stanford University Press. Jasso, G., and M. R. Rosenzweig. 1986. “Family Reunification and the Immigration Multiplier: U.S. Immigration Law, Origin-Country Conditions, and the Reproduction of Immigrants.” Demography 23, no. 3: 291-311. Kandel, W., and D. S. Massey. 2002. “The Culture of Mexican Migration: A Theoretical and Empirical Analysis.” Social Forces 80, no. 3: 981-1004. McKenzie, D. and H. Rapoport. 2004. “Network Effects and the Dynamics of Migration and Inequality: Theory and Evidence from Mexico.” BREAD Working Paper no. 063. Cambridge, MA: Bureau for Research in Economic Development, Harvard University. Mincer, J. 1978. “Family Migration Decision.” Journal of Political Economy 86: 749-73. Massey, D. S. 1987. “Understanding Mexican Migration to the United States.” American Journal of Sociology 92, no. 6: 1372-1403. ———. 1990a. “The Social and Economic Origins of Immigration.” Annals of the American Academy of Political and Social Science 510: 60-72. ———. 1990b. “Social Structure, Household Strategies, and the Cumulative Causation of Migration.” Population Index 56: 3-26. Massey, D. S., and K. E. Espinosa. 1997. “What’s Driving Mexico-U.S. Migration? A Theoretical, Empirical, and Policy Analysis.” American Journal of Sociology 102, no. 4: 939-999. Massey, D. S., and F. Garcia-Espana. 1987. “The Social Process of International Migration.” Science 237, no. 4816: 733. Massey, D. S., L. Goldring, and J. Durand. 1994. “Continuities in Transnational Migration: An Analysis of Nineteen Mexican Communities.” American Journal of Sociology 99, no. 6: 1492-1533. Massey, D. S., and J. A. Phillips. 1999. “The New Labor Market: Immigrants and Wages after IRCA.” Demography 36, no. 2: 233-246. McKeown, A. 2001. Chinese Migrant Networks and Cultural Change: Peru, Chicago, Hawaii, 1900-1936. Chicago: University of Chicago Press. 106 Montgomery, J. D. 1991. “Social Networks and Labor-Market Outcomes: Toward an Economic Analysis.” American Economic Review 81, no. 5: 1408-1418. Munshi, K. 2003. “Networks in the Modern Economy: Migrants in the U.S. Labor Market.” Quarterly Journal of Economics 118, no. 2: 549-599. Palloni, A., D. S. Massey, M. Ceballos, K. Espinosa, and M. Spittel. 2001. “Social Capital and International Migration: A Test Using Information on Family Networks.” American Journal of Sociology 106: 1262-1298. Phillips, J., and D. S. Massey. 2000. “Engines of Immigration: Stocks of Human and Social Capital in Mexico.” Social Science Quarterly 81, no. 1: 33-48. Taylor, J. E. 1986. “Differential Migration, Networks, Information and Risk.” In Migration Theory, Human Capital and Development, ed. O. Stark. Greenwich, CT: JAI Press, pp. 147-171. Thomas, W. I., and F. Znaniecki. 1918-1920. The Polish Peasant in Europe and America. 5 vols. Boston: William Badger. Winters, P., A. de Janvry, and E. Sadoulet. 2001. “Family and Community Networks in U.S.-Mexico Migration.” Journal of Human Resources 36, no. 1: 159-84. Dual Labor Market Framework Bailey, T., and R. Waldinger. 1991. “Primary, Secondary, and Enclave Labor Markets: A Training System Approach.” American Sociological Review 56, no. 2: 432-445. Bauer, T., G. S. Epstein, and I. N. Gang. 2005. “Enclaves, Language, and the Location Choice of Migrants.” Journal of Population Economics 18, no. 4: 649-662. Beck, E. M., P. Horan, and C. M. Tolbert II. 1980. “Social Stratification in Industrial Society: Further Evidence for a Structural Alternative.” American Sociological Review 45, no. 4: 712-719. Cain, G. 1976. “The Challenge of Segmented Labor Market Theories to Orthodox Theory: A Survey.” Journal of Economic Literature 14, no. 4: 1215-1257. Constant, A., and D. S. Massey. 2003. “Labor Market Segmentation and the Earnings of German Guestworkers.“ IZA Discussion Paper no. 774. Bonn: Institute for the Study of Labor. Dickens, W. T., and K. Lang. 1988. “The Reemergence of Segmented Labor Market Theory.” American Economic Review 78, no. 2: 129-134. Fuest, C., and M. P. Thum. 2000. “Welfare Effects of Immigration in a Dual Labor Market.” Regional Science and Urban Economics 30, no. 5: 551-563. Hodson, R., and R. L. Kaufman. 1982. “Economic Dualism: A Critical Review.” American Sociological Review 47, no. 6: 727-739. Launov, A. 2004. “An Alternative Approach to Testing Dual Labor Market Theory.” IZA Discussion Paper no. 217. Bonn: Institute for the Study of Labor. 107 Leontaridi, M. R. 1998. “Segmented Labor Markets: Theory and Evidence.” Journal of Economic Surveys 12, no. 1: 63-101. Light, I., G. Sabagh, M. Bozorgmehr, and C. Der-Martirosian. 1994. “Beyond the Ethnic Enclave Economy.” Social Problems 41, no. 1: 65-80. Light, I., and S. Gold. 2000. Ethnic Economies. San Diego, CA: Academic Press. Logan, J. R., W. Zhang, and R. D. Alba. 2002. “Immigrant Enclaves and Ethnic Communities in New York and Los Angeles.” American Sociological Review 67, no. 2: 299-322. Mata, F., and R. Pendakur. 1999. “Immigration, Labor Force Integration and the Pursuit of Self-Employment.” International Migration Review 33, no. 2: 378-402. Müller, T. 2001. “Migration, Unemployment and Discrimination.” European Economic Review 47, no. 3: 409-427. Nee, V., J. Sanders, and S. Sernau. 1994. “Job Transitions in an Immigrant Metropolis: Ethnic Boundaries and the Mixed Economy.” American Sociological Review 59, no. 6: 849-872. Pessar, P. 1995. “The Elusive Enclave: Ethnicity, Class, and Nationality among Latino Entrepreneurs in Greater Washington D.C.” Human Organization 54, no. 4: 383392. Piore, M. J. 1975. “Notes for a Theory of Labor Market Stratification.” In Labor Market Segmentation, eds. R. C. Edwards, M. Reich, and D. M. Edwards. Lexington, MA: D.C. Heath, pp. 125-150. ———. 1979. Birds of Passage: Migrant Labor and Industrial Societies. New York: Cambridge University Press. ———. 1986. “The Shifting Grounds for Immigration.” Annals of the American Academy of Political and Social Science 485: 23-33. Portes, A., and L. Jensen. 1987. “What’s an Ethnic Enclave? The Case for Conceptual Clarity.” American Sociological Review 52, no. 6: 768-771. ———. 1989. “The Enclave and the Entrants: Patterns of Ethnic Enterprise in Miami Before and After Mariel.” American Sociological Review 54, no. 6: 929-949. Tolbert, II., C. M., P. M. Horan, and E. M. Beck. 1980. “The Structure of Economic Segmentation: A Dual Economy Approach.” American Journal of Sociology 85, no. 5: 1095-1116. Wachter, M. L., R. A. Gordon, M. J. Piore, and R. E. Hall. 1974. “Primary and Secondary Labor Markets: A Critique of the Dual Approach.” Brookings Papers on Economic Activity 1974, no. 3: 637-693. Wilson, F. D. 1997. “Ethnic Concentrations and Labor Market Opportunities.” CDE Working Paper no. 97-17. Madison, WI: Center for Demography and Ecology, University of Wisconsin-Madison. 108 Policy Framework Boeri, T., G. H. Hanson, and B. McCormick, eds. 2002. Immigration Policy and the Welfare State: A Report for the Fondazione Rodolfo Debenedetti. Oxford: Oxford University Press. Borjas, G. J. 1999. Heaven’s Door: Immigration Policy and the American Economy. Princeton, NJ: Princeton University Press. Burns, P., and J. G. Gimpel. 2000. “Economic Insecurity, Prejudicial Stereotypes, and Public Opinion on Immigration Policy.” Political Science Quarterly 115, no. 2: 201-225. Castles, S. 2004. “Why Migration Policies Fail.” Ethnic and Racial Studies 27, no. 2: 205-227. Cornelius, W. A. 1989. “Impacts of the 1986 US Immigration Law on Emigration from Rural Mexican Sending Communities.” Population and Development Review 15, no. 4: 689-705. Cornelius, W. A., T. Tsuda, P. L. Martin, and J. F. Hollifield, eds. 2004. Controlling Immigration: A Global Perspective. 2nd ed. Stanford, CA: Stanford University Press. Edmonston, B. 1994. “Does the Threat of Border Apprehension Deter Undocumented US Immigration?” Population and Development Review 20, no. 4: 871-892. Eschbach, K., J. Hagan, and N. Rodríguez. 2003. “Deaths during Undocumented Migration: Trends and Policy Implications in the New Era of Homeland Security.” Paper prepared for the 26th Annual National Legal Conference on Immigration and Refugee Policy, April 3-4, Washington, D.C. Espenshade, T. J. 1990. “Undocumented Migration to the United States: Evidence from a Repeated Trials Model.” In Undocumented Migration to the United States: IRCA and the Experience of the 1980s, eds. F. D. Bean, B. Edmonston, and J. S. Passel. Washington, D.C.: The Urban Institute Press, pp. 159-181. Espenshade, T. J., and K. Hempstead. 1996. “Contemporary American Attitudes toward U.S. Immigration.” International Migration Review 30, no. 2: 535-570. Freeman, G. P. 1992. “Migration Policy and Politics in the Receiving States,” International Migration Review 26, no. 4: 1144-1167. ———. 2002. “Winners and Losers: Politics and the Costs and Benefits of Migration.” In West European Immigration and Immigrant Policy in the New Century, ed. A. M. Messina. Westport, CN: Praeger, pp. 77-96. Geddes, A. 2003. The Politics of Migration and Immigration in Europe. London: Sage. Givens, T., and A. Luedtke. 2005. “European Immigration Policies in Comparative Perspective: Issue Salience, Partisanship and Immigrant Rights.” Comparative European Politics 3, no. 1: 1-22. 109 Goldin, C. 1994. “The Political Economy of Immigration Restriction in the United States, 1890-1921.” In The Regulated Economy: A Historical Approach to Political Economy, eds. C. Goldin and G. Libecap. Chicago: University of Chicago Press, pp. 223-258. Gyory, A. 1998. Closing the Gate: Race, Politics and the Chinese Exclusion Act. Chapel Hill, NC: University of North Carolina Press. Hammar, T. 1985. European Immigration Policy: A Comparative Study. New York: Cambridge University Press. Joppke, C. 1998. “Why Liberal States Accept Unwanted Immigration.” World Politics 50: 266-293. Joppke, C., and E. Morawska eds. 2003. Toward Assimilation and Citizenship: Immigrants in Liberal Nation-States. New York: Palgrave Macmillan. Lahav, G. 2004. Immigration and Politics in the New Europe: Reinventing Borders. Cambridge: Cambridge University Press. Martin, P. 2004. “New NAFTA and Mexico-U.S. Migration: The 2004 Policy Options.” Agricultural and Resource Economics Update 8, no.2. Davis, CA: Department of Agricultural and Resource Economics, University of California, Davis. Massey, D. S. 1999. “International Migration at the Dawn of the Twenty-First Century: The Role of the State.” Population and Development Review 25, no. 2: 303-322. ———. 2005. “Five Myths About Immigration: Common Misconceptions Underlying U.S. Border-Enforcement Policy.” Immigration Policy in Focus 4, no. 6. Washington, D.C.: Immigration Policy Center. Money, J. 1997. “No Vacancy: The Political Geography of Immigration Control in Advanced Industrial Countries.” International Organization 51, no. 4: 685-720. ———. 1999. Fences and Neighbors: The Political Geography of Immigration Control. Ithaca, N.Y.: Cornell University Press. Nevins, J. 2002. Operation Gatekeeper: The Rise of the “Illegal Alien” and the Making of the U.S.-Mexico Boundary. New York: Routledge. Richter, S., J. E. Taylor, and A. Yúnez-Naude. 2005. “Impacts of Policy Reforms on Labor Migration from Rural Mexico to the United States.” NBER Working Paper no. 11428. Cambridge, MA: National Bureau of Economic Research. Scheve, K., and M. Slaughter. 2001. “Labor Market Competition and Individual Preferences over Immigration Policy.” Review of Economics and Statistics 83, no. 1: 133-145. Simon, R. J., and J. P. Lynch. 1999. “A Comparative Assessment of Public Opinion toward Immigrants and Immigration Policies.” International Migration Review 33, no. 2: 455-467. Timmer, A., and J. G. Williamson. 1996. “Racism, Xenophobia, or Markets? The Political Economy of Immigration Policy Prior to the Thirties.” NBER Working Paper no. 5867. Cambridge, MA: National Bureau of Economic Research. 110 ———. 1998. “Immigration Policy Prior to the 1930s: Labor Markets, Policy Interactions and Globalization Backlash.” Population and Development Review 24, no. 4: 739-771. ———. 2004. “Refugees, Asylum Seekers and Policy in Europe.” NBER Working Paper no. 10680. Cambridge, MA: National Bureau of Economic Research Todaro, M. P., and L. Maruszko. 1987. “Illegal Migration and US Immigration Reform: A Conceptual Framework.” Population and Development Review 13, no. 1: 101114. Zolberg, A. 2000. “Matters of State: Theorizing Immigration Policy.” In The Handbook of International Migration, eds. C. Hirschmann, P. Kasinitz, and J. De Wind. New York: Russell Sage, pp. 71-93. Immigration Theory: General Constant, A., and D. S. Massey. 2002. “Return Migration by German Guestworkers: Neoclassical versus New Economic Theories.” International Migration 40, no. 4: 5-36. Hollified, J. F., and B. S. Heisler, eds. 2000. Migration Theory: Talking across Disciplines. New York and London: Routledge. Jennissen, R. 2000. “Can Economic Determinants Improve the Theoretical Background for International Migration Hypothesis?” NIDI Working Papers no. 2000/02. The Hague: Netherlands Interdisciplinary Demographic Institute. Massey, D. S. 2003. “Patterns and Processes of International Migration in the 21st Century.” Paper prepared for the Conference on African Migration in Comparative Perspective, June 4-7, Johannesburg, South Africa. Massey, D. S., and J. E. Taylor, eds. 2004. International Migration: Prospects and Policies in a Global Market. Oxford: Oxford University Press. Massey, D. S., J. Arango, G. Hugo, A. Kouaouci, A. Pellegrino, and J. E. Taylor. 1993. “Theories of International Migration: A Review and Appraisal.” Population and Development Review 19, no. 3: 431-466. ———. 1994. “An Evaluation of International Migration Theory: The North American Case.” Population and Development Review 20, no. 4: 699-751. ———. 1998. Worlds in Motion: Understanding International Migration at the End of the Millennium. Oxford: Clarendon Press. Portes, A., and J. Boron. 1989. “Contemporary Immigration: Theoretical Perspectives on its Determinants and Modes of Incorporation.” International Migration Review 23, no. 3: 606-630. Smith, J. P., and B. Edmonston, eds. 1998. The Immigration Debate: Studies on the Economic, Demographic, and Fiscal Effects of Immigration Policy Options. Washington D.C.: National Academy Press. 111 Teitelbaum, M. S. 2001. “International Migration: Predicting the Unknowable.” In Demography and National Security, eds. M. Weiner and S.S. Russell. New York: Berghahn Books, pp. 21-37. Zimmerman, K. F., and T. Bauer, eds. 2002. The Economics of Migration. 4 vols. In The International Library of Critical Writings in Economics. Vol. 151. Northampton, MA: Edward Elgar Publishing. Zoltnik, H. 1998. “International Migration, 1965-1996: An Overview.” Population and Development Review 24, no. 3: 429-468. Zolberg, A. 1989. “The Next Waves: Migration Theory for a Changing World.” International Migration Review 23, no.3: 403-430. III. EMPIRICAL MIGRATION RESEARCH Alecke, B., P. Huber, and G. Untiedt. 2001. “What a Difference a Constant Makes—How Predictable Are International Migration Flows?” In Migration Policies and EU Enlargement: The Case of Central and Eastern Europe. Paris: OECD, pp. 63-78. Allen, J. 2001. “The State of the Art in Modeling Migration in the LDCs: A Comment.” Journal of Regional Science 41, no. 3: 521-528. Bauer, T. K., M. Lofstrom, and K. F. Zimmermann. 2000. “Immigration Policy, Assimilation of Immigrants and Natives’ Sentiments towards Immigrants: Evidence from 12 OECD Countries.” IZA Discussion Paper no. 187. Bonn: Institute for the Study of Labor. Bauer, T. K., and K. F. Zimmermann. 1999a. “Assessment of Possible Migration Pressure and Its Labour Market Impact Following EU Enlargement to Central and Eastern Europe.” IZA Research Report no. 3. Bonn: Institute for the Study of Labor. Benhabib, J. 1996. “On the Political Economy of Immigration.” European Economic Review 40: 1737-1743. Bohning, W. R. 1981. “Estimating the Propensity of Guestworkers to Leave.” Monthly Labor Review 104, no. 5: 37-40. Borjas, G. J., and B. Bratsberg. 1996. “Who Leaves? The Outmigration of the ForeignBorn.” The Review of Economics and Statistics 78, no. 1: 165-176. Brücker, H., and B. Siliverstovs. 2004. “The Macro-Determinants of International Migration in Europe: Evidence from Germany.” Paper prepared for the Immigration Issues in EU-Turkish Relations Conference, October 8-9, Istanbul. Chiswick, B. R., and T. J. Hatton. 2002. “International Migration and the Integration of Labor Markets.” IZA Discussion Paper no. 559. Bonn: Institute for the Study of Labor. Clark, X., T. J. Hatton, and J. G. Williamson. 2002. “Where Do U.S. Immigrants Come From, and Why?” NBER Working Paper no. 8998. Cambridge, MA: National Bureau of Economic Research. 112 ———. 2003. “What Explains Cross-Border Migration in Latin America?” Harvard Institute of Economic Research Discussion Paper no. 2012. Cambridge, MA: Harvard Institute of Economic Research. ———. 2004. “Explaining US Immigration, 1971-1998.” World Bank Policy Research Working Paper no. 3252. Washington, D.C.: World Bank. Constant, A., and K. F. Zimmermann. 2003. “The Dynamics of Repeat Migration: A Markov Chain Analysis.” IZA Discussion Paper no. 885. Bonn: Institute for the Study of Labor. Docquier, F., and H. Rappaport. 2003. “Remittances and Inequality: A Dynamic Migration Model.” IZA Discussion Paper no. 808. Bonn: Institute for the Study of Labor. Dustmann, C., M. Casanova, M. Fertig, I. Preston, and C. M. Schmidt. 2003. “The Impact of EU Enlargement on Migration Flows.” United Kingdom: Home Office Online Report 25/03. Available at http://www.homeoffice.gov.uk/rds/pdfs2/rdsolr2503.pdf . Hatton, T. J. 2003. “Explaining Trends in U.K. Migration.” Unpublished paper. Available at http://econrsss.anu.edu.au/Staff/hatton/pdf/UKNTREV.pdf. Hatton, T. J., and J. G. Williamson. 1992. “International Development and World Migration: A Historical Perspective.” NBER Historical Paper no. 41. Cambridge, MA: National Bureau of Economic Research. ———. 1993. “After the Famine: Emigration from Ireland, 1850-1913.” Journal of Economic History 53, no. 3: 575-600. ———. 1994a. “What Drove Mass Migrations From Europe in the Early Nineteenth Century?” NBER Historical Paper no. 43. Cambridge, MA: National Bureau of Economic Research. ———, eds. 1994b. Migration and the International Labor Market, 1850-1939. London: Routledge. ———. 1998. The Age of Mass Migration: Causes and Economic Impact. New York: Oxford University Press. ———. 2001. “Demographic and Economic Pressure on Emigration Out of Africa.” NBER Working Paper no. 8124. Cambridge, MA: National Bureau of Economic Research. ———. 2003. “What Fundamentals Drive World Migration” UNU/WIDER Discussion Paper no. 2003/23. Helsinki, Finland: United Nations University and World Institute for Development Economics Research. ———. 2004. “International Migration in the Long Run: Positive Selection, Negative Selection and Policy.” IZA Discussion Paper no. 1304. Bonn: Institute for the Study of Labor. 113 Karemara, D., V. I. Oguledo, and B. Davis. 2000. “A Gravity Model Analysis of International Migration to North America.” Applied Economics 32, no. 13: 17451755. Karras, G., and C. U. Chiswick. 1999. “Macroeconomic Determinants of Migration: The Case of Germany, 1964-1988.” International Migration 37, no. 4: 657-677. Massey, D. S., and R. M. Zenteno. 1999. “The Dynamics of Mass Migration.” Proceedings of the National Academy of Sciences of the United States of America 96, no. 6: 5328–5335. Mayda, A. M. 2004. “Who Is Against Immigration? A Cross-Country Investigation of Individual Attitudes toward Immigrants.” IZA Discussion Paper no. 1115. Bonn: Institute for the Study of Labor. ———. 2005. “International Migration: A Panel Data Analysis of Economic and NonEconomic Determinants.” IZA Discussion Paper no. 1590. Bonn: Institute for the Study of Labor. O’Rourke, K. H., and R. Sinnott. 2004. “The Determinants of Individual Attitudes towards Immigration.” Trinity College Dublin Economic Papers no. 20042. Dublin: Trinity College. Ortega, F. 2005. “Immigration Quotas and Skill Upgrading.” Journal of Public Economics 89, no. 9-10: 1841-1863. Passel, J. S., and R. Suro. 2005. Rise, Peak and Decline: Trends in U.S. Immigration, 1992-2004. Washington, D.C.: Pew Hispanic Center. Pedersen, P., M. Pytlikova, and N. Smith. 2004. “Selection or Network Effects? Migration Flows in 27 OECD Countries, 1990-2000.” IZA Discussion Paper no. 1104. Bonn: Institute for the Study of Labor. Rotte, R., and M. Vogler. 1998. “Determinants of International Migration: Evidence from Developing Countries to Germany.” IZA Discussion Paper no. 12. Bonn: Institute for the Study of Labor. Salt, J. 2005. “Current Trends in International Migration in Europe.” Strasbourg: Council of Europe. Available at http://www.geog.ucl.ac.uk/mru/docs/current_trends_2004.pdf . Tomaske, J. A. 1971. “The Determinants of Intercountry Differences in European Emigration, 1881-1900.” Journal of Economic History 31, no. 4: 840-853. Trefler, D. 1998. “Immigrants and Natives in General Equilibrium Trade Models.” In The Immigration Debate: Studies on the Economic, Demographic, and Fiscal Effects of Immigration Policy Options, eds. J. P. Smith and B. Edmonston. Washington, D.C.: National Academy Press, pp. 206-238. Vogler, M., and R. Rotte. 2000. “The Effects of Development on Migration: Theoretical Issues and New Empirical Evidence.” Journal of Population Economics 13, no. 3: 485-508. 114 Wamsley, T. L, and L. A. Winters. 2003. “Relaxing the Restrictions on the Temporary Movements of Natural Persons: A Simulation Analysis.” CEPR Discussion Paper no. 3719. London: Centre for Economic Policy Research. Williamson, J. G. 2005. The Political Economy of World Mass Migration: Comparing Two Global Centuries. Washington, D.C.: American Enterprise Institute Press. Wu, Z., and N. Li. 2003. “Immigration and the Dependency Ratio of a Host Population.” Mathematical Population Studies 10: 21-39. IV. DATA SOURCES FOR SELECTED MODEL DRIVERS Population Projections Eurostat. 2005. Reference Database. Available at http://epp.eurostat.cec.eu.int/. United Nations Population Division. 2005. World Population Prospects: The 2004 Revision. Vols. 1 and 2. New York: United Nations. Available at http://esa.un.org/unpp/. U.S. Census Bureau. 2005. International Data Base. Available at http://www.census.gov/ipc/www/idbnew.html. World Bank. 2005. World Development Indicators 2005. Washington, D.C.: World Bank. Available on CD-ROM. World Bank Health, Nutrition, and Population Division. 2005. HNPStats. Available at http://devdata.worldbank.org/hnpstats/. GDP Per Capita Heston, A., R. Summers, and B. Aten. 2002. Penn World Table Version 6.1. Philadelphia, PA: Center for International Comparisons, University of Pennsylvania. Available at http://pwt.econ.upenn.edu/. International Monetary Fund. 2005. World Economic Outlook: Building Institutions. Washington, D.C.: International Monetary Fund. World Bank. 2005. World Development Indicators 2005. Washington, D.C.: World Bank. Available on CD-ROM. ———. 2005. Global Economic Prospects 2005: Trade, Regionalism, and Development. Washington, D.C.: World Bank. ———. 2006. Global Economic Prospects 2006: Economic Implications of Remittances and Migration. Washington, D.C.: World Bank. Educational Attainment Barro, R. J., and J. Lee. 2000. Barro-Lee Data Set for a Panel of 138 Countries. Appendix Data Tables for “International Data on Educational Attainment: Updates and Implications.” CID Working Paper no. 42. Available at http://www.cid.harvard.edu/ciddata/ciddata.html/. 115 United Nations Development Program. 2005. Human Development Report 2005: International Cooperation at a Crossroads: Aid, Trade and Security in an Unequal World. New York: United Nations. World Bank. 2002. EdStats. Available at http://www1.worldbank.org/education/edstats/. Macroeconomic Models Bayoumi, T. 2004. “GEM: A New International Macroeconomic Model.” IMF Occasional Paper 239. Washington, D.C.: International Monetary Fund. Dalsgaard, T., C. André, and P. Richardson. 2001. “Standard Shocks in the OECD INTERLINK Model.” OECD Economics Department Working Papers no. 306. Paris: OECD. International Monetary Fund. 2004. World Economic Outlook. Washington, D.C.: International Monetary Fund. Laxton, D. 1998. “MULTIMOD Mark III: The Core Dynamic and Steady-State Models.” IMF Occasional Paper no. 164. Washington, D.C.: International Monetary Fund. van der Mensbrugghe, D. 2005. “LINKAGE Technical Reference Document: Version 6.0.” Unpublished paper. Washington, D.C.: World Bank. World Bank. 2005. Global Economic Prospects 2005: Trade, Regionalism, and Development. Washington, D.C.: World Bank. ———. 2006. Global Economic Prospects 2006: Economic Implications of Remittances and Migration. Washington, D.C.: World Bank. V. MISCELLANEOUS Bauer, T. K., and K. F. Zimmermann. 1999b. “Overtime Work and Overtime Compensation in Germany.” IZA Discussion Paper no. 48. Bonn: Institute for the Study of Labor. Bean. F., R. Corona, R. Tuiran, K. Woodrow-Lafield, and J. Van Hook. 2001. “Circular, Invisible, and Ambiguous Migrants: Components of Difference in Estimates of the Numbers of Unauthorized Mexican Migrants in the United States.” Demography 38, no. 3: 411-422. Bouvier, L. F. 1998. “The Impact of Immigration on United States’ Population Size: 1950-2050.” NPG Forum Series. Alexandria, VA: Negative Population Growth. Bouvier, L. F., D. L. Poston Jr., and N. B. Zhai. 1997. “Population Growth Impacts of Zero Net International Migration.” International Migration Review 31, no. 2: 294311. Brune, N., and G. Garrett. 2005. “The Globalization Rorschach Test: International Economic Integration, Inequality, and the Role of Government.” Annual Review of Political Science 8: 399-423. Castles, S., and M. J. Miller. 1993. The Age of Migration: International Population Movements in the Modern World. New York: Guilford Press. 116 Easterlin, R. 1961. “Influences in European Overseas Emigration before World War I.” Economic Development and Cultural Change 9, no. 3: 33-51. Espenshade, T. J., L. F. Bouvier, and W. B. Arthur. 1982. “Immigration and the Stable Population Model.” Demography 19, no. 1: 125-133. European Commission. 2000. Push and Pull Factors of International Migration: A Comparative Report. Luxembourg: Office for Official Publications of the European Communities. Global Commission on International Migration. 2005. Migration in an Interconnected World: New Directions for Action. Geneva: Global Commission on International Migration. Hatton, T. J., and J. G. Williamson. 2006. Global Migration and the World Economy. Cambridge, MA: MIT Press. Jasso, G., and M. R. Rosenzweig. 1982. “Estimating the Emigration Rates of Legal Immigrants Using Administrative and Survey Data: The 1971 Cohort of Immigrants to the United States.” Demography 19, no. 3: 279-290. Joly, D. 2000. “Some Structural Effects of Migration on Receiving and Sending Countries.” International Migration 38, no. 5: 25-40. Kalleberg, A., and A. Sorenson. 1979. “The Sociology of Labor Markets.” Annual Review of Sociology 5: 351-379. Kessler, A. 2001. “Immigration, Economic Insecurity, and the ‘Ambivalent’ American Public.” Working Paper no. 41. San Diego, CA: Center for Comparative Immigration Studies. Li, P.S. 2001. “Immigrants’ Propensity to Self-Employment: Evidence from Canada.” International Migration Review 35, no. 4: 1106-1129. Lutz, W., and S. Scherbov. 2003. “Future Demographic Change in Europe: The Contribution of Migration.” Interim Report IR-03-066. Laxenburg, Austria: IIASA. Martin, P. 2003. “Immigration and Integration: The Transatlantic Challenge.” Paper prepared for the Bertelsmann Foundation Transatlantic Initiative. Gütersloh, Germany: Bertelsmann Foundation. Martin, P., and E. Midgley. 1999. “Immigration to the United States.” Population Bulletin 54, no. 2. Washington, D.C.: Population Reference Bureau. ———. 2003. “Immigration: Shaping and Reshaping America.” Population Bulletin 58, no. 2. Washington, D.C.: Population Reference Bureau. Martin, P., and J. Widgren. 2002. “International Migration: Facing the Challenge.” Population Bulletin 57, no. 1. Washington, D.C.: Population Reference Bureau. Martin, P., and P. Duignan. 2003. “Making and Re-making America: Immigration into the United States.” Hoover Essays no. 25. Stanford, CA: Hoover Institution on War, Revolution and Peace, Stanford University. 117 Massey, D. S., and N. Malone. 2002. “Pathways to Legal Immigration.” Population Research and Policy Review 21, no. 6: 473-504. Massey, D. S., J. Durand, and N. J. Malone. 2002. Beyond Smoke and Mirrors: Mexican Immigration in an Era of Economic Integration. New York: Russell Sage Foundation. Myrdal, G. 1957a. Rich Lands and Poor. New York: Harper & Row. ———. 1957b. Economic Theory and Underdeveloped Regions. London: Duckworth. O’Rourke, K. H., and J. G. Williamson. 1999. Globalization and History: The Evolution of a Nineteenth Century Atlantic Economy. Cambridge, MA: MIT Press. Peri, G. 2005. “International Migration: Some Comparisons and Lessons for the EU.” Paper prepared for the Second Annual Berkeley-Vienna Conference on The US and European Economies in Comparative Perspective, September 12-13, Berkeley. Riche, M. F. 2000. “America’s Diversity and Growth: Signposts for the 21st Century.” Population Bulletin 55, no. 2. Washington, D.C.: Population Reference Bureau. Rogers, A. 1988. “Age Patterns of Elderly Migration: An International Comparison.” Demography 25, no. 3: 355-370. Tovar, E. M. L., and M. Susan. 1997. Migration between Mexico and the United States: Binational Study. Austin, Texas: U.S. Commission on Immigration Reform. United Nations Population Division. 2001. Replacement Migration: Is It a Solution to Declining and Ageing Populations? New York: United Nations. Visco, I. 2000. “Migration Scenarios for the 21st Century: Immigration, Development and the Labour Market.” Paper prepared for the OECD International Conference, July 12-14, Rome. Zlotnik, H. 1999. “Trends in International Migration since 1965: What Existing Data Reveal.” International Migration 37, no. 1: 21-61. 118
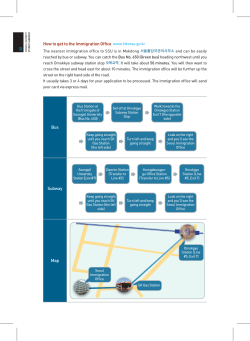


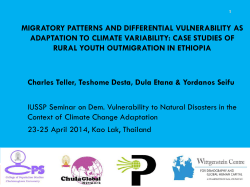


© Copyright 2026