
How to Develop Online Surveys That Work. from InsightExpress September 2002
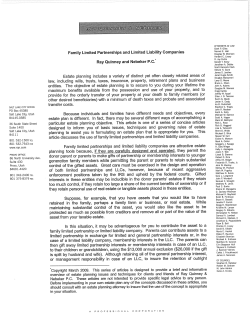
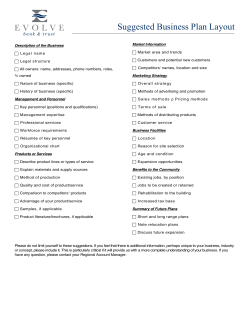
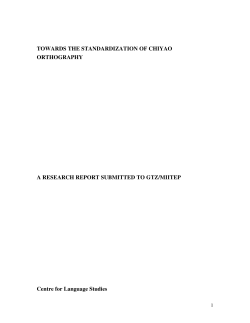
How to Develop Online Surveys That Work.
A Best Practices White Paper
from InsightExpress
September 2002
1351 Washington Boulevard • Stamford, CT 06902
Contents
THE RAPID GROWTH
OF
ONLINE RESEARCH .....................................................................................1
MORE REPRESENTATIVE EVERY DAY ......................................................................................... 2
VALIDATING ONLINE RESEARCH........................................................................................................3
REPLICATING MAIL STUDIES ONLINE .........................................................................................3
SAMPLE D IVERSITY I S THE KEY...................................................................................................5
SURVEY C REATION..............................................................................................................................6
OVERALL C ONSIDERATIONS ........................................................................................................6
QUESTION SEQUENCING............................................................................................................. 7
QUESTION FORMAT..................................................................................................................... 9
DETERMINING OPTIMUM SURVEY LENGTH...............................................................................10
WHEN A LONG SURVEY I S ACCEPTABLE.....................................................................................11
QUESTION WORDING..................................................................................................................12
CONVERTING M AIL AND TELEPHONE SURVEYS .................................................................................13
SHIFTING FOCUS.........................................................................................................................13
SIMPLE IS ALWAYS BEST PRACTICE .............................................................................................14
INVITATIONS AND INCENTIVES : GAINING COOPERATION....................................................................15
SURVEY I NVITATIONS...................................................................................................................15
WHEN TO USE INCENTIVES.........................................................................................................16
WHAT DO PEOPLE WANT?........................................................................................................ 16
THE I NCENTIVE I MPACT..............................................................................................................17
UNDERSTANDING
THE
POTENTIAL
FOR BIAS......................................................................................18
MINIMIZING BIAS........................................................................................................................18
DEVELOPING
AN
EFFECTIVE PRIVACY POLICY.................................................................................... 19
ABOUT INSIGHTEXPRESS.....................................................................................................................20
Copyright © 2002, InsightExpress, LLC. All rights reserved.
Distributing, copying, or unauthorized use is prohibited.
The Rapid Adoption of Online Surveys
The use of online surveys is growing at a phenomenal rate. In 2001, online market research revenue
reached $333.5 million, representing 50% growth over 2000, when companies conducted $221.5
million in online research, and a nearly 400% increase over 1999 when online research generated $92.7
million. Projections for 2002 are that online research will reach close to $500 million.1
At the same time, response rates are plummeting for traditional survey methods. The American
Public, inundated with heavy telemarketing and direct mail campaigning, is becoming less and less
receptive to telephone and mail research – even taking steps to screen and block incoming calls with
answering machines and caller-ID systems.
As traditional completion rates sink, rates for well-designed online surveys continue to rise to over
80%. One reason: While traditional surveys are increasingly seen as intrusive, respondents perceive
online surveys as less threatening. For example, recent studies show that people are more willing to
answer questions on sensitive issues on the Web than they are in phone interviews. Online research
respondents are also more willing to answer open-ended questions than those responding to mail or
telephone interviews.
The benefits of online research are apparent – speed, flexibility, and affordability are among the most
commonly cited. Beyond these benefits, the reality is that online research produces higher quality
results than traditional methods when based on solid, time-tested methods and techniques. The
following white paper examines the Best Practices for utilizing the Internet to conduct the reliable
research you need and demand.
1
Inside Research, Volume 13, Number 1, January 2002.
Copyright © 2002, InsightExpress, LLC. All rights reserved.
Distributing, copying, or unauthorized use is prohibited.
1
More Representative Every Day
Before adopting any methodology, researchers must first determine whether they can obtain
respondents who will be representative of their target market(s). While no methodology is perfect –
online research is growing closer to being 100% representative of the U.S. population every day.
Nearly two-thirds of all households are online, meaning that the profile of the average adult American
Internet user is rapidly converging with that of the average American.
Example Criteria
1996 Online
Population
2002 Online
Population*
U.S. Population
(2000 Census)
Gender: Male
Gender: Female
62%
38%
49%
51%
49%
51%
Marital Status: Married
59%
53%
53%
$62,700
20%
$49,000
11%
$40,816**
6%
Education: College+
48%
35%
22%
Age: Adults 18-49
Age: Adults 50+
88%
12%
72%
28%
63%
37%
Household Income: Mean
Household Income: $100K+
* InsightExpress Sample
** 1999 U.S. Census
Comparing the respondent base of Internet users versus mail or phone sample pulled from a U.S.
adult population frame shows:
• The gender distribution of online users is identical to that of the general population (as
reported by the U.S. Census).
• The marital status along all dimensions is identical to the general population.
• The age distribution of online individuals is also approaching that of the general population.
• The average online household income is rapidly approaching that of the general population.
These fundamental demographic shifts, in combination with higher respondent cooperation and
survey completion rates, make it feasible to migrate a variety of research applications from traditional
methodologies to the online environment – with impressive results.
Copyright © 2002, InsightExpress, LLC. All rights reserved.
Distributing, copying, or unauthorized use is prohibited.
2
Validating Online Research
InsightExpress has validated online research through side-by-side studies with traditional methods
for a variety of applications including concept testing, brand and awareness tracking, opinion and
satisfaction measurement. Each time, the online research study produced results that mirrored the
data from traditional methods.
Replicating Mail Studies Online
Looking for a faster, less expensive way to conduct its concept testing program, a global health and
personal care products company – with 54 product lines reporting annual worldwide revenues of
more than $50 million each – recently approached InsightExpress to develop side-by-side tests
comparing the results of mail and online concept tests.
Examining the online results against the mail survey results, we looked at many key measures. For
example, the "likeability" of the concept adheres closely to rank order and magnitude results when
compared to mail results.
Liking, Top Two Box Score
40%
35%
Mail
31%
30%
31%
Online
29%
28%
28%
26%
Percent of Respondents
25%
25%
22%
20%
19%
16%
18%
15%
15%
14%
13%
12%
10%
10%
5%
0%
Concept C
Concept A
Concept B
Concept D
Concept F
Concept E
Copyright © 2002, InsightExpress, LLC. All rights reserved.
Distributing, copying, or unauthorized use is prohibited.
Concept G
Concept H
3
A virtually identical level of response occurred in the number of units respondents intended to
purchase on the first occasion.
Units Purchased on First Occasion
2.0
1.8
1.6
Units Purchased
1.4
1.2
Mail
Online
1.1
1.0
1.0
0.9
0.9
0.9
0.9
0.8
0.8
0.8
0.7
0.6
0.6
0.6
0.6
0.4
0.2
0.0
Concept F
Concept B
Concept C
Concept E
Concept H
Concept G
Overall, the results are clear. Recruiting from the U.S. online population, we were able to replicate the
performance of validated mail surveys fielded to the general U.S. population. Not only were results
consistent as measured by rank order, the magnitude of the responses was also precise. This includes
key metrics such as concept purchase intent, believability, liking, unit purchases, and other
dimensions and diagnostics.
Copyright © 2002, InsightExpress, LLC. All rights reserved.
Distributing, copying, or unauthorized use is prohibited.
4
Sample Diversity Is the Key
Just as important as the size of the respondent pool is the diversity of sample within the group. You
would not conduct a telephone study exclusively in area code 212 (Manhattan) to get a clear,
representative picture of the U.S. population. While you would be able to complete the survey based
on the number of Manhattan residents, the attitudes and opinions inherent within this group would
not be representative of the entire country. The same goes for online research. While sheer numbers
can be achieved at specific sites, you will not obtain truly representative data from just one site.
Visitors to specific sites tend to have very similar profiles, or at the very least, profiles that are more
similar than the population at large.
That's why InsightExpress uses a methodology we call e-RDD. This methodology is based on the
premise that the only way to get a truly representative sample is by recruiting respondents from
thousands of websites, all across the Internet. Recruiting from as broad a range of sites as possible
provides the level of randomization that is essential for representivity. The result is a respondent pool
of more than 100,000,000 and reliable survey data from a truly representative sample.
Gender: Male
Gender: Female
Marital Status: Married
Household Income: Mean
2000 US Census
49%
51%
InsightExpress'
e-RDD
49%
51%
MSN
49%
51%
AOL
35%
65%
53%
$40,816
53%
$49,000
65%
$64,506
54%
NA
Education: College+
22%
37%
55%
56%
Age: 25-54
59%
64%
71%
75%
Number of Sites for Recruitment
Unique Visitors per Month
Reach of Online Population
NA
NA
100%
33,500+
104M
87%
25-40
78M
65%
9-15
93M
78%
US Government
InsightExpress,
MediaMetrix, Q2 2002
Greenfield Online,
MSN.com, MediaMetrix,
Q2 2002
SPSS, Q4 2001,
MediaMetix Q2, 2002
Source:
Copyright © 2002, InsightExpress, LLC. All rights reserved.
Distributing, copying, or unauthorized use is prohibited.
5
Survey Creation
The most common misstep when designing an online survey is to take the same survey used for
telephone or mail and simply put it online. While many of the basics of good survey design apply to
all methodologies, there are specific requirements and considerations when designing online surveys.
Sound survey design is critical to both response rates and the reliability of the survey data.
Overall Considerations
Before writing a single question for your survey consider the following:
• What problem are you trying to solve?
• What decision(s) do you need to make to solve that problem?
• What kind of information do you need to make your decision(s)?
• Who can give you that information?
The objective of any survey is to gather the information you need to make a sound decision – so it is
important that you identify a single hypothesis and develop a survey around testing that hypothesis.
Avoid the temptation to ask a respondent too much. While asking "everything you want to know – as
long as you have their attention" may work with mail research, online respondents will not tolerate
longer surveys. If you find that you have more than one objective, give serious consideration to
developing more than one survey. The affordability and accessibility to respondents online research
provides makes it both possible, and the best approach.
In addition, you want to build a straightforward survey that is:
• Interesting and engaging for participants
• Free of jargon
• As short as possible
And you should test your survey before rolling it out to your entire respondent base.
Copyright © 2002, InsightExpress, LLC. All rights reserved.
Distributing, copying, or unauthorized use is prohibited.
6
Question Sequencing
Your survey should reflect the fact that you are building a relationship with your respondent. As you
build any relationship, you work up to the harder, more personal questions.
Introduction
Begin your survey with a brief introduction that thanks the respondent for participating and for
his/her time. It's important that you avoid revealing your survey objective. Instead, offer a sincere
explanation that may go something like this:
"Your opinions are very important to us. Your responses will be used to create better products and
services. This survey will take no longer than 10 minutes."
Set the Proper Expectations: If it's going to take 15 minutes for someone to complete your survey,
don't promise that they'll be able to do it in five. And if you're willing to share the results of the
survey, say how and when. Be as truthful as you can about the purpose of the study. If you're offering
an incentive, be clear about what it is and when a respondent should expect to receive it.
Background Questions
Start with questions that are meaningful but not threatening. Questions like "What do you think
of___?" "Do you travel during the summer?" are not too personal, but do get your respondents into
the mindset of answering questions.
For example, when conducting a survey to find out how current customers feel about your company's
returned-goods policy, start by asking whether the respondent has ever returned an item that they
purchased. The question is straightforward and the answer options are limited to either "yes" or "no."
It's easy to understand, easy to answer, visually simple and doesn't require a lot of work on the
respondent's part.
Research has also shown that people are more likely to complete a survey and provide honest answers
if they can start answering questions related to what the survey is about at the very beginning. The
first question should be one that captures the respondent's interest, is easy to understand and easy to
answer. At all costs avoid multiple-answer grids at the beginning of the survey.
Example of a good (below) and bad (right) first survey question make sure your first question does not overwhelm or discourage
your respondents by seeming too complex and/or time consuming.
Copyright © 2002, InsightExpress, LLC. All rights reserved.
Distributing, copying, or unauthorized use is prohibited.
7
Ease Into Harder Questions
As you ease into the harder types of questions, here are some helpful rules of thumb:
• For multi-select questions, always use a checkbox question with a maximum of 20 rotating list
items. Include an "Other: Specify" choice and avoid drop-down formats that require use of the
keyboard "control" key.
• Providing a "Don't know" option lets you avoid forcing respondents to choose answers when
they're unfamiliar with a concept.
• Include no more than three to five open-ended questions – although they can elicit some
important insight, they also require a lot of respondent time and effort. Never make openended answers mandatory.
• Use no more than three rating grids, with no more than 15 elements per grid – to help avoid
confusion. Focus on proper presentation and sequencing. Answers to grid questions should
typically be optional.
• Limit your survey to one ranking/allocation question of no more than seven to ten elements.
And then use this type of question only when absolutely necessary. If used, it is best to limit
the requirement to rating either the top three or the bottom three. Ranking a longer list will be
frustrating for your respondent and your data will reflect that.
• Refrain from using an excessive number of images. This can seriously slow down your survey
for low-bandwidth users.
• Take advantage of skipping and piping options to personalize and streamline your survey.
Demographics
Wrap up your survey with your demographic questions – by that time you have built a rapport with
your respondent and they will feel more comfortable answering the more personal, demographic
questions (i.e. household income, age, race, etc.).
Copyright © 2002, InsightExpress, LLC. All rights reserved.
Distributing, copying, or unauthorized use is prohibited.
8
Question Format: Drop-down or Radio Button?
When you're asking a question with multiple answer choices, is it better to use drop-down menus or
radio buttons? We recently tested the two against one another in the area of purchase intent. We
found that drop-down or radio buttons produced no significant difference in results:
Question Type Comparison:
Drop Down vs. Radio Button
40.0%
36.2%
35.0%
32.9%
Drop Down
Radio Button
30.9%
Percent of Respondents
30.0%
28.2%
25.0%
20.9%
19.9%
20.0%
15.0%
10.0%
7.6% 7.6%
5.3%
5.0%
2.3%
3.7%
4.3%
0.0%
Definitely Will
Purchase
Probably Will
Purchase
May or May Not
Purchase
Probably Will
Not Purchase
Definitely Will
Not Purchase
Don't Know
Purchase Intent
What's more, when we asked respondents which they prefer, we discovered that they don't see a
significant difference between the two question types. While 35% said they preferred radio buttons,
and 17% voted in favor of drop-downs, 48% said that either one was fine with them.
Respondent Preference:
Question Type
Radio, 35%
Either, 48%
Drop Down, 17%
Copyright © 2002, InsightExpress, LLC. All rights reserved.
Distributing, copying, or unauthorized use is prohibited.
9
Determining Optimum Survey Length
Your survey should be as short as possible. That reliable piece of survey design advice is especially
valuable when it comes to Web surveys.
A recent study conducted by InsightExpress found that short surveys resulted in completion rates that
were nearly three times higher than those achieved by long surveys. In addition, the results offer an
excellent illustration of non-response bias in action.
Short vs. Long Surveys
Survey Characteristics
Survey length (minutes)
Number of questions
Completion rate
Demographics
M/F Ratio
Average age (years)
Average household income
Attitude and Perception (Top 2 Boxes)
Purchase intent
Concept appeal (liking)
Value
Short
Long
6
12
31.4%
21
23
11%
49/51
43.4
$59,768
51/49
42.8
$59,122
8.6%
3.7%
22.2%
24.3%
13.5%
21.6%
The study involved a concept test where two surveys were launched to assess consumer reaction to a
proposed new product. The "short" survey consisted of 12 questions and took about six minutes to
complete. The "long" survey posed 23 questions and took 21 minutes to complete. In the end, the short
survey achieved a 31.4% completion rate, while the long survey was completed by just 11% of those
who began it.
And although the demographics of respondents to both surveys were similar, there were significant
differences in how they responded when it came to attitudes and perceptions. Looking at the top two
boxes in this area, those taking the short survey showed considerably lower levels of purchase intent
and liking for the concept.
It seems likely that a respondent who's willing to commit more than 20 minutes to answering a
lengthy survey may not be truly representative of the population. Maybe he or she simply has lots of
free time. Or, more likely, you're looking at a person who has a particular interest in the survey topic
that probably wouldn't be shared by the general public.
So while you may be able to gather more information by asking more questions, you run the risk of
alienating respondents and altering the quality of your data. That's why we recommend that you limit
your survey to 12 to 15 questions. In fact, we recently asked 1,575 respondents how much time they'd
be willing to devote to completing an online survey. They told us in no uncertain terms (87%) that
they're most likely to complete an online survey if takes less than 20 minutes. But they're even more
agreeable to surveys that require no more than 15 minutes of their time.
Copyright © 2002, InsightExpress, LLC. All rights reserved.
Distributing, copying, or unauthorized use is prohibited.
10
Maximum Online Survey Length Prior to Abandonment
35.0%
Percent of Respondents
30.0%
28.7%
Your best bet is to keep your survey under
15 minutes, as 78% say that is their limit.
28.0%
25.0%
20.0%
15.7%
15.0%
9.0%
10.0%
6.6%
5.2%
4.5%
5.0%
2.2%
0.0%
Less than 1
minute
2 to 5
minutes
6 to 10
minutes
11 to 15
minutes
16 to 20
minutes
21 to 25
minutes
26 to 30
minutes
Longer than
30 minutes
Number of Minutes
When Is a Long Survey Acceptable?
There are exceptions to consider when it is difficult, if not impossible to avoid a long survey. If for
example, you're surveying a group of people who have a vested interest in the outcome of your
research (i.e. employees, members of an organization or customers who have made a major long-term
investment in a particular product or service), you can ask more questions without the same kinds of
concern for response rates or bias. Or if your respondents are members of a panel who have agreed in
advance to answer questionnaires of a given length, you can expect higher levels of cooperation than
usual.
Overall, it is important to remember that respondents almost always show a preference for shorter
surveys over longer ones. If you still have more questions to ask, conduct another survey.
Copyright © 2002, InsightExpress, LLC. All rights reserved.
Distributing, copying, or unauthorized use is prohibited.
11
Question Wording
The best approach when crafting your online survey questions is to make sure that each question is as
short, simple, and direct as possible.
For example, if you wanted to assess customer satisfaction with an online ordering system you should
not ask, "How was your last experience ordering online from Smith & Company?" If you did, you
would most likely get single-word answers (e.g. "fine") that wouldn't give you much information.
Avoid relying on single questions to gain insights into your audience. Instead, construct a set of
questions that will allow you to get specific feedback about a series of characteristics, options,
features, etc. Here are a few tips to help ensure that you're asking the right questions.
• Ask one thing at a time – Avoid confusion by taking a question like, "Did the order
confirmation and shipping procedures at Smith & Company meet your expectations?" and
break it into two separate questions instead.
• Avoid bias – It is easier than you may think to telegraph the "right" answers to some questions.
For example, if you asked, "Given the concerns of environmentalists and other groups, do you
think that Smith & Company should continue its policy of sending each item in a shipment in
separately wrapped packages?", you would most likely receive the same answer from
everyone. After all, who wants to advocate using excessive amounts of packaging materials?
• Look out for loaded questions – Be careful to present all sides of an issue when you ask for an
opinion. "Should Smith & Company offer a separate site for corporate account holders, or is
the current site sufficient?" doesn't give respondents an opportunity to consider other options
when it comes to handling large corporate orders. A better question would be "Which of the
following do you think would help meet the needs of large corporations ordering from Smith
& Company?" and follow it with a list of several options (including a special website,
expedited or standard ordering processes, etc.) along with directions to select all that apply.
Copyright © 2002, InsightExpress, LLC. All rights reserved.
Distributing, copying, or unauthorized use is prohibited.
12
Converting Mail and Telephone Surveys
A common misperception market researchers have is that converting a survey from traditional
methods to online requires little, if any, design changes. The Internet is a unique medium. Only by
following best practices specific to the online environment can you experience high response rates and
data that is comparable to data collected from traditional studies.
Shifting Focus
Because it is typically very difficult with traditional methods to obtain respondents, the temptation
carries over to online research to ask everything you can, and get as many question in when you have
the respondent's attention, commonly referred to as "boiling the ocean."
But online research offers you easier, less costly access to respondents, so your focus can shift from a
single long survey to several shorter surveys, leveraging your findings along the way.
Rewrite your survey keeping in mind that your respondents are always just one click away from
checking stock quotes, reading the news or checking e-mail.
And keep in mind that the computer screen is, in some ways, more restrictive than the printed page.
Your respondent can't scan ahead to see what's coming. Keep your survey flowing smoothly and
intelligently.
Price Comprison
$50,000
The price and sample
availability associated
with online research
make running more
surveys (instead of
longer surveys) possible,
and best practice.
$45,000
$40,000
Telephone
Mail
Online
Project Price
$35,000
$30,000
$25,000
$20,000
$15,000
$10,000
$5,000
$0
0
500
1000
1500
2000
2500
Sample Size
Copyright © 2002, InsightExpress, LLC. All rights reserved.
Distributing, copying, or unauthorized use is prohibited.
13
Rating Averages by Methodology
60%
Studies have found
respondents showing a
bias toward selecting
the endpoints of a rating scale during phone
surveys.
Percent of Respondents
50%
40%
Telephone
Online
30%
20%
10%
0%
Strongly Agree
Agree
Neither Agree Nor
Disagree
Disagree
Strongly Disagree
Interviewer: "Please indicate how strongly you agree or disagree with the statement, 'I will purchase the
product' - do you strongly agree, agree…"
Anxious to finish the interview, the respondent interrupts: "Strongly agree. Next question."
Simple Is Always Best Practice
From a structural point of view, make sure your survey is as simple and straightforward as it can be,
while including questions to probe both expected and unexpected answers.
Methods to simplify your survey include reducing the overall number of checkbox rating grids and
use piping (feeding data from one question to the next) to reduce answer sets for brand lists, names of
items purchased, etc.
Resort to multi-loop structures only when absolutely necessary. Test your survey, looking for any
differences resulting from word changes, respondent demographics and methodologies.
Copyright © 2002, InsightExpress, LLC. All rights reserved.
Distributing, copying, or unauthorized use is prohibited.
14
Invitations and Incentives: Gaining Cooperation
Best practices applied to your online survey mean little if you cannot convince people to accept your
invitation and participate. Driving cooperation rates starts with effective invitations – and sometimes
may even include an incentive.
Survey Invitations
The same factors that make soliciting respondents for an online survey less intrusive – and therefore,
more readily welcomed – can also make the invitations easier to overlook. It's important to give
careful consideration to both your medium, and your message.
Among the most popular methods for inviting people to take your survey:
• e-Mail – The best method if you have a well-defined audience, a list of their e-mail addresses,
and permission to send them e-mail. You can purchase/rent lists or use names from your own
database of customers, prospects, website visitors, members, employees, etc. Remember that
your subject line is key to getting your invitation read.
• Website banners, buttons and other links – The best choice when looking for feedback from
visitors to a specific website. Also the best way to recruit for low-incidence populations by
issuing your invitation on websites known to draw an audience similar to the one you're
trying to reach.
• Pop-up surveys – Similar to ads that pop up when visiting a website. Use these judiciously,
and only on sites that are very strongly related to the content of your survey, as potential
respondents can see them as a nuisance.
Performance of Invitation Methods.
Cooperation Rate
Completion Rate
Banner
.5%-5%
20%-60%
Pop-Up
1%-10%
20%-60%
Pop-Under E-Mail List
1%-7.5%
2%-50%
20%-60%
20%-80%
Whichever method you choose, make the most of the opportunity to capture a respondent's attention
and get him or her to say "yes."
Be proactive in convincing the members of your audience that completing your survey is just as
important to them as it is to you. How do you do that? By employing a WIIFM (what's in it for me?)
strategy. Communicate right up front why taking five or ten minutes out of an already busy day to
answer your survey questions is a worthwhile exercise. Some generic starting points:
• "We'd like to know what you look for in a family restaurant, so we can provide you with the
best possible food, service and value."
• "With your input, we'll be able to offer you more of what you're looking for – in terms of
products, service and value."
• "Your opinion is important to us because …"
Copyright © 2002, InsightExpress, LLC. All rights reserved.
Distributing, copying, or unauthorized use is prohibited.
15
Be as specific and clear as you can. And if you're creating an e-mail invitation, be as personal as you
can. That means being sure to mention the recipient's name, what you know about any recent
transactions, and acknowledging any past correspondence. The more you can do to emphasize
whatever relationship you have with the recipient, the better the chance that he or she will agree to
participate in your survey.
Having said that, it's also important that you keep your invitation short – and fun for respondents.
And don't use the same invitation over and over. People do remember.
When To Use Incentives
The question of whether an incentive is necessary depends largely on your audience. Incentives are
typically considered unnecessary for consumer surveys while they are seen as almost essential in the
business-to-business environment. An appropriate incentive for the businessperson would be an offer
to share the survey results, complete with industry-related information that is of interest to them.
Incentives may also be necessary if your survey is especially long – over 15 minutes. Better practice than
offering incentives for long surveys would be to simply shorten your survey. Recognizing that this is not
always possible, make sure your offer is an incentive that's attractive enough to boost response, without
being so spectacular that you end up with biased results because you've skewed your sample by
encouraging misbehavior. The larger the incentive, the greater likelihood for respondent misbehavior.
Finally, incentives are sometimes necessary to help boost response from low-incidence populations or
those who typically don't respond under other circumstances.
What Do People Want?
For the answer, InsightExpress asked respondents – and not surprisingly, cash was the clear winner.
Next came actual products while more people said they preferred no incentive at all to coupons,
redeemable points, and sweepstakes.
Preferred Type of Incentive
53.8%
Cash
62.4%
20.9%
Products Mailed to You
13.8%
6.7%
4.3%
Coupons/Discount Offers
2.7%
3.9%
Redeemable Points
Female
Male
Other
2.3%
2.8%
2.1%
2.1%
Sweepstakes
None
0.0%
11.2%
10.4%
10.0%
20.0%
30.0%
40.0%
50.0%
60.0%
70.0%
Percent of Respondents
Copyright © 2002, InsightExpress, LLC. All rights reserved.
Distributing, copying, or unauthorized use is prohibited.
16
The Incentive Impact
InsightExpress recently fielded three identical surveys – consisting of 17 questions each, and taking
roughly 10 minutes to complete – to a consumer audience. One survey offered a $1 incentive, while
another offered $5, and the third presented no incentive at all. As you can see, the incentive did help
boost completion rates somewhat – although the $1 offer worked better than the $5 offer. But the $1
incentive also seemed to encourage respondents to react slightly more favorably to the concept.
Survey Completion Rate
No
$1
$5
Incentive Incentive Incentive
20%
27%
25%
Gender
Male
Female
41%
59%
59%
46%
54%
41%
59%
Purchase Intent
Top 2 Box
Bottom 2 Box
Mean Rating Score
9%
56%
1.9
15%
46%
2.3
10%
50%
2.0
To determine what kind of impact incentives might have on your research, consider splitting your
sample and testing an offer-based invitation against one without an offer. While it's almost certain that
you'll achieve higher response rates with the incentive, you'll be able to see just how much higher.
And you'll get a chance to evaluate potential bias issues for future surveys.
Copyright © 2002, InsightExpress, LLC. All rights reserved.
Distributing, copying, or unauthorized use is prohibited.
17
Understanding the Potential for Bias
As is true for any research methodology, it's important to be aware of potential sources of bias in
online research. Fielding more than 6 million completed surveys for over 7,000 individual projects has
shown us that:
• Between 10% and 20% of all completions will occur within the first hour a survey is launched.
• For consumer audiences, the greatest activity occurs from 4 p.m. to 3 a.m. (Eastern) and then
again from 6 a.m. to noon (Eastern).
• For business audiences, responses are distributed throughout the workday with significantly
less activity on weekends.
Also of note is a gender bias associated with the day of the week. Females are more likely to
participate in surveys on weekdays, while males are more likely to respond during weekends.
Gender Bias by Type of Day
70.0%
59.5%
60.0%
Male
Female
54.6%
Percent of Respondents
50.0%
45.4%
40.5%
40.0%
30.0%
20.0%
10.0%
0.0%
Weekday
Weekend
Minimizing Bias
Knowing potential sources of bias give you the ability to eliminate them. For example, you should
always plan to keep your survey in the field for at least one 24-hour period. Stay away from forcing
faster fielding and/or taking advantage of oversampling techniques. This creates more opportunities
for bias and draws into question the true representativeness of "overnight" polls.
To ensure that you capture adequate male representation, your field schedule should include at least
one weekend day. And to accommodate the work and travel schedules of professionals, you should
plan to keep b-to-b surveys in the field for at least one full week.
Copyright © 2002, InsightExpress, LLC. All rights reserved.
Distributing, copying, or unauthorized use is prohibited.
18
Developing an Effective Privacy Policy
Privacy has become one of the most valuable – and most talked-about – commodities of the 21 st
century. Where online research is concerned, you need to be scrupulous about maintaining the privacy
of both the research sponsor(s), and the respondents. While a large portion of your privacy policy may
be dictated by your company's overall communications policies, here are a few factors to consider:
• Where will you be conducting surveys? In the U.S. only? In Europe? Other countries?
• What is the age range of your target audience? Are they teenagers or adults?
• Is your industry governed by specific regulations (e.g., GLB or HIPAA) that impact the release
of information?
• Will you need to capture personally identifiable information? And if so, why?
Some essentials for your policy include giving respondents the ability to opt-out, explanation of policy
changes if applicable, and contact information for questions regarding the policy.
Copyright © 2002, InsightExpress, LLC. All rights reserved.
Distributing, copying, or unauthorized use is prohibited.
19
About InsightExpress
InsightExpress is the acknowledged pioneer of rapid turnaround, high-quality, online market research
services. With our award-winning technology, market research expertise, and access to more than 90
million online individuals, we enable clients to easily harness market research to make the right
business decision in real time. InsightExpress is affiliated with the Interpublic Group (NYSE:IPG),
NFO WorldGroup, and General Atlantic Partners.
To learn more about how InsightExpress can help you with your market research needs, or for more
tips on designing online surveys, call InsightExpress toll-free at 1-877-329-1552 or visit us at
http://www.insightexpress.com today.
Entire contents, Copyright © 2002 InsightExpress, LLC. All rights reserved. Reproduction or
redistribution of this report, information, or supporting data in any part or form without prior
written consent from InsightExpress, LLC is forbidden. InsightExpress, LLC disclaims all
warranties as to the accuracy, completeness, or adequacy of such information. InsightExpress,
LLC shall have no liability for errors, omissions, inadequacies, misuse, or interpretations of the
data and information contained within this report. The reader assumes complete responsibility
for the use of the information contained within. The opinions expressed herein are subject to
change without notice in any form or manner.
Copyright © 2002, InsightExpress, LLC. All rights reserved.
Distributing, copying, or unauthorized use is prohibited.
20


© Copyright 2026