
MORPHOLOGY AND NON-ISOTHERMAL CRYSTALLIZATION OF POLY(ETYLENE TEREPHTHALATE) (PET)/GRAPHITE OXIDE (GO) NANOCOMPOSITES
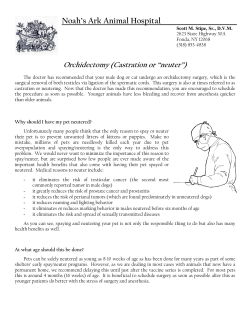
MORPHOLOGY AND NON-ISOTHERMAL CRYSTALLIZATION OF POLY(ETYLENE TEREPHTHALATE) (PET)/GRAPHITE OXIDE (GO) NANOCOMPOSITES Sandra Paszkiewicz1*, Anna Szymczyk2, Zdenko Špitalský3, Jaroslav Mosnáček4, Zbigniew Rosłaniec1 1 Institute of Materials Science and Engineering, West Pomeranian University of Technology, Piastow 17 Av., Szczecin, 70-310, Poland 2 Institute of Physics, West Pomeranian University of Technology, Piastow 48 Av., Szczecin, 70-310, Poland 3 Polymer Institute, Slovak Academy of Sciences, Dúbravská cesta 9, Bratislava 45, 845 41, Slovakia, 4 Polymer Institute, Centre of Excellence FUN-MAT, Slovak Academy of Sciences, Dúbravská cesta 9, Bratislava 45, 845 41, Slovakia * [email protected] Introduction Incorporation of nanofillers to a polymer matrix gives rise to a new class of materials known as polymer nanocomposites, which have more potential for many applications. Significant improvement in properties of the composites depends mainly on: the size and shape of particles nanofiller [1], surface area, degree of surface development, surface energy and on the spatial distribution of the polymer matrix of nanoparticles Exfoliated and homogeneous dispersions of the layered nanofillers, such expanded graphite or other graphene derivatives, can be obtained straightforwardly when the polymer contains functional groups, for example, amide or imide groups. This is because the functionalized graphene sheets have polar (hydroxyl, carboxyl) groups, which are compatible with polymers containing polar functional groups [2]. It has been shown [3] that for polyester-clay nanocomposites modulus and HDT increase with clay concentration as much as threefold. Furthermore, nonisothermal crystallization dynamics shows that the nanocomposites of PET have a three times greater crystallization rates than that of pure PET. The exfoliated clay particles act as nucleating agents and have strong interactions with PET molecular chains [3]. The increase of the apparent crystallinity with filler content also appears to result from the incidence of very rapid crystallization due to the nucleating effect of nanofillers. It is considered that the greater the interlamellar distance, the greater the interaction of PET with layered nanofiller sheets. Graphene oxide (GO) with functionalized groups on its surface has a larger interlayer distance than graphite [2,4]. It can be readily exfoliated into individual GO sheets in water and forms stable dispersions after sonication. Polymer nanocomposites with GO as filler have shown dramatic improvements in properties such as elastic modulus, tensile strength, electrical conductivity, and thermal stability [5,6]. In this work, the influence of graphite oxide (GO) content on the morphology and non-isothermal cristallization of poly(ethylene terephthalate) (PET) was investigated. For this purpose PET/GO nanocomposites at different nanofiller loadings were prepared by in situ polymerization. Experimental Materials. For the in situ synthesis of poly(ethylene terephthalate)/graphite oxide nanocomposites (PET/GO), the following chemicals were used: dimethyl terephthalate (DMT) (Sigma-Aldrich), ethane-1,2-diol (ED) (SigmaAldrich), zinc acetate Zn(CH3COO)2 (Sigma-Aldrich) -ester exchange catalyst, antimony trioxide Sb2O3 (Sigma-Aldrich) - polycondensation catalyst, Irganox 1010 (Ciba-Geigy, Switzerland) as a thermal stabilizer. Graphite oxide (GO) with flake size of about 5 μm was provided by Polymer Institute of Slovak Academy of Sciences, where the natural graphite was first converted to intercalated or expandable graphite through chemical oxidation in the presence of concentrated H2SO4 and HNO3 acids. Before adding nanofillers to the reaction mixture they were combined with ethanediol in order to split agglomerates and to improve further exfoliation. Preparation of PET/GO nanocomposites PET/GO nanocomposites were prepared by in situ polymerization in the polycondensation reactor (Autoclave Engineers, Pennsylvania, USA) capacity of 1000 cm3.The process was conducted in two stages and followed the same procedure as described in our previous publications [7-10]. Before polymerization, the dispersion of GO sheets was prepared by dispersing the desired amount of graphite oxide in ca. 250-300 ml of PDO through ultrasonication for 15 min using sonicator (Homogenizer HD 2200, Sonoplus, with frequency of 20 kHz and 75% of power 200W) and next by using for 15 min intensive mixing with high-speed stirrer (Ultra-Turax T25). Additionally, to improve the dispersion/exfoliation of GO in ED an ultra-power lower sonic bath (BANDELIN, Sonorex digitec, with frequency of 35kHz and power 140W) was applied for 20 hours. Characterization techniques The inherent viscosity [η] of the polymers was determined at 30 °C using a capillary Ubbelohde type Ic (K = 0.03294), according to the procedure described elsewhere [7-11]. The polymer solution had a concentration of 0.5 g/dl in mixture phenol/1,1,2,2-tetrachloroethane (60/40 by weight). The polymer nanocomposite solution was filtered through 0.2 μm pore size polytetrafluoroethylene (PTFE) filter (Whatman; membrane type TE 35) to ensure that the intrinsic viscosity is not affected by present GO. After filtration the polymer was precipitated and re-dissolved. The Mark–Houwink equation [ ] 3.72 10 4 M 0.73 was used to calculate the average viscosity molar mass of PET homopolymer [12]. The melt volume rate (MVR) was measured using a melt indexer (CEAST, Italy) as melt flow in cm3 per 10 min, at temperature of 280oC, and at orifice diameter 1.050 mm and under 2.160 kg load, according to ISO 1133 specification. The density was measured at 23◦C on hydrostatic balance (Radwag WPE 600C, Poland), calibrated according to standards for which density is known. The thermal properties of PET based nanocomposites were studied with differential scanning calorimetry (DSC, TA Instruments Q-100, USA, 2004) in cycle: heatingcooling-heating in the temperature range from -50 to 300oC at a scan rate of 10oC/min. To determine the melting and crystallization peaks, the second heating and cooling scans were used. The glass transition temperature (T g) for the prepared nanocomposites and pure PET was taken as the midpoint of the change in heat capacity. The degree of crystallinity (Xc, mass fraction) was calculated using the formula: Xc H m 100% H m0 (1) where H0m is 140 J/g. Small angle X-ray scattering (SAXS) measurements were performed at beam line A2 at HASYLAB (DESY, Hamburg). The wavelength of the X-ray beam was = 0.15 nm. Scattering patterns were collected by a two-dimensional MAR-CCD-165 detector placed at a distance of 2443 mm from the sample. The scattering-vectors were calibrated using a dray rat-tail tendon protein. Samples, mounted in Mettler hot stage and encased between aluminium-foil windows, were heated and cooled at heating rates of 5 o C/min over a temperature range of 25–275 oC. During cooling from the melt, data was collected with time scanning 60 and accumulation time 20 s. The raw SAXS intensity data was corrected for background scattering. Changes of the long period (L) and the thicknesses of the crystalline lamellae (lc) and amorphous layers (la) during non-isothermal crystallization of the neat PET and PET/0.5GO nanocomposite were determined from the correlation function according to procedure reported in [13]. Results A series of thermoplastic polyesters based on poly(ethylene terephthalate) (PET) and graphite oxide (GO) were synthesized by a catalyzed two-step reaction, involving transesterification and polycondensation in the bulk. Nanocomposites with 0.1, 0.3, 0.4 and 0.5wt.% of GO were prepared. Additionally, for comparison purposes, unmodified PET was synthesized and characterized in the same manner as the nanocomposites. In order to prepare high molecular mass polyesters, the polycondensation of these oligomers ensued at higher temperature, with the simultaneous application of high vacuum. The intrinsic viscosity of PET that was prepared was 0.556 dl/g. The presence of the GO in the polymerization mixture affected the reaction, leading to variations of the final intrinsic viscosities of the prepared nanocomposites. As shown in Table 1, the intrinsic viscosity gradually decreased with the increasing concentration of GO to 0.485 dl/g for PET/0.5wt.% of GO. As can be also seen in Table 1, that the synthesized nanocomposites have high molecular masses with a slight decrease with the increasing content of GO from 2.12·104 for PET to 1.85·104 for PET/0.5GO nanocomposite. A slight increase in the MVR only for nanocomposite with 0.1wt.% of graphene oxide and almost no changes for PET/0.5GO was observed. The comparable value of MVR for PET and PET/GO nanocomposites was due to the polymer – functionalized graphene sheets interactions. Nanocomposites in comparison to the neat PET showed slightly higher density due to the presence of nanofiller with higher density in PET matrix. Morphology of PET nanocomposites containing functionalized graphene sheets (GO) was investigated using both SEM and TEM analysis. Figures 1a and b show SEM micrographs of fracture surfaces of PET nanocomposites with GO. SEM analysis of the fracture surfaces indicate relatively homogenous dispersion of graphene sheets in polymer matrix. Individual functionalized sheets and some agglomerates of GO sheets, clearly embedded in the PET matrix are observed on the surface (Figure 1a). The ability of semicrystalline polymers (i.e. PET) to crystallize is usually affected by nanofillers [14-15]. The distributed nanoparticles have the influence on nucleation and growth of crystallites in polymer matrix. Table 1. Physical properties of PET/GO nanocomposites. Sample [η] (For polymer matrix) dL/g Mv x 104 g/mol d23 g/cm3 MVR cm3/10 min PET 0.536 2.12 1.330 72.8±1.9 PET/0.1GO 0.490 1.87 1.338 74.5±7.8 PET/0.3GO 0.490 1.87 1.340 73.9±3.9 PET/0.4GO 0.490 1.87 1.348 72.8±1.4 PET/0.5GO 0.486 1.85 1.351 72.4±2.3 [] -intrinsic viscosity; Mν– average viscosity molecular mass; MVR - melt volume rate at 280 oC; d – density at 23 oC. a) b) Figure 1. SEM micrographs of PET/GO nanocomposites: a) 0.1GO wt.%, b) 0.5GO wt.%. From TEM images (Fig. 2), it was observed that the dispersion of the graphene flakes into the PET matrix was homogeneous, while at higher concentrations of GO some small aggregates were also formed. This was due to the extremely high specific area of GO and the strong particlematrix interactions that take place. a) accompanied by the decrease of the la for neat PET and nanocomposites was observed. b) a) Exo up 5 PET/0.5GO Heat Flow [W/g] PET/0.4GO PET/0.3GO PET/0.1GO PET 0 50 100 150 200 250 300 o Temperature [ C] b) PET 0 PET/0.5GO Heat Flow [W/g] Figure 2. TEM micrographs of PET/GO nanocomposites: a) 0.3GO wt.%, x 50 000, b) 0.5GO wt.%, x 150 000. b) In the prepared nanocomposites no significant effect on degree of crystallization was observed and the values for nanocomposites with the highest concentration of GO (PET/0.4GO and PET/0.5GO) were comparable to the neat PET (Table 2, Fig. 3). This was probably due to the fact that the sizes of individual oxidized graphite nanoplatelets were below the critical nucleation agents, as a result, may not constitute active centers of growth of crystallites. However, as seen in the crystallization traces in Fig. 3a, graphite oxide played a nucleation role (change in T c form 214 oC for neat PET to 221 oC for PET/0.5GO). The lack of changes in the glass transition temperature (Tg) of semicrystalline PET regardless of the GO content was also observed. Nanocomposites with different amount of GO have very slightly lower values of Cp at Tg than the neat PET. PET/0.4GO PET/0.3GO PET/0.1GO -5 Exo up 0 50 100 150 200 250 300 o Temperature [ C] Table 2. Transition temperatures and the degree of crystallinity of PET/GO nanocomposites Tg C Cp J/g oC Tm o C PET 81 0.13 PET/0.1GO 82 0.11 Sample o Tc C xc % 257 214 27.1 250 214 26.7 o Figure 3. DSC thermograms obtained during cooling (a) and 2nd heating (b) for PET/GO nanocomposites. 0,9 PET PET/0.5GO 82 0.12 253 217 26.8 PET/0.4GO 82 0.12 254 218 27.2 PET/0.5GO 81 0.13 255 221 27.4 Tg - glass transition temperature; cp - heat capacity; Tm - melting temperature; Tc - crystallizing temperature; xc – degree of crystallinity. [a.u.] PET/0.3GO 0,3 (x) 0,6 0,0 -0,3 -0,6 0 5 10 15 x Effect of the presence of GO in PET matrix on the evolution of the lamellar nanostructure was monitored by SAXS during non-isothermal crystallization. The correlation function γ(x) has been applied to depict the changes of the nanostructure of PET/GO composites and neat PET during crystallization from the melt. Figure 3 displays the representative correlation functions for neat PET and nanocomposite (PET/0.5GO) obtained after cooling from the melt. According to procedure reported in [16] analysis of the γ(x) allows to determine: L, lc, la and crystallinity within the lamellar stacks (c). Figure 4 summarizes the results of the nanostructure studies during non-isothermal crystallization from the melt of neat PET and PET/GO nanocomposites. The difference between L and lc gives la. At higher temperatures a significant decrease of L 20 25 30 -1 [nm ] Figure 3. One-dimensional correlation function for PET and PET/0.5GO nanocomposite; samples after non-isothermal crystallization This is consistent with the appearance of lamellar stacks filling in the sample volume. Finally, nanocomposites showed almost the same values of the long period (L=11.4 nm for neat PET and L=11.5 nm for PET/0.5wt.% of GO). Nanocomposites have comparable thickness of crystalline lamellae as neat PET. Slightly higher value of lc for nanocomposites with the highest concentration of nanofiller was observed. According to an assumption that stacks of lamellae are volume-filing in the semicrystalline polymer the linear crystallinity determined by SAXS should be identical to the bulk crystallinity measured with the DSC method. 30 PET/0.5GO L PET/0.5GO lc PET/0.5GO la PET L PET lc PET la 25 L , lc , la [nm] 20 cooling 15 10 5 0 0 50 100 150 200 250 o Temperature [ C] Figure 4 Changes of long period (L), crystalline and amorphous lamellae thickness (lc, la) calculated from the one-dimensional correlation function for neat PET and PET/0.5GO nanocomposite during crystallization form the melt. Table 3. Parameters of nanostucture determined from correlation function for PET and PET/0.5GO. Sample L [nm] lc [nm] la [nm] E [nm] c PET 11.4 4.60 6.80 2.09 0.40 PET/0.5GO 11.5 4.63 6.87 1.97 0.40 L - long period; lc – thickness of crystalline lamellae; la – thickness of amorphous layer; E – thickness of transition layer ; c – volume fraction of crystallinity The fully amorphous and crystal PET has density of 1.331 g/cm3 and 1.455 g/cm3 [17], respectively. Using the method of relations for densities of amorphous and crystalline phases, the volume fraction crystallinity were transformed into a mass fraction crystallinity and compared with the value obtained from DSC method. Here, the obtained for neat PET value of volume fraction crystallinity is 0.4 and it’s around 0.274 of mass fraction and is very close to the calculated mass fraction of crystallinity by DSC (xc=0.271). The obtained results for neat PET confirm that the model of crystalline-amorphous two-phase lamellar system applied here can correctly describe the real structure of investigated PET and PET/GO nanocomposites Conclusions Nanocomposites based on PET containing from 0.1 to 0.5 wt.% of graphite oxide (GO) were obtained by in situ polymerization. The prepared nanocomposites showed uniform dispersion of GO sheets in polymer matrix (SEM. TEM). In comparison to the neat PET, the glass transition temperature and melting temperature of PET/GO nanocomposites are not influenced by the presence of graphite oxide sheets. The nucleating effect due to the presence of GO hasn’t been observed, so only 7 oC change in crystallization onset temperature for PET/0.5GO nanocomposite in comparison to the neat PET was observed. The degrees of crystallinity of the nanocomposites are comparable to the neat PET and the results obtained for both DSC and SAXS methods were almost the same (27.1 and 27.4 %). From SAXS data it was found that the long period of PET/GO nanocomposites is similar to the neat PET. This work is sponsored by European Project MNT ERA NET 2012 (project APGRAPHEL). The experiments performed at A2 in HASYLAB (DESY, Hamburg) were done using the beamtime of the proposal II-20110255EC References [1] Geim AK, Novoselov KS. The rise of graphene. Nature Mater 2007;6(3);183-191. [2] Li D, Kaner RB, Graphene based materials. Science 2008; 320:1170-1171 [3] Yangchuan K, Chenfen L, Zongneng Q. Crystallization, properties, and crystal and nanoscale morphology of PETcaly nanocomposites. J Appl Polym Sci 1999;71(7):113946. [4] Huang X, Yin Z, Wu S, Qi X, He Q, Zhang Q et al. Graphene-Based Materials: Synthesis, Characterization, Properties, and Applications, Small 2011; 7(14):1876-1902 [5] Ramanathan T, Abdala AA, Stankovich S, Dikin DA, Herrera-Alonso M, Piner RD et al. Functionalized graphene sheets for polymer nanocomposites. Nature Nanotech 2008;3:327-331. [6] Steurer P, Wissert R, Thomann T, Mülhaupt R. Functionalized graphenes and thermoplastic nanocomposites based upon expanded graphite oxide. Macromolecul Rapid Comm 2009;30(4-5);316-327. [7] Paszkiewicz S, Szymczyk, A, Špitalský Z, Soccio M, Mosnáček J, Ezquerra TA, Rosłaniec Z. Influence of EG on electrical conductivity of PET/EG nanocomposites prepared by in situ polymerization. J Polym Sci: Part B: Polym Phys 2012; 50: 1645-52. [8] Paszkiewicz S, Szymczyk, A, Špitalský Z, Soccio M, Mosnáček J, Ezquerra TA, Rosłaniec Z. Morphology and Thermal Properties of Expanded Graphite (EG)/Poly(ethylene terephthalate) (PET) Nanocomposites. CHEMIK 2012;66(1), 21-30. [9] Hernández JJ, García-Gutiérrez MC, Nogales A, Rueda DR, Kwiatkowska M, Szymczyk A, Roslaniec Z, Concheso A, Guinea I, Ezquerra TA. Influence of preparation procedure on the conductivity and transparency of SWCNTpolymer nanocomposites. Comp Sci Tech. 2012; 69,18671872. [10] Szymczyk A, Roslaniec Z, Zenker M, García-Gutiérrez MC, Hernández JJ, Rueda DR, Nogales A, Ezquerra TA. Preparation and characterization of nanocomposites based on COOH functionalized multi-walled carbon nanotubes and on poly(trimethylene terephthalate). eXPRESS Polym Lett 2011; 5(11): 977–995. [12] Anand KA, Agarwal US, Joseph R. Carbon nanotubesreinforced PET nanocomposite by melt-compounding. J Appl Polym Sci. 2007; 104(5): 3090–3095. [13] Szymczyk A, Roslaniec Z. Non-isothermal crystallization of poly(trimetylene terephthalate)/singlewalled carbon nanotubes nanocomposites. Polimery 2012; 57(3): 57-63. [14] Wen L, Xin Z. Effect of a novel nucleating agent on Isothermal crystallization of poly(L-lactid acid). Chin J Chem Eng 2010; 18(6): 899-904. [15] Kalaitzidou K, Fukushima H, Askeland P, Drzal LT. The nucleating effect of exfoliated graphite nanoplatelets and their influence on the crystal structure and electrical conductivity of polypropylene nanocomposites. J Mater Sci 2008;43:2895-2907. [16] Rabiej S., Rabiej M. Determination of lamellar structure of semicryslline polymers using a computer program SAXSDAT, Polimery 2011; 56(9): 662-670. [17] Miller RL. Crystallographic data melting points for various polymers. In Polymer Handbook 4 th Edn. WileyInterscience, New York; p.VI42-VI43, 1999.


© Copyright 2026