
Using the Build signal tool NOVA Technical Note 18
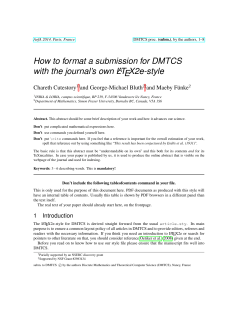
NOVA Technical Note 18
Using the Build signal tool
Case study: how to properly use the Build signal tool?
1 – The Build signal tool
Every command parameter or signal, measured or calculated, is identified by name
and type in NOVA. The Build signal tool is a data handling tool capable of gathering
all the items with the same identification in a single place. This tool offers some
unique benefits, already illustrated in previous technical notes.
In this technical note, the use of the Build signal tool will be covered in more detail.
2 – Understanding the Build signal
The Build signal data handling tool does not create new data. Instead, it is able to
search through a procedure or data set and collect all the values of the parameter
or signal that match a given identification. For example, as illustrated in Figure 1, if
a procedure or data set contains three different commands providing the
WE(1).Current signal, the Build signal tool is able to extract the values of this signal,
and copy them into a new table.
CV
(WE(1).Current)
LSV
(WE(1).Current)
Record signals
(WE(1).Current)
WE(1).Current
Figure 1 – Schematic overview of the Build signal tool
The number of values in the signal created by the Build signal command will be
equal to the sum of the number of values provided by the three source commands.
The Build signal has a number of controls that can be used. These controls are
explained in this section and practical examples are provided in the next sections.
1|Page
NOVA Technical note 18
All the settings of the Build signal tool are specified in the Build signal dialog, shown
in Figure 2.
Figure 2 – The settings of the Build signal tool are specified in a dedicated editor
2.1 – Location of the Build signal
The choice of the location of the Build signal tool is important for two reasons:
1. The location affects the number of values extracted by the tool.
2. The Build signal tool creates a copy of existing values. It is therefore
recommended to locate the Build signal in a convenient place.
Consider the example already illustrated in Figure 1. The procedure used in this
example contains a CV staircase command, followed by a Record signals (> 1 ms)
command and a LSV staircase command. Each of these commands collected a set
of data points (see Figure 3).
2|Page
NOVA Technical Note 18
Combined measurement
CV staircase
• i vs E
Record signals (>1 ms)
• i vs t
LSV staircase
• i vs E
WE(1).Potential
0.00244141
0.00488281
0.00732422
0.00976563
…
WE(1).Current
2.13562E-6
4.3689E-6
6.604E-6
8.84094E-6
…
Time
7.67796
7.70236
7.72676
7.75116
…
Time
WE(1).Current
WE(1).Potential
32.8636
33.0636
33.2636
33.4636
…
0.000458344
0.000458344
0.000458344
0.000458344
…
0.500275
0.500305
0.500305
0.500336
…
WE(1).Potential
WE(1).Current
Time
0.497589
0.495148
0.492706
0.490265
…
0.000455658
0.00045343
0.000451172
0.000448944
…
42.7124
42.7368
42.7612
42.7856
…
Figure 3 – Location of the data in the example
Since there is no data in the Combined measurement data set header, it is a good
location for the output of the Build signal tool.
Note
The output of the Build signal tool can be located anywhere in the procedure or
data set.
To use the Build signal tool at the location mentioned above, click the Combined
icon from the popup menu (see Figure 4).
measurement header and click the
Combined measurement
CV staircase
• i vs E
Record signals (>1 ms)
• i vs t
LSV staircase
• i vs E
Figure 4 – Adding a Build signal to the Combined measurement data set header
The Build signal will be displayed, showing the list of the all the commands and
command parameters identified by the Build signal tool in the frame on the lefthand side (see Figure 5).
3|Page
NOVA Technical note 18
Selected signals or
parameters
List of commands
and parameters
Search depth
Sorting options
Figure 5 – Overview of the Build signal editor controls
The options provided by the Build signal tool, like the Search depth and the Sorting
options are discussed in the next sections.
Expanding the three first group of commands reveals all the commands and
parameters identified by the tool (see Figure 6).
Figure 6 – The frame on the left shows all signals and parameters identified by the Build
signal tool
4|Page
NOVA Technical Note 18
The final group, called Untyped filter, contains all of the individual signals and
parameters listed in the previous groups, without command affiliation (see Figure
7).
Figure 7 – The Untyped signals group contains all the signals and parameters without
command affiliation
To select one or more of the signals or parameters shown in the Build signal tool,
double click the signal or parameter text in the frame on the left-hand side. The
selected signals or parameters will be added to the frame on the right-hand side.
For example, double clicking Time, WE(1).Current and WE(1).Potential will add these
three signals to the frame on the right-hand side. The choice of the signal or
parameter and the group in which they are listed is very important. Figure 8 and
Figure 9 and shows two possibilities.
Using the approach indicated in Figure 8, the Build signal will provide as output the
values of Time, WE(1).Current and WE(1).Potential from any instance of the Record
signals (> 1 ms) command. The procedure also includes a CV staircase command
and a LSV staircase command, both of which also provide values of Time,
WE(1).Current and WE(1).Potential. However, the Build signal tool is configured to
look at the data provided by any Record signals (> 1 ms) command only.
5|Page
NOVA Technical note 18
Figure 8 – Using the Build signal tool to isolate the Time, WE(1).Current and WE(1).Potential
signals provided by any instance of the Record signals (> 1 ms) command
Using the approach indicated in Figure 9, the Build signal will provide as output the
values of Time, WE(1).Current and WE(1).Potential from any command. The values
from these signals will be gathered from all three commands included in the
procedure: the CV staircase, the Record signals (>1 ms) and the LSV staircase
commands, in this order.
6|Page
NOVA Technical Note 18
Figure 9 – Using the Build signal tool to isolate the Time, WE(1).Current and WE(1).Potential
signals provided by any command
Clicking the
button validates the Build signal settings. The data set (or the
procedure) will be updated and the data will be added at the location where the
Build signal was added.
The method described in Figure 9 will provide all the values of the selected signals
in one convenient table. This in turn allows the data from all three commands to be
plotted in a single plot (see Figure 10).
7|Page
NOVA Technical note 18
Combined measurement
CV staircase
• i vs E
Record signals (>1 ms)
• i vs t
LSV staircase
• i vs E
i vs t
X = Time
Y = WE(1).Current
Z = WE(1).Potential
Figure 10 – Plotting the data provided by the Build signal tool
Note
All the data provided by the Build signal tool can be plotted as a single stream of
data points, regardless of which command provided the points.
2.2 – Sorting option
The Build signal tool provides the means to sort the data obtained with the tool,
based on first signal added to the tool. By ticking one of the two checkboxes, the
data provided by the Build signal tool can be sorted, descending (high to low) or
ascending (low to high), based on the values of the first array (signal or parameter),
which in the example shown in Figure 11 is the Time.
8|Page
NOVA Technical Note 18
Figure 11 – The option to sort the data provided by the Build signal tool is provided
Note
The data is always sorted based on the first signal or parameter in the list
displayed in the frame on the right-hand side. The sequence of the signals or
parameter can be adjusted if necessary.
2.3 – Indexing option
For each signal added to Build signal tool, it is possible to limit the selection to a
given range of value, based on the Index value. This option is only relevant for the
signals (which usually contain more than one value). To specify an index range, click
the button located next to a selected signal in the Build signal editor (see Figure
12).
9|Page
NOVA Technical note 18
Figure 12 – Using the index option in the Build signal tool
A new window will be displayed providing the option to select all the values, or a
specific range of values (selected on Index basis), as shown in Figure 13.
Figure 13 – Specifying an Index range for the selected signal
Clicking the
(see Figure 14).
10 | P a g e
button closes the window and updated the Build signal editor
NOVA Technical Note 18
Figure 14 – The Build signal dialog indicates the updated Index range
The same can be repeated with the two additional signals in order to create a
composite plot showing the first 10 points of each of the three measurement
commands (see Figure 15).
Combined measurement
CV staircase
• i vs E
Record signals (>1 ms)
• i vs t
LSV staircase
• i vs E
i vs t
X = Time
Y = WE(1).Current
Z = WE(1).Potential
Figure 15 – Plot generated from the indexed data provided by the Build signal
2.4 – Search depth
As already indicated, the Build signal is location dependent. To refine the data
selection of this tool, it may be necessary to adjust the location or the selection
criteria of the Build signal tool. The Demo 04 – Hydrodynamic linear sweep
voltammetry file provided in the demo database, is a good example.
11 | P a g e
NOVA Technical note 18
The Demo 04 file contains data from six consecutive linear sweep voltammetries
performed at six different rotation rates of the rotating disc electrode (RDE). One
convenient analysis method for this type of data is to plot the limiting current values
at each rotation rate in function of the square root of the angular frequency. This
plot is known as a Levich plot.
The Hydrodynamic i vs √ω analysis item located at the end of the file consists of a
Nested procedure command in which two Build signal commands have been
located. These Build signal commands have been predefined in order to create a
Levich plot.
To view the settings of these commands, load the file in the analysis view, select
the 𝜔𝜔 signal and click the button located in the toolbar, as shown in Figure 16.
Figure 16 – Viewing the settings of the Build signal tool used in the Demo 04 file
The Build signal editor will be displayed, indicating which signals are selected (see
Figure 17). There are two important parameters specified in this Build signal
command:
•
•
The Search depth parameter is set to 2.
The parameters to select are embedded into the Repeat for each value
command.
12 | P a g e
NOVA Technical Note 18
Figure 17 – The Build signal command used to select all the rotation rates
The search depth parameter has been set to two in order to allow the Build signal
tool to find all instances of the 𝜔𝜔 and the Rotation rate (RPM) parameters at least
one level outside its own Nested procedure.
If the search depth is left equal to 1, the Build signal command will only look inside
its own level. Since there are not Control Autolab RDE commands in this level, no
values will be found. By setting the parameter to 2, the Build signal command is
allowed to search for parameters that match the description one level higher
(illustrated schematically in Figure 18).
Search depth: 2
Search depth: 1
Figure 18 – Schematic overview of the effect of the search depth parameter
The commands located in the Hydrodynamic i vs √𝜔𝜔 group are accessible with the
search depth parameter set to 1. With this parameter set to 2, the Build signal tool
is allowed to search one level higher.
13 | P a g e
NOVA Technical note 18
In this level, which includes the rest of the procedure, the Control Autolab RDE
commands are present and values will be generated by the Build signal tool.
Note
In the example used in the previous sections, a top-down approach was used:
the Build signal command was located at the top most level. In this case, the
search depth parameter is irrelevant. In the example used in this section, a
bottom-up approach is used. This requires more fine-tuning but it allows to
gather the results in a convenient place holder (Nested procedure).
Additionally, the Build signal tool has been setup in such a way to search only for
the values of the 𝜔𝜔 and the Rotation rate (RPM) parameters belonging to a Control
Autolab RDE command located inside the repeat loop. All instances of the Control
Autolab RDE command located outside of a repeat loop will be ignored.
To cascade these selection criteria, the parameters of interest are first selected,
using the method described in the previous sections of this technical note (see
Figure 19).
Figure 19 – Setting up the Build signal in order to gather all values of the 𝝎𝝎 and the Rotation
rate (RPM) parameters
Then the Repeat for each value selection criteria can be selected and located on top
of the existing selection using the drag and drop method (see Figure 20).
14 | P a g e
NOVA Technical Note 18
Figure 20 – Dragging and dropping the Repeat for each value command on top of the
existing selection
Using this approach, the Build signal tool will be used to only look for the
parameters from the Control Autolab RDE commands embedded into the Repeat
for each value repeat loop.
Finally, this command is also pre-programmed to use a Build signal tool in order to
extract the 10th value of the WE(1).Current recorded by each LSV staircase
command, as described in the previous section (see Figure 21).
15 | P a g e
NOVA Technical note 18
Figure 21 – The Build signal is also used to extract the 10th value of the WE(1).Current signal
from each LSV staircase command
The Calculate signal tool is also used in this example to calculate the square root of
the angular frequency in order to build the Levich plot.
3 – Conclusion
This technical note has illustrated the possibilities offered by the Build signal data
handling tool. The tool can be used to gather data point and or parameter values
from all the commands used in the procedure. For experiments that rely on
systematic data handling steps, the Build signal tool provides a flexible framework
to correlate measured values to experimental parameters.
Note
The same approach can be used to add the Build signal tool to the procedure in
the Setup view.
16 | P a g e


© Copyright 2026