
Document 220352
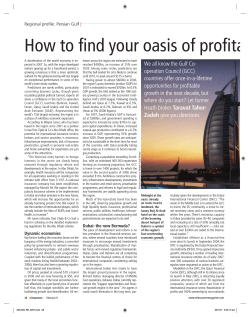
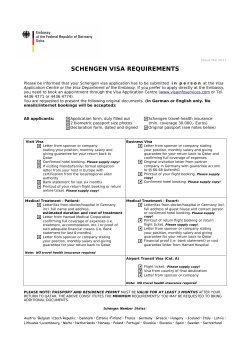
August 17, 2011
DSM INDEX: BEARISH BREAKOUT
QATAR NATIONAL CEMENT CO. : APPROACHING SUPPORT
.QSI - DAY CHART
QANC.QA - DAY CHART
DEMAND, SUPPLY AND DIRECTION - HOW TO USE TECHNICAL ANALYSIS
Name [RIC]
Doha Securities Market Index [.QSI]
Last
Close
8,137.00
Trend
Short Long
Term Term
FLAT FLAT
Support
Resistance
First
Second
First
Second
8,119.00
8,000.00
8,516.00
9,300.00
19.70
71.40
52.50
75.00
43.90
135.00
15.70
63.40
50.00
68.00
37.00
127.00
24.37
81.00
58.80
84.00
50.90
147.00
28.00
106.00
67.00
91.00
57.90
157.00
12.17
26.15
70.00
48.10
10.00
18.00
54.00
37.10
14.88
32.00
86.00
54.00
17.10
44.00
102.00
60.00
Banks
Masraf Al Rayan[ MARK.QA ]
Com mercial Bank of Qatar[ COMB.QA ]
Doha Bank[ DOBK.QA ]
Qatar Islamic Bank[ QISB.QA ]
Qatar International Islam ic Bank[ QIIB.QA ]
Qatar National Bank[ QNBK.QA ]
23.04
73.60
56.10
77.90
48.60
137.90
U FLAT
U FLAT
U FLAT
U FLAT
U FLAT
U FLAT
FLAT
DOWN
FLAT
DOWN
UP
FLAT
UDOWN
U UP
U FLAT
U FLAT
FLAT
UP
FLAT
UP
Financial Services
Dlala Brokerage & Inv. Holding Co.[ DBIS.QA
Doha Insurance Co.[ DICO.QA ]
Qatar Insurance Co.[ QINS.QA ]
Qatar Islamic Insurance[ QIIC.QA ]
14.05
27.80
79.40
50.80
Real Estate
Barwa Real Estate Co.[ BRES.QA ]
Qatar National Cement[ QANC.QA ]
United Development Co[ UDCD.QA ]
28.45 U FLAT
110.60 FLAT
20.01 U FLAT
DOWN
FLAT
DOWN
28.00
105.00
19.51
22.00
90.00
18.00
34.00
127.00
22.00
46.00
135.00
24.00
148.30 D FLAT
FLAT
133.00
118.00
148.50
165.00
DOWN
FLAT
DOWN
DOWN
FLAT
DOWN
116.10
118.00
16.10
17.00
43.00
76.00
100.00
100.00
15.10
13.00
27.00
73.00
130.00
137.00
17.10
21.00
59.00
79.40
150.00
154.00
18.20
25.00
75.00
88.20
Telecom
Qatar Telecom [ QTEL.QA ]
Others
Industries Qatar[ IQCD.QA ]
Qatar Electricity & Water Co.[ QEWC.QA ]
Qatar Gas Transport(Nakilat)[ QGTS.QA ]
Qatar Co. for Meat & Livestock[ QMLS.QA ]
Qatar Ind. & Manufacturing Co.[ QIMC.QA ]
Qatar Navigation[ QNNC.QA ]
• DSM Index [.QSI: 8,137.00 points] The Index broke the support at
8, points downwards and is going through a pullback. The trend
is down. Sell the rallies. Investors: Reduce/Hold.
• Industries Qatar [IQCD.QA: QAR 126.30] the stock broke the
support at QAR . and is searching for a bottom. Next support
is at QAR 6.. Traders can sell the rallies. Investors: Reduce/Hold.
• Qatar Electricity & Water Co. [QEWC.QA: QAR 131.00] the stock
broke the support at QAR . downwards. Our mentioned stop
loss at QAR . is activated. We expect a new round of selling.
Investors: Reduce/Hold.
• Qatar National Cement Co. [QANC.QA: QAR110.60] the stock
continues to trade in a sideway range. Traders can make use of this
range. Enter close to the support at QAR 7.7. Exit close to the
resistance at QAR . – QAR 7.. Put stop loss at QAR 6..
Investors: Hold.
• Barwa Real Estate Co. [BRES.QA: QAR 28.45] the stock faced
resistance at QAR 6. and is searching for a bottom. The trend is
down. The stock is approaching the support at QAR 28.. Traders
can sell the rallies. Investors: Reduce/Hold.
• United Development Co. [UDCD.QA: QAR 20.01] the stock is
trading in a sideway range. Support range is at QAR .2 –QAR
2.2. Resistance range is at QAR 2.7 – QAR 2.7. Enter close to
support and exit close to resistance. Put stop loss at QAR 8.8.
Investors: Hold.
126.30
131.00
16.90
20.01
52.80
77.80
U FLAT
UDOWN
U FLAT
U FLAT
U FLAT
UDOWN
• Combining Technical & Fundamental Analysis Investors can combine TA with FA for
fine tuning their investment decisions. FA and asset allocation are building blocks for
creating an investment portfolio/fund. TA is used to maximize gains/losses through
trading the minor zigzag moves during a bull/bear trend. Technical trading signals do not
weaken the validity of the fundamental buy/sell recommendations.
• Trend Direction The methods used to determine trend direction are subjective in
nature. We use a range of MA’s between & period moving averages, combined
with accurately drawn trend lines (which ever is more reliable) to determine the
direction of the short and long term trends.
• Investment Horizon (As an approximate guideline, and not a rule) Time horizon for
traders/short term trend is - weeks, and - months for investors/long.
• Trading Tactics According to your investment horizon watch the direction of the
trend. During down trends, investors attempt selling close to resistance levels.
During up trends, investors attempt buying close to support levels.
• Support & Resistance The table indicates horizontal S&R levels, and can be used for
the longer term. The text observes rising and falling S&R points.
NBK Capital • P.O .Box , Safat • Kuwait • nbkcapital.com • MENA Research: T. +965 2224 6663 • F. +965 2224 6905 • [email protected] • Brokerage: T. +965 2224 6964 • F. +965 2224 6978 • [email protected]
Disclaimer: This document and its contents are prepared for your personal information purposes only and do not constitute an offer or the solicitation of an offer to buy or sell a security or enter into any other agreement. Projections of potential risk or return are illustrative ,and should not be taken as limitations of the
maximum possible loss or gain .The information and any views expressed are given as of the date of writing and subject to change .While the information has been obtained from sources believed to be reliable ,we do not represent that it is accurate or complete and it should not be relied on as such .Watani Investment
Company (NBK Capita), its affiliates and subsidiaries accept no liability for any direct ,indirect or consequential loss arising from use of this document or its contents .At any time ,the employees of NBK Capital and its affiliates and subsidiaries may at their discretion hold a position , subject to change ,in any securities or
instruments referred to ,or provide services to the issuer of those securities or instruments.© Copyright Notice: This is a publication of NBK Capital. No part of this publication may be reproduced or duplicated without the prior consent of NBK Capital.


© Copyright 2026