
Malnutrition: what is it and why does it matter? Niamh Rice ISPEN
HIGHER SPECIALIST TRAINING
Malnutrition: what is it and
why does it matter?
Niamh Rice
ISPEN
HIGHER SPECIALIST TRAINING
Learning Objectives
1.
2.
3.
4.
5.
6.
What is malnutrition?
Malnutrition and disease
Effects of malnutrition
Impact of health outcomes
Economic impact
Nutritional support - who benefits?
ISG Trim Nov 2010
2
HIGHER SPECIALIST TRAINING
WHAT IS MALNUTRITION?
HIGHER SPECIALIST TRAINING
It all started out so well…….
• “In the face of illness,
thin people do badly”
– Hippocrates
• “thousands of patients are
annually starved in the midst
of plenty from want of
attention to the ways which
make it possible for them to
take food. I say to the nurse,
have a rule of thought about
your patient's diet”
Florence Nightingale, 1859
HIGHER SPECIALIST TRAINING
Unfortunately, we lost the advantage….
“Clinical nutrition has become the „cinderella of modern
medicine’….not least because of a failure of its practitioners
to define it in a way that engages doctors and causes them to
take it seriously”
Professor Simon Allison,
Chairman of ESPEN 2002
HIGHER SPECIALIST TRAINING
The problem with definitions..
“Malnutrition is a state of nutrition in which a deficiency
(or excess) of energy, protein and micronutrients causes
measurable adverse effects on tissue/body form (body
shape, size and composition) and function, and clinical
outcome.”
Marinos Elia
HIGHER SPECIALIST TRAINING
Defining malnutrition syndromes
(according to aetiology)
• Starvation-related malnutrition
• Eg. Anorexia nervosa
• Acute Disease-related malnutrition
• Eg. sepsis, burns, trauma or closed head injury.
• Chronic disease-related malnutrition
•
Eg rheumatoid arthritis, organ failure, pancreatic cancer, chronic diseases in older
patients, sarcopenic obesity.
International Consensus Guidelines Committee of ASPEN and ESPEN, 2010
7
HIGHER SPECIALIST TRAINING
…and a few more malnutrition syndromes
•
Sarcopenia
Loss of muscle mass and function
•
Sarcopenic obesity
Above in presence of obesity ie „‟fat frail‟
•
Cachexia
Severe loss of weight, far and muscle and
increased protein catabolism due to
underlying disease
•
Pre-cachexia
Underlying chronic disease weight loss of
<5%, chronic systemic inflammatory
response and anorexia.
HIGHER SPECIALIST TRAINING
Why it helps to differentiate ….
100
90
% lean body mass
Starvation
related
malnutrition
80
70
60
Time in months
100
Disease related
malnutrition
% lean body mass
90
80
70
60
1
2
ADRM
3
ADRM+ NS
4
5
CDRM
6
CDRM + NS
7
HIGHER SPECIALIST TRAINING
%
b
o
d
y
w
e
i
g
h
t
100
95
90
85
80
75
70
65
60
55
50
Decision Box
Catabolic
Complete starvation
Partial starvation
0
10
20
30
40
50
60
70
Days
Reproduced from presentation given by
Professor M Stroud, 2009
HIGHER SPECIALIST TRAINING
NICE criteria (2006)
a body mass index (BMI) of <18.5 kg/m2
unintentional weight loss >10% within the last 3–6
months
a BMI of <20 kg/m2 and unintentional weight loss
>5% within the last 3–6 months
HIGHER SPECIALIST TRAINING
Those at risk:
those who have:
• eaten little or nothing for more than 5 days and/or are
likely to eat little or nothing for 5 days or longer
• a poor absorptive capacity and / or high nutrient
losses and/or increased nutritional needs from
causes such as catabolism
HIGHER SPECIALIST TRAINING
EFFECTS AND
CONSEQUENCES OF
MALNUTRITION
HIGHER SPECIALIST TRAINING
Effects of Undernutrition
Ventilation - loss of
muscle & hypoxic
responses
Psychology –
depression & apathy
Immunity – Increased risk
of infection
liver fatty change,
functional decline
necrosis, fibrosis
Decreased Cardiac output
Renal function - loss of
ability to excrete
Na & H2O
Impaired wound
healing
Hypothermia
Impaired gut
integrity and
immunity
Loss of strength
Anorexia
? Micronutrient deficiency
HIGHER SPECIALIST TRAINING
Starvation causes reductive adaptation/conservation.
REDUCED FOOD INTAKE
Reduced Mass
Changed body composition
Reduced work, increased
efficiency
Changed metabolism
Metabolically stable BUT
loss of reserve and functional capacity
‘Marasmus’
HIGHER SPECIALIST TRAINING
REDUCED FOOD INTAKE
Reduced Mass
Reduced work, increased
efficiency
Changed body composition
Changed body composition
Marasmus
Infection, trauma, small bowel overgrowth, specific deficiency,
abnormal losses, excessive intake, unbalanced intake
Loss of homeostasis
HIGHER SPECIALIST TRAINING
Complications after abdominal surgery for
malignant disease
Meguid et al, Am J Surg. 156, 1988
%
p
a
t
i
e
n
t
s
100
90
80
70
60
50
40
30
20
10
0
Well nourished
Malnourished
Complication Rate
Post-Operative
Mortality
HIGHER SPECIALIST TRAINING
Malnourished patients have 2 to 3 times more
complications
Frequency of complications in at risk vs not at-risk patients
EuroOOps Study: n = 5051, mean age 59.8 years (±0.3 SEM), 12 countries, 26 hospital
departments. P<0.001.
1.
Sorensen J, Kondrup J, Prokopowicz J, Schiesser M, Krahenbuhl L, Meier R et al. EuroOOPS: an international, multicentre study to implement nutritional risk screening and
evaluate clinical outcome. Clin Nutr 2008; 27(3):340-349.
HIGHER SPECIALIST TRAINING
…more frequent hospital admissions
Malnourished patients experience a significantly higher total readmission rate than well-nourished patients1
Nutritional Status
Re-admission rate
Malnutrition
30.7%
Normal nutrition
20.7%
Over nutrition
17.7%
n = 400, mean age 57.3years (±17.5), P<0.05
1.
Planas M, Audivert S, Perez-Portabella C, Burgos R, Puiggros C, Casanelles JM et al. Nutritional status among adult patients admitted to an university-affiliated hospital in
Spain at the time of genoma. Clin Nutr 2004; 23(5):1016-1024.
HIGHER SPECIALIST TRAINING
Use more healthcare resource..
No. of visits or hospital admissions per
subject (>65y) per year (Elia et al 2006)
____________________________________
No MN*
MN
% increase
_____________________________________
GP visits
4.31
7.10
+65%
Hospital OP visits
Hospital admissions
1.02
0.28
1.36
0.50**
+33%
+80%
_____________________________________
*Low risk according to „MUST‟
** Length of hospital stay increased by > 30% - 70% in malnourished and less likely to be
discharged home.
HIGHER SPECIALIST TRAINING
..and are more likely to die
EuroOOps Study: n = 5051, mean age 59.8 years (±0.3 SEM), 12 countries, 26 hospital departments. Follow-up
period of 28 days, P<0.001.
1.
Sorensen J, Kondrup J, Prokopowicz J, Schiesser M, Krahenbuhl L, Meier R et al. EuroOOPS: an international, multicentre study to implement nutritional risk screening and
evaluate clinical outcome. Clin Nutr 2008; 27(3):340-349.
HIGHER SPECIALIST TRAINING
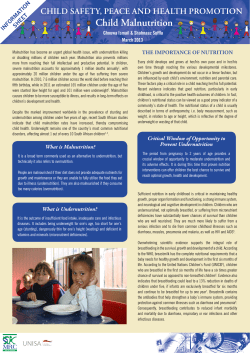
Malnutrition is associated with increased
mortality in older hospital patients1
Mortality according to malnutrition risk category
Patients at risk of malnutrition („MUST‟ categories medium and high) . P =0.01.
1.
Stratton RJ, King CL, Stroud MA, Jackson AA, Elia M. „Malnutrition Universal Screening Tool‟ predicts mortality and length of hospital stay in acutely ill elderly. Br J Nutr
2006; 95(2):325-330.
HIGHER SPECIALIST TRAINING
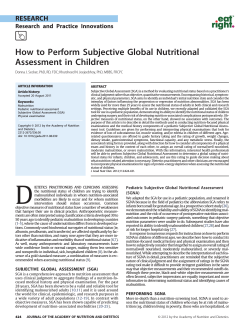
Hospital costs for malnourished patients
% increase above normally nourished
80
70
60
% increase
50
40
30
20
10
0
Pennslv
USA
Pennsylvania
1988
Ohio
USA
Ohio
1998
Illiois
USA
Illinois
2000
So'ton
UK
So‟ton
2004
Brazil
Brazil
2003
* A review in the USA (1996) suggested 35-75% increase in costs
HIGHER SPECIALIST TRAINING
Hospital costs for malnourished patients in UK
% increase above normally nourished
% increase
80
70
60
50
40
30
20
10
0
Surgical
(n= 138)
Stratton et al 2004
Geriatric
(n= 150)
Orthopaedic
(n= 194)
Medical
(n= 380)
* A mean increase of 40%
HIGHER SPECIALIST TRAINING
Costs of malnutrition
(and associated disease)
• Affects 20 million in the EU at an estimated annual cost
of €120billion
Conference held in EU Parliament, Tuesday 9 November 2010
• 3 million in the UK, at an estimated cost of £13billion stg
BAPEN 2009 Report
• 140,000 in ROI, at an estimated cost of €1.5billion
Rice, Normand. Journal of Public Health Nutrition 2012.
25
HIGHER SPECIALIST TRAINING
Estimated cost of DRM in Ireland in 2007
1800
1600
€million per year
1400
1200
Other
Social
care
Adult care homes (88%)
& home care (12%)
Primary care
1000
800
600
400
200
0
Health
care
Hospital inpatients (92%)
& outpatients (8%)
Nutritional support
products, adults:
(Tube
feeds, ONS, other
€32million
(community)
HIGHER SPECIALIST TRAINING
The malnutrition carousel
1 in 4 patients
admitted to
hospital
malnourished
Hospital
Home
More deaths
Longer length of stay
More support post discharge
More deaths post discharge
More GP visits
More hospital admissions
Up to 70% of patients
discharged from hospital
weigh less than on
admission
27
HIGHER SPECIALIST TRAINING
Inpatients with
disease-related malnutrition (2007, USING HIPE
DATA)
2922784
1139885
263050
No. of bed days used by
malnourished patients
Additional bed days used
by malnourished patients
due to longer LOS
HIGHER SPECIALIST TRAINING
Ideally, nutritional support should::
• Improve general status
–
–
–
–
–
–
Immune function
Wound healing
Ventilation
Strength
Mobility
Psychology
• Improve outcome
Does it?
HIGHER SPECIALIST TRAINING
EVIDENCE BASE
HIGHER SPECIALIST TRAINING
The Problems in Nutritional research
– Trials use different
•
•
•
•
•
•
•
Indications for intervention AND EXCLUSION
Levels of feeding
Controls
Starting times
Routes of support
Duration of support
Outcome measures
HIGHER SPECIALIST TRAINING
The Evidence
Wanted – volunteers for
randomized, placebo controlled trial
Patients with an undoubted need for nutrition
support cannot be randomized
HIGHER SPECIALIST TRAINING
Evidence for oral nutrition supplements and tube
Feeds – early studies
RCT of sip-feed supplements (approx 2) in 501 elderly care
patients. Larsson et al. Clin Nutr 1990
- Supplemented group ate more hospital food
- Supplemented group mortality 8.6 % vs 18.6% in controls
RCT overnight NG feeding in underweight females with fractured
NOF. Bastow et al. BMJ 1983
•
ONS group mobilised at 16 days with 8% mortality vs controls at 23 days
with 22% mortality
•
(Normally nourished mobile at 10 days with 5% mortality.
HIGHER SPECIALIST TRAINING
Impact of nutritional supplementation on length of stay
•
Reduced length of hospital stay (LOS) found in patients who received
ONS compared with control patients
– average reductions shown in a meta-analysis ranged from 2 days (in surgical
patients) to 33 days (in orthopaedic patients)1
•
Malnourished patients in a stroke rehabilitation centre receiving ONS
showed improved recovery
– higher level of functional independence was achieved and more of them were
able to go home rather than to institutional care2
1.
2.
Stratton RJ, Green CJ, Elia M. Disease-related malnutrition: an evidence based approach to treatment. Wallingford: CABI Publishing; 2003.
Rabadi MH, Coar PL, Lukin M, et al. Intensive nutritional supplements can improve outcomes in stroke rehabilitation. Neurology 2008; 71(23):1856-1861.
HIGHER SPECIALIST TRAINING
Impact of nutritional intervention on
readmission rates
•
Significantly lower proportion of acutely ill older people readmitted
to hospital at six months when supplemented with high protein oral
nutrition supplement (complete) compared with placebo1
(p < 0.05) (n = 445, aged between 65 and 92 years)
1.
Gariballa S, Forster S, Walters S, Powers H. A randomized, double-blind, placebo-controlled trial of nutritional supplementation during acute illness. Am J Med 2006; 119(8):693-699.
HIGHER SPECIALIST TRAINING
NICE data: Length of stay – impact of
supplementation
Standardised Mean diff.
(95% CI)
% Weight
Study
{HARTSELL1997}
-0.32 (-0.83,0.20)
12.3
{PEARL1998}
-0.49 (-0.78,-0.21)
12.7
{REISSMAN1995}
-3.00 (-3.45,-2.55)
12.4
Gist 2002
-0.03 (-0.39,0.33)
12.6
Gocmen 2002
-2.54 (-2.93,-2.15)
12.5
Burrows1995
-0.38 (-0.78,0.01)
12.5
Patolia2001
-2.08 (-2.53,-1.63)
12.4
Weinstein1993
0.11 (-0.25,0.47)
12.6
Overall (95% CI)
-1.09 (-1.91,-0.27)
-3.45185
0
3.45185
Standardised Mean diff.
HIGHER SPECIALIST TRAINING
How much would it be worth spending per
patient to prevent / treat malnutrition?
• *
€5,357
• Any spend BELOW this figure which successfully treats DRM
might be anticipated to deliver savings.
• Spend above this average may add value by improving
quality of healthcare but would require justification
*Estimated additional cost of MN (€750m) / number of people at
medium/high risk of DRM (140,000)
HIGHER SPECIALIST TRAINING
HOW TO IDENTIFY ‘AT
RISK’ PATIENTS
HIGHER SPECIALIST TRAINING
Malnutrition is not easy to spot until advanced…
39
39
HIGHER SPECIALIST TRAINING
And getting harder to identify as the population
widens...
A patient of average BMI at the start of an illness would
have to lose 25% of his/her body weight before
reaching the cut off point for „low‟ BMI.
HIGHER SPECIALIST TRAINING
Under-recognised, underdetected, under-treated..
About 1 in 4
patients in
hospital 1-7
1.
2.
3.
4.
5.
6.
7.
8.
9.
10.
11.
More than 1 in 3
patients in care
homes 2;3;8-10
< 1 in 10 older
persons living
independently11
Russell C, Elia M. Nutrition Screening Survey in the UK in 2008: Hospitals, Care Homes and Mental Health Units. 2009. Redditch, BAPEN.
Meijers JM, Schols JM, van Bokhorst-de van der Schueren MA, et al. Malnutrition prevalence in The Netherlands: results of the annual Dutch national prevalence measurement of care problems. Br J Nutr 2009; 101(3):417-423.
Russell C, Elia M. Nutrition screening survey and audit of adults on admission to hospitals, care homes and mental health units. 2008. Redditch, BAPEN.
Russell C, Elia M. Nutrition Screening Week in the UK and Republic of Ireland in 2010. Hospitals, care homes and mental health units. 2011. Redditch, BAPEN.
Imoberdorf R, Meier R, Krebs P, et al. Prevalence of undernutrition on admission to Swiss hospitals. Clin Nutr 2010; 29(1):38-41.
Kruizenga HM, Wierdsma NJ, van Bokhorst MA, et al. Screening of nutritional status in The Netherlands. Clin Nutr 2003; 22(2):147-152.
Schindler K, Pernicka E, Laviano A, et al. How nutritional risk is assessed and managed in European hospitals: a survey of 21,007 patients findings from the 2007-2008 cross-sectional nutritionDay survey. Clin Nutr 2010; 29(5):552-559.
Suominen MH, Sandelin E, Soini H, Pitkala KH. How well do nurses recognize malnutrition in elderly patients? Eur J Clin Nutr 2009; 63(2):292-296.
Lelovics Z, Bozo RK, Lampek K, Figler M. Results of nutritional screening in institutionalized elderly in Hungary. Arch Gerontol Geriatr 2009; 49(1):190-196.
Parsons EL, Stratton RJ, Elia M. An audit of the use of oral nutritional supplements in care homes in Hampshire. Proc Nutr Soc 2010; 69:E197.
Kaiser MJ, Bauer JM, Ramsch C, et al. Frequency of malnutrition in older adults: a multinational perspective using the mini nutritional assessment. J Am Geriatr Soc 2010; 58(9):1734-1738.
HIGHER SPECIALIST TRAINING
BMI categories for chronic protein energy
status Roy Coll Phys Lond, MAG(BAPEN)
BMI (kg/m2 )
Weight category
-------------------------------------------------------------<18.5
Underweight (probable PEM*)
18.5-20
Underweight (possible PEM*)
20-25
Desirable weight
25-30
Overweight
>30
Obese
* PEM = Protein-Energy Malnutrition
HIGHER SPECIALIST TRAINING
Unintentional weight loss over 3-6 months
•
<5% body weight: normal intra-individual variation
• 5-10% body weight: of concern
– decrease in voluntary physical activity
– increase in fatigue
– less energetic
• >10% body weight: of significance
– changes in muscle function
– disturbances in thermoregulation
– poor response or outcome to surgery and chemotherapy
HIGHER SPECIALIST TRAINING
HIGHER SPECIALIST TRAINING
Consider oral nutrition support
if patient malnourished and/at risk of malnutrition
and
can swallow safely and gastrointestinal tract is working
ensure oral nutrition support contains a balanced
mixture of protein, energy, fibre, electrolytes, vitamins and minerals
stop when the patient is established on adequate
oral intake from normal food
A
HIGHER SPECIALIST TRAINING
Does (mal) nutrition matter?
• Patients who are ill are likely to become
malnourished
• The best time to act is early
• Nutritional support gives time for surgical and
medical therapies to work


© Copyright 2026