
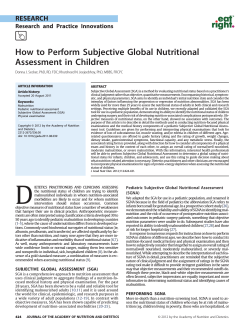
Malnutrition in a Sample of Community-Dwelling People with Parkinson’s Disease *
Malnutrition in a Sample of Community-Dwelling People
with Parkinson’s Disease
Jamie M. Sheard1,2*, Susan Ash1, George D. Mellick3, Peter A. Silburn4, Graham K. Kerr1,2
1 School of Exercise and Nutrition Sciences, Queensland University of Technology, Brisbane, Queensland, Australia, 2 Movement Neuroscience Program, Institute of Health
and Biomedical Innovation, Queensland University of Technology, Brisbane, Queensland, Australia, 3 Australia Eskitis Institute for Cell and Molecular Therapies, Griffith
University, Brisbane, Queensland, Australia, 4 University of Queensland Centre for Clinical Research, Brisbane, Queensland, Australia
Abstract
Objective: Malnutrition results in poor health outcomes, and people with Parkinson’s disease may be more at risk of
malnutrition. However, the prevalence of malnutrition in Parkinson’s disease is not yet well defined. The aim of this study is
to provide an estimate of the extent of malnutrition in community-dwelling people with Parkinson’s disease.
Methods: This is a cross-sectional study of people with Parkinson’s disease residing within a 2 hour driving radius of
Brisbane, Australia. The Subjective Global Assessment (SGA) and scored Patient Generated Subjective Global Assessment
(PG-SGA) were used to assess nutritional status. Body weight, standing or knee height, mid-arm circumference and waist
circumference were measured.
Results: Nineteen (15%) of the participants were moderately malnourished (SGA-B). The median PG-SGA score of the SGA-B
group was 8 (4–15), significantly higher than the SGA-A group, U = 1860.5, p,.05. The symptoms most influencing intake
were loss of appetite, constipation, early satiety and problems swallowing.
Conclusions: As with other populations, malnutrition remains under-recognised and undiagnosed in people with
Parkinson’s disease. Regular screening of nutritional status in people with Parkinson’s disease by health professionals with
whom they have regular contact should occur to identify those who may benefit from further nutrition assessment and
intervention.
Citation: Sheard JM, Ash S, Mellick GD, Silburn PA, Kerr GK (2013) Malnutrition in a Sample of Community-Dwelling People with Parkinson’s Disease. PLoS
ONE 8(1): e53290. doi:10.1371/journal.pone.0053290
Editor: Mathias Toft, Oslo University Hospital, Norway
Received August 13, 2012; Accepted November 30, 2012; Published January 9, 2013
Copyright: ß 2013 Sheard et al. This is an open-access article distributed under the terms of the Creative Commons Attribution License, which permits
unrestricted use, distribution, and reproduction in any medium, provided the original author and source are credited.
Funding: Parkinson’s Queensland, Inc (http://parkinsons-qld.org.au/) provided funding for this study. The funders had no role in study design, data collection
and analysis, decision to publish, or preparation of the manuscript. The funders did advertise the study in their newsletter and on their website for the purpose of
recruiting participants.
Competing Interests: The authors have declared that no competing interests exist.
* E-mail: [email protected]
risk for osteoporosis and increased risk of hospitalisation and
admittance to aged care facilities [8–13]. The etiology of
malnutrition is multi-factorial, and nutrition assessment tools,
such as the MNA and the Subjective Global Assessment (SGA),
incorporate anthropometry, weight history, dietary intake and
physical signs of malnutrition in the criteria for a diagnosis of
malnutrition. The scored Patient Generated Subjective Global
Assessment (PG-SGA), which incorporates the SGA, also includes
assessment of nutrition impact symptoms, such as poor appetite,
nausea, constipation, problems swallowing, early satiety and
depression. These symptoms commonly occur in Parkinson’s
disease and can provide information about appropriate intervention strategies. The recording of nutrition impact symptoms also
allows for monitoring and evaluation of the effectiveness of both
medical and nutritional interventions. Therefore, the use of the
SGA and the scored PG-SGA in this population appears to be the
most appropriate choice particularly as the SGA is a valid tool for
use in the community setting [14].
The current study aims to use a nutrition assessment tool, the
SGA to assess nutritional status to better estimate the frequency of
Introduction
The frequency of malnutrition, defined as protein-energy
undernutrition, in people with Parkinson’s disease (PWP) is
reported to be 0–2% using the Mini-Nutritional Assessment
(MNA) [1,2] with a further 20234% at risk of malnutrition [1,2].
Similarly, Jaafar, et al [3] reported that 24% of communitydwelling PWP were at medium to high risk of malnutrition using
the Malnutrition Universal Screening Tool (MUST). This
reported frequency of malnutrition is lower than may be expected
given that significant amounts of weight loss have previously been
reported in PWP [4–6]. Due to limitations such as sampling bias
towards more mobile participants without cognitive impairment
[7], the frequency of malnutrition in PWP reported to date is likely
to be under-reported.
Malnutrition results from inadequate calories, protein or other
nutrients that are required for maintenance and repair of body
tissues. Appropriate identification of and interventions for
malnutrition should be a priority in order to prevent or delay
the associated poor outcomes such as decreased quality of life,
longer recovery from illness, higher likelihood of falls, increased
PLOS ONE | www.plosone.org
1
January 2013 | Volume 8 | Issue 1 | e53290
Malnutrition in Parkinson’s Disease
capacity and disease status) and a physical examination of fat
stores, muscle status and fluid status. The assessment results in
a categorisation of nutrition status: SGA-A (well nourished), SGAB (moderately malnourished) or SGA-C (severely malnourished).
The SGA has been used extensively for nutrition assessment and is
validated for use in many different patient groups [16]. The scored
Patient-Generated Subjective Global Assessment (PG-SGA) was
also completed, which uses the same global nutrition assessment
rating as the SGA but also provides a total score from four
worksheets with a higher score indicating poorer nutritional status
[17].
PG-SGA Worksheet 1, which is completed by the participant,
provides a score for recent changes in weight, food intake,
nutrition impact symptoms and functional capacity. Worksheet 2
provides a score for medical conditions and age. Worksheet 3
provides a score for components of metabolic stress, and finally
Worksheet 4 consists of the physical examination score. Worksheets 2, 3 and 4 are completed by the assessor. The scores from
the worksheets are totaled to provide the PG-SGA score.
Anthropometric and body composition data were collected
while fasting. Body weight was measured to the nearest 0.1 kg
(Tanita HD-316, Japan) in light clothing, without shoes. For those
participants able to stand independently, height was measured to
the nearest 0.5 cm, without shoes. For those participants unable to
stand independently or with marked stooped posture, knee height
was used to estimate height. Knee height was measured to the
nearest 0.1 cm using a knee caliper on the left leg with the knee
and ankle at a 90u angle. The equation used for men was height
(cm) = 78.31+(1.946knee height) 2 (0.146age), and the equation
used for women was height (cm) = 82.21+(1.856knee heigh-
malnutrition in community-dwelling people with Parkinson’s
disease in Australia.
Subjects and Methods
Community-dwelling people with PD, aged .18 years were
recruited using a variety of methods between February and August
2011: invitations to previous research participants who had
expressed an interest in involvement in future studies, appearances
at community Parkinson’s disease support groups, advertisement
in Queensland-wide Parkinson’s disease organisation newsletter
and media coverage in local and state newspapers. Participants
were excluded if they resided in an assisted living facility (Figure 1).
Geographical location was limited to areas within ,2 hour driving
distance from Brisbane, Queensland, Australia.
Ethics Statement
Informed written consent was obtained as per protocol
approved by the Queensland University of Technology Human
Research Ethics Committee which also approved the study
(#1000001150).
Data collection was completed either at Queensland University
of Technology Institute of Health and Biomedical Innovation
(n = 15) or at participants’ homes (n = 110). During the data
collection visit, disease duration was obtained from the participant
and/or their spouse.
Nutritional status was measured by a dietitian using the
Subjective Global Assessment (SGA) [15]. Nutrition assessment
using the SGA is based on a medical history (recent changes in
weight, dietary intake, gastrointestinal symptoms, functional
Figure 1. Recruitment process.
doi:10.1371/journal.pone.0053290.g001
PLOS ONE | www.plosone.org
2
January 2013 | Volume 8 | Issue 1 | e53290
Malnutrition in Parkinson’s Disease
t)2(0.216age). [18] BMI was calculated (body weight(kg)/(height
in metres)2). Mid-arm circumference (MAC) was measured to the
nearest 0.1 cm at the mid-point between the acromion and the
olecranon process on the non-dominant arm [19]. Calf circumference was measured to the nearest 0.1 cm at the widest part of
the calf with the knee at 90u [20]. Waist circumference was
measured at the mid-point between the iliac crest and the lower rib
[19]. Some participants presented with visible peripheral oedema
but no adjustments were made to the weight or calf circumference
measurements to account for this.
The Hoehn and Yahr (H&Y) scale, which is a five point scale
(1–5) with a higher rating on the scale indicating a greater amount
of disability and impairment, was also measured. The H&Y
classifications were split into 2 groups (less severe PD H&Y 0–3,
severe PD H&Y 4–5).
Statistical analysis was completed using SPSS Version 19 (SPSS
Inc., Chicago, IL, USA). Missing data were not included in the
analysis. Variables were compared between SGA-A and SGA-B
classifications only as no one was classified as SGA-C. The only
variable of interest that was normally distributed in the SGA-A
group was height. The only variable that was normally distributed
for both males and females was also height. Therefore, nonparametric Mann-Whitney U tests were conducted to compare the
scores between the groups. Although within the SGA-B group, the
variables age, height, weight, MAC, calf circumference, PD
duration and PG-SGA score were all normally distributed for both
males and females, non-parametric tests were all conducted for
consistency in reporting. Pearson’s Chi square tests were used to
evaluate the differences in categorical variables. Statistical
significance was set at p,0.05.
in total score was determined by the significant differences in the
scores for Worksheet 1 (SGA A Mdn = 1, SGA B Mdn = 6),
U = 1811.5, z = 5.64, p = .000, and Worksheet 4 (SGA A Mdn = 0,
SGA B Mdn = 1), U = 1783.0, z = 6.37, p = .000. The scores for
Worksheets 2 and 3 were not significantly different between the
two groups. The score for Worksheet 3 was 0 for all participants.
‘No appetite or not feeling like eating’ was the symptom
reported most frequently on the PG-SGA for both SGA-A (13%)
and SGA-B (53%) groups, X2(1, n = 125) = 14.91,p,.05 (Table 2).
In addition to ‘no appetite’, the differences between groups
reached significance for constipation, X2(1, n = 125) = 8.11, p,.05,
diarrhea, X2(1, n = 125) = 6.32, p,.05, problems swallowing, X2(1,
n = 125) = 7.08, p,.05, and feel full quickly, X2(1,
n = 125) = 16.81, p,.05.
The PG-SGA score for 53% of the SGA B participants placed
them into the triage category requiring intervention by a dietitian
(scores 4–8), and the remaining 47% fell into the triage category
indicating a critical need for improved symptom management
and/or nutrient intervention options (scores $9). Comparatively,
21% and 9% of the SGA A participants were placed into these
categories, respectively. The remaining SGA A participants were
evenly split between the category requiring no intervention (scores
0–1) and the category requiring patient and family education
(scores 2–3). This categorisation was significantly different between
the groups, X2 (3, n = 125) = 34.91, p,.05.
Of the 19 malnourished participants, 9 were female (47%). A
similar proportion of females (18%) were malnourished than males
(14%) as assessed using Chi square analysis. A greater proportion
of females (50%) also experienced unintentional weight loss when
compared to males (38%). Females who were malnourished had
significantly lower BMIs, U = 71.5, z = 2.17, p = .028, smaller midarm circumferences, U = 80.0, z = 2.86, p = .003, and waist
circumferences, U = 64.0, z = 2.83, p = .003, than the malnourished males. This was reflected in the overall sample with
significantly lower BMIs, U = 2352.5, z = 2.34, p = .019, smaller
mid-arm circumference, U = 2526.5, z = 3.22, p = .001, and waist
circumferences, U = 2291.5, z = 3.34, p = .001, as well as smaller
calf circumferences, U = 2295.0, z = 2.27, p = .023, in the females
than the males (Table 3).
Results
One hundred twenty five community dwelling adults over the
age of 18 years (74 M, 51 F) agreed to participate. Characteristics
of those who did not participate were not known. Of the 27 that
provided a reason for not participating, four replied that they were
too ill, one stated immobility as the reason, two replied that
participation was too stressful, seven were not interested in the
research project, and the remaining 13 were not available or too
busy to participate. Median age of the participants was 70.0 years
(range: 35–92), and 72.8% (n = 91) were over the age of 65 years.
Median age at diagnosis was 63.0 years (range: 28.0–84.0), and
self-reported median disease duration was 6.0 years (range: 0–31).
The median H&Y score was 2 with 92.8% of participants in the
less severe category and 7.2% in the more severe category. Median
BMI was 25.1 kg/m2 (range: 17.0–49.5) with 4 participants (3.2%)
falling within the World Health Organisation (WHO) underweight
classification (,18.5 kg/m2). One participant could not recall
when diagnosis had occurred. Five participants did not have
a waist circumference measurement, and one participant did not
have a calf circumference measurement.
Nineteen (15.2%) participants were moderately malnourished
(SGA-B) while none were severely malnourished (SGA-C). In the
SGA-B category, 3 (15.8%) of the participants were ,65 years old.
Of the 125 participants, 54 (43%) (28 M, 26 F) reported previous
unintentional weight loss at some point following diagnosis. The
well-nourished participants had significantly higher anthropometric measures (BMI, U = 367.0, z = 24.40, p = .000; MAC,
U = 482.5, z = 23.61, p = .000; calf circumference, U = 355.5,
z = 24.46, p = .000; and waist circumference, U = 410.5,
z = 23.47, p = .001) than the malnourished participants. Significantly lower PG-SGA scores, U = 1860.5,z = 5.94,p = .000 were
found for the well-nourished participants (Table 1). This difference
PLOS ONE | www.plosone.org
Discussion
The current study resulted in a malnutrition diagnosis in 15% of
the sample of community-dwelling adults with Parkinson’s disease.
This result is higher than previous studies where 0–2% of PWP
were diagnosed with malnutrition. The discrepancy could be
a result of the different assessment tools used. It could also be
related to the fact that the samples in the studies by Wang, et al [1]
and Barichella, et al [2], included participants that were recruited
from a Movement Disorders outpatient clinic and physiotherapy
participants, respectively. As a result, the results may not be
generalizable to the wider community-dwelling population of
PWP in which the rates of malnutrition may be higher. This may
have also been the case in the present study. The most socially
isolated and those with higher disease severity are also the least
likely to participate in research, regardless of setting. This is
reflected in the current sample where only 1 participant was
classified as having a Hoehn & Yahr classification equal to 5 and
only eight were classified as having a Hoehn & Yahr classification
equal to 4.
Comparatively, estimates of malnutrition in community-dwelling adults without PD ranges from 3211% with the risk of
malnutrition between 15% and 38% [12,21–24]. The disparity in
results again arises from the differences in tool used, the age range
3
January 2013 | Volume 8 | Issue 1 | e53290
Malnutrition in Parkinson’s Disease
Table 1. Characteristics of the participants compared between nutritional status categories using Mann-Whitney analysis for
continuous variables and Chi square analysis for categorical variables and reported as median (range).
SGA Classification
A (Well-nourished) (n = 116)
B (Moderately malnourished) (n = 19)
Age (years)
69.0 (35.0–92.0)
74.0 (61.0–87.0)
Height (cm)
167.25 (148.0–186.0)
164.8 (140.5–174.0)
Weight (kg)
73.2 (46.5–145.0)*
55.4 (40.7–100.6)*
BMI (kg/m2)
25.9 (17.0–49.5)*
20.0 (17.7–33.2)*
MAC (cm)
29.1 (21.0–43.0)*
25.5 (21.0–35.0)*
Waist circumference (cm)
95.5 (67.5–149.5)*
82.5 (65.5–116.0)*
Calf Circumference (cm)
36.5 (31.0–48.5)*
32.5 (28.0–39.0)*
PG-SGA score
2 (0–15)*
8 (4–15)*
*Statistically significant difference between SGA classifications (p,0.05).
{
Reported as frequencies (percentages). Abbreviations: BMI = body mass index, MAC = mid-arm circumference, PD = Parkinson’s disease, PG-SGA = Patient-Generated
Subjective Global Assessment, SGA = Subjective Global Assessment.
doi:10.1371/journal.pone.0053290.t001
a PG-SGA score placing them in the triage categories requiring
intervention are potentially at risk of becoming malnourished if
those symptoms are not appropriately managed.
Significant unintentional weight loss is not uncommon in the
elderly population with between 17235% of community-dwelling
older adults losing at least 5% of their baseline weight over a 3
year period [13] resulting in significantly lower BMIs when
compared to non-weight losers [27]. A greater number of PWP
(60%) reportedly lose weight unintentionally following diagnosis
resulting in significantly lower body BMIs than those who do not
lose weight [4]. Lower BMIs are also found in malnourished PWP
compared to well-nourished [1]. Similarly, the current study found
a higher percentage of weight losers (43%) than that reported in
the general population, and BMIs were significantly lower in the
malnourished group compared to the well-nourished group. The
physical examination in the PG-SGA also resulted in significantly
of the samples and the sample sources. The frequency in the
current sample of PWP is also higher than that reported in the
general population. This is not wholly unexpected given the
presence of factors in PD that increase the risk of malnutrition
such as lack of appetite, altered taste and smell senses, poor eating
skills and potentially higher energy expenditures. Disturbance of
autonomic function of the gastrointestinal tract in PD including
dysphagia, delayed gastric emptying and constipation is welldocumented [25] and it is has been suggested that these
disturbances, especially constipation, precede the motor symptoms
[26]. The proportion of the malnourished with reduced intake due
to loss of appetite, constipation, diarrhea, problems swallowing
and early satiety was significantly higher than the proportion of
well-nourished in the current study. The total PG-SGA score
particularly reflects the presence of these nutrition impact
symptoms. The 30% of the well-nourished participants with
Table 2. Nutrition impact symptoms as reported on the PG-SGA compared between SGA groups using Chi-square analysis.
SGA Classification
A (Well-nourished) (n = 116)
B (Moderately malnourished) (n = 19)
No appetite, just did not feel like eating
15 (13%)*
10 (53%)*
Nausea
4 (3%)
1 (5%)
Vomiting
1 (1%)
0
Constipation
2 (2%)*
3 (16%)*
Diarrhea
1 (1%)*
1 (5%)*
Mouth sores
2 (2%)
0
Dry mouth
6 (5%)
1 (5%)
Things taste funny or have no taste
9 (8%)
4 (21%)
Smells bother me
1 (1%)
0
Problems swallowing
10 (9%)*
6 (32%)*
Feel full quickly
7 (6%)*
8 (42%)*
Pain
2 (2%)
1 (5%)
Other
5 (4%)
0
*Statistically significant difference between SGA classifications (p,0.05). Abbreviations: PG-SGA = Patient-Generated Subjective Global Assessment, SGA = Subjective
Global Assessment.
doi:10.1371/journal.pone.0053290.t002
PLOS ONE | www.plosone.org
4
January 2013 | Volume 8 | Issue 1 | e53290
Malnutrition in Parkinson’s Disease
Table 3. Characteristics of the total sample and of the malnourished participants compared between genders using MannWhitney analysis and reported as median (range).
Total sample (n = 125) (74 M, 51 F)
Malnourished participants (n = 19) (10 M,
9 F)
70.5 (35.0–86.0)
74.5 (66.0–81.0)
Age (years)
Male
Female
68.0 (42.0–92.0)
72.0 (61.0–87.0)
PD Duration (years)
Male
6.0 (0.3–31.0)
9.0 (1.0–26.0)
Female
6.0 (0.0–25.5)
5.0 (1.0–11.0)
Height (cm)
Male
172.75 (156.0–186.0)*
169.5 (158.5–174.0)*
Female
160.0 (140.5–173.5)*
154.5 (140.5–171.5)*
Weight (kg)
Male
75.5 (49.8–145.0)*
63.1 (49.8–100.6)*
Female
60.8 (40.7–128.8)*
46.7 (40.7–58.7)*
BMI (kg/m2)
Male
26.1 (19.1–46.3)*
21.3 (19.5–33.2)*
Female
23.6 (17.0–49.5)*
19.5 (17.7–21.6)*
Male
30.5 (23.0–41.0)*
27.6 (23.0–35.0)*
Female
27.0 (21.0–43.0)*
22.0 (21.0–28.0)*
Waist circumference (cm)
Male
96.5 (74.0–149.5)*
86.75 (78.0–116.0)*
Female
86.5 (65.5–117.0)*
73.5 (65.5–88.0)*
Calf circumference (cm)
Male
36.75 (28.0–48.5)*
33.75 (28.0–39.0)
Female
35.0 (29.0–43.0)*
32.0 (29.0–36.0)
PG-SGA score
Male
3 (0–15)
8 (4–15)
Female
3 (0–13)
MAC (cm)
H&Y
{
10 (8–13)
Male
Female
Male
Female
0
0 (0%)
2 (4%)
0 (0%)
0 (0%)
1
17 (23%)
11 (22%)
1 (10%)
0 (0%)
2
26 (35%)
18 (35%)
4 (40%)
3 (33%)
3
27 (37%)
15 (29%)
3 (30%)
4 (45%)
4
3 (4%)
5 (10%)
1 (10%)
2 (22%)
5
1 (1%)
0 (0%)
1 (10%)
0 (0%)
*Statistically significant difference between genders (p,0.05).
{
Reported as frequencies (percentages). Abbreviations: BMI = body mass index, H&Y = Hoehn & Yahr, MAC = mid-arm circumference, PD = Parkinson’s disease, PGSGA = Patient-Generated Subjective Global Assessment.
doi:10.1371/journal.pone.0053290.t003
were under the age of 65 years. Future studies in a larger sample
could attempt to further classify the extent of malnutrition in
younger PWP vs older PWP and to identify the risk factors of
importance in each age group.
Another strength of this study is the use of a nutrition assessment
tool applicable to any age that includes, in addition to recent
weight changes and a physical examination, the presence of
symptoms that are likely to influence intake in PWP. This study
also highlights the fact that anthropometric measures alone would
not have identified the malnourished in this population. Only 3
participants had BMI values in the underweight range (,18.5 kg/
m2), no one had a mid-arm circumference below 21 cm, and two
had calf circumferences less than 31 cm. This could be explained
by the fact that a higher BMI range to detect underweight may be
more appropriate in the older participants ($65 years) [33].
However, a multi-factorial approach to the diagnosis including
recent weight loss, intake, nutrition impact symptoms and
a thorough assessment of muscle and fat status resulted in a higher
proportion of participants classified as malnourished.
Limitations in the current study include the limited reach of the
sampling process to the frailest and most vulnerable of the
community-dwelling PD population. Although the current study
involved data collection at participants’ homes, some potential
reduced fat stores and muscle status in the malnourished group in
this study when compared to the well-nourished. Therefore, the
current results may more accurately reflect the extent of
malnutrition in PWP.
Females generally are at greater risk of unintentional weight loss
and malnutrition than males [22,28]. This appears to also be true
in PWP with previous studies [1,2] and the current study
supporting this finding. The significantly larger average values
for BMI and waist circumference (an indicator of adiposity [29])
coupled with the evidence of muscle loss in the PG-SGA
assessment in the malnourished males may indicate that males
in this group tend towards sarcopenic obesity while the females
exhibit both fat and muscle loss.
This study is the largest to report the extent of malnutrition in
community dwelling PWP and the first to do so in Australia. In
Australia, an estimated 20% of PWP are under the age of 65 with
over 2,000 aged in their 30 s and 40 s [30]. Therefore, the age
range in the current sample is representative of the Australian PD
population. While older age is a risk factor for malnutrition [31],
Parkinson’s disease has also been reported as an independent risk
factor for malnutrition [32]. Therefore it is important to understand the extent of malnutrition in PWP of any age, and there
were malnourished participants in the current sample (15.8%) who
PLOS ONE | www.plosone.org
5
January 2013 | Volume 8 | Issue 1 | e53290
Malnutrition in Parkinson’s Disease
participants declined the invitation to participate stating that they
were not well enough or their Parkinson’s disease symptoms were
too advanced to participate. The majority of the sample also lived
within the urban area of Brisbane, Queensland, Australia where
access to services and food supplies is not as limited as it might be
in a more rural setting. Despite the high frequency of malnutrition,
the small sample size limited the number of malnourished
participants with whom comparisons could be made and
potentially limits the ability to generalise the results. However,
the current sample size exceeds that of other studies reporting the
rate of malnutrition in community-dwelling people with Parkinson’s disease (n = 61 [2] and n = 117 [1]).
Another potential limitation in this study is the lack of validation
of the available nutrition assessment tools for the Parkinson’s
disease population. Therefore, the tool itself may influence the
validity of the results. Worksheets 2 and 3 of the PG-SGA also did
not significantly contribute to the overall score nor were they
different between groups. These boxes may be of particular value
in acutely ill populations, for which the tool was created and has
since been validated, rather than in a chronic condition such as
Parkinson’s disease. Therefore, the triage categories may not be
appropriate in this population. However, the SGA is a robust
nutrition assessment tool that has been widely used [16] and is
considered a valid tool in community populations, regardless of
disease state. Further exploration of appropriate nutrition assessment tools within this population is still warranted.
The first step to addressing malnutrition, the loss of lean body
mass and the associated poor outcomes is identifying the problem.
This study highlights the fact that malnutrition is prevalent in this
sample of PWP. However, as with malnutrition in other
populations, it remains under-recognised and undiagnosed. The
health professionals who have the most contact with these
individuals in the community setting should screen for malnutrition at regular intervals and provide appropriate referrals for
nutrition-related care for those who are at risk of malnutrition.
Acknowledgments
The authors would like to thank the participants of the study for their time.
The authors would also like to thank Parkinson’s Queensland, Inc for their
assistance with recruiting participants.
Author Contributions
Critically revised manuscript: SA GDM PAS GKK. Conceived and
designed the experiments: JMS SA GDM PAS GKK. Performed the
experiments: JMS. Analyzed the data: JMS. Wrote the paper: JMS.
References
1. Wang G, Wan Y, Cheng Q, Wang Y, Zhang J, et al. (2010) Malnutrition and
associated factors in Chinese patients with Parkinson’s disease: results from a pilot
investigation. Parkinsonism Relat Disord 16: 119–123.
2. Barichella M, Villa MC, Massarotto A, Cordara SE, Marczewska A, et al. (2008)
Mini Nutritional Assessment in patients with Parkinson’s disease: Correlation
between worsening of the malnutrition and increasing number of disease years.
Nutr Neurosci 11: 128–134.
3. Jaafar AF, Gray WK, Porter B, Turnbull EJ, Walker RW (2010) A crosssectional study of the nutritional status of community-dwelling people with
idiopathic Parkinson’s disease. BMC Neurol 10: 124–129. doi:10.1186/14712377-10-124.
4. Beyer PL, Palarino MY, Michalek D, Busenbark K, Koller WC (1995) Weight
change and body composition in patients with Parkinson’s disease. J Am Diet
Assoc 95: 979–983.
5. Uc EY, Struck LK, Rodnitzky RL, Zimmerman B, Dobson J, et al. (2006)
Predictors of weight loss in Parkinson’s disease. Mov Disord 21: 930–936.
6. Chen H, Zhang SM, Herna´n MA, Willett WC, Ascherio A (2003) Weight loss in
Parkinson’s disease. Ann Neurol 53: 676–679.
7. Sheard JM, Ash S, Silburn PA, Kerr GK (2011) Prevalence of malnutrition in
Parkinson’s disease: a systematic review. Nutr Rev 69: 520–532. doi:10.1111/
j.1753-4887.2011.00413.x.
8. Correia MITD, Waitzberg DL (2003) The impact of malnutrition on morbidity,
mortality, length of hospital stay and costs evaluated through a multivariate
model analysis. Clin Nutr 22: 235–239. doi:Doi: 10.1016/s0261-5614(02)002157.
9. Crogan NL, Pasvogel A (2003) The influence of protein-calorie malnutrition on
quality of life in nursing homes. J Gerontol A Biol Sci Med Sci 58: 159–164.
10. Banks M, Bauer J, Graves N, Ash S (2010) Malnutrition and pressure ulcer risk
in adults in Australian health care facilities. Nutrition 26: 896–901.
11. Wikby K, Ek A-C, Christensson L (2006) Nutritional status in elderly people
admitted to community residential homes: comparisons between two cohorts.
J Nutr Health Aging 10: 232–238.
12. Visvanathan R, Macintosh C, Callary M, Penhall R, Horowitz M, et al. (2003)
The nutritional status of 250 older Australian recipients of domiciliary care
services and its association with outcomes at 12 months. J Am Geriatr Soc 51:
1007–1011.
13. Newman AB, Yanez D, Harris T, Duxbury A, Enright PL, et al. (2001) Weight
change in old age and its association with mortality. J Am Geriatr Soc 49: 1309–
1318.
14. Watterson C, Fraser A, Banks M, Isenring E, Miller M, et al. (2009) Evidence
based practice guidelines for the nutritional management of malnutrition in
adult patients across the continuum of care. Nutr Diet 66: S1–S34.
15. Detsky AS, McLaughlin JR, Baker JP, Johnston N, Whittaker S, et al. (1987)
What is subjective global assessment of nutritional status? JPEN J Parenter
Enteral Nutr 11: 8–13. doi:10.1177/014860718701100108.
16. Barbosa-Silva MCG, Barros AJD (2006) Indications and limitations of the use of
subjective global assessment in clinical practice: an update. Curr Opin Clin Nutr
Metab Care 9: 263–269. doi:10.1097/01.mco.0000222109.53665.ed.
PLOS ONE | www.plosone.org
17. Ottery F (2000) Patient-Generated Subjective Global Assessment. In: McCallum
PD, editor. The Clinical Guide to Oncology Nutrition. Chicago: American
Dietetic Association. 11–23.
18. Chumlea WC, Guo SS, Wholihan K, Cockram D, Kuczmarksi RJ, et al. (1998)
Stature prediction equations for elderly non-Hispanic white, non-Hispanic
black, and Mexican-American persons developed from NHANES III data. J Am
Diet Assoc 98: 137–142.
19. Gibson RS (2005) Principles of Nutritional Assessment. 2nd ed. New York, New
York: Oxford University Press, Inc. p.
20. Lohman TG, Roche AF, Martorell R (1988) Anthropometric Standardization
Manual. Champaign: Human Kinetic Books. p.
21. Davidson J, Getz M (2008) Nutritional risk and body composition in free-living
elderly participating in congregate meal-site programs. J Nutr Elder 24: 53–68.
22. Johansson Y, Bachrach-Lindstro¨m M, Carstensen J, Ek A (2009) Malnutrition in
a home-living older population: prevalence, incidence and risk factors. A
prospective study. J Clin Nurs 18: 1354–1364.
23. Leggo M, Banks M, Isenring E, Stewart L, Tweeddale M (2008) A quality
improvement nutrition screening and intervention program available to Home
and Community Care eligible clients. Nutr Diet 65: 162–167. doi:10.1111/
j.1747-0080.2008.00239.x.
24. Pai MK (2011) Comparative study of nutritional status of elderly population
living in the home for aged vs those living in the community. Biomed Res 22:
120–126.
25. Pfeiffer RF (2003) Gastrointestinal dysfunction in Parkinson’s disease. Lancet
Neurol 2: 107–116.
26. Chaudhuri KR, Healy DG, Schapira AHV (2006) Non-motor symptoms of
Parkinson’s disease: Diagnosis and management. Lancet Neurol 5: 235–245.
27. Lee JS, Kritchevsky SB, Harris TB, Tylavsky F, Rubin SM, et al. (2005) Shortterm weight changes in community-dwelling older adults: The Health, Aging,
and Body Composition Weight Change Substudy. Am J Clin Nutr 82: 644–650.
28. Alho Letra Martins CP, Correia JR, Freitas Do Amaral T (2006) Undernutrition
risk screening and length of stay of hospitalized elderly. J Nutr Elder 25: 5–21.
doi:10.1300/J052v25n02_02.
29. Janssen I, Heymsfield SB, Allison DB, Kotler DP, Ross R (2002) Body mass
index and waist circumference independently contribute to the prediction of
nonabdominal, abdominal subcutaneous, and visceral fat. Am J Clin Nutr 75:
683–688.
30. Deloitte Access Economics (2011) Living with Parkinson’s Disease – update.
31. Morley JE (1997) Anorexia of aging: Physiologic and pathologic. The American
Journal of Clinical Nutrition 66: 760–773.
32. Mamhidir AG, Ljunggren G, Kihlgren M, Kihlgren A, Wimo A (2006)
Underweight, weight loss and related risk factors among older adults in sheltered
housing - a Swedish follow-up study. J Nutr Health Aging 10: 255–263.
33. Donini LM, Savina C, Gennaro E, De Felice MR, Rosano A, et al. (2012) A
systematic review of the literature concerning the relationship between obesity
and mortality in the elderly. J Nutr Health Aging 16: 89–98.
6
January 2013 | Volume 8 | Issue 1 | e53290


© Copyright 2026