
“WHY IS HE NOT SMILING?” DENTAL COSTS STUDY PHASE ONE
“WHY IS HE NOT SMILING?” DENTAL COSTS STUDY PHASE ONE FINAL REPORT August 2008 Health Issues Centre Inc. Level 5, Health Sciences 2 LA TROBE UNIVERSITY VIC 3086 (03) 9479 5827 Email: Fax: (03) 9479 5977 [email protected] Websites: www.healthissuescentre.org.au www.participateinhealth.org.au We suggest that this report be cited as follows: Horey, D., Naksook, C., McBride, T. and Calache, H., 2008, Why is He not Smiling: the Dental Costs Study Final Report. Health Issues Centre, Melbourne. TABLE OF CONTENTS PAGE NO: ACKNOWLEDGEMENTS 5 EXECUTIVE SUMMARY 8 PART A: 1. 2. 14 1.1 1.2 1.3 1.4 1.5 1.6 14 14 15 16 20 20 Rationale for the Study Broader Context Victoria’s Public Dental Service Dianella Community Health Impacts of Oral Health Status Dental Cost Study RESEARCH PLAN 22 2.1 2.2 2.3 2.4 2.5 2.6 22 22 23 23 25 26 Aims Research Method Sample Size Data Sources Recruitment Reliability RESULTS ALL STUDY PARTICIPANTS Overview 3.1 3.2 3.3 3.4 3.5 3.6 3.7 3.8 4. 14 INTRODUCTION PART B: 3. BACKGROUND Limitations of the Study Response to Recruitment Who Took Part? Use of Dental Services Oral Health Status General Health Status Proposed Treatment and Costs Key Issues COMPARISON OF WAITING TIMES Overview 4.1 4.2 4.3 4.4 4.5 4.6 4.7 4.8 Response to Recruitment Demographic Profile Oral Health and General Health Clinical Outcomes Oral Health Impact Profile Costs of Proposed Treatment and the Treatment Plans Impact of Proposed Treatment on Number of Functional Teeth Key findings “Why is He Not Smiling?” Dental Costs Study Phase One Final Report Health Issues Centre, August 2008 28 28 28 30 31 32 34 36 43 46 47 48 48 49 49 51 54 59 59 61 62 3 5. QUALITATIVE DATA FROM THE QUESTIONNAIRE Overview 5.1 5.2 5.3 5.4 5.5 6. 7. Oral Health and General Health Oral Health and Quality of Life Barriers to Public Dental Services The Consequences Key Issues 64 64 65 66 68 70 71 NON PARTICIPANT SURVEY 74 6.1 6.2 6.3 6.4 Survey Method Responses Why People Did Not Take Part Key Issues 74 74 75 78 DISCUSSION AND CONCLUSION 80 7.1 80 Key Findings 8. REFERENCES 88 9. APPENDICES 92 APPENDIX ONE: APPENDIX TWO: APPENDIX THREE: APPENDIX FOUR: APPENDIX APPENDIX APPENDIX APPENDIX APPENDIX APPENDIX FIVE: SIX: SEVEN: EIGHT: NINE: TEN: APPENDIX ELEVEN: APPENDIX TWELVE: STUDY PROTOCAL COMPLETE LIST OF DATA ITEMS DIANELLA’S LETTER OF OFFERING ON AN APPOINTMENT HEALTH ISSUES CENTRE’S LETTERS EXPLAINING THE STUDY PROJECT INFORMATION SHEET CONSENT FORM NON PARTICIPANT SURVEY INTERVIEW QUESTIONNAIRE RELIABILITY TESTING PROPOSED TREATMENT ITEM NUMBERS BY TREATMENT TYPE AND WAITING TIME ADDITIONAL TABLES FOR CHAPTER 3 MEAN COSTS, NUMBER OF PROPOSED TREATMENT BY TYPE AND BY GROUP “Why is He Not Smiling?” Dental Costs Study Phase One Final Report Health Issues Centre, August 2008 92 98 100 101 103 107 108 109 117 118 118 127 132 4 ACKNOWLEDGEMENTS Health Issues Centre, in collaboration with Dental Health Services Victoria and Dianella Community Health, conducted the study with funding support from the Department of Human Services Victoria, the Victorian Health Promotion Foundation and Dental Health Services Victoria. The Project Reference Group provided advice and support. It comprised: Mark Sullivan Dr Sachidanand Raju Nella Larubina Dr Hanny Calache Dr Rodrigo Marino Frank McNeil Judith Cassar Tony McBride Dell Horey Charin Naksook Dianella Community Health Dianella Community Health Dianella Community Health Dental Health Services Victoria University of Melbourne Consumer representative Consumer representative (until August 2006) Health Issues Centre Health Issues Centre (until December 2007), Australian Institute for Primary Care Health Issues Centre Additional advice was sought from: Professor John Spencer Adelaide University Dr Jane Harford Adelaide University Dr Charles Livingstone Monash University Pauline Brophy, Zahra Lassi and Helen Walls conducted most of the interviews. Martin Whelan of Dental Health Services Victoria provided technical assistance in the data collection. Dr Rodrigo Marino of the University of Melbourne assisted with the reliability testing analysis. We would like to acknowledge the invaluable contributions of all staff members at Dental Practice, Dianella Community Health, especially Nella Larubina and reception staff who assisted with recruitment of study participants; Dr Rosemary Phillipos, Dr Thanh Nguyen, Angela Black and clinical staff who conducted dental examinations for all study participants. We are especially grateful to the public dental patients at Dianella Community Health who kindly took part in the study. Dell Horey, Charin Naksook, Tony McBride and Hanny Calache wrote the report. “Why is He Not Smiling?” Dental Costs Study Phase One Final Report Health Issues Centre, August 2008 5 “Why is He Not Smiling?” Dental Costs Study Phase One Final Report Health Issues Centre, August 2008 6 “Why is He Not Smiling?” Dental Costs Study Phase One Final Report Health Issues Centre, August 2008 7 EXECUTIVE SUMMARY The Dental Costs Study (DCS) is the first comprehensive study of the comparative costs of public dental care in Victoria. It investigated the costs of delayed dental treatment for users of public dental health clinics1 among two groups of dental patients. One group was on the waiting list for more than two years (Group A) and the other group was on the waiting list for two to four months (Group B). The study also explored the impact of delayed dental treatment on health and social behaviours. Health Issues Centre, in collaboration with Dental Health Services Victoria and Dianella Community Health, conducted the study at Dianella Community Health, Broadmeadows, between September 2006 and February 2007. Funding for the study was provided by the Department of Human Services Victoria, the Victorian Health Promotion Foundation and Dental Health Services Victoria. Comprehensive data were collected through a mixed method approach combining clinical data with structured interviews and data from non-participants. The costs measured in this study are based on proposed treatment plans, and do not include the costs of emergency dental services or co-payments. This study is by no means an evaluation of Dianella’s staff performance or the quality of services they provide. Two hundred and forty-six (246) public dental patients took part in the study. One hundred and thirty (130) had been on the waiting list for two years or more (Group A), and 116 on the waiting list for two to four months (Group B). Key findings Cost of proposed dental treatment The costs of proposed dental treatment for people in the study ranged from $46 to more than $4,000, with an average cost of $924. This average cost is higher than expected, and almost three and a half times higher than the average cost of general dental treatment for public patients in Victoria of $271.2 Nearly 80% of people in the study had proposed treatment costs greater than the state’s average. This difference raises concerns about whether low income Australians receive all the dental treatment they require and whether actual treatment differs markedly from proposed treatment. There are also issues about the variation in need among those seeking public dental services and how this variation is managed. The mean costs of proposed dental treatment were slightly lower for people in the short-waiting Group B compared with those in the longer-waiting Group A ($912 compared with $936). Although this difference of less than 3% is statistically significant, it is not financially significant (see Section 4.6). The calculation of the proposed costs of treatment did not include costs associated with dental treatment from emergency dental services, or private dentists, undertaken while people were waiting for an offer of treatment from the public dental clinic. 1 For details about the Dental Costs Study, go to www.healthissuescentre.org.au\projects\index.asp The 2006-2007 figure from Clinical Analysis and Evaluation, DHSV. As with the study’s average, it does not include dental voucher and emergency services. 2 “Why is He Not Smiling?” Dental Costs Study Phase One Final Report Health Issues Centre, August 2008 8 Distribution of cost and types of treatment A major finding of the study was the distribution of costs for the proposed treatment types. Overall, only 8% of all proposed treatment costs were allocated to preventive care. The smallest proportion of costs (2%) was for the proposed management of periodontal disease, even though more than a fifth of the study population (22%) showed evidence of advanced periodontal disease and more than six in 10 showed evidence of calculus (that indicates a need for scaling and cleaning; 61%). More than one-third of the proposed costs were for fillings or restorative treatment (37.7%), and nearly a quarter of proposed costs were for dentures (see Section 3.7). Differences in the proposed costs between the two groups were apparent in all types of treatment apart from preventive care. The average cost for the proposed treatment among the longer-waiting Group A was higher for diagnostic services and periodontal, endodontic and restorative treatments, and for dentures. Costs for oral surgery and other services—mainly interpreter services—were higher for the shorter-waiting Group B (see Section 4.6). Oral health We found strong evidence of continuing inequalities in oral health status. The majority of study participants had a number of indicators of poor oral health. Compared with the results of the National Survey of Adult Oral Health (NSAOH) (2004–2006;Slade, Spencer et al. 2007), more adults in this study had: • Inadequate dentition—20 or fewer natural functional teeth (51% DCS vs 11% NSAOH) • High levels of gum disease—advanced gum disease (22.2% vs 2.4%) and moderate gum disease (53.6% vs 20.5%). Only nine (3.6%) out of 246 people in the study had at least 20 natural functional teeth and all associated supporting periodontal tissues (gums) healthy. More than 40% of people in this study reported they had visited a dentist in the previous 12 months (42.9%), about two-thirds the rate of dentate Australian adults (Slade, Spencer et al. 2007). The majority of these visits for people in this study were for emergency dental treatment (57% [see Table 4.3]), whereas nationally only 38 percent of dental visits are for emergency care (Slade, Spencer et al. 2007). Some differences in oral health between the two groups were apparent. Clinical examination of the two groups found that the longer-waiting Group A presented with a greater proportion of gum disease (87.7% vs 79.3%, p<0.05) and required more periodontic, restorative, and endodontic treatments (see Table 4.12). The treatment plans also suggested different needs, although this picture is somewhat complicated by the relatively low number of natural teeth present. More extractions were proposed for the shorter-waiting Group B, and given that it averaged fewer natural teeth than Group A at examination, these additional extractions would considerably worsen their oral health status and increase the probability for future dentures or dietary deficiencies, with subsequent general health implications. “Why is He Not Smiling?” Dental Costs Study Phase One Final Report Health Issues Centre, August 2008 9 Impact of oral health The majority of study participants reported social costs associated with their quality of life from issues related to oral health. For example, in the previous month, over half reported avoiding cold foods (56%) compared with 17% of Australian adults in the 2004–06 National Oral Health Survey (NOHS) (Slade, Spencer et al. 2007). Over half reported experiencing pain because of problems with mouth or teeth (56% compared with 15% in the NOHS). More than a quarter reported feeling selfconscious often or very often because of their oral health (28%) and more than 20%reported experiencing interrupted or unsatisfactory meals often or very often in the previous four weeks (See Tables 3.7 and 3.8). One in four people said they felt embarrassed or tense fairly often or more frequently because of problems with their mouth or teeth, and one in six people in the study reported using over-the-counter medication to manage dental pain fairly often or more frequently (17%). One in 10 people reported that problems with their oral health affected intimacy with others and with sleeping. Of those for whom it was relevant, more than one in seven felt their job prospects were affected by problems with their teeth, mouth or dentures (See Tables 3.7 and 3.8). General health Despite a large majority (86%) rating their health as good or better, people in the study reported a high level of health-seeking behaviour. Most had seen their GP in the last six months (87%), with more than half of these reporting three or more visits in that time (see Table 3.10). People in the study generally rated their general health more highly than their oral health (see Table 4.5 and Figures 4.2 and 4.3). Self-ratings of general health were generally lower than other Australian adults, For example, 50.8% of the study population rated their health as excellent or very good, compared with 56% of Australian adults (Australian Bureau of Statistics 2007b). Response to offer of treatment There was a relatively low response to offers of treatment experienced in this study even when incentives were offered, which was comparable to the usual response to offers of treatment at the community health centre. However, the response improved with the addition of a follow-up telephone call to the recruitment process. Our experience raised concern about issues affecting people’s decisions about their use of public dental care, specifically the high prevalence of poor literacy. “Why is He Not Smiling?” Dental Costs Study Phase One Final Report Health Issues Centre, August 2008 10 Recommendations The study revealed that this group of public dental patients had significant dental needs. Apart from the often repeated but still very important recommendation to significantly increase funding for public dental care, we make the following recommendations across the areas of policy development, public dental service practice, and further research. Policy development Public dental policy needs to promote a population health focus aimed at preventing avoidable tooth loss. It should include the following elements: early identification of need, early intervention, prevention and appropriate treatment. Specific issues need immediate short-term strategies: • Greater capacity to reduce the waiting list • Action to maximise oral health as people wait for dental treatment. • Develop and implement preventive care. • Promotion of health literacy in regard to dental care. workforce structures to provide effective Funding mechanisms are needed that facilitate effective triage, a population health approach, and that remove disadvantages to providing preventive care. Public dental service practice Public dental clinics need to create supportive environments that enable oral health practitioners to provide effective dental treatment and preventive care. Increase promotion of good dental health as part of good general health. To be relevant and effective, targeted strategies for disadvantaged communities need to be developed in partnership with those communities. There is an urgent need for the introduction and evaluation of interventions to help people preserve their teeth while waiting for dental treatment. This may include a preventive care appointment with dental hygienists. Strategies to improve the uptake of offers of dental treatment such as telephone calls need to be trialled and evaluated to find ways of improving responses to treatment offers. Further research More research is needed to investigate the costs related to public dental programs and the needs and experiences of clients to help reduce inequalities in access to dental care. This research could include: • An economic evaluation of the impact of oral health on other health outcomes. “Why is He Not Smiling?” Dental Costs Study Phase One Final Report Health Issues Centre, August 2008 11 • An economic evaluation of the costs of public dental care, which includes the costs of emergency and private dental care, should be conducted. • The Dental Cost Study should be repeated in other public dental clinic populations to compare findings across population and service groups. • A longitudinal study of Australian adults registered for public dental care, to explore motivating factors and barriers to attend services and other dental health-seeking behaviours. • A descriptive assessment of the socio-demographic characteristics, oral health literacy, attitudes and health behaviour knowledge and practices of people waiting for public dental care in Victoria. This should include an investigation of consumer attitudes and opinions towards public oral health services. • An investigation of the knowledge and use of dental vouchers among public dental patients, to determine how to improve the use and efficiency of vouchers in public dental care. • Comparison of actual dental treatment with the proposed treatment plan in Victorian public dental services, to determine differences in treatment and assess the usefulness of proposed treatment plans in estimating treatment costs. “Why is He Not Smiling?” Dental Costs Study Phase One Final Report Health Issues Centre, August 2008 12 “Why is He Not Smiling?” Dental Costs Study Phase One Final Report Health Issues Centre, August 2008 13 PART A: BACKGROUND 1. INTRODUCTION This study investigated the impacts of delayed dental treatment on the direct costs of treatment to government and the indirect health costs and social costs for those consumers who await public dental care in Victoria. 1.1 Rationale for the Study A search of the literature, including a hand search of relevant Australian journals,3 was unable to locate any study that has investigated the impact of delayed dental treatment for public dental patients; although a number of studies indicate that failure to seek timely dental care is an important contributor to poor oral health. This study appears to be the first Australian study that looks at the effect of delaying treatment, in terms of its costs, both financial and social. 1.2 Broader Context The World Health Organization (WHO 1964) defines health as ‘a state of complete physical, social and mental well being and not merely the absence of disease or infirmity’. Consistent with this definition, it follows that being ‘orally healthy’ means that ‘people can eat, speak and socialize without discomfort or embarrassment, and without active disease in their mouth which affects their overall well being’ (Oral Health Strategy Group 1994). Good oral health is more than just having good teeth and healthy gums. Dental professionals aim to achieve oral health by ensuring that ‘people’s lives are not affected by oral mucosal disease, oral cancer, jaw joint problems, malocclusion, malformation or trauma to the jaw and middle of the face’ (AHMAC 2001). Access to dental care is important to good oral health. Healthy gums, teeth and mouth comprise good oral health and are important to good overall health and quality of life. Timely treatment of dental problems helps prevent oral disease and tooth loss. The condition and number of natural teeth present have implications for a person’s capacity to chew and eat well. People with fewer than 20 natural functional teeth are at increased nutritional risk of an inadequate diet (Sheiham & Steele 2001). Despite population trends of improved oral health, Australian adults eligible for public dental care have consistently shown lower levels of oral health compared to other Australian adults in studies based on self-report (AIHW 2001, 2005, 2006a). They also are more likely to rate their oral health as poor and to be dissatisfied with life (Sanders & Spencer 2005). These self-perceptions of poor oral health are confirmed by clinical assessments of public dental patients, which reveal a higher rate of extractions and emergency dental treatment compared to the Australian population (Brennan, Spencer et al. 1997; AIHW 1999; Brennan, Spencer et al. 2001; AIHW 2002a, 2002b). 3 Australian Dental Journal and Australian and New Zealand Journal of Public Health “Why is He Not Smiling?” Dental Costs Study Phase One Final Report Health Issues Centre, August 2008 14 One of the main reasons attributed to poor oral health among low income Australians is their pattern of dental attendance. They are less likely to attend dentists regularly than people from higher income groups (Chen & Hunter 1996; Harford, Ellershaw et al. 2004; Sanders, Slade et al. 2004). This is the only known dental self-care behaviour that differs between people with different socio-economic status (Chen & Hunter 1996; Sanders, Spencer et al. 2006). While there is no evidence to support the practice of annual dental visits, access to timely clinical examination is likely to be beneficial because it enables early detection or diagnosis, and the use of preventive interventions (Wright & Satur 2000). However, organisational barriers, such as extended waiting times, may limit the effectiveness of dental health services to provide timely care. Limited resources in the public sector have led to waiting times exceeding five years in some parts of Victoria (Scopelianos 2006). In 2006, the average waiting time for all public patients in Victoria was 26 months, although patients at the Royal Dental Hospital in Melbourne waited less than a month for dental care (DHS 2007a). Extended waiting times for dental visits could have a number of important consequences for both the dental service and those receiving care. First, oral health is likely to deteriorate, leading to a need for more extensive restorative treatment or increased risk of tooth loss. Delayed treatment is likely to increase demand for emergency dental services, which generally results in tooth extraction rather than tooth preservation. This pattern of care shifts costs from preventive to emergency treatments. Finally, there are likely to be increased costs to those waiting for dental treatment as they seek alternative ways to manage oral conditions. 1.3 Victoria’s Public Dental Service Dental Health Services Victoria (DHSV) is responsible for the delivery and purchase of public dental care for children and disadvantaged adults in Victoria. The major service is located at the Royal Dental Hospital in Melbourne. DHSV subcontracts community health services to provide community-based dental care under conditions set by the Victorian Department of Human Services (DHS), which funds the system. While the average waiting time for general dental care across the state in 2006 was 26 months (DHS 2007a) waiting times varied at different public clinics, from less than one month to 68 months. In one-third of the clinics, waiting times were 10 months or more above the state average (DHS 2007a). There are two major constraints to the provision of public dental services. One is the total funding allocated to oral health services by the Victorian Government in its annual Budget. The second constraint is the number of oral health practitioners available to provide care (DHS 2007b). Workforce shortages are reported in both public and private practices. To be eligible for public dental services, adults must be health care or pensioner concession cardholders or their dependants. Co-payment fees apply. Currently, the maximum service cost for eligible adults is $88 for a complete course of care, 4 excluding dentures, which generally cost the consumer around $105 (DHS 2007b). Generally there is no provision for check-up visits. 4 A course of care begins when an assessment or examination is conducted. A course of care is deemed to be closed or completed when all planned treatments have been provided and no further visits are scheduled. “Why is He Not Smiling?” Dental Costs Study Phase One Final Report Health Issues Centre, August 2008 15 Government funding for public dental services varies among agencies in Victoria. It has been calculated based on service throughput but a new oral health service framework is proposed that is population-catchment based (DHS 2007b). Currently, the schedule of dental services and costing in the Community Dental Program is based on the rates for dental services used by the Department of Veterans’ Affairs. In 2006–2007 the average cost per course of care (Whelan 2008) for public dental patients in Victoria was: • $272 for general dental care, including restorative and prosthetic treatment • $190 for emergency care and general care combined • $97 for emergency dental care only. These costs do not include the Victoria Denture Scheme, which involves dental vouchers given to public patients for use in private dental services. The average treatment cost per course of care for patients using dental vouchers in 2006–07 was $406.21 (Whelan 2008). 1.4 Dianella Community Health The study involved public dental patients in Victoria, at Dianella Community Health, Broadmeadows campus. It was carried out between September 2006 and February 2007. Dianella Community Health (DCH) has a large catchment area, covering most of the City of Hume on Melbourne’s northern urban-rural fringe. It provides primary and community health services to one of the poorest and most diverse communities in the state. Broadmeadows is ranked as third most disadvantaged suburb in Melbourne (Hume City Council, Dianella Community Health et al. 2007). More than 130,000 people live in the area. The average age is 32.5 years, making it one of the youngest municipalities in Victoria. The population is expected to grow by about 40% over the next 10 years, especially among those aged 65 years and more. It is a culturally diverse community, with over one-third of the population born outside Australia. In the last seven years, people from Iraq, Turkey and Lebanon have moved to the area. Other than English, the major languages for residents include Turkish, Italian and Arabic. Hume has the highest proportion of Catholic and Muslim residents compared to other local government areas in Melbourne. The unemployment rate in Hume is above the Victorian average and individual and household incomes are below average (Hume City Council, Dianella Community Health et al. 2007). In 2006, less than two-thirds of the population were in the paid workforce and nearly one in 10 was unemployed. Most people in the workforce are employed in: manufacturing; the retail trade as clerical, sales and service workers; or as tradespersons and related workers. 1.4.1 Dental Services at Dianella The community dental program is offered to eligible clients by Dianella Community Health’s Broadmeadows clinic. In the financial year 2006–2007, the dental team treated 4829 clients and provided 42,188 treatments. These included services for 2532 patients who received emergency dental care (Dianella Community Health 2006). In 2006 and 2007 there were 4.06 effective full-time (EFT) dentists and 4.32 EFT dental nurses at Dianella for the adult dental programs. It has six dental chairs, two of which are for school dental services. On most days dentists receive 13 to 14 dental visits each (Raju 2006). Dianella dental service operates at capacity “Why is He Not Smiling?” Dental Costs Study Phase One Final Report Health Issues Centre, August 2008 16 for both adult and school dental services. It has a stable dental workforce, which allows it to maximise its resources (Dianella Community Health 2007a). The dental service at DCH receives between 30 and 40 telephone calls every working day—about half of these are for emergency care. Calls are assessed over the phone by the dental receptionist and allocated to either the general waiting list or the denture waiting list. On average, 170 patients are added to the waiting lists each month—137 for general dental services and 33 for prosthetic services (Raju 2006). People who report pain are transferred to a computerised triage system that assesses the urgency of their treatment needs. Some emergency patients will be given an appointment on the same day while others may wait up to five weeks (Raju 2006), depending on the urgency category level that is assigned to them through the triage system. In February 2006, there were 5116 patients waiting for dental treatment on the electronic dental database at Dianella. These comprised 4381 people waiting for general services and 735 people waiting for prosthetic or denture services. The estimated waiting time was 30.9 months for general patients (Victorian Minister for Health 2006). This was higher than the state-wide average waiting time for general care in March 2006 of 26 months (DHS 2007a). It is usual practice at Dianella to mail out offers of dental appointments in batches. Letters are sent to the 150 to 200 people at the top of the waiting list. They are given about four weeks to make an appointment. About 30% of those offered appointments for general services, and 60–70% of those offered appointments for denture services make appointments. The waiting time for appointments is about 3 to 4 weeks (Raju 2006). Dianella is estimated to require an additional 10 dental chairs. These chairs are planned to be located in Craigieburn, but not until 2011 (Dianella Community Health 2007b). 1.4.2 Management of waiting lists at Dianella Agencies providing public dental care are required to manage waiting lists in accordance with DHS policies. The average waiting time has been a key performance measure in the dental program and DHS has recently reviewed the drivers and possible solutions of waiting list management (DHS 2007a). The effectiveness of managing a dental waiting list is a function of the number of dental chairs and dental staff available at the service (the supply), and the number of public dental patients in the catchment areas, their needs and the complexity of needs (the demand). These factors can have a considerable effect on the waiting time for services. For example, Dianella Community Health has six dental chairs (four adult and two school dental service chairs). In this catchment area the number of eligible people per chair is 7610 and the waiting time for general treatment is 30.9 months (Victorian Minister for Health 2006; DHS 2007b). The nearby Darebin Community Health Service (PANCH), which provides services in the north central metropolitan area, has seven adult dental chairs. The number of eligible people in its catchment area is 4095 per chair and the waiting time for general dental care is 6.3 months (Victorian Minister for Health 2006; DHS 2007b). This is significantly higher capacity than Dianella, and hence waiting times are very much lower. “Why is He Not Smiling?” Dental Costs Study Phase One Final Report Health Issues Centre, August 2008 17 Table 1.1 presents the catchment areas for public dental services in the north and west metropolitan region. The eligible population per chair, the dental services in the catchment area, the number of dental chairs, and the waiting time for general treatment at each service are reported in the table. Please note that figures on the number of dental chairs include school dental services, which are not a focus of this study. “Why is He Not Smiling?” Dental Costs Study Phase One Final Report Health Issues Centre, August 2008 18 Table 1.1 Reported number of dental chairs and waiting times in North and West metropolitan region Catchment area Moonee Valley - 4360 Melbourne West Bay BanyuleNillumbik Number of 6 dental chairs Waiting time for general dental 7 treatment (mths) Doutta Galla CH Kensington 4 14.5 Doutta Galla CH Niddrie 7 14.5 Eligible population 5 per chair 4812 5155 Dental clinics in catchment area Ozanam Day Centre 1 n.a. Altona SDS 2 n.a. Footscray SDS 5 n.a. Isis Primary Care Wyndham 8 n.a. Western Region Health Centre 6 41.7 Banyule Community HS 8 16.0 Nillumbik Community HS 3 38.0 4 9.3 2 6.3 7 (all adults) 7.5 2 36.9 7 11.8 9 35.7 6 (only 4 for adults) 30.9 Moreland Community HS 3 30.0 Moomba Park SDS 2 n.a. Sunbury Community HC 5 15.5 Isis Primary Care Brimbank 10 29.3 Melton Latrobe Site 12 n.a. 2 n.a. 114 23.51 Darebin Community HS East Preston Darebin Community HS Northcote North Central 4095 Darebin Community HS PANCH North Richmond Community HC North Yarra North Richmond Community HC Richmond Plenty Valley Community HS Dianella Community Health HumeMoreland MeltonBrimbank TOTAL 7610 4425 Melton Mobile Dental Van 4915 5 DHS (2007b). Improving Victoria's Oral Health July 2007. Melbourne, Victorian Government Department of Human Services. Ibid. 7 Victorian Minister for Health (2006). Dental waiting list cut by more than 150,000. Media Release from the Minister for Health. 6 “Why is He Not Smiling?” Dental Costs Study Phase One Final Report Health Issues Centre, August 2008 19 1.5 Impacts of Oral Health Status Oral health can affect general health as it is closely linked to the selection and preparation of food (Walls & Steele 2001), which in turn influences whether there is an adequate diet, nutritional status and general health status. Adults with reduced chewing capacity are at increased risk of cardiovascular disease, possibly due to reduced chewing capacity, which leads to diets low in fibre and Vitamin C (Krall & Hayes 1998; Steele, Sheiham et al. 1998; Walls & Steele 2001). Reduced dietary fibre and Vitamin C intake has been associated with an increased risk of cardiovascular disease, stroke and cataract formation (Khaw & Woodhouse 1995; Ness, Powles et al. 1996; Joshipura, Douglas et al. 1998; Joshipura, Ascherio et al. 1999; Walls & Steele 2001). Reduced intake of fruit, vegetables and dietary fibre is also associated with an increased risk of cancers in the digestive system such as colorectal cancer (COMA 1998; Walls & Steele 2001). Recent studies also show close links between gum disease and general health. A meta-analysis found that the incidence of coronary heart disease significantly increased among people with gum disease (Bahekar, Singh et al. 2007). Heart disease, pneumonia and the risk of preterm, low birthweight babies have also been linked to gum disease as its causative agent can migrate to other systems in the body (Irwin, Mullally et al. 2008). Oral disease shares risk factors with other diseases and complicates their management (Mason 2004; Spencer & Harford 2007b). Poor oral health also reduces quality of life in many ways. The quality of life of an estimated one in six Australian adults is adversely affected by oral health problems (AIHW 2006b). About one in 10 respondents in a national health survey reported frequently experiencing painful aching, uncomfortable eating, poor sense of taste and trouble pronouncing words; and one in 12 reported frequently feeling tense, embarrassed or self-conscious because of problems with their mouth or teeth (AIHW 2006b). People who suffered dental problems have been found to lack the social confidence for successful job interviews. Dental treatment has been effective way to help people on welfare benefits gain employment in the USA (Heffernan 2004). 1.6 Dental Cost Study The impetus for the Dental Cost Study was the belief that delayed dental treatment was harmful to consumers and, in the long run, more expensive to the system. We wanted to find out if providing dental care in a more timely way (i.e. within a few months of seeking care, rather than years) was less costly to funders and to consumers in terms of its impact on them. “Why is He Not Smiling?” Dental Costs Study Phase One Final Report Health Issues Centre, August 2008 20 “Why is He Not Smiling?” Dental Costs Study Phase One Final Report Health Issues Centre, August 2008 21 2. RESEARCH PLAN 2.1 Aims The primary aims of the study were to: (a) Investigate the costs to the health system associated with a public dental care when dental treatment is delayed for two years. (b) Investigate the health and social impacts on consumers of delayed dental treatment. (c) Identify potential measures to monitor the effective use of public dental health care. (d) Identify areas of data required for further improvement of public dental health services. 2.2 Research Method The study involved two groups of users of public dental services—people who had joined the waiting list for two or more years before their initial dental appointment (Group A), and those who just joined; that is, only two to four months prior to their initial appointment (Group B). See Appendix 1 for the study protocol. The study was designed in two phases. This report covers the initial phase. Phase One Undertaken from September 2006 to February 2007, Phase One involved the following tasks: (a) Comparison of system costs of proposed dental treatment and study of impacts on health and social behaviours on consumers All study participants underwent a clinical dental health assessment and had a dental treatment plan developed as part of the usual care at the dental health service. Data were also gathered from the dental record, and through a structured face-to-face interview. The proposed dental treatment plan in the form of the item numbers (the identifiers used for specific dental treatments) was recorded by the dentist at the time of the initial consultation. The costs to the funder of the care of proposed dental treatment (the Victorian Department of Human Services) were calculated from the item numbers. Phase Two Phase Two of the study has yet to be funded. It comprises two parts: (b) Assessment of use of emergency dental services among people on waiting list De-identified data from all eligible participants in the long wait group (Group A) will be used to assess the use of emergency dental services and the potential impact to subsequently accept an offer of a dental appointment. “Why is He Not Smiling?” Dental Costs Study Phase One Final Report Health Issues Centre, August 2008 22 (c) Comparison of actual costs incurred against estimated costs of original plan This will involve a comparison of the actual treatment and the proposed treatment, and use of emergency dental services between the two groups. Dental records of study participants will be reviewed after 12 months to determine the actual dental treatment and its costs. Analyses will include assessment of the pattern of attendance, influences on adherence to treatment plans, and the use of emergency dental services at the health centre; it will evaluate the usefulness of an initial dental treatment plan as an economic assessment tool. 2.3 Sample Size The estimated minimum sample size for the study was 100 people in each group. This was based on a statistical power of 0.80, which would give an effect size of 0.40 (i.e. there would be an 80% probability of detecting changes of 0.40 standard deviations in variables with a bidirectional test and alpha of 0.05). Based on the value of the private dental voucher of $620, a sample size of 100 in each group, using a statistical power of 0.80 and alpha of 0.5 would detect a 12% reduction in dental costs. 2.4 Data Sources There were three main data sources for the study: face-to-face interviews; a clinical assessment; and the clinical records. Phase One data were collected at the initial appointment for a dental examination. Prior to the examination face-to-face interviews were conducted with consenting participants. The clinical assessment would provide data to a clinical data sheet and the electronic dental record (see Figure 2.1). Additional data were also collected from non-participants about their reasons for not taking part. All data for Phase Two will be taken from the electronic dental record. Appendix 2 contains a complete list of data items. Figure 2.1 Initial appointment for dental check Face-to-face interviews Clinical assessment Clinical data sheet “Why is He Not Smiling?” Dental Costs Study Phase One Final Report Health Issues Centre, August 2008 Electronic dental record 23 2.4.1 Face-to-face Interviews Structured interviews conducted at the initial dental visit collected the following information: Consumer demographic information These included: gender; level of education attained; main life occupation (either current or previous); country of birth; year of arrival in Australia (if relevant); and language spoken at home. Impact Profile: OHIP–14 Oral Health Impact Profile (OHIP) is a validated 14-item measure developed to rate the perceptions of social impact relating to oral health over the preceding four weeks (Slade 1997). It is a shortened form of the original 49-item OHIP instrument (Slade & Spencer 1994). It includes the dimensions of functional limitation, physical pain, psychological discomfort, physical disability, psychological disability, social disability and handicap. It uses a five-point Likert-type scale with the response categories: never; hardly ever; occasionally; fairly often; and very often, to assess the frequency of symptoms. Impact on health and social behaviour A 16-item scale was developed to assess behaviour relating to factors identified in the literature as important to people’s experience of poor oral health. The dimensions included: nutrition; pain management; productivity and employment; and social relationships. The scale uses a five-point Likert-type scale with response categories similar to the OHIP-14 scale for the frequency of self-reported behaviour over the past four weeks. Self-assessments of oral and general health Two items were concerned with self-assessments of health status using a five-point scale for responses. Perception of oral health was asked as a comparative measure; that is, oral health compared to others of a similar age. The scale used was: much better; better; about the same; worse; and much worse. General health selfassessments also used a five-scale: excellent; very good; good; fair; and poor. Use of dental and medical services: Four items included in the structured interview at the initial dental visit relate to the use of dental and medical services in the last six months, including the use of emergency services. Additional and clarifying comments were recorded in the structured interview, either verbatim or as a narrative summary. 2.4.2 Clinical Data Sheet Clinical data sheets prepared for the study were used during the initial clinical assessment to collect the following clinical outcomes: “Why is He Not Smiling?” Dental Costs Study Phase One Final Report Health Issues Centre, August 2008 24 • Periodontal assessment using the Community Periodontal Index (CPI). 8 • Determination of the number of functional natural teeth present. • Dentate status. • Dental treatment needs. See Appendix 2 for details.9 As part of the clinical assessment, the dental treatment plan was recorded in the clinical data sheet in the form of item numbers. The cost of all item numbers was calculated for each patient using the schedule of dental services and costing in the Community Dental Program 2006–2007. These are based on the Department of Veterans’ Affairs rates for dental services. The average cost was also calculated for specific dental services: diagnostic services; preventive services; periodontics (gum disease); oral surgery (extractions); endodontics (root canal treatment); restorative services (fillings); removable prosthodontics (dentures); and other, such as interpreter costs. 2.4.3 Electronic Dental Records Electronic clinical records are routinely used in community dental clinics in Victoria. Patient records provide information about: their length of time on the waiting list; clinical data; use of emergency dental services; types of treatment received; costs of treatments; and co-payments paid. In Phase One of the study only limited information from electronic dental records (i.e. length of time on the waiting list) was accessed. 2.5 Recruitment 2.5.1 Recruitment Process The study involved people on the dental waiting list at Dianella Community Health Centre. They were recruited between 31 July 2006 and 7 February 2007. Information about the study was sent to 511 people in six batches, comprising 60 to 100 letters and included a letter offering a dental appointment from Dianella Community Health (see Appendix 3). The information about the study comprised: a letter explaining the study and how to take part (Appendix 4); a detailed project information sheet (Appendix 5); consent form (Appendix 6); and a single-page questionnaire with a reply-paid envelope for those who did not want to participate (Appendix 7). The information was sent to 265 consecutive patients at the top of the waiting list who at that stage had been waiting at least two years. They were told that their initial co-payment of $22 would be waived if they agreed to participate to compensate for any additional time spent. 8 A method of ranking or rating a severity of periodontal (gum) disease. The original study design included calculation of the ratio of the number of teeth decayed, missing or filled teeth compared with the total number of teeth (DMFT or DMFS Index), but these data could not be accessed during field work. 9 “Why is He Not Smiling?” Dental Costs Study Phase One Final Report Health Issues Centre, August 2008 25 The information about the study was also sent to 246 consecutive patients who joined the waiting list in the previous two to four months. They were offered a dental appointment if they agreed to take part. This group would not have their first co-payment waived, as they did not have to wait for their examination and treatment. 2.5.2 Non-participant Survey As noted above, the information package sent at time of recruitment included a single-page questionnaire and a reply-paid envelope. The questionnaire asked people who did not want to take part in the study to give their reasons for nonparticipation (and not to reveal their identities). 2.5.3 Participation All potential study participants were asked to attend one hour prior to their dental appointment to participate in the interview; they were given a telephone reminder the day before their appointment. The study was explained to potential participants, including its purpose and requirements. People were asked to sign a consent form indicating their permission to access their dental records. Everyone was assured that participation was entirely voluntary and would not affect their treatment. All potential participants who attended the clinic received dental treatment regardless of their decision to participate. A face-to-face structured interview was then conducted with consenting participants. It involved the administration of a questionnaire (see Appendix 8). Additional comments were recorded either verbatim or as a narrative summary. An interpreter was used when necessary. At the conclusion of the interview, participants were given an acknowledgement for their contribution to the study. Following the interview, study participants attended their initial dental appointment with dentists trained for participation in the study. 2.6 Reliability 2.6.1 Minimising Bias It was not feasible, or ethical, to randomly allocate people to different waiting times, which is the ideal way to minimise bias in a study comparing two groups. However, we made every effort to minimise bias where possible. We approached people listed consecutively on the waiting list. Dentists were not told how long patients had been on the dental waiting list for a dental appointment; that is, the clinicians were blind as to whether the patients belonged to Group A or Group B. 2.6.2 Reliability of Dental Assessment Two dentists were nominated by Dianella Community Health to examine participants in the study. The two dentists and dental nurses who worked with them were trained according to the study protocol provided by Professor Hanny Calache (one of the study collaborators). Information about participants’ time on the waiting list was removed from the electronic dental records to ensure that participating dentists were blind as to which groups the patient belonged. Administrative staff members involved in recruitment were informed about recruitment procedures by Health Issues Centre’s project staff. “Why is He Not Smiling?” Dental Costs Study Phase One Final Report Health Issues Centre, August 2008 26 A random sub-sample comprising 19.5% of the study population number was reassessed at their subsequent dental visit to provide an estimate of reliability in the clinical assessments between the two dentists who took part in the study. An extra time of fifteen minutes was added to the second visit to allow for re-assessment prior to the treatment. A total of 48 people participated in the reliability testing, including 28 study participants and 20 general dental patients. Inter-examiner re-assessment was conducted with the 28 participants. They were re-examined in their second appointment by a dentist other than the one consulted in the initial appointment. The remaining 20 underwent intra-examiner reassessment. Each of the dentists who took part in the study repeated their clinical examination on 10 patients in their subsequent appointments. Data on proposed treatment plans were recorded manually as item numbers on a clinical data sheet. Costs of proposed treatment were calculated using the schedule of dental services and costing in the Community Dental Program 2006–2007. Analysis was made by comparing the costs proposed by each dentist on the same patients (inter-examiner testing) and the costs of two assessments by the same dentist on the same patient (intra-examiner testing). “Why is He Not Smiling?” Dental Costs Study Phase One Final Report Health Issues Centre, August 2008 27 PART B: RESULTS 3. ALL STUDY PARTICIPANTS Overview Two hundred and forty-six (246) public dental patients took part in the dental costs study. Over 70% were born overseas, coming from more than 25 countries. Arabic, Italian and Turkish were the most common languages used at home other than English. Over half the people in the study were aged less than 65 years. Women were over-represented overall, but made up less than half those aged 65 years and older. Most people had limited education; most had not completed high school. One in five identified as a tradesperson and a similar number worked, or had worked, in transport and production as their main job. More than 40% had visited a dentist in the previous 12 months; lower than the normal dental attendance rate of 62.5% among Australian dentate adults (Slade, Spencer et al. 2007); and 57% of these visits were for emergency dental treatment; higher than the 38% norm among public dental patients (Brennan, Spencer et al. 1977). Nearly half the dental visits in the past 12 months were at Dianella Community Health and about one-third were to private dental practices. The two major reasons people had not seen dentists were costs and the waiting time for an appointment. Overall, the oral health status of participants was poor across several measures in the study. Study participants had poorer outcomes compared with adults in the National Survey of Adult Oral Health 2004–2006 (NSAOH; Slade, Spencer et al. 2007), in terms of the proportion with fewer than 21 natural teeth (51% vs 11%), severe gum disease (19.6% vs 2.4%), and moderate gum disease (53.6% vs 20.5%). Only 9% of study participants had at least 20 natural functional teeth present and healthy supporting periodontal tissue (gums). The majority of participants showed evidence of gingival or periodontal disease (71.9%). In terms of social impacts from problems with their mouth or teeth in the previous four weeks, 56% of study participants reported frequently avoiding cold foods compared with 17.4% reported in the NSAOH. More than half reported experiencing pain frequently (55.5% compared with 15% in NSAOH). In addition, 28% reported feeling self-conscious often or very often and more than 20% reported interrupted or unsatisfactory meals often or very often. One in four people in the study reported feeling embarrassed or tense fairly often or more frequently because of problems with their mouth or teeth; 17% used over-the-counter medication to manage dental pain and one in 10 people said problems with their oral health affected intimacy with others and with sleeping. Of those for whom it was relevant, more than one in seven felt their job prospects had been affected by problems with their teeth, mouth or dentures. Most people rated their oral health as about the same as other people of similar age, although people under 65 years tended to rate their oral health about the same or worse than their peers. Overall, nearly one-third of all study participants rated their oral health as fair or poorer than others (32.6%). “Why is He Not Smiling?” Dental Costs Study Phase One Final Report Health Issues Centre, August 2008 28 Despite a large majority (86%) rating their health as good or better than others of the same age, people in the study reported a high level of health-seeking behaviour. Most had seen their GP in the last six months (87%) with more than half of these reporting three or more visits in that time (see Table 3.10). People in the study rated their general health more highly than their oral health (see Table 4.5 and Figures 4.2 and 4.3). Self-ratings of general health were generally lower than other Australian adults; for example, 50.8% of the study population rated their health as excellent or very good, compared with 56% of Australian adults (Australian Bureau of Statistics 2007). The study estimated the likely cost of treatment of the dentist’s plan for treatment for each patient based on the current DHS funding formula, which uses the Department of Veterans’ Affairs schedule. The estimated costs ranged from $46 to $4,267. The mean proposed cost was $924.31 per person (more than three times the average cost of care for Victorian public dental patients; $272)—the largest proportion of which were for restorative treatments followed by dentures. The average proposed cost for preventive treatment was $75 (8% of total proposed costs). The management of periodontal disease was allocated the least costs, only 2%, despite the high evidence of advanced gum disease among study participants. A more detailed analysis and key findings are presented in the rest of this chapter. “Why is He Not Smiling?” Dental Costs Study Phase One Final Report Health Issues Centre, August 2008 29 3.1 Limitations of the Study This study has a number of limitations that need to be considered when its results are interpreted. Some of these relate to the study design; others arose during the study. 3.1.1 Costs The costs used in this study were based on the proposed treatment plans, not the actual treatment. Further, the costs do not include emergency dental services sought elsewhere or co-payments by clients. The former will be addressed in the next phase of the study. Note that there has been no attempt in this study to quantitatively assess the financial costs borne by consumers who buy medications and other products to manage pain while they wait for dental treatment, although these are reflected in the qualitative data. 3.1.2 Response to Recruitment During the study it was found that the response to recruitment was much slower than expected. We can identify two possible reasons for this. First, contrary to arrangements agreed prior to the study, the dental clinic had to confine study appointments to one or two days each week, and often during these weeks, only one dentist instead of two worked for the study. The second reason may have contributed to this decision being made. Response to the recruitment letter was much slower than anticipated, especially among those who had recently joined the waiting list. We expected that many more of these people would take the opportunity to have an earlier dental appointment (within 2 to 4 months of registering) and that the response rate would have been higher than the 30% usually experienced by the clinic when it offers dental appointments to people at the top of the waiting list. However, this was not so. 3.1.3 Electronic Dental Record Prior to the commencement of the study it appeared that the proposed treatment plan could be recorded on the electronic dental record. This was ideal as the treatment costs could then be retrieved with minimal effort. Unfortunately, although the data could be recorded, it was discovered that the inclusion of the proposed treatment item numbers caused unforeseen problems with the billing system. This made it necessary to revert to manual recording of the proposed treatment, with additional data entry and data analysis. These activities also extended the study timeline and increased potential for errors at each stage of the process—recording, data entry and analysis—requiring additional data checking. 3.1.4 Reliability of Clinical Examination Reliability of clinical examination in the study was assessed, as described in Chapter Two. Assessment of the reliability testing shows that inter-examiner reliability for treatment planning is moderate, with Intraclass Correlation Coefficient (ICC) of 0.30 on single measures and 0.46 on average measures. This can be interpreted as moderate agreement between the assessment of both dentists (Landis & Koch 1977). “Why is He Not Smiling?” Dental Costs Study Phase One Final Report Health Issues Centre, August 2008 30 3.2 Response to Recruitment Two hundred and forty-six people volunteered to take part in the study. Of the 511 letters sent, five were returned to sender, and 350 responses were received (response rate = 69%). Appointments were made by 288 people (56% of those approached) and 62 returned completed non-participant questionnaires (12%). Two days per week in the clinic were allocated to appointments for the study. Of the 288 people who made appointments, 42 did not participate for the following reasons: they refused (8); cancelled or rebooked their appointment time outside the recruitment time (12); did not attend the clinic at the time for their appointment (18); they were overlooked (2); or their appointment was made for a non-study day (2). The response is depicted in Figure 3.1. Two hundred and forty-six (246) patients participated in interviews and dental examinations; 85.4% of those who initially made study appointments and 48.7% of those approached to take part in the study (excluding those whose letters were returned). The response rate improved when a follow-up telephone call was added to the recruitment protocol. Figure 3.1: Response to letter asking people to take part in study 511 letters mailed 156 No response 5 letters Returned to sender 62 Non-participant survey 288 Made study appointment 42 Did not take part 8 Refused 18 Did not attend 12 Cancelled appointment 2 Missed 2 Appointment error 246 took part in study “Why is He Not Smiling?” Dental Costs Study Phase One Final Report Health Issues Centre, August 2008 31 3.3 Who Took Part? 3.3.1 Age and Gender Nearly half the people in the study (49.4%) were aged between 35 and 64 years. People over 64 years made up 40% and 10.6% were aged 35 years or less. The age range of participants was 21 to 84 years (See Table 3.1). Women comprised almost 60% of study participants (p=0.001 [see Table A in Appendix 11 and Figure 3.2 below]). This is higher than the usual proportion of female of 52.3% among Australian population aged 20–84 years (Australian Bureau of Statistics 2007). In this study, the proportion of women compared with men was highest in the group aged under 35 years (84.6% compared with 15.4%) and was lowest in the group aged over 64 years (48.0% compared with 52.0% [see Table B in Appendix 11 and Figure 3.3]). Compared with the 2006 Census, the proportion of females in the study in the younger aged groups (84.6%) is much higher than the norm of 50.3% among Australian population aged 20–34 years (Australian Bureau of Statistics 2007a). Table 3.1: Age range Age range Total n (%) Less than 35 years 26 (10.6) 35-64 years 121 (49.4) More than 64 years 98 (40.0) Total 245 (100.0) Figure 3.2: Gender of study participants Male 40% Female 60% “Why is He Not Smiling?” Dental Costs Study Phase One Final Report Health Issues Centre, August 2008 Male Female 32 Figure 3.3: Proportion of study participants by gender and age group 90 80 70 60 % 50 40 Male Female 30 20 10 0 <35yrs 3.3.2 35-64yrs >64 years Total Country of Birth Most people in the study were born outside Australia, although Australian-born made up the single largest group of people (27.3%, [see Figure 3.4]). Overall, people from (born in) more than 25 countries took part in the study. The second largest groups in the study were born in the Middle East (16.7%) and Italy (16.3% [see Table C in Appendix 11]). Figure 3.4: Proportion of participants by country of birth Australia 27% Other 40% Middle East 17% Italy 16% Of the 178 people who were born overseas, 163 told us when they arrived in Australia (91.6% of those born outside Australia). Nearly 75% of these have lived in Australia for 20 years or longer and just less than 10% arrived in the last five years (see Table D in Appendix 11). English is spoken at home by the majority of study participants (55.7%); Arabic is the second most common language at home (11.8%), followed by Italian (7.7%) and Turkish (7.3%, [see Table E in Appendix 11]). “Why is He Not Smiling?” Dental Costs Study Phase One Final Report Health Issues Centre, August 2008 33 3.3.3 Education and Employment Nearly two-thirds of people in the study reported that they did not complete high school (65.8%), including seven people (2.8%) with no formal education. The highest level of education was the completion of high school for 15.9%, and tertiary education of some form for 18.3% (see Table F in Appendix 11). The five main occupation areas10 in which study participants worked or had worked were: tradespersons (19.7%); production and transport (19.3); labourers (16.8%); clerical or sales work (13.1%); and no paid work (12.7%). The rest worked in basic sales (6.6%), professional areas (5.7%) or associate professional areas (2.5%). Two people reported that their main occupation had been as managers or administrators (0.8%, [see Table G in Appendix 11]). 3.4 Use of Dental Services 3.4.1 Last Dental Visit Over two-fifths (40%) of people in the study had visited a dentist during the 12 months preceding the study, compared with 59.4% in the 2004–2006 National Survey of Adult Oral Health (NSAOH; Spencer and Harford 2007a). One-fifth of study participants had been to a dentist in the previous one to two years and another fifth had been two to five years previously. One in eight had seen a dentist more than five years prior and two people had never been to a dentist before (see Figure 3.5 and Table H in Appendix 11; Spencer & Harford 2007a). For most participants the last dental visit was an emergency visit (57.2% [see Figure 3.6 below and Table I in Appendix 11]). The rate of emergency visits among the study population was higher than in the NSAOH where 43.4% of people who attended a dentists in the previous 12 months did so for a dental problem (Spencer & Harford 2007a; Brennan, Luzzi et al. 2008). Figure 3.5: Time since last dental visit More than 5 years 13% No dental visit 1% Less than 12 months 2-5 years 21% 43% 1-2 years 22% 10 Based on the ABS Australian Standard Classification of Occupations (ASCO) 2nd edition 1997 “Why is He Not Smiling?” Dental Costs Study Phase One Final Report Health Issues Centre, August 2008 34 Figure 3.6: Type of last dental visit Unsure 2.4% Not emergency 40.4% Not emergency Emergency Emergency Unsure 57.2% Nearly half the study participants attended the Dianella Community Health Centre for their last dental visit (48.4%); nearly one-third attended a private dental practice (32.9%); and about one in 10 attended the dental hospital (9.8%). The others include two people who had never previously been to a dentist and six people whose last dental visit was in another country (see Table 3.2). Table 3.2: Place of last dental visit Last dental visit Total Dianella CHS 119 (48.4) Private practice 81 (32.9) Dental hospital 24 (9.8) Other CHS 13 (5.3) Dental technician 1 (0.4) Other 8 (3.3) Total 3.4.2 246 (100.0) Reason for Not Seeking Oral Health Services Table 3.3 shows the reasons people gave for not seeking oral health services. The question asking people what stopped them from doing so did not specify type of dentist—public or private. More than one of the prompted 12 reasons could be selected. The most common reason for not seeing a dentist was the cost (77.2%), followed by waiting time for dentist (54.9%), availability of dentist (37.4%), and fear of dentist (26.4%). “Why is He Not Smiling?” Dental Costs Study Phase One Final Report Health Issues Centre, August 2008 35 Table 3.3: Reasons for not seeing dentist All Reason n=246 (% group) Cost 190 (77.2) Waiting time for appointment 135 (54.9) Availability of dentist 92 (37.4) Fear of dentist 65 (26.4) Waiting time at surgery 42 (17.1) Location 24 (9.8) Health problems 22 (8.9) Communication problem 21 (8.5) Mental health issue 12 (4.9) Rude non-clinical staff 12 (4.9) Rude dentist 9 (3.7) Accessibility 8 (3.3) * Multiple responses were possible 3.5 3.5.1 Oral Health Status Rating of Oral Health A number of different ways were used to rate oral health. These included: study participants self-rating of oral health compared to others of the same age; clinical assessment that included the Community Periodontal Index (CPI); the number of natural functional teeth and the proposed treatment plan; and use of the 14-item Oral Health Impact Profile (OHIP)—a validated scale that assesses the consequences of oral health on functional limitation, physical disability, psychological disability, social disability and handicap. 3.5.2 Self-rating of Oral Health More people in the study rated their oral health as “about the same” as others (42.8%), almost one-quarter of study participants rated their oral health as better or much better than others of the same age (24.5%); a similar proportion rated it as worse (23.7%), and fewer than one in 10 rated it as “much worse” (8.9%, [see Figure 3.7 below and Table J in Appendix 11]). Nearly one-third of people in the study (32.6%) self-rated their oral health as fair or poor. This is almost double the proportion in the NSAOH, who rated their oral health this way (16.4%; Harford & Spencer 2007a). “Why is He Not Smiling?” Dental Costs Study Phase One Final Report Health Issues Centre, August 2008 36 Figure 3.7: Proportion of participants by self-rating of oral health compared with others of the same age % 45 40 35 30 25 20 15 10 5 0 Much better 3.5.3 Better About the same Worse Much worse Factors influencing oral health rating Table 3.4 shows that age was a significant factor influencing people’s self-rating of oral health status (p=0.027), and, although the number of natural functional teeth does appear to affect how people rate their oral health compared to others, it does not reach statistical significance. “Why is He Not Smiling?” Dental Costs Study Phase One Final Report Health Issues Centre, August 2008 37 Table 3.4: Self-rating of oral health status for all participants by age range, gender and number of natural functional teeth Much better n (%) Better n (%) About the same n (%) Worse n (%) Much worse n (%) Total n (%) Pearson’s chi square Age range <35yrs 35-64yrs 65 yrs & older 2 (7.7) 5 (19.2) 7 (26.9) 8 (30.8) 4 (15.4) 26 (100.0) 4 (3.4) 19 (16.0) 48 (40.3) 36 (30.3) 12 (10.1) 119 (100.0) 4 (4.4) 24 (26.7) 46 (51.1) 11 (12.2) 5 (5.6) 90 (100.0) 10 (4.3) 48 (20.4) 101 (43.0) 55 (23.4) 21 (8.9) 235 (100.0) Male 3 (3.2) 24 (25.3) 38 (40.0) 23 (24.2) 7 (7.4) 95 (100.0) Female 7 (5.0) 24 (17.0) 63 (44.7) 33 (23.4) 14 (9.9) 141 (100.0) 10 (4.2) 48 (20.3) 101 (42.8) 56 (23.7) 21 (8.9) 236 (100.0) 0 (0.0) 2 (10.0) 9 (45.0) 5 (25.0) 4 (20.0) 20 (100.0) 0 (0.0) 4 (13.8) 11 (37.9) 8 (27.6) 6 (20.7) 29 (100.0) 13-20 teeth 1 (1.5) 18 (27.3) 33 (50.0) 13 (19.7) 1 (1.5) 66 (100.0) >20 teeth 9 (7.6) 24 (20.3) 46 (39.0) 29 (24.6) 10 (8.5) 118 (100.0) Total Gender Total 17.315(a) df=8 p= 0.027 3.057(b) df=4 p=0.548 Natural functional teeth No functional teeth 1-12 teeth 8.872(c) df=4 p=0.064 a 5 cells (33.3%) have expected count less than 5. The minimum expected count is 0.76. b 1 cells (10.0%) have expected count less than 5. The minimum expected count is 4.03. c 1 cells (10.0%) have expected count less than 5. The minimum expected count is 4.70. “Why is He Not Smiling?” Dental Costs Study Phase One Final Report Health Issues Centre, August 2008 38 3.5.4 Clinical Assessment Number of natural functional teeth Twenty natural functional teeth are considered sufficient for effective chewing and important for good oral health in adults (AIHW 2006). Just over half of all study participants had fewer than 21 natural teeth (51%) compared with 11.4% of Australian adults in the NSAOH (Roberts-Thomson & Do 2007). In this study, 29% had between 13 and 20 natural functional teeth, 13% had fewer than 12 natural teeth, and 9% had no natural functional teeth. The average number of natural functional teeth among people in the study was 18.8. Details are reported in Figure 3.8 and Table K in Appendix 11. Figure 3.8: Natural functional teeth None 9% 1-12 teeth 13% More than 20 teeth 49% 13-20 teeth 29% Periodontal Assessment The periodontal assessment was performed on 235 study participants (97% of the study population); 11 people were excluded because of pre-existing medical conditions. The following data are for those people who underwent periodontal assessment. More than one in five people showed evidence of advanced gum disease (periodontitis; 22.2%). This is shown in Table 3.4 where the proportion with periodontal status in one or more sextant rated was severe (19.6%) or showing mobility (2.6%). More than half (53.6%) had moderate gum disease and over sixty per cent (61.1%) had evidence of calculus (indicating the need for scaling and cleaning). By comparison, the NSAOH in 2004–2006 found the prevalence of moderate or severe gum disease to be 22.9% (Roberts-Thomson & Do 2007). “Why is He Not Smiling?” Dental Costs Study Phase One Final Report Health Issues Centre, August 2008 39 Table 3.5: Periodontal status based on community periodontal index (CPI) Number with at least one sextant affected n (%) CPI HEALTHY (CPI = 0) GINGIVITIS (CPI = 1) CALCULUS CPI = 2) MODERATE (CPI = 3) SEVERE (CPI = 4) MOBILITY (CPI = 4) EXCLUDED a Number of sextants affected Mean (s.e.) Range of sextants affected Median Mode Skewness (s.e.) 63 (28.1) 0.85 (0.110) 0.35 0 0-6 1.965 (0.163) 48 (21.4) 0.45 (0.070) 0.24 0 0-6 2.846 (0.163) 138 (61.6) 2.09 (0.143) 1.56 0 0-6 0.557 (0.163) 120 (53.6) 1.24 (0.100) 0.85a 0 0-6 1.123 (0.163) 44 (19.6) 0.41 (0.065) 0.22a 0 0-5 2.598 (0.163) 6 (2.6) 0.03 (0.013) 0.03 a 0 0-2 7.047 (0.163) 77 (34.40) 0.92 (0.103) 0.46 a 0 0-5 1.581 (0.163) calculated from grouped data Table 3.6 shows that the large majority of people in the study had no healthy sextants (71.9%) and fewer than one in 20 people had no evidence of gingival or periodontal disease (4.0%). Table 3.6: Sextants* with healthy community periodontal index (CPI=0) Number of participants n (%) No healthy sextants 161 (71.9) 1 healthy sextant 17 (7.6) 2 healthy sextants 12 (5.4) 3 healthy sextants 11 (4.9) 4 healthy sextants 8 (3.6) 5 healthy sextants 6 (2.7) All healthy sextants Total 9 (4.0) 224 (100.0) * The mouth is divided into six sextants defined by tooth numbers (WHO Global InfoBase) “Why is He Not Smiling?” Dental Costs Study Phase One Final Report Health Issues Centre, August 2008 40 3.5.5 Oral Health Impact Profile (OHIP) Table 3.7 shows the distribution of responses to questions about the frequency of troubles over the previous four weeks related to problems with teeth, mouth or dentures. People who answered ‘fairly often’ or ‘very often’ were interpreted as having the corresponding problem. More than 40% of people in the study found eating uncomfortable fairly often or very often because of problems with their teeth or mouth. This was the most common problem among study participants. Twenty-eight per cent—about two in seven—felt self-conscious because of their oral health fairly often or very often in the previous month. Painful aching (26.0%), feeling embarrassed (24.2%) or feeling tense (24.0%) was experienced by about a quarter of study participants fairly often or very often. Over one-fifth of participants reported that their meals were interrupted fairly often or very often (21.5%) or that their diet was unsatisfactory (21.1%). Table 3.7: Distribution of responses to oral health impact profile (OHIP) (%) During the PAST FOUR WEEKS, how often have you had trouble pronouncing any words Felt that your sense of taste has worsened had painful aching in your mouth found it uncomfortable to eat any foods Never (0) Hardly ever (1) Occasionally (2) Fairly Often (3) Very Often (4) Mean (SE) 80.2 2.1 9.1 3.7 5.0 72.2 2.1 14.5 5.0 6.2 0.71 (0.080) 40.4 4.1 28.6 11.0 15.9 1.58 (0.096) 28.2 4.1 26.9 8.2 32.7 2.13 (0.102) been self-conscious 47.8 3.3 20.8 6.9 21.2 1.5 (0.104) felt tense 46.5 5.3 24.1 7.3 16.7 1.42 (0.098) thought your diet has been unsatisfactory 57.0 5.8 16.1 7.9 13.2 1.14 (0.096) had to interrupt meals 55.2 4.1 19.1 9.1 12.4 1.2 (0.096) found it difficult to relax 57.0 6.6 18.6 7.4 10.3 1.07 (0.091) been a bit embarrassed 51.2 2.9 21.7 4.5 19.7 1.39 (0.102) 69.3 2.0 18.4 4.5 5.7 0.75 (0.079) 75.3 4.9 12.8 3.7 2.5 0.56 (0.070) 55.8 5.0 24.0 6.2 9.1 1.08 (0.088) 80.2 3.7 13.2 1.6 1.2 0.40 (0.056) been a bit irritable with other people had difficulty doing your usual jobs felt that life in general was less satisfying been totally unable to function 3.5.6 0.51 (0.072) Impact on Health and Social Behaviour The scale to assess impact of oral health problems on health behaviour is not validated and was developed for this project based on the OHIP scale. As with the OHIP, people who answered ‘fairly often’ or ‘very often’ were classified as having the corresponding problem. “Why is He Not Smiling?” Dental Costs Study Phase One Final Report Health Issues Centre, August 2008 41 Table 3.8 shows behaviours related to the previous four weeks. Over one-third of all people in the study reported avoiding cold foods fairly often or very often (34.8%) and more than half avoided cold food at least occasionally during that time. About one-sixth reported avoiding hot foods fairly often or very often (17.9%); more than 30 per cent avoided hot foods at least occasionally (31.7%). About one in six study participants reported using over-the-counter medications to manage dental pain fairly often or very often (17.4%). Table 3.8 also shows that approximately one in 10 people reported that concerns about their oral health affected intimacy with others (11.6%), affected sleeping (9.9%), or caused them to buy special foods (8.1%) either fairly often or very often in the previous four weeks (see Table 3.19). Among those to whom employment was relevant (n=103), more than one in seven were concerned that their job prospects were affected by problems with their teeth, mouth or dentures occasionally or more often in the past four weeks (15.6%). Of those who smoked (n=164), 6.7% claimed they used smoking to manage dental pain at least occasionally or more often, and, of the 191 people in the study who drank alcohol, two (1.0%) reported using alcohol for pain very often and 14 reported using alcohol for pain either occasionally (3.7%) or hardly ever (3.7% [see Table 3.8]). Table 3.8: Distribution of responses to impact on health behaviour (%) Avoided cold foods (n=236) Avoided hot foods (n=244) Used OTC painkillers (n=244) Medication from doctor (n=244) Used nutrition supplements (n=238) Bought special foods (n=242) Found sleep difficult (n=238) Used traditional remedy (n=240) Affected social activities (n=232) Caused problems with intimacy (n=232) Stopped from important function (n=238) Used alcohol for pain (n=191) Smoked tobacco to manage pain (n=164) Missed work (n=98) Affected job prospects (n=103) Never (0) Hardly ever (1) Occasionally (2) Fairly Often (3) Very Often (4) Mean (SE) 80.2 3.3 19.8 7.9 26.9 1.74 (0.108) 63.8 4.5 13.8 5.3 12.6 0.98 (0.093) 54.9 2.4 25.2 8.1 9.3 1.15 (0.089) 89.8 2.0 6.5 1.2 0.4 0.20 (0.041) 92.6 0.0 2.1 1.6 3.7 0.24 (0.056) 90.6 1.2 5.7 1.2 1.2 0.21 (0.045) 60.9 3.3 25.5 4.1 5.8 0.92 (0.081) 91.8 1.2 5.7 0.4 0.8 0.17 (0.040) 74.6 3.7 12.3 4.5 4.9 0.61 (0.074) 71.3 2.1 15.0 3.3 8.3 0.75 (0.084) 84.4 1.2 11.9 1.2 1.2 0.34 (0.053) 91.6 3.7 3.7 0 1.0 0.15 (0.042) 92.7 0.6 3.7 0.6 2.4 0.20 (0.059) 93.9 2.0 3.1 0 1.0 0.12 (0.055) 84.5 0 4.9 4.9 5.8 0.48 (0.114) “Why is He Not Smiling?” Dental Costs Study Phase One Final Report Health Issues Centre, August 2008 42 3.6 General Health Status 3.6.1 Self-rating of General Health Self-rating of general health is a common indicator of health status. While it may not reflect the actual health status of the person, it does show how people perceive their own health and may provide understanding about perceived general health in relation to oral health problems. About half of study participants (50.8%) rated their general health compared to others of the same age as excellent (10.4%) or very good (41.3%). A further third described their health as good (34.2%). About one in 10 rated their health as ’fair’ (11.0%) while seven people said their health was very poor (2.9%, [see Table 3.9]). Compared with the self-ratings of general health in the 2004–05 ABS National Health Survey (NHS), people in this study were less likely to rate their health as excellent (10.4% compared with 21% ABS 2007) or poor (2.9% vs 4%), and more likely to rate their health as very good (41.3% vs 35%) or good (34.2% vs 28%) (Australian Bureau of Statistics 2007b). Table 3.9: Self-rating of general health compared to others by age, gender and number of natural functional teeth Excellent n (%) All Age range <35yrs 35-64yrs 65 yrs & older Total Very good n (%) Good n (%) Fair n (%) Poor n (%) Total n (%) 25 (10.4) 99 (41.3) 82 (34.2) 27 (11.3) 7 (2.9) 240 (100.0) 4(15.4) 14 (53.8) 7 (26.9) 1 (3.8) 0 (0.0) 26 (100.0) 14 (12.1) 41 (35.3) 39 (33.6) 20 (17.2) 2 (1.7) 116 (100.0) 7 (7.2) 43 (44.3) 36 (37.1) 6 (6.2) 5 (5.2) 97 (100.0) 25 (10.5) 98 (41.0) 82 (34.3) 27 (11.3) 7 (2.9) 25 (100.0) 10 (10.4) 42 (43.8) 31 (32.3) 11 (11.5) 2 (2.1) 96 (100.0) 15 (10.4) 57 (39.6) 51 (35.4) 16 (11.1) 5 (3.5) 144 (100.0) 25 (10.4) 99 (41.3) 82 (34.2) 27 (11.3) 7 (2.9) 240 (100.0) 0 (0.0) 6 (28.6) 11 (52.4) 2 (9.5) 2 (9.5) 21 (100.0) 1 (3.4) 11 (37.9) 12 (41.4) 4 (13.4) 1 (3.4) 29 (100.0) 5 (7.1) 32 (45.7) 20 (28.6) 11 (15.7) 2 (2.9) 70 (100.0) 19 (16.2) 48 (41.0) 39 (33.3) 9 (7.7) 2 (1.7) 117 (100.0) Pearson’s chi square NS Gender Male Female ALL NS Functional teeth No functional teeth 1-12 teeth 13-20 teeth >20 teeth 3.6.2 NS Use of Other Health Services Table 3.10 shows the reported use of dental and other health services by people in the study population in the previous six months. Nearly 30% had emergency dental treatment, largely at the Dianella dental clinic. A smaller proportion had non-emergency dental treatments (13.9%), mostly with a “Why is He Not Smiling?” Dental Costs Study Phase One Final Report Health Issues Centre, August 2008 43 private dentist. No further analysis of the use of emergency dental services and the costs incurred has been done at this stage. A large majority (87.4%) had seen a general practitioner in the last six months and more than half of these people had three or more visits. Hospital-based services were used by fewer people and were used less frequently. Just under a third reported attending hospital outpatient departments (32.9%), with the majority using them one to three times in the last six months. Eleven per cent had attended an emergency department, with more than half of this group doing so more than once. “Why is He Not Smiling?” Dental Costs Study Phase One Final Report Health Issues Centre, August 2008 44 Table 3.10: Reported use of health services in the last six months No n (%) Use emergency dental service 173 (71.2) Dianella CHS Yes n (%) 69 (28.4)* Unsure n (%) Total n (%) 1 (0.4) 243 (100.0) 2 (0.8) 244 (100.0) 43 (62.3) Other public CHS 11 (15.9) Private dentist 19 (27.5) Used non-emergency dental service 208 (85.2) Dianella CHS 5 (14.7) Other public DHS 6 (17.6) Private dentist Saw GP 34 (13.9) 23 (67.6) n 31 (12.6) 215 (87.4) 246 (100.0) Frequency Once only 24 (11.4) 2-3 times 55 (26.1) 4-6 times 63 (29.9) > 6 times 69 (32.7) Total 211 (100.0) Outpatient 165 (67.1) 81 (32.9) 246 (100.0) Frequency Once only 34 (43.6) 2-3 times 22 (28.2) 4-6 times 12 (15.4) > 6 times 10 (12.8) Total 78 (100.0) Emergency department 214 (87.3) 27 (11.0) 4 (1.6) 241 (100.0) Frequency Once only 2-3 times 4-6 times Total 14 (51.9) 10 (37.0) 2 (7.4) 27 (100.0) * Four people attended both Dianella CHS and a private dentist for emergency dental treatment in the previous six months. “Why is He Not Smiling?” Dental Costs Study Phase One Final Report Health Issues Centre, August 2008 45 3.7 Proposed Treatment and Costs 3.7.1 Mean Estimated Costs of Proposed Dental Treatment The average estimated cost to the Victorian Government of proposed dental treatment was $924.31 per person in the study. This is more than three times the state average cost—$271.68—actually delivered per course of care for general dental treatment in 2006–07; and is about twice higher than the state average cost—$406.21—per course of care for public patients using private services through dental vouchers. (It is planned to compare the cost of actual care against the original treatment plan in the next stage of this project.) Figure 3.9 shows the proportions of the types of treatment in the proposed treatment plans (see also Table L in Appendix 11). The largest estimated average costs are for proposed restorative treatments (37.7%) followed by dentures (24.7%). Eight per cent were allocated to proposed preventive treatments. The lowest average cost was for proposed management of periodontal conditions (2%). Figure 3.9: Mean estimated costs of proposed types of treatment Other $3 Dentures $229 Diagnostic $104 Preventive $75 Periodontal $18 Oral surgery $97 Endodontic $50 Restorative $349 3.7.2 Diagnostic Preventive 8% Periodontal 2% Oral surgery 10.5% Endodontic 5.4% Restorative 37.7% Dentures 24.7% Other 0.4% Ranges of Proposed Costs for Dental Treatment The estimated costs of proposed dental treatment for people in the study ranged from $46 to more than $4,000. The costs of the proposed treatment for over onequarter of all participants were between $1,001 and $2,000 (see Figure 3.10 below and Table M in Appendix 11). Figure 3.10: Distribution of proposed treatment costs More than $2001 7% $0-$300 19% $1,001-$2,000 26% $301-$600 24% $601-$1000 24% “Why is He Not Smiling?” Dental Costs Study Phase One Final Report Health Issues Centre, August 2008 46 3.8 Key Issues • Most people in the study were born overseas and have lived in Australia 20 years or more. • The rate of dental visits in the 12 months preceding the study is lower than that of Australian adults in general (40% vs 60%). • Cost is the most common inhibitor to accessing dental services, followed by the waiting time for an appointment. • The use of emergency dental care among people on, or joining, public dental waiting lists was more common compared with National Survey of Adult Oral Health 2004–2006 (57.2% vs 43.4%). • Overall, several oral health indicators of study participants were poor. Compared with Australian adults in the NSAOH study, participants: o Had lower self-rating of their own oral health o Had a higher proportion of inadequate natural dentition o Had higher prevalence of severe and moderate gum disease. • Fewer than one in 10 had at least 20 natural functional teeth with associated healthy gums. • More than one in five had 12 or fewer natural teeth and more than one in 10 had no natural functional teeth. • The average estimated cost of proposed dental treatment for people in the study was more than $900; three times higher than the average cost for general dental care for Victorian public dental patients (twice as high as public patients using private services through dental vouchers). • Over one-third of all proposed treatment costs were for restorative treatments (fillings; 37.7%) and nearly one-quarter were for dentures (24.7%). • Less than 10% of proposed treatment costs were for preventive care (8.1%). Only 2% was for the management of periodontal disease despite the high prevalence of the condition in this population group. “Why is He Not Smiling?” Dental Costs Study Phase One Final Report Health Issues Centre, August 2008 47 4. COMPARISON OF WAITING TIMES Overview Of the 246 study participants, 130 had been on the dental waiting list for more than two years (Group A); 116 joined the waiting list for two to four months previously (Group B). There were some differences in the characteristics between the two groups, although age was the only statistically significant difference. Overall, Group B was significantly younger than Group A. People in Group B had joined the waiting list more recently and also tended to have seen a dentist more recently than people in Group A. People in Group A were more likely to identify the availability of dentists and the waiting time for an appointment as reasons for not visiting dentists. As these differences were not statistically significant, they could be due to chance. Despite the lack of statistical difference there was a common trend; across a number of indicators of oral health status Group B fared worse than Group A, despite having joined the waiting list more recently. These indicators included the average number of natural functional teeth (17.8 in Group B compared with 19.6 in Group A) and self-ratings of oral health. People in Group B reported more frequent feelings of uncomfortable eating and reported feeling that life was less satisfying more often than those in Group A. However, clinical assessment revealed more people in Group B had no evidence of periodontal disease compared with those in Group A. There were significant differences in the proposed dental treatment planned for people who joined the waiting list more recently (Group B) compared with those who waited two years or more (Group A). These differences included more complex fillings, more extractions, and more dentures. Proposed restorative treatment— treatments for management of periodontal disease, root canal therapy and dentures—were more common among Group A. Proposed oral surgery procedures (extractions) were more common in Group B. If proposed treatments proceed as intended, the average number of natural teeth will be further reduced in the two groups. The mean number of natural teeth in Group B will reduce from 17.8 to 12.8, and in Group A it will reduce from 19.6 to 14.6. The overall estimated dollar costs for the proposed treatment plans were lower for Group B compared with Group A; although statistically significant, the financial difference is slight. Apart from preventive services, estimated costs for Group B were significantly lower for all treatment types except for oral surgery (extractions), which was significantly higher. Detailed analysis and more findings on the comparison of the two groups are presented in the rest of this chapter. “Why is He Not Smiling?” Dental Costs Study Phase One Final Report Health Issues Centre, August 2008 48 4.1 Response to Recruitment The 246 study participants comprised 130 people who had been on the dental waiting list for more than two years (Group A) and 116 people who had been on the waiting list for two to four months (Group B). Figure 4.1 shows the recruitment steps and responses given by people in both groups. Figure 4.1: Comparison of waiting times and response to recruitment 511 letters sent 265 Waiting >2 yrs 154 made appointment 2 return to sender 246 Waiting 2-4 months 134 made appointment 3 return to sender 24 did not participate 18 did not participate GROUP A 130 Waiting > 2 years GROUP B 116 Waiting 2-4 months Among the 265 people who had been waiting for a dental appointment for two years or more and were approached to take part in the study, 58% (154) made appointments, and 49% (130) kept the appointments and participated (Group A). Of 246 people who had waiting two to four months and were approached to take part in the study, 54% (134) made appointments and 47% (116) kept the appointment and took part (Group B). There was little difference in response rate, despite one group having only recently joined the waiting list—less than four months. This is an unexpected result. 4.2 Demographic Profile There was no significant difference between the two groups in terms of: gender; whether they were born in Australia or overseas; level of education and main occupation (see Tables 4.1 and 4.2). However, people in shorter-waiting group (Group B) were younger than the longer-waiting group (Group A [see Table 4.1]). A larger proportion of Group B was aged less than 35 years (15.7% compared with 6.2% in Group A), and a smaller proportion was aged 65 years or more (33% compared with 42.6%). “Why is He Not Smiling?” Dental Costs Study Phase One Final Report Health Issues Centre, August 2008 49 Table 4.1: Age range, gender, born in Australia or overseas, level of education and main occupation by group Age range Group A Group B Waiting > 2 years Waiting 2-4 months <35yrs n (%) 8 (6.2) Total n (%) Pearson’s Chi Square n (%) 18 (15.7) 26 (10.6) 35-64yrs 62 (47.7) 59 (51.3) 121 (49.4) 7.971 65 yrs & older 60 (42.6) 38 (33.0) 98 (40.0) 130 (100.0) 115 (100.0) 245 (100.0) p=0.01 9 Male 53 (40.8) 46 (39.7) 99 (40.2) Female 77 (59.2) 70 (60.3) 130 (100.0) 116 (100.0) 31 (23.0) 36 (32.4) 67 (27.4) All df=2 Gender All 147 (59.8) NS 246 (100.0) Country of birth Australia Italy 24 ((19.0) 15 (13.9) 39 (16.7) Middle East 19 (15.1) 20 (18.5) 39 (16.7) Other 54 (42.9) 38 (35.2) 92 (39.3) 126 (100.0) 108 (100.0) 234 (100.0) All NS Education level No formal education 3 (2.3) 4 (3.4) 7 (2.8) Primary incomplete 7 (5.4) 10 (8.6) 17 (6.9) Primary complete 30 (23.1) 14 (12.1) 44 (17.9) Secondary incomplete 51 (39.2) 43 (37.1) 94 (38.2) Secondary complete 21 (16.2) 18 (15.5) 39 (15.9) Tertiary education 18 (13.8) 27 (23.3) 45 (18.3) 130 (100.0) 116 (100.0) 246 (100.0) 31 (12.7) All NS Main occupation No paid work 21 (16.4) 10 (8.6) Managers/administrators 1 (0.8) 1 (0.9) 2 (0.8) Professionals 5 (3.9) 9 (7.8) 14 (5.7) Associate professionals 4 (3.1) 2 (1.7) 6 (2.5) Tradespersons 22 (17.2) 26 (22.4) 48 (19.7) Adv clerical & service 3 (2.3) 4 (3.4) 7 (2.9) Clerical sales service 17 (13.3) 15 (12.9) 32 (13.1) Production & transport 28 (21.9) 19 (16.4) 47 (19.3) 7 (5.5) 9 (7.8) 16 (6.6) 20 (15.6) 21 (18.1) 41 (16.8) Basic clerical sales Labourers & related “Why is He Not Smiling?” Dental Costs Study Phase One Final Report Health Issues Centre, August 2008 NS 50 Table 4.2: Year arrived in Australia and language at home by group Group B Year arrived Australia Group A Waiting > 2 years Waiting 2-4 months n (%) n (%) Pearson’s chi square Total n (%) >50 yrs ago 20 (23.0) 8 (10.5) 28 (17.2) 20-50yrs ago 51 (58.6) 43 (56.6) 94 (57.7) 10-20 yrs ago 7 (8.0) 7 (9.2) 14 (8.6) 5-10 yrs ago 4 (4.6) 8 (10.5) 12 (7.4) < 5 yrs 5 (5.7) 10 (13.2) 15 (9.2) 87(100.0) 76 (100.0) 163 (100.0) English 74 (56.9) 63 (54.3) 137 (55.7) Turkish 13 (10.0) 5 (4.3) 18 (7.3) Italian 11 (8.5) 8 (6.9) 19 (7.7) Arabic 12 (9.2) 17 (14.7) 29 (11.8) All NS Language at home Greek 2 (1.5) 5 (4.3) 7 (2.8) Other 18 (13.8) 18 (15.5) 36 (14.6) 130 (100.0) 116 (100.0) 246 (100.0) All 4.3 Oral Health and General Health 4.3.1 Use of Dental Health Services NS As described previously, nearly two-thirds of all study participants had seen a dentist within the previous two years (65.3%, [see Table H Appendix 11]) and for more than half of those in the study (57.1%) their last dental visit was an emergency (see Table 4.3). Comparison of the length of time since a dental visit for the two groups shows no significant difference; however, the trend suggests that people in Group B who have been waiting a shorter time had seen a dentist more recently. Two people in this group had not previously seen a dentist. Further analysis of the use of emergency dental services and the costs incurred is planned for the next stage of the study. Table 4.3: Time of last dental visit A Waiting B Waiting All 2 years 2-4 months n (%) How long ago? n (%) n (%) <12mths 48 (37.2) 57 (49.1) 105 (42.9) 1-2 yrs 29 (22.5) 26 (22.4) 55 (22.4) 2-5yrs 35 (27.1) 17 (14.7) 52 (21.2) >5yrs 17 (13.2) 14 (12.1) 31 (12.7) 0 (0.0) 2 (1.7) 2 (0.8) 129 (100.0) 116 (100.0) 245 (100.0) No 49 (38.0) 50 (43.1) 99 (40.4) Yes 77 (55.0) 63 (54.3) 140 (57.1) No dental visit Total Pearson’s Chi square p=0.067 Last visit emergency? Unsure Total 3 (2.3) 3 (2.6) 6 (2.4) 129 (52.7) 116 (47.3) 245 (100.0) “Why is He Not Smiling?” Dental Costs Study Phase One Final Report Health Issues Centre, August 2008 NS 51 4.3.2 Reasons for Not Seeing a Dentist Table 4.4 shows that people in the longer waiting Group A are more likely to identify the availability of dentists [Odd Ratio (OR) = 4.3 95%CI 2.3-8.2] and the waiting time for an appointment (OR= 1.9, 95%CI = 1.1-3.3) as reasons for not seeing a dentist compared with those in Group B. There were no other significantly different reasons between the two groups. Table 4.4: Reasons for not seeing dentist by waiting time* Reasons for not seeing dentist Group A Group B Waiting > 2 years Waiting 2-4 months n (%) n (%) All 190 (77.2) Odds Ratio (95% CI) Cost 98 (75.4) 92 (79.3) NS Availability of dentist 58 (44.6) 34 (29.3) 92 (37.4) 4.3 (2.3-8.2) Waiting time for appointment 81 (62.3) 54(46.6) 135 (54.9) 1.9 (1.1-3.3) Rude dentist 3 (2.3) 6 (5.1) 9 (3.7) NS Rude non-clinical staff 8 (6.2) 4 (3.4) 12 (4.9) NS Location 15 (11.5) 9 (7.8) 24 (9.8) NS Waiting time at surgery 20 (15.4) 22 (19.0) 42 (17.1) NS Fear of dentist 28 (21.5) 37 (31.9) 65 (26.4) NS Access 4 (3.1) 4 (3.4) 8 (3.3) NS Health problems 10 (7.7) 12 (10.3) 22 (8.9) NS Communication problem 10 (7.7) 11 (9.5) 21 (8.5) NS 5 (3.8) 7 (6.0) 12 (4.9) NS Mental health issue *multiple answers possible 4.3.3 Self-assessments of Oral and General Health Table 4.5 shows that people in Group B were more likely to rate their dental health as worse than others, compared to the self-rating of people in Group A who waited longer for dental treatment, but this difference was not significant (p=0.064, [see Figure 4.2]). However, this trend was not apparent in the self-ratings of general health, which was similar between the two groups (see Figure 4.3). “Why is He Not Smiling?” Dental Costs Study Phase One Final Report Health Issues Centre, August 2008 52 Table 4.5: Self-rating of oral health compared to others by waiting time Group B Group A Oral health status Waiting > 2 years Waiting 2-4 months n (%) n (%) Much better Total n (%) 6 (4.8) 4 (3.6) 10 (4.2) Better 25 (20.0) 23 (20.7) 48 (20.3) About the same 63 (50.4) 38 (34.2) 101 (42.8) Worse 22 (17.6) 34 (30.6) 56 (23.7) Much worse All 9 (7.2) 12 (10.8) 21 (8.9) 125 (100.0) 111 (100.0) 236 (100.0) Pearson’s Chi Square 8.872(a) df=4 p=0.064 General health status Excellent 14 (10.9) 11 (9.5) 25 (10.2) Very good 56 (43.4) 43 (37.1) 99 (40.4) Good 39 (30.2) 43 (37.1) 82 (33.5) Fair 17 (13.2) 10 (8.6) 27 (11.0) Poor 2 (1.6) 5 (4.3) 7 (2.9) Total 129 (100.0) 116 (100.0) 245 (100.0) NS Figure 4.2: Self-rating of oral health 60 50 40 % A Waiting > 2 years 30 B Waiting 2–4 months 20 10 0 Much better Better “Why is He Not Smiling?” Dental Costs Study Phase One Final Report Health Issues Centre, August 2008 About the same Worse Much worse 53 Figure 4.3: Self-rating of general health 50 45 % 40 35 30 A Waiting > 2 years 25 20 15 10 B Waiting 2–4 months 5 0 Excellent Very good Good Fair 4.4 Clinical Outcomes 4.4.1 Number of Natural Functional Teeth Poor People who were clearly edentulous (had no teeth) prior to clinical assessment were excluded from the study. Table 4.6 and Figure 4.4 show the number of natural functional teeth (determined by clinical assessment) by waiting time. Overall, nearly 9% of all study participants had no natural functional teeth and more than 20% had 12 or fewer teeth. Despite being younger than Group A on average, a higher proportion of Group B had either no natural functional teeth (11.3% compared with 6.3%) or 12 or fewer natural functional teeth (14.8% compared with 10.9%). The mean number of natural functional teeth was 19.6 for those in Group A, and 17.8 for those in Group B. Table 4.6: Number of natural functional teeth by waiting time Number of natural functional teeth Group A Group B Total Waiting > 2 years Waiting 2-4 months n (%) n (%) n (%) No natural functional teeth 8 (6.3) 13 (11.3) 21 (8.6) 1-12 teeth 14 (10.9) 17 (14.8) 31 (12.8) 13-20 teeth 38 (29.7) 32 (27.8) 70 (28.8) >20 teeth 68 (53.1) 53 (46.1) 121 (49.8) 128 (100.0) 115 (100.0) 243 (100.0) Total “Why is He Not Smiling?” Dental Costs Study Phase One Final Report Health Issues Centre, August 2008 Pearson’s Chi Square NS 54 Figure 4.4: Number of natural functional teeth by waiting time 60 50 40 A Waiting > 2 years 30 B Waiting 2–4 months 20 Total 10 0 No natural functional teeth 4.4.2 1-12 teeth 13-20 teeth >20 teeth Community Periodontal Index Despite the lower average number of natural teeth in Group B, comparison of the Community Periodontal Index (CPI) scores shows that significantly more healthy sextants—the six areas of the mouth defined by tooth positions—were present in Group B compared with Group A which had waited longer (p=0.036). This difference disappeared when people with 20 natural functional teeth or fewer were excluded (see Table 4.7 and Figure 4.4). “Why is He Not Smiling?” Dental Costs Study Phase One Final Report Health Issues Centre, August 2008 55 Table 4.7: Healthy Community Periodontal Index (CPI=0) by waiting time for all participants and for participants with at least 20 functional teeth Number of healthy quadrants Group A Waiting > 2 years All participants Group B Pearson’s Chi Square Total df=6 Waiting 2-4 months n (%) n (%) n (%) None 14 (10.8) 14 (12.1) 28 (11.4) 1 55 (42.3) 35 (30.2) 90 (36.6) 2 6 (4.6) 17 (14.7) 23 (9.3) 3 12 (9.2) 9 (7.8) 21 (8.5) 4 13 (10.0) 7 (6.0) 20 (8.1) 5 14 (10.8) 10 (8.6) 24 (9.8) All 16 (12.3) 24 (20.7) 40 (16.3) 130 (100.0) 116 (100.0) 246 (100.0) Total 13.447 p=0.036 Participants with at least 20 natural functional teeth Total None 13 (19.1) 12 (22.6) 25 (20.7) 1 38 (55.9) 22 (41.5) 60 (49.6) 2 4 (5.9) 6 (11.3) 10 (8.3) 3 1 (1.5) 3 (5.7) 4 (3.3) 4 2 (2.9) 3 (5.7) 5 (4.1) 5 5 (7.4) 3 (5.7) 8 (6.6) All 5 (7.4) 4 (7.5) 9 (7.4) 68 (100.0) 53 (20.7) 121 (100.0) NS Table 4.8 shows the number of healthy sextants present by the waiting time for all study participants and for each age group. There was no statistical difference in the number of healthy sextants between the two groups in each age group. However, a relatively low proportion of participants in both groups had only one healthy sextant (36.6%). “Why is He Not Smiling?” Dental Costs Study Phase One Final Report Health Issues Centre, August 2008 56 Figure 4.5: Number of healthy sextants by waiting time 45 40 35 30 % 25 20 15 10 5 0 A Waiting >2yrs B Waiting 2–4mths All None 1 2 “Why is He Not Smiling?” Dental Costs Study Phase One Final Report Health Issues Centre, August 2008 3 4 5 All 57 Table 4.8: Number of healthy sextants (CPI=0) by waiting time by age range Group A Group B Waiting > 2 years Waiting 24 months 94 (74.6) 78 (71.6) 172 (73.2) 7.712(a) 1 7 (5.6) 10 (9.2) 17 (7.2) p=0.260 2 4 (3.2) 8 (7.3) 12 (5.1) 3 8 (6.3) 3 (2.8) 11 (4.7) 4 3 (2.) 5 (4.6) 8 (3.4) Number of healthy sextants Pearson’s Chi Square Total df=6 All aged 18 years and more None 5 5 (4.0) 1 (0.9) 6 (2.6) All healthy quadrants 5 (4.0) 4 (3.7) 9 (3.8) Total 126 (100.0) 109 (100.0) 235 (100.0) None 7 (87.5) 13 (72.2) 20 (76.9) 1 1 (12.5) 0 (0) 1 (3.8) 2 0 (0.0) 0 (0.0) 0 (0.0) 3 0 (0.0) 1 (5.6) 1 (3.8) 4 0 (0.0) 1 (5.6) 1 (3.8) 5 0 (0.0) 0 (0.0) 0 (0.0) All 0 (0.0) 3 (16.7) 3 (11.5) 8 (100.0) 18 (100.0) 26 (100.0) Age-range = 18-34 years Total 4.640(b) p=0.326 Age-range = 35-64 years None 45 (72.6) 42 (72.4) 87 (72.5) 1 3 (4.8) 5 (8.6) 8 (6.7) 2 4 (6.5) 5 (8.6) 9 (7.9) 3 3 (4.8) 1 (1.7) 4 (3.3) 4 2 (3.2) 3(5.2) 5 (4.2) 5 3 (4.8) 1 (1.7) 4 (3.3) All healthy quadrants 2 (3.2) 1 (1.7) 3 (2.5) 62 (100.0) 58 (100.0) 120 (100.0) 42 (75.0) 22 (68.8) 64 (72.7) 3 (5.4) 5 (15.6) 8 (9.1) 2 0 (0) 3 (9.4) 3 (3.4) 3 5 (8.9) 1 (3.1) 6 (6.8) 4 1 (1.8) 1 (3.1) 2 (2.3) 5 2 (3.6) 0 (0) 2 (2.3) All healthy quadrants 3 (5.4) 0 (0) 3 (3.4) 56 (100.0) 32 (100.0) 88 (100.0) Total 3.118 (c) p=0.794 Age-range = >65 years None 1 Total 11.745(d) p=0.068 a) 6 cells (42.9%) have expected count less than 5. The minimum expected count is 2.78. b) 8 cells (80.0%) have expected count less than 5. The minimum expected count is .31. c) 12 cells (85.7%) have expected count less than 5. The minimum expected count is 1.45. d) 11 cells (78.6%) have expected count less than 5. The minimum expected count is .73. “Why is He Not Smiling?” Dental Costs Study Phase One Final Report Health Issues Centre, August 2008 58 4.5 Oral Health Impact Profile People in Group B were more likely than those in Group A to report higher frequencies of uncomfortable eating (p=0.030 [Table 4.9]) and feeling that life was less satisfying in the last four weeks because of problems with their teeth, mouth or dentures (p=0.011 [Table 4.10] ). Table 4.9: Frequency of experience of uncomfortable eating in last four weeks by waiting time Group A Frequency Waiting > 2 years Never Waiting 2-4 months 40 (30.8) Hardly ever Occasionally Fairly often Chi square Total 29 (25.2) df=4 69 (28.2) 9 (6.9) 1 (0.9) 10 (4.1) 35 (26.9) 31 (27.0) 66 (26.9) 6 (4.6) 14 (12.2) 20 (8.2) 40 (30.8) 40 (34.8) 80 (32.7) 130 (100.0) 115 (100.0) 245 (100.0) Very often Total Pearson Group B 10.718(a) p = 0.030 a) 1 cell (10.0%) has expected count less than 5. The minimum expected count is 4.69. Table 4.10: Frequency of experience of feeling life less satisfying in last four weeks by waiting time Group B Group A Waiting > 2 years Frequency Never Hardly ever Occasionally Fairly often Very often Total Pearson Waiting 2-4 months n (%) n (%) Chi square Total df=4 n (%) 81 (62.8) 54 (47.8) 7 (5.4) 5 (4.4) 135 (55.8) 12 (5.0) 29 (22.5) 29 (25.7) 58 (24.0) 12.981(a) 2 (1.6) 13 (11.5) 15 (6.2) P = 0.011 10 (7.8) 12 (10.6) 22 (9.1) 129 (100.0) 113 (100.0) 242 (100.0) a) No cells (.0%) have expected count less than 5. The minimum expected count is 5.60. 4.6 Costs of Proposed Treatment and the Treatment Plans 4.6.1 Cost of Proposed Treatment The total proposed costs to the system of care for both groups were more than $900 per person. The average cost of the proposed treatment for people in Group B was slightly lower than those in the longer-waiting Group A ($912.22 compared with $935.88). The mean difference was $23.66 (95%CI $5.14 to $42.18). This difference was statistically significant but considered to be not financially significant. Table 4.11 shows the treatment plans proposed to both groups, with the number of proposed procedures and costs. “Why is He Not Smiling?” Dental Costs Study Phase One Final Report Health Issues Centre, August 2008 59 Table 4.11: Number of proposed treatment procedures and costs Group A Waiting >2 years (n=130) Type of Procedures Group B Waiting 2-4 months (n=116) Number of procedures Total cost ($) Number of procedures Total cost ($) Diagnostic 401 13,766.15 333 11,995.20 Preventive 212 9772.85 184 8,583.90 36 3553.2 13 888.3 Oral surgery 122 9781.1 170 14133.9 Endodontics 59 6822.45 57 5370.95 483 45913.55 398 39852.1 15 360.7 13 476.5 1446 121,665.40 1237 105,817.70 11.12 $935.88 10.66 $912.22 Periodontal Restorative Other TOTAL Average per person There was a significant difference in the types of proposed treatment for the two groups (p=0.00079). There were also significant differences in the costs of each type of treatment proposed for the two groups, apart from those of preventive services (see Table 4.12 and Figure 4.5). The average cost for the proposed treatment among the longer-waiting Group A was higher for diagnostic services and periodontal, endodontic, and restorative treatments, and for dentures. Costs for oral surgery and other services—mainly interpreter services—were higher for the shorter-waiting Group B. See Appendix 10 for a complete list of the dental items proposed for each group. “Why is He Not Smiling?” Dental Costs Study Phase One Final Report Health Issues Centre, August 2008 60 Table 4.12: Mean costs of proposed dental treatment by type Group A Waiting > 2 years n=130 Mean cost $ (std dev) Group B Waiting 2-4 months n=115 Mean cost $ (std dev) t-test Pearson’s Chi square Diagnostic services 105.89 (9.29) 103.41 (9.60) Preventive services 75.18 (6.59) 74.00 (6.87) Periodontal treatment 27.33 (2.40) 7.66 (0.71) p<0.00001 Oral surgery 75.24 (6.60) 121.84 (11.31) p<0.00001 24.91 p-value=0.00079 p=0.0411012 NS Endodontic treatment 52.48 (4.60) 46.30 (4.30) p=0.0118236 Restorative treatment 353.18 (30.98) 343.55 (31.90) p=0.0173495 Dentures 243.81 (21.38) 211.35 (19.62) p<0.00001 Other TOTAL 2.77 (0.24) 4.11 (0.38) 935.88 (62.06) 912.22 (84.70) p<0.00001 p=0.014164 Figure 4.5: Proposed treatment costs by proposed treatment type for each group Figure 4.5: Proposed treatment costs by waiting time Waiting >2yrs Waiting 2-4mths D ia gn os Pr tic ev se en Pe rv tiv ri ic od e es on se rv ta ic lt es re at En m O do en ra do t ls nt Re u r al ge st tr or ry e at at iv m e en tr t ea tm en D en t tu re s O th er 400 350 300 250 200 150 100 50 0 4.7 Impact of Proposed Treatment on Number of Functional Teeth The total number of natural functional teeth for all people in this study was 4558 before treatment; the mean number of teeth for people waiting two to four months for a dental appointment (Group B) was 17.8, and 19.6 for those waiting two years or more (Group A). “Why is He Not Smiling?” Dental Costs Study Phase One Final Report Health Issues Centre, August 2008 61 The dental plans proposed a total of 292 extractions (6.4%) and 881 fillings (19.3%; [see Table 4.13 and Figure 4.6]). After the proposed extractions the mean number of natural functional teeth will be 14.6 for those in Group A and 12.8 for those in Group B. Table 4.13: Number of natural functional teeth after proposed treatment Total natural functional teeth present Total proposed extractions Total proposed restorations Total proposed teeth treated Group A Group B Waiting > 2 years Waiting 2-4 months n (%) n (%) 2507 (100.0) All n (%) 2051 (100.0) 4558 (100.0) 122 (4.9) 170 (8.3) 292 (6.4) 483 (19.3) 398 (19.4) 881 (19.3) 605 (24.1) 568 (27.7) 1173 (25.7) Total teeth proposed untreated 1902 (75.9) 1483 (72.3) 3385 (74.3) Mean number natural functional teeth before proposed treatment 19.6 17.8 18.8 Mean number natural functional teeth after proposed treatment 14.6 12.8 13.8 Figure 4.6: Proposed treatment plans for teeth by percentage of natural teeth for each group 80 70 60 50 A Waiting >2yrs % 40 B Waiting 2-4 mths All 30 20 10 0 Extractions 4.8 Restorations Untreated Key findings • • • • • People in the shorter-waiting Group B were significantly younger than those who had waited two years or more in Group A. Group B had fewer natural teeth and reported more symptoms than those in Group A. The proportion and costs for proposed dental treatment were different for those in Group B compared with those in Group A. The proposed dental plans for Group B included more extractions and fillings than those in Group A. The proposed dental plans for Group A included more root canal therapy and treatment for gum disease than for Group B. “Why is He Not Smiling?” Dental Costs Study Phase One Final Report Health Issues Centre, August 2008 62 • • If the proposed treatment proceeds as intended the mean number of natural teeth will reduce from 17.8 to 12.8 in Group B and from 19.6 to 14.6 in Group A. The average cost of proposed treatment for Group B was $23.66 lower than for Group A ($912.22 compared with $935.88). This difference was statistically significant but considered to be not financially significant. “Why is He Not Smiling?” Dental Costs Study Phase One Final Report Health Issues Centre, August 2008 63 5. QUALITATIVE DATA FROM THE QUESTIONNAIRE Overview During the face-to-face interviews, in addition to noting the rating scales, the research assistants were encouraged to record all additional responses. These descriptive data were recorded as either verbatim accounts or as narrative summaries of the stories told to them. Of the 246 people who participated in the study, 115 explained or expanded their responses. This additional information was transcribed electronically, coded and categorised. The analysis provided additional insight into people’s experiences of oral health problems. About one in seven people in the study rated their health as fair or poor compared with others of the same age. Chronic health problems were common among people who provided narrative accounts to the interviews. Many of these chronic conditions were linked to oral health problems directly or indirectly by study participants. This supports current literature linking oral health to general health (see Chapter 1). Participants described how their poor oral health impacted upon their daily lives—avoiding main meals, not eating properly and taking pain killers regularly. More than one in four people in the study frequently felt self-conscious about their oral condition. Some said they avoided smiling because they were embarrassed about the look of their teeth and some were constantly aware of their mouth odour. People who smoked found it hard to quit smoking because of stress from dental pain. Problems with mouth or teeth had impact on self-esteem; some participants reported they were unable to find employment because of their oral health conditions. Some participants described how their social activities were limited because of the embarrassment associated with eating problems or bad breath. These include going out and being intimate with partners. Cost of treatment (co-payment) was a major barrier to using public dental services; several stories were told about the financial hardship people experienced as they sought dental care. The lengthy wait for an appointment was another major problem. People also described the problems they found when using public dental services and their disappointment with them. Some did not understand the waiting list system, or that their cultural needs—such as a requirement to see female dentist—could not be met. Many participants reported bad experiences with public emergency services, including poor responses to patients’ telephone calls and long waiting times. Because of these barriers and bad experiences, people reported seeking dental services outside the public system and even overseas. Those who saw private dentists faced significant cost consequences. Some who had sought treatment from overseas or from local, unregistered dental practitioners did not have a proper treatment and subsequently returned to the public system. The rest of this chapter provides fuller descriptive information and analysis of the above. “Why is He Not Smiling?” Dental Costs Study Phase One Final Report Health Issues Centre, August 2008 64 I am a diabetic. I have four teeth left only. I have been on baby foods for most of the time. I grind everything before I eat. I used to miss a dental appointment because of family problems and the next appointment took some five years. I don’t enjoy eating—with no teeth you can’t eat much. I tried to get used to it. …Smell is a real problem for me. …When you have no teeth, you have no life on your face. …You can’t smile, it looks dangerous. People used to ask “why is he not smiling?” (46-year-old man, waiting more than two years for a dental appointment) 5.1 Oral Health and General Health About one in seven people in the study said their general health was fair or poor compared with others of the same age. Despite this, many people mentioned some type of chronic health condition at some time during the interview. Most commonly, diabetes, heart disease and arthritis were mentioned. One person had had a liver transplant, and others were recovering from surgery. Overall, the responses suggest that chronic ill-health is seen as ‘normal’ among the public dental clinic population. People linked their poor general health to their oral health in three ways. It either directly, or indirectly, affected their oral health, or oral health was seen in the context of poor general health. A reported, direct link between oral health and general health was apparent in a number of comments. For example, an 80-year-old man said his kidney stones, prostate and urinary difficulties upset his stomach. This made his tongue cracked and painful and caused a constant sour taste in his mouth. Others related their weight problems to poor oral health because they could not eat properly: I opt for processed food only. I have gained weight due to lacking of proper food. One of the research assistants noted: A middle-aged woman feels she is underweight. She cannot eat well because of dental problems. She has sepsis in her nostrils, constant pain in her neck and ears because of dental problems. She is seeing four doctors including a psychiatrist at the moment. She feels that every day her health is being deteriorated because of the lack of nutrition. She has multiple problems but dental health remains a major one. Some participants reported a direct link between their poor oral health and their mental health, such as experiences of psychological stress due to recurring pain and discomfort. Others felt anxious due to their embarrassment caused by eating difficulties or from concerns about more tooth loss. According to the research assistant’s notes: “Why is He Not Smiling?” Dental Costs Study Phase One Final Report Health Issues Centre, August 2008 65 A 40-year-old woman felt very down and stressed about her dental health situation. She felt embarrassed about her teeth. She felt her face has changed its shape, and that she is prematurely ageing psychologically and physically, due to dental health. She had no back teeth, her front teeth ache from chewing. She did not like eating in public. The indirect link between poor general health and oral health was from poor health impeding access to dental health services. For example, two people with chronic back pain reported problems caused by prolonged sitting, which they associated with the extended waiting times at the dental clinic. The third link between oral health and general health is the influence they have on each other. People judge the state of their oral health in the context of other health problems. Those who live with ongoing health problems tend to think less about their oral health conditions. For example, one research assistant noted: A former spray painter has had multiple chronic health problems. He has had throat cancer, is on medication for cardio-vascular diseases, and has asthma that has caused him to be hospitalised three times and many other conditions such as various stones and cysts. He has only a couple of front teeth left to use for chewing, “like a rabbit”, he said. He considers his teeth the least of his worries. 5.2 Oral Health and Quality of Life 5.2.1 Daily Problems Difficulty eating Over 40% of people who took part in the study reported that in the previous four weeks they found it uncomfortable to eat either fairly often or very often. Many people gave details about their poor eating experiences. Interrupted meals are common and many avoid hot or cold foods. People who find it uncomfortable to eat cope by eating slowly, eating only soft food, avoiding foods that cause pain, pureeing all meals, eating prepared baby food or even skipping meals. One man said: I have stopped eating lunch at work to avoid tooth pain. Pain and psychological impacts Problems with eating can have a psychological impact: I’m less satisfied with life when food comes to my mouth. I actually got sick of eating. Pain is a major problem. People in the study described a number of strategies they used to manage pain and dental sensitivity. They cleaned their teeth more often, cleaned their teeth more thoroughly, used dental floss several times throughout the day, rinsed regularly with salted water or commercial mouthwash, bought gel or drops from chemist shops, or used either a cold or warm pack. About one in six people used over-the-counter pain killers to manage pain caused by their dental problems fairly often or very often. Some took them daily: “Why is He Not Smiling?” Dental Costs Study Phase One Final Report Health Issues Centre, August 2008 66 Panadol are my “lollies”. I do get the pain every day. Others reported using alternative remedies to reduce pain. To numb teeth, people used a wide range of substances including oil of cloves, Chinese medicine, olive oil, ginger, herbal teas (rosemary, thyme and chamomile), alcohol such as brandy or Greek whisky used as a mouth-rinse, and Turkish cologne. When nothing works they put up with the pain. Although few participants reported smoking to cope with dental pain occasionally to very often (6.7%), some found that pain made it difficult to quit smoking. For example, a 51-year-old man said he gave up smoking four years ago but that he wanted to smoke again because of dental pain and depression. An older man from Italy said: You don’t smoke to manage pain but when it is painful you become upset and then you feel like smoking. 5.2.2 Employment About one in 10 people in the workforce felt that problems with their oral health affected their employment prospects either fairly often or very often. Two main reasons were evident in people’s responses—the impact of pain and poor selfesteem. One woman said it was hard for her to look for work when she was in pain. A 37-year-old former social worker said she had to fix her teeth before looking for a job. She could not deal with people face-to-face because of her bad breath. A middle-aged man said: It’s all about confidence. When I talk to people I am not confident because of my dental problems. I am not working because my selfesteem goes down. 5.2.3 Social Life The questionnaire included questions about social aspects of life, including selfconsciousness and intimacy. These received extensive responses from study participants. More than a quarter of people in the study reported feeling selfconscious either fairly often or very often in the past four weeks because of their poor oral health. This seems to occur especially when they talked or smiled because of the condition of their teeth or mouth odour. A 64-year-old man from Malta said he even avoided smiling, feeling embarrassed all the time. Others said: Even little kids notice I have a hole in my teeth. You are subconsciously aware of the odour of your mouth. For some people social activities were limited because of embarrassment due to eating problems. Two women, aged 37 and 73, both said they made excuses to avoid going out if eating was involved. Another participant, a middle-aged man, said he was very uncomfortable sharing foods with others as he had to wait for everything to cool down before he could eat, as a consequence his social life suffered. More than one in 10 people said their poor health caused problems with intimacy fairly often or very often. This was largely due to bad breath and pain. One 70year-old man commented that he felt bad when his wife complained of his bad “Why is He Not Smiling?” Dental Costs Study Phase One Final Report Health Issues Centre, August 2008 67 breath, while a 50-year-old woman would not let anyone to touch her face or jaw because it was too painful. One woman in her thirties said: I have avoided intimacy completely. The following narrative from a research assistant recounts the story of a young woman and highlights the impact of oral health problems on several aspects of her life: A 29-year-old process worker had [a] chipped tooth and severe pain. She did ring the emergency service but the line was busy. She resorted to private dentists for emergency. She said it cost her so much money. The chipped tooth has caused pain for three to four months and has got worse in the last four weeks. She has lost seven kilograms since she has to stop eating meat and hard fruits and veggies. She has her meals interrupted three or four times each time she eats. She said her daily routine is destroyed by pain. She has difficulty sleeping every night due to pain. She takes Panadeine Forte up to four times a day. She said she is “not in the mood for an outing”. 5.3 Barriers to Public Dental Services 5.3.1 Costs In Victoria public dental patients pay an $88 co-payment for the course of their treatment in instalments—$22 is paid at the first appointment. In the study, this initial co-payment was waived for those who had waited more than two years but not for those who had joined the waiting list in the previous four months. We found that the initial co-payment was sufficient to deter some people from seeking treatment. Ten of the 62 people who returned the non-participation survey (16%) said they did not take part in the study because they could not afford to see the dentist at the pubic clinic (see Chapter 6). Some of the participants who provided extensive responses to the interview raised the co-payment as an important consideration for them. For example, one young woman wanted to reschedule her appointment to see the dentist because she was not able to make the co-payment on that day. Other comments relating to the costs of treatment concerned the family budget. It is apparent that there are competing demands for family resources and money for dental treatment must come from other areas of need: I can’t afford to look after my teeth when I have two children and my husband is not working. We pensioners can’t bear both our expenses and health care costs. When we have to pay a dentist for emergency treatment, we have less money to buy food. When I talk to other people of my age and my situation, all of them have the same problems. 5.3.2 Waiting Time The waiting time for a dental appointment was an important reason for delayed dental treatment for more than half the people in the study. It affected people by causing frustration, extending the period of suffering and contributing to their “Why is He Not Smiling?” Dental Costs Study Phase One Final Report Health Issues Centre, August 2008 68 deteriorating oral health. One man reported that he had been on waiting lists in South Australia and Victoria for 10 years and that his teeth had become considerably worse over that time. He now had many cavities and was experiencing pain. Another possible consequence of an extended waiting time is that it becomes an expected part of the system of dental care. This in turn can influence people’s decisions and expectations of the dental health system. The focus of the service shifts from preventive care to therapeutic treatment, although that is not what people want. One said: I have wanted to use dental service due to pain but I hesitated because of long waiting time, and I’m not sure if I would be seen. A research assistant noted that: [This gentleman] just puts up with his problems. Once or twice a day, glue for his dental plate wears off and he has problems eating and swallowing. He thinks there are people worse off than him so he didn’t come back for check up. A participant suggested that: Waiting time should be reduced, so that people can have regular, maybe yearly, dental check-ups. 5.3.3 Service Problems Although only a small proportion of participants said that problems with the manner of health professionals (3.7%) or other staff members (4.9%) were reasons for not seeing a dentist, several people gave accounts of poor experiences with public dental services. Complaints about staff and communication issues meant people felt un-informed, misinformed or simply did not know what to expect. For example, a 33-year-old woman felt she had been on the waiting list for a long time but when she called to see how much longer she had to wait she was told that she was not on their list. As a result of the confusion, she took out a loan to get her teeth fixed privately: When you go on a waiting list you don’t get a receipt or even any written confirmation of going on the list, so you can’t prove you had been waiting. One elderly man with a non-English speaking background spoke of problems with conflicting information. He reported that initially the receptionist told him he was eligible for services, yet when he attended the clinic, he was told he was in another area and not eligible. He found this very frustrating and went to the dental hospital instead. Some participants reported they did not know that public dental health services were available to them. They had endured pain because they could not afford the cost of private dentists, borrowed money to see private dentists or gave up—only seeking treatment when told about the public clinic. This seemed particularly true of recent refugees, as a research assistant noted: “Why is He Not Smiling?” Dental Costs Study Phase One Final Report Health Issues Centre, August 2008 69 [This woman] started to notice one of front teeth becoming discoloured four years ago. Costs of private dental service prevented her from seeking treatment. She didn’t know that public dental was available. A friend told her about it and she made an appointment in 2005. A challenge for public dental services is to meet the needs of clients from culturally and linguistically diverse (CALD) backgrounds. Over 70% of participants in the study were born overseas, and although health interpreter services are available, most CALD participants who needed language assistance brought a family member to act as their interpreter. This raises a number of issues, from the quality of the information exchange between the service and clients to the reasons for the reluctance to use professional interpreters. (This issue was not explored further in the study.) The study also reveals another culturally specific need that deterred people from seeking treatment—the availability of services from specific genders. A 48-year-old woman from Lebanon said: As a Muslim, I can only see female dentists. Sometimes a female dentist is not available I have to forgo my appointment. 5.3.4 Emergency Service Participants also identified problems they experienced with dental emergency services generally. Frequently mentioned were the problems with access to services and waiting times. People were frustrated by slow responses and unanswered telephone calls. One woman reported problems getting an appointment with an emergency service. Another said he was denied access to the service because his perception of ‘emergency’ was different to that of the service: Unless you are about to die with pain, they won’t consider you an “emergency”. Some people reported waiting for two hours or longer at an emergency service before seeing a dentist. Some were told to come back in a few days. Even people who would be expected to be familiar with the system, such as an ex-dental nurse, reported poor experiences: I sat and waited, but didn’t actually see someone. I did this twice. Finally I went home and took painkillers. 5.4 The Consequences The barriers to public dental clinics and the urgency of oral health conditions forced many people to seek dental treatment elsewhere. Many reported seeing dentists in private practice, or dental technicians, because there was no other choice. A few reported poor treatment and service quality from private dentists. For example, an elderly woman reported severe pain from her denture, which kept breaking despite several appointments with a private dental technician. An elderly man from Tunisia said he felt intimidated by private dentists because they insisted that he return every three months. For recent immigrants the financial consequence of private dental treatment can be severe. A 28-year-old mother from Lebanon, speaking through her sister as interpreter, was distressed and related the following story: “Why is He Not Smiling?” Dental Costs Study Phase One Final Report Health Issues Centre, August 2008 70 She came to Dianella three months ago for an emergency treatment, because she had very bad tooth pain. She was told she had to wait for a few days for treatment. She couldn’t wait because the pain was just too much, and went to have treatment with private practice. It was for root canal and was very expensive. Her family had to borrow money for it. She feels traumatised by the expense and she is now paying back the money. She still has problems with her teeth, a gap where foods always get in. She is very afraid of what the dentist might find with her teeth. (Research assistant’s notes) A small number of people in the study reported seeking dental treatment in their country of origin when they returned for other reasons. They acknowledged that while the service was cheaper, the treatment quality was generally poor, and they needed more care in Australia. One 65-year-old immigrant had seen an unregistered dentist in Melbourne but did not go back when he became concerned about risks to his health. Some people told of losing teeth because treatment from the public dental services was not timely and they could not afford private dentists. For example, one 70year-old man from Malta pulled his own teeth over the years. He only had one top tooth left, and his bottom teeth were loose. Another participant, a 37-year-old medical receptionist, said that she had to wait for her tooth to fall out because she could not see a dentist. Epilogue I think it’s not fair for old people…to make them wait for so long on the waiting list. If they should at least get one appointment quickly for the first time, dentist can do a general examination. Then they can put us on the waiting list for treatment. I am given this appointment after waiting for six years. I was left alone to worry about my dental health for so long. I wish I could have a general examination and got the idea if there was anything wrong to worry about. (67 year-old man, a former accountant) 5.5 Key Issues • The extended delay for dental visits had a number of important consequences for both the dental service and those receiving care. People in this study told us they were suffering, and disappointed with the dental health system. • Poor oral health can affect both physical and mental health and quality of life. Many of those waiting for dental treatment sought different ways to manage their conditions. • Findings from the descriptive data suggest some ways that the experience of waiting for dental treatment can be improved. These included: o o Improved information about the public dental service and the alternatives. A booking system that allows people to track their position on the waiting list. “Why is He Not Smiling?” Dental Costs Study Phase One Final Report Health Issues Centre, August 2008 71 o o o o More information about dental vouchers and interpreter services so people can use them more effectively. Communication skills training for staff working with people from diverse cultural and linguistic backgrounds. An evaluation of the current triage system. Investigation into the effective use of dental health professionals other than dentists—such as dental hygienists, dental therapists and dental nurse practitioners—to maximise the dental health workforce. “Why is He Not Smiling?” Dental Costs Study Phase One Final Report Health Issues Centre, August 2008 72 “Why is He Not Smiling?” Dental Costs Study Phase One Final Report Health Issues Centre, August 2008 73 6. NON-PARTICIPANT SURVEY Overview We wanted to know more about why people did not want to take part in the study, so we included a non-participant questionnaire in the information about the study sent out to potential participants. Sixty-two people returned the questionnaire, citing either a single reason or a combination of reasons for not taking part. Several reasons people gave related to participating in the study itself but others related to problems with accessing public dental services. Lack of time, poor health and the costs of seeing a dentist were the three reasons most frequently identified by people who returned the questionnaire. Lack of time was a reason for non-participation for people who were carers of family members and for people who also reported that they now worked, although it was not clear whether working meant that they were still eligible for public dental services. Illness and physical limitations were also reasons given by people who chose not to participate in the study. Cost was seen as a barrier to accessing public dental services, and was nominated as a reason for not taking part, by one in five of those who returned the survey. Some people who had just joined the waiting list could not afford the co-payment and hence decided not to accept an early appointment offered in the study. It appeared that literacy was another factor contributing to poor responses to the study recruitment (and possibly to responses to all correspondence from the Dental Service). People from culturally and linguistically diverse backgrounds, as well as English-speaking backgrounds, reported they found the document sent to them too much to read or they did not understand it. The rest of the chapter provides descriptive information and analysis of the above. 6.1 Survey Method In the recruitment phase information about the study was sent to people on the dental waiting list. This information included a non-participant questionnaire with a reply-paid envelope (see Appendix 7). The questionnaire contained a single question asking people why they did not want to take part in the study. There were 10 fixed responses with tick-boxes and space for an open-ended response. More than one answer could be given. People were asked not to identify themselves and to return the completed questionnaire in the envelope provided. 6.2 Responses Sixty-two (62) people returned a completed questionnaire (28.4% of those who did not make a dental appointment). Table 6.1 shows the distribution of responses to the fixed reasons in the questionnaire. “Why is He Not Smiling?” Dental Costs Study Phase One Final Report Health Issues Centre, August 2008 74 Of these 62 people, 44 cited a single reason (71%), with or without further explanations. The remaining 18 people gave a combination of reasons for not participating. Table 6.1 shows a comparison of responses by those who gave a single reason for not taking part in the study, and all the reasons given. Four additional single reasons were given by respondents who gave a single reason only: cultural reasons; old age; disappointment with the system; confusion with the information about the study. Table 6.1: Reasons for not taking part All Responses (N=62) n (%) Single response (N= 44) n (%) I haven't time to take part 26 (41.9) 17 (38.6) I am too sick 15 (24.2) 9 (20.5) I can't afford to see the dentist 12 (19.4) 4 (9.1) It is too much bother 7 (11.3) 1 (2.3) I am working now 7 (11.3) 2 (4.5) There is too much to read 6 (9.7) 3 (6.8) It is too hard to get to the dental clinic 5 (8.1) 0 (0) I don't need to see a dentist anymore 4 (6.5) 4 (9.1) I don't like seeing the dentist 3 (4.8) 0 (0) Costs of transport concerns me 3 (4.8) 0 (0) 0 (0) 4 (9.1) Reasons Other reasons (cultural reasons, old age, disappointment with system, confusion with information about the study) 6.3 Why People Did Not Take Part Several of the reasons people gave for not participating related to the study but others related to problems with accessing dental treatment. It was not always clear whether their responses distinguished between these two issues. 6.3.1 Lack of Time Lack of time was the most frequently given reason for not taking part in the study (41.9% of all respondents), and the most common single reason (38.6%). One person also indicated that “I am working now” and four others gave multiple reasons (more than two). Six people described caring for family members as the reason they had no time—caring for small children, grandchildren, sick husband and aged mother. Five people added additional information. One said: I am a full-time carer for my husband and therefore unable to take part. Thank you for asking me. I had an emergency treatment approximately one and a half months ago. “Why is He Not Smiling?” Dental Costs Study Phase One Final Report Health Issues Centre, August 2008 75 6.3.2 Ill-health Being too sick was the next most frequently given reason for not taking part (24.2%). Nine people indicated ill-health as the only reason for their nonparticipation, while another six gave a combination of reasons. The additional comments for this group included: I am getting over a prostate operation which hasn't been overly successful as yet. I have a bad back and suffer with arthritis and find it very difficult to get around. This lady is now suffering with a form of memory loss and it would not be in her interest and Dianella's interest to take part in dental survey. 6.3.3 Costs of Seeing Dentists Information sent to potential participants included details of the co-payment required. People who had been on the waiting list for at least two years were told the first co-payment of $22 would be waived; despite this, however, cost appeared to remain an important barrier to care. The cost of dental care was given as a reason for not taking part in the study by nearly one in five of those who returned the non-participant questionnaire (19.4%). Four people said they “can’t afford to see the dentist” as the only reason. The remaining eight people gave cost as one of multiple reasons for not taking part. Costs, compounded with waiting time for dental services, led to the following responses: Cannot afford it. At my age, you are waiting for me to die before you give me any assistance. I've been on waiting list for five years and now still not ready. Shame on you and the government who run this. I was told I need a crown and the dental clinics don't do crowns. At the cost of $1,000, I can't afford that. Thank you very much anyway. 6.3.4 Too Much Bother Seven people (11.3%) indicated that “it was too much bother” to take part in the study. It was the only reason given by one person. Further understanding of just how participation was a bother is seen in their additional comments and the other reasons they gave. One person referred to waiting time and costs. Another, who also identified “too much to read”, said they had a limited command of English and a third wrote: Due to age-related disabilities – I am legally blind. 6.3.5 I am Working Now Seven people (11.3%) said they did not want to take part as they are now working. Most of these (5) also said that they had no time but two gave it as the only reason. It was not clear whether working meant that they were no longer eligible for a Healthcare Card—and so not eligible for public dental service—but this could not be verified. “Why is He Not Smiling?” Dental Costs Study Phase One Final Report Health Issues Centre, August 2008 76 6.3.6 Too Much To Read Six people indicated that there was too much to read in order to be involved in the study, with two of these identifying this as the only reason. One wrote: I haven’t got enough English. This person also returned a completed consent form, demonstrating that the instructions for participation were not understood. Speaking and writing English was also identified as a problem for two other people. One said he or she needed a translator due to limited English. Three others did not check the box “too much to read” but added comments about their problems reading and speaking English. Other comments also suggested low levels of English literacy. 6.3.7 Too Hard to Get to the Dental Clinic Five people (8.1%) identified access to the dental clinic as one of multiple reasons for not taking part in the study. Other reasons given by this group included: being too sick; costs of transportation; too much bother; costs of seeing dentists; and not liking to see dentists. One added another reason about transport to the clinic: I live in Kilmore. I do not drive. 6.3.8 No Need to See the Dentist Anymore Four people (6.5%) indicated that they did not need to see a dentist anymore as their only reason for not taking part in the study. Three of these provided further details. One had been to another community dentist after waiting for some time, another now had mostly false teeth, and the third said: I am paraplegic and confined to a wheel chair, so I find it almost impossible to find transport to attend there for study. A comment from a fifth person also suggested that no further need to see a dentist influenced their decision not to participate: …Thank you for asking me. I had an emergency treatment approx. one and a half months ago. 6.3.9 Other Reasons Four people included open-ended responses in reasons for not taking part. identified a cultural issue: One Unable to take part because at that time I'll be fasting for the month of Ramadan. Two others gave their age as the reason for not taking part (age-related reasons were discussed earlier). One of these also cited poor health as a factor. Three responses expressed disappointment with the dental health system. person gave this as the only reason for not participating in the study: “Why is He Not Smiling?” Dental Costs Study Phase One Final Report Health Issues Centre, August 2008 One 77 I have been on the waiting list for 3 to 4 years; I am very disappointed that I have to wait such a long time to have a check-up. Quite frankly I think this system is not fair. Two others gave additional reasons but described their disappointment with some degree of anger. One said: Daylight robbery. Pensioners can't afford. Worked for 50 years, paid tax, in return I get zero. Shame on government to treat me like this. Been on waiting list for five years and now I get this silly invitation for nothing. The other response showed a misunderstanding about the study, as they evidently thought they would have to pay to be involved: The study should be for free. This will encourage me to participate. 6.4 Key Issues Responses to the non-participation question are likely to reflect the opinions of other public dental patients in the catchment area. Some key issues that emerged in the non-participant survey are: • Literacy appears to be an issue that affected people’s decision to take part in the study. • People felt they did not have time to take part in the study, particularly those with a carer role. • Poor general health affected participation in the study and appeared to be a barrier to accessing dental care. The cost of dental treatment was a reason people gave for not taking part in the study and for not using public dental services. “Why is He Not Smiling?” Dental Costs Study Phase One Final Report Health Issues Centre, August 2008 78 “Why is He Not Smiling?” Dental Costs Study Phase One Final Report Health Issues Centre, August 2008 79 7. DISCUSSION AND CONCLUSION This is the first comprehensive study of the comparative costs of public dental treatment of its type in Victoria that we have been able to identify. The study involved people on the public dental waiting list at a Victorian community health centre. As noted earlier, although every effort was made to minimise bias where possible, there was undoubtedly some bias in each study group given the low response rate, although this rate was initially comparable to the usual response to offers of dental treatment (around 40%). The addition of telephone follow-up increased the average response rate to 48%, which is higher than the usual response to clinic offers of treatment. We found the two groups in the study differed significantly in terms of age but no other significant demographic differences were identified. This age difference was an important finding in itself; it has affected some of the comparisons made between the two groups in the study. 7.1 Key Findings Taking into account its relative strengths and limitations, this study offers several important findings. 7.1.1 Cost of Dental Care The primary aim of this study was to investigate the costs to the system of delayed dental treatment for people who use a public dental clinic. The major finding was that the mean proposed costs for dental treatment were slightly lower for the shorter-waiting group compared with those in the longer-waiting group ($912.22 compared with $935.88). Although this difference is statistically significant, it is not significant financially. The costs of proposed dental treatment for people in the study ranged from $46 to more than $4,000, with an average of $924.31. This average cost is higher than expected, and more than three times higher than the average actual cost of general dental treatment per course of care for Victorian public patients in 2006–2007 of about $272,11 and more than twice higher than that of $406 per public patient using dental vouchers. Nearly 80% of people in the study had their proposed treatment costs greater than the state average. There are several possible reasons for this difference. For this stage of the project, the average costs in this study were calculated from proposed treatment plans, not the actual treatment. Actual treatment may differ from the initial plan for a number of reasons. A course of dental treatment generally occurs over a period of about six months. In that time a patient’s oral health status may worsen and proposed restorative treatments may be replaced by teeth extractions, which are cheaper. People may not return for their full course of treatment because of similar barriers to dental care identified in this study, such as poor general health and other demands on time. People in Group A may have attended for emergency visits for 11 The 2006-2007 figure from Clinical Analysis and Evaluation, DHSV. As with the study’s average, it does not include dental voucher and emergency services. “Why is He Not Smiling?” Dental Costs Study Phase One Final Report Health Issues Centre, August 2008 80 dental extractions while waiting for an appointment with the public dental clinic. Forty per cent of participants reported having visited the dentist in the last 12 months; 57% of which were for emergency visits. The cost associated with emergency visits was not able to be included in this study. The study would have been strengthened with such data, and there is a strong case to conduct this larger study. The difference between proposed costs of dental treatment for people in this study and the average amount actually spent on public dental patients in Victoria raises concern about whether public dental patients receive all the dental treatment they need. Further, it is already known from the literature that the public dental system relies more on emergency care (reflected in larger proportions of patients receiving extractions) and less on preventive and maintenance services, than private practice (Brennan, Luzzi et al. 2008). Hence the average cost to the system per course of care for emergency and general care combined, in 2006–2007, was only $97 per public patient in Victoria, whereas that for general care only (including restorative and prosthetic treatment) was $272 (Whelan 2008). This appears far from best practice, and we are certain that both consumers and clinicians would wish for a healthier balance. 7.1.2 Distribution of Costs and Types of Treatment Differences in the proposed costs between the two groups were apparent in all types of treatment apart from preventive care. The average cost for the proposed treatment among the longer-waiting Group A was higher for diagnostic services, periodontal, endodontic, restorative treatments, and dentures. Costs for oral surgery (extractions) and other services—mainly interpreter services—were higher for the shorter-waiting Group B. This suggests that moderate needs. services), there is treatment, such as people initially seeking dental care have more acute yet more After two years of waiting (and the use of emergency dental less need for acute care, but greater need for more complex endodontic, restorative, periodontal and dentures. This study found that, overall, only 8% of all proposed treatment costs were allocated to preventive care, which includes procedures such as plaque removal, fluoride treatment and oral hygiene instruction. The smallest proportion of costs (2%) was attributed to the proposed management of periodontal disease, despite a prevalence of advanced periodontal disease of 22.2% and evidence of calculus in 61.2% of participants. More than one-third of all proposed costs were for fillings or restorative treatment (37.7%), and nearly a quarter of proposed costs were for dentures. The proposed services were typically of a more acute nature, reflecting a reasonable clinical response to the high level of need. However, the relatively low amount of preventive work proposed—an average of only one to two preventive procedures per patient—suggests there is little emphasis on, or the service capacity for, a preventive or population health approach. 7.1.3 Overall Oral Health Status Three findings about oral health status are particularly important. First, a high proportion of people in the study had a number of indicators of poor oral health. Compared with the results of the National Survey of Adult Oral Health (NSAOH; 2004–2006) (Spencer & Harford 2007a) more adults in this study had: “Why is He Not Smiling?” Dental Costs Study Phase One Final Report Health Issues Centre, August 2008 81 • Inadequate dentition—20 or fewer natural functional teeth (51% DCS vs 11% NSAOH). • High levels of gum disease—severe gum disease (22.2% vs 2.4%) and moderate gum disease (53.6% vs 20.5%; Roberts-Thomson & Do 2007). The evidence of tooth loss among the study population was high, and, unexpectedly, was higher among Group B, who more recently joined the waiting list. The average number of natural functional teeth for all people in the study was 18.5 at their first dental visit; fewer than the minimal 20 teeth considered to be essential for optimum chewing efficiency and dietary intake (Sheiham & Steele 2001) and for good oral health in adults (AIHW 2006a). This average would fall to approximately 14 if all extractions proposed in the dental treatment plans were to occur. More extractions were proposed for people in the shorter-waiting Group B than the longer-waiting Group A. Given the low number of natural teeth in both groups, further tooth loss increases the need for dentures and may adversely affect dietary intake. It should also be remembered that current treatment plans included dentures, which accounted for almost a quarter of all proposed treatment costs. Only nine, less than 4%, were found to have at least 20 natural functional teeth with all gums healthy. Just over half of all study participants had fewer than 21 natural teeth (51%) compared with 11.4% of Australian adults; more than one in five people showed evidence of advanced gum disease (periodontitis; 22.2%) and more than half had moderate gum disease (53.6%) compared with a prevalence of moderate or severe gum disease among Australian adults of 22.9% (RobertsThomson & Do 2007). Second, people join the waiting list with immediate dental care needs, not in anticipation of future treatment needs. This is important as the current system does not address this need, nor does it provide any assistance to help people manage their oral health while waiting for treatment. Immediate problems with dental health appear to prompt people to seek treatment by joining the waiting list. Over two-fifths (40%) of people in the study had visited a dentist during the 12 months preceding the study, compared with 59.4 per cent in the 2004–2006 National Survey of Adults Oral health (NSAOH; Spencer & Harford 2007). Third, a long waiting time for dental treatment changes the nature of dental care needs and people find ways to manage their acute needs either by accessing emergency treatment or through private dentists. These issues have long-term implications for both people’s oral and general health and to the structure of the dental health system. Many study participants had sought treatment elsewhere; for example, more than 28% used emergency dental services at either public or private providers in the past six months. Physical and psychological discomfort was common. The study revealed a considerable gap in dental care for this high needs population group. It provides an example of the inequities in health status and available health care in some population groups in Victoria. “Why is He Not Smiling?” Dental Costs Study Phase One Final Report Health Issues Centre, August 2008 82 7.1.4 Impact of Oral Health Status The impact of poor oral health on people in the study was considerable; it affected how people lived and how they felt about themselves, as the following quote shows: I am a diabetic. I have four teeth left only. I have been on baby foods for most of the time. I grind everything before I eat. I used to miss a dental appointment because of family problems and the next appointment took some five years. I don’t enjoy eating—with no teeth you can’t eat much. I tried to get used to it. …Smell is a real problem for me. …When you have no teeth, you have no life on your face. …You can’t smile, it looks dangerous. People used to ask, “why is he not smiling?” (46-year-old man, waiting more than two years for a dental appointment) A large proportion of participants reported problems with eating. This raises concern about the implications for nutrition and longer-term general health. Over 40% frequently found eating uncomfortable; a third regularly avoided cold foods and more than one in five people reported problems with their teeth or mouth that led to frequently interrupted meals or unsatisfactory diet. One in 12 bought special or different foods because of the difficulty they had eating. Eating was not the only aspect of life affected. Aching pain was often experienced by more than a quarter of people in the study, with nearly 10% often finding it difficult to sleep because of problems with their teeth or mouth. The findings of this study provide some evidence to show how poor oral health can affect nutrition intake and general health. Such outcomes are likely to create more demand in the wider health system and lead to additional health costs. The experience of poor oral health affected the quality of life among study participants in ways other than its adverse impact on eating. About one-quarter or more felt self-conscious, embarrassed or tense because of problems with their teeth, and one in seven felt their poor oral health affected their job prospects or personal relationships. 7.1.5 Health-seeking behaviour Another important finding was that study participants reported a high level of health-seeking behaviour. Most had seen their GP at least once in the previous six months (87%) with more than half of these reporting three or more visits in that time. Although people in the study generally rated their general health more highly than their oral health they clearly differentiated between them. The relationship between self-rating of health and health-seeking behaviour is not clear but this study allows some comparison of such behaviour in regard to dental and general health. The study shows that among this population, people reported regular access to medical services and that they rated their general health more highly than their oral health. Several studies have shown associations between poor oral health and poor general health in low-income populations (ADAVB 2004; Mason 2004; Spencer & Harford 2007b; NIDCR 2008) and oral diseases are known to complicate management of other diseases (Spencer & Harford 2007b). “Why is He Not Smiling?” Dental Costs Study Phase One Final Report Health Issues Centre, August 2008 83 While participants were not asked directly about their knowledge of oral health, it is difficult to identify possible information sources available to them. They are likely to need some education about how to maintain oral health. Models for health promotion interventions targeting oral health need to be developed to ensure effective implementation in public dental populations. 7.1.6 Low Response Rates to Offers of Treatment Initially the research team was surprised to learn that the majority of people (60%) offered dental treatment after two years on the waiting list do not make appointments (Raju 2006). On reflection, it was understandable given that changing personal circumstances and access to emergency dental care could affect responses. However, this explanation was challenged when those who had recently joined the waiting list (two to four months previously) responded at a similar rate. Telephone follow-up calls improved the response rate considerably—increasing to 49% of people approached who had waited for two years or longer, and 47% of those waiting two to four months. The response rate raised several questions: • Had people sought dental care elsewhere, either for emergency treatment or as a private patient—even those who had joined the waiting list within the last four months? This would be feasible, given the acute nature of people’s needs, as revealed by the dental examinations. • Was the co-payment cost a significant barrier to dental care for some people? • Were people too sick to worry about their oral health? • Was literacy a barrier to understanding the offers made by the service and by the study? • Had some people become ineligible for public dental care because they had found sufficient employment? • Were people no longer experiencing pain and so thought that dental treatment was no longer needed? In any case, the lack of difference in response rates between the two groups shows that within two to four months, half of those seeking care no longer wanted it or were unable to use it. The non-participant survey and feedback during the interviews showed that cost and general health were significant barriers to accessing dental care. Further, although this study suggests some answers to the above questions, relatively little is known about people using public dental services in terms of their motivations or circumstances. The study revealed a low level of literacy among the study population, which provides another highly feasible explanation for a poor response. “Why is He Not Smiling?” Dental Costs Study Phase One Final Report Health Issues Centre, August 2008 84 Recommendations The study revealed that this group of public dental patients had significant dental needs. Apart from the often repeated but still very important recommendation to significantly increase funding for public dental care, we make the following recommendations across the areas of policy development, public dental service practice, and further research. Policy development Public dental policy needs to promote a population health focus aimed at preventing avoidable tooth loss. It should include the following elements: early identification of need, early intervention, prevention and appropriate treatment. Specific issues need immediate short-term strategies: • Greater capacity to reduce the waiting list • Action to maximise oral health as people wait for dental treatment. • Develop and implement preventive care. • Promotion of health literacy in regard to dental care. workforce structures to provide effective Funding mechanisms are needed that facilitate effective triage, a population health approach, and that remove disadvantages to providing preventive care. Public dental service practice Public dental clinics need to create supportive environments that enable oral health practitioners to provide effective dental treatment and preventive care. Increase promotion of good dental health as part of good general health. To be relevant and effective, targeted strategies for disadvantaged communities need to be developed in partnership with those communities. There is an urgent need for the introduction and evaluation of interventions to help people preserve their teeth while waiting for dental treatment. This may include a preventive care appointment with dental hygienists. Strategies to improve the uptake of offers of dental treatment such as telephone calls need to be trialled and evaluated to find ways of improving responses to treatment offers. Further research More research is needed to investigate the costs related to public dental programs and the needs and experiences of clients to help reduce inequalities in access to dental care. This research could include: • An economic evaluation of the impact of oral health on other health outcomes. “Why is He Not Smiling?” Dental Costs Study Phase One Final Report Health Issues Centre, August 2008 85 • An economic evaluation of the costs of public dental care, which includes the costs of emergency and private dental care, should be conducted. • The Dental Cost Study should be repeated in other public dental clinic populations to compare findings across population and service groups. • A longitudinal study of Australian adults registered for public dental care, to explore motivating factors and barriers to attend services and other dental health-seeking behaviours. • A descriptive assessment of the socio-demographic characteristics, oral health literacy, attitudes and health behaviour knowledge and practices of people waiting for public dental care in Victoria. This should include an investigation of consumer attitudes and opinions towards public oral health services. • An investigation of the knowledge and use of dental vouchers among public dental patients, to determine how to improve the use and efficiency of vouchers in public dental care. • Comparison of actual dental treatment with the proposed treatment plan in Victorian public dental services, to determine differences in treatment and assess the usefulness of proposed treatment plans in estimating treatment costs. “Why is He Not Smiling?” Dental Costs Study Phase One Final Report Health Issues Centre, August 2008 86 “Why is He Not Smiling?” Dental Costs Study Phase One Final Report Health Issues Centre, August 2008 87 8. REFERENCES Australian Bureau of Statistics. (2007a). 2006 census tables: Australia. Retrieved May 15, 2008 from http://www.abs.gov.au/ausstats/[email protected]/mf/4828.0.55.001 Australian Bureau of Statistics. (2007b). Self-assessed health in Australia: A snapshot, 2004– 05. Retrieved May, 2008, from http://www.abs.gov.au/ausstats/[email protected]/mf/4828.0.55.001 Australian Dental Association Victorian Branch. (ADAVB). (2004). Looking beyond teeth: The link between overall health and oral health. Media Release, August 2004. Australian Health Ministers Advisory Council. (AHMAC) (2001). Steering Committee for National Planning for Oral Health. Oral health of Australians: National planning for oral health improvement: Final report. South Australian Department of Human Services, 2001. Australian Institute of Health and Welfare. (AIHW). (1999). Oral health of public dental patients. Australian Institute of Health and Welfare Dental Statistics and Research Unit Research Report December 1999. Adelaide: Australian Institute of Health and Welfare Dental Statistics and Research Unit. Australian Institute of Health and Welfare. (AIHW). (2001). Oral health and access to dental care: The gap between the 'deprived' and the 'privileged' in Australia. Australian Institute of Health and Welfare Dental Statistics and Research Unit Research Report March 2001. Adelaide: Australian Institute of Health and Welfare Dental Statistics and Research Unit. Australian Institute of Health and Welfare. (AIHW). (2002a). Caries experience of public dental patients. Australian Institute of Health and Welfare Dental Statistics and Research Unit Research Report No 10. Adelaide: Australian Institute of Health and Welfare Dental Statistics and Research Unit. Australian Institute of Health and Welfare. (AIHW). (2002b). Service patterns of public dental patients. Australian Institute of Health and Welfare Dental Statistics and Research Unit Research Report No 13. Adelaide: Australian Institute of Health and Welfare Dental Statistics and Research Unit. Australian Institute of Health and Welfare. (AIHW). (2005). Satisfaction with dental care. Research Report No 21. Adelaide: Australian Institute of Health and Welfare Dental Statistics and Research Unit. Australian Institute of Health and Welfare. (AIHW). (2006a). Australia's Health 2006. Canberra: Author. Australian Institute of Health and Welfare. (AIHW). (2006b). Social impact of oral conditions among Australian adults. Australian Institute of Health and Welfare Dental Statistics and Research Unit Research Report No 24. Adelaide: Australian Institute of Health and Welfare Dental Statistics and Research Unit.. Bahekar, A., Singh, S., Saha, S., Molnar, J., & Arora, R. (2007). The prevalence and incidence of coronary heart disease is significantly increased in periodontitis: A meta-analysis. American Heart Journal, 154, 830–837. Brennan, D. S., Spencer, A. J., Slade, G. D. (1977). Service provision among adult public dental service patients: Baseline data from the Commonwealth Dental Health Program. Australian and New Zealand Journal of Public Health 21(1), 40-44. Brennan, D. S., Spencer, A. J., & Slade, G. D. (2001). Prevalence of periodontal conditions among Australian public dental patients in Australia. Australian Dental Journal, 46(2), 114–121. Brennan, D. S., Luzzi, L., & Roberts-Thomson, K. F. (2008). Dental service patterns among private and public adult patients in Australia. BMC Health Services Research, 8(1). Retrieved from http://www.pubmedcentral.nih.gov/articlerender.fcgi?artid=2246120 Chen, M. S., & Hunter, P. (1996). Oral health and quality of life in New Zealand: A social perspective. Social Science and Medicine, 43(8), 1213–1222. Committee on Medical Aspects of Food and Nutrition Policy. (COMA). (1998). Nutritional aspect of the development of cancer. Department of Health Committee on Medical Aspects of Food and Nutrition Policy, report No. 48. London, Department of Health. “Why is He Not Smiling?” Dental Costs Study Phase One Final Report Health Issues Centre, August 2008 88 Department of Human Services. (DHS). (2007a). Dental health program waiting times project report. Melbourne: Victorian Government Department of Human Services. Department of Human Services. (DHS). (2007b). Improving Victoria's oral health. Melbourne: Victorian Government Department of Human Services. Dianella Community Health. (2006). 2005-2006 Dianella Community Health Annual Report and 2007 Calender. Melbourne: Author. Dianella Community Health. (2007a). Annual report and quality of care report. Melbourne: Author. Dianella Community Health. (2007b). Dianella community health service plan. Melbourne: Author. Harford, J., Ellershaw, A.. & Stewart, J. (2004). Access to dental care in Australia. Australian Dental Journal, 49(4), 206–208. Harford, J., & Spencer, A.J. (2007). 'Oral health perceptions' in Australia's dental generations: The national survey of adult oral health 2004–2006. Dental Statistics and Research Series. Canberra: Australian Institute of Health and Welfare. Heffernan, C. (2004). Dental treatment highly effective in helping welfare recipients gain employment. School of Dentistry, University of California San Francisco. Hume City Council, Dianella Community Health & Sunbury Community Health Centre. (2007). Hume City health snapshot. Book 2 of Municipal Public and Community Health Strategic Plan 2007-2012 for Hume City. Melbourne: Hume City Council. Irwin, C., Mullally, B., Ziada, H., Byrne, P. J., & Allen, E. (2008). Periodontics: 9. Periodontitis and systematic conditions - is there a link? Dental Update, 35(2), 92–101. Joshipura, H. J., Douglass, C. W., & Willett, W.C. (1998). Possible explanations for the tooth loss and cardiovascular disease relationship. Ann Periodontal, 31(1), 175–183. Joshipura, K. J., Ascherio, A., Manson, J. E., Stampfer, M. J., Rimm, E. B., & Speizer, F. E. (1999). Fruit and vegetable intake in relation to risk of ischemic stroke. Journal of the American Medical Association, 282(13), 1233–1239. Khaw, K. T., & Woodhouse, P. (1995). Interrelation of vitamin C, infection, haemostatic factors and cardiovascular disease. British Medical Journal, 310, 1559–1563. Krall, E., & Hayes, C. (1998). How dentition status and mastication function affect nutrient intake. Journal of American Dental Association, 129, 1261–1269. Landis, J. R., & Koch, G. G. (1977). The measurement of observer agreement for categorical data. Biometrics, 33, 159–174 Mason, J. (2004). Concepts in dental public health. Baltimore: Lippincott Williams and Wilkins. National Institute of Dental and Craniofacial Research. (NIDCR). (2008). Heart disease and oral health: Improving the nation's oral health. Author. Ness, A. R., Powles, J. W., & Khaw, K. T. (1996). Vitamin C and cardiovascular disease: A systematic review. Journal of Cardiovascular Risk, 3(6), 513–521. Oral Health Strategy Group. (1994). An oral health strategy for England. London: Department of Health. Raju, S. (2006). Personal communication D. Horey and C. Naksook. Melbourne. Roberts-Thomson, K., & Do, L. (2007). 'Oral health status' in Australia's dental generations: The national survey of adult oral health 2004-2006. Dental Statistics and Research Series. Canberra, Australian Institute of Health and Welfare. Sanders, A., Slade, G.D., Carter, K. D., & Stewart, J. F. (2004). Trends in prevalence of complete tooth loss among Australians, 1979-2002. Australian and New Zealand Journal of Public Health, 28(6), 549–554. Sanders, A., & Spencer, A. J. (2005). Why do poor adults rate their oral health poorly? Australian Dental Journal, 50(3), 161–67. Sanders, A., Spencer, A. J., & Slade, G. D. (2006). Evaluating the role of dental behaviour in oral health inequalities. Community Dentistry and Oral Epidemiology, 34, 71–79. Scopelianos, S. (2006). Dental waiting pain grows. Warnambool Standard. Sheiham, A., & Steele, J. (2001). Does the condition of the mouth and teeth affect the ability to eat certain foods, nutrient and dietary intake and nutritional status amongst older people? Public Health Nutrition, 4(3), 797–803. Slade, G. D. (1997). Derivation and validation of a short-form Oral Health Impact Profile. Community Dentistry and Oral Epidemiology, 25, 284–290. “Why is He Not Smiling?” Dental Costs Study Phase One Final Report Health Issues Centre, August 2008 89 Slade, G. D., & Spencer, A. J. (1994). Development and evaluation of the Oral Health Impact Profile. Community Dental Health, 11(1), 3–11. Slade, G. D., Spencer, A. J., & Roberts-Thomson, K. F. (Eds.). (2007). Australia's dental generations: The national survey of adult oral health 2004–2006. Dental Statistics and Research Series. Canberra: Australian Institute of Health and Welfare. Spencer, A. J., & Harford, J. (2007a). Dental care in Australia's dental generations: The national survey of adult oral health 2004–2006. Dental Statistics and Research Series. Canberra: Australian Institute of Health and Welfare. Spencer, A. J., & Harford, J. (2007b). Inequality in oral health in Australia. Symposium: Is it Time for a Universal Dental Scheme in Australia? Australian Review of Public Affairs. Steele, J. G., Sheiham, A. Marcenes, W. & Walls, A.W.G. (1998). National diet and nutrition survey: People aged 65 years or over. Vol 2. Report of the oral health survey. London, Stationary Office. Victorian Minister for Health. (2006). Dental waiting list cut by more than 150,000. Media Release. Walls, A. W. G., & Steele, J. G. (2001). Geriatric oral health issues in the United Kingdom. International Dental Journal, 51, 183–187. Whelan, M. (2008). Personal communication C. Naksook. Melbourne. World Health Organization. (WHO). (1964). Basel Documents (15th ed). Geneva: World Health Organization. Wright, F., & Satur, J. (2000). ‘No 1 Oral Health’ Evidence-based health promotion> Resources for Planning. Melbourne: Public Health Division, The Victorian Government Department of Human Services. “Why is He Not Smiling?” Dental Costs Study Phase One Final Report Health Issues Centre, August 2008 90 “Why is He Not Smiling?” Dental Costs Study Phase One Final Report Health Issues Centre, August 2008 91 9. APPENDICES APPENDIX ONE: STUDY PROTOCAL DENTAL COSTS STUDY BACKGROUND This study intends to investigate the impact of delayed dental treatment for users of public dental health clinics. These costs include the direct costs of dental treatment but also indirect health costs and social costs for those who await dental care. Australian adults eligible for public dental care have consistently shown lower levels of oral health compared to other Australian adults in studies based on self-report despite population trends of improved oral health (AIHW 2001, AIHW 2005, AIHW 2006). They also are more likely to rate their oral health as poor and to be dissatisfied with life (Sanders 2005). These self-perceptions of poor oral health are confirmed by clinical assessments of public dental patients that reveal a higher rate of extractions and emergency dental treatment compared to the Australian population (Brennan 1997, AIHW 1999, Brennan 2001, AIHW 10 2002, AIHW 13 2002). One of the main reasons attributed to the poor oral health of poorer Australians is because they are less likely to attend dentists regularly and more likely to attend when a problem exists than people from higher income groups (Chen 1996, Harford 2004, Sanders 2004). The pattern of dental attendance is the only dental self-care behaviour that differs between people with different socio-economic status (Sanders 2006, Chen 1996). While there is no evidence to support the practice of annual dental visits access to timely clinical examination is likely to be beneficial because it enables early detection or diagnosis, and the use of preventive interventions (Wright 2000). However, organisational barriers, such as extended waiting times, may limit the effectiveness of dental health services to provide timely care. Limited resources in the public sector have led to waiting times exceeding five years in some parts of Victoria (Scopelianos 2006). Extended waiting for dental visits could have a number of important consequences for both the dental service and those receiving care. First oral health is likely to deteriorate leading to a need for more extensive restorative treatment or even increasing the risk of tooth loss. Poor oral health can impact general health and also negatively affect quality of life in terms of its effect on social and employment relationships. Next, delayed treatment is likely to lead to greater demand for emergency dental services, thereby shifting costs from preventive to emergency treatments. Finally, there are likely to be increased costs to those waiting for dental treatment as they seek ways to manage oral condition. RATIONALE FOR THIS STUDY A search of the literature, including a handsearch of relevant Australian journals Australian Dental Journal and Australian and New Zealand Journal of Public Health) was unable to locate any study that has investigated the impact of delayed dental treatment for public dental patients, although a number of studies indicate that failure to seek timely dental care is an important contributor to poor oral health. “Why is He Not Smiling?” Dental Costs Study Phase One Final Report Health Issues Centre, August 2008 92 This study appears to be the first Australian study that will look at the effect of delaying treatment in terms of its costs, both financial and social. AIMS The primary aims of the study are to: • investigate the costs associated with a public dental care when dental treatment is delayed for two years; • investigate the social and other costs associated with an extended delay for public dental care; • identify potential measures to monitor the effective use of public dental health care. HYPOTHESES Extended time on a waiting list for public dental health care leads to delayed dental treatment that: a. increases the costs of dental treatment without tooth loss a. increases the risk of tooth loss b. increases the use of emergency dental services c. increases the impact on the quality of life due to poor oral health d. increases social costs in terms of health behaviours in nutrition, pain management, productivity and employment and social relationships e. increases the use of health services RESEARCH PLAN The study will involve two cohorts on a public dental waiting list who will be offered dental treatment. One group will comprise people who are eligible for dental treatment after a waiting period of approximately two years (control group) and the second group (intervention group) will comprise people who have been on the waiting list for two months only. (The intervention is the provision of dental treatment within three months.) Phase One: Comparison of costs of proposed dental treatment and estimated social costs In Phase One of the study both groups will undergo a dental health assessment and will have a dental treatment plan developed as part of usual care at the dental service. Data will be collected from the dental record, from a clinical assessment and through a structured face-to-face interview. Assessment of use of dental services among people eligible for control group De-identified data from all those eligible to be in the control group will be used to assess their use of emergency dental services and its potential impact on decisions to take up an offer of a dental appointment. Phase Two: Comparison of actual treatment costs and use of emergency dental services After twelve months dental records will be reviewed to determine the actual dental treatment and its costs. Analysis will include assessment of the pattern of attendance, influences on adherence to treatment plans, the use of emergency “Why is He Not Smiling?” Dental Costs Study Phase One Final Report Health Issues Centre, August 2008 93 dental services at the health centre and will evaluate the usefulness of an initial dental treatment plan as an economic assessment tool. PROCEDURE Timely Dental treatment a) Two to three hundred dental consecutive patients on the dental waiting list who are due to be offered dental appointments will be asked to take part in the study. Requests will be sent out in batches of 100 to ensure that clinic will be able to manage requests for appointments, until about 100 agree to take part. (Currently 30-40% of people on the waiting list offered a dental appointment make appointments.) People who are eligible for the control group will be sent a non-participant’s questionnaire with a replied paid envelope. People who agree to take part will have their initial co-payment waived. b) The first mail-out to potential members of the control group will also include 110 letters to the Intervention group, who will also be offered a dental appointment. This group will not have their first co-payment waived. c) All potential study participants will be sent an information sheet about the study and asked to make a dental appointment and arrive one hour ahead if they wish to take part in the study. They will called the day before their appointment (or on the previous Friday if a Monday appointment) as a reminder. d) A research assistant will meet with potential participants prior to their appointment to explain the study, its purpose and requirements, and address any concerns. Consenting patients will sign the informed consent document giving permission to access their dental records. e) A face-to-face structured interview will involve the administration of a question prior to the dental appointment, using an interpreter where necessary. f) Consenting patients in the control group will have the initial co-payment ($22) waived. g) Dentists will not have access to information about the study participants waiting list status Emergency dental treatment audit a) De-identified data from those eligible for the intervention and control groups will be used to compare the profile of people on the waiting list and those that attend for dental visits and participate in the study. b) The comparison will include the use of emergency dental services at the time of study recruitment. In Phase 2 the use of emergency dental care in the first 12 months after joining the waiting list will be compared for all people eligible for the control and intervention groups. Inclusion and exclusion criteria People will be eligible for the study if they are on the dental waiting list at the Dianella Community Health, and they are due to be offered a dental appointment or are in the first 120 people who joined the list after the 1st March 2006, and are competent to give consent. “Why is He Not Smiling?” Dental Costs Study Phase One Final Report Health Issues Centre, August 2008 94 People will be excluded from the study if they are unable to give informed consent, and if they fail to attend for an initial dental appointment at Dianella. People consenting to take part in the study who have pre-existing medical conditions will be excluded from periodontal assessment. MEASURES Primary outcome: Phase 1 • cost of proposed treatment plan. Phase 2 • cost of actual dental treatment plan. Secondary outcomes: Phase 1 • clinical assessments. • type of dental treatments – extraction or restoration • other dental treatments (eg emergency and private care) • co-payments charged to patient • Impact of oral health [OHIP-14] • Impact on social costs (from consumer interview) • Use of health service (from consumer interview) Phase 2 • Actual type of treatment. • Use of emergency dental services. DATA COLLECTION Consumer demographic information: Demographic information will be collected in a structured interview including: gender; level of education attained; (previous) occupation; country of birth; and language spoken at home. Patient records will be reviewed to collect information including: date of joining waiting list; number of missing teeth; use of emergency dental services: types of treatment received; costs of treatments; and co-payments paid. Cost of proposed dental treatment: Costs associated with dental treatment (from the perspective of the health service) are itemised and recorded in the dental record. Costs for treatments are determined according to the Department of Veteran’s Affairs dental schedule. Costs associated with oral health issues (from the perspective of the consumer) will be assessed from the assessment by the dentist (re private dental work estimated to have occurred in past 6 months); and consumer interview. Clinical assessment: Four clinical outcomes will be collected. These will be ascertained by dentists at the clinic at the initial dental visit. The electronic dental records will be adjusted to restrict access to information about study participants experience on the waiting list. This means that all dentists involved in clinical assessments will be effectively blind to the allocation of study participant to either the intervention or control groups. A random sub-sample comprising 10 percent of the study population will be reassessed at their subsequent dental visit to provide a calibration of the assessments. a) Decayed, Missing and Filled Teeth or Surfaces index (DMFT or DMFS index) “Why is He Not Smiling?” Dental Costs Study Phase One Final Report Health Issues Centre, August 2008 95 DFMT provides a summary assessment of dental decay and treatment: D= the sum of decayed and recurrent caries or the level of untreated disease; F= the sum of filled teeth; and M= the sum of extracted teeth due to caries or periodontal condition. F and M provide a treatment history (Brennan 2004). The DMFT index is calculated automatically from the dental chart in the dental record software and will be extracted from the record after the initial clinical assessment. b) Mean number of functional teeth The number of functional teeth will be determined by the initial clinical assessment and extracted from the electronic dental record. c) Dental Prosthesis status Dentists will assess the Dentate Status [=All Own Teeth; Teeth and Dentures; Edentulous] in the electronic dental record which will be used to determine the Dental Prostheses status. d) Community Periodontal Index (CPI) The Community Periodontal Index (CPI) involves assessment of each dentate sextant for the presence of gingival bleeding (which score 1), calculus at any supraor sub-gingival site (score 2), and the presence of pockets (pockets of 4-5mm score 3 and pockets of 6mm or more score 4). Periodontal health receives a score of 0. The CPI will be charted by each dentist manually. Other assessments Oral Health Impact Profile – OHIP-14: The 14-item scale OHIP-14 measures perceptions of social impact relating to oral health over the preceding 4 weeks (Brennan 2004). It will form part of the structured interview at the initial dental visit. The scale is concerned with frequency of symptoms and uses response categories: Never; Hardly ever; Occasionally; Very Often; and Fairly Often in a five point Likert-type scale. The scale has been widely used in Australia. Impact on health behaviour: A 16-item scale was developed to assess behaviour relating to the dimensions of nutrition, pain management, productivity and employment, and social relationships. It will be included in the structured interview at the initial dental visit. The scale uses response categories similar in format to the OHIP-14 for the frequency of self-reported behaviour over the past four weeks: Never; Hardly ever; Occasionally; Very Often; and Fairly Often in a five point Likert-type scale. The scale is not validated and will be reviewed after the first twenty interviews to see if the Use of dental and medical services: Four items included in the structured interview at the initial dental visit relate to the use of dental and medical services in the last six months including emergency services. Study participants will be asked about a specific public dental service and public and private health services more generally. Recall of the use of the specific public dental service will be compared with the dental record. SAMPLE SIZE CALCULATION The sample size of 100 in each group, using a statistical power of 0.80, would give an effect size (d) of 0.40. (That is there would be an 80% probability of detecting changes of “Why is He Not Smiling?” Dental Costs Study Phase One Final Report Health Issues Centre, August 2008 96 0.40 standard deviations in variables with a bidirectional test and alpha of 0.05.) Based on the value of the private dental voucher of $620, a sample size of 100 in each group, using a statistical power of 0.80, and alpha of 0.5 will detect a 12 percent reduction in dental costs. DATA ANALYSIS Data analysis will compare the proposed treatment costs and final treatment costs for the control and intervention groups. Odds ratios with 95 percent confidence intervals will be calculated. Other variables will also be compared including clinical assessments, type of treatment (extraction vs restoration), assessment of the social impact of oral health and health service use. Data will stratified by age group (18-64 years; 65 years and older), gender, language at home (English only vs not English only) and place of birth (Australia vs not Australia). Sub-group analysis will be performed on those patients for whom an extraction is proposed to compare the effect of patient preference alone as reason for extraction if there are sufficient data. “Why is He Not Smiling?” Dental Costs Study Phase One Final Report Health Issues Centre, August 2008 97 APPENDIX TWO: COMPLETE LIST OF DATA ITEMS Consumer demographic information: Demographic information was collected in a structured interview including: gender; level of education attained; (previous) occupation; country of birth; and language spoken at home. Patient records were reviewed to collect information including: date of joining waiting list; number of missing teeth; use of emergency dental services: types of treatment received; costs of treatments; and co-payments paid. Cost of proposed dental treatment: Costs associated with dental treatment (from the perspective of the health service) were itemised and recorded in the dental record. Costs for treatments were determined according to the Department of Veteran’s Affairs dental schedule. Costs associated with oral health issues (from the perspective of the consumer) were assessed from the assessment by the dentist (re private dental work estimated to have occurred in past 6 months); and consumer interview. Clinical assessment: Four clinical outcomes were collected. These were ascertained by dentists at the clinic at the initial dental visit. The electronic dental records were adjusted to restrict access to information about study participants experience on the waiting list. This means that all dentists involved in clinical assessments were effectively blind to the allocation of study participant to either the intervention or control groups. A random sub-sample comprising 10 percent of the study population will be reassessed at their subsequent dental visit to provide a calibration of the assessments. (a) Decayed, Missing and Filled Teeth or Surfaces index (DMFT or DMFS index) DFMT provides a summary assessment of dental decay and treatment: D= the sum of decayed and recurrent caries or the level of untreated disease; F= the sum of filled teeth; and M= the sum of extracted teeth due to caries or periodontal condition. F and M provide a treatment history (Brennan 2004). The DMFT index is calculated automatically from the dental chart in the dental record software and will be extracted from the record after the initial clinical assessment. (b) Mean number of functional teeth The number of functional teeth was determined by the initial clinical assessment and recorded by the dentist. (c) Dental Prosthesis status Dentists assessed the Dentate Status [=All Own Teeth; Teeth and Dentures; Edentulous] in the electronic dental record which will be used to determine the Dental Prostheses status. (d) Community Periodontal Index (CPI) The Community Periodontal Index (CPI) involves assessment of each dentate sextant for the presence of gingival bleeding (which score 1), calculus at any supra- or sub-gingival site (score 2), and the presence of pockets (pockets of 4-5mm score 3 and pockets of 6mm or more score 4). Periodontal health receives a score of 0. The CPI was charted by each dentist manually. “Why is He Not Smiling?” Dental Costs Study Phase One Final Report Health Issues Centre, August 2008 98 Other assessments: Oral Health Impact Profile – OHIP-14 The 14-item scale OHIP-14 measures perceptions of social impact relating to oral health over the preceding 4 weeks (Brennan 2004). It formed part of the structured interview at the initial dental visit. The scale is concerned with frequency of symptoms and uses response categories: Never; Hardly ever; Occasionally; Very Often; and Fairly Often in a five point Likert-type scale. The scale has been widely used in Australia. Impact on health behaviour: A 16-item scale was developed to assess behaviour relating to the dimensions of nutrition, pain management, productivity and employment, and social relationships. It was included in the structured interview at the initial dental visit. The scale uses response categories similar in format to the OHIP-14 for the frequency of self-reported behaviour over the past four weeks: Never; Hardly ever; Occasionally; Very Often; and Fairly Often in a five point Likert-type scale. The scale is not validated. Use of dental and medical services: Four items included in the structured interview at the initial dental visit relate to the use of dental and medical services in the last six months including emergency services. Study participants were asked about a specific public dental service and public and private health services more generally. Recall of the use of the specific public dental service was compared with the dental record. Emergency dental treatment audit De-identified data from those eligible for the intervention and control groups will be used to compare the profile of people on the waiting list and those that attend for dental visits and participate in the study. “Why is He Not Smiling?” Dental Costs Study Phase One Final Report Health Issues Centre, August 2008 99 APPENDIX THREE: DIANELLA’S LETTER OF OFFERING ON AN APPOINTMENT Dianella Community Health Inc Date Name Address Dear Re: LETTER OF OFFER FOR GENERAL TREATMENT You have been on our waiting list for a Dental appointment and we are pleased to inform you that you have been selected as study group and offered treatment at Dianella Dental Practice. Attached with this letter is an information pack. If you are still a holder of a Health Care Card or a Pension Concession Card, please come into the Dianella Community Health Dental Department and make appointment. When you come to make this appointment please bring this letter together with your current Health Care or Pension Card between 1.30 pm and 4.00 pm Monday to Friday. From 1997 Co-Payment for Dental treatment has been introduced, you will be required to pay a fee of $88 to the Dental Practice. Please note your maximum contribution for dental treatment will be $88 only. Please come or contact us on 8345 5410/8345 5827 to make an appointment before the (date). Please disregard this letter if you have been to this clinic for General dental treatment within the last twelve months. You may place your name on our Waiting List as per the instruction sheet that was given to you when your treatment was last completed. Yours sincerely, Dental Receptionist “Why is He Not Smiling?” Dental Costs Study Phase One Final Report Health Issues Centre, August 2008 100 APPENDIX FOUR: HEALTH ISSUES CENTRE’S LETTERS EXPLAINING THE STUDY DATE Dear Dental Costs Study As someone who has reached the top of the dental waiting list at Dianella Community Health, we invite you to take part in a study to find out more about the costs dental treatment and waiting lists. We have included information about the study for you to read. If you agree to take part in the study: • • • • • • • • You will have your dental treatment at Dianella Community Health. The usual co-payment of $22 for your first treatment will be waived. You will need to call Dianella Community Health to make an appointment for dental treatment as described in their letter enclosed. You need to attend the clinic an hour before your appointment time so that we can explain the study and answer any questions you may have about it. You will need to sign a consent form which will be explained to you. You will need to answer some questions about your dental health and how it affects you. The questions should take about 30 minutes. To participate in this study, we need your permission to give the researchers access to your dental treatment records. We need information about your dental treatment plan, your use of emergency dental care and your dental treatments over the next 12 months. Information from your records will only be used for the Dental Costs Study. Your name and personal details will not be revealed in the study. It’s entirely up to you Taking part in this study is completely up to you. If you do not wish to take part you do not have to and it will not affect your oral health treatment at Dianella Community Health in any way. It would be helpful for us to know the reasons why you decide not to take part so we have enclosed a brief survey and return paid envelope. You do NOT have to add a stamp. Please DO NOT write your name on this survey. What you need to do now If you want to be in the study you need to call Dianella Community Health’s Dental Reception at (03) 8345 5410 or (03) 8345 5827 by the date in the LETTER OF OFFER FOR GENERAL TREATMENT. Tell the Receptionist that you want to be in the Dental Costs Study. If you have any questions about this study, please call Charin at (03) 9479 3614. Yours sincerely Charin Naksook Senior Project Officer “Why is He Not Smiling?” Dental Costs Study Phase One Final Report Health Issues Centre, August 2008 101 Date Dear Dental Costs Study As someone who has recently joined the dental waiting list at Dianella Community Health, we invite you to take part in a study to find out more about the costs dental treatment and waiting lists. We have included information about the study for you to read. If you agree to take part • • • • • • • • You will be able to have your dental treatment at Dianella Community Health in the next few weeks. You will need to call Dianella Community Health to make an appointment for dental treatment as described in their letter enclosed. You will be required to meet the usual co-payment for your treatment. You will need to attend the clinic an hour before your appointment time so that we can explain the study and answer any questions you may have about it. You will need to sign a consent form which will be explained to you. You will need to answer some questions about your dental health and how it affects you. The questions should take about 30 minutes. If you participate in this study we need your permission to give the researchers access your dental treatment records. We need information about your dental treatment plan, your use of emergency dental care and your dental treatments over the next 12 months. Information from your records will only be used for the Dental Costs Study. Your name and personal details will not be revealed in the study. It’s entirely up to you Taking part in this study is completely up to you. If you do not wish to take part you do not have to and it will not affect your oral health treatment at Dianella Community Health in any way. If you do not wish to take up this offer you will remain on the waiting list until it is your turn for treatment. It would be helpful for us to know the reasons why you decide not to take part so we have enclosed a brief survey and return paid envelope. You do NOT have to add a stamp. Please DO NOT write your name on this survey. What you need to do now If you want to be in the study you need to call Dianella Community Health’s Dental Reception at (03) 8345 5410 or (03) 8345 5827 by the date required by the LETTER OF OFFER FOR GENERAL TREATMENT. Tell the Reception that you want to be in the Dental Costs Study. If you have any questions about this study, please call Charin at (03) 9479 3614. Yours sincerely Charin Naksook Senior Project Officer “Why is He Not Smiling?” Dental Costs Study Phase One Final Report Health Issues Centre, August 2008 102 APPENDIX FIVE: 1. PROJECT INFORMATION SHEET Participating in this study We would like you to take part in a research project called The Dental Costs Study which is looking at the costs of dental care and waiting lists. Before you decide to take part, we will provide you with the relevant information about what the study involves. If you are not sure about anything, please ask us. You can call Dr Charin Naksook at (03) 9479 3614 or Dr Sachidanand Raju at (03) 8345 5410. Taking part in any research project is completely up to you. If you do not wish to be involved you do not have to and it will not affect your oral health treatment at Dianella Community Health in any way. If you agree to take part in the study, you will need to sign a consent form. If you decide to take part and later change your mind, you can pull out of the study. If this happens we will not use any information about you that has been collected and not yet analysed. Your dental treatment will be the same as anyone else on the waiting list. 2. What is the study about? We are doing this study to find out more about the costs of delayed dental treatment. We will compare the costs of dental treatment for people who have had an extended time on a waiting list with people who have only waited two months. We are also interested in any other costs related to your health during the past six months, including any other dental treatment you may have had. 3. Who is taking part? We hope to involve about 200 people seeking dental treatment at Dianella Community Health in this project. About half of these are due to get an appointment for dental treatment after having been on the waiting list for some time and about half will have joined the waiting list since May 2006. “Why is He Not Smiling?” Dental Costs Study Phase One Final Report Health Issues Centre, August 2008 103 4. What does the study involve? If you agree to take part in the study you will need to: • attend the dental clinic an hour before your first dental appointment. We will call to remind you of this appointment; • give your signed consent to the project team to let them access your dental records at Dianella Community Health. We want to learn more about your dental treatment plan, any emergency dental treatment you may have had and your dental treatments over the next 12 months; • answer some questions about how your dental health and how it affects you. This will take about 30 minutes; • have an oral health assessment completed by a dentist at Dianella Community Health. 5. What about reimbursement? People who have been on the waiting list for an extended period and who agree to be in the study will have the co-payment for their first treatment waived. People who have early dental treatment because they are part of this study will need to pay their co-payment as per usual. 6. Who is funding the study and who is doing it? We are able to do this study through funding from the Department of Human Services and VicHealth (Victoria Health Promotion Foundation). Health Issues Centre, Dental Health Services Victoria and Dianella Community Health will work together on this project. Health Issues Centre is an independent non-government organisation that promotes and researches consumer perspectives. If you have access to the Internet at home or at your local library you can read more about Health Issues Centre at www.healthissuescentre.org.au 7. What are the possible benefits from the study? People who take part in this study, especially those who have waited for a long time, will learn more about the costs associated with delayed dental treatment. The other benefit will be helping to know more about the costs of dental waiting lists. 8. What are the possible risks? Physical risks involved in this project are the same as those with normal dental treatment, including any x-ray that may be taken for routine dental examinations. As in usual care, the dentist will decide if you need an x-ray. There is a small risk that thinking about how you have managed your dental health problems while waiting for an appointment may upset you. If this happens, you can pull out of the study and you can access a free confidential session with an experienced counsellor to help you if you want it. This will not affect your dental care in any way. “Why is He Not Smiling?” Dental Costs Study Phase One Final Report Health Issues Centre, August 2008 104 9. How will information be kept private? We will collect information in writing and on the computer. All data will be coded so that names will not appear with it. All computerised information will be passwordprotected. Any information that we get in this project that can identify the people in the study will remain confidential. Only people on the research team will see individual data, other than the information people usually see when they provide your dental care. People who take part in the study can see any information about them that we collect if they wish. No one will be identifiable in any reports that are produced. All data will be stored in a locked filing cabinet at Health Issues Centre, retained for seven years and shredded after that time. 10. What will happen to the study results? We will write reports on the study findings for the Department of Human Services and VicHealth. These may also be used to prepare papers for wider publication. In any publication, no person who takes part in the study will be identified. No one will make any money from the results of this study. If you want a summary of the 2006 findings of the study, it will be sent to you in later this year. A summary of the full study will be available by the end of 2007. 11. Ethical Guidelines This project will be carried out according to the National Statement on Ethical Conduct in Research Involving Humans (June 1999) produced by the National Health and Medical Research Council of Australia. This statement was developed to protect the interests of people who agree to participate in human research studies. If you want to read this statement please contact Health Issues Centre. This research study has been approved by the Human Research Ethics Committee of Dental Health Services Victoria. 12. Who is doing the research? The Principal Researchers for this study are: Tony McBride who is the CEO of Health Issues Centre, Dr Dell Horey, Senior Project Officer at Health Issues Centre and Dr Hanny Calache, Clinical Director at Dental Health Services Victoria. The Associate Researchers are: Dr Sachidanand Raju from Dianella Community Health and Dr Charin Naksook from Health Issues Centre. 13. Further Information If you want to know more about this study you can contact: Tony McBride, CEO Health Issues Centre, (03) 9479 5827 or 0407 531 468, or Charin Naksook, (03) 9479 3614. “Why is He Not Smiling?” Dental Costs Study Phase One Final Report Health Issues Centre, August 2008 105 14. Other Issues If you have any complaints about any aspect of this project or have any questions about your rights as someone taking part in a research project, you can contact: Dr Hanny Calache Clinical Director Dental Health Services Victoria Telephone: (03) 9341 1291 July 2006 “Why is He Not Smiling?” Dental Costs Study Phase One Final Report Health Issues Centre, August 2008 106 APPENDIX SIX: CONSENT FORM I have read, and I understand the information sheet about the Dental Costs Study, dated July 2006. I freely agree to take part in this study as described in the Information about the Dental Costs Study sheet. I understand that I can withdraw from the study at any stage if I wish to do so and that any information that has not yet been analysed will not be used. I will be given a copy of the Information about the Dental Costs Study sheet and the Consent Form to keep. I understand that the information I give in the questionnaire and oral health assessment will be recorded manually or electronically. However, the researcher will not reveal any of my personal details or my identity to any third party, nor will he/she identify me in any published reports or presentations about the project. I give the Dental Cost Study researchers permission to access my dental health records at Dianella Community Health and the Royal Dental Hospital of Melbourne. Participant’s Name (printed) …………………………………………………………………………… Signature Date Name of Witness (printed) ……………………………………………………………………………… Signature Date Researcher’s Name (printed) …………………………………………………………………………… Signature Do you want a summary of the study findings? Date YES NO Note: All parties signing the Consent Form must date their own signature. “Why is He Not Smiling?” Dental Costs Study Phase One Final Report Health Issues Centre, August 2008 107 APPENDIX SEVEN: NON PARTICIPANT SURVEY If you can’t take part in this study, or don’t want to, it would be helpful for us to know why. Please let us know by sending back this form in the enclosed envelope. You DO NOT need a postage stamp. Please DO NOT write your name on this survey. Just mark the boxes next to your reasons for not taking part. I haven’t time to take part There is too much to read I am working now I don’t need to see a dentist anymore I am too sick It is too hard to get to the dental clinic I don’t like seeing the dentist I can’t afford to see the dentist It is too much bother Cost of transport concerns me Other reason (please tell us what it is) .................................................................................................................. .................................................................................................................. .................................................................................................................. Thank you! “Why is He Not Smiling?” Dental Costs Study Phase One Final Report Health Issues Centre, August 2008 108 APPENDIX EIGHT: INTERVIEW QUESTIONNAIRE DENTAL COSTS STUDY HEALTH ISSUES CENTRE, DENTAL HEALTH SERVICES VICTORIA AND DIANELLA COMMUNITY HEALTH SERVICE Funded by VicHealth and Department of Human Services, Victoria STUDY ID: “Why is He Not Smiling?” Dental Costs Study Phase One Final Report Health Issues Centre, August 2008 Interpreter: YES NO 109 Thank you for agreeing to take part in this study. The first questions are about you. Q1. Age: Q2. Gender: Male (1) Female (2) Q3a. What is your country of birth? Q3b. (If not Australia) When did you arrive in Australia? Q3c. What language do you speak at home? English Italian Other (1) Turkish (4) (2) Arabic (YEAR) (Tick all that apply) Vietnamese (3) (5) Greek (6) (7) (please indicate)___________________________________ The next questions are about your use of dental services. Q4a. Where did you go for your last dental visit? □ □ □ □ □ □ □ Dianella Community Health Centre Other Community Health Centre Dental Hospital (3) Private practice (4) Dental technician Can’t recall Other (7). (Tick one that applies) (1) (2) (5) (6) Please, specify _______________________ Q4b. How long ago was your last dental visit? □ □ □ □ □ Less than 12 months ago 1 to 2 years ago (2) 2 to 5 years ago (3) More than 5 years ago (Tick one that applies) (1) (4) Never had dental visit before (5) Q5. Was your last dental visit for emergency treatment? YES NO “Why is He Not Smiling?” Dental Costs Study Phase One Final Report Health Issues Centre, August 2008 (Tick one that applies) UNSURE 110 Q6. Have any of the following stopped you seeking oral health services? (Check all that apply) a) □ Cost b) □ Availability of dentists c) □ Time waiting for appointments (waiting lists) d) □ Rude behaviour from dentists e) □ Rude behaviour from non-professionals (receptionist, dental nurses) □ g) □ h) □ i) □ j) □ k) □ l) □ f) Location of services (transportation) Waiting time in surgery Fear of dentist/treatments/procedures Physical disability (access) General health problem Communication/language problems Mental health problem (eg depression, anxiety) Q7. In comparison to the ORAL HEALTH of other people of your age, would you say your oral health is? (Circle one only) 1 Much better 2 Better 3 About the same 4 Worse 5 Much worse _____________________________________________________________ The next group of questions is about the PAST FOUR WEEKS. In that time… [Please record additional responses in space below.] Q8. [During the PAST FOUR WEEKS] how often have you had trouble pronouncing any words because of problems with your teeth, mouth or dentures? (Circle one only) 0 Never 1 Hardly ever 2 Occasionally 3 Fairly often 4 Very often Q9. [During the PAST FOUR WEEKS] how often have you felt that your sense of taste has worsened because of problems with your teeth, mouth or dentures? (Circle one only) 0 Never 1 Hardly ever 2 Occasionally 3 Fairly often 4 Very often Q10. [During the PAST FOUR WEEKS] how often have you had painful aching in your mouth? (Circle one only) 0 Never 1 Hardly ever 2 Occasionally 3 Fairly often 4 Very often Q11. [During the PAST FOUR WEEKS] how often have you found it uncomfortable to eat any foods because of problems with your teeth, mouth or dentures? (Circle one only) 0 Never 1 Hardly ever 2 Occasionally 3 Fairly often 4 Very often Q12. [During the PAST FOUR WEEKS] how often have you been self-conscious because of your teeth, mouth or dentures? (Circle one only) 0 Never 1 Hardly ever “Why is He Not Smiling?” Dental Costs Study Phase One Final Report Health Issues Centre, August 2008 2 Occasionally 3 Fairly often 4 Very often 111 SOCIAL COSTS OF DELAYED DENTAL TREATMENT SURVEY Q13. [During the PAST FOUR WEEKS] how often have you felt tense because of problems with your teeth, mouth or dentures? (Circle one only) 0 Never 1 Hardly ever 2 Occasionally 3 Fairly often 4 Very often Q14. [During the PAST FOUR WEEKS] how often have you thought your diet has been unsatisfactory because of problems with your teeth, mouth or dentures? (Circle one only) 0 Never 1 Hardly ever 2 Occasionally 3 Fairly often 4 Very often Q15. [During the PAST FOUR WEEKS] how often have you had to interrupt meals because of problems with your teeth, mouth or dentures? (Circle one only) 0 Never 1 Hardly ever 2 Occasionally 3 Fairly often 4 Very often Q16. [During the PAST FOUR WEEKS] how often have you found it difficult to relax because of problems with your teeth, mouth or dentures? (Circle one only) 0 Never 1 Hardly ever 2 Occasionally 3 Fairly often 4 Very often Q17. [During the PAST FOUR WEEKS] how often have you been a bit embarrassed because of problems with your teeth, mouth or dentures? (Circle one only) 0 Never 1 Hardly ever 2 Occasionally 3 Fairly often 4 Very often Q18. [During the PAST FOUR WEEKS] how often have you been a bit irritable with other people because of problems with your teeth, mouth or dentures? (Circle one only) 0 Never 1 Hardly ever 2 Occasionally 3 Fairly often 4 Very often Q19. [During the PAST FOUR WEEKS] how often have you had difficulty doing your usual jobs because of problems with your teeth, mouth or denture? (Circle one only) 0 Never 1 Hardly ever 2 Occasionally 3 Fairly often 4 Very often Q20. [During the PAST FOUR WEEKS] how often have you felt that life in general was less satisfying because of problems with your teeth, mouth or dentures? (Circle one only) 0 Never 1 Hardly ever 2 Occasionally 3 Fairly often 4 Very often Q21. [During the PAST FOUR WEEKS] how often have you been totally unable to function because of problems with your teeth, mouth or dentures? (Circle one only) 0 Never 1 Hardly ever 2 Occasionally 3 Fairly often 4 Very often ____________________________________________________________ Q22. In general, would you say your health is? 1 Excellent or very good 2 Good 3 Average or fair (Circle one only) 4 Poor 5 Very poor ___________________________________________________________________ “Why is He Not Smiling?” Dental Costs Study Phase One Final Report Health Issues Centre, August 2008 112 [Please record additional responses in space below.] HEALTH SERVICE USE The next 5 questions are about your use of health services over the PAST SIX MONTHS. Q23. [In the PAST SIX MONTHS] have you used emergency dental services? that applies) YES (Tick one NO Q23a. If yes, did you use Q23a) Dianella Community Health Centre dental services? YES NO Q23b) Other public emergency dental services? YES NO Q23c) Private emergency dental services? YES NO Q24. [In the PAST SIX MONTHS] have you used non-emergency dental services? one that applies) YES (Tick NO Q24a. If yes, did you use Q24a) Dianella Community Health Centre dental services? YES Q24b) Other public dental services? YES NO Q24c) Private dental services? YES NO NO _________________________________________________________________________________________________________ Q25. [In the PAST SIX MONTHS] have you attended a general medical practitioner (GP) or health clinic? (Tick one that applies) YES NO Q25a. If yes, how may times? Once only 2 or 3 times 3 to 6 times More than six times _________________________________________________________________________________________________________ Q26. [In the PAST SIX MONTHS] have you attended a medical hospital (not dental hospital or clinic) as an out-patient? (Tick one that applies) YES NO Q26a. If yes, how may times? Once only 2 or 3 times 4 to 6 times More than six times “Why is He Not Smiling?” Dental Costs Study Phase One Final Report Health Issues Centre, August 2008 113 Q27. In the PAST SIX MONTHS have you attended the emergency ward of a medical hospital for health care? (Tick one that applies) YES NO Q27a. If yes, how may times? Once only 2 or 3 times 3 to 6 times More than six times _______________________________________________________________________________________________________________ _________ The next questions are about how you might have managed pain in your teeth and mouth over the LAST FOUR WEEKS. Q28. [During the PAST FOUR WEEKS] how often have you avoided cold foods to manage pain with your teeth or mouth? (Circle one only) 0 Never 1 Hardly ever 2 Occasionally 3 Fairly often 4 Very often [For questions asking ‘how often’ please record any descriptive terms used such as ‘every day’ or ‘now and then’ but ask them to rate as per scale – how it feels to them.] Q29. [During the PAST FOUR WEEKS] how often have you avoided hot foods to manage pain with your teeth or mouth? (Circle one only) 0 Never 1 Hardly ever 2 Occasionally 3 Fairly often 4 Very often Q30. [During the PAST FOUR WEEKS] how often have you used painkillers bought over the counter (eg at chemist or supermarket) to manage pain with your teeth or mouth? (Circle one only) 0 Never 1 Hardly ever 2 Occasionally 3 Fairly often 4 Very often Q31. [During the PAST FOUR WEEKS]how often have you used alcohol to manage pain with your teeth or mouth? (Circle one only) 0 Never 1 Hardly ever 2 Occasionally 3 Fairly often 4 Very often 5* n’t drink alcohol Q32. [During the PAST FOUR WEEKS] how often have you smoked cigarettes to manage pain with your teeth or mouth? (Circle one only) 0 Never 1 Hardly ever 2 Occasionally 3 Fairly often 4 Very often 5* Don’t smoke Q33. [During the PAST FOUR WEEKS] how often have you used acupuncture to manage pain with your teeth or mouth? (Circle one only) 0 Never 1 Hardly ever 2 Occasionally 3 Fairly often [For questions asking ‘how often’ please record any descriptive terms used such as ‘every day’ or ‘now and then’ but ask them to rate as per scale – how it feels to them.] 4 Very often Q34. [During the PAST FOUR WEEKS] how often have you seen a doctor to get medication because of problems related to your teeth or mouth? (Circle one only) 0 Never 1 Hardly ever “Why is He Not Smiling?” Dental Costs Study Phase One Final Report Health Issues Centre, August 2008 2 Occasionally 3 Fairly often 4 Very often 114 Q35. [During the PAST FOUR WEEKS] how often have you used nutrition supplements because of problems related to your teeth or mouth? (Circle one only) 0 Never 1 Hardly ever 2 Occasionally 3 Fairly often 4 Very often Q36. [During the PAST FOUR WEEKS] how often have you bought special foods because of problems related to your teeth or mouth? (Circle one only) 0 Never 1 Hardly ever 2 Occasionally 3 Fairly often 4 Very often Q37. [During the PAST FOUR WEEKS] how often have you missed work because of problems related to your teeth or mouth? (Circle one only) 0 Never 1 Hardly ever 2 Occasionally 3 Fairly often 4 Very often 5 Not applicable Q38. [During the PAST FOUR WEEKS] how often have you found it difficult to sleep because of problems related to your teeth or mouth? (Circle one only) 0 Never 1 Hardly ever 2 Occasionally 3 Fairly often 4 Very often Q39. [During the PAST FOUR WEEKS] how often have you used a traditional remedy, like oil of cloves, to manage pain with your teeth or mouth? (Circle one only) 0 Never 1 Hardly ever 2 Occasionally 3 Fairly often 4 Very often Q40. [During the PAST FOUR WEEKS] how often do you think that problems with your teeth, mouth or dentures affected your social activities? (Circle one only) 0 Never 1 Hardly ever 2 Occasionally 3 Fairly often 4 Very often Q41. [During the PAST FOUR WEEKS] how often do you think that problems with your teeth, mouth or dentures caused problems with intimacy with others? (Circle one only) 0 Never 1 Hardly ever 2 Occasionally 3 Fairly often 4 Very often Q42. [During the PAST FOUR WEEKS] how often do you think that problems with your teeth, mouth or dentures affected your job prospects? (Circle one only) 0 Never 1 Hardly ever 2 Occasionally 3 Fairly often 4 Very often 5* Not applicable Q43. [During the PAST FOUR WEEKS] how often do you think that problems with your teeth, mouth or dentures stopped you attending important functions? (Circle one only) 0 Never 1 Hardly ever 2 Occasionally 3 Fairly often 4 Very often Q44. a) During the PAST FOUR WEEKS have you used any other ways to manage pain with your teeth or mouth, eg using a cold pack? (Please describe) ________________________________________________________________________________________ ________________________________________________________________________________________ “Why is He Not Smiling?” Dental Costs Study Phase One Final Report Health Issues Centre, August 2008 115 Q44. b) If so, how often did you use it? 0 Never 1 Hardly ever 2 Occasionally (Circle one only) 3 airly often 4 Very often 5 Not applicable Finally, some questions about you. Q45. What is the highest level of education you have reached? applies) □ No formal education □ Primary incomplete (year 1-6) □ Primary complete □ Secondary incomplete □ Secondary complete □ Tertiary education (complete or incomplete) (Tick one that Q46. What is (or was) your main occupation in your life? _________________________________________________________________________________________________ Thank you! NOTES: RESEARCHER’S CHECKLIST Have you given the envelope containing Thank You note? “Why is He Not Smiling?” Dental Costs Study Phase One Final Report Health Issues Centre, August 2008 □ 116 APPENDIX NINE: RELIABILITY TESTING To determine the intra-, inter-rate reliability consensus on the assessment, the intraclass correlation coefficient (ICC) was used. ICC is used when data is measured at an interval level and because of the sample size (smaller than 15). Interpretation of the ICC is similar to Kappa. By convention, a Kappa value of 0.40 to 0.59 is moderate inter-examiner reliability, 0.60 to 0.79 substantial, and 0.80 outstanding (Landis and Koch 1977). Consequently, when ICC approaches 1, all examiners give the same reading. That is, perfect inter-examiner reliability. In the present case the inter-examiner reliability is generally low (either 0.30 or 0.46). Single measures are used when individual ratings constitute the unit of analysis. Average measures are used when the mean of all ratings is the unit of analysis. In this test a single measure is applicable. In either case, inter-examiner reliability is low, or at best moderate. Inter Examiner Reliability Intraclass Correlation Coefficient Intraclass Correlation(a) Lower Bound Single Measures Average Measures 95% Confidence Interval Upper Bound Value F Test with True Value 0 Lower df1 df2 Sig Bound .299(b) -.076 .601 1.846 27.0 27 .059 .461(c) -.164 .750 1.846 27.0 27 .059 Intraclass Correlation Coefficient: Rater 1 (Dentist A) Intraclass Correlation(a) Lower Bound Single Measures Average Measures 95% Confidence Interval Upper Bound Value F Test with True Value 0 df1 df2 Lower Bound Sig 1.000(b) . 1.000 . 9.0 . . 1.000(c) . 1.000 . 9.0 . . Intraclass Correlation Coefficient: Rater 2 (Dentist B) Intraclass Correlation(a) Lower Bound Single Measures Average Measures 95% Confidence Interval Upper Bound Value F Test with True Value 0 df1 df2 Lower Bound Sig .997(b) .990 .999 764.949 9.0 9 .000 .999(c) .995 1.000 764.949 9.0 9 .000 “Why is He Not Smiling?” Dental Costs Study Phase One Final Report Health Issues Centre, August 2008 117 APPENDIX TEN: PROPOSED TREATMENT ITEM NUMBERS BY TREATMENT TYPE AND WAITING TIME Table 1: Diagnostic procedures: People treated by waiting time Waiting 2-4 months n (%) Waiting > 2yrs n (%) Item No 011 Oral examination ($40.25) Total n (%) 9 (6.9) 4 (3.4) 13 (5.3) Item No 014 Consultation ($45.95) 72 (55.4) 61 (52.6) 133 (54.1) Item No 015 Extended consultation ($75.25) 50 (38.5) 52 (44.8) 102 (41.5) Number people with one referral letter 36 (27.7) 38 (32.8) 74 (30.1) Number people with two referral letters 4 (3.1) 3 (2.6) 7 (2.8) 44 44 88 1 treatment 86 (66.2) 63 (54.3) 149 (60.6) 2 treatments 5 (3.8) 5 (4.3) 10 (4.1) 3 treatments 1 (0.8) 1 (0.9) 2 (0.8) 4 treatments 1 (0.8) 0 (0.0) 1 (0.4) 8 treatments 0 (0.0) 1 (0.9) 1 (0.4) 93 (71.5) 70 (60.3) 163 (66.3) 103 84 187 1 treatment 72 (55.4) 56 (48.3) 128 (52.0) 2 treatments 6 (4.6) 3 (2.6) 9 (3.7) 3 treatments 3 (2.3) 0 (0.0) 3 (1.2) 4 treatments 0 (0.0) 2 (1.7) 2 (0.8) 5 treatments 1 (0.8) 0 (0.0) 1 (0.4) 6 treatments 1 (0.8) 0 (0.0) 1 (0.4) 7 treatments 0 (0.0) 1 (0.9) 1 (0.4) 83 (63.8) 62 (53.4) 145 (58.9) 104 77 181 18 (13.8) 11 (9.5) 29 (11.8) Item No 019 Referral letter ($15.50) Total letters sent Item No 022 Radiograph ($32.60) Total people Total radiographs Item No 024 Radiograph same day ($22.05) Total people Total same day radiographs Item No 037 Panoramic radiograph ($0) “Why is He Not Smiling?” Dental Costs Study Phase One Final Report Health Issues Centre, August 2008 118 Table 2: Preventive treatment procedures: People treated by waiting time Waiting 2-4 months n (%) Waiting > 2yrs n (%) Item No 111 plaque removal ($41.50) Total n (%) 0 (0.0) 1 (0.9) 1 (0.4) 1 treatment 105 (80.8) 96 (82.8) 201 (81.7) 2 treatments 0 (0.0) 1 (0.9) 1 (0.4) Item No 114 calculus removal ($56.40) 3 treatments 1 (0.8) 1 (0.9) 2 (0.8) 106 (81.5) 98 (84.5) 204 (82.9) 110 101 211 1 treatment 2 (1.5) 3 (2.6) 5 (2.0) 2 treatments 1 (0.8) 0 (0.0) 1 (0.4) Total people 3 (2.3) 3 (2.6) 6 (2.4) Total treatments 4 (3.1) 3 (2.6) 7 (2.8) 1 treatment 7 (5.4) 6 (5.2) 13 (5.3) 2 treatments 1 (0.8) 0 (0.0) 1 (0.4) Total people 8 (6.2) 6 (5.2) 14 (5.2) Total treatments 9 (6.9) 6 (5.2) 15 (6.1) Total people Total treatments Item No 115 calculus removal >1 Item No 121 Fluoride ($25.05) Item No 141 hygiene instruction ($38.85) 86 (66.2) 69 (59.2) 155 (63.0) Item No 161 fissure seal ($36.50) 0 (0.0) 1 (0.9) 1 (0.4) Item No 165 desensitising ($19.60) 1 (0.8) 3 (2.6) 4 (1.6) Table 3: Periodontal procedures: People treated by waiting time Waiting 2-4 months n (%) Waiting > 2yrs n (%) Total n (%) Item No 222 Root planning ($98.70) 1 treatment 1 (0.8) 1 (0.9) 2 (0.8) 3 treatments 1 (0.8) 0 (0.0) 1 (0.4) 4 treatments Total people Total treatments “Why is He Not Smiling?” Dental Costs Study Phase One Final Report Health Issues Centre, August 2008 8 (6.2) 2 (1.7) 10 (4.1) 10 (7.7) 3 (2.6) 13 (5.3) 36 9 45 119 Table 4: Oral surgery: People treated by waiting time Waiting 2-4 months n (%) Waiting > 2yrs n (%) Total n (%) Item No 311 removal ($90.75) 1 treatment 12 (9.2) 12 (10.3) 24 (9.8) 2 treatments 8 (6.2) 11 (9.5) 19 (7.7) 3 treatments 7 (5.4) 2 (1.7) 9 (3.7) 4 treatments 3 (2.3) 2 (1.7) 5 (2.0) 6 treatments 1 (0.8) 0 (0.0) 1 (2.0) 7 treatments 0 (0.0) 1 (0.9) 1 (0.4) 11 treatments 0 (0.0) 1 (0.9) 1 (0.4) 13 treatments 1 (0.8) 0 (0.0) 1 (0.4) 15 treatments 0 (0.0) 2 (1.7) 2 (0.8) 32 treatments Total people Total treatments 0 (0.0) 1 (0.9) 1 (0.4) 32 (24.6) 32 (27.6) 64 (26.0) 80 128 208 2 (1.5) 0 (0.0) 2(0.8) 2 0 2 Item No 314 sectional removal ($121.50) Total people Total treatments Item No 316 additional removal ($59.95) 1 treatment 3 (2.3) 3 (2.6) 6 (2.4) 2 treatments 1 (0.8) 4 (3.4) 5 (2.0) 5 treatments 1 (0.8) 0 (0.0) 1 (0.4) 7 treatments 0 (0.0) 1 (0.9) 1 (0.4) 24 treatments 0 (0.0) 1 (0.9) 1 (0.4) 28 treatments 1 (0.8) 0 (0.0) 1 (0.4) 6 (4.6) 9 (7.8) 15 (6.1) 38 42 80 1 (0.8) 0 (0.0) 1 (0.4) 1 (0.8) 0 (0.0) 1 (0.4) 2 0 2 Total people Total treatments Item No 322 surgical removal ($154.30) 2 treatments Total people Total treatments “Why is He Not Smiling?” Dental Costs Study Phase One Final Report Health Issues Centre, August 2008 120 Table 5: Endodontics: People treated by waiting time Waiting > 2yrs n (%) Item No 415 complete root preparation (1) ($174.35) 1 treatment 2 treatments 4 treatments Total people Total treatments Item No 416 root preparation (1) ($72.45) 1 treatment 2 treatments 3 treatments 6 treatments Total people Total treatments Item No 418 root obturation (+) ($72.45) 1 treatment 2 treatments 3 treatments 4 treatments 6 treatments Total people Total treatments Item No 419 expiration ($99.85) 1 treatment 2 treatments Total people Total treatments Item No 451 removal root filling ($76.55) 2 treatments Total people Total treatments Item No 455 irrigation visit ($76.55) 1 treatment 3 treatments 4 treatments Total people Total treatments Item No 458 Interim root filling ($102.05) 1 treatment 2 treatments 3 treatments 4 treatments Total people Total treatments “Why is He Not Smiling?” Dental Costs Study Phase One Final Report Health Issues Centre, August 2008 Waiting 2-4 months n (%) Total n (%) 2 (1.5) 5 (3.8) 2 (1.5) 9 (6.9) 20 0 (0.0) 3 (2.6) 0 (0.0) 3 (2.6) 6 2 (0.8) 8 (3.3) 2 (0.8) 12 (4.9) 26 0 (0.0) 3 (2.3) 1 (0.8) 0 (0.0) 4 (3.1) 9 1 (0.9) 0 (0.0) 0 (0.0) 1 (0.9) 2 (1.7) 7 1 (0.4) 3 (7.8) 1 (0.4) 1 (0.4) 6 (2.4) 16 1 (0.8) 1 (0.8) 1 (0.8) 0 (0.0) 0 (0.0) 3 (2.3) 6 1 (0.9) 0 (0.0) 0 (0.0) 1 (0.9) 1 (0.9) 3 (2.6) 11 2 (0.8) 1 (0.4) 1 (0.4) 1 (0.4) 1 (0.4) 6 (2.4) 17 6 (4.6) 2 (1.5) 8 (6.2) 10 1 (0.9) 3 (2.6) 4 (3.4) 7 7 (2.8) 5 (2.0) 12 (4.9) 17 0 (0.0) 0 (0.0) 0 (0.0) 1 (0.9) 1 (0.9) 2 (1.7) 1 (0.4) 1 (0.4) 2 (0.8) 0 (0.0) 1 (0.8) 1 (0.8) 2 (1.5) 7 1 (0.9) 2 (1.7) 1 (0.9) 4 (3.4) 11 1 (0.4) 3 (7.8) 2 (0.8) 6 (2.4) 18 0 (0.0) 0 (0.0) 1 (0.8) 1 (0.8) 2 (1.5) 7 1 (0.9) 1 (0.9) 2 (1.7) 1 (0.9) 5 (4.3) 13 1 (0.4) 1 (0.4) 3 (7.8) 2 (0.8) 7 (2.8) 20 121 Table 6a: Restorative treatments: People treated by waiting time Items 511, 512, 513, 514, 515 Waiting 2-4 months n (%) Waiting > 2yrs n (%) Total n (%) Item No 511 metallic restoration ($75.55) 1 treatment 20 (15.4) 9 (7.8) 29 (11.8) 2 treatments 6 (4.6) 9 (7.8) 15 (6.1) 3 treatments 4 (3.1) 2 (1.7) 6 (2.4) 4 treatments 2 (1.5) 1 (0.9) 3 (1.2) 5 treatments 1 (0.8) 0 (0.0) 1 (0.4) 6 treatments 1 (0.8) 1 (0.9) 2 (0.8) 0 (0.0) 1 (0.9) 1 (0.4) 34 (26.2) 23 (19.8) 57 (23.2) 63 50 113 1 treatment 25 (19.2) 18 (15.5) 43 (17.5) 2 treatments 17 (13.1) 5 (4.3) 22 (8.9) 3 treatments 6 (4.6) 6 (5.2) 12 (4.9) 4 treatments 2 (1.5) 4 (3.4) 6 (2.4) 5 treatments 0 (0.0) 1 (0.9) 1 (0.4) 6 treatments 2 (1.5) 1 (0.9) 3 (1.2) 7 treatments 1 (0.8) 0 (0.0) 1 (0.4) 7 treatments Total people Total treatments Item No 512 metallic restoration ($94.00) 1 (0.8) 0 (0.0) 1 (0.4) 54 (41.5) 35 (30.2) 89 (36.2) 112 73 185 1 treatment 9 (6.9) 11 (9.5) 20 (8.1) 2 treatments 2 (1.5) 3 (2.6) 5 (2.0) 8 treatments Total people Total treatments Item No 513 metallic restoration (3) ($114.05) 3 treatments 1 (0.8) 2 (1.7) 3 (1.2) 12 (9.2) 16 (13.8) 28 (11.4) 16 23 39 1 treatment 10 (7.7) 4 (3.4) 14 (5.7) 2 treatments 0 (0.0) 2 (1.7) 2 (0.8) 10 (7.7) 6 (5.2) 16 (6.5) 10 8 18 1 treatment 3 (2.3) 2 (1.7) 5 (2.0) 2 treatments Total people Total treatments Item No 514 metallic restoration (4) ($134.05) Total people Total treatments Item No 515 metallic restoration (5) ($154.30) 0 (0.0) 1 (0.9) 1 (0.4) Total people 3 (2.3) 3 (2.6) 6 (2.4) Total treatments 3 (2.3) 4 (3.4) 7 “Why is He Not Smiling?” Dental Costs Study Phase One Final Report Health Issues Centre, August 2008 122 Table 6b: Restorative treatments: People treated by waiting time Items 521, 522, 523, 524, 525, 531 Waiting > 2yrs n (%) Item No 521 resin restoration (2)($87.25) 1 treatment 2 treatments 3 treatments 4 treatments 5 treatments 9 treatments 10 treatments Total people Total treatments Item No 522 resin restoration (2) ($107.45) 1 treatment 2 treatments 3 treatments 4 treatments 5 treatments Total people Total treatments Item No 523 resin restoration (3) ($122.60) 1 treatment 2 treatments 3 treatments Total people Total treatments Item No 524 resin restoration (4) ($145.15) 1 treatment 2 treatments Total people Total treatments Item No 525 ($167.75) 3 treatments Total people Total treatments Item No 531 resin restoration ($92.20) 1 treatment 2 treatments 3 treatments 4 treatments Total people Total treatments “Why is He Not Smiling?” Dental Costs Study Phase One Final Report Health Issues Centre, August 2008 Waiting 2-4 months n (%) Total n (%) 8 (6.2) 7 (5.4) 1 (0.8) 2 (1.5) 0 (0.0) 1 (0.8) 2 (1.5) 21 (16.2) 62 8 (6.9) 1 (0.9) 1 (0.9) 2 (1.7) 2 (1.7) 0 (0.0) 0 (0.0) 14 (12.1) 31 16 (6.5) 8 (3.3) 2 (0.8) 4 (1.6) 2 (0.8) 1 (0.4) 2 (0.8) 35 (14.2) 93 17 (13.1) 10 (7.7) 3 (2.3) 1 (0.8) 2 (1.5) 33 (25.4) 60 15 (12.9) 7 (6.0) 6 (5.2) 2 (1.7) 0 (0.0) 30 (25.9) 55 32 (13.0) 17 (6.9) 9 (3.7) 3 (1.2) 2 (0.8) 63 (25.6) 115 4 (3.1) 6 (4.6) 1 (0.8) 11 (8.5) 19 14 (12.1) 4 (3.4) 3 (2.6) 21 (18.1) 31 18 (7.3) 10 (4.1) 4 (1.6) 32 (13.0) 50 4 (3.1) 1 (0.8) 5 (3.8) 6 (4.6) 2 (1.7) 1 (0.9) 3 (2.6) 4 (3.4) 6 (2.4) 2 (0.8) 8 (3.3) 10 (4.1) 0 (0.0) 0 (0.0) 0 (0.0) 1 (0.9) 1 (0.9) 1 (0.9) 1 (0.4) 3 (1.2) 3 (1.2) 20 (15.4) 5 (3.8) 3 (2.3) 1 (0.8) 29 (22.3) 43 13 (11.2) 7 (6.0) 3 (2.6) 2 (1.7) 25 (21.6) 44 33 (13.4) 12 (4.9) 6 (2.4) 3 (1.2) 54 (22.0) 67 123 Table 6c: Restorative treatments: People treated by waiting time Items 532, 533, 534, 535, 572, 575, 577 Waiting > 2yrs n (%) Item No 532 resin restoration (2) ($119.90) 1 treatment 2 treatments 3 treatments 4 treatments 5 treatments 9 treatments Total people Total treatments Item No 533 resin restoration (3) ($146.50) 1 treatment 2 treatments Total people Total treatments Item No 534 resin restoration ($172.30) 1 treatment 2 treatments Total people Total treatments Item No 535 resin restoration (5) ($197.80) 1 treatment 3 treatments Total people Total treatments Item No 572 provisional restoration ($35.30) 1 treatment Total people Total treatments Item No 575 pin retention ($21.90) 1 treatment 2 treatments 4 treatments Total people Total treatments Item No 577 cusp capping ($21.90) 1 treatment 2 treatments 4 treatments 8 treatments Total people Total treatments “Why is He Not Smiling?” Dental Costs Study Phase One Final Report Health Issues Centre, August 2008 Waiting 2-4 months n (%) Total n (%) 10 (7.7) 4 (3.1) 1 (0.8) 0 (0.0) 0 (0.0) 0 (0.0) 15 (11.5) 21 3 (2.6) 5 (4.3) 2 (1.7) 2 (1.7) 1 (0.9) 1 (0.9) 14 (12.1) 41 13 (5.3) 9 (3.7) 3 (1.2) 2 (0.8) 1 (0.4) 1 (0.4) 29 (11.8) 62 8 (6.2) 1 (0.8) 9 (6.9) 10 3 (2.6) 1 (0.9) 4 (3.4) 5 11 (4.5) 2 (0.8) 13 (5.3) 15 9 (6.9) 1 (0.8) 10 (7.7) 11 7 (6.0) 0 (0.0) 7 (6.0) 7 16 (6.5) 1 (0.4) 17 (6.9) 18 (7.3) 3 (2.3) 1 (0.8) 4 (3.1) 6 2 (1.7) 0 (0.0) 2 (1.7) 2 5 (2.0) 1 (0.4) 6 (2.4) 8 (3.3) 1 (0.8) 1 (0.8) 1 (0.8) 1 (0.9) 1 (0.9) 1 (0.9) 2 (0.8) 2 (0.8) 2 (0.8) 3 (2.3) 2 (1.5) 1 (0.8) 6 (4.6) 11 2 (1.7) 2 (1.7) 0 (0.0) 4 (3.4) 6 5 (2.0) 4 (1.6) 1 (0.4) 10 (4.1) 17 7 (5.4) 5 (3.8) 1 (0.8) 1 (0.8) 14 (10.8) 29 2 (1.7) 5 (4.3) 0 (0.0) 0 (0.0) 7 (6.0) 12 9 (3.7) 10 (4.1) 1 (0.4) 1 (0.4) 21 (8.5) 41 124 Table 7: Dentures: People treated by waiting time Waiting > 2yrs n (%) Item 711 Complete upper denture ($706.40) Total Item 712 Complete lower denture ($706.40) Total Item 719 Complete upper and lower dentures ($1265.60) Total Item 721A Part. resin upper denture 1 tooth ($319.20) Total Item 721B Part. resin upper denture 2 teeth ($354.55) Total Item 721C Part. resin upper denture 3 teeth ($426.60) Total Item 721D Part. resin upper denture 4 teeth ($479.40) Total Item 721E Part. resin upper denture 5-9 teeth ($580.30) 1 2 Total Total dentures Item 721F Part. Resin upper denture 10-12 teeth ($656.05) Total Item No 731 retainer (per tooth) ($31.90) 1 retainer 2 retainers 4 retainers Total Total retainers Item 721E Part. resin lower denture 5-9 teeth ($580.30) 1 Total Item 722F Part. Resin lower denture 10-12 teeth ($656.05) Total Item 765 replace tooth ($109.10) 3 replacements 4 replacements 5 replacements Total Total replacements Item 768 Adding to part denture($145.40) Total Item 776 Impression ($33.30) Total “Why is He Not Smiling?” Dental Costs Study Phase One Final Report Health Issues Centre, August 2008 Waiting 2-4 months n (%) Total n (%) 7 (5.4) 7 (5.4) 10 (8.6) 10 (8.6) 17 (6.9) 17 (6.9) 3 (2.3) 3 (2.3) 2 (1.7) 2 (1.7) 5 (2.0) 5 (2.0) 2 (1.5) 2 (1.5) 3 (2.6) 3 (2.6) 5 (2.0) 5 (2.0) 1 (0.8) 1 (0.8) 0 (0.0) 0 (0.0) 1 (0.4) 1 (0.4) 1 (0.8) 1 (0.8) 1 (0.9) 1 (0.9) 2 (0.8) 2 (0.8) 3 (2.3) 3 (2.3) 2 (1.7) 2 (1.7) 5 (2.0) 5 (2.0) 8 (6.2) 8 (6.2) 5 (4.3) 5 (4.3) 13 (5.3) 13 (5.3) 13 (10.0) 3 (2.3) 16 (12.3) 19 11 (9.5) 0 (0.0) 11 (9.5) 11 24 (9.8) 3 (1.2) 27 (11.0) 30 2 (1.5) 2 (1.5) 0 (0.0) 0 (0.0) 2 (0.8) 2 (0.8) 0 (0.0) 12 (9.2) 8 (6.2) 20 (15.4) 56 2 (1.7) 14 (12.1) 1 (0.9) 17 (14.7) 34 2 (0.8) 26 (10.6) 9 (3.7) 37 (15.0) 90 0 (0.0) 0 (0.0) 2 (1.7) 2 (1.7) 2 (0.8) 2 (0.8) 1 (0.8) 1 (0.8) 0 (0.0) 0 (0.0) 1 (0.4) 1 (0.4) 1 (0.8) 1 (0.8) 1 (0.8) 3 (2.3) 12 0 (0.0) 0 (0.0) 0 (0.0) 0 (0.0) 0 1 (0.4) 1 (0.4) 1 (0.4) 3 (1.2) 12 1 (0.8) 1 (0.8) 2 (1.5) 2 (1.5) 0 (0.0) 0 (0.0) 0 (0.0) 0 (0.0) 1 (0.4) 1 (0.4) 2 (0.8) 2 (0.8) 125 Table 8: Other services: People treated by waiting time Waiting 2-4 months n (%) Waiting > 2yrs n (%) Total n (%) Item 927 Medication ($19.90) 1 medication 6 6 12 3 medication 1 0 1 4 medication 1 0 1 8 6 14 Total people Total medications 13 6 19 Item 935 Interpreter ($51.00) 2 6 8 Total 2 6 8 Item 986 Post-operative care ($51.10) 1 0 1 1 Total 0 1 1 “Why is He Not Smiling?” Dental Costs Study Phase One Final Report Health Issues Centre, August 2008 126 APPENDIX ELEVEN: ADDITIONAL TABLES FOR CHAPTER 3 Table A: Gender of Study Participants Gender Total n (%) Male 99 (40.2) Female 147 (59.8) Total 246 (100) Table B: Age Range by Gender Gender Age range <35yrs 35-64yrs 65 yrs & older Total Pearson’s n (row %) n (row %) n (row %) n (row %) Chi Square Male 4 (15.4) 44 (36.4) 51 (52.0) 99 (40.4) Female 22 (84.6) 77 (63.3) 47 (48.0) 146 (59.6) 26 (100.0) 121 (100.0) 98 (100.0) 245 (100.0) Table C: Country of birth Country of birth Total n (%) Australia 67(27.3) Italy 40 (16.3) Middle East 41 (16.7) Other 97 (39.4) Total 245 (99.6) Other comprises: Great Britain 7 (2.9) Turkey 17 (6.9) Greece 8 (3.3) Malta 16 (6.5) Cyprus 6 (2.4) Poland 7 (2.9) And people from other countries Middle East comprises “Why is He Not Smiling?” Dental Costs Study Phase One Final Report Health Issues Centre, August 2008 36 (14.7) Lebanon 17 (6.9) Iraq 18 (7.3) Egypt 6 (2.4) 127 Table D: Length of time in Australia for overseas born >50 yrs ago Total n (%) 28 (17.2) 20-50yrs ago 94 (57.7) 10-20 yrs ago 14 (8.6) 5-10 yrs ago 12 (7.4) Time in Australia < 5 yrs 15 (9.2) 163 (100.0) Table E: Language at home English Total n (%) 137 (55.7) Turkish 18 (7.3) Language at home Italian 19 (7.7) Arabic 29 (11.8) Greek 7 (2.8) Other 36 (14.6) All 246 (100.0) Table F: Education level Education level Total n (%) No formal education 7 (2.8) Primary incomplete 17 (6.9) Primary complete 44 (17.9) Secondary incomplete 94 (38.2) Secondary complete 39 (15.9) Tertiary education All “Why is He Not Smiling?” Dental Costs Study Phase One Final Report Health Issues Centre, August 2008 45 (18.3) 246 (100.0) 128 Table G: Main occupation Total n (%) Main occupation No paid work 31 (12.7) Managers/administrators 2 (0.8) Professionals 14 (5.7) Associate professionals 6 (2.5) Tradespersons 48 (19.7) Advanced clerical & services 7 (2.9) Clerical sales & services 32 (13.1) Production & transport 47 (19.3) Basic clerical sales 16 (6.6) Labourers & unskilled workers 41 (16.8) TOTAL 244 (98.4) Table H: Time since last dental visit How long ago? <12mths Total 105 (42.9) 1-2 yrs 55 (22.4) 2-5yrs 52 (21.2) >5yrs 31 (12.7) No dental visit Total 2 (0.8) 245 (100.0) Table I: Type of last dental visit Last visit emergency? Total No 99 (40.4) Yes 140 (57.2) Unsure Total “Why is He Not Smiling?” Dental Costs Study Phase One Final Report Health Issues Centre, August 2008 6 (2.4) 245 (100.0) 129 Table J: Self-Rating Of Oral Health Oral health status Total Much better 10 (4.2) Better 48 (20.3) About the same 101 (42.8) Worse 56 (23.7) Much worse 21 (8.9) All 236 (100.0) Table K: Number of functional teeth Significant reduction in masticatory efficiency 0 natural functional teeth All 9 (9.1) 12 (8.3) 21 (8.6) 14 (14.1) 17 (11.8) 31 (12.8) 35 (35.4) 35 (24.3) 70 (28.8) 41 (41.4) 80 (55.6) 121 (49.8) 99 (100.0) 144 (100.0) 243 (100.0) 13-20 teeth >20 teeth Total Female Pearson’s chi square NS 1-12 teeth Reduced masticatory efficiency Maximum masticatory efficiency Male Table L: Mean costs of proposed dental treatment by type Type of treatment n=246 Mean cost $ (SD) %Total Mean Cost Diagnostic services 104.30 (6.65) 11.3 Preventive services 74.62 (4.76) 8.1 Periodontal treatment 18.05 (1.15) 2.0 Oral surgery 97.22 (6.20) 10.5 Endodontic treatment 49.57 (3.16) 5.4 Restorative treatment 348.64 (22.23) 37.7 Dentures Other TOTAL 228.51 (14.57) 3.40 (0.22) 24.7 0.4 924.31 (58.93) 100.0 “Why is He Not Smiling?” Dental Costs Study Phase One Final Report Health Issues Centre, August 2008 130 Table M: Range of proposed dental treatment cost Cost of proposed treatment Number of people % of people n = 229 <$100 4 1.7 $101-$200 20 8.3 $201-$300 19 7.9 subtotal $0-$300 43 17.8 $301-$400 23 9.5 $401-$500 20 8.3 $501-$600 13 5.4 subtotal $301-$600 56 23.2 $601-$700 20 8.3 $701-$800 14 5.8 $801-$900 12 5.0 $901-$1000 9 3.7 subtotal $601-$1000 55 22.8 $1001-$1100 6 2.5 $1101-$1200 11 4.6 $1201-$1300 3 1.2 $1301-$1400 19 7.9 $1401-$1500 5 2.1 $1501-$1600 6 2.5 $1601-$1700 5 2.1 $1701-$1800 7 2.9 $1801-$1900 5 2.1 $1901-$2000 5 2.1 subtotal $1001-$2000 60 24.9 $2001-$2500 8 3.3 $2501-$3000 3 1.2 >$3001 4 1.7 subtotal TOTAL “Why is He Not Smiling?” Dental Costs Study Phase One Final Report Health Issues Centre, August 2008 >$2001 15 6.2 229 100 131 APPENDIX TWELVE: MEAN COSTS, NUMBER OF PROPOSED TREATMENT BY TYPE AND BY GROUP Diagnostic Services Diagnostic services include examination, consultation, referral letter and radiograph. On average, fewer diagnostic services were proposed for people waiting two to four months for dental care than those waiting two or more years (2.87 compared with 3.08). This resulted in a small but significant difference in the mean cost of the proposed diagnostic services between the two groups (p=0.04, [see Table 1]). Table 1: Mean costs and number of proposed diagnostic services by type Waiting > 2 years Total procedures Mean number of procedures t-test 333 3.08 2.87 $13,766.15 $11,995.20 $105.89 (9.29) $103.41 (9.60) Total cost Mean cost per patient (SD) Waiting 2-4 months 401 p-value =0.0411012 Preventive Treatment Procedures Preventive treatment procedures refer to plaque removal, fluoride treatment and hygiene instruction, for example. The average number of preventive treatment procedures was similar for the two groups (1.63 compared with 1.59). There was no significant difference in the mean costs of the proposed preventive treatment. Table 2: Mean costs and number of proposed preventive treatment procedures by type Waiting > 2 years Waiting 2-4 months t-test Total procedures 212 184 Mean number of procedures 1.63 1.59 $9,772.85 $8,583.90 Total cost Mean cost per patient “Why is He Not Smiling?” Dental Costs Study Phase One Final Report Health Issues Centre, August 2008 $75.18 (6.59) $74.00 (6.87) NS 132 Periodontic Procedures There were 49 periodontic procedures, for example root planning, proposed for the study participants. More procedures were proposed for people who had waited more than two years for dental treatment, which led to significantly lower costs for people who had waited two to four months for dental care (p<0.00001, [see Table 3]). Table 3: Mean costs and number of proposed periodontic procedures Waiting > 2 years Total procedures Mean number of procedures Total cost Mean cost per patient Waiting 2-4 months 36 t-test 13 0.28 0.11 $3,553.20 $888.30 $27.33 (2.40) $7.66 (0.71) p-value <0.00001 Oral Surgery Oral surgery includes extraction of natural teeth. The mean number of natural functional teeth was 17.8 for those waiting a shorter time for a dental appointment and 19.6 for those waiting longer. On average, the dental treatment plans showed that more teeth are to be extracted from those waiting a shorter time than for those waiting longer. The average costs of proposed oral surgery for those waiting a shorter time was much higher (p<0.00001, [see Table 4]) than those who had waited longer. Table 4: Mean costs and number of proposed oral surgery Total teeth extracted Mean teeth extracted Total cost Mean cost per patient Waiting > 2 years 122 0.94 $9,781.10 $75.24 (6.60) Waiting 2-4 months 170 1.47 $14,133.90 $121.84 (11.31) t-test p<0.00001 Endodontics Endodontics procedures are for example root preparation, removal root filling and interim filling. There was no significant difference in the overall costs of the endodontic procedures proposed for the two groups (see Table 4.16). However, when the comparison is restricted to those procedures related to the proposed removal of a tooth root or its filling, there is a significant difference in treatment costs between the two groups. The average cost for endodontic treatments for people waiting two to four months is significantly less than the costs for those waiting two years or more (p=<0.00001, [see Table 5]). Table 5: Mean costs and number of proposed endodontic procedures Total procedures Mean number of procedures Total cost Mean cost per patient “Why is He Not Smiling?” Dental Costs Study Phase One Final Report Health Issues Centre, August 2008 Waiting > 2 years 59 0.45 $6,822.45 $52.48 (4.60) Waiting 2-4 months 57 0.49 $5,370.95 $46.30 (4.30) t-test NS 133 Table 6: Mean costs and number of proposed endodontic procedures for items 415 416 and 451 Item Number Waiting > 2 years 415 - complete root prep (1) Waiting 2-4 months t-test 20 6 416 - root prep (>1) 9 7 451 - removal root filling 0 2 Total number of procedures 29 15 Mean number of procedures 0.22 0.13 Total cost 415 $3,487.00 $1,046.10 Total cost 416 $652.05 $507.15 Total cost 451 Total cost Mean cost per patient (SD) $0.00 $153.10 $4,139.05 $1,706.35 $31.84 (2.79) $14.71 (1.37) p<0.00001 Restorative Treatments The average number of proposed restorative treatments, or fillings, was 3.72 for those waiting more than two years and 3.43 for those waiting two to four months. This resulted in a significantly lower average cost for people waiting two to four months (p=0.0173, [see Table 7]). Table 7: Mean costs and number of proposed restorative treatments Waiting > 2 years Waiting 2-4 months Total procedures 483 398 Mean number of procedures 3.72 3.43 $45,913.55 $39,852.10 $353.18 (30.98) $343.55 (31.90) Total cost Mean cost per patient (SD) t-test 0.0173 Tables 8, 9 and 10 compare the size of fillings, based on the number of surfaces (sides of tooth that require filling) for both groups. There is no difference between the two groups for one-surface (see Table 8) and two-surface fillings (see Table 9). However, Table 4.21 shows that the mean number of restorations with three or more surfaces for both groups is the same but the costs are significantly different (p=0.00001) because of the distribution of types of fillings proposed (see Table 10). “Why is He Not Smiling?” Dental Costs Study Phase One Final Report Health Issues Centre, August 2008 134 Table 8: Mean costs and number of proposed restorative treatments with 1 surface fillings Item Number Waiting > 2 years Waiting 2-4 months t-test 511 metallic restoration (1) 63 50 521 resin restoration (1) 62 31 531 resin restoration p(1) 43 44 168 125 Total restorations Mean number of restorations 1.29 1.08 511 metallic restoration (1) $4,759.65 $3,777.50 521 resin restoration (1) $5,409.50 $2,704.75 531 resin restoration p(1) $3,964.60 $4,056.80 $14,133.75 $10,539.05 $108.72 (9.54) $90.85 (8.44) Total cost restorations Mean cost of restorations (SD) NS Table 9: Mean costs and number of proposed restorative treatments with 2 surface fillings Item Number 512 metallic restoration (2) Waiting > 2 years Waiting 2-4 months t-test 112 73 522 resin restoration (2) 19 31 532 resin restoration p(2) 21 41 152 145 1.17 $10,528.00 1.25 $6,862.00 522 resin restoration (2) $2,329.40 $3,800.60 532 resin restoration p(2) $2,517.90 $4,915.90 $15,375.30 $15,578.50 $118.27 (10.37) $134.30 (12.47) Total restorations Mean number of restorations 512 metallic restoration (2) Total cost restorations Mean cost of restorations (SD) “Why is He Not Smiling?” Dental Costs Study Phase One Final Report Health Issues Centre, August 2008 NS 135 Table 10: Mean costs and number of proposed restorative treatments with 3 or more surface fillings Waiting > 2 years 513 metallic restoration (3) 514 metallic restoration (4) 515 metallic restoration (5) 523 resin restoration (3) 524 resin restoration (4) 525 resin restoration (5) 533 resin restoration p(3) 534 resin restoration p(4) 535 resin restoration p(5) 577 cusp capping Total restorations Mean number of restorations 513 metallic restoration (3) 514 metallic restoration (4) 515 metallic restoration (5) 523 resin restoration (3) 524 resin restoration (4) 525 resin restoration (5) 533 resin restoration p(3) 534 resin restoration p(4) 535 resin restoration p(5) 577 cusp capping Total cost restorations Mean cost of restorations (SD) “Why is He Not Smiling?” Dental Costs Study Phase One Final Report Health Issues Centre, August 2008 Waiting 2-4 months 16 10 3 19 6 0 10 11 6 29 23 8 4 31 4 3 5 7 2 12 110 0.85 $1,824.80 $1,340.50 $462.90 $2,329.40 $870.90 $0.00 $1,465.00 $1,895.30 $1,186.80 $635.10 $12,010.70 $92.39 (8.10) 99 0.85 $2,623.15 $1,072.40 $617.20 $3,800.60 $580.60 $503.25 $732.50 $1,206.10 $395.60 $262.80 $11,794.20 $101.67 (9.44) t-test p-value<0.00001 136 Tables 11, 12 and 13 compare the type of fillings for both groups. There is no difference between the two groups for adhesive resin fillings (see Table 11). However, Table 12 shows that more metallic fillings are included in the treatment plan of people who have waited two or more years and that costs are significantly higher (p=0.00001). Table 13 shows that composite resin fillings are because of the distribution of types of fillings proposed. Table 11: Mean costs and proposed restorative treatments for metal fillings Item Number Waiting 2-4 months Waiting > 2 years 511 metallic restoration (1) 63 50 512 metallic restoration (2) 112 73 513 metallic restoration (3) 16 23 514 metallic restoration (4) 10 8 515 metallic restoration (5) Total restorations 3 4 204 158 Mean number of restorations 1.57 1.36 511 – metallic restoration (1) $4,759.65 $3,777.50 512 metallic restoration (2) $10,528.00 $6,862.00 513 metallic restoration (3) $1,824.80 $2,623.15 514 metallic restoration (4) $1,340.50 $1,072.40 515 metallic restoration (5) $462.90 $617.20 $18,915.85 $14,952.25 $145.51 (12.76) $128.90 (11.97) Total cost restorations Mean cost of restorations (SD) p-value<0.00001 Table 12: Mean costs and proposed restorative treatments for adhesive resin fillings Item Number Waiting 2-4 months Waiting > 2 years 521 resin restoration (1) 62 31 522 resin restoration (2) 60 55 523 resin restoration (3) 19 31 524 resin restoration (4) 6 4 525 resin restoration (5) 0 3 Total restorations 147 124 Mean number of restorations 1.13 1.07 521 resin restoration (1) $5,409.50 $2,704.75 522 resin restoration (2) $6,447.00 $5,909.75 523 resin restoration (3) $2,329.40 $3,800.60 524 resin restoration (4) $870.90 $580.60 525 resin restoration (5) $0.00 $503.25 Total cost restorations Mean cost of restorations (SD) “Why is He Not Smiling?” Dental Costs Study Phase One Final Report Health Issues Centre, August 2008 $15,056.80 $13,498.95 $115.82 (10.16) $116.37 (10.80) NS 137 Table 13: Mean costs and proposed restorative treatments for composite resin fillings Item Number Waiting > 2 years Waiting 2-4 months 531 resin restoration p(1) 43 44 532 resin restoration p(2) 21 41 533 resin restoration p(3) 10 5 534 resin restoration p(4) 11 7 535 resin restoration p(5) 6 2 Total restorations 91 99 0.70 0.85 531 resin restoration p(1) $3,964.60 $4,056.80 532 resin restoration p(2) $2,517.90 $4,915.90 533 resin restoration p(3) $1,465.00 $732.50 534 resin restoration p(4) $1,895.30 $1,206.10 Mean number of restorations 535 resin restoration p(5) Total cost restorations Mean cost of restorations (SD) $1,186.80 $395.60 $11,029.60 $11,306.90 $84.84 (7.44) $97.47 (9.05) p-value<0.00001 Dentures Table 14 shows there is no statistical difference in costs for dentures between the two groups. The dental plans anticipated that more full dentures would be needed for the group that had waited two to four months compared to those that waited two or more years. The cost difference is significant (p<0.00001, [see Table 15]). On the other hand, more partial dentures were proposed for the group that had waited two years or more with a significant difference in costs (p<0.00001, [see Table 16]). Table 14: Mean costs and number of proposed dentures Waiting > 2 years Total dentures and repairs 118 Mean number of dentures and repairs 70 0.91 0.60 $31,695.40 $24,516.85 $243.81 (22.64) $211.35 (19.62) Total cost Mean cost per patient (SD) Waiting 2-4 months “Why is He Not Smiling?” Dental Costs Study Phase One Final Report Health Issues Centre, August 2008 NS 138 Table 15: Mean costs and number of proposed complete upper and lower dentures Item Number Waiting > 2 years Waiting 2-4 months 711 Complete upper denture ($706.40) 7 10 712 Complete lower denture ($706.40) 3 2 719 Complete upper and lower dentures ($1,265.60) 2 3 Total dentures 12 15 0.09 0.13 711 Complete upper denture ($706.40) $4,944.80 $7,064.00 712 Complete lower denture ($706.40) $2,119.20 $1,412.80 719 Complete upper and lower dentures ($1,265.60) $2,531.20 $3,796.80 $9,595.20 $12,273.60 Mean cost per patient (SD) $73.81 (6.47) $105.81 (9.82) Mean number of dentures p-value<0.00001 Table 16: Mean costs and number of proposed partial dentures Item Number 721A Part. resin upper denture 1 tooth ($) 721B Part. resin upper denture 2 teeth ($) 721C Part. resin upper denture 3 teeth 721D Part. resin upper denture 4 teeth 721E Part. resin upper denture 5-9 teeth 721F Part. resin upper denture 10-12 teeth 722E Part. Resin lower denture 5-9 teeth 722F Part. Resin lower denture 10-12 teeth Total partial dentures Mean partial dentures 721A Part. resin upper denture 1 tooth 721B Part. resin upper denture 2 teeth 721C Part. resin upper denture 3 teeth 721D Part. resin upper denture 4 teeth 721E Part. resin upper denture 5-9 teeth 721F Part. resin upper denture 10-12 teeth 722E Part. Resin lower denture 5-9 teeth 722F Part. Resin lower denture 10-12 teeth Waiting > 2 years Mean cost per patient (SD) “Why is He Not Smiling?” Dental Costs Study Phase One Final Report Health Issues Centre, August 2008 Waiting 2-4 months 1 0 1 1 3 2 8 5 19 11 2 0 0 2 1 35 0.27 0 21 0.18 $319.20 $0.00 $364.55 $364.55 $1,279.80 $853.20 $3,835.20 $2,397.00 $364.55 $364.55 $1,312.10 $0.00 $0.00 $1,160 $656.05 $8,131.45 $62.55 (5.49) $0.00 $5,139.30 $44.30 (4.11) p-value<0.00001 139 Other services Other services included drug therapy, interpreter services and post-operative care. There was no difference in the number of these services between the two groups although the average cost of other services was significantly higher for those waiting two to four months for a dental visit (p<0.00001,[see Table 17]). Table 17: Mean costs and number of proposed other services Waiting > 2 years Total services Mean number of services Total cost Mean cost per patient “Why is He Not Smiling?” Dental Costs Study Phase One Final Report Health Issues Centre, August 2008 Waiting 2-4 months p-value= 15 13 0.12 0.11 $360.70 $476.50 $2.77 (0.24) $4.11 (0.38) p-value<0.00001 140

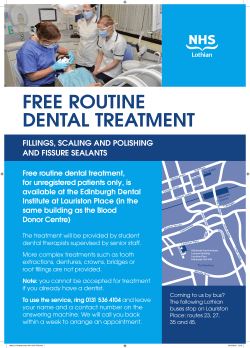

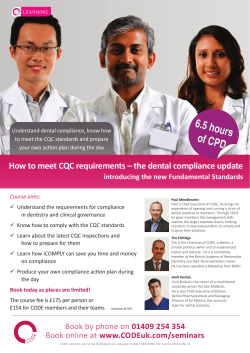
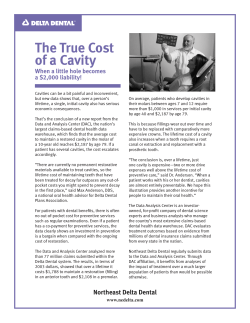
© Copyright 2026