
Why Do Users Like Video? Studies of Multimedia-Supported Collaboration
Why Do Users Like Video?
Studies of Multimedia-Supported Collaboration
John C. Tang and Ellen Isaacs
1. The promise and perplexity of multimedia-supported collaboration
Multimedia technology promises to enable smooth and effective interactions among collaborators in different locations. The growing need to support technical and social activity that occurs across geographical distances has not been fully satisfied by the current
technologies of phones, faxes, electronic mail, and video conference rooms. Visions of
systems that allow people from around the world to see and hear each other have been
promoted at least since AT&T unveiled the PicturePhone in the mid-1960’s.
Recent technology and infrastructure developments are adding to the promise of multimedia support for remote collaboration [Gale 1992]. The emergence of digital audio
and video technology allows voice and images to be computationally manipulated and
transmitted over the existing computer networks. Improved compression algorithms
running on faster hardware promise to provide acceptable audio-video quality at viable
network bandwidth rates. The availability of affordable computer workstations, proliferation of digital networks, emergence of compression algorithm and network protocol
standards, and marketing hype are converging to bring multimedia capability to personal
desktops.
Research prototypes that provide what is often referred to as desktop conferencing
(audio, video, and computational connections between computer desktops) have been
demonstrated using analog [Root, 1988; Stults et al., 1989; Buxton & Moran, 1990] and
digital [Watabe et al., 1990; Masaki et al., 1991] technology. Olson and Bly [1991]
reported on the experiences of a distributed research group using a network of audio,
video, and computer connections to explore ways of overcoming their separation in location and time. These prototypes have demonstrated the technical feasibility of desktop
conferencing, experimented with some of its features, and provided a glimpse of how
people will use it.
However, increased costs (e.g., upgrading networks, buying media-equipped workstations) and uncertainty over the benefits of collaborative multimedia have been significant
barriers to its widespread adoption and use. While videophone products have recently
reappeared in the marketplace, the lack of commercial success of PicturePhone since it
was introduced almost 30 years ago indicates that there is much yet to be learned about
the deployment and use of collaborative multimedia technologies [Francik et al., 1991].
Furthermore, research to date on the effects of various communication media on collaborative activity has not provided convincing evidence of the intuitively presumed
value of video [Williams, 1977]. Ochsman and Chapanis [1974] examined problem1
solving tasks in various communication modes including typewriting, voice only, voice
and video, and unrestricted (working side-by-side) communication. They concluded that
relative to communication modes using an audio channel, “...there is no evidence in this
study that the addition of a video channel has any significant effects on communication
times or on communication behavior.” [Ochsman & Chapanis, 1974, p. 618].
Gale [1990] compared computer-mediated collaboration on experimental tasks under
three conditions: sharing data only (via a shared electronic whiteboard), sharing data and
audio, and sharing data, audio, and video. He also concluded, “The results showed no
significant differences in the quality of the output, or the time taken to complete the
tasks, under three conditions: data sharing; data sharing plus audio; data sharing plus
audio and video.” [Gale, 1990, p. 175]. Gale did find that collaborators’ perceptions of
productivity increased as communication bandwidth increased and suggested that higher
bandwidth media enabled the groups to perform more social activities.
Some research has begun to identify uses of video in support of remote collaboration.
Smith et al. [1989] compared computer-mediated problem-solving activity in audio only,
audio and video, and face-to-face settings. They found that the presence of the video
channel encouraged more discussion about the task rather than the mechanics of the
computer tool being used for the task. Fish et al. [1992] equipped mentor-student pairs
of researchers with a desktop conferencing prototype and studied their informal communication over several weeks. They found that the prototype was used frequently, but the
users thought of it more like a telephone or electronic mail rather than face-to-face communication.
Most of the studies to date have used artificial groups (subjects randomly assigned to
work together) working on short, contrived tasks (problems unrelated to their actual
work). We hypothesized that evidence for the value of video would be most visible in
actual work activity of real working groups. We set out to study real examples of synchronous, distributed, small group collaboration in order to understand how multimedia
technology (video in particular) could be designed to support that activity. The research
pursued an iterative cycle of studying existing work activity, developing prototype systems to support that activity, and studying how people use those prototypes in their work
[Tang, 1991b].
In this paper, we first describe two background studies that examine existing remote
collaboration work practice—a survey of users’ perceptions of an existing video conference room system and a study of a geographically divided work group in various collaboration settings. Then we describe the development of a prototype desktop conferencing
system, which embodied some of the design implications identified by the background
studies. We used that prototype to study a distributed team under three conditions: using
their existing collaboration tools, adding the desktop conferencing prototype, and subtracting the video capability from the prototype. We conclude by discussing evidence
from the three studies which help explain why users like video and other related issues.
2. Survey of video conference room users
The first background study surveyed users’ perceptions about an existing video confer2
ence room system. The survey was conducted within Sun Microsystems, Inc. which at
the time used commercially available video conference room systems (PictureTel Corporation model CT3100 operating at 112kb/s bandwidth). These systems connected conference rooms among sites in Mountain View, California; Billerica, Massachusetts;
Colorado Springs, Colorado; and Research Triangle Park, North Carolina. In addition to
the audio-video link, they could also send high quality video still images on a separate
video display.
A survey was sent via electronic mail to users of the video conference room system.
The survey asked for usage information and for the users’ perceptions of the system. A
total of 76 users responded to the survey, with representatives from all four sites and a
variety of types of meetings (e.g., staff meetings, presentations, design meetings).
2.1 Survey Results
Users were asked to indicate the best aspects of video conferencing. Respondents could
check more than one item from a list of choices as well as add their own items. Most
respondents (89%) liked having regular visual contact with remote collaborators. Many
also indicated that it saved travel (70%) and time (51%). This survey measured only the
users’ perceptions of saved time and travel, not whether those savings actually occurred.
Users were also asked to indicate the worst aspects of their video conferencing experience. The percentage of respondents who checked each aspect is shown in Figure 1.
The most frequently indicated problem (72%) was difficulty in scheduling an available
room. Poor audio quality (poor microphone pickup, moving the microphones into range
of the speaker, echo, etc.) was indicated by 55% of the respondents, 53% mentioned not
being able to see overheads and other materials used in presentations, and 52% complained about the time delay (latency) in transmitting audio and video through video
conferences. Between Mountain View, California and Billerica, Massachusetts, the system exhibited about a 0.57 second delay between capturing voice and video on one end
and producing them on the other end. Poor video quality was relatively less troubling;
only 28% mentioned it as a problem.
Some sample comments from the survey that illustrate these observations:
... we need more video rooms! They are overbooked.
% respondents
100
50
0
scheduling
Figure 1. Worst aspects of video conferencing
Percentage of respondents who indicated the following as the worst aspects of their video conferencing
experience: difficulty in scheduling the room, poor
audio quality, poor ability to see and interact with
overhead slides, time delay (latency) in audio-video
transmission, and poor video quality.
poor audio
poor overhead
time delay
poor video
3
... audio quality is the real problem. Both audio quality and delay.
Difficulty in being able to make a comment--can’t see a verbal opening coming
because of the delays and image and audio quality
Can’t provide direct feedback on written material (e.g., by pointing and/or annotating slides and drawings presented remotely)
Respondents were also asked to rank order a list of additional capabilities (to which
they could add their own) they would like to have in video conferencing. Figure 2 shows
the five most frequently requested features with each item’s average rank (rank 1 is most
urgently desired) labelled on the bar chart. The need for a shared drawing surface stood
out as the most commonly desired feature; 68% of the respondents mentioned it as a
desired feature, and its average rank order was 1.76. Respondents also indicated that
they wanted a larger video screen (34%) and the ability to connect multiple sites together
at the same time (30%). Only 18% wanted to incorporate computer applications, but its
low average rank (1.75) suggests that those who wanted it considered it a highly desirable feature. Users suggested incorporating software such as word processing, spreadsheet, and shared whiteboard applications. More comments from the survey:
A shared drawing surface could be really useful. It should be a single device, so
that you draw on the device and see your marks and the other person’s marks
on that same device.
...networked [computer workstation] in each conference room would be nice, especially one that could project onscreen at the local site and at the remote
sites...
[larger video screen] so I can really tell who’s talking and get a fix on facial/
body talk better...
A similar survey of users of video conferencing systems [Masaki et al., 1991] identified
some of the same features as requirements for improving video conferencing. They
found that users wanted a virtual common space (including a shared drawing space),
% respondents
1.76
2.12
larger screen
2.18
multiple sites
computer tools
4
2.40 1.75
more cameras
100
50
0
shared drawing
Figure 2. Desired features for video conferencing
Percentage of respondents who indicated the following as
the features they would like to add to video conferencing:
a shared drawing surface, larger video screen, connections
among multiple sites at a time, more camera views, and
access to computer tools while in a conference. The average rank of how urgently each feature was desired is also
labelled (rank 1 being most urgently desired).
integration of teleconference and computational tools, and multiple site conferencing
capability.
2.2 Design Implications From Surveying Video Conferencing Users
The survey did show that video conferencing users broadly appreciated the capabilities
of video conferencing. Users’ comments indicated that collaboration between remote
sites would not be as effective or even possible without video conferencing. The survey
responses indicated that multimedia tools to support collaboration should:
• be readily available for use,
• provide a shared workspace, and
• provide high quality, interactive audio among sites.
Note that the aspect of the system that users found most troublesome (scheduling difficulty) is a problem of use, not a technical problem per se. The technical benefits (and
problems) of multimedia-supported collaboration tools will not be discovered if users
cannot readily access them. Respondents’ desire for a shared workspace reinforces
research results identifying the crucial role of shared workspaces in remote collaboration
[Olson & Bly, 1991; Tang, 1991a]. The responses also clearly indicated the need to
improve the audio channel, both in sound quality and transmission delay. By contrast,
users were not as disturbed about the image quality of the video channel. This pattern is
consistent with results reported in the literature on the greater importance of audio relative to video in supporting remote collaboration [Gale, 1990; Ochsman & Chapanis,
1974].
3. Study of collaboration in various settings
After completing the video conferencing survey, we studied a work group composed of
four members from two different sites: three in Billerica, near Boston, and one (the second author of this paper) in Mountain View, in the San Francisco Bay Area. Their discussions centered around graphical user interfaces for on-line help systems. The group
conducted weekly video conference room meetings, supplemented by occasional phone
conferences. At one point in the project, the Mountain View participant visited Billerica
for a week of face-to-face meetings. Although some participants knew each other from
previous work contacts, this was the first time they worked together extensively as a
project team.
Over two months, meetings in each of the collaboration settings were videotaped and
analyzed to identify characteristics of their collaboration that varied among the settings.
The collected data comprised eight video conferences, five face-to-face meetings, and
one phone conference, amounting to over 15 hours of data.
3.1 Findings From The Study Of Collaboration Settings
From reviewing the videotapes, we found that the team experienced certain problems
while using the video conference rooms that did not arise in face-to-face meetings:
5
• problematic audio collisions,
• difficulty in directing the attention of remote participants, and
• diminished interaction.
During their video conferences, there were many instances of audio collisions when
participants on both sides started talking simultaneously and then had difficulty negotiating who should take the next turn. Although such collisions naturally occur in face-toface and phone conversations, they were more problematic in video conferencing. In
face-to-face conversation, turn transitions are largely negotiated verbally (aided by gestures) through precise timing (sometimes involving overlapping talk) and systematic,
implicit organization [Sacks et al., 1974]. The more than half-second delay in transmitting audio between video conference rooms disrupted these mechanisms for mediating
turn-taking. As a result, participants sometimes relied on gestural cues (e.g., extending a
hand toward the camera conveying “you go first”), which were usually successful if
seen.
The participants also had occasional difficulty directing a remote collaborator’s attention to the video display so that these gestures would be seen. We observed several
examples of “just missed” glances between remote collaborators when one participant
would look up from her notes to glance at her remote collaborator, but returned looking
down at her notes just before the remote collaborator looked up at his video display to
glance at her. These missed glances could largely be explained by delayed reactions
caused by the transmission delays. However, just missed glances have also been
observed in audio-video links that do not have any perceivable delay [Smith et al., 1989;
Heath & Luff, 1991]. Current research suggests that lack of peripheral vision, division
of attention between video windows and the shared workspace, and other aspects of
video links also play a role in disrupting the coordination of glancing at each other.
Difficulties in negotiating turn-taking and directing participants’ attention in video
conferencing apparently combined to reduce the amount of interaction between the
remote parties compared to face-to-face meetings. Video conferences tended to consist
of a sequence of individual monologues rather than interactive conversations. We
observed less frequent changes of speaker turns, longer turns, and less back-channelling
in video conferencing than in face-to-face meetings. This reduced level of interaction
appeared to affect the content of video conferences by suppressing complex, subtle, or
difficult-to-manage interactions. Participants seemed inhibited from expressing their
opinions and, in particular, avoided working through conflict and disagreement. Video
conferences also exhibited a marked lack of humor (in part because humor relies on precise timing).
3.2 Design Implications From Studying Collaboration Settings
Comparing collaboration in video conferencing with face-to-face and phone conferencing settings underscored the need to provide responsive (minimally delayed) audio in
technology to support interaction. The work group we studied was so frustrated by the
audio delays in video conferencing that they turned off the audio provided by the video
conferencing system and placed a phone call (using speakerphones) for their audio channel. Although this arrangement eliminated the audio delay, the audio now arrived before
6
the accompanying video (i.e., audio and video were no longer synchronized), the audio
quality was poorer, and speakerphone audio was only half-duplex (only one party’s
sound was transmitted at a time). Nonetheless, the collaborators strongly preferred this
arrangement to the frustrations they experienced with the delayed audio. Their meetings
conducted under this arrangement appeared to exhibit more frequent changes in speaker
turns, more back-channelling, and more humor than those using the normal video conference configuration. More research is needed to investigate these informal observations.
This experience indicates that users prefer audio with minimal delay even at the
expense of disrupting synchrony with the video. This observation again confirms
research findings of the greater importance of audio relative to video [Gale 1990; Ochsman & Chapanis, 1974], and is also consistent with users’ perceptions from the survey
that audio quality and responsiveness are more important than video quality. This finding suggests that, given the limited bandwidth and performance available for desktop
conferencing, more attention should be devoted to providing responsive, interactive
audio. More research on the trade-offs and limits of degrading other parameters of desktop conferencing (e.g., video quality, video refresh rate, audio quality, audio silence suppression) is needed.
While our studies confirm the greater importance of audio relative to video, they also
provide evidence for the value of video in supporting remote collaboration. Through the
video channel, gestures were used to demonstrate actions (e.g., enact how a user would
interact with an interface) and the participants’ attitudes. Especially under the delayed
audio conditions of video conferencing, video was valuable in helping mediate interaction (e.g., using gestures to take a turn of talk) [Krauss et al., 1977].
4. Developing a desktop conferencing prototype
The observations gained from these two studies helped guide the design of our research
prototypes for new multimedia technology to support collaboration. An initial phase of
this research was to design and implement a prototype desktop conferencing system that
provided real-time audio and video links and a shared drawing program among participants at up to three sites. The desktop conferencing prototype was built on a prototype
hardware card that enabled real-time video capture, compression, and display on a workstation desktop. This prototype card, in conjunction with the workstation’s built-in
audio capability, enabled digital audio-video links among workstations on a computer
network.
Figure 3 shows the user interface for establishing and managing desktop conferences.
Initiating a conference was modeled after placing a telephone call. A user selected from
a list of receivers to request a conference with them. An identical copy of the interface
appeared on the receivers’ screens, announced by three beeps. Each receiver could
decide to join or decline the conference. A shared message area allowed users to send
text messages among each other to negotiate joining or refusing a conference.
Once all receivers joined the conference, the collaborative tools that the group
7
Figure 3. User interface for managing conference connections
John places a call to Amy to request a conference using the default conference properties of audio, 10 frames per second video, and the Show Me shared drawing tool.
Figure 4. Screenshot of a desktop conference
A typical 2-person desktop conference consists of the Show Me shared drawing tool (showing an image of a spreadsheet), a video window of the remote
user (Amy), and preview video window of the outgoing video signal.
requested were invoked. Figure 4 shows a screen image of the tools that comprised the
desktop conferencing prototype. For a two-way conference, each user’s screen displayed:
- a video window of the remote collaborator,
- a preview window of the video signal being sent to the remote collaborator, and
- a shared markup and drawing program (called Show Me) for drawing, typing,
8
pointing, and erasing over shared bitmap images.
Show Me allowed users to create shared free-hand graphics and allowed any user to grab
a bitmap image from their screen and share that image with the others.
The two studies of existing collaboration activity helped shape the design of the desktop conferencing prototype. The survey identified users’ need for a shared drawing
space, prompting a significant investment in the development of the Show Me shared
drawing tool. The design of Show Me drew upon shared drawing research [Tang & Minneman, 1991; Minneman & Bly, 1991] to provide a drawing surface that remote collaborators could share in much the same way that face-to-face collaborators use a
whiteboard.
The study of collaboration settings identified the problem of audio delay and underscored the importance of the audio channel in mediating interaction. The delay in the
audio of the desktop conferencing prototype was minimized to be in the range of 0.220.44 seconds (depending on computational and networking constraints). Since the audio
and video data streams were being sent through a computer network that was shared
with other users, spurts of heavy network traffic affected the prototype’s performance.
When network loading prevented video frames from being delivered at the requested
video rate, the video image would occasionally freeze until an updated frame was
received. More severe loading caused cut outs in the audio signal. One characteristic of
handling the audio and video data streams separately was that the timely delivery of
video would degrade before the delivery of audio was disrupted. This behavior reflected
the study’s finding that immediate and responsive audio was more important than preserving audio-video synchrony.
5. A Study of the use of desktop conferencing
We used the desktop conferencing prototype (DCP) to study the collaborative work
activity of a distributed team in three different conditions.
Pre-DCP: using conventional collaboration tools (phone, e-mail, video conference rooms, etc.) as they currently were doing.
Full-DCP: adding the desktop conferencing prototype (audio, video, Show Me).
DCP minus video: subtracting the video channel from the desktop conferencing
prototype (audio and Show Me only).
By measuring the team’s use of these communication media and analyzing actual work
activity across the three conditions, we sought to learn how desktop conferencing, and
the video channel in particular, would be used in remote collaboration.
5.1 Background
The team we studied initially consisted of four members distributed across three locations. One member was located in Billerica, Massachusetts, another worked in a building in Mountain View, California, and the remaining two members worked in offices
9
near each other in a different building in Mountain View (approximately 100 yards away
from the other building). The team worked together developing automated software testing tools. They were previously all located together in neighboring cubicle offices at the
Billerica site but, for reasons not related to their work on this project, were relocated to
these distributed sites a few months before the beginning of the study. During the course
of the study, a fifth team member was added at the Billerica site in a cubicle facing that
of the other Billerica team member.
Although the team had no formal hierarchy, there were differences in their job
responsibilities. The project leader (PL) was located alone in one Mountain View building. The two members located in the other Mountain View building were software
developers (SD1 and SD2) who wrote most of the computer code. The customer representative (CR1) in Billerica communicated the customers’ needs, requirements, and
experiences to the rest of the team. The newly added member in Billerica (CR2) had a
job similar to CR1.
Altogether, we studied the team’s work activity for 14 weeks. After three weeks in
the pre-DCP condition, the desktop conferencing prototype was installed into each team
member’s workstation. This installation involved inserting a hardware card into each
existing workstation, adding a second display screen (except for CR1 who continued to
use a single display), outfitting each office with a camera and speakers, and adding software to their system. Due to equipment limitations, we were unable to equip the added
member of the team (CR2) with a prototype, but he often joined CR1 in desktop conferences or used CR1’s workstation when he was not in the office. The team was studied in
the full-DCP condition for seven weeks in an attempt to go beyond the initial novelty
effect of introducing a technology to a more routine pattern of use. For the DCP minus
video condition, the hardware card and second display screen were removed; the speakers and camera (camera’s microphone was used for audio input) were left in their offices.
The team was studied in the DCP minus video condition for four weeks.
When operating at 30 video frames per second (fps), a desktop conference (audio,
video, Show Me) consumed approximately 1.6 Mbit/s of network bandwidth. The bandwidth demand came mostly from the video stream and could be reduced almost directly
in proportion to the requested video frame rate. At 10 fps, desktop conferences could
use the existing local area networks without overly disrupting other network traffic.
However, dedicated network bandwidth was needed for robust connections between the
Billerica and Mountain View sites. A 0.5 Mbit/s link was leased that provided enough
bandwidth to support conferencing at 5 fps. Because of this limitation, the default video
frame rate was set to 5 fps for all desktop conferences among the team, although any
user could change this rate before starting a conference. This video frame rate was
noticeably less lively than the 30 fps used in full-motion video, and we wanted to learn if
that video rate was usable.
5.2 Observation Methodologies
A variety of observational methods were used to obtain information from several different perspectives for this study:
- Phone calls received from other team members were automatically logged (num10
ber of calls, average duration) by the corporate internal phone system.
- Electronic mail messages sent to the other team members and to the team’s distribution list were collected.
- Desktop conferences made using the prototype were automatically logged (start
& stop time, who was being conferenced, conference parameters, etc.) by software built into the prototype.
- Face-to-face meetings among team members at the Mountain View site were
logged by the team members.
This data provided an opportunity to observe many differences in the use of these communication media across the three conditions.
In addition to the quantitative data collected, we videotaped selected samples of collaborative activity in each of the three conditions. After each videotape was made, the
participants were always given the option of erasing the videotape if they were uncomfortable with having a record of that interaction. The videotape data captured 19 interactions including examples of: all team video conference room meeting, all team face-toface meeting, two-person face-to-face meeting, three-way phone conference, two-way
desktop conference, three-way desktop conference (involving all five team members),
four-way desktop conference, and two-way Show Me conference (with phone audio).
These tapes were analyzed by a multi-disciplinary group that included the designers of
the prototype, a psychologist, and user interface designers. The group studied the tapes
in the tradition of interaction analysis [Tatar, 1989] to understand how the team accomplished their collaborative work and compared similar types of activity across different
instances collected on videotape.
Furthermore, we interviewed each team member individually to gather their perceptions about their work activities at various stages during the three conditions of the
study:
- at the beginning of the study, to understand their existing work activity;
- before the installation of the desktop conferencing prototype, to test their expectations of how they would use the prototype;
- mid-way through the use of desktop conferencing prototype, to see how they
were responding to it;
- just prior to removing the video capability, to test their expectation of how that
would affect their use of the tools; and
- at the end of the study, to review their perceptions of the experience.
5.3 Limitations Of The Data
It is important to note the context and limitations of these data to appropriately understand and apply the results from this study. Since this team previously had been colocated, they were in some respects not representative of distributed groups in general.
On the other hand, they also knew how they had interacted when co-located and could
evaluate how well the prototype tools fulfilled those interactional needs. Since video is
believed to be especially useful in supporting social activities [Gale, 1990], the team’s
existing social relationships made them a good candidate to demonstrate any benefit
11
from that capability.
Although we intended to collect data that would provide a clean comparison among
the three conditions, several factors combined to complicate the data collection and the
analyses that can be drawn from the data. In general, the quantitative data were relatively sparse and had large variances, making it less likely that we could demonstrate statistically significant differences. Several factors contributed to the variance in the data.
Company holidays shortened weeks 1 and 5 by one day. Training classes or travel
caused one or more team members to be away from the office for an entire week during
weeks 3, 4, 7, 8, and 11 of the study. These absences not only affected the data, but also
caused some adjustments in the duration of the three conditions. A total of 15 other individual days of absence (e.g., illness, day off) occurred during the study. During the third
week of the full-DCP condition (week 6), both CR1 and CR2 from Billerica traveled to
Mountain View to meet with the team and others there. Besides affecting the data collected for that week, the visit had an effect on the progress and nature of the team’s subsequent work.
Also, several uncertainties were discovered in the phone, e-mail, and face-to-face
meeting logging. Problems with the automatic phone logging of the Billerica team
members resulted in lost data. Consequently, our analyses are based only on the data of
calls received by Mountain View team members. After the study started, PL realized
that he was logging e-mail from only one of two sources that he sends mail from, resulting in some lost e-mail data from him. In addition, we allowed the participants to delete
any e-mail messages that they did not want us to see before making their e-mail logs
available to us. Although this added some uncertainty to the e-mail data collected, we
felt that it was a worthwhile trade-off in order to accommodate their participation in the
study. Since we did not provide the new team member (CR2) with a desktop conferencing prototype, we did not include any quantitative data collected on CR2’s activity in the
analyses.
Because we were relying on the team members to report their face-to-face meetings,
some meetings were probably recorded inaccurately or not at all. These meeting logs
also had some inherent uncertainty since individuals reported the same meeting differently (different start and stop times, different participants). We reminded them to log
their meetings throughout the study to counteract any tendency to overlook their selflogging over time.
While all of these factors frustrated our attempt to get clean, quantitative data to compare among the three conditions, they were accommodated to preserve the team’s actual
working activity with minimal disruption from the study. The quantitative data were
used to identify trends and raise issues that we could examine through the other qualitative data that we had collected. Even though these variations limit some of the claims we
can make based on the quantitative data, we accept them as a characteristic of studying
actual work activity, rather than studying behavior in an isolated, laboratory setting.
12
6. Analyzing the use of desktop conferencing
The quantitative and qualitative data were analyzed for any patterns or changes across
the three conditions. We conducted statistical tests on the quantitative data to identify
any significant differences across the conditions. We used the videotape and interview
data to discover any changes across the conditions and to help explain patterns that were
observed in the quantitative data. These analyses revealed that desktop conferencing:
• did not increase overall interactive communication usage,
• was used more heavily when video was available,
• substituted for e-mail messages,
• may have substituted for shorter face-to-face meetings,
• changed the usage pattern of phone calls,
• was a novel collaboration setting, and
• afforded being aware of where people were looking (gaze awareness).
6.1 No Increase In Overall Interactive Communication Usage
The data indicate that introducing desktop conferencing did not systematically change
the total amount of interactive communication (face-to-face meetings, phone calls, desktop conferences) for the team. A measure of usage for each medium of interactive communication was calculated by multiplying the duration of each interaction by the number
of people involved. Figure 5 graphs the combined measures of usage for the interactive
communication media per week. The most visible feature of this graph is the spike in
week 6. This was the week when the team members from Billerica traveled to Mountain
View to meet face-to-face together with the team.
person-minutes of usage
Besides the spike in week 6, there is no other visible pattern in the combined usage of
interactive media throughout the three conditions. An analysis of variance showed no
significant differences in the total measure of usage across the three conditions (p < 0.17,
where less than 0.05 indicates significance). This lack of an effect is itself a finding, suggesting that the additional desktop conferencing capability did not cause the team to
6000
5000
pre-DCP
full-DCP
DCP - video
4000
3000
2000
1000
week
Figure 5. Total measure of usage for all forms of interactive communication
Total number of person-minutes of face-to-face meetings, phone calls, and desktop conferences combined per week. Note that weeks 1 and 5 only had four working days due to company holidays.
13
spend more time in interactive communication. Instead, desktop conferences apparently
substituted for other forms of communication. A closer look at the data provides some
insights into the usage relationships among the communication media.
6.2 Video Determined How Much Desktop Conferencing Was Used
The data clearly show that the presence of the video capability determined how much the
desktop conferencing prototype was used. Figure 6 plots each of the communication
media for the 14 weeks of the study (excluding the atypical week 6). For e-mail, the
number of e-mail messages was counted as a measure of usage. The use of the desktop
conferencing prototype significantly decreased during the DCP minus video condition
when the video capability was taken away (p < 0.02). This result indicates that the video
capability was the determining factor in whether the team used the desktop conferencing
prototype. Why did the users like using video so much?
Interviews with the team indicated that they strongly liked the video because they
could see each others’ reactions, monitor if they were being understood, and engage in
more social, personal contact through video. Besides using desktop conferencing for
technical discussions, they also reported using it for informal chatting. Some team
members expressed that having the video improved the communication among the team.
Turning to the videotape data of their use of the desktop conferencing prototype, we
could see specific evidence of their use of video that would contribute to these positive
perceptions.
Video played a crucial role in facilitating their interaction. It clearly helped remote
collaborators interpret long audio pauses. We observed many pauses in desktop conferences, lasting up to 15 seconds, but the participants did not mark them as problematic.
The video channel provided visual cues that explained the purpose of the pause (e.g.,
reading e-mail, looking for some information in the office, looking up at the ceiling
while thinking of what to say next, preparing an image to send in Show Me). Without
the video channel, these pauses would have been mystifying, as evidenced in video
records of phone calls where participants frequently asked for feedback (e.g., “Right?”,
“OK?”).
Other gestures that facilitated their interaction included leaning into the camera when
users could not hear what a remote collaborator said (usually prompting a repetition of
the utterance) and hand gestures that indicated taking or yielding a turn of talk. Facial
and body gestures often communicated whether a person was understanding what was
being said, prompting the speaker to either continue explaining or move on to the next
topic. The video channel conveyed many of the gestures people use to mediate their
speech [Kendon, 1986]. Gestures were also used to express disagreement, as will be discussed in more detail with respect to eye gaze awareness.
We also observed several examples of turn completions in desktop conferencing
when one person would complete a sentence or turn of talk for a remote collaborator.
Completions are a demonstration of mutual understanding that require tight interaction
and coordination among the participants [Wilkes-Gibbs, 1986]. The prototype demonstrated that it can support accomplishing turn completions between remote participants.
Completions were notably absent when using the video conference rooms, largely due to
14
person-minutes
Mountain View phone calls
pre-DCP
full-DCP
DCP - video
week
person-minutes
Mountain View face-to-face meetings
pre-DCP
full-DCP
DCP - video
week
Figure 6. Usage of communication media
Weekly measures of usage of
phone calls received by the
Mountain View team members, face-to-face meetings
held by the Mountain View
team members, desktop conferences of the whole team,
and electronic mail of the
whole team across the three
conditions. Phone calls, faceto-face meetings, and desktop conferences are measured
in person-minutes. Electronic
mail is measured in number
of messages. Note that week
6 is eliminated since the team
was all together at one site.
Because it took a couple days
to install the desktop conferencing prototype, some usage
was recorded before the entire
team was equipped for the
full-DCP condition.
person-minutes
Desktop conferences
pre-DCP
full-DCP
DCP - video
week
Electronic mail
full-DCP
DCP - video
messages
pre-DCP
week
the more than half-second audio delay.
The video channel was also used to visually convey information. Shrugs were often
demonstrated through the video channel without any accompanying talk indicating indifference or “I don’t know”. In a three-way conference involving all five team members,
SD1 rhetorically asks “What does that benefit [this project]?” and emphatically answers the
question by synchronizing a gesture indicating “zero” without saying anything else. Occasionally, objects were held in front of the camera to show them to the others. Team members sometimes noticed activities happening in the background through the video channel.
15
For example, they could often see people walking by at the Billerica site (which had
open cubicle offices) and would wave and engage in conversations with them.
The team seemed to use gestures naturally in desktop conferences much as they
would in face-to-face interaction. Some of the users’ gestures were not transmitted
through the video channel because they were not within the camera’s field of view, indicating that in some ways the desktop conferencing prototype elicited an illusion of faceto-face interaction beyond what it could actually support. At other times, the team members were aware that they were deliberately using the video channel to convey gestures.
In one example, PL noticed someone he knew in Billerica looking in on a desktop conference he was having with CR1. PL waved his hand, but it was not within the camera’s
field of view. He quickly repositioned his wave within camera view, which finally elicited a response. The data contain evidence that users’ activity both built on the familiar
face-to-face experience and also accommodated the capabilities of desktop conferencing.
As mentioned earlier, because of network bandwidth limitations between Billerica
and Mountain View, the default video frame rate for desktop conferences was set to 5
fps. Although this rate is dramatically less than the 30 fps used in television video, the
users found the lower frame rate to be usable for desktop conferencing purposes. There
was only one instance (out of 72) where the users chose to increase the video frame rate
(to 10 fps). When asked in the interviews about the slow frame rate, they commented
that it did not bother them. They did comment on a related problem of having the video
image occasionally freeze when the network traffic or computational load was heavy.
Under severe loading conditions, images were frozen for several seconds before a new
image was received. Users found this to be annoying, although it was sometimes amusing if the frozen image captured a humorous pose of one of the collaborators.
In the interviews just prior to removing the video, all team members anticipated they
would hardly use the prototype once the video capability was removed. The prototype’s
audio quality was considerably worse than the telephone, due to the perceptible delay
and echo. While the Show Me shared drawing tool might have motivated continued use
of the prototype after removing the video, we did not observe heavy use of Show Me
throughout the study. Although we could not collect statistics on the actual use of Show
Me, the team apparently had only occasional need to use it. Comments from the interviews indicated that the team found Show Me very satisfying and helpful when they
used it. However, the use of Show Me depends on whether the task at hand requires a
shared drawing space.
6.3 Desktop Conferencing Substituted For E-mail Messages
We did not expect the availability of desktop conferencing, an interactive communication medium, to have any effect on the use of e-mail, which is asynchronous. However,
the e-mail statistics in Figure 6 and Table I show that the average number of e-mail messages per day was significantly lower in the full-DCP condition compared to the preDCP or DCP minus video conditions (p < 0.02).
Why would the availability of desktop conferencing affect the use of e-mail? One
explanation offered in the interviews is that they would sometimes choose to respond to
16
total # msgs. avg. msgs. / day
s.d.
avg. basic / day avg. reply / day
pre-DCP
120
8.6
5.5
3.0
3.6
full-DCP
155
5.3
3.0
2.7
2.0
DCP - video
185
9.3
6.9
4.5
5.2
Table I. Overall e-mail statistics across conditions
Total number of e-mail messages, average number of messages per day, standard deviation of the
average, and average basic and reply messages per day across the pre-DCP, full-DCP, and DCP minus
video conditions.
an e-mail message by desktop conferencing instead of replying with e-mail. One member said that he sometimes started composing a reply e-mail message, but then decided
to respond with a desktop conference instead and discarded the unfinished e-mail reply.
Some team members also commented that they disliked using e-mail when handling certain topics because it generated many messages back and forth before resolving an issue.
Issues that might require several cycles of e-mail messages could be easily and quickly
resolved in an interactive group desktop conference. The availability of desktop conferencing might have obviated several cycles of e-mail traffic.
We tested these explanations by reviewing the e-mail data to count the number of
“reply” e-mail messages compared to the number of “basic” messages (those not in reply
to a previous message) across the three conditions, shown in Table I. The data show that
the proportion of reply messages was lower in the full-DCP condition than the other two
conditions, but this pattern was not statistically significant (p < 0.27).
Some team members also mentioned that the team rarely used e-mail among themselves when they were located together in Billerica (except when trying to avoid personal contact with someone). After moving to the three different sites, they began using
e-mail heavily, especially since the three-hour time difference between Billerica and
Mountain View made it difficult to catch remote team members by phone. Comments
from the interviews indicate that they did not prefer using e-mail (except to send computer files), but resorted to using it because the other modes of communication were not
effective, given the distribution of the team in time and space. The reduction in e-mail
usage during the full-DCP condition could indicate that desktop conferencing restored
some of the interactions that they had when located at the same site, thereby reducing
their reliance on e-mail.
These explanations alone would not explain why using the phone did not offer the
same benefits of reducing e-mail use as desktop conferencing. Phone calls, like desktop
conferences, afford interactive rather than asynchronous communication, but they do not
allow visual contact with the remote party. Perhaps the novelty effect of introducing a
new technology (desktop conferencing) attracted the team to use it in ways that they did
not use an existing technology (the telephone). However, the data show that the use of
desktop conferencing did settle down after the first two weeks of the full-DCP condition,
but the diminished use of e-mail stayed relatively constant throughout the full-DCP condition. There is no evidence in the data that the team, having learned the value of substituting interactive communication for e-mail, began using the phone to substitute for email after the video capability was removed from the prototype. These observations
17
reinforce the role of video in determining the use of communication media.
6.4 Some Substitution For Short Face-to-face Meetings
Although Figure 6 does not exhibit a significant effect on the usage of face-to-face meetings among the Mountain View members, the data do suggest some meetings were being
replaced by desktop conferences in the full-DCP condition. In the interviews, all of the
Mountain View members perceived that they were having fewer face-to-face meetings
during the full-DCP condition. One instance of a desktop conference that substituted for
a face-to-face meeting was brought to our attention because the participants requested
that we erase the videotape we had made of it. They did not want to have a record of the
sensitive personnel issue that they discussed, which they normally would have handled
face-to-face but used desktop conferencing because it was available.
Figure 7 shows a graphical comparison between the face-to-face meeting activity
between week 2 in the pre-DCP condition with the meeting and desktop conferencing
activity in week 5 in the full-DCP condition. For these representative weeks, Figure 7
shows that longer, 3-person face-to-face meetings persisted in the full-DCP condition,
but many of the shorter, 2-person face-to-face meetings appeared to be replaced by desktop conferences. The data in Table II indicate that the average duration for face-to-face
meetings was slightly longer in the full-DCP condition compared to the pre-DCP and
DCP minus video conditions, although high variability in the data precluded statistical
significance (p < 0.60). This pattern suggests that short face-to-face meetings might
have been substituted by desktop conferences. Interviews with the team members confirmed that they felt that longer meetings with more than two people merited the effort to
actually meet face-to-face rather than use desktop conferencing.
meetings (pre-DCP)
M
T
W
T
F
meetings (full-DCP)
M
T
W
T
F
desktop conferences (full-DCP)
M
T
W
T
F
9
9
9
10
10
10
11
11
11
12
1
12
1
12
1
2
2
2
3
3
3
4
4
4
5
5
5
6
6
6
2-person face-to-face meeting
2-way COCO conference
3-person face-to-face meeting
3-way COCO conference
all team video conference meeting
involves Billerica team member
Figure 7. Comparison of face-to-face meetings between pre-DCP and full-DCP
Comparison of face-to-face meetings in pre-DCP condition week 2 (left) with the full-DCP condition
week 6 face-to-face meetings (middle) and desktop conferences (right).
18
total # mtgs avg. length (mins.)
s.d.
pre-DCP
26
32.8
27.5
full-DCP
37
43.9
49.6
DCP - video
32
39.2
44.2
Table II. Face-to-face meeting statistics across conditions
Total number of face-to-face meetings, average duration of meetings, and standard deviation of the average duration (indicating
variance) across the pre-DCP, full-DCP, and DCP minus video
conditions.
Desktop conferencing was also used to increase visual contact between Billerica and
Mountain View. Of the 72 desktop conferences logged, 28 (39%) involved team members from both sites. Thus in the six typical weeks in the full-DCP condition, there were
28 cross-site desktop conferences, while in the seven weeks of the pre-DCP and DCP
minus video conditions combined there were only four video conference room meetings
where collaborators at both sites could see each other. Although the team used desktop
conferencing to gain visual access to remote team members, most of the desktop conferences (61%) were among the Mountain View team members. These team members
could have walked to the other building to meet face-to-face, but they elected to use the
desktop conferencing prototype instead. The data indicate a use of desktop conferencing
among collaborators who are separated by a few hundred feet as well as thousands of
miles.
In the pre-DCP condition, the team had just started using a weekly one-hour time slot
in the video conference rooms to have all-team meetings. In the full-DCP condition, the
team never used the slot, and resumed using it two weeks into the DCP minus video condition. The prototype was not designed to support a five-way connection for an all-team
desktop conference. However, the team used three-way conferencing several times to
have an all-team meeting by having pairs of people share a camera at two sites. Even
though the team did not frequently meet all together via desktop conferencing, the subteam desktop conferences apparently obviated the need for all-team video conference
meetings.
The data from this five-person team indicate that the availability of full desktop conferencing eliminated their use of video conference rooms. However, video conferencing
between meeting rooms is generally a different kind of collaborative activity than conferencing between personal desktops. Video conferencing rooms allow planned meetings between moderate-sized groups (perhaps ten or more on each side) in an
environment that is relatively free from interruptions (e.g., telephone calls, e-mail
arrival, impromptu visitors). Desktop conferencing on the other hand allows spontaneous interactions between individuals or small groups where each person has access to the
resources of their own workstation and office. Although desktop conferencing was
found to eliminate the use of video conference rooms for this small team of five people,
we do not believe that desktop conferencing should be generally considered to replace
video conference rooms.
19
6.5 Changes In The Use Of Phone Calls
In the interviews before installing the desktop conferencing prototype, some team members expected they would use a desktop conference for anything they currently did over
the phone. In the interviews after they had used the prototype for a couple weeks, all
team members reported less phone use when they had the prototype. In contrast to their
perceived reduction in phone call use, the measures of usage in Figure 6 do not show any
significant effect on the usage of phone calls across the three conditions, and the phone
call statistics in Table III show a slight increase in the average number of phone calls per
day over the three conditions. The average duration of phone calls was shorter in the
full-DCP condition compared to the pre-DCP and DCP minus video conditions. This
pattern suggests that longer phone calls may have been substituted by desktop conferences but shorter calls continued to be made by telephone. Wide variation in the relatively sparse data prevented statistical significance (p < 0.17).
total # calls avg. # / day
avg. length (secs.)
pre-DCP
26
1.9
461.5
full-DCP
78
2.7
348.2
DCP - video
58
2.9
453.3
Table III. Phone call statistics across conditions
Total number of calls, average number of calls per day, and average
duration of calls across the pre-DCP, full-DCP, and DCP minus video
conditions.
Interviews with the participants provided some reasons why participants continued to
use the phone rather than desktop conferencing for short calls. The prototype was not
optimized for quick performance and starting a desktop conference could take about a
half-minute. For quick calls (e.g., “Ready to go to lunch?”, checking if someone is in the
office before visiting or desktop conferencing), the users did not want to incur the overhead of starting a desktop conference since using the phone would be much quicker.
Audio quality was also relatively poor compared to the phone due to the delay and echo.
Desktop conferencing was also perceived to be inappropriate in some situations. SD1
commented that it seemed “decadent” to make a desktop conference to SD2 (who was
located just a few offices away) instead of calling or just walking down the hall.
6.6 Desktop Conferencing Is A Novel Collaboration Setting
From the analysis of the videotapes, it is clear that desktop conferencing is a distinctly
different collaboration setting than meeting face-to-face or talking on the phone. In
desktop conferences, all members are located in their own offices where each person has
access to his or her own resources and distractions (e.g., phone calls, e-mail arrivals, visitors). By contrast, face-to-face meetings are usually held in conference rooms, where
everyone is isolated from their resources, or in one person’s office, where only that person can access her books, phone calls, etc. Consequently, in face-to-face meetings, it is
generally considered poor etiquette to take long phone calls or spend much time reading
e-mail while other people are waiting for attention. In the desktop conferences that we
20
analyzed, there were several examples of people reading e-mail and taking phone calls
during a desktop conference. They seemed to treat desktop conferencing as a medium
for focused interaction (like a phone call or meeting), but also one that tolerated significant amounts of attending to personal distractions. This kind of interaction is similar to
the ebb and flow of group and individual activity that occurs when sharing an office or
working in a computer-augmented meeting room [Stefik et al., 1987].
There are several reasons why desktop conferencing afforded this type of collaborative activity. Because all participants are located in their own offices, if one member
attends to a personal distraction, every other member can easily attend to their own personal work while waiting for the conference to refocus. Also, desktop conferencing
affords many cues (largely through audio and video) that enable a remote collaborator to
make sense of what is happening when one person temporarily stops participating. By
contrast, in a phone conversation it is often difficult to interpret long pauses. In addition,
some users commented that since they did not have true eye contact with the remote collaborator, they felt that they were slightly detached from them, which allowed attending
to personal work.
Although the users of the desktop conferencing prototype found themselves in a
novel collaboration setting, they interacted in a very routine and seemingly familiar manner. They smoothly migrated from group interaction to individual work in a way that
could not occur in any other medium, yet they did so in a familiar and natural way without marking the activity as novel. We believe that desktop conferencing, largely through
the video channel, provided enough cues for participants to interpret the transitions
between group interaction and individual work and accommodate a new style of interaction.
Although they were able to accommodate a new style of working in desktop conferences, interview comments indicate that they did not necessarily like it. Several team
members found it annoying when someone stopped to take a long phone call or continued doing private work while desktop conferencing. Although the video channel helped
them detect such distractions, it still required a delicate social negotiation to try to
directly manage them. Just as participants in face-to-face conversation are often reluctant to direct their partner’s action (e.g., “Excuse me, you need to wipe off some food
smudged on your face”), so desktop conference participants did not feel free to tell their
partners to stop doing other work or to reposition their head to be in camera view. It is
notable that many of the rules of politeness that govern face-to-face interaction also
appear to be in force in desktop conferencing.
The group interaction that occurred in desktop conferencing was notably more like
face-to-face meetings than meeting in the commercial video conferencing rooms.
Remote collaborators were able to interrupt each other, accomplish turn completions,
and time jokes in their conversations. This improved interaction was enabled by reducing the audio delay in the prototype. During the study, the audio delay was measured to
vary between 0.32-0.44 seconds (depending on processing and networking loads). This
slight improvement over the 0.57 second delay in the video conference rooms was
enough to noticeably affect the level of interaction that the collaborators could accomplish.
21
6.7 Gaze Awareness In Desktop Conferencing
To provide a sense of eye contact in desktop conferencing, the lens of the camera was
positioned as close as possible to where the video window of the remote collaborator
appeared on the screen. However, all of the team members remarked that they could not
establish direct eye contact through the prototype. Rather than introducing half-silvered
mirror devices that effectively provide eye contact [Buxton & Moran, 1990], we wanted
to see if users could interact comfortably without true eye contact. Ishii and Kobayashi
[1992] raised a distinction between eye contact (seeing eye-to-eye) and gaze awareness
(being aware of where others are looking). While eye contact is the expected form of
interaction from face-to-face meetings, providing each collaborator with a confident
sense of gaze awareness may be sufficient to enable effective and comfortable interaction.
We found considerable evidence in the videotapes of desktop conferences that the
collaborators had a strong sense of gaze awareness and were able to make use of that
information. Figure 8 shows a sequence of video images that show one example of the
use of gaze awareness. In a desktop conference between CR1 and PL, CR1 visually
expresses continued disagreement with PL by avoiding “looking at” PL. PL continues to
talk, and notices that CR1 is avoiding looking at him and gazes and speaks to CR1 in
ways that invite CR1 to look up at him. After over 40 seconds of gaze avoidance, PL
moves on to another topic, at which point CR1 immediately resumes looking up at him.
In the interviews, we asked whether the team members could tell when collaborators
in a desktop conference were looking at them. After just two weeks of use, some members were occasionally uncertain, but by the end of the study everyone said that they
could. We believe that if everyone’s equipment is configured to provide near eye contact, users can quickly gain a confident sense of gaze awareness and use that to convey
cues in their interactions. Of course, establishing actual eye contact would be ideal in
Figure 8. Demonstrating gaze awareness by avoiding “eye contact”
This sequence of images show CR1 (top) and PL (bottom) in a desktop conference. At left, CR1 and PL
are “looking at” each other. In the middle two frames, CR1 visually expresses continued disagreement
by avoiding “eye contact” with PL for over 40 seconds. After PL moves on to another topic, CR1
resumes “eye contact” with him.
22
desktop conferencing, but there may be situations where the trade-offs made to accomplish that (e.g., added footprint and volume occupied by half-silvered mirror devices) are
not merited.
6.8 Design Implications From The Study Of Desktop Conferencing
This study indicates that, for a working team that is already familiar with each other,
desktop conferencing is a useful medium for distributed collaboration. In contrast to
studies that did not find a strong effect of a video channel, we found that video was the
determining factor in how much desktop conferencing was used. The video provided
visual and gestural cues that enabled them to interact smoothly. Gaze awareness among
the collaborators in particular was used to convey cues in their interaction. When they
used the shared drawing tool, they found it to be valuable in supporting distributed collaboration.
Users commented that the audio quality of the desktop conferencing prototype
needed improvement. Because most team members used a speaker for audio output and
an open microphone for audio input, the system exhibited a considerable amount of
audio echo. Those speaking often heard a delayed echo of their speech as it traveled to
others’ speakers and back through their microphones. The audio quality was worse in 3way conferencing, since mixing audio streams introduced even more echo and the
increased network traffic caused deletions in the audio streams. Because of these problems, the team often resorted to using telephone audio in three-way conferences.
Although we provided headsets that eliminated the audio echo problem, all but one user
found them too bothersome to use.
Additionally, our experiences with the desktop conferencing prototype indicated that
the phone call model for establishing and managing conferences was too limited. Users
were sometimes reluctant to use desktop conferencing to contact others because they
could not tell in advance whether a person was available or interruptible. The prototype
also did not have the equivalent of a phone answering machine to handle conference
requests when no one was there, making it frustrating to try to catch someone. This
problem was evidenced in the many unsuccessful conference attempts found in the logs
of prototype use. Besides the 72 desktop conferences recorded, 96 attempts to conference were unsuccessful (recipient not in office to receive conference request, recipient’s
workstation not operational, recipient declined to accept conference request). Mechanisms that integrate desktop conferencing with other forms of communication, such as
automatically leaving e-mail or voice mail after an unsuccessful attempt to conference,
would be helpful.
This study was also a methodological learning experience in trying to combine different
observational perspectives to understand the team’s work activity and reaction to the prototype. Although the quasi-experimental structure of the study (three conditions, quantitative measures) did not yield many statistically significant results, it was helpful in
identifying patterns and trends that could be explored by analyzing video recorded
examples of work activity or interviewing the users for their perceptions. User perceptions elicited by the interviews also helped guide us in selecting samples of videotaped
activity on which to focus our analysis. The multiple perspectives also provided a
broader understanding of the activity that could not be found in any single observational
23
method.
The multiple observational perspectives also presented some new problems. Collecting multiple types of data added complexity to the data collection process and resulted in
a vast amount of data to sift through. Since our primary commitment was in collecting
data on actual team work activity, we did not have the luxury of establishing control conditions and exercising other manipulations often used in laboratory experiments to produce clean quantitative data for statistical comparison.
7. What we learned about multimedia-supported collaboration
What can we learn from our studies about how to design multimedia technology to effectively support collaborative work? Two points clearly came out in each of the three studies presented: 1) users want video connections and 2) the quality of the audio
connection is crucial. It is also important to distinguish desktop conferencing from other
types of communication media (e.g., face-to-face meetings, video conference room
meetings, phone calls) to understand how it and other new multimedia collaboration
technologies will be incorporated into everyday use with existing communication technologies.
7.1 Users Want Video
Each of the three studies clearly indicated that the users wanted to have a video capability that allowed them to have visual contact during their interaction. Why do the users
want this video capability? Although these studies do not claim to definitively answer
this question, they do present a variety of evidence that helps explain why users like
video.
The video channel is clearly a valuable resource in mediating interpersonal interaction. Not only does the visual channel provide cues that facilitate the mechanics of turntaking, but it also naturally affords gestures and other visual information that convey
how much is being understood, reasons for pauses in speech, participants’ attitudes, and
other modifiers (e.g., humor, sarcasm) on what is being said. This support for interactional mechanisms make video-mediated communications more efficient, effortless, and
effective. A richer communication channel affords greater mutual understanding among
the participants, and we would expect it to help improve the quality of their collaborative
work in the long term. Isaacs and Tang [1993] describe more details comparing interactions through face-to-face, phone, and desktop conferences from our data.
Users’ comments clearly show that they perceived added value from the video.
Besides the benefits we identified in our analyses of video-mediated activity, users
reported that the video capability made their interactions more satisfying. These user
perceptions should play a major role in guiding the design of technology to support collaboration.
Why did our studies find such a strong effect of video whereas the studies cited earlier
[Ochsman & Chapanis, 1974; Gale, 1990] found none? Firstly, the previous studies
focused on effects that were associated with the resulting product (e.g., quality of the
24
result, time to complete the task). We found that the video channel had effects on the
process of interaction (e.g., supporting turn-taking mechanisms, demonstrating understanding and attitudes). Although these effects on interpersonal communication have
been hypothesized [Short et al., 1976] and recognized [Gale, 1990] in earlier studies, this
paper presents specific evidence from real work activity of how video supports human
interaction.
Secondly, the observational methods used in this research differed from those used in
the previous studies. The previous studies measured completion times, graded the
resulting artifacts, and ranked user assessments of their work. Our research used openended surveys and interviews, video-based analyses of work activity, and quantitative
measures of actual usage. Perhaps more importantly, the previous studies analyzed the
activity of artificial groups working on contrived tasks. The studies presented in this
paper examined the activity of actual working groups engaged in their real work activity.
Since audio and video tend to have the most effect on social, interpersonal communication, those effects would be most noticeable among a group in which social and personal
relationships were well developed and exercised. Our ability to see how video supports
social interaction was a direct result of studying actual working activity that had real
social elements in it.
The value of video that we observed did not even include one of the inherent strengths
of the video media. Video is good for showing and manipulating three-dimensional
objects, such as a component to be manufactured or a volumetric shape to be designed.
Since the groups studied in this research worked mainly with documents or computer
software, they did not exercise this potential capability of video. We would expect that
working teams in a domain that involved physical artifacts would find even greater value
in video.
7.2 Audio Is Crucial
In each of our three studies, audio quality was an issue. Audio plays a fundamental role
in supporting human interaction and users’ expectations of audio are formed by their
experiences in face-to-face and phone interactions. Technologies that degrade the audio
channel (e.g., delays, echo, incomprehensible audio quality) will disrupt people’s ability
to smoothly interact with each other. Although the team using our desktop conferencing
prototype was willing to endure the degraded audio to have the video capability, it was
clearly the aspect they most wanted to see improved in the prototype.
Although the ideal is to strive for high fidelity audio and video, our experiences confirm that audio is relatively more important than video in supporting collaboration. Our
desktop conferencing prototype made several trade-offs of degrading video performance
in order to preserve audio quality. If high network traffic prevented transmitting all of
the audio-video data between sites, the video data degraded first (image froze) to allow
as much audio data to get through before cutting out. Audio was delivered with minimal
delay, even though the audio arrived before the accompanying video image, violating
audio-video synchrony. As long as network constraints require trade-offs to conserve
bandwidth, our experiences indicate that degrading video quality before degrading audio
quality provides a more usable experience.
25
7.3 Desktop Conferencing Is Not Face-to-face Meeting Is Not Video Conferencing
Is Not...
The data from our study of desktop conferencing demonstrated that it substituted for certain amounts of other kinds of interaction (e.g., video conference room meetings, e-mail,
some face-to-face meetings). Comments from the video conferencing room survey indicate that some users may like to think that video conference room meetings substitute for
face-to-face meetings. However, these findings should not be taken to imply that desktop conferencing could completely replace face-to-face meetings, video conference
room meetings, e-mail, or any other form of interaction. As discussed earlier, desktop
conferencing is a distinct setting for collaboration and is unlikely to completely replace
existing forms of interaction. The adoption of video conferencing rooms and other multimedia technology has suffered from marketing myths that promote them as replacements for face-to-face interaction [Egido, 1990].
Rather, we should strive to understand how new forms of interaction can be integrated
with the existing ones into people’s day-to-day work. By understanding how these new
technologies augment, complement, and interact with people’s existing work practice,
we can design new technology that can be smoothly and naturally adopted. As we
develop new technology for collaboration, more research is needed to understand existing collaborative practice as well as how users respond to the new technology in the context of their actual work. More research is needed into new issues that these
technologies raise, such as the privacy concerns of having ubiquitously available audio
and video and how to apply multimedia support to collaboration settings that are noncooperative. By iteratively cycling between developing new technology and studying
how people actually use that technology, we can both design better technology that is
matched to users’ needs and increase our understanding of human work activity.
Acknowledgements
We would like to acknowledge the other members of the Conferencing and Collaboration (COCO) group: David Gedye, Amy Pearl, Alan Ruberg, and Trevor Morris. They
helped build the desktop conferencing prototype and provided many forms of support for
this study. We thank the other participants in our regular video analysis sessions for the
many insights and observations that they contributed: Monica Rua, Hagan Heller, Todd
Macmillan, and Tom Jacobs. We thank Randy Smith for reviewing this paper. The Digital Integrated Media Environment (DIME) group in Sun Microsystems Laboratories,
Inc. developed the SBus card that enabled the COCO conferencing prototype. This
research was conducted at Sun Microsystems Laboratories, Inc. We especially thank our
anonymous participants in the study for giving us generous access to their daily work
activity.
References
Buxton, Bill and Tom Moran, “EuroPARC’s Integrated Interactive Intermedia Facility
(IIIF): Early Experiences,” Multi-User Interfaces and Applications, S. Gibbs and A.
A. Verrijn-Stuart (Eds.), Amsterdam: Elsevier Science Publishers B.V., 1990, pp. 1126
34.
Egido, Carmen, “Teleconferencing as a Technology to Support Cooperative Work: Its
Possibilities and Limitations,” Teamwork: Social and Technological Foundations of
Cooperative Work, Jolene Galegher, Robert E. Kraut, and Carmen Egido (Eds.),
Hillsdale, NJ: Lawrence Erlbaum Associates, Publishers, 1990, pp. 351-371.
Fish, Robert S., Robert E. Kraut, Robert W. Root, and Ronald E. Rice, “Evaluating
Video as a Technology for Informal Communication,”Proceedings of the Conference
on Computer Human Interaction (CHI) ‘92, Monterey, CA, May 1992, pp. 37-48.
Francik, Ellen. Susan Ehrlich Rudman, Donna Cooper, and Stephen Levine, “Putting
Innovation to Work: Adoption Strategies for Multimedia Communication Systems,”
Communications of the ACM, Vol. 34, No. 12, December 1991, pp. 53-63.
Gale, Stephen, “Human aspects of interactive multimedia communication,” Interacting
with Computers, Vol. 2, No. 2, 1990, pp. 175-189.
Gale, Stephen, “Desktop video conferencing: Technical advances and evaluation issues,”
Computer Communications, Vol. 15, No. 2, October 1992, pp. 517-526.
Heath, Christian and Paul Luff, “Disembodied Conduct: Communication Through Video
in a Multi-media Office Environment,” Proceedings of the Conference on Computer
Human Interaction (CHI) ‘91, New Orleans, LA, April/May 1991, pp. 99-103.
Isaacs, Ellen and John C. Tang, “What Video Can and Can’t Do for Collaboration,” Conference on Computer-Human Interaction (INTERCHI ‘93), Amsterdam, Netherlands,
April 1993, submitted.
Ishii, Hiroshi and Minoru Kobayashi, “ClearBoard: A Seamless Medium for Shared
Drawing and Conversation with Eye Contact,” Proceedings of the Conference on
Computer Human Interaction (CHI) ‘92, Monterey, CA, May 1992, in press.
Kendon, Adam, “Current Issues in the Study of Gesture,” in The Biological Foundations
of Gestures: Motor and Semiotic Aspects, Jean-Luc Nespoulous, Paul Perron, and
Andre Roch Lecours (Eds.), Hillsdale, NJ: Lawrence Erlbaum Associates, Publishers,
1986, pp. 23-47.
Krauss, Robert M., Connie M. Garlock, Peter D. Bricker, and Lee E. McMahon, “The
Role of Audible and Visible Back-Channel Responses in Interpersonal Communication,” Journal of Personality and Social Psychology, Vol. 35, No. 7, 1977, pp. 523529.
Masaki, Shigeki, Naobumi Kanemaki, Hiroya Tanigawa, Hideya Ichihara, and Kazunori
Shimamura, “Personal Multimedia-multipoint Teleconference System for Broadband
ISDN,” High Speed Networking, III, O. Spaniol and A. Danthine (Eds.), Amsterdam:
Elsevier Science Publishers B.V. 1991, pp. 215-230.
Minneman, Scott L. and Sara A. Bly, “Managing a trois: a study of a multi-user drawing
tool in distributed design work,” Proceedings of the Conference on Computer Human
Interaction (CHI) ‘91, New Orleans, LA, April/May 1991, pp. 217-224.
Ochsman, Robert B. and Alphonse Chapanis, “The Effects of 10 Communication Modes
on the Behavior of Teams During Co-operative Problem-solving,” International Journal of Man-Machine Studies, Vol. 6, 1974, pp. 579-619.
Olson, Margrethe H. and Sara A. Bly, “The Portland Experience: A Report on a Distributed Research Group,” International Journal of Man-Machine Systems, Vol. 34, No.
27
2, February 1991, pp. 211-228. Reprinted: Computer-supported Cooperative Work
and Groupware, Saul Greenberg (Ed.), London: Academic Press, 1991, pp. 81-98.
Root, Robert W., “Design of a Multi-Media Vehicle for Social Browsing,” Proceedings
of the Conference on Computer-Supported Cooperative Work, Portland, OR, September 1988, pp. 25-38.
Sacks, H., E. Schegloff, and G. Jefferson, “A simplest systematics for the organization of
turn-taking for conversation,” Language, Vol. 50, 1974, pp. 696-735.
Short, John, Ederyn Williams, and Bruce Christie, The Social Psychology of Telecommunications, London: John Wiley & Sons, 1976.
Smith, Randall B., Tim O’Shea, Claire O’Malley, Eileen Scanlon, and Josie Taylor,
“Preliminary experiments with a distributed, multi-media, problem solving environment,” Proceedings of the First European Conference on Computer Supported Cooperative Work: EC-CSCW ‘89, London, UK, September 1989, pp. 19-34. Reprinted:
Studies in Computer Supported Cooperative Work: Theory Practice and Design, J.
Bowers and S. Benford (Eds.), Amsterdam: Elsevier Science Publishers B.V., 1991.
Stefik, Mark, Gregg Foster, Daniel G. Bobrow, Kenneth Kahn, Stan Lanning, and Lucy
Suchman, “Beyond the chalkboard: Computer support for collaboration and problem
solving in meetings,” Communications of the ACM, Vol. 30, No. 1, January 1987, pp.
32-47. Reprinted: Computer-Supported Cooperative Work: A Book of Readings, Irene
Greif (Ed.), San Mateo, CA: Morgan Kaufmann Publishers, Inc., 1988, pp. 335-366.
Stults, Robert, Steve Harrison, and Scott Minneman, “The Media Space - experience
with video support of design activity,” Engineering Design and Manufacturing Management, Andrew E. Samuel (Ed.), Amsterdam: Elsevier Science Publishers B.V.,
1989, pp. 164-176.
Tang, John C., “Findings from Observational Studies of Collaborative Work,” International Journal of Man-Machine Studies, Vol. 34, No. 2, February 1991, pp. 143-160.
Reprinted: Computer-supported Cooperative Work and Groupware, Saul Greenberg
(Ed.), London: Academic Press, 1991, pp. 11-28
Tang, John, “Involving Social Scientists in the Design of New Technology,” Taking Software Design Seriously: Practical Techniques for Human-Computer Interaction
Design, John Karat (Ed.), Boston: Academic Press, 1991, pp. 115-126.
Tang, John C. and Scott L. Minneman, “VideoDraw: A Video Interface for Collaborative
Drawing.” ACM Transactions on Information Systems, Vol. 9, No. 2, April 1991, pp.
170-184.
Tatar, Deborah, “Using Video-Based Observation to Shape the Design of a New Technology,” SIGCHI Bulletin, Vol. 21, No. 2, October 1989, pp. 108-111.
Watabe, Kazuo, Shiro Sakata, Kazutoshi Maeno, Hideyuki Fukuoka, Toyoko Ohmori,
“Distributed Multiparty Desktop Conferencing System: MERMAID,” Proceedings of
the Conference on Computer-Supported Cooperative Work, Los Angeles, CA, October 1990, pp. 27-38.
Wilkes-Gibbs, Deanna, Collaborative Processes of Language Use in Conversation,
Ph.D. dissertation, Stanford University, 1986.
Williams, Ederyn, “Experimental Comparisons of Face-to-Face and Mediated Communication: A Review,” Psychological Bulletin, Vol. 84, No. 5, 1977, pp. 963-976.
28


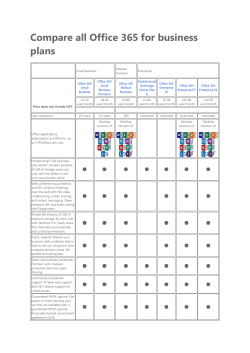
© Copyright 2026