
COVER SHEET
COVER SHEET
7 7 8 2 3
SEC Registration Number
C I T Y L A N D
D E V E L O PME N T
COR P OR A T I ON
(Company’s Full Name)
2 n d
F l o o r ,
1 0 ,
T o w e r
S t r e e t ,
C i t y l a n d
I , 1 5 6
S a l c e d o
H . V .
C o n d o m i n i u m
d e
l a
V i l l a g e ,
C o s t a
M a k a t i
C i t y
(Business Address: No. Street City/Town/Province)
Rufina C. Buensuceso
893-6060
(Contact Person)
(Company Telephone Number)
1 2
3 1
1 2 - 1 (A3)
Month
Day
(Form Type)
Month
(Calendar Year)
Day
(Annual Meeting)
(Secondary License Type, If Applicable)
CFD
Dept. Requiring this Doc.
Amended Articles Number/Section
Total Amount of Borrowings
Total No. of Stockholders
Domestic
Foreign
To be accomplished by SEC Personnel concerned
File Number
LCU
Document ID
Cashier
STAMPS
Remarks: Please use BLACK ink for scanning purposes.
SECURITIES AND EXCHANGE COMMISSION
SEC FORM 12-1 (A3)
REGISTRATION STATEMENT UNDER THE SECURITIES REGULATION CODE
1. SEC Identification Number
77823
............
2. CITYLAND DEVELOPMENT CORPORATION
........................................................................................
Exact name of registrant as specified in its character
3. MAKATI CITY, PHILIPPINES
...............................................................
Province, country or other jurisdiction of
incorporation or organization
4. 000-527-103
..................................................
BIR Tax Identification Number
5. REAL ESTATE DEVELOPER
.....................................................................
General character of business of registrant
6. Industry Classification Code:
(SEC Use only)
7. 2F Cityland Condominium 10 Tower 1, 156 H.V. Dela Costa Street, Salcedo Village, Makati City 1226
Telephone No.: (632) 893-6060
FAX No.: (632) 892-8656
...........................................................................................................................................................
Address, including postal code, telephone number, FAX number including area code of
registrant's principal office
8. ...........................................................................................................................................................
If registrant is not resident in the Philippines, or its principal business is outside the Philippines,
state name and address including postal code, telephone number and FAX number, including
area code and email address of resident agent in the Philippines.
9. Fiscal Year Ending Date (Month and Day) : December 31
.....................
COMPUTATION OF REGISTRATION FEE
Title of each class of securities to be Amount to be registered
registered
Short Term Commercial Papers
Php 1,000,000,000
1% Legal Research Fee
Total
Amount of
registration fee
Php 812,500
8,125
Php 820,625
FINALPROSPECTUS
CITYLAND DEVELOPMENT
NOV
zl 2012
(A CorporationorganizedunderPhilippine
Registrationof Philippine PesoPhp 1,00q000,000Short-TermCommercialPapers
Cityland DevelopmentCorporation(hereinafterreferredto as
*CDC", the "Company'' or "Issuer") is offering for public
sale at face value, up to Php 1,000,000,000worth of its
Short-Term Commercial Papers(hoeinafter referred to as
"STCPs" or the "lCffered STCPs') to be traded over-thecoiiroter
\J
The dateof this Prospectusis November 23,2012
.ALL REGISTRATION REQI]IREMENTS HAVE BEEN MET AITD
ALL INTORMATION CONTAIITED MREIN ARE TRUE AND
CURREI{T'
CITYLAI{D DEVELOPMENT CORPORATION
AND swoRN to beforeln" in MA$lkAy on NO\l 2 3 2012.alfiaot
SIJBSCRIBED
personally appearedand exhibited his SSS ID with No. 3
evidenceof identification.
Doc. No. . 461 :
PageNo. i4 :
v :
BookNo.
Seriesof 2012.
i.:o
NOTARY i:,i-icFCil tr4All
UNT|i- llsJl;:-:.:++i+f , z
I S FR l r i . i ' l i ) 4 4 2 3 9
i |-i)4-12/ i\'la'It|::r
PTR NiO.0:i:lr:i,i.'::i
(.)
\i
i
/ L;trtirti3
U788,:tl-iietirtte
lBir,
l\ilft.E Cnlpi N,r lV-0003097
Commis:lonNo. 2011-105
5 i l-51ii ,JulntinParedesSt.
Republicof the Philippines
Deparuert of Fiuauc€
Securitiesand ExchangeCommission
SECBuilding,
EDSA,Greenhills,
Mandaluyong
City
@RrcRA NON TTNANCEDEPAR71'[ENT
SEC-CFD ORDIR NOi.
.....-.--...._.!_?..
"....
5 t r . i i 5 O F .....&E..r-2....
INTHEMATTER
OF
CITYTAND
DEVETOPMENT
CORPORATION
Regislrolionof Securilies
- Registronl-
ORDER
Upon considerotionof the Registrolion
Sfofemeniond oiher popersond documenfs
oiloched fhereiowhich were filed on behqlfof CITYIAND
DEVETOPMENI
CORPORATION,
fhe
Commissionresolvedin its meeting of November22, 2012fo render effeciive lhe same for
ihe registrotionof One BillionPesos(Pl,000,000,000.00)
worlh of shorl-lermcommerciol
popers, in occordqnce wilh Seciion 12 of lhe SecuritiesReguloiion Code ond iis
lmplemeniingRulesond Reguloiions.
Lel o Cerfificoleof Permiflo Offer Securiiies
for Solebe issuedin fovor of fhe subjeci
compony ouihorizingihe soleond distribuiion
of lhe oforementionedsecurifies.
SOORDERED.
EDSA.MondoluyongCiiy,Philippines,
November23,2012.
o
;
U
E-
&
r
6
^
!
^
o ( ,
li
d
-O
^
O
L- --
3-A
L
a-
5
a
f
*
^"J
q j :
: - o -
;
^.
d q
z
o
E
F
:: c! r_ox
F
rc
o
7
o
F
ru
o
o
zFl
rt
=
b
E
It
FI
! =
*
tt
0q
al
o
EJ
It
F
ft
lt)
o
F
FJ
v)
,-l
Fl
l-l
e
F
o
tr
o
'J
q
o
rt
x
o
te
E
t
o
o
o
FJ o
F
(t)
trt B
(
Ir!
o
o
EI
Fl
Fl
ts
7z
:i,
i o
7
z
- v
-i^
'az
F
.i <
tr,
93
':6i
;v
i<
;l
='!
a
o
)7t
E
t!
o
)-1
EI
98n
:
-P:
It
H
t-l
F
o
z ' : FU
i12
< i..l
ii>
>;
Iti It
,l
Fl
z
o
H
o
U
E r
zU
F
Fl
E
o
FI
< ( , - -
Y. I;i',
!/
3-(]
T . ^
5 o -
i
<
o F t
.0
9 - X
^ !r .i
a
5 Q " A
r ! c E
"
3.'o
8 * 2 '
F 6
I
u l u
*o-=
0 q o A
: s.a,+
a
E E-o ?
o
t
o-
'J
f
o
Fl
a-
z
o
o- *<
Y.
i;
( D A
u' 0a
.\
x P
,i<
50-
-J
RISK DISCLOSURE STATEMENT
General Risk Warning
The price of securities can and does fluctuate, and any individual security may experience
upward or downward movements, and may even become valueless. There is an inherent risk
that losses may be incurred rather than profit made as a result of buying and selling securities.
Past performance is not a guide to future performance.
There is an extra risk of losing money when securities are bought from smaller companies.
There may be a big difference between the buying price and the selling price of these securities.
An investor deals in a range of investments each of which may carry a different level of risk.
Prudence Required
This risk disclosure does not purport to disclose all the risks and other significant aspects of
investing in these securities. An investor should undertake his or her own research and study on
the trading of securities before commencing any trading activity. He / she may request
information on the securities and the issuer thereof from the Commission which are available to
the public.
Professional Advice
An investor should seek professional advice if he or she is uncertain of, or has not understood
any aspect of the securities to invest in or the nature of risks involved in trading of securities
specially those high risk securities.
CITYLAND DEVELOPMENT CORPORATION
(A corporation organized under Philippine laws)
Registration of Php 1,000,000,000 worth of Short-Term Commercial Papers for public sale at face
value.
The Company is registering Php 1,000,000,000 worth of Short-Term Commercial Papers which it is
offering for public sale at face value. The gross proceeds that will be raised from the offering is
Php1,000,000,000.00 less registration fees, taxes, professional fees and other related expenses.
The net proceeds from the offering of the Short-Term Commercial Papers is Php 994,090,375 which
is intended to be used as follows (in order of priority):
1) Project – Related Costs
2) Payment of Maturing Loans / Notes
3) Interest Expense
Net Proceeds
Php
Php
650,000,000
306,290,375
37,800,000
994,090,375
The Company is organized under the laws of the Republic of the Philippines. Its principal office is
located at 2nd Floor Cityland Condominium 10 Tower 1, 156 H.V. Dela Costa Street, Salcedo
Village, Makati City. Its telephone number is (632) 893-60-60.
Unless otherwise stated, the information contained in this document have been supplied by the
Company which accepts full responsibility for the accuracy of the information and confirms, after
having made all reasonable inquiries, that to the best of its knowledge and belief, there are no
material facts, the omission of which would make any statement in this document misleading in any
material respect. Neither the delivery of this document nor any sale made hereunder shall, under any
circumstances, create any implication that the information contained herein is correct as of any time
subsequent to the date hereof.
No dealer, salesman or any other person has been authorized by the Company to issue any
advertisement or to give any information or make any representation in connection with the sale of
the Short-Term Commercial Papers other than those contained in this document and, if issued, given
or made, such advertisement, information or representation must not be relied upon as having been
authorized by the Company.
TABLE OF CONTENTS
Page
Glossary……………………………………………………………………………………..
1
Summary Information ………………………………………………………………………
2
Risks Factors ………………………………………………………………………………..
4
Use of Proceeds ……………………………………………………………………………..
7
Determination of the Offering Price………………………………………………………...
10
Offering Period………………………………………………………………….... . ............
11
Plan of Distribution ……………….……….……….……….……….……….……………..
12
Description of Registrant’s Securities ……….……….……….……….……….…………...
13
Market Information For Securities Other Than Common Equity ……….……….…………
16
Market For Issuer’s Common Equity and Related Stockholders’ Matters ……….………...
17
Interests of Named Experts and Independent Counsels ……….……….……….…………..
20
Information With Respect to the Registrant
Business ……….……….……….……….……….……….……….……….…………...
Properties ……….……….……….……….……….……….……….……….………….
Legal Proceedings……….……….……….……….……….……….……….………….
Management’s Discussion and Analysis or Plan of Operation ……….……….……….
Changes in and Disagreements With Accountants On Accounting and Financial
Disclosure ……….……….……….……….……….……….……….……….…………
Directors and Executive Officers……….……….……….……….……….……………
Executive Compensation ……….……….……….……….……….……….…………...
Security Ownership of Certain Record and Beneficial Owners and Management …….
Certain Relationships and Related Transactions ……….……….……….……………..
Corporate Governance ………………………………………………………………….
21
31
33
34
49
49
57
57
59
60
Other Expenses Of Issuance and Distribution ……….……….……….……….…………...
61
Financial Information ……….……….……….……….……….……….……….………….
**
Exhibits ……….……….……….……….……….……….……….……….……….……….
**
Signatures ……….……….……….……….……….……….……….……….……………...
**
1
GLOSSARY
In this prospectus, unless the context otherwise requires, the following words or expressions shall have
the following corresponding meanings:
“Articles”
The Articles of Incorporation of the Company
“Board”
The Incumbent Members of the Board of
Directors of the Company
“CDC” or “Cityland” or “Company” or “Issuer” or
“Registrant”
Cityland Development Corporation
“HLURB”
Housing and Land Use Regulatory Board
“IAS”
International Accounting Standard
“IFRS”
International Financial Reporting Standard
“Offer”
The
offering
for
public
sale
Php 1,000,000,000 worth of STCPs.
“Offering Period”
The offering period shall commence upon
the approval of the SEC permit to sell the
STCPs and ends upon the expiry of the SEC
permit to sell the STCPs.
“Offering Price”
The offering price is 100% of the face value
of the STCPs.
“PAS”
Philippine Accounting Standards
“PFRS”
Philippine Financial Reporting Standards
“Php”, “Pesos”
The Philippine currency
“SEC”
Securities and Exchange Commission
“SGV”
SyCip, Gorres, Velayo and Co.
“SRC”
Securities Regulations Code
“STCPs”, Offered “STCPs”
Short - Term Commercial Papers
of
2
SUMMARY INFORMATION
THE COMPANY
Cityland Development Corporation (CDC) is a domestic publicly-listed corporation which is
duly organized and existing under and by virtue of the laws of the Philippines since January 31, 1978
with the primary purpose of engaging in real estate development. CDC was listed with the Manila &
Makati Stock Exchange in March 1983. Its more significant subsidiaries are: City & Land Developers,
Inc. - a real estate company incorporated under the laws of the Philippines and registered with the
Securities and Exchange Commission on June 28, 1988; and, Cityplans, Inc. - a pre-need company
incorporated under the laws of the Philippines and registered with the Securities and Exchange
Commission on October 27, 1988.
The Company's primary purpose is to acquire and develop suitable land sites for residential,
office, commercial, institutional and industrial uses. Its projects include medium to high-rise office,
commercial and residential condominiums located in Makati City, Mandaluyong City, Manila City and
Pasig City; and residential subdivisions and farmlots in Bulacan and Cavite. Its subsidiary, City &
Land Developers, Inc. has condominiums in Manila City and Pasig City. Another subsidiary,
Cityplans, Inc. is a pre-need company and also has condominium projects in Pasig City.
CDC recently launched last July 2012 Pines Peak Tower I, a 27-storey residential
condominium located at Union corner Pines Sts., Mandaluyong City.
It is also currently developing Makati Executive Tower IV, a 29-storey commercial and
residential condominium located at Cityland Square, Sen. Gil Puyat Ave., cor. P. Medina St., Makati
City and Grand Central Residences Tower 1, a 40-storey office, commercial and residential
condominium located at EDSA cor. Sultan St., Barangay Highway Hills, Mandaluyong City.
As of the time of filing of this Prospectus dated September 27, 2012, the foreign equity
ownership of CDC is 6.11%, equivalent to 198,072,807 shares.
Detailed discussion of Company and its Business is found under “Information with Respect to
the Registrant.”
RISKS OF INVESTING
Investors should prudently assess all attendant risks, as well as other considerations associated
with an investment in this Offer. These include the internal risks such as refinancing risk, credit risk,
interest rate risk, market risk and liquidity risk; and external ones arising from the political and
economic situation, real estate industry outlook and market competition. These are discussed more
extensively under “Risks Factors”.
SUMMARY FINANCIAL INFORMATION
The following selected financial information were derived from the consolidated audited
financial statements as of and for the years ended December 31, 2011, 2010 and 2009 and
consolidated unaudited financial statements as of and for the nine months ended September 30, 2012.
The financial statements were audited by SyCip, Gorres, Velayo & Co., in accordance with the
Generally Accepted Accounting Principles in the Philippines. The information should be read in
conjunction with, and is qualified in its entirety by reference to such financial statements and related
notes thereto and "Management's Discussion and Analysis or Plan of Operation".
3
As of and for the years ended September 30
December 31
(Unaudited)
(Audited)
2010
2011
2012
INCOME STATEMENT
Revenues
2,042,727,021
2,097,580,254
1,376,864,916
Expenses
1,330,875,164
1,393,047,409
913,108,782
Income before tax
711,851,857
704,532,845
463,756,134
Net Income
582,352,213
601,834,373
383,556,931
Total Assets
7,889,727,983
8,030,430,077
8,226,284,327
Total Liabilities
2,987,585,009
2,682,548,835
2,624,554,451
Stockholders’ Equity
4,902,142,974
5,347,881,242
5,601,729,876
BALANCE SHEET
PER SHARE (Php)
Earnings per share
* Annualized
** Based on consolidated financial statements
Php 0.15
Php 0.15
Php 0.11*
4
RISKS FACTORS
The risk factors in the order of importance are as follows:
REFINANCING RISKS
The Company is primarily engaged in real estate development. Risk Factors are: the
moderately aggressive debt level of the Company's borrowings being short-term in nature
increase the possibility of refinancing risks. This debt mix in favor of short-term borrowings is
a strategy which the Company adopted to take advantage of lower cost of money for short-term
loans versus long-term loans. Because the Company has the flexibility to convert its short-term
loans to a long-term position by drawing down its credit lines with several banks or sell its
receivables, refinancing risk is greatly reduced.
The Company manages such refinancing risks by improving the acid-test ratio and maintaining
the current ratio at 1.39:1 and 2.01:1 as of June 30, 2012 from 1.21:1 and 2.01:1 as of
December 31, 2011.
CREDIT RISK
This is defined as the risk that one party to a financial instrument will cause a financial loss for
the other party by failing to discharge an obligation.
The financial instruments which may be the subject of credit risk are the installment contracts
receivables and other financial assets of the Company. The corresponding management
strategies for the aforementioned risks are as follows:
1. The credit risk on the installment contracts receivables may arise from the buyers who
may default on the payment of their amortizations. The Company manages this risk by
dealing only with recognized, credit worthy third parties. Moreover, it is the
Company's policy to subject customers who buy on financing to credit verification
procedures. Also, receivable balances are monitored on an on-going basis with the
result that the Company's exposure to bad debts is insignificant.
2. The credit risk on the financial assets of the Company such as cash and cash
equivalents, short-term cash investments, financial assets at fair value through profit
or loss and available for sale investments may arise from default of the counterparty.
The Company manages such risks by its policy to enter into transactions with a
diversity of creditworthy parties to mitigate any significant concentration of credit
risks. As such, there are no significant concentrations of credit risks in the Company.
INTEREST RATE RISK
This is the risk arising from uncertain future interest rates.
The Company's financial instruments are:
1. The Company's financial assets mainly consist of installment contract receivables,
cash and cash equivalents and short-term investments. Interest rates on these assets
are fixed at their inception and are therefore not subject to fluctuations in interest
rates.
5
2. For the financial liabilities, the Company only has short-term commercial papers
which bear fixed interest rates, thus are not exposed to fluctuations in interest rates.
MARKET RISK
This is the risk that the fair value or future cash flows of a financial instrument will fluctuate
because of changes in market prices. Financial instruments which rely their value on market
factors are subject to market risk.
The available-for-sale investments are exposed to market risk. There is a risk for a decline in
the value due to changes in the market. The exposure however, is negligible because the
amount of the said investment is insignificant as compared to the financial assets of the
Company.
LIQUIDITY RISK
This is the current and prospective risk to earnings or capital from a company's inability to
meet it obligations when they come due without incurring unacceptable losses.
The Company's treasury has a well-monitored funding and settlement management plan. The
following is the liquidity risk management framework maintained by the Company:
1. Asset- Liability Management: Funding sources are abundant and provide a
competitive cost advantage. The Company also holds financial assets for
which there is a liquid market and are, therefore, readily saleable to meet
liquidity needs.
2. Conservative Liability Structure: Funding is widely diversified. There is little
reliance on wholesale funding services or other credit-sensitive fund
providers. The company accesses funding across a diverse range of markets
and counterparties.
3. Excess Liquidity: The Company maintains considerable excess liquidity to
meet a broad range of potential cash outflows from business needs including
financial obligations.
4. Funding Flexibility: The Company has an objective to maintain a balance
between continuity of funding and flexibility through the use of loans from
banks and STCPs.
As such, the Company addresses risk on liquidity by maintaining committed borrowing
facilities in the form of bank lines and a established record in accessing these markets.
ECONOMIC FACTORS
The Company’s business consists mainly of providing office and housing units in the
Philippines and the results of its operations will be influenced by the general conditions of the
Philippine economy. Any economic instability or failure to register improved economic
performance in the future may adversely affect the Company’s operations and eventually its
financial performance.
6
POLITICAL STABILITY
The Company’s business like all other businesses may be influenced by the political situation
in the country. Any political instability in the future could have a material adverse effect in the
Company’s business and results of operations.
INDUSTRY OUTLOOK
The real estate is characterized by boom-bust cyclical pattern exhibited in the past couple of
decades where the industry normally goes through years of robust growth following years of
slowdown. The Company believes that the industry is in the boom cycle.
COMPETITION
The demand for housing especially in the medium-cost category has moderately stepped up.
The situation has attracted both old and new players to develop projects that cater to this rising
demand. As a result of the foregoing, competition in the area of medium-cost development is
expected to intensify. The Company believes that it is in a better position to cope with the
competition because of the affordability of the projects it offers in the market.
The following preventive measures are being undertaken by the Registrant to manage the
aforementioned risks:
1. Conducting assessments of the economic and political situations of the country as
well as new developments in the industry. The procedures involved in gathering
of information of economic indicators and political events as well as being aware
of the new developments in the industry is through media, business conferences,
economic briefings and other sources.
2. Maintaining our competitive edge by keeping up to date with the technological
advances in the construction industry, improving our marketing strategies and
continuously updating the skills of our personnel.
Note: STCPs are not insured with the Philippine Deposit Insurance Corporation (PDIC).
7
USE OF PROCEEDS
The gross proceeds that will be derived from the offering is Php 1,000,000,000 less
registration fees, taxes, professional fees and other related expenses.
The net proceeds from the offering of the Short-Term Commercial Papers is Php 994,090,375
which is intended to be used as follows (in order of priority):
1)
2)
3)
Project – Related Costs
Payment of Maturing Loans / Notes
Interest Expense
Net Proceeds
Php
650,000,000
306,290,375
37,800,000
994,090,375
Php
The total actual and estimated expenses amounting to Php 5,909,625 is shown under “Other
Expenses of Issuance and Distribution on page 58.
1) Project-related costs
The proceeds from the offering will be used to partially finance the construction of Makati
Executive Tower IV, Grand Central Residences Tower I and Pines Peak Tower I.
Makati Executive Tower IV (MET IV) is a 29-storey commercial and residential
condominium located at Cityland Square, Sen. Gil Puyat Ave., cor. P. Medina St., Makati City. Its
percentage of completion as of June 30, 2012 is 75.45%.
Grand Central Residences Tower I (GCR) is a 40-storey office, commercial and residential
condominium located at EDSA cor. Sultan St., Barangay Highway Hills, Mandaluyong City. Its
percentage of completion as of June 30, 2012 is 13.75%.
Pines Peak Tower I is a 27-storey residential condominium located at Union corner Pines Sts.,
Mandaluyong City. It was recently launched last July 2012.
The utilization of the P 650 million project-related costs is broken down as follows:
Project
1st Qtr
2nd Qtr
3rd Qtr
4th Qtr
Total
(Dec. 2012-Feb. 2013) (Mar. 2013-May. 2013) (June 2013-Aug. 2013) (Sept. 2013-Nov. 2013)
Makati Executive Tower IV
P 25.00 M
P 25.00 M
P 25.00 M
P 25.00 M
P 100.00 M
Grand Central Residences
Tower 1
87.50 M
87.50 M
87.50 M
87.50 M
350.00 M
Pines Peak Tower I
50.00 M
50.00 M
50.00 M
50.00 M
200.00 M
P 162.50 M
P 162.50 M
P 162.50 M
P 162.50 M
P 650.00 M
Total
The above P 650M project costs is just part of the Php 2,200M total estimated development
cost to complete the above projects. The balance of P1,550M will be financed through internallygenerated funds. The components of the total development cost are as follows:
Project
Makati Executive Tower IV
Labors & Materials
Supplied by Contractors
Php
120M
Materials Supplied
by Owner
Php
80 M
Estimated Development
Cost
Php
200 M
Grand Central Residences Tower 1
620 M
450 M
1,070 M
Pines Peak Tower I
510 M
420 M
930 M
950 M
Php 2,200 M
Total
Php
1,250 M
Php
8
Labor & Materials Supplied by Contractors – These are for civil, architectural, electrical, mechanical, plumbing,
structural works, fire protection, elevator, garbage chute, sewage treatment, etc.
Materials Supplied by Owner- These are for the purchase of owner- furnished materials like rebars, cements, CHB,
pipes, electrical wires, etc.
Extent of financial commitment to complete the projects: The total credit line available for the
Company from banks and financial institutions is P2.45B all of which is unavailed. This total P2.45B
credit line were all made available to the company by the following banks and financial institutions:
Amalgamated Investment Bancorporation, Metrobank, Security Bank and United Coconut Planters
Bank.
2) Payment of Maturing Loans/ Notes
The Php306M proceeds from the offering are estimated to be allocated for the payment of
short-term promissory notes.
Breakdown of Outstanding Loans as of June 30, 2012:
Financial Institution
Short-Term Commercial Papers *
Short-term Promissory Notes **
Original
Amount
---
Outstanding Balance
849,250,000
370,242,885
Php 1,219,492,885
Interest
Rate
- various- various-
Maturity Date
-various-various-
*(a) Breakdown according to type of investors as of June 30, 2012:
Amount
%
Individual
P 779,850,000
92%
Corporate
69,400,000
8%
Total
P 849,250,000 100%
(b) Breakdown according to SEC Permit to Sell as of June 30, 2012:
Dated November 25, 2011: P 833,250,000
Dated December 2, 2010 :
16,000,000
Total
P 849,250,000
** Short-term Promissory Notes are covered by a contract of guaranty with Home Guaranty
Corporation. The guaranty covers the unpaid principal due on the outstanding promissory
notes and unpaid interest thereon up to 10% per annum.
3) Interest Expense
Interest expense pertains to this P1B STCP issue computed on the average STCP rate as of
June 30, 2012 (rounded-off) as shown below:
Lender
New STCP
Principal
P1,000,000,000
Rate
3.78%
Term
One year
Interest
P37.80 M
In the event of any deviation/ adjustment in the planned uses of proceeds, the Company shall
inform the Commission and STCP investors within thirty (30) days prior to its implementation.
9
Others:
a) If proceeds are substantially less than the maximum proceeds, the Company will just opt to
renew the maturing obligations from the existing financial institutions which extended the
loans.
b) If material amount of other funds are necessary to accomplish purpose(s), the Company will
avail from its existing lines with the financial institutions or banks which has an unavailed
balance of P2.45B. This total unavailed credit line were all made available to the company by
the following banks and financial institutions: Amalgamated Investment Bancorporation,
Metrobank, Security Bank and United Coconut Planters Bank.
c) Proceeds from the offering will not be used to reimburse any officer, director, employee or
any shareholder.
d) Proceeds from the offering is not intended to acquire properties within the next twelve
months.
10
DETERMINATION OF THE OFFERING PRICE
The Offering Price is One Hundred Percent (100%) of the face value.
The interest rates are fixed and are determinable at the time of issuances of the STCPs. The
interest rates are based on the prevailing market rates at the time of issue.
11
OFFERING PERIOD
The offering period will commence upon approval of the SEC of the STCPs and will end upon
the expiry of the Permit to Sell the STCP’s.
12
PLAN OF DISTRIBUTION
The Short-Term Commercial Papers will be distributed by the Issuer itself to institutional
buyers and general public as follows:
Institutional Buyers
General Public
% to Total
30%
70%
Php
Amount
300,000,000
700,000,000
1,000,000,000
The projected STCPs to be offered within the offering period is as follows:
Within the First Quarter
Within the Second Quarter
Within the Third Quarter
Within the Fourth Quarter
Amount
250,000,000
250,000,000
250,000,000
250,000,000
Php
1,000,000,000
Php
The securities to be registered are to be offered through the Company's salesmen duly licensed
by the Commission. The Company's salesmen have been registered and authorized to act as Fixed
Income Market Salesman with a Certificate of Registration issued by the SEC- Company Registration
and Monitoring Department (CRMD). Please see Exhibit 18 for the Certificate of Registration of
Salesmen. The monthly salaries of these personnel range from Php 18,000.00 to Php 62,000.00.
They are also entitled to incentives and bonuses such as mid-year, year-end and performance bonuses.
As in the previously approved issues, the Company requested for exemption from the
underwriting agreement as it has demonstrated its capability to sell the STCP’s through its own selling
efforts as mentioned in the foregoing paragraph.
Upon approval of the Registration Statement and the request for exemptive relief, the
company will provide a statement that its request for exemption from the submission of underwriting
agreement has been granted.
13
DESCRIPTION OF REGISTRANT'S SECURITIES
1. Total Issue Amount
The issue amount is ONE BILLION PESOS (1,000,000,000) outstanding STCPs at any given time
within the validity period granted by the SEC.
2. Provisions:
a.) Instrument
The instrument is Short-Term Commercial Papers (STCPs). STCPs constitute direct,
unconditional and general obligations of the Issuer. The STCPs maybe in registered or bearer
form.
b.) Issue Date
The issue dates can be one or more dates to commence within the validity period granted by
the Securities and Exchange Commission.
c.) Term/Maturity
The STCPs shall have a term/maturity not exceeding 365 days from issue date.
d.) Interest Rates
The interest rate(s) will be fixed and payable in arrears either monthly, quarterly, semiannually or annually or at the end of the term based on the prevailing market interest rates at
the time of issuances. The average interest rate as of September 30, 2012 is 3.5781%.
e.) Redemption
Redemption shall be on a one-time payment at the end of each term.
f.) Minimum Denomination Purchase
The minimum amount of STCP instruments shall not be lower than Php 300,000. The Issuer
shall cause the STCP certificates to be made available to the purchaser upon full payment of
the offering price.
g.) Penalty Interest
Should any amount payable by the Issuer under the STCPs, whether for principal, interest or
otherwise, be not paid on due date, the Issuer shall pay in addition to the computed interest,
liquidated damages equivalent to one percent (1%) of the outstanding amount of the note, plus
attorney’s fees and cost of collection in case of suit, an amount equal to Php 2,000 or 5% of
the principal or interest whichever is higher. The Issuer further agrees that any action for the
STCPs shall be instituted in the proper court of Makati City or the proper Regional Trial Court
of Metro Manila or the case maybe.
14
h.) Tax on the Interest on the STCP
Interest income on the STCPs shall be subject to a twenty percent (20%) final withholding tax
or such rate that maybe provided by law or regulation. The tax shall be for the account of the
holder of the STCPs. Corporate and institutional purchasers who are exempt from or are not
subject to the said tax shall submit pertinent documents evidencing their tax - exempt status.
i.) Documentary Stamps on Original Issuance
The cost of documentary stamps on the original issues shall be for the account of the Issuer.
The documentary stamps by reason of the secondary sales/transfers involving the change of
the registered holdings shall be for the account of the secondary buyers.
j.) Conversion, amortization, sinking fund, retirement
Conversion, amortization, sinking fund and retirement are not applicable in this STCP issue.
3. Substitution
Substitution is not permitted with or without notice.
4. Material Provisions Giving or Limiting Rights of Debt Holders
a) STCPs are unsecured obligations; as such, STCP debt holders are subordinate to secured
creditors.
b) There is no limitation on the declaration of dividends; no restrictions on issuance of
additional debt; no maintenance of asset ratios; and no provision on security (collateral).
5. Financial Ratios
2009
2010
2011
Average
As of September 30,
2012
Current Ratio
1.57
1.77
2.01
1.78
2.26
Acid- Test Ratio
0.87
1.07
1.21
1.05
1.53
Asset To Equity Ratio
1.99
1.84
1.75
1.71
1.72
Interest Rate Coverage Ratio
9.04
11.78
14.14
11.65
15.14
Return on Equity
12.92%
10.47%
9.59%
10.99%
Debt-Equity Ratio
0.56
0.46
0.34
0.45
7.56%*
0.37
* Annualized
Manner of Calculation:
Current Ratio
= Current Assets / Current Liabilities
Acid- Test Ratio
= Cash & Cash Equivalents + Short-Term Investments + Available-for-sale Investments +
(current portion) Installment Contracts Receivables + (current portion) Other Receivables
Total Current Liabilities
Asset to Equity Ratio
= Total Assets / Total Stockholders’ Equity (net of Net Change in Fair Value of Investments)
Interest Rate Coverage Ratio = Net Income before Tax + Depreciation + Interest Expense / Interest Expense
Return on Equity
= Net Income / Total Stockholders' Equity
Debt-Equity Ratio
=
Loans & Notes Payable
Total Stockholders' Equity (net of Net Changes in FV of Investments)
15
Significance:
Current Ratio and Acid-Test Ratio are ratios of short-term solvency which measures the ability of the firm to meet
recurring and current financial obligations. Current ratio is often associated with net working capital which is
the difference between current assets and current liabilities. Acid –test ratio on the other hand is the ratio
between quick assets (as enumerated above) and current liabilities. Quick assets are the currents assets that
are quickly convertible to cash.
Asset to Equity Ratio measures the financial stability of the company.
Interest Rate Coverage Ratio is used to determine the company's ability to pay interest payments. It determines
how easily a company can pay interest expenses on outstanding debt.
Return on Equity or ROE is one of the measures of a company’s profitability from the stockholders’ viewpoint. It
indicates the profitability of their investment in a company.
Debt to Equity Ratio provides information about the protection of creditors for insolvency and the ability of the
company to obtain additional financing for potentially attractive investment opportunities.
6. Track Record of Securities Registered
SEC Order No.
Date Issued
Nature of
Securities
Amount
Registered
Amount Outstanding as
of September 30, 2012,
1.
344 Series of 2011
November 25, 2011
STCP
P 1,000,000,000
2.
294 Series of 2010
December 2, 2010
STCP
P 1,000,000,000
3.
187 Series of 2009
December 7, 2009
STCP
P
900,000,000
--
4.
147 Series of 2008
December 8, 2008
STCP
P
900,000,000
--
5.
195 Series of 2007
December 14, 2007
STCP
P 1,200,000,000
--
6.
182 Series of 2006
December 28, 2006
STCP
P
700,000,000
--
7.
151 Series of 2005
December 28, 2005
STCP
P
595,000,000
--
8.
179 Series of 2004
December 29, 2004
STCP
P
635,000,000
--
16
MARKET INFORMATION FOR SECURITIES OTHER THAN COMMON EQUITY
STCPs has no established public trading market from which market information for STCPs
can be obtained.
17
MARKET FOR ISSUER'S COMMON EQUITY AND RELATED
STOCKHOLDERS' MATTERS
1. Dividends Policy
Dividends declared by the Company on its shares of stocks are payable in cash or in additional
shares of stock. The payment of dividends in the future will depend upon the earnings, cash
flow, and financial condition of the Corporation and other factors.
2. Dividends
2012
Cash
Php 0.03 / share
Stock
10.00%*
2011
Php 0.05 / share
2010
2009
Php 0.06 / share
Php 0.10 / share
20.00%
20.00%
20.00%
The Company declared Php 0.03 per share cash dividends on May 18, 2012, given to
stockholders of record as of June 15, 2012 and paid on July 11, 2012.
* On August 9, 2012, SEC authorized the issuance of 294,532,105 shares of the par value of
P1.00 or P294,532,105.00 to cover the ten percent (10%) stock dividends declared by the
BOD on May 7, 2012 and ratified by the stockholders on June 5, 2012 and issuance of the
shares to stockholders of record as of August 27, 2012. Payment date is on September 20,
2012.
a) Stock Prices
Unclassified Common Shares
2012
2011
2010
High
Low
First Quarter
1.24
1.07
Second Quarter
1.50
1.11
First Quarter
1.27
1.00
Second Quarter
1.38
1.06
Third Quarter
1.30
1.11
Fourth Quarter
1.25
1.07
First Quarter
1.35
0.75
Second Quarter
1.67
1.18
Third Quarter
1.88
1.38
Fourth Quarter
1.51
1.30
b) Trading Market
The Company's common equity is traded in the Philippine Stock Exchange.
The Corporation has no plans of acquisition, business combination, or other
reorganization that will take effect in the near future that involves issuances
of securities.
18
c) Price Information on the Latest Practicable Date
The Company’s shares were last traded on September 24, 2012 at P 1.14 per share.
Holders
a. The number of shareholders of record as of June 30, 2012 was 802.
b. Top 20 Stockholders on record as of June 30, 2012:
Name
No. of Unclassified
Common Shares
1,484,571,007
332,191,317
%
1.
2.
Cityland, Incorporated
PCD Nominee Corp. (Filipino)
50.40%
11.28
3.
Roxas, Stephen C.
217,222,864
7.38
4.
5.
6.
7.
8.
9.
10.
11.
12.
13.
14.
15.
16.
17.
18.
19.
20.
Liuson, Grace C.
Gohoc, Alice C.
Fan, Lucy
Liuson, Andrew I. (Dr.)
Roxas, Helen C.
Chiong, Daniel Yen
Gohoc, Josef C.
Recto, Ester C.
Gohoc, Johann
Gohoc, Josua
Gohoc, Joel
Gohoc, Joanna
PCD Nominee Corp. (Foreign)
Jefcon, Inc.
Co, Stephen Vincent
Chang, Rita D.
Obadiah, Inc.
157,153,310
125,133,696
107,557,356
90,149,252
44,770,965
37,309,210
34,461,628
31,967,029
31,356,962
26,535,744
26,438,163
26,357,033
19,439,298
13,659,345
13,540,031
12,740,179
12,580,161
5.34
4.25
3.65
3.06
1.52
1.27
1.17
1.09
1.06
0.90
0.90
0.89
0.66
0.46
0.46
0.43
0.43
Changes in Control
There are no agreement which may result in changes in control of the registrant.
19
Recent Sales of Unregistered Securities or Exemption Securities (Including Recent Issuance of
Securities Constituting an Exempt Transaction)
The total number of shares issued and outstanding of the Company increased for the past three
(3) as a result of stock dividends as follows:
Stock
Dividend
Outstanding Shares
From
To
Date Distributed
2008
--
1,704,470,182
1,704,470,182
--
2009
20%
1,704,470,182
2,045,364,273
July 22, 2009
2010
20%
2,045,364,273
2,454,436,794
July 08, 2010
2011
20%
2,454,436,794
2,945,323,834
August 02, 2011
Stock dividends are exempted from registration under Section 10.1 (d) of the Securities
Regulation Code (SRC).
20
INTERESTS OF NAMED EXPERTS AND COUNSELS
The validity of the STCPs Offer and other matters concerning the registration and offering of
the STCPs was passed upon for the Company by Abaya Elias Law Firm.
The audited financial statements of the Company as of and for the years ended December 31,
2011, 2010 and 2009 together with the notes thereto, have been audited by SyCip, Gorres, Velayo &
Co., independent public accountants, as indicated in their reports with respect thereto included herein,
and have been so included in reliance upon the authority of SGV as experts in accounting and auditing
in giving such reports.
The expert or independent counsel will not receive a direct or indirect interest in the registrant
nor was such expert or independent counsel a promoter, underwriter, voting trustee, director, officer or
employee of the registrant.
21
INFORMATION WITH RESPECT TO THE REGISTRANT
Business
A. Background Information
1. Brief Company History
Cityland Development Corporation is a domestic publicly listed corporation which is duly
organized and existing under and by virtue of the laws of the Philippines since January 31,
1978 with the primary purpose of engaging in real estate development.
2. Listing in Stock Exchange
Cityland Development Corporation was listed with the Manila and Makati Stock Exchange in
March 1983.
3. Subsidiaries
a. City & Land Developers, Inc. (Subsidiary)
City & Land Developers, Inc. was incorporated on June 28, 1988 with a primary purpose
of acquiring and developing suitable land sites for residential, office, commercial,
institutional, and industrial uses. Its principal office is at 3/F Cityland Condominium 10
Tower 1 156 H.V. Dela Costa Street, Salcedo Village, Makati City.
The financial performance:
Revenues
Expenses
Income before tax
Net Income
2010
940,719,658
608,583,385
332,136,273
265,596,227
2011
1,115,696,076
740,957,878
374,738,198
316,984,047
September 30, 2012
567,707,098
315,330,828
252,376,270
221,096,628
SEC Registration No. - 152661
b. Cityplans, Inc. (Subsidiary)
Cityplans, Inc. was incorporated on October 27, 1988 with a primary purpose of
establishing, organizing, developing, maintaining, conducting, operating, marketing and
selling educational assistance and pensions. Its principal office is at 3F Cityland
Condominium 10 Tower II, 154 H.V. Dela Costa Street, Salcedo Village, Makati City.
The financial performance:
Revenues
Expenses
Income before tax
Net Income
2010
24,660,713
10,429,613
14,231,100
10,766,213
SEC Registration No. - 156675
2011
21,121,587
12,679,414
8,442,173
8,127,860
September 30, 2012
21,079,716
13,949,563
7,130,153
6,074,194
22
4. Nature of Operations
The Company's primary purpose is to acquire and develop suitable land sites for residential,
office, commercial, institutional, and industrial uses.
Its projects include medium to high-rise office, commercial, and residential condominiums
located in Makati City, Mandaluyong City, Pasig City and Manila City.
B. Development of Business for the past two (2) years (2010 – 2011)
We present herewith the status of sales and construction of our projects as of the end of the
following years:
Cityland Development Corporation
Makati Executive Tower II
Corinthian Executive Regency
Rada Regency
Manila Executive Regency
Makati Executive Tower III
Mandaluyong Executive Mansion III
Makati Executive Tower IV
Grand Central Residences Tower 1
2010
100.00%
98.95
99.40
98.98
81.83
32.67
11.58
7.92
PERCENTAGE SOLD
June 30, 2012
2011
100.00%
99.43%*
99.84
99.63 *
100.00
99.77 *
99.89
99.63 *
88.09
89.76
62.72
86.35
18.90
28.59
11.72
15.59
Launched in 2003
Launched in 2004
Launched in 2005
Launched in 2005
Launched in 2006
Launched in 2008
Launched in 2009
Launched in 2010
* The decrease in percentage sold as of June 30, 2012 as compared with the previous year 2011 was due to cancellation of contracts
to sell due to non- payment.
Makati Executive Tower II
Corinthian Executive Regency
Rada Regency
Manila Executive Regency
Makati Executive Tower III
Mandaluyong Executive Mansion III
Makati Executive Tower IV
Grand Central Residences Tower 1
PERCENTAGE OF COMPLETION
June 30, 2012
2010
2011
100.00%
100.00%
100.00%
100.00
100.00
100.00
100.00
100.00
100.00
100.00
100.00
100.00
100.00
100.00
100.00
100.00
100.00
100.00
23.00
75.06
75.45
4.68
7.22
13.75
City and Land Developers, Inc. (Subsidiary)
Pacific Regency
Grand Emerald Tower
Manila Residences Bocobo
2010
99.67%
68.24
58.61
PERCENTAGE SOLD
June 30, 2012
2011
99.79%
99.78% *
86.50
93.61
72.52
83.52
Launched in 2004
Launched in 2006
Launched in 2009
* The decrease in percentage sold as of June 30, 2012 as compared with the previous year 2011 was due to cancellation of contracts
to sell due to non- payment.
Pacific Regency
Grand Emerald Tower
Manila Residences Bocobo
PERCENTAGE OF COMPLETION
June 30, 2012
2010
2011
100.00%
100.00%
100.00%
97.52
100.00
100.00
38.10
96.36
100.00
23
Cityplans, Inc. (Subsidiary)
Oxford Mansion
Windsor Mansion
Oxford Mansion
Windsor Mansion
2010
95.63%
86.91
PERCENTAGE SOLD
June 30, 2012
2011
95.71%
98.23%
87.46
90.89
Launched in 2004
Launched in 2007
PERCENTAGE OF COMPLETION
June 30, 2012
2009
2010
100.00%
100.00%
100.00%
100.00
100.00
100.00
The details of the above projects are as follows:
Cityland Development Corporation (Parent)
Pines Peak Tower I (launched July 2012)
Pines Peak is a 27-storey residential condominium located at Union corner Pines Sts., Central
Business District of Mandaluyong, a block away from the major thoroughfare of EDSA, near
Shaw Blvd., Pioneer and MRT Station. The project is easily accessible to various commercial
centers and other places of interest. Amenities include swimming pool, gym, multi-purpose
function room with movable playset, viewing deck and 24-hour association security, among
others.
Estimated Date of Completion: March 2016
Grand Central Residences Tower 1
Grand Central Residences Tower 1 is a 40-storey office, commercial and residential
condominium strategically located fronting MRT Shaw Station and steps away from malls,
schools, churches and hospitals. Its amenities include multi-purpose function room with
movable children's playset, swimming pool, gym, central information assistance counter at the
lobby, closed circuit TV system, 24-hour association security and multi-purpose deck.
Estimated Date of Completion: March 2015
Makati Executive Tower IV
Makati Executive Tower IV is a 29-storey commercial and residential condominium located at
Cityland Square, Sen. Gil Puyat Ave., cor. P. Medina St., Makati City. It is in close proximity
to schools, malls, hypermarkets and hospitals. Its amenities include swimming pool, gym,
playground, function room, roof deck and 24-hour association security.
Estimated Date of Completion: December 2013
Mandaluyong Executive Mansion III
Mandaluyong Executive Mansion III is a 7-storey office, commercial and residential
condominium located at Mandaluyong Executive Subdivision, G. Emriquez St., Brgy.
Vergara, Mandaluyong City, with close proximity to Don Bosco Technical College, Rockwell,
SM Megamall, Podium, Shangri-la Plaza, Puregold, Market Place, Robinson's Pioneer, Edsa
Central and Starmall. Its amenities include playground, basketball court and 24-hour
association security.
Date Completed: January 2011
24
Makati Executive Tower III
Makati Executive Tower III is a 38-storey commercial, office, and residential condominium
located at Cityland Square, Sen. Gil Puyat Avenue, Pio Del Pilar, Makati City. Its amenities
include swimming pool, sauna, viewing deck, jogging area, mini-gym, children’s playground,
function room, and 24-hour association security.
Date Completed: April 2010 (completed three months advance)
Manila Executive Regency
Manila Executive Regency is a 39-story office, commercial and residential condominium
situated along J. Bocobo St. Ermita. This property has close proximity to churches, malls,
parks, party places, historical places, government institutions, and commercial establishments.
Its amenities and facilities include swimming pool, gym, spa, function room, children’s
playground, and Manila Bay viewing deck.
Date Completed: August 2009 (completed 4 months advance)
Rada Regency
Rada Regency is a 24-storey commercial and residential condominium located along Rada St.
corner Dela Rosa St., Legaspi Village, Makati City. Its close proximity to various schools
(Don Bosco Technical Institute, Ateneo and La Salle Graduate School), shopping malls (The
Landmark, Glorietta, Greenbelt), hospitals, fire station, post office, banks, restaurants and
other leisure centers truly makes it an excellent investment opportunity. Its amenities and
facilities include swimming pool, separate sauna for men and women, roofdeck / viewing /
jogging deck, gym, children’s playground, function room, drying area, laundromat and 24hour association security.
Date Completed: July 2008 (completed six months in advance)
Corinthian Executive Regency
Corinthian Executive Regency is a 39-storey office, commercial and residential condominium
located along Ortigas Avenue, Pasig City. It has an excellent location and close proximity to
various schools (La Salle Greenhills, Poveda), churches, hospitals (the new Medical City),
banks, shopping malls (Robinson Galleria), SM Megamall, the Podium, Shangrila), restaurants
and other leisure centers. Its amenities and facilities include swimming pool, gym, sauna for
men and women, viewing deck, function room, laundromat, provision for children’s
playground, and 24-hour association security.
Date Completed: May 2008 (completed one month in advance)
Makati Executive Tower II
Makati Executive Tower II is a 35-storey office, commercial and residential condominium
located at Cityland Square, Dela Rosa Street, corner P. Medina Street, Makati City, with close
proximity to the establishments such as Makati Medical Center, Makati Post Office, Glorietta
and Greenbelt, Assumption College, AMA University, Don Bosco Technical Institute and
Makati Gospel Church. Amenities and facilities include swimming pool, gym, men and female
sauna, roof deck/viewing deck, children’s playground and function room. Other service
facilities include laundromat and 24-hour association.
Date Completed: March 2007 (completed three months in advance)
25
City & Land Developers, Inc. (Subsidiary of Cityland Development Corporation)
Manila Residences Bocobo
Manila Residences Bocobo is a 34-storey commercial, office and residential building located
at 1160 Jorge Bocobo St., Ermita, Manila City. Its amenities and features include swimming
pool, gymnasium, function room, multi-purpose deck, children's play area and 24-hour
association security.
Date Completed: June 2012 (completed 1 year ahead of schedule)
Grand Emerald Tower
Grand Emerald Tower , a 39-storey commercial, office and residential condominium located
along Emerald corner Ruby and Garnet Streets, Ortigas Center, Pasig City. Its amenities and
facilities include swimming pool, gymnasium, viewing deck, sauna, children’s playground,
multi purpose function room, and 24-hour association security. It is proximate to schools,
hospitals, shopping malls, banks, restaurants, hotels , churches and other leisure and business
establishments.
Date Completed: February 2011 (completed four months in advance)
Pacific Regency
Pacific Regency is a 38-storey commercial, office, and residential condominium located at
Pablo Ocampo Sr. Ave. (formerly Vito Cruz Street) in front of Rizal Memorial Sports
Complex in Manila. Amenities and facilities include swimming pool, gymnasium, separate
sauna for male and female, function room, children’s playground, 24-hour association
security, viewing area, and jogging areas at the roof deck.
Date Completed: October 2007 (completed eight months in advance)
Cityplans, Inc. (Subsidiary of Cityland Development Corporation)
Oxford Mansion
Oxford Mansion is an 8-storey commercial and residential condominium located along
Evangelista St., New Santolan, Pasig City. Amenities and facilities include 2 elevators,
administrative office, visitor’s lounge, provision for cable TV and telephone line, individual
water submeter / Meralco meter and 24-hour association security.
Date Completed: October 2006
Windsor Mansion
Windsor Mansion is a joint project of the Company and Cityplans. It is a commercial and
residential condominium located at Santolan, Pasig City. Amenities include common
clubhouse, swimming pool and 24-hours association security for the whole complex. It is
proximate to schools, commercial establishments, business and office centers.
Date Completed: December 2007
2. Marketing
All projects are sold by direct company salesmen and independent brokers.
26
3. Revenue Contribution to Total Revenues on Sales of Real Estate
PERCENTAGE
2010
2011
June 30, 2012
Cityland Development Corporation
Cityland Makati Executive Tower II
Corinthian Executive Regency
Rada Regency
Manila Executive Regency
Cityland Makati Executive Tower III
Mandaluyong Executive Mansion III
Makati Executive Tower IV
Grand Central Residences I
Others
City & Land Developers, Inc.
Pacific Regency
Grand Emerald Tower
Manila Residences Bocobo
Others
Cityplans, Inc.
Pasig Royale Mansion
Oxford Mansion
Windsor Mansion
Total
1.72%
1.44
1.01
4.45
25.32
6.24
2.54
0.49
4.00
0.73%
1.52
0.73
2.21
10.99
11.22
10.45
0.85
1.57
0.99%
0.87
0.61
0.91
9.53
22.84
13.19
3.84
0.87
0.04
37.82
14.65
0.22
0.62
23.33
35.50
0.28
0.27
17.91
26.95
0.04
-0.06
-100.00%
---100.00%
-0.30
0.88
100.00%
4. Domestic and Foreign Sales Contribution to Total Sales
2010
Sales
Filipino Citizens
Foreign Citizens
Total
PERCENTAGE
June 30, 2012
2011
86.44%
13.56
100.00%
88.53%
11.47
100.00%
88.58%
11.42
100.00%
5. Competition
The property development industry in the Philippines where the Registrant is selling its
products and services is characterized by boom-bust cyclical pattern exhibited in the past
couple of decades where the industry normally goes through years of robust growth following
years of slowdown. Currently, the industry is in the middle of this cycle.
The geographical area/ location of the Company's projects are in Makati, Manila, Pasay and
Mandaluyong cities. The Company builds high- rise condominium projects catering to middle
and high- income groups.
Cityland's projects are offered at affordable prices and affordable payment schemes. The
Company has proven its track record in the timely turn-over or even advanced turn-over of its
projects in line with its, “We commit, we deliver” slogan.
In the property development industry, the principal methods of competition among the
developers are as follows:
a. price;
b. product or the type of development i.e. high, middle, low-end; and
c. service or property management after the project is turned over to the buyers.
The present projects of the registrant and the competitors' projects which are quite similar in
terms of classification and proximity to the registrant's projects are:
27
Grand Central Residences Tower 1 is located at EDSA cor. Sultan St., Brgy. Highway Hills,
Mandaluyong City. Other condominium project which is quite similar in terms of
classification and proximity to Grand Central Residences Tower 1 is the Light Residences, a
project of SM Development Corporation. In terms of size, financial and market strengths, said
developer is one of the major developers in the country.
Makati Executive Towers III and IV are located at Sen. Gil Puyat Ave., Makati City. Other
condominium project which is quite similar in terms of classification and proximity to Makati
Executive Towers III and IV is The Linear which is located at corner Yakal, Malugay and
Mayapis Sts., Makati City, a project of Filinvest Land, Inc. In terms of size, financial and
market strengths, said developer is one of the major developers in the country.
Mandaluyong Executive Mansion III is a 7-storey commercial and residential condominium
located at G. Enriquez St., Brgy. Namayan, Mandaluyong City. Other condominium project
that is quite similar in classification and proximity to Mandaluyong Executive Mansion III is
the Tivoli Garden Towers which is located along Coronado St., Mandaluyong City. This is a
project of DMCI. In terms of size, financial and market strengths, said developer is one of the
major developers in the country.
The Registrant's competitors have their own respective financial and market strengths.
However, Cityland believes it can effectively compete with other companies because of good
location, affordable pricing, and quality development.
6. Customers
Cityland has a broad market base and is not dependent upon a single or few customers. It has
no single customer that accounts for 20% or more of its sales. Likewise, there are no major
existing sales contracts.
7. Purchases of Raw Materials and Supplies
Cityland engaged the services of Millennium Erectors Corporation and CapCons Philippines
Corporation for the civil and architectural works in the development of its on-going projects.
As to the construction materials, Cityland has no major existing supply contracts for its
projects. The major construction materials like steel bars, cement, etc. are sourced through
canvassing and bidding from its list of accredited suppliers. Cityland then buys the materials
from the lowest bidder.
8. Number of Employees
Cityland has a total of 143 employees as of June 30, 2012 classified as follows:
Managerial
34
Administrative
82
Rank & File
109
Operations
61
Total
143
Total
143
The number of employees is expected to increase by 7% within the next 12 months. The
Company maintains an organizational framework whereby important management functions as
well as administrative tasks are shared within the Cityland group.
The Company gives bonuses to its employees. Also, employees are entitled to vacation and
sick leave and are covered by a retirement plan.
28
All employees are not subject to collective bargaining agreement.
The Company's employees are not on strike or are threatening to strike nor they have been on
strike for the past three (3) years.
9. Government Approval of Projects
Status of Approval of On- going Projects
Government Agency:
a. Housing and Land Use
Regulatory Board
-Certificate of Registration/
License to Sell
b. City/Municipal Building
Official / Department of Public
Works and Highways.
1. Development Permit by HLRB
/Location
2. Building Permit
- Excavation, Civil Works
- Mechanical, Electrical,
Sanitary, Fire,Sidewalk
3. Occupancy Permit (Electrical,
Fire, Mechanical,Civil, Sanitary)
c. Department of Environment
and Natural Resources
-Environmental Compliance
Certificate
-Permit to Construct Sewage
Treatment Plant (STP)
- Permit to Operate STP
d. Laguna Lake Development
Authority
-Permit to Construct Sewage
Treatment Plant (STP)
- Permit to Operate STP
Makati Executive Tower IV Grand Central Residences
Tower 1
Approved
Approved
Approved
Approved
Approved
Approved
Approved
Approved
To be applied upon
completion
To be applied upon
completion
Approved
Approved
Not Applicable
(to be connected to
METIII STP)
Not Applicable
(to be connected to
METIII STP)
Not Applicable
(included in ECC)
To be applied upon
completion
Not Applicable
Not Applicable
Not Applicable
Not Applicable
10. Effect of Existing Government Regulations on the Business
The Company has complied with all the appropriate government regulations prior to the
development and marketing of its projects.
The effect of the various regulations on the business of the issuer are projects developed in
accordance with the high quality standards required by the various regulatory agencies of the
government. Compliance with these requirements symbolizes the unrelenting commitment of
the management to service and protection of its community and environment.
11. Amount Spent for Research/Development Activities
There is no amount spent on research and development activities.
29
12. Cost and Effect of Compliance with Environmental Laws
Costs:
Payments made for environmental clearances to the Department of Environment & Natural
Resources are as follows:
2012
Payment of Php33,600.00 to Wet Consultancy, Inc. as downpayment for
securing ECC and LLDA Clearance of Citynet.
2011
Final payment of Php159,985.00 to Wet Consultancy Inc. in securing the ECC
of Pines Peak project.
2010
Paid Php653,115 to Wet Consultancy, Inc. for ECC of Grand Central
Residences and Pines Peak project.
Effects:
Obtained Environmental Clearance Certificates for the aforementioned projects.
13. Transactions with and/or dependence on related parties
Transactions with related parties are confined to cash advances and non-interest-bearing
advances for reimbursable expenses from and to the registrant which the Company enters into
with its affiliates in the regular course of its business. It also includes an existing management
agreement with Cityland, Inc., its parent company.
The Registrant's affiliates are Cityland, Inc. (CI), its parent company and City and Land
Developers, Inc. (CLDI) and Cityplans, Incorporated (CPI), its subsidiaries.
14. Principal Terms and Expiration Dates of All Patents, Trademarks, Copyrights, Licenses and
Royalty Agreements Held
The Company holds no patents, trademarks, copyrights, licenses, franchises, concessions and
royalty agreements.
15. Major Risks Involved in Each of the Businesses of the Company
The Company is primarily engaged in real estate development. Risk factors are:
Refinancing Risk: The Company is primarily engaged in real estate development. Risk Factors
are: the moderately aggressive debt level of the Company's borrowings being
short-term in nature increase the possibility of refinancing risks. This debt
mix in favor of short-term borrowings is a strategy which the Company
adopted to take advantage of lower cost of money for short-term loans versus
long-term loans. Because the Company has the flexibility to convert its shortterm loans to a long-term position by drawing down its credit lines with
several banks or sell its receivables, refinancing risk is greatly reduced.
The Company manages such refinancing risks by improving the acid-test ratio
and maintaining the current ratio at 1.39:1 and 2.01:1 as of June 30, 2012
from 1.21:1 and 2.01:1 as of December 31, 2011.
Credit Risk:
This is defined as the risk that one party to a financial instrument will cause a
financial loss for the other party by failing to discharge an obligation.
The financial instruments which may be the subject of credit risk are the
installment contracts receivables and other financial assets of the Company.
30
The corresponding management strategies for the aforementioned risks are as
follows:
1. The credit risk on the installment contracts receivables may arise from the
buyers who may default on the payment of their amortizations. The
Company manages this risk by dealing only with recognized, credit
worthy third parties. Moreover, it is the Company's policy to subject
customers who buy on financing to credit verification procedures. Also,
receivable balances are monitored on an on-going basis with the result that
the Company's exposure to bad debts is insignificant.
2. The credit risk on the financial assets of the Company such as cash and
cash equivalents, short-term cash investments, financial assets at fair value
through profit or loss and available for sale investments may arise from
default of the counterparty. The Company manages such risks by its policy
to enter into transactions with a diversity of creditworthy parties to
mitigate any significant concentration of credit risks. As such, there are no
significant concentrations of credit risks in the Company.
Interest Rate
Risk:
This is the risk arising from uncertain future interest rates.
The Company's financial instruments are:
1. The Company's financial assets mainly consist of installment contract
receivables, cash and cash equivalents and short-term investments. Interest
rates on these assets are fixed at their inception and are therefore not
subject to fluctuations in interest rates.
2. For the financial liabilities, the Company only has short-term commercial
papers which bear fixed interest rates, thus are not exposed to fluctuations
in interest rates.
Market Risk: This is the risk that the fair value or future cash flows of a financial instrument
will fluctuate because of changes in market prices. Financial instruments which
rely their value on market factors are subject to market risk.
The available for sale investments are exposed to market risk. There is a risk for
a decline in the value due to changes in the market. The exposure however, is
negligible because the amount of the said investment is insignificant as
compared to the financial assets of the Company.
Liquidity Risk: This is the current and prospective risk to earnings or capital from a company's
inability to meet it obligations when they come due without incurring
unacceptable losses.
The Company's treasury has a well-monitored funding and settlement
management plan. The following is the liquidity risk management framework
maintained by the Company:
1. Asset- Liability Management: Funding sources are abundant and provide a
competitive cost advantage. The Company also holds financial assets for which
there is a liquid market and are, therefore, readily saleable to meet liquidity
needs.
2. Conservative Liability Structure: Funding is widely diversified. There is little
reliance on wholesale funding services or other credit-sensitive fund providers.
The company accesses funding across a diverse range of markets and
counterparties.
31
3. Excess Liquidity: The Company maintains considerable excess liquidity to
meet a broad range of potential cash outflows from business needs including
financial obligations.
4. Funding Flexibility: The Company has an objective to maintain a balance
between continuity of funding and flexibility through the use of loans from
banks and STCPs. As such, the Company addresses risk on liquidity by
maintaining committed borrowing facilities in the form of bank lines and a
established record in accessing these markets.
Economic:
Results of operations is influenced by the general condition of the Philippine
economy. Any economic instability or failure to register improved economic
performance may adversely affect the Company’s operations.
Political:
The Company’s business like all other business may be influenced by the
political situation in the country. Any political instability in the future could
have a material adverse effect in the Company’s business.
Industry:
The real estate industry is characterized by boom-bust cyclical pattern exhibited
in the past couple of decades where the industry normally goes through years of
robust growth following years of slowdown.
The management manages the above risks by:
Conducting assessments of the economic and political situations of the country as well as new
developments in the industry. The procedures involved in gathering of information of
economic indicators and political events as well as being aware of the new developments in
the industry is through media, business conferences, economic briefings and other sources.
With this information, the Company is able to assess and manage the risks mentioned above.
Debt Issues
The registrant's net worth exceeds P 25 million and the registrant has been in business for
more than thirty (30) years.
Properties
Investment in real estate properties as of June 30, 2012 are as follows:
Particular
Location
Total Area
(in sq.m.)
1. Land &
building
Corner of Pioneer and
Reliance Sts., partly
located in Mandaluyong
City& Pasig City
12,502
2. Land
Corner Union and Pines
Sts.,
Mandaluyong City
6,130
3. Land
Barangay Punungyanan,
Gen. Trias, Cavite City
501,832
4. Land
Brgy. Sabang, Naic,
Cavite
670,891
Description
Mortgagee /
Limitation
The property is located near Metrobank /
MRT3 Boni Station; about a
P 200M
km. away from Ortigas Center
&
and presently improved with
warehouse buildings. Portion Security Bank /
P 1600M
of property is mortgaged with
bank.
The land is located in an area
--where land development is for
commercial and industrial
purposes.
The land is adjacent to Eagle
--Ridge Golf Course and
Gateway Business Park.
The land is for mixed
--commercial and residential
use.
32
5. Land
Bo. Wack-Wack
Mandaluyong City
2,367
6. Office
H.V. Dela Costa St.,
Condominium Salcedo Village, Makati
City
3,493
7. Land
Brgy. Sabang, Naic,
Cavite
513,705
8. Land
Brgy. Almanza, Uno,
Las Piñas
1,400
9. Land
Brgy. Highway Hills,
Mandaluyong City
2,837
The land is located near Security Bank /
POEA in front of Robinson's
P 1600M
Galleria; along EDSA very
near MRT3 Ortigas Station.
Property is mortgaged with
bank.
This is an office condominium
for lease and office use located
at Cityland 10 Tower I&II in
H.V.dela
Costa
corner
Geronimo St.,Makati City.
Only 1,683.42 sq.m. of
property is mortgaged with
bank.
Lot is near subdivisions like
Coastal City and Retirement
Village
Lot is located in front of
Alabang-Zapote road near
Madrigal Business Park.
Lot is located near EDSA
Central & Shangri-La Mall in
Shaw Blvd.
Investment in Real Estate Properties of subsidiary: City and Land Developers, Inc.;
1. Land
Roxas Blvd. Cor.
3,154
Lot is located along Roxas
Seaside Drive, Brgy.
Blvd. Property.
Tambo, Parañaque City
2. Land
Samar Ave. cor.
Eugenio Lopez Ave.,
Quezon City
EDSA cor. Lanutan
Alley, Brgy. Veterans
Village, Quezon City
3. Land
Metro Bank /
P 200M
---
-----
---
3,096
Lot is located along Samar
Ave., Quezon City
---
1,661
Lot is located along EDSA
cor. Lanutan Alley, Brgy.
Veterans Village, Quezon
City
---
Ownership
The Company has complete ownership of the above-mentioned properties.
Plan to Purchase
The Company has intentions to acquire property(ies) in the next twelve (12) months within the
vicinity of Metro Manila. Actual acquisition is dependent on the outcome of negotiation with
prospective seller(s). The source of financing the Company expects to use is the unavailed credit line
of the company amounting to P2.45B.
Lease Contracts
Leased properties as of June 30, 2012 are as follows:
Project
Pioneer – Warehouse / Parking
Makati Executive Towers
Grand Emerald Tower- Units/Parking
Cityland Condominium 10 Towers I and II - Units/Parking
Roxas Boulevard – Lot
Rental Income
Php
4,576,105
2,491,163
2,120,891
1,951,095
740,453
33
Edsa Ortigas – Lot
Mandaluyong Executive Mansion III- Units/Parking
Cityland Dela Rosa Condominium – Parking/Storage
Cityland Herrera Tower – Parking/Storage
Rada Regency - Parking
Manila Executive Regency
Vito Cruz Properties
Cityland Mega Plaza – Parking
Others
Total
Php
402,102
394,215
357,251
280,229
259,311
120,727
108,166
23,214
21,360
13,846,282
Note : Term of lease contracts ranges from 1 month to 1 year.
Renewal Options
Lease contracts are renewable upon written agreement of the parties.
Legal Proceedings
The material legal proceedings to which the registrant, its subsidiaries or affiliates is a party
or of which any of their property is the subject as of June 30, 2012 are as follows:
1.) Registrant
Esmeraldo Balosa vs. Cityland Development Corporation
(Civil Case No. MC08 – 3563)
Mandaluyong Regional Trial Court- Branch 208
Date Instituted: April 11, 2008
Esmeraldo Balosa filed a case for preliminary Mandatory Injunction with damages against
Cityland after the Business and License Department of Mandaluyong City closed his stalls due
to Balosa’s failure to secure the necessary permits. He alleged that he has not been paying the
lease because another entity is also claiming ownership of the leased property and that
property cannot be used for his business. Balosa claims Cityland illegally ejected him. Trial of
the case is on going.
2) Affiliates
a. Cityland, Inc. (CI) - parent company
Tagaytay Executive Village Homeowners’ Association, Inc. vs Cityland, Inc.
Case No. REM-A-11-01574
Tagaytay Executive Village Homeowners’ Association, Inc. (TEVHAI) filed an Appeal
Memorandum dated November 9, 2011 with the HLURB Board of Commissioners and
received by Cityland last November 19, 2011. The case involves a petition to revoke the
certificate of completion (“COC”) dated March 10, 2010 issued by the Regional Office,
HLURB, Southern Tagalog Region, in favor of Cityland, Inc., owner and developer of
Tagaytay Executive Village located at Brgy. San Jose, Tagaytay City. TEVHAI wants the
Court to recall/cancel the COC and that Cityland be ordered to fully complete the alleged
deficiencies in the amenities.
The case was dismissed by the HLURB Region IV office. Consequently, the TEVHAI filed
an appeal with the HLURB Board of Commissioners (which was dismissed in a Decision
dated February 2, 2012).
34
b. City & Land Developers, Inc. (CLDI)- subsidiary
Angapat Realty vs. CLDI
Manila Regional Trial Court- Branch 11
Date Instituted: March 16, 2004
This is a complaint for injunction and damages with a prayer for preliminary injunction with
temporary restraining order filed by Angapat Realty and Development Corporation
(“Angapat”) against CLDI to enjoin the corporation from further constructing a billboard that
allegedly blocks the view of Angapat’s billboard. Angapat is asking for actual damages in the
amount of P100,000 a month, exemplary damages to P 500,000 and attorney’s fees amounting
to P 250,000.
The prayer for preliminary injunction was denied and the case was subsequently archived in
an Order dated May 18, 2007.
3) Property
There was no case filed wherein any of its property/ies as the subject.
The Company does not expect that the outcome of the above material legal proceedings involving
the registrant and its subsidiary will have a material adverse effect on the financial condition of the
Company.
During the past five years up to present, there is no bankruptcy petition filed by or against any
business of which such person was a general partner or executive officer of the Registrant either at
a time of the bankruptcy or within two years prior to that time.
During the past five years up to present, the Registrant, any of its directors or executive officers
has no conviction by final judgment, domestic or foreign, or is not subject to a pending criminal
proceeding, domestic or foreign.
During the past five years up to present, the Registrant, any of its directors or executive officers is
not subject to any order, judgment, or decree, not subsequently reversed, suspended or vacated, of
any court of competent jurisdiction, domestic or foreign, permanently or temporarily enjoining,
barring, suspending or otherwise limiting his involvement in any type of business, securities,
commodities or banking activities.
During the past five years up to present, the Registrant, any of its directors or executive officers
has not been found by a domestic or foreign court of competent jurisdiction (in civil action), the
Commission or comparable foreign body, or a domestic or foreign exchange or other organized
trading market or self- regulatory organization, to have violated a securities or commodities law or
regulation and the judgment has not been reversed, suspended, or vacated.
MANAGEMENT’S DISCUSSION AND ANALYSIS OR PLAN OF OPERATION
1. Financial Performance
For the Nine Months Ended September 30, 2012
On July 2012, the Company (CDC) launched Pines Peak Tower 1, a 27-storey residential
condominium located at Union corner Pines St., Barangka, City of Mandaluyong. Also, on June
2012, the Company’s subsidiary, City & Land Developers, Inc. (CLDI) turned over, one year
ahead of schedule, Manila Residences Bocobo, a 34-storey office, commercial and residential
condominium located in Jorge Bocobo St., Ermita, Manila City. CLDI is now selling its remaining
unsold units.
35
The Company and its subsidiaries are pre-selling the following on-going projects:
Grand Central Residences, a 40-storey office, commercial and residential condominium located at
EDSA corner Sultan St., Mandaluyong City, a project of CDC.
Makati Executive Tower IV, a 29-storey office, commercial and residential condominium located
at Cityland Square, Senator Gil Puyat Avenue, Pio del Pilar Makati City, a project of CDC.
Also, the Company and its subsidiaries are selling the following completed and operational
projects:
Grand Emerald Tower, a 39-storey commercial, office and residential condominium located along
Emerald corner Ruby and Garnet Streets, Ortigas Center, Pasig City, a project of CLDI.
Makati Executive Tower III, a 37-storey office, commercial and residential condominium located
at Cityland Square, Senator Gil Puyat Avenue, Pio del Pilar Makati City, a project of CDC.
Mandaluyong Executive Mansion III, a residential condominium located at Mandaluyong
Executive Mansion Subdivision, G. Enriquez St., Brgy. Vergara, Mandaluyong City, a project
of CDC.
Oxford Mansion, an 8-storey commercial and residential condominium located along Evangelista
St., New Santolan, Pasig City, a joint project of Cityplans, Inc. (CPI), a subsidiary of CDC and
Cityland, Inc. (CI).
Windsor Mansion, an 8-storey commercial and residential condominium located at New Santolan,
Pasig City, a joint project of CPI and CI.
The Company has also a number of prime lots reserved for future projects. Its land bank is
situated in strategic locations ideal for horizontal and vertical developments.
Internal sources come from sales of condominiums and real estate projects, collection of
installment receivables, maturing short-term investments and other sources such as rental income,
interest income and dividend income. External sources come from SEC-registered commercial
papers and Home Guaranty Corporation’s guaranteed promissory notes.
The estimated development cost of 307.93 million as of September 30, 2012 representing the cost
to complete the development of real estate projects sold will be sourced through:
1.
2.
3.
4.
5.
Sales of condominium and real estate projects
Collection of installment receivables
Maturing short-term investments
Issuance of commercial papers
Availment of bank lines (bank lines as of September 30, 2012 amounted to 2.515 billion
of which 2.515 billion is still unavailed).
For the Year Ended December 31, 2011
The Philippine economy as measured by the gross domestic product (GDP) posted a modest 3.7
percent growth in 2011. The slowdown can be attributed to the typhoons and the decline in
foreign trade due to the poorly performing U.S economy, the European debt crisis and the Japan
earthquake. In addition, political tensions in the Middle East resulted to high oil prices. The
government is now pushing for a more robust growth rate in 2012 by increasing tax collection,
implementing sound monetary policies and pledging to boost public spending on infrastructure
development through public-private partnership. Amidst the economic slowdown, the Company’s
sales remained stable indicating a sustained demand for condominium projects. At present, low
interest rates encouraged availment of loans resulting to investments in real estate properties. The
Company projects that sales will further increase with the stable macroeconomic environment and
the gradual recovery of the world economy.
36
The Company and its subsidiaries are pre-selling the following on-going projects:
Grand Central Residences I, launched last year is a 40-storey commercial, office and residential
condominium located at EDSA corner Sultan St. (fronting MRT Shaw), Mandaluyong City.
Makati Executive Tower IV, a 29-storey office, commercial and residential condominium located
at Cityland Square, Senator Gil Puyat Avenue, Pio del Pilar Makati City.
Manila Residences Bocobo, a 34-storey commercial, office and residential condominium project
located at Jorge Bocobo St., Ermita, Manila City, a project of CLDI.
In addition, the Company and its subsidiaries are selling the following completed projects:
Grand Emerald Tower, a 39-storey commercial, office and residential condominium located along
Emerald corner Ruby and Garnet Streets, Ortigas Center, Pasig City, a project of CLDI.
Makati Executive Tower III, a 37-storey office, commercial and residential condominium located
at Cityland Square, Senator Gil Puyat Avenue, Pio del Pilar, Makati City.
Mandaluyong Executive Mansion III, a 7-storey commercial and residential condominium located
at G. Enriquez St., Brgy. Vergara, Mandaluyong City.
Oxford Mansion, an 8-storey commercial and residential condominium located in Santolan, Pasig
City, a joint project of Cityplans, Inc. (CPI) and Cityland, Inc. (CI). CPI is a subsidiary of CDC.
Windsor Mansion, an 8-storey commercial and residential condominium located in Santolan,
Pasig City, a joint project of CPI and CI.
The Company has also a number of prime lots reserved for future projects. Its land bank is
situated in strategic locations ideal for horizontal and vertical developments.
Internal sources of liquidity come from sales of condominiums and real estate projects, collection
of installment receivables, maturing short-term investments while external sources come from
SEC-registered commercial papers and Home Guaranty Corporation’s promissory notes.
For the Year Ended December 31, 2010
The country’s economy grew dramatically from 0.9% in 2009 to 7.3 % in 2010, the highest in
more than two decades. The high gross domestic product (GDP) rate came during a peaceful
political transition of a new administration. The strong growth can be attributed to improved
investor’s confidence, government and election expenditures, continued inflow of overseas
remittances, growth of the business outsourcing sector and the high rate of foreign trade due to the
improving global economy. At present, real estate sales remained strong as bank interest rates
remained low while inflation rate remained manageable at below 5%. The Company is optimistic
that the favorable political and business environment combined with the recovery of the world
economy will bring more investments in the real estate industry.
The Company launched Grand Central Residences on August 2010. This is a 40-storey
commercial, office, and residential condominium located at Shaw Boulevard, Mandaluyong City.
The Company and its subsidiaries are selling the following on-going projects:
Makati Executive Tower IV, a 29-storey office, commercial and residential condominium located
at Cityland Square, Senator Gil Puyat Avenue, Pio del Pilar Makati City, a project of CDC.
Mandaluyong Executive Mansion III, a residential condominium located at Mandaluyong
37
Executive Mansion Subdivision, G. Enriquez St., Brgy. Vergara, Mandaluyong City, a project
of CDC.
Grand Emerald Tower, a 39-storey office, residential and commercial condominium project
located along Emerald Avenue corner Garnet and Ruby Roads, Ortigas Center, Pasig City, a
project of City & Land Developers, Inc. (CLDI).
Manila Residences Bocobo, a 34-storey commercial, office, and residential condominium project
located at Jorge Bocobo St., Ermita, Manila City, a project of CLDI.
Also, the Company and its subsidiaries are selling the following finished projects:
Makati Executive Tower III, a 37-storey office, commercial and residential condominium, located
at Cityland Square, Senator Gil Puyat Avenue, Pio del Pilar Makati City, a recently
completed and turned over project of CDC.
Corinthian Executive Regency, a 39-storey office, commercial and residential condominium
located along Ortigas Avenue, Ortigas Center, Pasig City, a project of CDC.
Manila Executive Regency, a 39-storey office, commercial and residential condominium located
along J. Bocobo St., Malate, Manila, a project of CDC.
Windsor Mansion, an 8-storey commercial and residential condominium located at New
Santolan, Pasig City, a joint project of Cityplans, Inc. (CPI), a subsidiary of CDC and
Cityland, Inc. (CI)
The Company has also a number of prime lots reserved for future projects. Its land bank is
situated in strategic locations ideal for horizontal and vertical developments.
Internal sources come from sales of condominiums and real estate projects, collection of installment receivables, maturing short-term investments and other sources such as rental income, interest income and dividend income. External sources come from bank loans.
For the Year Ended December 31, 2009
The Philippine gross domestic product registered a 0.9% growth in 2009, the slowest pace in 11
years amid the global financial crisis and after being devastated by two strong typhoons during
the year. The growth was still within the government’s target showing the economy’s resilience
as compared with other economies experiencing a negative growth rate. A large fiscal stimulus,
an accommodative monetary policy and strong remittances from increasing overseas Filipinos
helped the economy elude a recession. The government aims to achieve a better growth rate in
2010 and plans to implement appropriate policies that will continue to provide the right
environment to boost economic growth. At present, the low interest rates, the availability of
capital to investors and borrowers, the continued influx of dollars from overseas workers, the
growth of the business outsourcing sector and the rapidly expanding population continued to fuel
the demand of real estate properties. It is for this reason that despite the odds, the Company
posted a respectable performance in 2009. It is hopeful that the year 2010 will bring in fresh
mandates that will usher in new energy and opportunities of growth that will be beneficial to the
real estate industry and to the entire business community.
The Company managed to achieve financial stability by maintaining a cautious stance given the
current environment. The Company will continue to offer quality projects in convenient locations
at affordable and easy payment terms.
For the year 2009, the Group launched 2 new condominium projects. These are: Makati
Executive Tower IV, a 29 storey commercial , office and residential condominium located at
Cityland Square, Senator Gil puyat Avenue, corner P. Medina St., Makati City and Manila
Residences Bocobo, a 34-storey office, commercial and residential condominium located at
Jorge Bocobo St,. Ermita Manila City. These projects were well received and are expected to
boost the Company’s sales and revenues.
In addition to the above, the Company and its subsidiaries are pre-selling the following on-going
38
projects:
Mandaluyong Executive Mansion III is a 7-storey commercial and residential condominium
located at G. Enriquez St., Brgy. Vergara, Mandaluyong City.
Makati Executive Tower III, a 37-storey office, commercial and residential condominium located
at Cityland Square, Senator Gil Puyat Avenue, Pio del Pilar, Makati City.
Grand Emerald Tower, a 39-storey commercial, office and residential condominium located
along Emerald corner Ruby and Garnet Streets, Ortigas Center, Pasig City, a project of
CLDI.
In addition, the Company and its subsidiaries are selling the last few units of the following
completed projects:
Manila Executive Regency, a 39-storey office, commercial and residential condominium located
along J. Bocobo St., Ermita Manila., a project of CDC. This project was completed in the
third quarter of 2009 and was ahead of its scheduled turnover.
Rada Regency, a 24-storey condominium located along Thailand St. (formerly Rada St.) corner
Dela Rosa St., Legaspi Village, Makati City, a project of CDC.
Corinthian Executive Regency, a 39-storey office, commercial and residential condominium
located along Ortigas Avenue, Ortigas Center, Pasig Ctiy , a project of CDC.
Oxford Mansion, an 8-storey commercial and residential condominium located along
Evangelista St., New Santolan, Pasig City, a joint project of Cityplans, Inc (CPI) and
Cityland, Inc. (CI). CPI is a subsidiary of CDC.
Windsor Mansion, an 8-storey commercial and residential condominium located in Santolan,
Pasig City, a joint project of CPI and CI.
The Company has also a number of prime lots reserved for future projects. Its land bank is
situated in strategic locations ideal for horizontal and vertical developments.
Internal sources of liquidity come from sales of condominiums and real estate projects,
collection of installment receivables, maturing short-term investments while external sources
come from loans obtained from financial institutions.
Financial Condition
September 30, 2012 vs. December 31, 2011
Total assets amounted to 8.226B as of the third quarter of 2012 as compared with the previous
year’s ending balance of 8.030B. Cash and cash equivalents stood at 2.163B as of September
2012, derived from net operating activities, proceeds from loans and shift of funds to shorter term
period investments. Although cash and cash equivalents increased by 50.88%, total assets slightly
increased by 2.44% due to the decrease in installment contracts receivable, real estate properties
for sale, investment properties and short term cash investments. Collection of receivables
decreased installment contracts receivables and sales of real estate properties decreased real estate
properties for sale. The launching of a project in July 2012 also decreased investment properties
due to reclass of lot to real estate properties for sale.
On the liabilities side, the Company’s payment of accounts payable and accrued expenses,
income tax payable and deferred tax liabilities resulted to the reduction of liabilities. However,
loans and notes payable increased due to additional issuance of notes payable, while increase in
contracts payable was due to purchase of a property resulting to a 2.16% reduction in total
39
liabilities. Total stockholders’ equity stood at 5.602B as of September 30, 2012 higher by 4.75%
from 2011 year end balance of 5.348B due to net income of 383.56M less cash dividends of
138.45M plus other adjustment of 9.00M. As a result of the foregoing, the Company’s liquidity
position improved with acid-test and current ratio at 1.53:1 and 2.26:1 as of the third quarter of
2012 as compared to 1.21:1 and 2.01:1 in December 2011, respectively. Debt-equity ratio is also
improved to 0.37:1 as of the third quarter of 2012, as compared with 0.42 as of the same period of
the previous year.
December 31, 2011 vs. December 31, 2010
The Company’s balance sheet remains to be healthy with total assets of 8.043B in 2011, higher
than the previous year's level of 7.890B. Cash and cash equivalents increased due to net cash
inflows from operating activities and the shift of investments to shorter period resulting to the
reclassification of account. The Company’s funds were substantially utilized for the construction
of condominium projects, was used to purchase a prime lot, partially settle loans and notes payable
and pay cash dividends. As a result of the foregoing, the group strengthened its liquidity position
with current and acid test ratio of 2.01:1 and 1.21:1 as compared to 2010 of 1.77:1 and 01.07:1,
respectively. The decrease in liabilities improved its solvency position with asset and debt ratio at
2.99:1 and 0.34:1 compared with the previous year of 2.64:1 and 0.46:1, respectively.
Total stockholders' equity stood at 5.356B, higher by 9.27% as compared with 2010 of 4.902B.
The increase was due to net income of 610.40M less cash dividends of 161.68M plus other
adjustments of 5.59M.
December 31, 2010 vs. December 31, 2009
The Company’s balance sheet remained solid with total assets of 7.890B in 2010, slightly higher
than the previous year's level of 7.864B. Short term cash investments increased by 826.05M due to
net cash inflows from operating activities and re-investment of held to maturity investments.
Majority of the Company's funds were used for project development resulting to the increase in
completion rates of projects and the completion of two condominium projects, namely, Makati
Executive Tower III and Mandaluyong Executive Mansion III. The stable cash flow has also
enabled the Company to purchase a prime lot, pay cash dividends and reduce accounts payable
and accrued expenses by 62.81M as well as notes and loans payable of 266.26M. As a result of the
foregoing, the group strengthened its liquidity position with current and acid test ratio of 1.77:1
and 1.07:1 as compared to 2009 of 1.57:1 and 0.87:1, respectively. Asset and debt ratio likewise
improved to 2.64:1 and 0.46:1 from the previous year of 2.33:1 and 0.56:1, respectively.
Total stockholders' equity stood at 4.902B, higher by 9.28% as compared with 2009 of 4.486B.
The increase was due to net income of 582.35M less cash dividends of 161.20M less other
adjustments of 4.97M.
December 31, 2009 vs. December 31, 2008
Total assets amounted to 7.864B in 2009 slightly higher than last year’s level of 7.838B. Sales
of real estate properties resulted to the decline in real estate properties for lease and for future
development. The Company’s funds were utilized for the development of the projects and a
substantial portion was used to pay its loans amounting to 532.38M. Although cash and cash
equivalents decreased by 307.43M, this was offset by the increase in short-term cash investments
411.40M. Total stockholders’ equity stands at 4.486B, higher than in 2008 of 4.081B. The 9.92%
increase was due to net income of 579.82M, less cash dividends of 184.08M plus other
adjustments of 9.26M. As a result of the foregoing, the group strengthened its liquidity position
with current and acid test ratio of 1.51:1 and 0.87:1 as compared with 2008 of 1.23:1 and 0.69:1,
respectively. Asset ratio and debt equity ratio likewise improved to 2.33:1 and 0.56:1 from the
previous year of 2.09:1 and 0.76:1, respectively.
40
Results of Operation
September 30, 2012 vs. September 30, 2011
Total revenues reached 1.377B as compared with last year’s figure of 1.473B. The decrease can be
attributed to lower sales of the subsidiary, CLDI because of the decrease of inventory of the
condominium project, Grand Emerald Tower as of December 2011. This project was already sold
at 86.50% last year. On the cost side, lower sales decreased cost of sales and operating expenses
and income tax. Financial expenses decrease due to lower interest rates. Altogether, the financial
performance as of September 30, 2012 resulted to a net income of 383.56M compared to the
previous year of 404.91M. This translated to earnings per share and return on equity (both
annualized) of 0.11 and 7.56% as compared to the previous year of 0.12 and 9.07%, respectively.
December 31, 2011 vs. December 31, 2010
The Company’s sales of real estate properties increased by 8.26% to 1.574B from the previous
year of 1.454B. The sales growth can be attributed to sales and the construction accomplishment
of several projects. The Company’s on going project, Makati Executive Tower IV reached 75.06%
completion, while the subsidiary’s projects, Grand Emerald Tower and Manila Residences
Bocobo reached a completion rate of 100% and 96.36%, respectively. Meantime, the Company’s
other completed projects like the Makati Executive Tower III and Mandaluyong Executive
Mansion continued to contribute modestly to total revenues and provided stable cash flows.
Grand Central Residences, the newest addition, is still in the initial stages of construction. Other
sources of revenues are financial income and rent income. Financial income which is
substantially composed of interest income from sale of real estate properties accounted for 22.82%
of total revenues.
On the cost side, the Company remained prudent in managing costs and other disbursements
during the year. Cost of sales and operating expenses increased since these move in tandem with
sales. Cost of sales was recorded at 971.07M in 2011 as compared with 965.27B in 2010.
Operating expenses also increased by 19.85% due to higher personnel and professional fees.
However, payment of loans and notes payable eased interest payments resulting to the decline in
financial expenses by 20.26%, while lower taxable income decreased income tax by 17.86%.
Altogether, financial performance for the year 2011 resulted to a net income of 610.40M, as
compared to the previous year of 582.35M, while net income attributable to equity holders of the
parent amounted to 449.91M, slightly higher as compared to the previous year of 447.87M. This
translated to an earnings per share and return on equity of 0.15 and 9.76% in 2011 as compared
with 0.15 and 10.47% in 2010.
December 31, 2010 vs. December 31, 2009
The Company ended 2010 with a consolidated net income of 582.35M, slightly higher as
compared to the previous year’s 579.82M. Makati Executive Tower III and Mandaluyong
Executive Mansion III continued to contribute modestly to total revenues as they both reached a
100 % completion in 2010. However, two of the Company's new projects are still in the initial
stages of construction. These are Grand Central Residences I and Makati Executive Tower IV,
launched in 2010 and 2009, respectively. It should be noted that realized gross profit on sales are
determined by sales and the timing of development and completion of the projects. Although
revenues declined, this will eventually improve as the construction of the projects advances.
Meantime, sales of the subsidiary company, City and Land Developers, Inc. continued to
contribute significantly to the Company's revenues. Grand Emerald Tower and Manila
Residences Bocobo continued to contribute a significant 37.82% and 14.65%, respectively. The
41
decrease in revenues was offset by lower cost of sales, operating expenses and provision for
income tax. In addition, partial maturity of loans and notes payable led to the decline in financial
expenses by 26.43%. Other revenue contributors are financial and rent income. Financial income
which is substantially derived from interest from sales of real estate properties amounted to
544.52M accounting for 26.66% of total revenues, higher by 4.13% from the previous year.
As a result of the foregoing, the Company still posted a respectable net income translating to
earnings per share and return on equity of 0.18 and 10.47% as compared to the previous year of
0.21 and 12.92%.
December 31, 2009 vs. December 31, 2008
Revenue on sales reached 1.881B, higher by 2.29% from last year’s figure of 1.838B despite the
economic and business uncertainties during the year. Revenue growth was driven by sales and
and high completion rates of vertical projects.
Revenue on sales were substantially generated from seven (7) high-rise projects namely, Makati
Executive III and IV, and Rada Regency located in Makati City; Manila Executive Regency and
Manila Residences Bocobo (a project of CLDI) located in Manila City; Grand Emerald Tower (a
project of CLDI) located in Ortigas Center, Pasig City ; and Mandaluyong Executive Mansion III
located in Mandaluyong City.
In addition, financial income which is substantially composed of interest on sales of real estate
properties reached 522.91M in 2009 as compared with 527.30M in 2008, accounting for 21.44%
and 21.79% , respectively of total revenues.
On the cost side, cost of sales was recorded at 1.235B in 2009 as compared with 1.228B in 2008.
Operating expenses on the other hand, increased due to higher sales. The Company’s payment of
loans payable eased interest expense payments resulting to the decline of financial expenses by
13.56%. Lower tax rate and taxable income decreased income tax by 11.57%.
Altogether, financial performance for the year 2009 resulted to a net income of 579.82M, higher
than the previous year of 572.10M, while net income attributable to equity holders of the parent
amounted to 513.10M, almost reaching the same level in 2008 of 520.33M. This translated to an
earnings per share and return on equity of 0.25 and 12.86% in 2009 as compared with 0.25 and
14.33% in 2008.
Key Performance Indicators
Cityland Development Corporation (Consolidated)
Earnings per share
Return on equity
Interest rate coverage ratio
Asset to liability ratio
Asset to equity ratio
Debt to equity ratio
Current ratio
Acid – test ratio
City & Land Developers, Inc. (Subsidiary)
Earnings per share
Return on equity
Interest rate coverage ratio
Asset to liability ratio
Asset to equity ratio
Debt to equity ratio
September 30,
2012
2011
2010
2009
0.11
7.56%
15.14
3.13
1.72
0.37
2.26
1.53
0.15
9.59%
14.14
2.99
1.75
0.34
2.01
1.21
0.15
10.47%
11.78
2.64
1.84
0.46
1.77
1.07
0.17
12.92%
9.04
2.33
1.99
0.56
1.57
0.87
0.36
18.85%
30.79
2.91
1.53
0.29
0.47
21.95%
36.95
2.86
1.54
0.22
0.39
22.02%
493.80
2.71
1.59
0.29
0.19
13.38%
864.52
2.79
1.56
0.30
42
Current ratio
Acid – test ratio
Cityplans, Incorporated (Subsidiary)
Earnings per share
Return on equity
Interest rate coverage ratio
Asset to liability ratio
Asset to equity ratio
Debt to equity ratio
Current ratio
Acid – test ratio
2.04
1.73
2.00
1.26
2.10
1.20
2.23
0.88
0.07
3.03%
-6.59
1.24
-14.11
12.94
0.07
3.01%
-5.91
1.23
-22.93
21.09
0.09
4.14%
-5.39
1.25
-22.41
21.15
0.18
7.20%
-4.88
1.27
-17.01
15.95
Manner of Calculations
Earnings Per Share
Return on Equity
= Net Income attributable to equity holders / Ave. # of Shares Issued & Outstanding
=
Net Income attributable to equity holders
Total Stockholder’s Equity (net of minority interest)
Interest Rate Coverage Ratio = Net Income before Tax + Depreciation + Interest Expense / Interest Expense
Asset to Liability Ratio
= Total Assets / Total Liabilities
Asset to Equity Ratio
= Total Assets / Total Stockholders’ Equity (net of Net Changes in Fair Value of Investments)
Debt – Equity Ratio
=
Loans & Notes Payable
____________
Total Stockholder’s Equity (net of Net Changes in Fair Value of Investments)
Current Ratio
= Total Current Assets/ Total Current Liabilities
Acid Test Ratio
= Cash and Cash Equivalents + Short-term Investments + Available for Sale Investments +
Financial Asset at Fair Value + Installment Contracts Receivable + Other Receivables
Total Current Liabilities
1. Items affecting assets, liabilities, equity, net income, or cash flows that are unusual because of
their nature, size or incidents
There are no unusual items affecting assets, liabilities, equity, net income or cash flows.
2. Any changes in estimates of amounts reported in prior interim periods of the current financial
year or changes in estimates of amounts reported in prior financial years that have a material
effect in the current interim period
There are no changes in estimates of amounts reported in prior interim periods of the current
financial year or changes in estimates of amounts reported in prior financial years that have a
material effect in the current interim period.
3. Any issuances, repurchases, and repayments of debt and equity securities
The Parent Company and its subsidiary issued SEC-Registered Short-Term Commercial
Papers during the period with outstanding balance of 849.25 million and 134.45 million,
respectively as of June 30, 2012.
4. Any material events subsequent to the end of the interim period that have not been reflected in
the financial statements for the interim period
There are no material events subsequent to the end of the interim period that have not been
reflected in the financial statements for the interim period.
5. Effect of changes in the composition of the issuer during the interim period, including
business combinations, acquisition or disposal of subsidiaries and long-term investments,
restructuring, and discontinuing operations.
There are no changes in the composition of the issuer during the interim period, including
business combinations, acquisition or disposal of subsidiaries and long-term investments,
restructuring, and discontinuing operations.
43
6. Any changes in contingent liabilities or contingent assets since the last annual balance sheet
date
There are no changes in the contingent liabilities or contingent assets since the last annual
balance sheet date.
7. Any Known Trends, Events or Uncertainties (Material impact on liquidity)
There is no known trends, events or uncertainties that has a material effect on liquidity.
8. Internal and External Sources of Liquidity
Internal sources come from sales of condominium and real estate projects, collection of
installment receivables and maturing short-term investments. External sources come from
bank loans.
9. Any Material Commitments for Capital Expenditures and Expected Sources of Funds of such
Expenditures
The total estimated development costs of P2,200M representing the cost to complete Makati
Executive Tower IV, Grand Central Residences Tower I as of June 30, 2012 and Pines Peak
Tower I (launched July 2012) will be sourced through:
a.
b.
c.
d.
Sales of condominium and real estate projects
Collection of installment receivables
Maturing short-term investments
Proceeds from the sale of commercial papers
10. Any Known Trend or Events or Uncertainties (Material Impact on Net Sales or Revenues or
Income from Continuing Operations)
There is no known trend, event or uncertainties that has a material effect on the net sales,
revenues or income from continuing operations.
11. Any Significant Elements of Income or Loss that did not arise from Registrant’s Continuing
Operations
There are no significant elements of income or loss that did not arise from registrant’s
continuing operations.
12. Any Known Trends or Events or Uncertainties (Direct or Contingent Financial Obligation)
There are no events that will trigger direct or contingent financial obligation, including any
default or acceleration of an obligation that is material to the Company.
13. Any Known Trends or Events or Uncertainties (Material off-balance sheet transactions,
arrangements, obligations and other relationships)
There are no material off-balance sheet transactions, arrangements, obligations (including
contingent obligations), and other relationships of the Company with unconsolidated entities
created during the reporting period.
44
Causes for any Material Changes from Period to Period in One or More Line of the Registrant's
Financial Statements
Material Changes (+/-5% or more) in the Financial Statements
Interim Periods:
September 30, 2012 vs. December 31, 2011
a.
Increase in Cash and Cash Equivalent was due to collections from sales of real
estate properties, proceeds from notes payable and maturity of short term
investments.
Percentage (+/-%)
(Increase/Decrease)
50.88%
b.
Decrease in Short Term Cash Investments was due to maturity of placements.
-30.22%
c.
Decrease in Investment in Trust Funds was due to maturity and termination of
pension plans.
-13.17%
d.
Decrease in Installment Contracts Receivable was due to collections.
e.
Decrease in Other Receivables was due to collection.
f.
Decrease in Real Estate Properties for Sale-net was due to sales of real estate
properties.
-9.13
Increase in Real Estate Properties Held for Future Development was due to
purchase of a property.
11.00%
Decrease in Investment Properties was due to reclass of lot cost to real estate
properties for sale.
-14.17%
i.
Decrease in Property and Equipment was due to depreciation.
-16.29%
j.
Decrease in Accounts Payable and Accrued Expenses was due to payment of
development cost, trade payables, director’s fee and deposits.
-35.46%
Increase in Loans and Notes Payable was due to contracts payable from the
purchase of a lot and increase in notes payable
14.47%
g.
h.
a.
-8.75%
-45.30%
k.
Decrease in Income Tax Payable was due to payment.
l.
Decrease in Pre-need and Other Reserves was due to maturity and termination of
plans.
-12.49%
m. Decrease in Deferred Tax Liabilities was due to lower financial income as
compared to taxable income.
-6.78%
-36.00%
n.
Increase in Capital Stock was due to 10% stock dividends.
o.
Decrease in Net Changes in Fair Value of AFS Financial Asset was due to
decrease in market value of stocks.
-116.49%
Decrease in Retained Earnings was due to declaration of stock and cash dividends.
-6.07%
p.
9.99%
September 30, 2012 vs. September 30, 2011
q.
Decrease in Sales of Real Estate was primarily due to lower sales of Grand
Emerald Tower due to lower inventory of units available for sale.
-6.40%
Decrease in Financial Income was due to decrease in interest income from sale of
real estate properties and money market.
-8.41%
s.
Increase in Rent Income was due to increase in units available for lease.
21.82%
t.
Decrease in Cost of Sales was due to sales.
-6.74%
u.
Decrease in Operating Expenses was due to sales and lower professional fees,
donations, and membership and subscription dues.
-9.96%
r.
45
v.
Decrease in Financial Expense was due to higher capitalized interest and lower
interest rates.
w. Decrease in Provision for Income Tax-Current was due to lower net income.
x.
Decrease in Net Income was due to lower sales.
-18.08%
-15.93%
-5.27%
Full Fiscal Years:
December 31, 2011 vs. December 31, 2010
a.
Percentage (+/-%)
(Increase/Decrease)
Increase in Cash and Cash Equivalents was due to reclassification of investments
to shorter period.
142.61%
b.
Decrease in Short-term Cash Investments was due to maturity of investments.
-58.97%
c.
Decrease in Investments in Trust Funds was due to maturity and termination of
plans.
-6.40%
d.
Increase in Other Receivables was due to increase in advances to customers.
29.68%
e.
Increase in Real Estate Properties held for Future Development was due to the
purchase of a lot.
12.28%
f.
Decrease in Property and Equipment was primarily due to depreciation.
-20.04%
g.
Decrease in Other Assets was due to decrease in electric meter deposits.
-27.36%
h.
Increase in Accounts Payable and Accrued Expenses was due to developments
costs, trade payables and accrued director’s fee.
27.93%
i.
Decrease in Notes and Loans Payable was due to payment.
-19.66%
j.
Decrease in Income Tax Payable was due to payment.
-42.43%
k.
Decrease in Deferred tax liabilities was due to lower accounting income as
compared with taxable income.
-12.65%
l.
Increase in Capital Stock was due to 20% stock dividends.
19.98%
m. Decrease in Retained Earnings was due to stock and cash dividends
-9.03%
n.
Increase in Non-controlling Interests was due to net income of subsidiaries.
19.44%
o.
Increase in Revenue on Sales of Real Estate was due to sales and high completion
rate of projects.
8.26%
Decrease in Financial Income was due to lower interest income from sales of real
estate properties.
-12.09%
p.
q.
Increase in Rent Income was due to increase in units available for lease.
48.69%
r.
Decrease in Other Income was due to decrease in miscellaneous income.
-24.68%
s.
Increase in Operating Expenses was due to higher personnel expenses,
professional fee, membership dues and rent expense.
24.01%
t.
Decrease in Financial Expenses was due to termination of loans and notes payable.
-20.26%
u.
Decrease in Provision for Income Tax was due to lower taxable income.
-20.70%
December 31, 2010 vs. December 31, 2009
a.
b.
c.
d.
e.
Decrease in Cash and Cash Equivalents was due to payment of notes and loans payable and reinvestment
in short term cash investments.
Increase in Short-term Cash Investments was due to sales and collection of installment contracts
receivable.
Decrease in Financial Assets at Fair Value through Profit and Loss was due to maturity and termination
of plans.
Decrease in Held to Maturity Investments was due to maturity of investments.
Decrease in Installment Contracts Receivables ( net of estimated development cost) was due to collection
of receivables and payment of development costs.
46
f.
g.
Increase in Real Estate for Sale was due to launching of a new project – Grand Central Residences I.
Decrease in Real Estate Properties held for future development was due to reclassification of lot cost to
Real Estate for Sale of the new project.
h. Decrease in Property and Equipment was primarily due to depreciation.
i. Increase in Other Assets was due to increase in electric meter deposits.
j. Decrease in Accounts Payable and Accrued Expenses was due to payment of trade payables, accrued
director’s fee, deposits and VAT payable.
k. Decrease in Notes and Loans Payable was due to payment.
l. Decrease in Pre-Need Reserves was due to maturity and termination of contracts.
m. Decrease in Deferred tax liabilities was due to lower accounting income as compared with taxable
income.
n. Increase in Capital Stock was due to 20% stock dividends.
o. Decrease in Net Changes in Fair Value of Investments was due to recognition of realized gain on sale of
stocks and impairment loss in the statements of income.
p. Increase in Minority Interests was due to net income of subsidiaries.
q. Decrease in Revenue on Sales of Real Estate was due to sales and low percentage of completion of the
new projects.
r. Increase in Other Income was due to increase in scrap and other miscellaneous income.
s. Decrease in Cost of Sales was due to lower revenue on sales of real estate properties.
t. Decrease in Operating Expenses was due to lower sales.
u. Decrease in Financial Expenses was due to payment of loans and notes payable.
v. Decrease in Provision for Income Tax was due to lower taxable income.
December 31, 2009 vs. December 31, 2008
a.
Decrease in Cash and Cash Equivalents was due to placements in short-term cash investments and
payment of loans and notes payable.
b. Increase in Short-term Cash Investments was due to placements.
c. Decrease in Financial Assets at Fair Value through Profit and Loss was due to decrease in market value.
d. Increase in Available-for-Sale Investments was due to increase in market value of stocks.
e. Increase in Real Estate for Sale was due to launching of two new projects – Manila Residences Bocobo
and Makati Executive Tower IV.
f. Decrease in Real Estate Properties for Lease was due to sale of property and reclassification of lot cost
of the newly launched project.
g. Decrease in Property and Equipment was due to depreciation.
h. Increase in Other Assets was due to net income from retirement plan assets.
i. Increase in Accounts Payable and Accrued Expenses was due to accrued development costs.
j. Decrease in Notes and Loans Payable was due to payment of contracts and loans payable.
k. Increase in Income Tax Payable was due to lower prepaid taxes.
l. Decrease in Pre-Need Reserves and other reserves was due to maturity and termination of contracts.
m. Increase in Capital Stock was due to 20% stock dividends.
n. Decrease in Revaluation Increment was due to sale of inventory with appraised values.
o. Increase in Net Changes in Fair Value of Investments was due to increase in value of stocks.
p. Increase in Minority Interests was due to net income of subsidiaries.
q. Decrease in Rent Income was due to expiration of lease contracts.
r. Decrease in Other Revenues was due to decrease in miscellaneous income and recovery of impairment
loss.
s. Increase in Operating Expenses was due to higher sales.
t. Decrease in Financial Expenses was due to lower loan balance.
u. Decrease in Provision for Income Tax was due to lower taxable income and tax rate.
Response to the Review of SEC-OGA on Cityland Development Corporation's Audited
Consolidated Financial Statements for the Year Ended December 31, 2011 and Unaudited
Interim Consolidated Financial Statements as of June 30, 2012
Part I.
1.
Disclosures on related party transactions, particularly the following;
a) Interest applied on advances, any guarantees given or received;
b) Conditions of the waiver of management fees of Cityland, Inc. (PAS 24);
47
Reply:
a) The interests applied on advances are accordingly disclosed under Item a. of Note 24, Related
Party Transactions.
b) As disclosed in Note 24, Related Party Transactions, the management fee which is based on a
certain percentage of income as mutually agreed upon by Cityland, Inc. and Cityland
Development Corporation was waived by Cityland, Inc. There are no conditions attached to the
waiver of these management fees.
2.
Disclosures on leases, i.e., total of future minimum lease payments under non-cancellable operating
leases;
Reply:
As disclosed in Note 10 of the Audited Consolidated Financial Statements, the investment properties are
generally rented out for one-year term renewable every year. Operating leases entered into during the
year are cancellable except for a new lease agreement effective November 15, 2011 with a lease term of
ten (10) years which is considered as non-cancellable. The rent income derived from the said lease in
2011 amounted to P1.02 million which is immaterial to the total rent income amounting to P23.08
million.
We will disclose the minimum lease payments for this non-cancellable lease in 2012 consolidated
financial statements.
3.
Carrying Values of Collaterals as presented in Note 14 and Note 8 of the Financial Statements (PFRS 7).
Reply:
The amount presented under Note 8, Real Estate Properties for Sale, pertains to the carrying value of real
estate properties for sale which serve as collaterals of loans availed from financial institutions in 2010
while the amounts in Note 14, Notes and Loans Payable present the carrying values of the properties
(investment properties and real estate properties for sale) used as collaterals for the Group's loans and
credit lines in 2011 and 2010.
To present clearly, below is the breakdown of the carrying values of collaterals to the loans and credit
lines with financial institutions of the Group:
Description
Carrying Values of
Collaterals (in millions)
2011
Real Estate Properties for Sale
2010
--
Investment Properties
418.39
Total
418.39
395.40
(a)
418.40
(b)
813.80
(b)
(a) Amount in Note 8,Real Estate Properties for Sale;
(b) Amounts in Note 14, Notes and Loans Payable.
Part II.
1.
Disclosures on minimum lease payments; and
Below is the required disclosure on the non-cancellable lease:
In November 2011, the Company entered into a non-cancellable operating lease with third
party that permit the lessee to use the property as a fast food outlet. Other lease agreements
with third parties are generally for a one-year term renewable every year.
48
The future minimum lease payments for this lease agreement as of December 31, 2011 are as
follows:
Within one year
P
3,757,050
After one year but not more than five years
23,844,962
Later than five years
24,564,923
P
52,166,935
Rest assured that we will be including this required information in the future annual financial statements.
2.
Carrying Values of Collaterals
The differences are accounted and explained as follows:
a) P395.40 million
The real estate properties for sale with a carrying value of P395.40 million serve as collaterals
for loans availed from financial institutions as of December 31, 2010 only. As of December 31,
2011, the Group has no unpaid loans availed from credit lines.
As of December 31, 2011, the project- financing credit line agreement with a financial
institution which was supported by the P395.40 million carrying value of real estate properties
for sale was ended as the project to be financed as stated in the agreement was already
completed.
With this we are correcting the third paragraph of Note 8, Real Estate Properties for Sale, page
26 of the Notes to the Financial Statement to exclude th year 2011 as follows:
As of December 31, 2010, some real estate properties for sale of the Group with a
carrying value of P395.40 million serve as collaterals of loans availed from
financial institution by the Parent Company and CLDI's specific credit lines in 2010
(See Note 14).
b) P418.39 million
We refer to Note 14, Notes and Loans Payable, page 32 of the Notes to the AFS for the correct
amount of the carrying values of collaterals for the years 2011 and 2010 which are as follows:
Carrying Values of Collaterals
Description
2011
2010
418.39
813.80
418.39
813.80
Group's Real Estate Properties for Sale
and lease (investment properties)
Total
Although, no disclosure was made on the amount of investment properties which serve as
collaterals in Note 10, Investment Properties, this was accordingly disclosed in Note 14, Loans
and Notes Payable.
The total P418.39 million collateral carrying value for the existing credit lines in 2011 were all
comprised of real estate properties for lease (investment properties).
Rest assured that we will be including this information on investment properties in the future
annual financial statements.
49
c) P163.36 million
The P163.36 million difference pertains to the investment properties which serve as collaterals
for the existing credit lines with financial institutions granted only to Cityland, Inc. (CI), the
Company's parent company as accordingly disclosed in Note 10, Investment Properties as
follows:
“Some real estate properties for lease with carrying values of P581.76 million were
used as collateral for loans availed by the Group and CI from the omnibus credit line
in 2010.”
For the reference AFS, Cityland Development Corporation and Subsidiaries Consolidated
Financial Statements, only the P418.40 million carrying value of collaterals (investment
properties) pertains to the Company and its subsidiaries. The P518.76 million pertains to the
total of the carrying value of collaterals in 2010 of: 1) CDC and its subsidiaries, P418.40
million; and 2) CI, the parent company of CDC, 163.36 million.
Information On Independent Accountant
External Audit Fees
2011
800,000
--800,000
Audit and Audit-Related Fees
Tax Fees
All Other Fees
Total
2010
765,000
--765,000
SyCip, Gorres, Velayo & Co. is the Registrant's external auditor for the calendar year 2011 &
2012.
The Audit Committee’s approval policies and procedures consist of:
a) Discussion with the external auditors of the Audited Financial Statements.
b) Recommendation to the Board of Directors for the approval and release of the Audited
Financial Statements.
Changes in and Disagreements With Accountants on Accounting and Financial
Disclosure
There is no change in and disagreements with accountants on accounting and financial
disclosure.
Directors and Executive Officers
i. Identify Directors and Executive Officers:
Name
Washington SyCip
Stephen C. Roxas
Citizenship
Position
Period
of
Service
American Chairman of the Board/ 06/13/01 to Present/
Independent Director 1997 to Present
Filipino Chairman of the
07/01/97 to Present
Executive Committee/
Director
Term Age
of
Office
(Year)
Family
Relationship
1
91
---
1
71 Husband of Helen
Roxas; brother of
Grace Liuson and
Alice Gohoc; brotherin-law of Andrew I.
Liuson; and uncle of
Josef C. Gohoc
50
Name
Citizenship
Position
Period
of
Service
Term Age
of
Office
(Year)
Family
Relationship
Andrew I. Liuson
Filipino Vice Chairman of the
Board/ Director
01/16/08 to Present
1
Grace C. Liuson
Filipino Deputy Vice-Chairman of 02/01/11 to Present
1
Josef C. Gohoc
Filipino
President/ Director
1
Atty. Sabino R. Padilla
Peter S. Dee
Alice C. Gohoc
Filipino
Filipino
Filipino
Director
2006 to Present
Independent Director 1982 to Present
Director
1996 to Present
1
1
1
Helen C. Roxas
Filipino
Director
1979 to Present
1
Rufina C.Buensuceso
Filipino
Executive Vice
President
02/01/11 to Present
1
68 Husband of Grace
Liuson; brother-in-law
of Stephen C. Roxas
and Alice C. Gohoc
66 Wife of Andrew
Liuson; sister of
Stephen Roxas and
Alice Gohoc; aunt of
Josef C. Gohoc; and
sister-in-law of Helen
C. Roxas
42 Son of Alice Gohoc;
and nephew of Stephen
Roxas, Helen C.
Roxas, Grace Liuson
and Andrew I. Liuson
76
--70
--70 Sister of Stephen
Roxas and Grace
Liuson; mother of
Josef C. Gohoc; and
sister-in-law of
Andrew Liuson and
Helen C. Roxas
63 Wife of Stephen
Roxas; sister-in-law of
Grace C. Liuson,
Andrew I. Liuson and
Alice C. Gohoc
63
---
Emma A. Choa
Filipino
Senior Vice President/
Treasurer
02/01/11 to Present
1
51
---
Eden F. Go
Rudy Go
Melita M. Revuelta
Romeo E. Ng
Josie T. Uy
Melita L. Tan
Emma G. Jularbal
Filipino
Filipino
Filipino
Filipino
Filipino
Filipino
Filipino
Vice President
01/16/08 to Present
Vice President
08/16/07 to Present
Vice President
01/16/08 to Present
Vice President
01/10/05 to Present
Vice President – Mla 02/16/04 to Present
Vice President
02/21/04 to Present
Vice President – Legal 07/01/01 to Present/
Affairs/ Corporate
1997 to Present
Secretary
1
1
1
1
1
1
1
59
52
53
51
57
52
56
---------------
the Board/ Director
02/01/11 to Present
2. Positions in Other Private Institutions:
1. Washington SyCip
Present positions in other private institutions:
Name of Office
Asian Eye Institute
Asian Institute of Management
Asian Terminals Inc.
Banco De Oro
Belle Corporation
Position
Independent Director
Chairman Emeritus
Adviser to the Board
Adviser to the Board
Independent Director
Date Assumed
September 2000
October 2010
October 2009
July 1996
51
Century Properties Group, Inc.
Commonwealth Foods, Inc.
First Philippine Holdings Corp.
Gokongwei Brothers Foundation
Highlands Prime, Inc.
I-Academy
Investment and Capital Corp. of the Phils.
JG Summit Holdings
Jollibee Food Corporation
Lopez Holdings Corp. (formerly Benpres Holdings Corp.)
Lufthansa Technik Philippines, Inc.
MacroAsia Corporation
Metrobank Bank & Trust Co.
Metrobank Foundation, Inc.
Metro Pacific Investment Corp.
Phil. Equity Management Inc.
Philippine Airlines, Inc.
Philippine Hotelier, Inc.
Philippine Long Distance Telephone Co.
Philippine National Bank
Philamlife, Inc.
Realty Investment, Inc.
The PHINMA Group
PinoyMe Foundation
Realty Investment, Inc.
Stateland, Inc.
Independent Director
Independent Director
Independent Director
Trustee
Independent Director
Board of Governors
Senior Adviser to the Board
Adviser to the Board
Adviser to the Board
Independent Director
Chairman
Chairman
Adviser to the Board
Trustee
Independent Director
Independent Director
Director
Independent Director
Adviser to the Board
Director
Independent Director
Independent Director
Independent Director
Trustee
Independent Director
Independent Director
July 2011
June 2000
November 1997
January 2002
January 2002
July 1987
August 2001
July 2011
April 1997
July 2000
November 1996
April 1996
May 2012
October 1998
February 1997
September 1997
January 2011
December 1999
April 2001
April 1950
September 1996
April 1950
July 1996
Past positions in other private institutions:
Name of Office
Aboitiz Transport Systems, Inc.
Century Properties, Inc.
Global Business Holdings, Inc.
Manila Electric Co. (MERALCO)
Position
Independent Director
Independent Director
Independent Director
Director
Duration
Aug. 1996 to Dec. 2010
Feb. 2010 to July 2011
June 2003 to Sept. 2007
Aug. 1996 to May 2008
2. Stephen C. Roxas
Present positions in other private institutions:
Name of Office
Position
Cityland, Inc.
Director/ Chairman of the Board
City & Land Developers, Inc
Director/ Chairman of the Executive
Committee
Cityplans, Inc.
Director/ President
Cityland Asset-Backed Securities (SPC), Inc. Director/ Chairman
MGC New Life Christian Academy
Chairman
Center for Community Transformation
Vice- Chairman
Date Assumed
July 1997
July 1997
October 1988
December 2005
3. Andrew I. Liuson
Present positions in other private institutions:
Name of Office
Cityland, Inc.
City & Land Developers, Inc.
Cityplans, Inc.
Cityland Asset-Backed Securities (SPC), Inc.
Febias College of Bible
International Graduate School of Leadership
Grace Christian College
Philippine Council of Evangelical Churches
Position
Director/ Vice Chairman of the Board
Director/ Vice Chairman of the Board
Director/ Chairman of the Board
Director/ President
Chairman
Chairman
Chairman
Chairman
Date Assumed
January 2008
January 2008
September 2006
December 2005
52
Past positions in other private institutions:
Name of Office
Cityland, Inc.
City & Land Developers, Inc
Cityplans, Inc.
Position
President
President
Vice Chairman of the Board/
Exec. Vice President
Duration
1997 to January 2008
1997 to January 2008
1988 to Sept. 24, 2006
4. Grace C. Liuson
Present positions in other private institutions:
Name of Office
Cityland, Inc.
City & Land Developers, Inc.
Cityplans, Inc.
Cityland Asset-Backed Securities
(SPC), Inc.
Youth Gospel Center
Makati Gospel Church
Position
Director/ Deputy Vice Chairman
of the Board
Director/ Deputy Vice Chairman
of the Board
Director/ Exec. Vice President/
Treasurer
Director/ Exec. Vice President/
Treasurer
Treasurer/ Trustee
Treasurer
Date Assumed
February 1, 2011
February 1, 2011
September 2006
December 2005
Past position in other private institutions:
Name of Office
Cityland, Inc.
City & Land Developers, Inc.
Cityplans, Inc.
Position
President/
Exec. Vice President/ Treasurer
President/
Exec. Vice President/ Treasurer
Senior Vice President
Duration
Feb. 14, 2008 to Jan. 31, 2011
1997 to Feb. 13, 2008
Feb. 14, 2008 to Jan. 31, 2011
1997 to Feb. 13, 2008
1988 to Sept. 24, 2006
5. Josef C. Gohoc
Present position in other private institutions:
Name of Office
Cityland, Inc.
City & Land Developers, Inc.
Cityland Asset-Backed Securities (SPC), Inc.
Cityland Foundation Inc.
Asian Business Solutions, Inc.
Philippine Trading & Investment
Corporation
Atlas Agricultural & Mercantile
Development Corp.
Position
Director/ President
Director/ President
Director
Director
Director
Director
Date Assumed
Feb. 2011
Feb. 2011
December 2005
2002
1996
1997
Director
1997
Past position in other private institutions:
Name of Office
Cityland, Inc.
City & Land Developers, Inc.
Position
Senior Vice President/
Treasurer
First Vice President
Senior Vice President/
Treasurer
First Vice President
Duration
Jan. 16, 2008 to Jan. 31, 2011/
June 11, 2008 to Jan. 31, 2011
Sept. 2006 to Jan. 15, 2008
Jan. 16, 2008 to Jan. 31, 2011/
June 11, 2008 to Jan. 31, 2011
Sept. 2006 to Jan. 15, 2008
6. Atty. Sabino R. Padilla Jr.
Present position in other private institutions:
Name of Office
Padilla Law Office
Date Assumed
Partner
Date Assumed
Past 5 years up to Present
53
Apostolic Nunciature to the Phils.
Legal Counsel
-do-
Catholic Bishops’ Conference of the Phils.
(CBCP) and various archdioceses, dioceses
and prelatures
Association of Major Religious Superiors
of the Philippines
Philippine Association of Religious
Treasurers
Grace Christian College
Various Catholic religious congregations,
orders and societies for men and women
(Dominicans, Augustinians, Franciscans,
Columbans, Religious of the Virgin Mary,
Daughters of Charity, Sisters of St. Paul of
Chartres, Carmelite Sisters, Holy Spirit
Sisters, etc.)
Bank of the Philippine Islands and its
subsidiaries
Ayala Land, Inc.
City & Land Developers, Inc.
State Investment Trust, Inc
Stateland Investment, Inc.
Mother Seton Hospital
Our Lady of Lourdes Hospital
St. Paul Hospital Cavite
Various Catholic universities, colleges,
schools and foundations
Legal Counsel
-do-
Legal Counsel
Legal Counsel
Legal Counsel
Legal Counsel
-do-do-
Legal Counsel
-do-
Legal Counsel
Director/ Chairman of the Board
Legal Counsel
-do-do-do-do-do-do-do-
Chairman of the Board/ Legal Counsel
Legal Counsel
Legal Counsel
Legal Counsel/ Trustee
Trustee
Past positions in other private institutions:
Name of Office
Bank of the Philippine Islands
BPI – Family Bank
Position
Director
Director
Duration
1982 to 1994
1982 to 1994
7. Peter S. Dee
Present positions in other private institutions:
Name of Office
Asean Finance Corporation Ltd.
Alpolac, Inc.
Bankers Association of the Philippines
China Banking Corp.
CBC Forex Corp.
CBC Insurance Brokers, Inc.
CBC Properties & Computer Center, Inc.
Cityplans, Incorporated
Cityland, Inc.
City and Land Developers, Inc.
GDSK Development Corp.
Hydee Management & Resources
Corporation
Kemwerke, Inc.
Makati Curbs Holding Corp.
Silver Falcon Insurance Agency
Position
Director
Director
Director
Director / President & CEO
Director / Chairman of the Board
Chairman of the Board
Director / President
Independent Director / MemberNominations Committee
Independent Director
Independent Director
Director
Director
Director
Director
Director
Date Assumed
Past 5 years up to Present
- do - do - do - do - do - do - do - do - do - do - do - do - do -
Past positions in other private institutions:
Name of Office
Can Lacquer, Inc. *
Position
Director
Duration
54
CBC Finance, Inc.
CBC Venture Capital
First CBC Capital (Asia) Ltd.
GPL Holdings, Inc. *
KK Converters Co. Ltd.
MSD Company Inc. *
Sinclair (Phils.) Inc. *
Sol Mar Y Tierra Resources *
Director
Director
Director
Director
Director
Director
Director
Director
1986 to 2001
1986 to 2001
1986 to 2001
* ceased operations
8. Alice C. Gohoc
Present positions in other private institutions:
Name of Office
Cityland, Inc.
City & Land Developers, Inc.
Philippine Trading & Investment Corp.
Atlas Agricultural & Mercantile
Development Corp.
Makati Hope Christian School
Asian Business Solutions, Inc.
Director
Director
Director
Director
Position
Date Assumed
September 2001
1996
1997
1997
Director
Director
1996
Past positions in other private institutions:
Name of Office
Cityland, Inc.
City & Land Developers, Inc.
Position
Vice President
Vice President
Duration
June 11, 2008 to Jan. 31, 2011
June 11, 2008 to Jan. 31, 2011
9. Helen C. Roxas
Present positions in other private institutions:
Name of Office
Position
Cityland, Inc.
Director
City & Land Developers, Inc.
Director
Cityplans, Inc.
Director
Cityland Asset-Backed Securities (SPC), Director
Inc.
Good Tidings Foundation Inc.
Treasurer
MGC New Life Christian Academy
Board of Trustee
Date Assumed
January 1997
1979
October 1988
December 2005
1992
1992
10. Rufina C. Buensuceso
Present positions in other private institutions:
Name of Office
Cityland, Inc.
City & Land Developers, Inc.
Cityplans, Inc.
Position
Executive Vice President
Executive Vice President
Comptroller
Date Assumed
February 2011
February 2011
September 1990
Past positions in other private institutions:
Name of Office
Cityland, Inc.
City & Land Developers, Inc
Position
Senior Vice President
Senior Vice President
Duration
June 1997 to January 2011
June 1997 to January 2011
11. Emma A. Choa
Present positions in other private institutions:
Name of Office
Cityland, Inc.
City & Land Developers, Inc.
Position
Senior Vice President/ Treasurer
Senior Vice President/ Treasurer
Date Assumed
February 2011
February 2011
55
Past positions in other private institutions:
Name of Office
Cityland, Inc.
City & Land Developers, Inc
Position
Vice President/
Asst. to the Exec. Vice President
Vice President/
Asst. to the Exec. Vice President
Duration
Feb. 1, 2006 to Jan. 31, 2011
July 1, 1997 to Jan. 31, 2006
Feb. 1, 2006 to Jan. 31, 2011
July 1, 1997 to Jan. 31, 2006
12. Eden F. Go
Present positions in other private institutions:
Name of Office
Cityland, Inc.
City & Land Developers, Inc.
Position
Vice President
Vice President
Date Assumed
January 2008
January 2008
13. Rudy Go
Present positions in other private institutions:
Name of Office
Cityland, Inc.
City & Land Developers, Inc.
Position
Vice President
Vice President
Date Assumed
August 2007
August 2007
Past positions in other private institutions:
Name of Office
Cityland, Inc.
City & Land Developers, Inc.
Position
Asst. to the President
Asst. to the President
Duration
Dec. 2004 to Aug. 15, 2007
Dec, 2004 to Aug. 15, 2007
14. Melita M. Revuelta
Present positions in other private institutions:
Name of Office
Cityland, Inc.
City & Land Developers, Inc.
Position
Vice President & Asst. Corporate
Secretary
Vice President
Date Assumed
January 2008
January 2008
Past positions in other private institutions:
Name of Office
Cityland, Inc.
City & Land Developers, Inc.
Position
Asst. to the President
Asst. to the President
Duration
July 1, 2001 to Jan. 15, 2008
July 1, 2001 to Jan. 15, 2008
15. Romeo E. Ng
Present positions in other private institutions:
Name of Office
Cityland, Inc.
City & Land Developers, Inc.
Position
Vice President
Vice President
Date Assumed
January 2005
January 2005
Past positions in other private institutions:
Name of Office
Cityland, Inc.
City & Land Developers, Inc.
Position
Assistant Vice President
Assistant Vice President
Duration
July 1, 2002 to Jan. 9, 2005
July 1, 2002 to Jan. 9, 2005
16. Josie T. Uy
Present positions in other private institutions:
Name of Office
Cityland, Inc.
Position
Vice President-Manila Branch
Date Assumed
February 2004
56
City & Land Developers, Inc.
Vice President-Manila Branch
February 2004
17. Melita L. Tan
Present positions in other private institutions:
Name of Office
Cityland, Inc.
City & Land Developers, Inc.
Position
Date Assumed
February 21, 2004
February 21, 2004
Position
Senior Manager
Duration
1994 to Feb. 20, 2004
Vice President
Vice President
Past positions in other private institutions:
Name of Office
Cityland, Inc.
18. Emma G. Jularbal
Present positions in other private institutions:
Name of Office
Position
Cityland, Inc.
Corporate Secretary
City and Land Developers, Inc.
Asst. Corporate Secretary
Cityland Asset-Backed Securities (SPC), Inc. Corporate Secretary
Date Assumed
July 1997
July 1997
December 2005
i. Identify Significant Employees
There is no identifiable significant employee because the Company expects each employee to
do his / her share in achieving the corporation’s set goal.
ii. Involvement in Certain Legal Proceedings of Any of the Directors and Executive Officers,
during the past five years:
During the past five years and up to the latest date, there is no involvement in certain legal
proceedings of any of the directors and executive officers such as:
a) Any bankruptcy petition filed by or against any business of which such person was a
general partner or executive officer either at the time of the bankruptcy or within two
years prior to that time;
b) Any conviction by final judgment, including the nature of the offense, in a criminal
proceeding, domestic or foreign, or being subject to a pending criminal proceeding,
domestic or foreign;
c) Being subject to any order, judgment, or decree, not subsequently reversed suspended or
vacated, of any court of competent jurisdiction, domestic or foreign, permanently or
temporarily enjoining, barring, suspending or otherwise limiting his involvement in any
type of business, securities, commodities or banking activities; and
d) Being found by a domestic or foreign court of competent jurisdiction (in a civil action),
the Commission or comparable foreign body, or a domestic or foreign Exchange or other
organized trading market or self regulatory organization, to have violated a securities or
commodities law or regulation and the judgment has not been reversed, suspended, or
vacated.
i. Independent Directors
The independent directors of the company are:
a. Washington SyCip
b. Peter Dee
57
Executive Compensation
Executive Compensation Summary Table
Name
Position
Josef C. Gohoc
President effective Feb. 1, 2011
Grace C. Liuson
President up to Jan. 31, 2011
Rufina C. Buensuceso
Executive Vice Pres.
Emma G. Jularbal
VP-Legal
Josie T. Uy
VP – Manila
Dorothy U. So
AVP-Internal Audit
Alvin Albert Anthony
Legal Counsel
Ocampo
Salaries
Bonus
Others
Total (Top 5)
Salaries
Bonus
Others
All officers & directors as a group unnamed
2010
2011
x
2012 (estimate)
x
x
x
x
x
x
x
x
x
x
x
x
x
x
3,608,052.00
4,289,980.00
5,793,787.93
13,691,819.93
13,547,697.00
10,135,834.00
17,571,621.63
41,255,152.63
3,878,556.00
4,836,496.00
2,679,116.26
11,394,168.26
15,200,109.00
9,835,639.00
16,468,730.59
41,504,478.59
4,262,057.00
1,067,298.00
711,770.26
6,041,125.26
15,732,378.00
4,178,309.00
16,288,310.59
36,198,997.59
X= represents the top five officers for the specific or given year
The Company has no standard arrangements with regards to the remuneration of its directors. In 2011
and 2010, the Board of Directors received a total of 16,549,677.85 and 19,815,786.56 respectively,
including a total per diem of 14,400.00 per annum for each director for the board meetings attended, as
part of the compensation under all officers and directors as a group unnamed. Moreover, the Company
has no standard arrangement with regards to the remuneration of its existing officers aside from the
compensation received nor any other arrangement with employment contracts, compensatory plan and
stock warrants or options.
Security Ownership of Certain Beneficial Owners and Management
a. Security Ownership of Record and Beneficial Owner owning more than 5% of the outstanding
capital stock of the Registrant as of September 30, 2012:
Title of Class Name, Address & Relationship
with Issuer
Unclassified
Cityland, Inc. *
common
2F Cityland Condo 10 T1
shares
156 H.V. Dela Costa St.,
Makati City
- Principal Stockholder
Beneficial Owner &
Relationship
Citizenship
Filipino
Unclassified
common
shares
PCD Nominee Corp.Filipino **
37F Tower 1, The Enterprise
Centre, 6766 Ayala Ave.,
cor. Paseo de Roxas, Makati
City
- Stockholder
-Various- **
Unclassified
common
shares
Stephen C. Roxas
1392 Campañilla St.,
Dasmariñas Village, Makati
- Director/ Chairman of
Executive Committee
Lincoln
Roxas
Immediate family
sharing the same
household
Jefcon, Inc
Obadiah Inc.
Corporation of w/c
record owner is a
controlling
shareholder
No. of Shares
Held
1,633,028,106
%
50.40%
Filipino
366,197,719 11.30%
Filipino
238,945,147
7.38%
58
Unclassified
common
shares
*
Grace C. Liuson
2072 Lumbang cor. Cypress
Dasmariñas Village, Makati
-Director/ Deputy ViceChairman of the Board
- NA -
Filipino
172,868,638
5.34%
The following directors direct the voting or disposition of the shares held by Cityland, Inc.:
(Beneficial Owners)
Name
Position
Stephen C. Roxas
Chairman of the Board
Andrew I. Liuson
Vice Chairman of the Board
Grace C. Liuson
Deputy Vice Chairman of the Board
Josef C. Gohoc
President
** PCD Nominee Corp.- Filipino is a wholly-owned subsidiary of the Philippine Central Depository.
It is the registered owner of the shares in the books of the Company's transfer agent and holds such
shares in behalf of the beneficial owners.
The Corporation knows no person holding more than 5% of the Company's shares registered under
the name of PCD Nominee Corp.- Filipino.
b. No change of control in the corporation has occurred since the beginning of its last fiscal
year.
c. Security Ownership of Management as of September 30, 2012.
Title of Class
Directors:
Unclassified
common shares
Unclassified
common shares
Unclassified
common shares
Unclassified
common shares
Unclassified
common shares
Unclassified
common shares
Unclassified
common shares
Unclassified
common shares
Unclassified
common shares
Executive Officers:
Unclassified
common shares
Unclassified
common shares
Unclassified
common shares
Unclassified
common shares
Unclassified
common shares
Unclassified
common shares
Name of Beneficial Owner /
Position
Washington SyCip
Director/ Chairman of the Board
Stephen C. Roxas
Director/ Chairman of the
Executive Committee
Andrew I. Liuson
Director/ Vice Chairman of the
Board
Grace C. Liuson
Director/ Deputy Vice Chairman
of the Board
Josef C. Gohoc
Director/ President
Sabino R. Padilla, Jr.
Director
Peter S. Dee
Independent Director
Alice C. Gohoc
Director
Helen C. Roxas
Director
Rufina C. Buensuceso
Executive Vice President
Emma A. Choa
Senior Vice President/ Treasurer
Eden F. Go
Vice President
Rudy Go
Vice President
Melita M. Revuelta
Vice President
Romeo E. Ng
Vice President
No. of Shares
Held
892
Nature of
Ownership
Direct
Citizenship
%
American
0.00003%
273,997,046
Direct / Indirect
Filipino
8.45707%
117,899,551
Direct / Indirect
Filipino
3.63904%
172,868,638
Direct
Filipino
5.33569%
Direct/ Indirect
Filipino
1.19669%
59,178
Direct
Filipino
0.00183%
414,268
Direct
Filipino
0.01279%
Direct / Indirect
Filipino
4.33989%
Direct
Filipino
1.52007%
4,363,260
Direct / Indirect
Filipino
0.13467%
2,188,092
Direct
Filipino
0.06754%
282,093
Direct
Filipino
0.00871%
1,476,612
Direct
Filipino
0.04558%
137,427
Direct
Filipino
0.00424%
2,013,350
Direct
Filipino
0.06214%
38,771,070
140,606,142
49,248,061
59
Title of Class
Unclassified
common shares
Unclassified
common shares
Note:
Name of Beneficial Owner /
Position
Josie T. Uy
Vice President – Manila Branch
Melita L. Tan
Vice President
No. of Shares
Held
3,605
495,571
Nature of
Ownership
Direct
Citizenship
%
Filipino
0.00011%
Filipino
0.01530%
Direct
The above security ownership of management consists of Unclassified Common Shares
amounting to Php 804,824,856 which is equivalent to 24.84%.
d. The Corporation knows no person holding more than 5% of common shares under a
voting trust or similar agreement.
Certain Relationships and Related Transactions
1) Transactions of Registrant with Any Director, Executive Officer of the Registrant and Any
Nominee for Election as a Director
There is no transaction (or series of similar transactions) with or involving the registrant or any of
each subsidiary with a director, executive officer, and a nominee for election as a director.
2) Transactions with Cityland Inc, a stockholder which owns more than 10% of the registrant’s
outstanding shares and other related parties:
a) Interest-bearing cash advances and non-interest-bearing advances for reimbursable
expenses from and to the registrant which the Company enters into with its affiliates in the
regular course of its business.
The Registrant's affiliates are its parent company, Cityland, Inc. (CI), and its subsidiaries,
City and Land Developers, Inc. ( CLDI) and Cityplans, Inc. (CPI).
Interest rates used by the parties for the interest- bearing cash advances were the
prevailing market interest rates for loans averaged by the parties.
b) Existing management contract with Cityland, Inc. (CI), its parent company.
Business Purpose / Nature of the transaction:
Cityland, Inc. provides management services for the business of the Registrant. The
agreement is for a period of five years renewable automatically for another five years
unless either party notifies the other six months prior to expiration. The management fee is
based on a certain percentage of net income as mutually agreed upon by both parties. The
management fees for 2011, 2010 and 2009 were waived by CI.
3) Parent of the Registrant
Cityland, Inc. owns 50.40% of the outstanding capital stock of the Registrant.
60
Corporate Governance
The evaluation system employed by the Corporation is through a periodic self-rating system based
on the criteria on the leading practices and principles on good governance.
1. Measures being Undertaken by the Company to fully comply with the Adopted Leading
Practices on Good Corporate Governance.
We are implementing the periodic self-rating system on an annual basis.
2. Any Deviation from the Company’s Manual of Corporate Governance (including a disclosure
of the name and position of the persons involved and sanctions imposed on said individual.)
There were no major deviations that require sanctions.
3. Any Plan to improve Corporate Governance of the Company.
Based on the outcome of the periodic self-rating, we will come up with necessary actions /
procedures to improve the corporate governance of the Company.
In compliance with SEC Memorandum Circular No. 6, Series of 2009, the Company has
started implementing the applicable rules of the Revised Code of Corporate Governance in its
aim to continually improve its corporate governance system.
61
OTHER EXPENSES OF ISSUANCE AND DISTRIBUTION
Actual Fees and Expenses:
Registration Fee:
Filing Fee
Legal Research Fee
Legal and Accounting Fee
Publication
Php
812,500
8,125
Php
820,625
30,000
29,000
Estimated Fees and Expenses:
Printing Costs of STCPs (estimate)
Documentary Stamps (estimate)
Total
30,000
5,000,000
Php 5,909,625
There is no insurance premium paid by the Registrant in connection with this offering.
62
CITYLAND DEVELOPMENT CORPORATION
INDEX TO FINANCIAL STATEMENTS AND SUPPLEMENTARY SCHEDULES
Audited for Year 2011, 2010 and 2009 and
Unaudited As of and For the Nine Months Ended September 30, 2012
Financial Statements
Page
Statement of Management’s Responsibility for Financial Statements
Report of Independent Public Accountant
Consolidated Balance Sheets as of December 31, 2011 and 2010
Consolidated Statements of Income for the Years Ended December 31, 2011, 2010 and 2009
Consolidated Statements of Comprehensive Income for the Years Ended December 31, 2011,
2010 and 2009
Consolidated Statements of Changes in Stockholders’ Equity for the Years Ended
December 31, 2011, 2010 and 2009
Consolidated Statements of Cash Flows for the Years Ended December 31, 2011, 2010 and 2009
Notes to Consolidated Financial Statements
Consolidated Balance Sheets as of September 30, 2012 and December 31, 2011
Consolidated Statements of Income for the Nine Months Ending September 30, 2012 and
September 30, 2011
Consolidated Statements of Comprehensive Income for the Nine Months Ending September 30,
2012 and September 30, 2011
Consolidated Statements of Changes in Stockholders’ Equity as of September 30, 2012 and 2011
Consolidated Statements of Cash Flows as of September 30, 2012 and 2011
Notes to Consolidated Financial Statements
Supplementary Schedules
A. Financial Assets
B. Amounts Receivable from Directors, Officers, Employees, Related Parties and Principal
Stockholders (Other than Related Parties)
C. Amounts Receivable from Related Parties which are Eliminated during the Consolidation
of Financial Statements
D. Intangible Assets – Other Assets
E. Long-Term Debt
F. Indebtedness to Related Parties
G. Guarantees of Securities of Other Issuers
H. Capital Stock
***
***
***
***
***
Others
Annex “A” Retained Earnings Available for Dividend Declaration
Annex “B” Map of the Relationships of the Companies within the Group
Annex “C” Supplementary Schedule of All Effective Standards and Interpretations
(Part 1, 4j)
Index to Exhibits
__________
***
These schedules, which are required by Part II of SRA Rule 68, as amended, have been
omitted because they are either not required, not applicable or the information required to be
presented is included in the Company’s financial statements or the notes to financial
statements.
COVER SHEET
7 7 8 2 3
SEC Registration Number
C I T Y L A N D
A N D
D E V E L O P M E N T
C O R P O R A T I O N
S U B S I D I A R I E S
(Company’s Full Name)
2 n d
F l o o r ,
1 0 ,
T o w e r
S t r e e t ,
C i t y l a n d
I ,
1 5 6
A y a l a
C o n d o m i n i u m
H . V .
N o r t h ,
d e
l a
M a k a t i
C o s t a
C i t y
(Business Address: No. Street City/Town/Province)
Rufina C. Buensuceso
893-6060
(Contact Person)
(Company Telephone Number)
1 2
3 1
A A C F S
Month
Day
(Form Type)
Month
(Calendar Year)
Day
(Annual Meeting)
(Secondary License Type, If Applicable)
Dept. Requiring this Doc.
Amended Articles Number/Section
Total Amount of Borrowings
746
Total No. of Stockholders
Domestic
Foreign
To be accomplished by SEC Personnel concerned
File Number
LCU
Document ID
Cashier
STAMPS
Remarks: Please use BLACK ink for scanning purposes.
*SGVMC312904*
n
a IYLAN
CITYIAND
DEVEI-OP]
CORPORA
\t
t:
Iiril
lirl
SCVaCo
1:].]
am*"u****ocr-.**,q-"
u$ frriPf!
sbdt
q ^dihs
/
rer
fftfllllfllt [!1fi[
-2Opinion
In our opinion, the consolidated financial statements present fairly, in all material respects, the
financial position of Cityland Development Corporation and its subsidiaries as at December 31, 2011
and 2010, and their financial performance and their cash flows for each of the three years in the period
ended December 31, 2011 in accordance with Philippine Financial Reporting Standards.
SYCIP GORRES VELAYO & CO.
Aileen L. Saringan
Partner
CPA Certificate No. 72557
SEC Accreditation No. 0096-AR-2 (Group A),
March 18, 2010, valid until March 17, 2013
Tax Identification No. 102-089-397
BIR Accreditation No. 08-001998-58-2009,
June 1, 2009, valid until May 31, 2012
PTR No. 3174828, January 2, 2012, Makati City
March 21, 2012
*SGVMC312904*
c{i!Idcfih0qlidqR(!ok4l
hr!ftsi
PoFdnr NoE r od tr)
tfll!ruflmrnm
I
CITYLAND DEVELOPMENT CORPORATION AND SUBSIDIARIES
CONSOLIDATED STATEMENTS OF INCOME
Years Ended December 31
2010
2011
REVENUE
Sales of real estate properties
Financial income (Note 19)
Rent income (Note 10)
Other income (Note 21)
2009
P
=1,574,293,008
478,693,976
23,077,618
21,515,652
2,097,580,254
=1,454,122,153
P
544,519,894
15,520,120
28,564,854
2,042,727,021
P
=1,880,570,472
522,912,688
14,862,065
21,000,738
2,439,345,963
971,074,045
365,402,991
56,570,373
1,393,047,409
965,266,466
294,664,300
70,944,398
1,330,875,164
1,235,462,795
372,005,001
96,434,076
1,703,901,872
INCOME BEFORE INCOME TAX
704,532,845
711,851,857
735,444,091
PROVISION FOR INCOME TAX
(Note 23)
102,698,472
129,499,644
155,627,166
P
=601,834,373
=582,352,213
P
=579,816,925
P
P
=441,337,900
160,496,473
P
=601,834,373
=447,868,346
P
134,483,867
=582,352,213
P
=513,099,506
P
66,717,419
=579,816,925
P
P
=0.15
=0.15
P
=0.17
P
EXPENSES
Cost of real estate sales
Operating expenses (Note 16)
Financial expenses (Note 20)
NET INCOME
Attributable to:
Equity holders of the parent
Non-controlling interests
BASIC/DILUTED EARNINGS PER
SHARE (Note 28)
See accompanying Notes to Consolidated Financial Statements.
*SGVMC312904*
CITYLAND DEVELOPMENT CORPORATION AND SUBSIDIARIES
CONSOLIDATED STATEMENTS OF COMPREHENSIVE INCOME
Years Ended December 31
2010
2011
2009
=582,352,213
P
=579,816,925
P
279,600
9,796,245
NET INCOME
OTHER COMPREHENSIVE INCOME
(LOSS)
Changes in fair value of available-for-sale
financial assets (Note 12)
Realized gain on sale of available-for-sale
financial assets recognized in the
consolidated statements of income
(Note 12)
Loss on impairment of available-for-sale
financial assets recognized in the
consolidated statements of income
(Note 12)
P
=601,834,373
TOTAL COMPREHENSIVE INCOME
P
=601,832,323
=572,251,789
P
=584,665,637
P
P
=441,346,532
160,485,791
P
=601,832,323
=437,302,183
P
134,949,606
=572,251,789
P
=517,770,281
P
66,895,356
=584,665,637
P
Attributable to:
Equity holders of the parent
Non-controlling interests
(2,050)
–
–
(2,050)
(11,750,260)
(4,947,533)
1,370,236
(10,100,424)
–
4,848,712
See accompanying Notes to Consolidated Financial Statements.
*SGVMC312904*
CITYLAND DEVELOPMENT CORPORATION AND SUBSIDIARIES
CONSOLIDATED STATEMENTS OF CHANGES IN EQUITY
FOR THE YEARS ENDED DECEMBER 31, 2011, 2010 and 2009
BALANCES AT DECEMBER 31, 2008
Net income
Other comprehensive income
Total comprehensive income
Transfer of deferred tax liability on deemed cost adjustment of
property and equipment absorbed through depreciation
Transfer of deferred tax liability on deemed cost adjustment of
properties realized through sale
Parent Company shares of stock held by CPI’s investments in trust
fund
Stock dividends - 20%
Fractional shares
Cash dividends - P
=0.10 per share
Cash dividends declared by subsidiaries
Cash dividends received by CPI on Parent Company shares of stock
BALANCES AT DECEMBER 31, 2009
Net income
Other comprehensive income (loss)
Total comprehensive income
Transfer of deferred tax liability on deemed cost adjustment
of property and equipment absorbed through depreciation
Transfer of deferred tax liability on deemed cost adjustment
of properties realized through sale
Parent Company shares of stock held by CPI’s investments
in trust fund
Stock dividends - 20%
Fractional shares
Cash dividends - P
=0.06 per share
Cash dividends declared by subsidiaries
Cash dividends received by CPI on Parent Company shares of stock
BALANCES AT DECEMBER 31, 2010
Capital
Stock
(Note 15)
P
=1,706,408,129
–
–
–
Attributable to Equity Holders of the Parent
Net Changes
in Fair Values of
Additional Available-for-sale
Retained
Paid-in
financial assets
Earnings
Capital
(Note 12)
(Note 15)
P
=7,277,651
P
=6,408,174
P
=1,941,812,749
–
–
513,099,506
–
4,670,775
–
–
4,670,775
513,099,506
Treasury
Stock
(Note 15)
(P
=32,004,722)
–
–
–
Total
P
=3,629,901,981
513,099,506
4,670,775
517,770,281
Non-controlling
Interests
P
=451,050,670
66,717,419
177,937
66,895,356
Total
P
=4,080,952,651
579,816,925
4,848,712
584,665,637
–
–
–
2,871,518
–
2,871,518
–
–
–
(8,168,523)
–
(8,168,523)
–
340,894,091
–
–
–
–
–
–
–
–
–
–
–
–
–
–
–
–
–
(340,894,091)
–
(170,447,018)
–
99,403
(218,289)
–
–
–
–
–
(218,289)
–
–
(170,447,018)
–
99,403
–
–
(21)
–
(13,630,668)
–
(218,289)
–
(21)
(170,447,018)
(13,630,668)
99,403
1,938,373,544
447,868,346
–
447,868,346
(32,223,011)
–
–
–
3,971,809,353
447,868,346
(10,566,163)
437,302,183
514,148,038
134,483,867
465,739
134,949,606
4,485,957,391
582,352,213
(10,100,424)
572,251,789
11,078,949
–
(10,566,163)
(10,566,163)
–
2,871,518
9,832,701
1,664,178
2,047,302,220
–
–
–
7,277,651
–
–
–
–
–
–
2,871,517
–
2,871,517
–
–
–
12,130,482
–
12,130,482
(9,832,701)
–
409,072,521
–
–
–
–
–
–
–
–
–
–
–
–
–
–
–
–
–
(409,072,521)
(333)
(147,266,208)
–
88,059
(36,764)
–
(333)
(147,266,208)
–
88,059
–
–
(229)
–
(14,020,029)
–
P
=2,456,374,741
P
=7,277,651
P
=512,786
P
=1,844,992,886
(36,764)
–
–
–
–
–
(P
=32,259,775)
P
=4,276,898,289
–
P
=625,244,685
2,871,517
2,297,781
(36,764)
–
(562)
(147,266,208)
(14,020,029)
88,059
P
=4,902,142,974
(Forward)
*SGVMC312904*
-2-
Capital
Stock
(Note 15)
Attributable to Equity Holders of the Parent
Net Changes
in Fair Values of
Additional Available-for-sale
Retained
Paid-in
financial assets
Earnings
Capital
(Note 12)
(Note 15)
Treasury
Stock
(Note 15)
Total
(P
=32,259,775)
–
–
–
P
=4,276,898,289
441,337,900
8,632
441,346,532
Non-controlling
Interests
P
=2,456,374,741
–
–
–
P
=7,277,651
–
–
–
P
=512,786
–
8,632
8,632
P
=1,844,992,886
441,337,900
–
441,337,900
–
–
–
2,871,517
–
2,871,517
–
2,871,517
–
–
–
2,794,372
–
2,794,372
–
2,794,372
–
490,887,040
–
–
–
–
–
–
–
–
–
–
–
–
–
–
–
–
BALANCES AT DECEMBER 31, 2011
P
=2,947,261,781
P
=7,277,651
P
=521,418
–
(490,887,040)
(318)
(122,721,840)
–
71,571
P
=1,678,459,048
(146,138)
–
–
–
–
–
(P
=32,405,913)
(146,138)
–
(318)
(122,721,840)
–
71,571
P
=4,601,113,985
P
=625,244,685
160,496,473
(10,682)
160,485,791
Total
BALANCES AT DECEMBER 31, 2010
Net income
Other comprehensive income (loss)
Total comprehensive income
Transfer of deferred tax liability on deemed cost adjustment
of property and equipment absorbed through depreciation
Transfer of deferred tax liability on deemed cost adjustment
of properties realized through sale
Parent Company shares of stock held by CPI’s investments
in trust fund
Stock dividends - 20%
Fractional shares
Cash dividends - P
=0.05 per share
Cash dividends declared by subsidiaries
Cash dividends received by CPI on Parent Company shares of stock
–
–
(292)
–
(38,962,927)
–
P
=746,767,257
P
=4,902,142,974
601,834,373
(2,050)
601,832,323
(146,138)
–
(610)
(122,721,840)
(38,962,927)
71,571
P
=5,347,881,242
See accompanying Notes to Consolidated Financial Statements.
*SGVMC312904*
CITYLAND DEVELOPMENT CORPORATION AND SUBSIDIARIES
CONSOLIDATED STATEMENTS OF CASH FLOWS
Years Ended December 31
2010
2011
CASH FLOWS FROM OPERATING ACTIVITIES
Income before income tax
Adjustments for:
Interest income (Note 19)
Interest expense - net of amounts capitalized
(Note 20)
Depreciation (Note 18)
Retirement benefits cost (income) (Note 22)
Decrease in pre-need reserves
Trust fund income (Note 21)
Dividend income (Note 19)
Gain on sale of available-for-sale financial
assets (Note 19)
Impairment loss on available-for-sale financial
assets (Note 20)
Recovery of impairment loss on real estate
properties for lease (Notes 10 and 21)
Gain on sale of property and equipment
Operating income before working capital changes
Decrease (increase) in:
Installment contracts receivable
Other receivables
Real estate properties for sale (Note 8)
Real estate properties held for future development
Deposits and others
Increase (decrease) in:
Accounts payable and accrued expenses
Other reserve
Cash generated from operations
Interest received
Income taxes paid, including creditable and
final withholding taxes
Contributions to the plan
Net cash flows from operating activities
CASH FLOWS FROM INVESTING ACTIVITIES
Proceeds from:
Matured short-term cash investments (Note 4)
Sale of available-for-sale financial assets (Note 12)
Matured held-to-maturity investments
Sale of property and equipment
Withdrawals from investments in trust funds (Note 5)
Contributions to investments in trust fund (Note 5)
Additions to:
Investment properties (Note 10)
Available-for-sale investments
Property and equipment (Note 11)
Dividends received
Purchases of short-term cash investments (Note 4)
Net cash flows from (used in) investing activities
2009
P
=704,532,845
=711,851,857
P
=735,444,091
P
(478,657,522)
(526,594,758)
(517,806,397)
55,051,749
18,842,759
841,757
(2,548,858)
(2,213,192)
(36,454)
67,836,489
19,119,585
149,537
(5,279,339)
(2,669,444)
(154,895)
93,876,703
19,089,437
(9,834,069)
(11,995,491)
(3,212,279)
(158,758)
–
(17,770,241)
(4,947,533)
–
1,370,236
–
–
–
295,813,084
(767,390)
(59,999)
247,031,638
(2,267,220)
(76,999)
298,111,485
9,930,666
(14,217,214)
80,324,236
(131,270,607)
9,510,255
291,940,402
3,280,815
158,504,810
(130,741,407)
(10,614,344)
(63,011,893)
(2,740,878)
143,713,526
(12,934,286)
(378,254)
154,564,035
(50,502)
404,603,953
480,919,527
(60,765,835)
(76,930)
498,559,149
523,994,348
175,721,158
(177,530)
538,303,328
519,000,427
(167,630,548)
(118,683)
717,774,249
(182,495,373)
(141,314)
839,916,810
(156,692,846)
(390,259)
900,220,650
729,700,028
–
–
–
7,932,724
(2,430,147)
13,225,531
150,344,747
60,000
8,388,256
(747,509)
–
5,377,240
260,028
77,000
15,422,893
(1,940,761)
(6,800,632)
–
–
36,454
–
728,438,427
(343,907)
(227)
(1,792,428)
154,895
(826,050,028)
(656,760,670)
(651,039)
–
158,758
(411,400,000)
(392,695,881)
(Forward)
*SGVMC312904*
-2Years Ended December 31
2010
2011
CASH FLOWS FROM FINANCING ACTIVITIES
Dividends paid
Net availments (payments) of short-term notes (Note 14)
Interest paid (Note 14)
Payments of long-term loans (Note 14)
Availments of long-term loans (Note 14)
Payments of contracts payable (Note 14)
Net cash flows used in financing activities
NET INCREASE (DECREASE) IN CASH
AND CASH EQUIVALENTS
2009
=160,529,862) (P
=183,433,000)
(P
=161,031,325) (P
22,110,433
94,702,565
(373,252,226)
(70,551,950)
(99,138,508)
(59,095,590)
(293,374,955)
(377,107,560)
(10,000,000)
5,000,000
44,000,000
–
(293,976,561)
–
(497,346,334)
(814,953,064)
(603,379,141)
842,833,535
(314,190,194)
(307,428,295)
CASH AND CASH EQUIVALENTS
AT BEGINNING OF YEAR
590,992,564
905,182,758
1,212,611,053
CASH AND CASH EQUIVALENTS
AT END OF YEAR (Note 4)
P
=1,433,826,099
=590,992,564
P
=905,182,758
P
See accompanying Notes to Consolidated Financial Statements.
*SGVMC312904*
CITYLAND DEVELOPMENT CORPORATION AND SUBSIDIARIES
NOTES TO CONSOLIDATED FINANCIAL STATEMENTS
1. Corporate Information
Cityland Development Corporation (the Parent Company) was incorporated in the Philippines on
January 31, 1978. It has two subsidiaries, Cityplans, Incorporated (CPI) and City & Land
Developers, Incorporated (CLDI), a publicly listed company, all domiciled in the Philippines. The
Parent Company’s and CLDI’s primary business purpose is to acquire, develop, improve,
subdivide, cultivate, lease, sublease, sell, exchange, barter and/or dispose of agricultural,
industrial, commercial, residential and other real properties, as well as to construct, improve, lease,
sublease, sell and/or dispose of houses, buildings and other improvements thereon, and to manage
and operate subdivisions and housing projects or otherwise engage in the financing and trading of
real estate. CPI is engaged in the business of establishing, organizing, developing, maintaining,
conducting, operating, marketing and selling pension plans. The Parent Company is 50.40%
owned by Cityland, Inc. (CI), the ultimate parent company incorporated in the Philippines, which
also prepares consolidated financial statements.
The Parent Company’s and its subsidiaries’ (the Group) registered office and principal place of
business is 2nd Floor, Cityland Condominium 10, Tower I, 156 H. V. de la Costa Street, Ayala
North, Makati City.
The consolidated financial statements of the Group were authorized for issuance by the Board of
Directors (BOD) on March 21, 2012.
2. Summary of Significant Accounting and Financial Reporting Policies
Basis of Preparation
The consolidated financial statements of the Group have been prepared using the historical cost
basis, except for financial assets at fair value through profit or loss and available-for-sale financial
assets that have been measured at fair values and certain items of property and equipment which
are stated at revalued amounts. These consolidated financial statements are presented in
Philippine peso (Peso), which is the Parent Company’s functional currency, and rounded to the
nearest Peso except when otherwise indicated.
Statement of Compliance
The consolidated financial statements have been prepared in compliance with Philippine Financial
Reporting Standards (PFRS).
Changes in Accounting Policies
The accounting policies adopted are consistent with those of the previous financial year except for
the adoption of the following new and amended Philippine Accounting Standards (PAS), PFRS
and new Philippine Interpretations based on International Financial Reporting Interpretations
Committee (IFRIC) interpretations effective in 2011. The adoption of the following revised PAS
is relevant but does not have a significant impact on the consolidated financial statements:
·
Revised PAS 24, Related Party Disclosures, simplifies the identification of related party
relationships, particularly in relation to significant influence and joint control. The
amendment emphasizes a symmetrical view on related party relationships as well as clarifies
in which circumstances persons and key management personnel affect the related party
relationships of an entity. The amendment also introduces an exemption from the general
*SGVMC312904*
-2related party disclosure requirements, for transactions with a government and entities that are
controlled, jointly controlled or significantly influenced by the same government as the
reporting entity. The adoption of the amendment did not have any impact on the financial
position and performance of the Group.
The adoption of the following new and amended PFRS, PAS and Philippine Interpretations are
either not relevant to or have no significant impact on the consolidated financial statements:
·
·
·
Amended PAS 32, Financial Instruments: Presentation - Clarification of Rights Issues
Amended IFRIC 14, Prepayments of a Minimum Funding Requirement
Philippine Interpretation IFRIC 19, Extinguishing Financial Liabilities with Equity
Instruments
Improvements to PFRS
The annual improvements process has been adopted by the International Accounting Standards
Board (IASB) to deal with non-urgent but necessary amendments to PFRS. The following
summarizes the amendments that are effective on or after January 1, 2011. The adoption of the
following amendments is relevant but does not have a significant impact on the consolidated
financial statements:
·
PFRS 7, Financial Instruments Disclosures, emphasizes the interaction between quantitative
and qualitative disclosures and the nature and extent of risks associated with financial
instruments.
·
PAS 1, Presentation of Financial Statements, clarifies that an entity will present an analysis of
other comprehensive income for each component of equity, either in the statement of changes
in equity or in the notes to the financial statements.
·
PAS 27, Consolidated and Separate Financial Statements (Amended), clarifies that the
consequential amendments from PAS 27 made to PAS 21, The Effect of Changes in Foreign
Exchange Rates, PAS 28, Investment in Associates, and PAS 31, Interest in Joint Ventures,
apply prospectively.
·
PAS 34, Interim Financial Reporting, provides guidance to illustrate how to apply disclosure
principles in PAS 34 and requires additional disclosures on: (a) the circumstances likely to
affect fair values of financial instruments and their classification, (b) transfers of financial
instruments between different levels of the fair value hierarchy, (c) changes in the
classification of financial assets and (d) changes in contingent liabilities and assets.
Other amendments resulting from the following 2011 improvements to PFRS, PAS and Philippine
Interpretations did not have any significant impact on the accounting policies, financial position or
performance of the Group.
·
·
PFRS 3, Business Combinations
Philippine Interpretation IFRIC 13, Customer Loyalty Programmes
Basis of Consolidation
The consolidated financial statements consist of the financial statements of the Parent Company
and its subsidiaries as of December 31 of each year. The financial statements of the subsidiaries
are prepared for the same reporting year as the Parent Company using consistent accounting
policies.
*SGVMC312904*
-3These subsidiaries, all incorporated and domiciled in the Philippines, and the percentage of
ownership of the Parent Company in 2011, 2010 and 2009 are as follows:
CPI
CLDI
Percentage of
Ownership
90.81
49.73
Nature of
Activity
Pre-need pension plans
Real estate
Subsidiaries are entities over which the Parent Company has the power to govern the financial and
operating policies, generally accompanying a shareholding of more than one half of the voting
rights. The existence and effect of any potential voting rights that are currently exercisable or
convertible are considered when assessing whether the Parent Company controls another entity.
Subsidiaries are consolidated from the date on which control is transferred to the Parent Company
and cease to be consolidated from the date on which control is transferred out of the Parent
Company.
The accounts of CLDI were consolidated since the Parent Company, some of its stockholders and
affiliates (whose stockholders also own equity ownership in the Parent Company) collectively
own more than 50% of the equity of CLDI, thereby giving the Parent Company effective control
over the financial and operating policies of CLDI.
The equity, net income and total comprehensive income attributable to non-controlling interests of
the consolidated subsidiaries are shown separately in the consolidated balance sheet, consolidated
statement of income and consolidated statement of comprehensive income, respectively.
All significant intercompany accounts and transactions are eliminated.
Non-controlling Interests
Non-controlling interest represents the portion of the net assets of consolidated subsidiaries not
held by the Group, and are presented separately in the consolidated statement of income,
consolidated statement of comprehensive income and within the equity section of the consolidated
balance sheet, separate from the Parent company’s equity. The losses applicable to the minority in
a consolidated subsidiary may exceed the non-controlling interest’s equity in the subsidiary even if
the losses exceed the non-controlling equity investment in the subsidiary.
The acquisition of non-controlling interests is not considered a business combination under
PFRS 3, Business Combinations, and therefore, the re-measurement of the net assets acquired is
not permissible and is not performed. Subsequent to January 1, 2010, changes in the parent's
ownership interest in a subsidiary that do not result in a loss of control are accounted for as equity
transactions. In such circumstances, the carrying amounts of the controlling and non-controlling
interests shall be adjusted to reflect the changes in their relative interests in the subsidiary. Any
difference between the amount by which the non-controlling interests is adjusted and the fair value
of the consideration paid or received shall be recognized directly in equity and attributed to the
owners of the parent. This is applied on a prospective basis. Prior to January 1, 2010, acquisitions
of non-controlling interests are accounted for using the parent entity extension concept method,
wherein any excess of the consideration given up over the book value of the net assets acquired is
recognized as goodwill. Any excess of the book value of the net assets acquired over the
consideration given up is recognized as negative goodwill referred to as “Excess of net book value
of non-controlling interests acquired over acquisition cost” in the consolidated statement of
income.
Non-controlling interests represent the interests in CPI and CLDI not held by the Parent Company.
*SGVMC312904*
-4Cash and Cash Equivalents
Cash includes cash on hand and in banks. Cash equivalents are short-term, highly liquid
investments that are readily convertible to known amounts of cash with original maturities of three
months or less from dates of acquisition, and are subject to an insignificant risk of change in value.
Short-term Cash Investments
Short-term cash investments are investments with maturities of more than three months but not
exceeding one year from dates of acquisition.
Financial Assets and Financial Liabilities
Date of recognition
The Group recognizes a financial asset or a financial liability in the consolidated balance sheet
when it becomes a party to the contractual provisions of the instrument. In the case of a regular
way purchase or sale of financial assets, recognition and derecognition, as applicable, is done
using settlement date accounting.
Initial recognition of financial instruments
Financial instruments are recognized initially at fair value, which is the fair value of the
consideration given (in case of an asset) or received (in case of a liability). The initial
measurement of financial instruments, except for those designated at fair value through profit or
loss, includes directly attributable transaction cost.
Classification of financial instruments
Subsequent to initial recognition, the Group classifies its financial instruments in the following
categories: financial assets and financial liabilities at fair value through profit or loss, loans and
receivables, held-to-maturity investments, available-for-sale financial assets and other financial
liabilities. The classification depends on the purpose for which the instruments are acquired and
whether they are quoted in an active market. Management determines the classification at initial
recognition and, where allowed and appropriate, re-evaluates this classification at each end of
reporting period.
a. Financial Assets or Financial Liabilities at Fair Value through Profit or Loss
A financial asset or financial liability is classified in this category if acquired principally for
the purpose of selling or repurchasing in the near term or upon initial recognition it is
designated by management as at fair value through profit or loss.
Financial assets or financial liabilities classified in this category are designated as at fair value
through profit or loss by management on initial recognition when the following criteria are
met:
·
·
·
The designation eliminates or significantly reduces the inconsistent treatment that would
otherwise arise from measuring the assets or liabilities or recognizing gains or losses on
them on a different basis; or
The assets or liabilities are part of a group of financial assets or financial liabilities, or
both financial assets and financial liabilities, which are managed and their performance is
evaluated on a fair value basis, in accordance with a documented risk management or
investment strategy; or
The financial instrument contains an embedded derivative, unless the embedded
derivative does not significantly modify the cash flows or it is clear, with little or no
analysis, that it would not be separately recorded.
*SGVMC312904*
-5Financial assets or financial liabilities classified under this category are carried at fair value in
the consolidated balance sheet. Changes in the fair value of such assets and liabilities are
recognized in the consolidated statement of income.
The Group designated its investments in trust funds as financial assets at fair value through
profit or loss. The Group’s investments in trust funds directly relate to the Pre-need Reserves
accounts.
b. Loans and Receivables
Loans and receivables are non-derivative financial assets with fixed or determinable payments
that are not quoted in an active market. They arise when the Group provides money, goods or
services directly to a debtor with no intention of trading the receivables. Loans and receivables
are carried at cost or amortized cost in the consolidated balance sheet. Amortization is
determined using the effective interest rate method. Loans and receivables are included in
current assets if maturity is within 12 months from the end of reporting period. Otherwise,
these are classified as noncurrent assets.
The Group’s cash in banks and cash equivalents, short-term cash investments, installment
contracts receivable and other receivables are classified under this category.
c. Held-to-maturity Investments
Held-to-maturity investments are non-derivative financial assets with fixed or determinable
payments and fixed maturities wherein the Group has positive intention and ability to hold to
maturity. Held-to-maturity investments are carried at cost or amortized cost in the
consolidated balance sheet. Amortization is determined using the effective interest rate
method. Assets under this category are classified as current assets if maturity is within 12
months from the end of reporting period and noncurrent assets if maturity is more than one
year.
The Group has no held-to-maturity investments as of December 31, 2011 and 2010.
d. Available-for-sale Financial Assets
Available-for-sale financial assets are non-derivatives that are either designated in this
category or not classified in any of the other categories. Available-for-sale financial assets are
carried at fair value in the consolidated balance sheet. Changes in the fair value of such assets
are accounted in the consolidated statement of comprehensive income and in equity. These
financial assets are classified as noncurrent assets unless the intention is to dispose such assets
within 12 months from the end of reporting period.
The Group’s available-for-sale financial assets consist of investments in quoted equity
securities that are traded in liquid markets, held for the purpose of investing in liquid funds
and not generally intended to be retained on a long-term basis.
e. Other Financial Liabilities
Other financial liabilities are non-derivative financial liabilities with fixed or determinable
payments that are not quoted in an active market. They arise when the Group owes money,
goods or services directly to a creditor with no intention of trading the payables. Other
financial liabilities are carried at cost or amortized cost in the consolidated balance sheet.
Amortization is determined using the effective interest rate method. Other financial liabilities
*SGVMC312904*
-6are included in current liabilities if maturity is within 12 months from the end of reporting
period, otherwise, these are classified as noncurrent.
The Group’s other financial liabilities consist of accounts payable and accrued expenses and
notes and loans payable.
Determination of fair value
The fair value of financial instruments traded in active markets at the end of reporting period is
based on their quoted market price or dealer price quotations (bid price for long positions and ask
price for short positions), without any deduction for transaction costs. When current bid and
asking prices are not available, the price of the most recent transaction provides evidence of the
current fair value as long as there has not been a significant change in economic circumstances
since the time of the transaction.
For all other financial instruments not traded in an active market, the fair value is determined by
using appropriate valuation techniques. Valuation techniques include net present value techniques,
comparison to similar instruments for which market observable prices exist, option pricing
models, and other relevant valuation models.
“Day 1” Difference
Where the transaction price in a non-active market is different from the fair value from other
observable current market transactions in the same instrument or based on a valuation technique
whose variables include only data from observable market, the Group recognizes the difference
between the transaction price and fair value (a “Day 1” difference) in the consolidated statement
of income unless it qualifies for recognition as some other type of asset. In cases where inputs are
made of data which are not observable, the difference between the transaction price and model
value is only recognized in the consolidated statement of income when the inputs become
observable or when the instrument is derecognized. For each transaction, the Group determines
the appropriate method of recognizing the “Day 1” difference.
Offsetting of financial instruments
Financial assets and financial liabilities are offset and the net amount is reported in the
consolidated balance sheet if, and only if, there is a currently enforceable legal right to offset the
recognized amounts and there is an intention to settle on a net basis, or to realize the asset and
settle the liability simultaneously.
Derecognition of Financial Assets and Financial Liabilities
Financial assets
A financial asset (or, where applicable, a part of a financial asset or part of a group of similar
financial assets) is derecognized where:
·
·
·
the rights to receive cash flows from the asset have expired; or
the Group retains the right to receive cash flows from the asset, but has assumed an obligation
to pay them in full without material delay to a third party under a “pass-through” arrangement;
or
the Group has transferred its right to receive cash flows from the asset and either (a) has
transferred substantially all the risks and rewards of the asset, or (b) has neither transferred nor
retained substantially all the risks and rewards of the asset, but has transferred control of the
asset.
Where the Group has transferred its rights to receive cash flows from an asset and has neither
transferred nor retained substantially all the risks and rewards of the asset nor transferred control
of the asset, the asset is recognized to the extent of the Group’s continuing involvement in the
*SGVMC312904*
-7asset. Continuing involvement that takes the form of a guarantee over the transferred asset is
measured at the lower of the original carrying amount of the asset and the maximum amount of
consideration that the Group could be required to repay.
Financial liabilities
A financial liability is derecognized when the obligation under the liability is discharged,
cancelled or has expired.
Where an existing financial liability is replaced by another from the same lender on substantially
different terms, or the terms of an existing liability are substantially modified, such an exchange or
modification is treated as a derecognition of the original liability and the recognition of a new
liability, and the difference in the respective carrying amounts is recognized in the consolidated
statement of income.
Impairment of Financial Assets
The Group assesses at each reporting period whether a financial asset or a group of financial assets
is impaired.
Assets carried at amortized cost
The Group first assesses whether objective evidence of impairment exists individually for
financial assets that are individually significant, and individually or collectively for financial
assets that are not individually significant. Objective evidence includes observable data that
comes to the attention of the Group about loss events such as, but not limited to significant
financial difficulty of the counterparty, a breach of contract, such as default or delinquency in
interest or principal payments, probability that the borrower will enter bankruptcy or other
financial reorganization. If it is determined that no objective evidence of impairment exists for an
individually assessed financial asset, whether significant or not, the asset is included in the group
of financial assets with similar credit risk and characteristics and that group of financial assets is
collectively assessed for impairment. Assets that are individually assessed for impairment and for
which an impairment loss is recognized are not included in a collective assessment of impairment.
The impairment assessment is performed at each end of reporting period. For the purpose of
collective evaluation of impairment, financial assets are grouped on the basis of such credit risk
characteristics such as customer type, payment history, past-due status and term.
If there is an objective evidence that an impairment loss on loans and receivables carried at
amortized cost has been incurred, the amount of loss is measured as the difference between the
asset’s carrying amount and the present value of estimated future cash flows (excluding future
credit losses that have not been incurred) discounted at the financial asset’s original effective
interest rates (i.e., the effective interest rate computed at initial recognition). The carrying amount
of the asset shall be reduced either directly or through the use of an allowance account. The
amount of loss, if any, is recognized in the consolidated statement of income.
If, in a subsequent period, the amount of the impairment loss decreases and the decrease can be
related objectively to an event occurring after the impairment was recognized, the previously
recognized impairment loss is reversed by adjusting the allowance account. The amount of the
reversal is recognized in the consolidated statement of income. Interest income continues to be
accrued on the reduced carrying amount based on the original effective interest rate of the asset.
Loans together with the associated allowance are written off when there is no realistic prospect of
future recovery and all collateral, if any, has been realized or has been transferred to the Group. If
in a subsequent year, the amount of the estimated impairment loss increases or decreases because
of an event occurring after the impairment was recognized, the previously recognized impairment
*SGVMC312904*
-8loss is increased or reduced by adjusting the allowance for impairment losses account. If a future
write off is later recovered, the recovery is recognized in the consolidated statement of income
under “Other income” account. Any subsequent reversal of an impairment loss is recognized in
the consolidated statement of income to the extent that the carrying value of the asset does not
exceed its amortized cost at reversal date.
Assets carried at cost
If there is an objective evidence that an impairment loss of an unquoted equity instrument that is
not carried at fair value because its fair value cannot be reliably measured, or a derivative asset
that is linked to and must be settled by delivery of such an unquoted equity instrument has been
incurred, the amount of the loss is measured as the difference between the asset’s carrying amount
and the present value of estimated future cash flows discounted at the current market rate of return
for a similar financial asset.
Available-for-sale financial assets
In the case of debt instruments classified as available-for-sale financial assets, impairment is
assessed based on the same criteria as financial assets carried at amortized cost. Future interest
income is based on the reduced carrying amount and is accrued based on the rate of interest used
to discount future cash flows for the purpose of measuring impairment loss. Such accrual is
recorded as part of “Financial income” in the consolidated statement of income. If, in subsequent
year, the fair value of a debt instrument increases and the increase can be objectively related to an
event occurring after the impairment loss was recognized in the consolidated statement of income,
the impairment loss is reversed through the consolidated statement of income.
In case of equity investments classified as available-for-sale financial assets, this would include a
significant or prolonged decline in the fair value of the investments below its cost. Where there is
evidence of impairment, the cumulative loss - measured as the difference between the acquisition
cost and the current fair value, less any impairment loss on that financial asset previously
recognized in the consolidated statement of income - is removed from equity and recognized in the
consolidated statement of income. Increases in fair value after impairment are recognized in the
consolidated statement of comprehensive income and directly in the consolidated statement of
changes in equity.
Real Estate Properties for Sale and Real Estate Properties Held for Future Development
Real estate properties for sale and real estate properties held for future development are valued at
the lower of cost and net realizable value. Cost consists of all expenditures incurred which are
directly attributable to the acquisition, development, and construction of the real estate properties.
Interest on loans (borrowing costs) incurred during the development or construction phase is also
capitalized as part of the cost of the real estate properties. Net realizable value is the estimated
selling price in the ordinary course of business less the estimated costs of completion and
estimated costs necessary to make the sale.
Investment Properties
Investment properties which represent real estate properties for lease are measured initially at cost,
including transaction costs. The carrying amount includes the cost of replacing part of existing
investment properties at the time that cost is incurred if the recognition criteria are met, and
excludes the costs of day-to-day servicing of the property. The carrying values of revalued
properties transferred to real estate properties for lease on January 1, 2004 were considered as the
assets’ deemed cost as of said date. Subsequent to initial measurement, investment properties are
carried at cost less accumulated depreciation and impairment loss.
*SGVMC312904*
-9Investment properties, except land, are carried at cost less accumulated depreciation and
amortization and any impairment in value. Land is carried at cost less any impairment in value.
Buildings for lease are depreciated over their useful life of 25 years using the straight-line method.
Investment properties are derecognized when either they have been disposed of or when the
property is permanently withdrawn from use and no future economic benefit is expected from its
disposal.
Any gains or losses on the retirement or disposal of investment properties are
recognized in the statement of income in the year of retirement or disposal.
Transfers are made to investment properties when, and only when, there is a change in use,
evidenced by ending of owner-occupation, commencement of an operating lease to another party,
or ending of construction or development. Transfers are made from investment properties when,
and only when, there is a change in use, evidenced by commencement of owner-occupation or
commencement of development with a view to sale.
Transfers between investment properties, owner-occupied property and inventories do not change
the carrying amount of the property transferred and they do not change the cost of that property for
measurement or disclosure purposes.
Property and Equipment
Property and equipment, except for office premises, are stated at cost less accumulated
depreciation and any impairment in value. Office premises are stated at appraised values as
determined by independent firms of appraisers on various dates, less accumulated depreciation and
any impairment in value. Subsequent additions prior to the next regular appraisal are stated at
cost.
The initial cost of property and equipment consists of the purchase price and any directly
attributable cost of bringing the assets to their working condition and location for their intended
use. Expenditures incurred after the property and equipment have been put into operations, such as
repairs and maintenance, are normally charged to the consolidated statement of income in the
period in which the costs are incurred. In situations where it can be clearly demonstrated that the
expenditures have resulted in an increase in the future economic benefits expected to be obtained
from the use of an item of property and equipment beyond its originally assessed standard of
performance, the expenditures are capitalized as an additional cost of property and equipment.
Depreciation of an item of property and equipment begins when the asset becomes available for
use, i.e., when it is in the location and condition necessary for it to be capable of operating in the
manner intended by management. Depreciation ceases at the earlier of the date that the item is
classified as held for sale (or included in a disposal group that is classified as held for sale) in
accordance with PFRS 5, Noncurrent Assets Held for Sale and Discontinued Operations, and the
date the asset is derecognized.
Depreciation is computed using the straight-line method over the estimated useful lives of the
properties as follows:
Office premises
Furniture, fixtures and office equipment
Transportation and other equipment
Years
25
5
5
The assets’ useful lives and depreciation method are reviewed periodically to ensure that these are
consistent with the expected pattern of economic benefits from items of property and equipment.
*SGVMC312904*
- 10 When property and equipment are sold or retired, the cost and related accumulated depreciation
and any impairment in value are removed from the accounts, and any gains or losses from their
disposal is included in the consolidated statement of income.
Impairment of Nonfinancial Assets
The carrying values of investment properties and property and equipment are reviewed for
impairment when events or changes in circumstances indicate that the carrying values may not be
recoverable. If any such indication exists and where the carrying value exceeds the estimated
recoverable amount, the assets are either written down to their recoverable amount or provided
with valuation allowance. The recoverable amount of the assets is the greater of fair value less
costs to sell and value-in-use. Valuation allowances are provided for the carrying amounts of
assets which are not expected to be recovered. Impairment losses, if any, are recognized in the
consolidated statement of income.
The Group assesses at each reporting period whether there is an indication that previously
recognized impairment losses may no longer exist or may have decreased. The Group considers
external and internal sources of information in its assessment of the reversal of previously
recognized impairment losses. A previously recognized impairment loss is reversed only if there
has been a change in the estimates used to determine the asset’s recoverable amount since the last
impairment loss was recognized. If that is the case, the carrying amount of the asset is increased
to its recoverable amount. That increased amount cannot exceed the carrying amount that would
have been determined, net of depreciation, had no impairment loss been recognized for the asset in
prior years. Such reversal is recognized in the consolidated statement of income. After such a
reversal, the depreciation is adjusted in future periods to allocate the asset’s revised carrying
amount, less any residual value, on a systematic basis over its remaining useful life.
Value-added Tax (VAT)
Revenue, expenses, assets and liabilities are recognized, net of the amount of VAT, except where
the VAT incurred on a purchase of assets or services is not recoverable from the taxation
authority, in which case the VAT is recognized as part of the cost of acquisition of the asset or as
part of the expense item as applicable.
The net amount of VAT recoverable from or payable to, the taxation authority is included as part
of “Other assets” or “Accounts payable and accrued expenses,” respectively, in the consolidated
balance sheet.
Pre-need Reserves (PNR)
Pre-need reserves for pension plans are calculated on the following basis of the methodology and
assumptions set out in the Pre-need Rule 31, as amended:
The amount of provision is the present value of the funding expected to be required to settle the
obligation with due consideration of the different probabilities as follows:
On Currently-being-paid Plans
i. Provision for termination values applying the inactivity and surrender rate experience of CPI.
ii. For the portion of currently-being-paid plans that will reach full payment, applying the full
payment experience of CPI, the liability is equivalent to the present value of future maturity
benefits reduced by the present value of future trust fund contributions required per Product
Model discounted at the approved hurdle rate per Product Model of CPI.
*SGVMC312904*
- 11 On Lapsed Plans within the Allowable Reinstatement Period
i.
Provision for termination values applying the reinstatement experience of CPI.
On Fully Paid Plans
i.
For those due for payment within the next five years, the reserve is the present value of future
maturity benefits discounted at the attainable rate, as determined and certified by CPI’s trustee
using industry best practices and principles which shall be indicated in such certification;
ii. For those not yet due for payment within the next five years, the reserves is the present value
of future maturity benefits discounted at the approved hurdle rate per Product Model of CPI.
The rates of surrender, cancellation, reinstatement, utilization, and inflation considered the actual
experience of CPI in the last three years.
The computation of the foregoing assumptions has been validated by a qualified actuary of CPI.
Based on CPI’s experience, the probability of pre-termination on surrender of fully paid plans is
below 5% and therefore considered insignificant. As such, no pretermination rate was considered
in determining the PNR of fully paid plans. The derecognition of liability shall be recorded at
pretermination date.
Capital Stock
Capital stock is measured at par value for all shares issued and outstanding. When the Parent
Company issues more than one class of stock, a separate account is maintained for each class of
stock and the number of shares issued. Incremental costs incurred directly attributable to the
issuance of new shares are shown in equity as a deduction from proceeds, net of tax.
When the shares are sold at premium, the difference between the proceeds and the par value is
credited to the “Additional paid-in capital” account. When shares are issued for a consideration
other than cash, the proceeds are measured by the fair value of the consideration received. In case
the shares are issued to extinguish or settle the liability of the Parent Company, the shares shall be
measured either at the fair value of the shares issued or fair value of the liability settled, whichever
is more reliably determinable.
The Parent Company’s shares which are reacquired (treasury shares) are recognized at cost and
deducted from equity. No gain or loss is recognized in the consolidated statement of income on the
purchase, sale, issue or cancellation of the Parent Company’s own equity instruments. Any
difference between the carrying amount and the consideration is recognized as additional paid-in
capital.
Retained Earnings
Retained earnings represent the cumulative balance of net income or loss, dividend distributions,
effects of changes in accounting policy and other capital adjustments.
Unappropriated retained earnings represent that portion which is free and can be declared as
dividends to stockholders. Appropriated retained earnings represent that portion which has been
restricted and therefore is not available for any dividend declaration.
Dividend Distributions
Dividends on common shares are recognized as a liability and deducted from retained earnings
when approved by the shareholders of the Group. Dividends for the year that are approved after
*SGVMC312904*
- 12 the end of the reporting period but before the approval for issuance of the financial statements are
dealt with as an event after the reporting period.
Revenue and Costs Recognition
Revenue is recognized to the extent that it is probable that the economic benefits will flow to the
Group and the amount of revenue can be reliably measured. Revenue is measured at the fair value
of the consideration received excluding VAT. The Group assesses its revenue arrangements
against specific criteria in order to determine if it is acting as principal or agent. The Group has
concluded that it is acting as a principal in all of its revenue arrangements. The following specific
recognition criteria must also be met before revenue is recognized:
Sales of real estate properties
Sales of condominium units and residential houses where the Group has material obligations under
the sales contract to provide improvements after the property is sold are accounted for under the
percentage of completion method. Under this method, revenue on sale is recognized as the related
obligations are fulfilled.
Revenue from sales of completed residential lots and housing units, where a sufficient down
payment has been received, the collectability of the sales price is reasonably assured, the refund
period has expired, the receivables are not subordinated and the seller is not obligated to complete
improvements, is accounted for under the full accrual method. If the criterion of full accrual
method was not satisfied, any cash received by the Group is included in the “Accounts payable
and accrued expenses” in the consolidated balance sheet until all the conditions for recording a
sale are met.
Cost of real estate sales
Costs of real estate sales are recognized consistent with the revenue recognition method applied.
Cost of condominium units sold before the completion of the development is determined on the
basis of the acquisition cost of the land plus its full development costs, which include estimated
costs for future development works as determined by the Group’s in-house technical staff.
In addition, cost of real estate sales of 100% completed projects represents the proportionate share
of the sold units to the total of the development cost which includes land, direct materials, labor
cost and other indirect costs related to the project. If the project is still under construction, the cost
of real estate sales of the sold units is multiplied by the percentage of completion. The cost
referred to is the same total development costs and not only actual expenditures. The percentage
of completion is based on the technical evaluation of the project engineers as well as
management’s monitoring costs, progress and improvements of the projects.
Sales of pre-need plans
Premiums from sale of pre-need plans, included under “Other income” account in the consolidated
statement of income are recognized as earned when collected.
Cost of contracts issued account pertains to (a) the increase in PNR as at the current year as
compared to the provision for the same period of the previous year. If there is a decrease in the
PNR as a result of new information or new developments, the amount shall be deducted from the
cost of contracts issued of the current period. In case of material prior period errors, the
requirements of PAS 8, Accounting Policies, Changes in Accounting Estimates and Errors, shall
be complied with by the pre-need company; (b) amount of trust funds contributed during the year;
and (c) documentary stamp taxes and SEC registration fees.
*SGVMC312904*
- 13 Interest income
Interest income from cash in banks, cash equivalents, short-term cash investments and installment
contracts receivables is recognized as the interest accrues taking into account the effective yield on
interest.
Dividend income
Dividend income is recognized when the Group’s right to receive the payment is established.
Operating leases
Operating leases represent those leases under which substantially all risks and rewards of
ownership of the leased assets remain with the lessor. Rent income from operating leases is
recognized as income when earned on a straight-line basis over the term of the lease agreement.
Initial direct costs incurred specifically to earn revenue from an operating lease are recognized as
an expense in the consolidated statement of income in the period in which they are incurred.
Operating expenses
Operating expenses constitute costs of administering the business. These costs are expensed as
incurred.
Financial expenses
Financial expenses consist of interest incurred from loans and notes payable. Interest attributable
to a qualifying asset is capitalized as part of the cost of the property; otherwise, these are expensed
as incurred.
Interest costs are capitalized if they are directly attributable to the acquisition, development and
construction of real estate projects as part of the cost of such projects. Capitalization of interest
cost (1) commences when the activities to prepare the assets for their intended use are in progress
and expenditures and interest costs are being incurred, (2) is suspended during extended periods in
which active development is interrupted, and (3) ceases when substantially all the activities
necessary to prepare the assets for their intended use are complete.
Other Comprehensive Income
Other comprehensive income comprises items of income and expense (including items previously
presented under the consolidated statement of changes in equity) that are not recognized in the
consolidated statement of income for the year in accordance with PFRS.
Retirement Benefits Cost
Retirement benefits cost is actuarially determined using the projected unit credit method.
Actuarial gains and losses are recognized as income or expense when the net cumulative
unrecognized actuarial gains and losses for the plan at the end of the previous reporting year
exceeded 10% of the higher of the present value of the defined benefit obligation and the fair
value of plan assets at that date. These gains or losses are recognized over the expected average
remaining working lives of the employees participating in the plan.
Past service cost is recognized as an expense on a straight-line basis over the average period until
the benefits become vested. If the benefits are already vested immediately following the
introduction of, or changes to, a retirement plan, past service cost is recognized immediately.
The retirement plan liability is the aggregate of the present value of the defined benefit obligation
and actuarial gains and losses not recognized, reduced by past service cost not yet recognized, and
the fair value of plan assets out of which the obligations are to be settled directly. If such
*SGVMC312904*
- 14 aggregate is negative, the asset is measured at the lower of such aggregate or the aggregate of
cumulative unrecognized net actuarial losses and past service cost and the present value of any
economic benefits available in the form of refunds from the plans or reductions in the future
contributions to the plan.
If the asset is measured at the aggregate of cumulative unrecognized net actuarial losses and past
service cost and the present value of any economic benefits available in the form of refunds from
the plan or reductions in the future contributions to the plan, net actuarial losses of the current
period and past service cost of the current period are recognized immediately to the extent that
they exceed any reduction in the present value of those economic benefits. If there is no change or
increase in the present value of economic benefits, the entire net actuarial losses of the current
period and past service cost of the current period are recognized immediately. Similarly, net
actuarial gains of the current period after the deduction of past service cost of the current period
exceeding any increase in the present value of the economic benefits stated above are recognized
immediately if the asset is measured at the aggregate of cumulative unrecognized net actuarial
losses and past service cost at the present value of any economic benefits available in the form of
refunds from the plan or reductions in the future contributions to the plan. If there is no change or
decrease in the present value of the economic benefits, the entire net actuarial gains of the current
period after the deduction of past service cost of the current period are recognized immediately.
Provisions and Contingencies
Provisions are recognized when the Group has a present obligation (legal or constructive) as a
result of a past event, it is probable that an outflow of resources embodying economic benefits will
be required to settle the obligation and a reliable estimate can be made of the amount of the
obligation. If the effect of the time value of money is material, provisions are determined by
discounting the effective future cash flows at a pre-tax rate that reflects current market assessment
of the time value of money and where appropriate, the risks specific to the liability. Where
discounting is used, the increase in the provision due to the passage of time is recognized as an
interest expense.
Contingent liabilities are not recognized in the consolidated financial statements. They are
disclosed unless the possibility of an outflow of resources embodying economic benefits is
remote. A contingent asset is not recognized in the consolidated financial statements but disclosed
when an inflow of economic benefits is probable.
Income Taxes
Current income tax
Current income tax assets and liabilities for the current and prior periods are measured at the
amount expected to be recovered from or paid to the taxation authorities. The tax rates and the tax
laws used to compute the amount are those that are enacted or substantively enacted at the end of
reporting period.
Current income tax for current and prior periods shall, to the extent unpaid, be recognized as a
liability under “Income tax payable” account in the consolidated balance sheet. If the amount
already paid in respect of current and prior periods exceeds the amount due for those periods, the
excess shall be recognized as an asset under “Other assets” account in the consolidated balance
sheet.
Deferred income tax
Deferred income tax is recognized on all temporary differences at the end of reporting period
between the tax bases of assets and liabilities and their carrying amounts for financial reporting
purposes.
*SGVMC312904*
- 15 Deferred income tax liabilities are recognized for all taxable temporary differences, including
assets revaluations. Deferred income tax assets are recognized for all deductible temporary
differences to the extent that it is probable that sufficient future taxable profits will be available
against which the deductible temporary differences can be utilized. Deferred income tax assets
and deferred income tax liabilities are not recognized when it arises from the initial recognition of
an asset or liability in a transaction that is not a business combination and, at the time of the
transaction, affects neither the accounting profit nor taxable profit or loss.
Deferred income tax liabilities are not provided on nontaxable temporary differences associated
with investments in subsidiaries and affiliates.
The carrying amount of deferred income tax assets is reviewed at each end of reporting period and
reduced to the extent that it is no longer probable that sufficient future taxable profits will be
available to allow all or part of the deferred tax assets to be utilized. Unrecognized deferred
income tax assets are reassessed at each end of reporting period and are recognized to the extent
that it has become probable that sufficient future taxable profits will allow the deferred income tax
asset to be recovered.
Deferred income tax assets and deferred income tax liabilities are measured at the tax rates that are
expected to apply to the period when the asset is realized or the liability is settled, based on tax
rates and tax laws that have been enacted or substantively enacted at the end of reporting period.
Income tax relating to items recognized directly in equity is recognized in the consolidated
statement of comprehensive income and consolidated statement of changes in equity and not in the
consolidated statement of income.
Deferred income tax assets and deferred income tax liabilities are offset, if a legally enforceable
right exists to offset current tax assets against current income tax liabilities and the deferred taxes
relate to the same taxable entity and the same taxation authority.
Earnings Per Share
Basic earnings per share based on net income is computed by dividing the net income for the year
attributable to equity holders of the Parent Company by the weighted average number of ordinary
shares issued and outstanding after considering the retroactive effect, if any, of stock dividends
declared during the year.
Diluted earnings per share is calculated by dividing the net income for the year attributable to
equity holders of the Parent Company by the weighted average number of ordinary shares
outstanding during the year, excluding treasury shares and adjusted for the effects of all dilutive
potential common shares, if any. In determining both the basic and diluted earnings per share, the
effect of stock dividends, if any, is accounted for retrospectively.
Segment Reporting
The Group’s operating businesses are organized and managed separately according to the nature
of the products and services provided, with each segment representing a strategic business unit
that offers different products and serves different markets. Financial information on business
segments is presented in Note 29 to the consolidated financial statements. The Group’s assetproducing revenues are located in the Philippines (i.e., one geographical location). Therefore,
geographical segment information is no longer presented.
*SGVMC312904*
- 16 Events After the Reporting Period
Post year-end events that provide additional information about the Group’s position at the end of
reporting period (adjusting events) are reflected in the consolidated financial statements. Post
year-end events that are not adjusting events are disclosed in the notes to the consolidated
financial statements when material.
Future Changes in Accounting Policies
The Group will adopt the following standards and interpretations when these become effective
subsequent to 2011. Except as otherwise indicated, the Group does not expect the adoption of
these new, and amended and improvements to PFRS, PAS and Philippine Interpretations to have
significant impact on the consolidated financial statements.
Effective in 2012
· PFRS 7, Financial Instruments: Disclosures - Enhanced Derecognition Disclosure
Requirements, requires additional disclosure about financial assets that have been transferred
but not derecognized to enable the user of the consolidated financial statements to understand
the relationship with those assets that have not been derecognized and their associated
liabilities. In addition, the amendment requires disclosures about continuing involvement in
derecognized assets to enable the user to evaluate the nature of, and risks associated with, the
entity’s continuing involvement in those derecognized assets.
·
Amended PAS 12, Income Taxes - Deferred Taxes: Recovery of Underlying Assets, introduces
a rebuttable presumption that deferred tax on investment properties measured at fair value will
be recognized on a sale basis, unless an entity has a business model that would indicate the
investment property will be consumed in the business. If consumed, an own use basis must be
adopted. The amendment also introduces the requirement that deferred tax on non-depreciable
assets measured using the revaluation model in PAS 16, Property, Plant and Equipment,
should always be measured on a sale basis.
Effective in 2013
· PFRS 7, Financial instruments: Disclosures - Offsetting Financial Assets and Financial
Liabilities, requires an entity to disclose information about rights of offset and related
arrangements (such as collateral agreements). The new disclosures are required for all
recognized financial instruments that are offset in accordance with PAS 32. These disclosures
also apply to recognized financial instruments that are subject to an enforceable master netting
arrangement or ‘similar agreement’, irrespective of whether they are offset in accordance with
PAS 32. The amendments require entities to disclose, in a tabular format unless another
format is more appropriate, the following minimum quantitative information. This is presented
separately for financial assets and financial liabilities recognized at the end of the reporting
period:
a) The gross amounts of those recognized financial assets and recognized financial liabilities;
b) The amounts that are offset in accordance with the criteria in PAS 32 when determining
the net amounts presented in the consolidated balance sheet;
c) The net amounts presented in the consolidated balance sheet;
d) The amounts subject to an enforceable master netting arrangement or similar agreement
that are not otherwise included in (b) above, including:
i. Amounts related to recognized financial instruments that do not meet some or all of
the offsetting criteria in PAS 32; and
ii. Amounts related to financial collateral (including cash collateral); and
e) The net amount after deducting the amounts in (d) from the amounts in (c) above.
*SGVMC312904*
- 17 The amendments to PFRS 7 are to be applied retrospectively.
·
PFRS 10, Consolidated Financial Statements, replaces the portion of PAS 27 that addresses
the accounting for consolidated financial statements. It also addresses the issues raised in
SIC-12, Consolidation - Special Purpose Entities resulting in SIC-12 being withdrawn. It
establishes a single control model that applies to all entities including special purpose entities
The changes introduced by PFRS 10 will require management to exercise significant judgment
to determine which entities are controlled, and therefore, are required to be consolidated by a
parent, compared with the requirements that were in PAS 27.
·
PFRS 11, Joint Arrangements, replaces PAS 31, Interests in Joint Ventures and SIC-13,
Jointly-controlled Entities - Non-monetary Contributions by Venturers. PFRS 11 removes
the option to account for jointly controlled entities (JCEs) using proportionate consolidation.
Instead, JCEs that meet the definition of a joint venture must be accounted for using the equity
method.
·
PFRS 12, Disclosure of Interests with Other Entities, includes all of the disclosures that were
previously in PAS 27 related to consolidated financial statements, as well as all of the
disclosures that were previously included in PAS 31 and PAS 28. These disclosures relate to
an entity’s interests in subsidiaries, joint arrangements, associates and structured entities. A
number of new disclosures are also required.
·
PFRS 13, Fair Value Measurement, establishes a single source of guidance under PFRS for all
fair value measurements. PFRS 13 does not change when an entity is required to use fair
value, but rather provides guidance on how to measure fair value under PFRS when fair value
is required or permitted.
·
PAS 1, Financial Statements Presentation - Presentation of Items of Other Comprehensive
Income, changes the grouping of items presented in other comprehensive income (OCI).
Items that would be reclassified (or recycled) to profit or loss at a future point in time (e.g.,
upon derecognition or settlement) would be presented separately from items that will never be
reclassified. The amendments affect the presentation only and have therefore no impact on the
financial position or performance.
·
Revised PAS 19, Employee Benefits, includes a number of amendments that range from
fundamental changes to simple clarifications and re-wording. The more significant changes
include the following:
o For defined benefit plans, the ability to defer recognition of actuarial gains and losses has
been removed.
o Objectives for disclosures of defined benefit plans are explicitly stated in the revised
standard, along with new or revised disclosure requirements.
o Termination benefits will be recognized at the earlier of when the offer of termination
cannot be withdrawn or when the related restructuring costs are recognized under
PAS 27, Provisions, Contingent Liabilities and Contingent Assets.
o The distinction between short-term and other long-term employee benefits will be based
on expected timing of settlement rather than the employee’s entitlement of the benefits.
·
PAS 27, Separate Financial Statements (Revised). As a consequence of the new PFRS 10 and
PFRS 12, what remains of PAS 27 is limited to accounting for subsidiaries, jointly controlled
entities, and associates in separate financial statements.
*SGVMC312904*
- 18 ·
PAS 28, Investments in Associates and Joint Ventures. As a consequence of the new PFRS 11
and PFRS 12, PAS 28 has been renamed PAS 28, Investments in Associates and Joint
Ventures, and describes the application of the equity method to investments in joint ventures
in addition to associates.
·
Philippine Interpretation IFRIC 20, Stripping Costs in the Production Phase of a Surface
Mine, applies to waste removal costs that are incurred in surface mining activity during the
production phase of the mine (“production stripping costs”) and provides guidance on the
recognition of production stripping costs as an asset and measurement of the stripping activity
asset.
Effective in 2014
· Amendments to PAS 32, Financial Instruments: Presentation - Offsetting Financial Assets
and Financial Liabilities, clarifies the meaning of “currently has a legally enforceable right to
offset” and also clarify the application of the PAS 32 offsetting criteria to settlement systems
(such as central clearing house systems) which apply gross settlement mechanisms that are not
simultaneous.
Effective in 2015
· PFRS 9, Financial Instruments - Classification and Measurement, as issued reflects the first
phase on the replacement of PAS 39 and applies to classification and measurement of
financial assets and financial liabilities as defined in PAS 39. In subsequent phases, hedge
accounting and impairment of financial assets will be addressed with the completion of this
project expected on the first half of 2012. The adoption of the first phase of PFRS 9 will have
an effect on the classification and measurement of the Company’s financial assets, but will
potentially have no impact on classification and measurements of financial liabilities. The
Company will quantify the effect in conjunction with the other phases, when issued, to present
a comprehensive picture.
Standard Issued but not yet Effective
· Philippine Interpretation IFRIC 15, Agreements for the Construction of Real Estates, covers
accounting for revenue and associated expenses by entities that undertake the construction of
real estate directly or through subcontractors. The interpretation requires that revenue on
construction of real estate be recognized only upon completion, except when such contract
qualifies as construction contract to be accounted for under PAS 11, Construction Contracts,
or involves rendering of services in which case revenue is recognized based on stage of
completion. Contracts involving provision of services with the construction materials and
where the risks and reward of ownership are transferred to the buyer on a continuous basis
will also be accounted for based on stage of completion. The SEC and the Financial
Reporting Standards Council (FRSC) have deferred the effectivity of this interpretation until
the final Revenue standard is issued by IASB and an evaluation of the requirements of the
final Revenue standard against the practices of the Philippine real estate industry is completed.
The Group will quantify the effect when the final Revenue standard is issued.
Additional disclosures required by these amendments will be included in the consolidated
financial statements when these amendments are adopted.
*SGVMC312904*
- 19 -
3. Significant Accounting Judgments, Estimates and Assumptions
The preparation of the consolidated financial statements requires management to make judgments,
estimates and assumptions that affect the amounts reported in the consolidated financial statements
and accompanying notes.
In the opinion of management, these consolidated financial statements reflect all adjustments
necessary to present fairly the results for the period presented. Actual results could differ from
such estimates.
Judgments
In the process of applying the Group’s accounting policies, management has made the following
judgments, apart from those involving estimations, which has the most significant effect on the
amounts recognized in the consolidated financial statements:
Determination of the Group’s functional currency
The Group, based on the relevant economic substance of the underlying circumstances, has
determined its functional currency to be Peso. It is the currency that influences the Group’s sale of
real estate properties and the cost of selling the same.
Classification of financial instruments
The Group classifies a financial instrument, or its component parts, on initial recognition as a
financial asset, a financial liability or an equity instrument in accordance with the substance of the
contractual arrangement and the definitions of a financial asset, a financial liability or an equity
instrument. The substance of a financial instrument, rather than its legal form, governs its
classification in the Group’s consolidated balance sheet.
The Group determines the classification at initial recognition and, where allowed and appropriate,
re-evaluates this designation at every end of reporting period.
Classification of leases - Group as lessor
The Group has entered into property leases of its investment properties where it has determined
that the risks and rewards of ownership are retained with the Group. As such, these lease
agreements are accounted for as operating leases.
The Group determines the classification at initial recognition and, where allowed and appropriate,
re-evaluates this designation at every reporting period.
Classification of real estate properties
The Group determines whether a property is classified as for investments for sale, for future
development and for capital appreciation as follows.
Real estate properties which the Group develops and intends to sell before or on completion of
construction are classified as real estate properties for sale and for future development. Carrying
values of real estate properties for sale and for future development amounted to P
=2,774.38 million
and P
=2,723.43 million as of December 31, 2011 and 2010, respectively (see Notes 8 and 9).
Real estate properties which are not occupied substantially for use by, or in the operations of, the
Group, nor for sale in the ordinary course of business, but are held primarily to earn rental income
and capital appreciation are classified as investment properties. Investment properties amounted
to P
=986.04 million and P
=984.20 million as of December 31, 2011 and 2010, respectively
(see Note 10).
*SGVMC312904*
- 20 Provisions
The Group provides for present obligations (legal or constructive) where it is probable that there
will be an outflow of resources embodying economic benefits that will be required to settle said
obligations. An estimate of the provision is based on known information at the end of reporting
period, net of any estimated amount that may be reimbursed to the Group. If the effect of the time
value of money is material, provisions are discounted using a current pretax rate that reflects the
risks specific to the liability. The amount of provision is being re-assessed at least on an annual
basis to consider new relevant information. There are no provisions recognized in 2011, 2010 and
2009.
Estimates
The key assumptions concerning the future and other key sources of estimation uncertainty at the
end of reporting period, that have a significant risk of causing a material adjustment to the
carrying amounts of assets and liabilities within the next financial year are discussed below:
Determination of fair value of financial instruments
Financial assets and financial liabilities, on initial recognition, are accounted for at fair value. The
fair values of financial assets and financial liabilities, on initial recognition, are normally the
transaction prices. In the case of those financial assets and financial liabilities that have no active
markets, fair values are determined using an appropriate valuation technique.
As of December 31, 2011 and 2010, the carrying values, which is equal to total fair values, of
financial assets amounted to P
=4,184.51 million and P
=4,072.42 million, respectively, while the
carrying values of financial liabilities amounted to P
=2,251.57 million and P
=2,480.21 million,
respectively (see Note 25).
Estimation of allowance for impairment of receivables
The level of this allowance is evaluated by management based on past collection history and other
factors, which include, but not limited to the length of the Group’s relationship with customer, the
customer’s payment behavior and known market factors that affect the collectability of the
accounts. As of December 31, 2011 and 2010, installment contracts receivable and other
receivables aggregated to P
=2,200.18 million and P
=2,198.15 million, respectively. There was no
impairment of receivables in 2011 and 2010 (see Notes 6 and 7).
Impairment of available-for-sale financial assets
An impairment issue arises when there is an objective evidence of impairment, which involves
significant judgment. The Group evaluates the financial health of the issuer, among others. The
Group treats available-for-sale equity financial assets as impaired when there has been a
significant or prolonged decline in the fair value below its cost or where other objective evidence
of impairment exists. The determination of what is “significant” or “prolonged” requires
judgment. The Group treats “significant” generally as 20% or more of cost and “prolonged” as
greater than 12 months for quoted equity securities. In addition, the Group evaluates other factors,
including normal volatility in share price for quoted equities and the future cash flows and the
discount factors for unquoted equities.
In 2010, the Group recognized impairment loss amounting to P
=1.37 million on available-for-sale
investments (see Note 20). No impairment was recognized in 2011.
Available-for-sale financial assets amounted to P
=1.35 million and P
=1.36 million as of
December 31, 2011 and 2010, respectively (see Note 12).
*SGVMC312904*
- 21 Estimation of percentage of completion of projects
The Group estimates the percentage of completion of ongoing projects for purposes of accounting
for the estimated costs of development as well as revenue to be recognized. The percentage of
completion is based on the technical evaluation of the independent project engineers as well as
management’s monitoring of the costs, progress and improvements of the projects. As of
December 31, 2011 and 2010, installment contracts receivable from sales of real estate properties
amounted to P
=2,147.94 million and P
=2,157.87 million, respectively (see Note 6). Gross profit on
sales of real estate properties amounted to P
=603.22 million, P
=488.86 million and P
=645.11 million
in 2011, 2010 and 2009, respectively.
Determination of net realizable value of real estate properties for sale
and held for future development
The Group’s estimates the net realizable value of inventories based on the most reliable evidence
available at the time the estimates are made, or the amount that the inventories are expected to be
realized. These estimates consider the fluctuations of price or cost directly relating to events
occurring after the end of the reporting period to the extent that such events confirm
conditions existing at the end of the period. A new assessment is made of net realizable value in
each subsequent period. When the circumstances that previously caused inventories to be written
down below cost no longer exist or when there is a clear evidence of an increase in net realizable
value because of changes in economic circumstances, the amount of the write-down is reversed so
that the new carrying amount is the lower of the cost and the revised net realizable value. The
Group’s real estate properties for sale and held for future development as of December 31, 2011
and 2010 amounted to P
=2,774.38 million and P
=2,723.43 million, respectively (see Notes 8 and 9).
Estimation of useful lives of investment properties and property and equipment
The Group determines whether its investment properties are impaired when impairment indicators
exist such as significant underperformance relative to expected historical or projected future
operating results and significant negative industry or economic trends. When an impairment
indicator is noted, the Group makes an estimation of the value-in-use of the cash-generating units
to which the assets belong. Estimating the value-in-use requires the Group to make an estimate of
the expected future cash flows from the cash-generating unit and also to choose an appropriate
discount rate in order to calculate the present value of those cash flows. As of December 31, 2011
and 2010, net book value of depreciable investment properties amounted to P
=18.62 million and
=11.09 million, respectively (see Note 10). On the other hand, the carrying value of property and
P
equipment amounted to P
=55.40 million and P
=69.28 million as of December 31, 2011 and 2010,
respectively (see Note 11).
Impairment of investment properties and property and equipment
The Group determines whether its nonfinancial assets such as investment properties and property
and equipment are impaired when impairment indicators exist such as significant
underperformance relative to expected historical or projected future operating results and
significant negative industry or economic trends. This requires an estimation of the value-in-use
of the cash-generating units to which the assets belong. Estimating the value-in-use requires the
Group to make an estimate of the expected future cash flows from the cash-generating unit and
also to choose an appropriate discount rate in order to calculate the present value of those cash
flows. Net book value of investment properties as of December 31, 2011 and 2010 amounted to
=986.04 million and P
P
=984.20 million, respectively (see Note 10). On the other hand, the net book
value property and equipment amounted to P
=55.40 million and P
=69.28 million as of
December 31, 2011 and 2010, respectively (see Note 11).
Impairment loss of P
=16.57 million was recognized in 2006 to reduce the carrying values of certain
investment properties to their recoverable amounts, which is the estimated net selling price. In
*SGVMC312904*
- 22 2010 and 2009, recovery of the impairment loss amounting to P
=0.77 million and
=2.27 million, respectively, was recognized (see Notes 10 and 21). Recoverable amounts of the
P
impaired properties were established as the ultimate estimated selling price based on an
independent valuation by a third party.
Estimation of retirement benefits cost
The determination of the Group’s obligation and costs for retirement benefits depends on
management’s selection of certain assumptions used by actuaries in calculating such amounts.
The assumptions for retirement benefits cost include, among others, discount rates, expected
annual rates of return on plan assets and rates of salary increase. Actual results that differ from
assumptions are accumulated and amortized over future periods and therefore, generally affect the
Group’s recognized expenses and recorded obligation in such future periods. While management
believes that the assumptions are reasonable and appropriate, significant differences in actual
experience or significant changes in management assumptions may materially affect the Group’s
retirement obligations.
Net retirement benefits cost amounted to P
=0.84 million and P
=0.15 million in 2011 and 2010,
respectively, while net retirement benefits income amounted to P
=9.83 million in 2009
(see Note 22). Retirement plan assets as of December 31, 2011 and 2010 amounted to
=10.89 million and P
P
=11.61 million, respectively (see Notes 12 and 22).
Estimation of pre-need reserves
The determination of CPI’s PNR is based on the actuarial formula, methods and assumptions
allowed by applicable SEC circulars. This is dependent on management’s selection of certain
assumptions used by actuaries in computing this amount.
Management believes that the amount of PNR recorded in the books closely reflect potential plan
claims as of end of reporting period. As of December 31, 2011 and 2010, the PNR amounted to
=46.15 million and P
P
=48.39 million, respectively (see Note 5).
The following are the assumptions used in the computation of PNR:
December 31, 2011:
a. Currently-Being-Paid Pension Plans - Actively Paying Plans
Plans issued prior to 2006 - 12 % (hurdle rate) discount rate and no surrender/lapse rates were
used.
Plans issued in 2006 and after - 10% (hurdle rate) discount rate and surrender /lapse rates
were used as per original assumptions.
b. Currently-Being-Paid Pension Plans - Lapsed Plans
Plans issued prior to 2006 - reserves equal the termination values (as originally computed) at
the date of lapse and no reinstatement rate was assumed.
Plans issued in 2006 and after - reserves equal the termination values (as originally computed)
at the date of lapse and no reinstatement rate was assumed.
*SGVMC312904*
- 23 c. Fully paid plans - Availing and Not Yet Availing
Plans with maturity dates in years 2011 to 2015 - 6.0306% discount rate (average rate of
return of the three trustee banks) and no surrender rates were assumed for fully paid plans.
Plans with maturity dates in years 2016 and after - 12% (hurdle rate) discount rate and no
surrender rates were assumed for fully paid plans.
December 31, 2010:
a. Currently-Being-Paid Pension Plans - Actively Paying Plans
Plans issued prior to 2006 - 12 % (hurdle rate) discount rate and no surrender/lapse rates were
used.
Plans issued in 2006 and after - 10% (hurdle rate) discount rate and surrender /lapse rates were
used as per original assumptions.
b. Currently-Being-Paid Pension Plans - Lapsed Plans
Plans issued prior to 2006 - reserves equal the termination values (as originally computed) at
the date of lapse and no reinstatement rate was assumed.
Plans issued in 2006 and after - reserves equal the termination values (as originally computed)
at the date of lapse and no reinstatement rate was assumed.
c. Fully paid plans - Availing and Not Yet Availing
Plans with maturity dates in years 2010 to 2014 - 6.3452% discount rate (average rate of
return of the two trustee banks) and no surrender rates were assumed for fully paid plans.
Plans with maturity dates in years 2015 and after - 12% (hurdle rate) discount rate and no
surrender rates were assumed for fully paid plans.
Recognition of deferred income tax assets
The Group reviews the carrying amounts at the end of each reporting period and reduces deferred
income tax assets to the extent that it is no longer probable that sufficient future taxable profits
will be available to allow deferred income tax assets to be utilized. As of December 31, 2011 and
2010, deferred tax assets amounted to P
=9.36 million and P
=6.07 million, respectively (see Note 23).
4. Cash and Cash Equivalents and Short-term Cash Investments
Cash and cash equivalents consist of:
Cash on hand and in banks
Cash equivalents
2011
P
=14,849,936
1,418,976,163
P
=1,433,826,099
2010
P23,321,291
=
567,671,273
=590,992,564
P
*SGVMC312904*
- 24 Cash in banks earn interest at the respective bank deposit rates. Cash equivalents are made for
varying periods up to three months depending on the immediate cash requirements of the Group,
and earn interest at the respective short-term investment rates.
Short-term cash investments amounting to P
=507.75 million and P
=1,237.45 million as of
December 31, 2011 and 2010, respectively, are investments in banks with maturities of more than
three months to one year from dates of acquisition and earn interest at the prevailing market rates.
Interest income earned from cash and cash equivalents and short-term cash investments amounted
to =
P91.04 million, P
=69.57 million and P
=56.08 million in 2011, 2010 and 2009, respectively
(see Note 19).
5. Investments in Trust Funds
Pursuant to the provisions of SEC Memorandum Circular No. 6, Guidelines on the Management of
the Trust Fund of Pre-Need Corporation (SEC Circular No. 4), the SEC requires, among others,
that companies engaged in the sale of pre-need plans and similar contracts set up a trust fund to
guarantee the delivery of property or performance of service in the future. Withdrawals from
these trust funds are limited to, among others, payments of pension plan benefits, bank charges
and investment expenses in the operation of the trust funds, termination value payable to
planholders, contributions to the trust funds of cancelled plans and final taxes on investment
income of the trust funds.
In accordance with the SEC requirements, CPI had funds deposited with two local trustee banks
amounting to P
=47.14 million and P
=50.12 million as of December 31, 2011 and 2010, respectively.
Total contributions to the trust funds amounted to P
=2.43 million in 2011 and P
=0.75 million in
2010.
Based on the actuarial reports, the required balances of the trust funds as of December 31, 2011
and 2010 amounted to P
=44.22 million and P
=46.04 million, respectively. As of December 31, 2011
and 2010, CPI has trust fund assets amounting to about P
=47.14 million and P
=50.12 million,
respectively (including contributions and related trust fund income of pension holders) and
recorded reserve liabilities (shown in the consolidated balance sheets as “Pre-need and other
reserves” account) of P
=46.50 million and P
=48.79 million, respectively (composed of actuarially
computed liabilities of P
=44.22 million and P
=46.04 million as of December 31, 2011 and 2010,
respectively, other reserves amounting to P
=0.35 million and P
=0.40 million as of
December 31, 2011 and 2010, respectively, and pension bonus owing to pension holders
amounting to P
=1.92 million and P
=2.35 million as of December 31, 2011 and 2010).
In the opinion of management and the independent actuary, CPI’s net contractual liabilities of
about P
=44.22 million and P
=46.04 million as of December 31, 2011 and 2010, respectively, closely
reflect actual potential plan claims as of those dates. In accordance with the Pre-Need New Rules,
should the Insurance Commission discover a deficiency in the trust fund, it shall give notice to
CPI and require CPI to make additional deposits to the trust fund. CPI shall have 30 days from
receipt of notice to make the said deposits and correct the deficiency.
The current portion of pre-need reserves amounted to P
=3.84 million and P
=4.51 million as of
December 31, 2011 and 2010, respectively (see Note 26).
*SGVMC312904*
- 25 The details of CPI’s investments in trust funds as of December 31 are as follows:
2011
Assets
Debt and listed equity securities
Others
Liabilities
P
=26,440,344
19,675,422
46,115,776
(424,093)
P
=45,691,673
2010
=24,989,402
P
24,400,153
49,389,555
(573,084)
=48,816,471
P
6. Installment Contracts Receivable
Installment contracts receivable arise from sales of real estate properties.
The installment contracts receivable on sales of real estate properties are collectible in monthly
installments for periods ranging from one to 10 years and bear monthly interest rates of 0.67% to
2.00% in 2011, 2010 and 2009 computed on the diminishing balance. Interest income earned
from installment contracts receivable amounted to P
=385.66 million, P
=441.83 million and
=451.10 million in 2011, 2010 and 2009, respectively (see Note 19).
P
The portion due within one year amounted to P
=426.08 million and P
=689.24 million as of
December 31, 2011 and 2010, respectively (see Note 26).
The Group and CI entered into a contract of guaranty under Retail Guaranty Line in the amount of
=2,000.00 million in 2010 with Home Guaranty Corporation (HGC) (see Note 14). The amount of
P
installment contracts receivable enrolled by the Group amounted to P
=1,844.00 million and
=2,472.00 million in 2011 and 2010, respectively. The Group paid a guarantee premium of
P
0.90%, based on outstanding principal balance of the receivables enrolled in 2011 and 2010 (see
Note 16).
7. Other Receivables
Other receivables consist of:
Accrued interest
Advances to:
Customers
Contractors
Others (Note 24)
2011
P
=7,158,793
2010
=9,420,798
P
32,255,888
4,289,589
8,531,354
P
=52,235,624
13,051,713
4,350,280
13,457,624
=40,280,415
P
Advances to customers are receivables of the Group for the real estate property taxes of sold units
whereas advances to contractors are advances made by the Group for the contractor’s supply
requirements.
Other receivables include receivables from customers relating to registration and real estate taxes
initially paid by the Company on behalf of the buyers and employees’ advances.
*SGVMC312904*
- 26 Other receivables due within one year amounted to P
=46.17 million and P
=33.47 million as of
December 31, 2011 and 2010, respectively (see Note 26).
8. Real Estate Properties for Sale
Real estate properties for sale consist of cost incurred in the development of condominium units
and residential houses for sale amounting to P
=1,591.55 million and P
=1,669.93 million as of
December 31, 2011 and 2010, respectively.
Real estate properties for sale account includes capitalized interest costs incurred during each year
in connection with the development of the properties amounting to P
=11.57 million, P
=17.67 million
and P
=36.42 million in 2011, 2010 and 2009 respectively (see Notes 14 and 20). The average
capitalization rate used to determine the amount of interest costs eligible for capitalization is
3.86%, 4.07% and 4.97% in 2011, 2010 and 2009, respectively.
As of December 31, 2011 and 2010, some real estate properties for sale of the Group with carrying
value of P
=395.40 million serve as collaterals of loans availed from financial institutions by the
Parent Company and CLDI’s specific credit lines in 2010 (see Note 14).
Shown below are the aggregate cash price values and related aggregate carrying costs of
condominium units and residential houses for sale as of December 31, 2011 and 2010
(in millions).
Aggregate cash price values
Less aggregate carrying costs
Excess of aggregate cash price values over
aggregate carrying costs
2011
P
=4,617
2,637
2010
=5,531
P
3,426
P
=1,980
=2,105
P
Real estate properties for sale includes deemed cost adjustment amounting to P
=170.21 million and
=202.42 million as of December 31, 2011 and 2010, respectively (see Note 15). The deemed cost
P
adjustment arose when the Group transitioned to PFRS in 2005.
9. Real Estate Properties Held for Future Development
Movements in real estate properties held for future development are as follows:
Balance at beginning of the year
Additions
Transfers to real estate properties for sale
Balance at end of the year
2010
2011
P1,127,236,834
P
=1,053,501,489 =
130,741,407
131,270,607
(204,476,752)
(1,942,095)
=1,053,501,489
P
=1,182,830,001 P
Real estate properties held for future development includes land properties reserved by the Group
for its future condominium projects. During 2011 and 2010, the Group transferred portion of its
real estate properties held for future development to its newly launched projects accounted for
under real estate properties for sale.
*SGVMC312904*
- 27 -
10. Investment Properties
Investment properties represent real estate properties for lease consist of:
Land
Costs
Balances at beginning of year
Additions
Reclassification
Balances at end of year
Accumulated Depreciation
Balance at beginning of year
Depreciation for the year
(Notes 16 and 18)
Balance at end of year
Net Book Values
Costs
Balances at beginning of year
Additions
Transfers to real estate properties
for sale
Reversal of impairment loss
(Note 21)
Balances at end of year
Accumulated Depreciation
Balance at beginning of year
Depreciation for the year
(Notes 16 and 18)
Balance at end of year
Net Book Values
P
=973,103,522
6,800,632
(12,488,347)
967,415,807
2011
Building
Total
P
=58,618,046
–
12,488,347
71,106,393
P
=1,031,721,568
6,800,632
–
1,038,522,200
P
=–
P
=47,525,865
P
=47,525,865
–
–
P
=967,415,807
4,960,329
52,486,194
P
=18,620,199
4,960,329
52,486,194
P
=986,036,006
Land
2010
Building
Total
=
P1,009,557,153
343,907
=58,618,046
P
-
=1,068,175,199
P
343,907
(37,564,928)
-
(37,564,928)
767,390
973,103,522
58,618,046
767,390
1,031,721,568
-
42,565,542
42,565,542
=973,103,522
P
4,960,323
47,525,865
=11,092,181
P
4,960,323
47,525,865
=984,195,703
P
The net book values of land include net deemed cost adjustment amounting to
to P
=267.85 million as of December 31, 2011 and 2010 (see Note 15). The deemed cost
adjustment arose when the Group transitioned to PFRS in 2005.
Investment properties are rented out at different rates generally for a one-year term renewable
every year. Rent income from real estate properties for lease amounted to P
=23.08 million,
=15.52 million and P
P
=14.86 million in 2011, 2010 and 2009, respectively.
Based on the appraisal reports by independent firms of appraisers using market data approach at
various dates in 2011 and 2010, the appraised values of these real estate properties are
=1,369.80 million and P
P
=1,308.44 million as of dates of appraisal.
In 2006, impairment loss of P
=16.57 million was recognized to reduce the carrying value of real
estate properties for lease to its recoverable amount. Recovery of the impairment loss was
recognized in 2010 and 2009 amounting to P
=0.77 million and P
=2.27 million, respectively, which
is included under “Other income” account in the consolidated statements of income (see Note 21).
*SGVMC312904*
- 28 Some real estate properties for lease with carrying values of P
=581.76 million were used as
collateral for loans availed by the Group and CI from the omnibus credit line in 2010,
(see Note 14). No loans were availed from omnibus credit line in 2011.
11. Property and Equipment
Property and equipment consist of:
At Cost
Accumulated Depreciation
Balances at beginning of year
Depreciation for the year
(Notes 16 and 18)
Balances at end of year
Net Book Values
At Deemed Cost
Accumulated Depreciation
Balances at beginning of year
Depreciation for the year
(Notes 16 and 18)
Balances at end of year
Net Deemed Cost
Total
Office
Premises
P
=–
2011
Furniture,
Fixtures and Transportation
Office
and Other
Equipment
Equipment
P
=28,530,802
P
=5,715,606
Total
P
=34,246,408
–
27,177,681
3,750,887
30,928,568
–
–
–
259,448,852
736,895
27,914,576
616,226
–
507,235
4,258,122
1,457,484
–
1,244,130
32,172,698
2,073,710
259,448,852
193,489,171
–
–
193,489,171
12,638,300
206,127,471
53,321,381
P
=53,321,381
–
–
–
P
=616,226
–
–
–
P
=1,457,484
12,638,300
206,127,471
53,321,381
P
=55,395,091
Office
Premises
Furniture,
Fixtures and
Office
Equipment
P–
=
-
=28,530,802
P
28,530,802
=4,236,814
P
1,792,428
(313,636)
5,715,606
=32,767,616
P
1,792,428
(313,636)
34,246,408
–
26,086,652
3,634,592
29,721,244
-
1,091,029
27,177,681
1,353,121
429,930
(313,635)
3,750,887
1,964,719
1,520,959
(313,635)
30,928,568
3,317,840
2010
At Cost
Balances at beginning of year
Additions
Disposals
Balances at end of year
Accumulated Depreciation
Balances at beginning of year
Depreciation for the year
(Notes 16 and 18)
Disposal
Balances at end of year
Net Book Values
Transportation
and Other
Equipment
Total
(Forward)
*SGVMC312904*
- 29 -
2010
At Deemed Cost
Accumulated Depreciation
Balances at beginning of year
Depreciation for the year
(Notes 16 and 18)
Balances at end of year
Net Deemed Cost
Total
Office
Premises
=259,448,852
P
Furniture,
Fixtures and
Office
Equipment
=–
P
Transportation
and Other
Equipment
=–
P
Total
=259,448,852
P
180,850,868
–
–
180,850,868
12,638,303
193,489,171
65,959,681
=65,959,681
P
=1,353,121
P
=1,964,719
P
12,638,303
193,489,171
65,959,681
=69,277,521
P
For the office premises, the Group elected to apply the optional exemption under PFRS 1, FirstTime Adoption of PFRS, to use the revalued amount as deemed cost as at January 1, 2005, the date
of transition to PFRS. As of December 31, 2011 and 2010, the balances at pre-PFRS cost of the
office premises as of December 31 are as follows:
Office premises
Less accumulated depreciation
2011
P
=61,858,970
46,672,058
P
=15,186,912
2010
=61,858,970
P
43,605,480
=18,253,490
P
Difference between the net deemed cost and the net pre-PFRS cost amounting to P
=38.13 million
and P
=47.71 million as of December 31, 2011 and 2010, respectively, represents the remaining
balance of the deemed cost adjustment (see Note 15).
The cost of fully depreciated property and equipment amounted to P
=29.74 million and
=24.29 million as of December 31, 2011 and 2010, respectively.
P
12. Other Assets
Other assets consist of:
Available-for-sale financial assets
Retirement plan assets (Note 22)
Deposits and others
2011
P
=1,354,728
10,887,820
14,936,345
P
=27,178,893
2010
P1,356,778
=
11,610,894
24,446,600
=37,414,272
P
Available-for-sale financial assets consist of investments in quoted equity securities. The fair
values of available-for-sale financial assets were determined based on published prices in an active
market.
*SGVMC312904*
- 30 The movement in “Net changes in fair values of available-for-sale financial assets” account
presented in the equity section of the consolidated balance sheets is as follows:
Balance at beginning of year
Mark-to-market gain
Disposals
Impairment loss (Note 20)
Balance at end of year
2011
P
=512,786
8,632
–
–
P
=521,418
2010
=11,078,949
P
156,762
(11,750,260)
1,027,335
=512,786
P
Net changes in fair values of available-for-sale financial assets pertaining to the non-controlling
interests amounted to a net decrease of P
=0.01 million in 2011 and net increase of P
=0.46 million in
2010.
Deposits and others represent payments made by the Group to various utility companies for the
installation of electric and water meters for condominium units still unsold.
The portion of other assets due within one year aggregated to P
=16.01 million and P
=21.85 million
as of December 31, 2011 and 2010, respectively (see Note 26).
13. Accounts Payable and Accrued Expenses
Accounts payable and accrued expenses consist of:
Trade payables
Deposits
Accrued expenses:
Development costs
Director’s fee (Note 24)
Interest payable
Taxes, premiums, others
Withholding taxes payable
Dividends payable
VAT payable
Others (Note 24)
2011
P
=63,810,250
24,469,238
2010
=51,760,498
P
27,345,476
542,275,766
30,879,836
7,794,265
3,119,398
6,426,370
6,301,664
414,822
6,632,537
P
=692,124,146
403,898,176
19,866,781
11,838,107
3,641,138
6,343,238
5,719,183
4,009,007
6,599,868
=541,021,472
P
Trade payables consist of payables to contractors and other counterparties, whereas deposits
consist of rental deposits and collected deposits for water and electric meters of the sold units.
Accrued expenses represent various accrual of the Group for its expenses and real estate projects.
Accrued development costs represent the corresponding accrued expenses for the sold and
completed real estate projects of the Group. Other payables consist of customers’ reservation fees
and employees’ payables.
Accounts payable and accrued expenses due within one year amounted to P
=429.55 million and
=433.45 million as of December 31, 2011 and 2010, respectively (see Note 26).
P
*SGVMC312904*
- 31 -
14. Notes and Loans Payable
The details of notes and loans payable are as follows:
Notes payable:
Short-term promissory notes with varying
maturities and annual interest rates ranging
from 2.19% to 5.39% in 2011 and
2.50% to 5.47% in 2010
Short-term promissory notes enrolled with HGC
with varying maturities and annual interest
rates ranging from 1.70% to 3.40% in 2011
and 2.00% to 3.40% in 2010
Loans payable from financial institutions
with annual average interest rates from 5.41% to
9.25% in 2010
2011
2010
P
=967,050,000
=858,200,000
P
599,410,772
1,566,460,772
1,081,512,998
1,939,712,998
–
P
=1,566,460,772
10,000,000
=1,949,712,998
P
On various dates in 2011 and 2010, the SEC authorized the Group to issue P
=1,200.00 million
worth of STCP registered with the SEC in accordance with the provision of the Securities
Regulation Code and its implementing rules and regulations, the code of Corporate Governance
and other applicable laws and orders. Outstanding STCP issued by the Group as of
December 31, 2011 and 2010 aggregated to P
=967.05 million and P
=858.20 million, respectively.
In 2011 and 2010, the Group entered a contract of guaranty under a Revolving Cash Guaranty
Line with HGC in the amount of P
=1,400.0 million. The guaranty covers the unpaid principal due
on the outstanding STCP and unpaid interest thereon of 10.00% per annum. The guaranty
premium paid was 0.90% per annum based on enrolled commercial papers in 2011 and 2010,
respectively. Outstanding STCP covered by the guaranty amounted to P
=599.41 million and
=1,081.51 million as of December 31, 2011 and 2010, respectively.
P
The Group has omnibus credit line with financial institutions aggregating to about
=2,165.00 million as of December 31, 2011 and 2010, which is available for drawing by any of the
P
companies within the Group.
In addition, the Parent Company and CLDI have specific credit lines as follows (amounts in
millions):
Parent Company
CLDI
2011
P
=200.00
–
P
=200.00
2010
=200.00
P
735.00
=935.00
P
Outstanding balances of loans from financial institutions availed from the omnibus and specific
credit lines for the Parent Company and CLDI as of December 31, 2010 follow (amounts in
millions):
Parent Company
CLDI
=5.00
P
5.00
=10.00
P
*SGVMC312904*
- 32 The Company has no outstanding balances of loans from financial institutions as of
December 31, 2011.
Outstanding balances of loans from financial institutions and carrying values of collaterals as of
December 31 follow (amounts in millions):
Outstanding Loan Balances
2010
2011
Secured
Unsecured
Total
P
=–
–
P
=–
=5.00
P
5.00
=10.00
P
Carrying Values of Collaterals
Description
2011
Group’s real
estate properties
for sale and lease
=418.39
P
–
=418.39
P
2010
=813.80
P
–
=813.80
P
Long-term loans obtained from financial institutions aggregating P
=10.00 million in 2010 which
shall mature at various dates from January 2012 to December 2016, have been fully paid in 2011.
Interest expense related to short-term notes amounted to P
=65.39 million, P
=77.63 million and
=92.77 million in 2011, 2010 and 2009, respectively, while interest expense related to long-term
P
loans amounted to P
=0.30 million, P
=7.78 million and P
=36.93 million in 2011, 2010 and 2009,
respectively (see Note 20). Capitalized interests in 2011, 2010 and, 2009 amounted to
=11.57 million, P
P
=17.67 million and P
=36.42 million, respectively (see Notes 8 and 20).
The portion of notes and loans payable due within one year amounted to P
=1,566.46 million and
=1,939.71 million as of December 31, 2011 and 2010, respectively (see Note 26).
P
15. Equity
a. The following table summarizes the reconciliation of the issued and outstanding shares of
capital stock for each of the following:
Authorized - P
=1 par value
Issued, beginning
Treasury stock
Outstanding
Stock dividends
Treasury stock
Issued, ending
2011
3,000,000,000
2,456,374,741
(3,655,633)
2,452,719,108
490,887,040
2,943,606,148
3,655,633
2,947,261,781
2010
3,000,000,000
2,047,302,220
(3,369,362)
2,043,932,858
409,072,521
2,453,005,379
3,369,362
2,456,374,741
2009
3,000,000,000
1,706,408,129
(3,130,785)
1,703,277,344
340,894,091
2,044,171,435
3,130,785
2,047,302,220
Treasury stock includes 1,717,686 and 1,431,415 shares in 2011 and 2010 held by CPI.
The Company registered with SEC 10,000,000 shares on June 15, 1978 with an initial offer
price of P
=10.00. As of December 31, 2011 and 2010, the Company has 2,947,261,781 shares
held by 746 equity holders and 2,456,374,741 shares held by 714 equity holders, respectively.
*SGVMC312904*
- 33 b. Dividends declared and issued/paid by the Parent Company in 2011, 2010 and 2009 are as
follows:
Dividends
Cash
Stock
Date Approved
May 30, 2011
May 31, 2010
June 1, 2009
June 7, 2011
June 1, 2010
May 28, 2009
Per Share
=0.05
P
0.06
0.10
20%
20%
20%
Stockholders of
Record Date
June 13, 2011
June 30, 2010
June 17, 2009
July 7, 2011
June 11, 2010
June 26, 2009
Date Issued/Paid
July 8, 2011
July 26, 2010
July 13, 2009
August 2, 2011
July 8, 2010
July 22, 2009
Fractional shares of stock dividends were paid in cash based on the par value.
On May 28, 2009, the SEC approved the Amended Articles of Incorporation on the
application for increase in authorized capital stock from P
=1,900.00 million to
=3,000.00 million with a par value of P
P
=1.00 each. The SEC also authorized the issuance of
20% stock dividends declared by the BOD last April 29, 2008 and ratified by the stockholders
on June 3, 2008.
c. As of December 31, 2011 and 2010, the retained earnings attributable to equity holders of the
Parent Company and the non-controlling interest include the remaining balance of deemed
cost adjustment which arose when the Group transitioned to PFRS in 2005.
The components of the net deemed cost adjustment as of December 31 are as follows:
Real estate properties for sale (Note 8)
Investment properties (Note 10)
Property and equipment (Note 11)
Deemed cost adjustment
Deferred tax liability (Note 23)
Net deemed cost adjustment
2011
P
=170,206,549
267,845,684
38,134,466
476,186,699
(142,856,010)
P
=333,330,689
2010
=202,417,452
P
267,845,684
47,706,191
517,969,327
(155,390,798)
=362,578,529
P
The net deemed cost adjustment is allocated in the consolidated statement of changes in equity as
follows:
Attributable to:
Equity holders of the Parent Company
Non-controlling interest
2011
2010
P
=327,386,072
5,944,617
P
=333,330,689
=356,633,912
P
5,944,617
=362,578,529
P
The deemed cost adjustment has yet to be realized through additional depreciation in profit or loss
in case of depreciable assets (classified under property and equipment) and building (classified
under investment properties) and through sales in case of inventory (classified under real estate
properties for sale) and land (classified under investment properties).
*SGVMC312904*
- 34 The balance of retained earnings is restricted for the payment of dividends to the extent of the
Parent Company’s shares of stock held in treasury, net deemed cost adjustment in properties and
undistributed earnings of subsidiaries as follows:
2011
P
=807,101,513
327,386,072
32,405,913
P
=1,166,893,498
2010
=681,228,586
P
356,633,912
32,259,775
=1,070,122,273
P
2011
P
=155,258,575
52,023,492
48,607,854
18,842,759
18,812,757
17,758,594
8,577,753
6,787,361
6,208,824
5,003,000
4,068,586
3,414,874
2,163,449
1,333,493
16,541,620
P
=365,402,991
2010
=128,772,009
P
50,734,646
23,446,269
19,119,585
10,722,583
24,556,583
6,288,535
5,711,863
6,356,320
1,124,695
3,262,808
980,305
1,997,770
319,619
11,270,710
=294,664,300
P
2009
=157,720,436
P
58,838,040
53,612,801
19,089,437
5,592,671
24,580,107
8,496,751
6,447,646
8,733,502
600,000
3,583,855
5,206,224
2,821,905
663,766
16,017,860
=372,005,001
P
2011
P
=61,424,961
40,341,147
2010
=45,569,283
P
44,105,291
2009
=68,484,680
P
45,826,576
53,492,467
P
=155,258,575
39,097,435
=128,772,009
P
43,409,180
=157,720,436
P
Undistributed earnings of subsidiaries
Net deemed cost adjustment in properties
Cost of treasury shares
16. Operating Expenses
Operating expenses consist of:
Personnel (Notes 17 and 22)
Taxes and licenses
Professional fees
Depreciation (Note 18)
Membership dues
Insurance (Notes 6 and 14)
Outside services
Brokers’ commission
Advertising and promotions
Donations
Light, power and water
Repairs and maintenance
Postage, telephone and telegraph
Stationery and office supplies
Others
17. Personnel Expenses
Personnel expenses consist of:
Salaries and wages
Commissions
Bonuses and other employee
benefits (Note 22)
*SGVMC312904*
- 35 -
18. Depreciation
Depreciation consists of:
Investment properties (Note 10)
Property and equipment (Note 11)
2011
P
=4,960,329
13,882,430
P
=18,842,759
2010
=4,960,323
P
14,159,262
=19,119,585
P
2009
=4,960,323
P
14,129,114
=19,089,437
P
2011
2010
2009
P
=385,658,918
=441,830,423
P
=451,102,168
P
90,915,532
123,549
–
1,959,523
36,454
69,351,960
218,632
12,513,759
2,679,984
154,895
55,494,274
590,269
10,516,306
103,380
158,758
–
P
=478,693,976
17,770,241
=544,519,894
P
4,947,533
=522,912,688
P
2011
2010
2009
P
=65,385,026
=77,625,787
P
=92,771,234
P
304,974
65,690,000
7,782,835
85,408,622
36,930,097
129,701,331
(11,574,197)
54,115,803
935,946
55,051,749
1,518,624
(17,671,147)
67,737,475
99,014
67,836,489
1,737,673
(36,420,748)
93,280,583
596,120
93,876,703
2,557,373
–
P
=56,570,373
1,370,236
=70,944,398
P
–
=96,434,076
P
19. Financial Income
Financial income consists of:
Interest income from:
Installment contracts receivable
relating to sales of real estate
(Note 6)
Cash equivalents and short-term
cash investments (Note 4)
Cash in banks (Note 4)
Held-to-maturity investments
Others (Note 24)
Dividend income (Note 12)
Gain on sale of available-for-sale
financial assets
20. Financial Expenses
Financial expenses consist of:
Interest expense on:
Notes payable (Note 14)
Loans payable
(Notes 8 and 14)
Capitalized interest
(Notes 8 and 14)
Others
Finance charges (Note 8)
Impairment loss on available-forsale financial assets (Note 12)
*SGVMC312904*
- 36 -
21. Other Income
Other income consists of:
Trust fund income
Recovery of loss on impairment of
investment properties
(Note 10)
Others
2011
P
=2,213,192
2010
=2,669,444
P
2009
=3,212,279
P
–
19,302,460
P
=21,515,652
767,390
25,128,020
=28,564,854
P
2,267,220
15,521,239
=21,000,738
P
Other income includes premium revenue, penalties for customers’ late payments, forfeiture of
reservations and downpayment on sales which were not consummated, sale of scraps and
miscellaneous income.
22. Retirement Benefits Cost
The Group, jointly with affiliated companies, has funded, noncontributory defined benefit
retirement plan, administered by trustee covering all of its permanent employees.
The latest actuarial valuation report was as of December 31, 2011. The following tables
summarize the components of the net retirement benefits cost (income) recognized in the
consolidated statements of income and the funded status and amounts recognized in the
consolidated balance sheets.
The details of net retirement benefits cost (income), which is included in “Personnel expense”
account, are as follows:
Current service cost
Interest cost on benefit obligation
Expected return on plan assets
Net actuarial loss (gain)
Actuarial loss recognized immediately
Effect of asset limit
Net retirement benefits cost (income)
Actual return on plan assets
2011
P
=1,164,396
2,589,382
(4,832,879)
7,045
12,241,971
(10,328,158)
P
=841,757
P
=134,135
2010
=1,027,984
P
2,238,458
(4,380,680)
8,223
–
1,255,552
=149,537
P
=4,380,680
P
2009
=111,923
P
810,732
(4,020,055)
(764,866)
–
(5,971,803)
(P
=9,834,069)
=3,369,025
P
2010
=24,115,276
P
48,328,791
(24,213,515)
2009
=20,848,834
P
43,806,797
(22,957,963)
The details of the retirement plan assets are as follows:
Defined benefit obligation
Fair value of plan assets
Unrecognized net actuarial
gains (losses)
Amount not recognized because
of limit
Retirement plan assets
2011
P
=52,930,403
48,309,001
4,621,402
(15,509,222)
2,274,463
10,328,158
–
=11,610,894)
(P
=10,887,820) (P
2,266,240
9,072,606
(P
=11,619,117)
*SGVMC312904*
- 37 Changes in present value of defined benefit obligation are as follows:
2011
Defined benefit obligation,
January 1
Current service cost
Interest cost on benefit obligation
Benefits paid
Actuarial losses
Defined benefit obligation,
December 31
2010
2009
P
=24,115,276
1,164,396
2,589,382
(272,608)
25,333,957
=20,848,834
P
1,027,984
2,238,458
–
–
=2,917,883
P
111,923
810,732
(153,034)
17,161,330
P
=52,930,403
=24,115,276
P
=20,848,834
P
2011
P
=48,328,791
4,832,879
118,683
(272,608)
(4,698,744)
2010
=43,806,797
P
4,380,680
141,314
–
–
2009
=40,200,547
P
4,020,055
390,259
(153,034)
(651,030)
P
=48,309,001
=48,328,791
P
=43,806,797
P
Changes in fair value of plan assets are as follows:
Fair value of plan assets, January 1
Expected return on plan assets
Contributions to the plan
Benefits paid
Actuarial losses
Fair value of plan assets,
December 31
The major categories of plan assets of the Group with its affiliated companies as a percentage of
the fair value of net plan assets are as follows:
Cash and cash equivalents
Investments in securities
Receivables
Liabilities
2011
0.00%
8.35%
91.78%
(0.13%)
100.00%
2010
0.47%
15.85%
83.72%
(0.04%)
100.00%
2009
0.06%
36.89%
63.09%
(0.04%)
100.00%
The overall expected return on the plan assets is determined based on the market prices prevailing
on the date applicable to the period over which the obligation is to be settled. There has been no
change in the expected rate of return on plan assets.
The principal assumptions used in determining retirement benefits costs for the Group’s plans are
as follows as of January 1 of each year:
Discount rate per annum
Expected annual rate of return
on plan assets
Future annual increase in salary
2011
10.74%
2010
10.74%
2009
27.78%
10.00%
6.00%
10.00%
6.00%
10.00%
6.00%
As of December 31, 2011, the discount rate is 5.90%, future increase in salary is 6.00% and the
expected annual rate of return on plan assets is 6%.
There are 221, 203 and 209 employees in the plan as of December 31, 2011, 2010 and 2009,
respectively.
*SGVMC312904*
- 38 The present value of defined benefit obligation, fair values of plan assets and experience
adjustments for the current and previous four years are as follows:
Fair value of plan assets
Defined benefit obligation
Surplus (Deficit)
Experience adjustment on plan
liabilities - gain (loss)
Experience adjustment on plan
assets - loss (gain)
2010
=48,328,791
P
24,115,276
24,213,515
2009
=43,806,797
P
20,848,834
22,957,963
–
–
1,467,292
4,698,744
–
2011
P
=48,309,001
52,930,403
(4,621,402)
2008
=40,200,547
P
2,917,882
37,282,665
(239,206)
(651,030)
(674,309)
2007
=36,804,179
P
22,132,726
14,671,453
(144,738)
3,113,190
The Group expects to contribute P
=0.14 million to the retirement fund in 2012.
23. Income Taxes
a. Provision for income tax consists of:
Current
Deferred
Final tax on interest income
2011
P
=129,620,127
(45,129,470)
84,490,657
18,207,815
P
=102,698,472
2010
=167,313,192
P
(54,230,418)
113,082,774
16,416,870
=129,499,644
P
2009
=153,493,086
P
(11,186,090)
142,306,996
13,320,170
=155,627,166
P
b. The components of the net deferred tax liabilities are as follows:
Deferred tax assets:
Accrued expenses and others
Deferred tax liabilities:
Deemed cost adjustment in properties
(Note 15)
Unrealized gain on real estate transactions
Capitalized interest
Retirement plan assets
Net deferred tax liabilities
2011
2010
P
=9,363,034
=6,067,398
P
142,856,010
204,824,514
9,012,512
3,266,346
359,959,382
P
=350,596,348
155,390,798
231,846,341
16,738,698
3,483,268
407,459,105
=401,391,707
P
c. The reconciliation of income tax computed at the statutory tax rate to provision for income tax
follows:
Income tax at statutory tax rate
Additions to (reductions in) income
tax resulting from:
Income entitled to tax holiday
(Note 30)
Tax-exempt interest income
Interest income subjected to
final tax
Final tax on interest income
2011
P
=211,359,853
2010
=213,555,557
P
2009
=220,633,227
P
(68,910,859)
(43,698,374)
(25,680,643)
(58,163,305)
(8,295,401)
(58,256,210)
(27,311,724)
18,207,815
(24,625,305)
16,416,870
(19,980,255)
13,320,170
(Forward)
*SGVMC312904*
- 39 -
Nondeductible interest expense
Nondeductible decrease in
pre-need reserves - net
Trust fund income already
subjected final tax
Nontaxable dividend income
Others - net
Provision for income tax
2010
=7,408,779
P
2009
=5,892,662
P
(671,446)
(1,046,279)
(3,598,647)
(663,958)
(10,934)
6,162,272
P
=102,698,472
(800,833)
(46,468)
2,481,271
=129,499,644
P
(963,684)
(47,627)
6,922,931
=155,627,166
P
2011
P
=8,235,827
For income tax purposes, full revenue recognition for the sale of real estate properties is
applied when more than 25% of the contract price has been collected in the year of sale;
otherwise, the installment method is applied where gain from sales is recognized based on
collection multiplied by the gross profit rates of individual sales contract.
24. Related Party Transactions
Parties are considered to be related if one party has the ability to control, directly or indirectly, the
other party or exercise significant influence over the other party in making financial and operating
decisions. It includes companies in which one or more of the directors and/or shareholder of the
Parent Company either has a beneficial controlling interest or are in a position to exercise
significant influence therein.
The Group discloses the nature of the related party relationship and information about the
transactions and outstanding balances necessary for an understanding of the potential effect of the
relationship on the consolidated financial statements, including, as a minimum, the amount of
outstanding balances and its terms and conditions including whether they are secured, and the
nature of the consideration to be provided in settlement.
The Group, in the normal course of business, has transactions and account balances with related
parties consisting mainly of the following:
a. The Parent Company’s interest-bearing cash advances and non interest-bearing advances for
reimbursable expenses are unsecured and to be settled on cash.
Related Party
CI
Relationship
Parent Company
Year
2011
2010
Interest
Income on
Advances to
Related Parties
P
=66,266
94,425
CLDI
Subsidiary
2011
2010
72,204
122,320
98,217
42,191
1,060,034
780,829
–
37,359
CPI
Subsidiary
2011
2010
–
–
–
–
–
–
–
109,276
Others
Affiliates
2011
2010
2011
2010
146
–
P
=138,616
=216,745
P
–
–
P
=307,360
=92,506
P
–
10,000
P
=1,060,034
=3,750,678
P
–
–
P
=–
=223,440
P
Total
Totals
Interest
Expense on
Advances from
Related Parties
P
=209,143
50,315
Amounts
Owed
by Related
Parties
P
=–
2,959,849
Amounts
Owed
to Related
Parties
P
=–
76,805
An affiliate is an entity under common control of the Parent Company.
*SGVMC312904*
- 40 Parent Company’s transactions with CLDI and CPI are eliminated in the consolidated balance
sheets and statement of income.
Interest income on advances to CI, which is included in “Financial income” account,
amounted to P
=0.07 million in 2011, P
=0.09 million in 2010 and P
=0.07 million in 2009
(see Note 19).
b. The Parent Company also has an existing management contract with CI, wherein CI provides
management services to the Parent Company. The agreement is for a period of five years
renewable automatically for another five years unless either party notifies the other party six
months prior to expiration. The management fee is based on a certain percentage of the net
income as mutually agreed upon by both parties. The management fees for 2011, 2010 and
2009 were waived by CI.
c. The Parent Company’s shares held by members of the BOD aggregated to 721,695,328 and
608,268,938 as of December 31, 2011 and 2010, respectively. On the other hand, shares held
by the ultimate parent and affiliate totaled to 1,486,288,693 and 1,238,573,911 as of
December 31, 2011 and 2010, respectively.
d. The Group, jointly with affiliated companies under common control, has a trust fund for the
retirement plan of their employees. In 2011 and 2010, contributions to the fund amounted to
=0.12 million and P
P
=0.14 million, respectively, while the net fund assets amounted to
=48.31 million and P
P
=48.33 million as of December 31, 2011 and 2010, respectively
(see Note 22).
e. Compensation of key management personnel are as follows:
Salaries
Bonuses
Other benefits
2011
P
=27,745,084
26,044,679
31,890,045
P
=85,679,808
2010
=25,172,183
P
21,911,600
29,621,835
=76,705,618
P
2009
=23,741,227
P
19,520,338
32,065,434
=75,326,999
P
The Group has no standard arrangements with regards to the remuneration of its directors. In
2011, 2010 and 2009, the BOD received a total of P
=28.26 million, P
=23.97 million and
=25.93 million, respectively. Moreover, the Group has no standard arrangement with regards
P
to the remuneration of its existing officers aside from the compensation received or any other
arrangements in the employment contracts and compensatory plan. The Group does not have
any arrangements for stock warrants or options offered to its employees.
25. Financial Instruments
Financial Risk Management Objectives and Policies
The Group’s principal financial instruments comprise cash and cash equivalents, short-term cash
investments, notes payable, bank loans and contracts payable. The main purpose of these financial
instruments is to finance the Group’s operations. The Group’s other financial instruments consist
of financial assets at fair value through profit or loss and available-for-sale financial assets, which
are held for investing purposes. The Group has various other financial instruments such as
installment contracts receivables, other receivables and accounts payable and accrued expenses
which arise directly from its operations.
*SGVMC312904*
- 41 It is, and has been throughout the year under review, the Group’s policy that no trading in
financial instruments shall be undertaken.
The main risks arising from the Company’s financial instruments are market risk (i.e., cash flow
interest rate risk and equity risk), credit risk and liquidity risk. The BOD reviews and approves
policies for managing these risks and they are summarized as follows:
Market risk
Cash flow interest rate risk
Cash flow interest rate risk is the risk that the fair value or future cash flows of a financial
instrument will fluctuate because of changes in market interest rates. The Group’s exposure to the
risk for changes in market interest rates relates primarily to the Group’s short-term and long-term
loans payables, all with repriced interest rates.
The Group’s policy in addressing volatility in interest rates includes maximizing the use of
operating cash flows to be able to fulfill principal and interest obligations even in periods of rising
interest rates.
The following table demonstrates the sensitivity of the Group’s income before income tax to a
reasonably possible change in interest rates based on forecasted and average movements of
interest rates (with all other variables held constant):
December 31, 2011
Change in
Basis Points (bps)
-/+6 bps
Effect on Income
before Income Tax
+/-P
=939,876
December 31, 2010
-/+5 bps
+/-5,000
There is no impact on the Group’s equity other than those already affecting income before
income tax.
Equity price risk
Equity price risk is the risk that the fair values of investments in equity securities will decrease as
a result of changes in the market values of individual shares of stock. The Group is exposed to
equity price risk because of investments held by the Group classified as available-for-sale
financial assets included under “Other assets” in the consolidated balance sheets. The Group
employs the service of a third-party stock broker to manage its investments in shares of stock.
The following table demonstrates the sensitivity analysis of the Group’s equity to a reasonably
possible change in equity price based on forecasted and average movements of equity prices (with
all other variables held constant):
2011
2010
Change in
Equity Price Effect on Equity
+/-P
=0.05
+/-P
=65,599
+/-P
=0.24
+/-P
=322,068
Credit risk
The Group trades only with recognized, creditworthy third parties. Credit risk arises when the
Group will incur a loss because its customers, clients or counterparties failed to discharge their
obligations. It is the Group’s policy that all customers who wish to trade on credit terms are
subject to credit verification procedures. In addition, receivable balances are monitored on an
on-going basis with the objective that the Group’s exposure to bad debts is not significant. The
*SGVMC312904*
- 42 Group’s policy is to enter into transactions with a diversity of creditworthy parties to mitigate any
significant concentration of credit risk. There are no significant concentrations of credit risk
within the Group.
The tables below show the Group’s exposure to credit risk for the components of the consolidated
balance sheets. The exposure as of December 31, 2011 and 2010 is shown at gross, before taking
the effect of mitigation through the use of collateral agreements, and at net, after taking the effect
of mitigation through the use of collateral agreements.
December 31, 2011:
Financial assets at fair value through profit or loss:
Investments in trust funds
Loans and receivables:
Cash and cash equivalents, excluding
cash on hand
Short-term cash investments
Installment contracts receivable
Other receivables:
Accrued interest
Advances to customers
Others
Available-for-sale financial assets
Total credit risk exposure
Gross
Net
P
=45,691,673
P
=–
1,433,659,318
507,750,000
2,147,940,019
628,589,896
411,750,000
–
7,158,793
32,255,888
8,531,354
1,354,728
P
=4,184,341,773
–
11,975,319
794,978
–
P
=1,053,110,193
Gross
Net
=48,816,494
P
=–
P
590,816,871
1,237,450,028
2,157,870,685
352,243,134
1,123,450,000
-
9,420,798
13,051,713
13,457,624
1,356,778
=4,072,240,991
P
12,260,107
326,609
–
P
=1,488,279,850
December 31, 2010:
Financial assets at fair value through profit or loss
Investments in trust funds
Loans and receivables:
Cash and cash equivalents, excluding
cash on hand
Short-term cash investments
Installment contracts receivable
Other receivables:
Accrued interest
Advances to customers
Others
Available-for-sale financial assets
Total credit risk exposure
*SGVMC312904*
- 43 The following tables summarize the aging analysis of receivables:
December 31, 2011:
Past due But Not Impaired
Installment contracts
receivable
Other receivables:
Accrued interest
Advances to customers
Others
Current
< 30 days
31 - 60 days
61- 90 days
Over
90 days
P
= 400,900,318
P
= 8,332,729
P
= 2,061,817
P
= 1,500,809
P
= 13,285,579
P
= 1,721,858,767 P
= 2,147,940,019
7,158,793
20,280,569
5,964,002
P
= 434,303,682
–
–
794,978
P
= 9,127,707
–
712,514
–
P
= 2,774,331
–
468,543
–
P
= 1,969,352
–
10,794,262
–
P
= 24,079,841
–
7,158,793
–
32,255,888
1,772,374
8,531,354
P
= 1,723,631,141 P
= 2,195,886,054
> One year
Total
December 31, 2010:
Past due But Not Impaired
Installment contracts
receivable
Other receivables:
Accrued interest
Advances to customers
Others
Current
< 30 days
31 - 60 days
61- 90 days
Over
90 days
=668,040,506
P
=6,021,207
P
=2,072,655
P
=2,434,109
P
=10,671,600
P
=1,468,630,608 P
P
=2,157,870,685
9,420,798
791,606
10,666,808
=688,919,718
P
–
886,383
326,609
=7,234,199
P
–
540,265
–
=2,612,920
P
–
239
–
=2,434,348
P
–
10,833,220
–
=21,504,820
P
–
9,420,798
–
13,051,713
2,464,207
13,457,624
=
P1,471,094,815 P
=2,193,800,820
> One year
Total
The tables below show the credit quality by class of asset for loan-related balance sheet lines,
based on the Group’s credit rating system:
December 31, 2011:
Financial asset at fair value through profit
or loss
Investments in trust funds
Loans and receivables:
Cash and cash equivalents, excluding
cash on hand
Short-term cash investments
Installment contracts receivable
Other receivables:
Accrued interest
Advances to customers
Others
Total
High Grade*
Medium
Grade**
Past Due but
not Impaired
Total
P
=45,691,673
P
=–
P
=–
P
=45,691,673
1,433,659,318
507,750,000
2,122,759,085
–
–
–
–
–
25,180,934
1,433,659,318
507,750,000
2,147,940,019
7,158,793
20,280,569
7,341,755
4,098,949,520
P
=4,144,641,193
–
–
394,621
394,621
P
=394,621
–
7,158,793
11,975,319
32,255,888
794,978
8,531,354
37,951,231 4,137,295,372
P
=37,951,231 P
=4,182,987,045
** High Grade - financial assets with reputable counterparties and which management believes to be reasonably assured to be
recoverable.
** Medium Grade - financial assets for which there is low risk of default of counterparties.
*SGVMC312904*
- 44 December 31, 2010:
Financial asset at fair value through profit
or loss
Investments in trust funds
Loans and receivables:
Cash and cash equivalents,
excluding cash on hand
Short-term cash investments
Installment contracts
receivable
Other receivables:
Accrued interest
Advances to customers
Others
Total
High Grade*
Medium
Grade**
Past Due but
not Impaired
Total
=48,816,494
P
=–
P
=–
P
=48,816,494
P
590,816,871
1,237,450,028
-
-
590,816,871
1,237,450,028
2,136,671,114
-
21,199,571
2,157,870,685
9,420,798
791,606
12,160,747
3,987,311,164
=4,036,127,658
P
970,268
970,268
=970,268
P
9,420,798
12,260,107
13,051,713
326,609
13,457,624
33,786,287 4,022,067,719
=33,786,287 =
P
P4,070,884,213
** High Grade - financial assets with reputable counterparties and which management believes to be reasonably assured to be
recoverable.
** Medium Grade - financial assets for which there is low risk of default of counterparties.
The main considerations for impairment assessment include whether any payments are overdue or
if there are any known difficulties in the cash flows of the counterparties. The Group assesses
impairment into two areas: individually assessed allowances and collectively assessed allowances.
The Group determines allowance for each significant receivable on an individual basis. Among the
factors that the Group considers in assessing impairment is the inability to collect from the
counterparty based on the contractual terms of the receivables. The Group also considers the fair
value of the real estate collateralized in computing the impairment of the receivables. Receivables
included in the specific assessment are those receivables under the installment contracts receivable
accounts.
For collective assessment, allowances are assessed for receivables that are not individually
significant and for individually significant receivables where there is no objective evidence of
individual impairment. Impairment losses are estimated by taking into consideration the age of the
receivables, past collection experience and other factors that may affect collectability.
No impairment has been recognized because the Group holds the title to the real estate properties
with outstanding installment contracts receivable balance and the Group can repossess such real
estate properties upon default of the customer in paying the outstanding balance.
Liquidity risk
Liquidity risk is defined as the risk that the Group would not be able to settle or meet its
obligations on time or at a reasonable price.
The Group’s objective is to maintain a balance between continuity of funding and flexibility
through the use of STCPs and bank loans (Note 14).
*SGVMC312904*
- 45 The tables below summarize the maturity analysis of the Group’s financial assets held for
managing liquidity and financial liabilities based on contractual undiscounted payments:
December 31, 2011:
30 days
31-90 days
91-180 days
181-360 days
Above 1 year
Total
P
= 1,117,776,099
158,950,000
69,439,932
1,346,166,031
P
= 316,050,000
348,800,000
85,393,976
750,243,976
P
=–
–
94,832,552
94,832,552
P
=–
–
227,122,779
227,122,779
P
=–
–
1,774,269,553
1,774,269,553
P
= 1,433,826,099
507,750,000
2,251,058,792
4,192,634,891
108,869,048
654,803,717
763,672,765
Liquidity Position
P
= 582,493,266
** Excludes statutory liabilities amounting to =
P7,017,664.
** Includes interest expense amounting to =
P 60,465,386.
53,831,452
662,709,547
716,540,999
P
= 33,702,977
112,560,890
292,795,293
405,356,183
(P
= 310,523,631)
147,268,815
16,617,600
163,886,415
P
= 63,236,364
262,576,277
–
262,576,277
P
= 1,511,693,276
685,106,482
1,626,926,157
2,312,032,639
P
= 1,880,602,252
30 days
31-90 days
91-180 days
181-360 days
Above 1 year
Total
=462,892,564
P
393,350,000
58,109,680
914,352,244
=128,100,000
P
700,100,028
79,379,841
907,579,869
=–
P
139,000,000
363,727,274
502,727,274
=–
P
5,000,000
188,023,282
193,023,282
P–
=
1,468,630,608
1,468,630,608
=590,992,564
P
1,237,450,028
2,157,870,685
3,986,313,277
107,100,560
256,565,681
363,666,241
=139,061,033
P
175,994,723
23,519,413
199,514,136
(P
=6,490,854)
107,575,067
10,406,820
117,981,887
=1,350,648,721
P
530,492,656
2,018,624,402
10,406,820
2,559,523,878
=1,426,789,399
P
Financial Assets
Cash and cash equivalents
Short-term cash investments
Installment contract receivable
Financial Liabilities
Accounts payable and accrued
expenses*
Notes payable**
December 31, 2010:
Financial Assets
Cash and cash equivalents
Short-term cash investments
Installment contract receivable
Financial Liabilities
Accounts payable and accrued
expenses*
Notes payable**
Loans payable***
88,659,935
51,162,371
768,786,113
969,753,195
857,446,048
1,020,915,566
Liquidity Position
=56,906,196
P
(P
=113,335,697)
*** Excludes statutory liabilities amounting to =
P10,528,816.
*** Includes interest expense amounting to =
P78,911,404.
*** Includes interest expense amounting to =
P406,820.
Fair Values
The carrying amounts of recorded financial assets and financial liabilities as of December 31 are
as follows:
2010
2011
Financial Assets
Cash on hand
Financial asset at fair value
through profit or loss
Investments in trust funds
Loans and receivables:
Cash in banks and cash equivalents
Short-term cash investments
Installment contracts receivable
Other receivables:
Accrued interest
Advances to customers
Others
Available-for-sale financial assets
Carrying
Value
Fair
Value
Carrying
Value
Fair
Value
P
=166,781
P
=166,781
=175,693
P
=175,693
P
45,691,673
45,691,673
48,816,494
48,816,494
1,433,659,318
507,750,000
2,147,940,019
1,433,659,318
507,750,000
2,147,940,019
590,816,871
1,237,450,028
2,157,870,685
590,816,871
1,237,450,028
2,157,870,685
7,158,793
32,255,888
8,531,354
4,137,295,372
1,354,728
P
=4,184,508,554
7,158,793
32,255,888
8,531,354
4,137,295,372
1,354,728
P
=4,184,508,554
9,420,798
13,051,713
13,457,624
4,022,067,719
1,356,778
=4,072,416,684
P
9,420,798
13,051,713
13,457,624
4,022,067,719
1,356,778
P
=4,072,416,684
(Forward)
*SGVMC312904*
- 46 2010
2011
Financial Liabilities
Other financial liabilities:
Accounts payable and accrued
expenses*
Notes and loans payable
Carrying
Value
Fair
Value
Carrying
Value
Fair
Value
P
=685,106,482
1,566,460,772
P
=2,251,567,254
P
=685,106,482
1,566,460,772
P
=2,251,567,254
=530,492,656
P
1,949,712,998
=2,480,205,654
P
=530,492,656
P
1,949,712,998
P
=2,480,205,654
* Excludes statutory liabilities amounting to P
=7,017,664 and =
P 10,528,816 as of December 31, 2011 and 2010,
respectively.
Cash and cash equivalents, short-term cash investments, other receivables,
and accounts payable and accrued expenses
Due to the short-term nature of the transactions, the fair values of cash and cash equivalents,
short-term cash investments, other receivables and accounts payable and accrued expenses
approximate their carrying amounts.
Financial assets at fair value through profit or loss and available-for-sale financial assets
Financial assets at fair value through profit or loss and available-for-sale financial assets are stated
at fair value based on quoted market prices.
Installment contracts receivable
The fair value of installment contracts receivable cannot be reasonably estimated due to the
significant volume of transactions and the varied terms and maturities.
Notes and loans payable
The fair value of floating rate borrowings is estimated by discounting future cash flows using rates
currently available for debt or similar terms and remaining maturities. The fair value approximates
their carrying values gross of unamortized transaction costs
Fair Value Hierarchy
The Group uses the following hierarchy for determining and disclosing the fair value of financial
instruments by valuation technique:
· Level 1 - quoted (unadjusted) prices in active markets for identical assets or liabilities;
·
Level 2 - other techniques for which all inputs which have a significant effect on the recorded
fair value are observable, either directly or indirectly; and
·
Level 3 - techniques which use inputs which have a significant effect on the recorded fair
value that are not based on observable market data.
As of December 31, 2011 and 2010, the Group’s financial asset measured at fair value under the
Level 1, which consists of available-for-sale financial assets aggregated to P
=1.35 million and
=1.36 million, respectively. There are no available-for-sale financial assets that are measured at
P
Level 2 and 3. The Group does not have transfers of financial instruments from Level 1 to Level 2
and Level 2 to Level 3 in 2011 and 2010.
*SGVMC312904*
- 47 -
26. Current Assets and Current Liabilities
The Group’s current assets and current liabilities:
Current Assets:
Cash and cash equivalents (Note 4)
Short-term cash investments (Note 4)
Investments in trust funds (Note 5)
Installment contracts receivable (Note 6)
Other receivables (Note 7)
Real estate properties for sale (Note 8)
Other assets (Note 12)
Current Liabilities:
Accounts payable and accrued expenses (Note 13)
Notes and loans payable (Note 14)
Income tax payable
Pre-need reserves (Note 5)
2011
2010
P
=1,433,826,099
507,750,000
45,691,673
426,081,252
46,173,659
1,591,546,671
16,005,010
P
=4,067,074,364
=590,992,564
P
1,237,450,028
48,816,494
689,240,077
33,465,928
1,669,928,812
21,846,062
=4,291,739,965
P
P
=429,547,869
1,566,460,772
26,865,178
3,840,320
P
=2,026,714,139
=433,446,405
P
1,939,712,998
46,667,784
4,513,460
=2,424,340,647
P
27. Capital Management
The primary objective of the Group’s capital management is to ensure that it maintains a strong
credit and healthy capital ratios in order to support its business and maximize shareholder value.
The Group manages its capital structure and makes adjustment to it in light of changes in
economic conditions. It monitors its use of capital using leverage ratios on both gross debt and net
debt basis. Debt consists of short-term and long-term debt. Net debt includes short-term and
long-term debt less cash and cash equivalents and short-term cash investments. The Group
considers as capital the total equity less net changes in fair values of available-for-sale financial
assets.
As of December 31, 2011 and 2010, the Group had the following ratios:
Notes and loans payable
Total equity
Less net changes in fair values of
available-for-sale financial assets
Debt to equity ratio
Notes and loans payable
Less:
Cash and cash equivalents
Short-term cash investments
2011
P
=1,566,460,772
2010
=1,949,712,998
P
P
=4,601,113,985
=4,276,898,289
P
521,418
P
=4,600,592,567
0.34
512,786
=4,276,385,503
P
0.46
P
=1,566,460,772
=1,949,712,998
P
1,433,826,099
507,750,000
(P
=375,115,327)
590,992,564
1,237,450,028
=121,270,406
P
*SGVMC312904*
- 48 2011
P
=4,601,113,985
Total equity
Less net changes in fair values of
available-for-sale financial assets
2010
=4,276,898,289
P
512,786
521,418
=4,276,385,503
P
=4,600,592,567 P
0.03
(0.08)
Net debt to equity ratio
As of December 31, 2011 and 2010, the Group has no externally imposed capital requirements.
28. Basic/Diluted Earnings Per Share
Basic/diluted earnings per share amounts were computed as follows:
Net income attributable to equity
holders of the Parent
Weighted average number of shares
Basic/diluted earnings
per share (a/b)
2011
2010
2009
P
=441,337,900
2,945,323,834
=447,868,346
P
2,945,323,834
=513,099,506
P
2,945,323,834
P
=0.15
=0.15*
P
=0.17*
P
* After retroactive effect of 20% stock dividend in 2011.
The Company has no potential dilutive common shares for the years ended December 31, 2011,
2010 and 2009. Thus, the basic and diluted earnings per share are the same as of those dates.
29. Business Segments
The Group derives its revenues primarily from the sale and lease of real estate properties and
marketing of pension plans. The Group does not have any major customers and all sales and
leases of real estate properties and sales of pension plans are made to external customers.
Segment Revenue and Expenses
2011
Sales of Real
Lease of Real
Pension Plan
Estate Properties Estate Properties
Operations
Revenue:
Sales of real estate
Financial income
Rent income
Other income
Cost of sales
Operating expenses:
Personnel
Taxes and licenses
Professional fees
Insurance
Depreciation
Others
Financial expenses
Provision for (benefit from) income tax
Net income
P
=1,574,293,008
475,449,808
–
18,746,298
971,074,045
P
=–
–
23,077,618
–
–
P
=–
3,244,168
–
2,769,354
–
153,571,575
48,156,604
47,840,969
17,757,635
13,882,430
66,563,902
56,570,373
99,260,093
593,811,488
–
3,255,070
–
–
4,960,329
1,123,346
–
4,121,662
9,617,211
1,687,000
611,818
766,885
959
–
5,224,469
–
(683,283)
(1,594,326)
Total
P
=1,574,293,008
478,693,976
23,077,618
21,515,652
971,074,045
155,258,575
52,023,492
48,607,854
17,758,594
18,842,759
72,911,717
56,570,373
102,698,472
601,834,373
*SGVMC312904*
- 49 -
Sales of Real
Estate Properties
Revenue:
Sales of real estate
Financial income
Rent income
Other income
Cost of sales
Operating expenses:
Personnel
Taxes and licenses
Professional fees
Insurance
Depreciation
Others
Financial expenses
Provision for (benefit from) income tax
Net income
=1,454,122,153
P
540,915,543
24,838,114
965,266,466
P–
=
15,520,120
-
=–
P
3,604,351
3,726,740
-
126,854,122
47,514,156
22,439,715
24,555,236
14,159,262
42,954,611
70,944,398
127,863,447
577,324,397
2,890,105
4,960,323
1,333,347
1,900,903
4,435,442
1,917,887
330,385
1,006,554
1,347
3,747,250
(264,706)
592,374
Sales of Real
Estate Properties
Revenue:
Sales of real estate
Financial income
Rent income
Other income
Cost of sales
Operating expenses:
Personnel
Taxes and licenses
Professional fees
Insurance
Depreciation
Others
Financial expenses
Provision for income tax
Net income
2010
Lease of Real
Pension Plan
Estate Properties
Operations
2009
Lease of Real
Pension Plan
Estate Properties
Operations
Total
=1,454,122,153
P
544,519,894
15,520,120
28,564,854
965,266,466
128,772,009
50,734,646
23,446,269
24,556,583
19,119,585
48,035,208
70,944,398
129,499,644
582,352,213
Total
=1,880,570,472
P
518,442,985
–
16,217,493
1,235,462,795
=–
P
–
14,862,065
–
–
=–
P
4,469,703
–
4,783,245
–
=1,880,570,472
P
522,912,688
14,862,065
21,000,738
1,235,462,795
154,932,467
58,502,723
53,300,951
24,580,107
15,745,139
46,524,457
96,434,076
153,918,409
575,829,826
–
149,471
–
–
3,344,298
6,930,052
–
1,331,474
3,106,770
2,787,969
185,846
311,850
–
–
4,709,671
–
377,283
880,329
157,720,436
58,838,040
53,612,801
24,580,107
19,089,437
58,164,180
96,434,076
155,627,166
579,816,925
Sales of Real
Estate
Properties
P
=6,840,810,643
2,628,621,880
Lease of
Real Estate
Properties
P
=986,036,006
5,618,366
Pension Plan
Operations
P
=203,583,428
48,308,589
Total
P
=8,030,430,077
2,682,548,835
Sales of Real
Estate
Properties
=6,781,295,496
P
2,938,444,753
Lease of
Real Estate
Properties
=984,195,703
P
3,190,867
Pension Plan
Operations
=124,236,784
P
45,949,389
Total
=7,889,727,983
P
2,987,585,009
Segment Assets and Liabilities
December 31, 2011:
Total assets
Total liabilities
December 31, 2010:
Total assets
Total liabilities
*SGVMC312904*
- 50 -
30. Income Subject to Income Tax Holiday
The Group has been duly registered by the Board of Investments as a New Developer of Low-cost
Mass Housing Project on a Non-pioneer Status under the Omnibus Investments Code of 1987
(Executive Order No. 226). The Group is entitled to Income Tax Holiday (ITH) for a period of
four years from date of registration or actual start of commercial operations, whichever is earlier.
The ITH is limited only to revenue generated from these registered projects. Revenues from units
with selling price exceeding P
=3.00 million shall not be covered by ITH.
The income (loss) of projects registered under BOI for the year ended December 31, 2011 are as
follows:
CDC - Mandaluyong Executive Mansion III
Income Subject to
Tax Holiday
Revenues from sale of condominium
units
Cost of sales
Gross profit
Other income:
Interest income
Others
Expenses:
Operating expenses
Net income
=155,270,116
P
(72,738,240)
82,531,876
Adjustment due to
Percentage of
Completion
=P
-
Income based on
Percentage of
Completion
=155,270,116
P
(72,738,240)
82,531,876
19,937,565
381,591
20,319,156
-
19,937,565
381,591
20,319,156
23,657,220
=79,193,812
P
P–
=
23,657,220
=79,193,812
P
Income Subject to
Tax Holiday
Adjustment due to
Percentage of
Completion
Income based on
Percentage of
Completion
CDC - Makati Executive Tower IV
Revenues from sale of condominium
units
Cost of sales
Gross profit
Other income:
Interest income
Others
Expenses:
Operating expenses
Financial expenses
Net income
P60,692,661
=
(33,801,617)
26,891,044
=8,055,373
P
161,744
8,217,117
8,576,336
937,194
9,513,530
=25,594,631
P
P28,687,909
=
(28,876,140)
(188,231)
=P
(P
=188,231)
P89,380,570
=
(62,677,757)
26,702,813
=8,055,373
P
161,744
8,217,117
8,576,336
937,194
(9,513,530)
=25,406,400
P
*SGVMC312904*
- 51 CDC - Grand Central Residences
Income Subject to
Tax Holiday
Revenues from sale of condominium
units
Cost of sales
Gross profit
Other income:
Interest income
Others
Expenses:
Operating expenses
Financial expenses
Net income (loss)
=115,870,236
P
(93,051,219)
22,819,017
6,430,604
200,108
6,630,712
15,159,463
240,483
15,399,946
=14,049,783
P
Adjustment due to
Percentage of
Completion
(P
=105,533,116)
84,592,505
(20,940,611)
(P
=20,940,611)
Income based on
Percentage of
Completion
=10,337,120
P
(8,458,714)
1,878,406
6,430,604
200,108
6,630,712
15,159,463
240,483
15,399,946
(P
=6,890,828)
CLDI - Manila Residences Bocobo
Income Subject to
Tax Holiday
Revenues from sale of condominium
units
Cost of sales
Gross profit
Other income:
Interest income
Others
Expenses:
Operating expenses
Financial expenses
Net income
=112,043,827
P
(58,767,728)
53,276,099
Adjustment due to
Percentage of
Completion
P205,206,314
=
(135,272,754)
69,933,560
Income based on
Percentage of
Completion
P317,250,141
=
(194,040,482)
123,209,659
24,973,906
254,602
25,228,508
–
–
–
24,973,906
254,602
25,228,508
15,402,380
1,042,308
16,444,688
=62,059,919
P
–
–
–
=69,933,560
P
15,402,380
1,042,308
16,444,688
=131,993,479
P
The reconciliation of consolidated income for the year ended December 31, 2011 which is entitled
to the ITH from revenue from sale of residential units with selling price not exceeding
=3.00 million to amounts as shown in consolidated statement of income is presented as follows:
P
BOI Registered
Activities
Revenues from sale of condominium
units
Cost of sales
Gross profit
Other income:
Financial income
Rent income
Others
Non-BOI Income As Shown
Registered
In Consolidated
Activities Statement of Income
=572,237,947
P
337,915,193
234,322,754
=1,002,055,061
P
633,158,852
368,896,209
=1,574,293,008
P
971,074,045
603,218,963
59,397,448
998,044
60,395,492
419,296,528
23,077,618
20,517,608
462,891,754
478,693,976
23,077,618
21,515,652
523,287,246
(Forward)
*SGVMC312904*
- 52 -
BOI Registered
Activities
Less:
Operating expenses
Financial expenses
Income before income tax
Provision for income tax
Net income
=62,795,399
P
2,219,985
65,015,384
229,702,862
–
=229,702,862
P
Non-BOI Income As Shown
In Consolidated
Registered
Activities Statement of Income
=302,607,592
P
54,350,388
356,957,980
474,829,983
102,698,472
=372,131,511
P
=365,402,991
P
56,570,373
421,973,364
704,532,845
102,698,472
=601,834,373
P
31. Contingencies
The Group is contingently liable for certain lawsuits or claims filed by third parties which are
either pending decisions by the courts or are under negotiation, the outcomes of which are not
presently determinable. In the opinion of management and its legal counsel, the eventual liability
under these lawsuits or claims, if any, will not have a material effect on the consolidated financial
statements. Hence, no provision for contingencies was recognized as of December 31, 2011 and
2010.
*SGVMC312904*
SyCip Gorres Velayo & Co.
6760 Ayala Avenue
1226 Makati City
Philippines
Phone: (632) 891 0307
Fax:
(632) 819 0872
www.sgv.com.ph
BOA/PRC Reg. No. 0001,
January 25, 2010, valid until December 31, 2012
SEC Accreditation No. 0012-FR-2 (Group A),
February 4, 2010, valid until February 3, 2013
INDEPENDENT AUDITORS’ REPORT
The Stockholders and the Board of Directors
Cityland Development Corporation
2nd Floor, Cityland Condominium 10, Tower I
156 H.V. de la Costa Street
Ayala North, Makati City
We have audited the accompanying consolidated financial statements of Cityland Development
Corporation as at and for the year ended December 31, 2011, on which we have rendered the attached
report dated March 21, 2012.
In compliance with Securities Regulation Code Rule 68, we are stating that the above Company has
744 stockholders owning 100 or more shares each.
SYCIP GORRES VELAYO & CO.
Aileen L. Saringan
Partner
CPA Certificate No. 72557
SEC Accreditation No. 0096-AR-2 (Group A),
March 18, 2010, valid until March 17, 2013
Tax Identification No. 102-089-397
BIR Accreditation No. 08-001998-58-2009,
June 1, 2009, valid until May 31, 2012
PTR No. 3174828, January 2, 2012, Makati City
March 21, 2012
A member firm of Ernst & Young Global Limited
SyCip Gorres Velayo & Co.
6760 Ayala Avenue
1226 Makati City
Philippines
Phone: (632) 891 0307
Fax:
(632) 819 0872
www.sgv.com.ph
BOA/PRC Reg. No. 0001,
January 25, 2010, valid until December 31, 2012
SEC Accreditation No. 0012-FR-2 (Group A),
February 4, 2010, valid until February 3, 2013
INDEPENDENT AUDITORS’ REPORT
The Stockholders and the Board of Directors
Cityland Development Corporation
2nd Floor, Cityland Condominium 10, Tower I
156 H.V. de la Costa Street
Ayala North, Makati City
We have audited in accordance with Philippine Standards on Auditing, the consolidated financial
statements of Cityland Development Corporation and its subsidiaries as at December 31, 2011 and
2010 and for each of the three years in the period ended December 31, 2011, included in this
Form 17-A, and have issued our report thereon dated March 21, 2012. Our audits were made for the
purpose of forming an opinion on the basic financial statements taken as a whole. The schedules listed
in the Index to the Consolidated Financial Statements and Supplementary Schedules are the
responsibility of the Company’s management. These schedules are presented for purposes of
complying with Securities Regulation Code Rule 68, As Amended (2011) and are not part of the basic
financial statements. These schedules have been subjected to the auditing procedures applied in the
audit of the basic financial statements and, in our opinion, fairly state, in all material respects, the
information required to be set forth therein in relation to the basic financial statements taken as a
whole.
Aileen L. Saringan
Partner
CPA Certificate No. 72557
SEC Accreditation No. 0096-AR-2 (Group A),
March 18, 2010, valid until March 17, 2013
Tax Identification No. 102-089-397
BIR Accreditation No. 08-001998-58-2009,
June 1, 2009, valid until May 31, 2012
PTR No. 3174828, January 2, 2012, Makati City
March 21, 2012
*SGVMC312904*
A member firm of Ernst & Young Global Limited
CITYLAND DEVELOPMENT CORPORATION AND SUBSIDIARIES
DECEMBER 31, 2011
Schedule A.
Financial Assets
Name of Issuing Entity and Description of Each Issue
Number of Shares or Principal
Amount of Bonds and Notes
Cash and Cash Equivalents
Cash on hand and in banks
Temporary Investments
Rizal Commercial Banking Corporation
China Bank Corporation
United Coconut Planters Bank
East West Bank
Allied Bank
Planters Development Bank
Security Bank
Union Bank
Amalgamated Bancorporation
Philippine Savings Bank
Philippine National Bank
Bank of Commerce
Banco De Oro
Philippine Commercial Capital Investments
Other maturities during the year
Short-term Cash Investments
Union Bank
Philippine Savings Bank
Planters Development Bank
United Coconut Planters Bank
Philippine Commercial Capital Investments
Amalgamated Bancorporation
Other maturities during the year
Available-for-sale Investments
Ayala Land “B”
Ayala Corporation “B”
First Holding “B”
33,750
903
5,126
Amount Shown in the
Balance Sheet
Value Based on Market
Quotations at Balance
Sheet Date
Income Received and
Accrued
14,849,936
123,549
278,000,000
250,000,000
200,450,000
137,800,000
136,413,716
108,000,000
73,000,000
67,500,000
54,150,000
36,200,000
23,000,000
20,500,000
19,000,000
14,962,447
-1,433,826,099
3,168,618
8,574,163
10,263,449
1,820,214
4,299,701
3,651,097
4,188,260
4,535,087
2,431,454
9,127,359
6,194,302
4,280,887
5,110,220
3,722,234
4,518,535
76,009,129
191,600,000
120,800,000
64,650,000
60,700,000
41,000,000
29,000,000
-507,750,000
3,395,269
3,271,983
1,262,633
2,333,727
158,637
495,174
4,112,529
15,029,952
257,513
210,463
315,249
257,513
210,463
315,249
Swift
Empire East
PLDT
Filinvest Land
Union Bank
Empire East
1,866
300,301
74
1,445
415
300,301
Investments in Trust Funds
Installment Contract Receivables
Others Receivables
220
177,177
188,108
1,430
27,390
177,178
1,354,728
45,691,673
2,147,940,019
47,946,035
4,184,508,554
220
177,177
188,108
1,430
27,390
177,178
1,354,728
45,691,673
2,147,940,019
47,946,035
4,184,508,554
Schedule C. Amounts Receivable from Related Parties which are Eliminated during Consolidation of Financial Statements
Name and
Designation of Debtor
CI (parent company)
CLDI (subsidiary)
CPI (subsidiary)
CAI (affiliate)
CLHI (affiliate)
Balance at
beginning of period
2,959,849
780,829
-10,000
Additions
9,807,085
29,357,889
60,215
1,385
109
Amounts collected
12,766,934
29,078,684
60,215
11,385
109
Amounts
written-off
------
Current
-1,060,034
----
Non-current
-----
Balance at
end of period
-1,060,034
----
Parent Company’s transactions with CDC, CLDI, CPI, CAI and CLHI are eliminated in the consolidated balance sheets.
Schedule H.
Capital Stock
Title of Issue
Common Stock – P1 par value
Number of Shares
Authorized
3,000,000,000
Number of Shares
Issued and
Outstanding
2,945,323,834
Number of Shares
Reserved for Options,
Warrants, Conversion
and Other Rights
--
Number of Shares Held By
Affiliates
Directors, Officers
and Employees
1,486,288,693
739,419,963
Others
719,615,178
Annex “A”
CITYLAND DEVELOPMENT CORPORATION
RETAINED EARNINGS AVAILABLE FOR DIVIDEND DECLARATION
AS OF DECEMBER 31, 2011
The SEC issued Memorandum Circular No. 11 series of 2008 on December 5, 2008, which provides guidance
on the determination of retained earnings available for dividend declaration.
The table below presents the reconciliation of retained earnings available for dividend declaration as of
December 31, 2011:
Unappropriated, Retained Earnings as restated, beginning
Adjustments: net of tax
Deferred tax assets
Unrealized deemed cost adjustment on real estate properties
Treasury shares
Unappropriated, Retained Earnings available for dividend declaration, beg.
Net income during the period closed to retained earnings
Add (Less): Non-actual / unrealized loss (income) net of tax
Deemed cost adjustment on real estate properties realized through
depreciation and sale
Movement in deferred tax assets
Net income actually earned during the period
Add (Less):
Dividends declarations during the period
Unappropriated, Retained Earnings Available for Dividends
Declaration, Ending
1,157,736,169
(3,442,139)
(350,753,152)
(28,524,728)
(382,720,019
775,016,150
330,134,054
34,913,731
(1,378,505)
363,669,280
(613,609,198)
525,076,232
Annex “B”
CITYLAND DEVELOPMENT CORPORATION
MAP OF THE RELATIONSHIPS OF THE COMPANIES WITHIN THE GROUP
CITYLAND, INC. (CI)
(ultimate parent)
100.00%
↓
100.00%
↓
CREDIT & LAND HOLDINGS,
INCORPORATED (CLHI)
(subsidiary of CI)
CITYADS, INC. (CAI)
(subsidiary of CI)
50.40%
CITYLAND DEVELOPMENT CORPORATION (CDC)
(subsidiary of CI)
29.54%
CITY & LAND DEVELOPERS,
INCORPORATED (CLDI)
(subsidiary of CDC)
9.18%
49.73%
90.81%
CITYPLANS, INCORPORATED (CPI)
(subsidiary of CDC)
“Annex C”
CITYLAND DEVELOPMENT CORPORATION
SUPPLEMENTARY SCHEDULE OF ALL EFFECTIVE
STANDARDS AND INTERPRETATIONS (PART 1, 4J)
List of Philippine Financial Reporting Standards (PFRSs) [which consist of PFRSs, Philippine Accounting
Standards (PASs) and Philippine Interpretations] and Philippine Interpretations Committee (PIC) Q&As
effective as of December 31, 2011:
PFRSs and PIC Q&As
PFRS 1, First-time Adoption of Philippine Financial
Reporting Standards
PFRS 2, Share-based Payment
PFRS 3, Business Combinations
PFRS 4, Insurance Contracts
PFRS 5, Non-current Assets Held for Sale and Discontinued
Operations
PFRS 6, Exploration for and Evaluation of Mineral Resources
PFRS 7, Financial Instruments: Disclosures
PFRS 8, Operating Segments
PAS 1, Presentation of Financial Statements
PAS 2, Inventories
PAS 7, Statement of Cash Flows
PAS 8, Accounting Policies, Changes in Accounting
Estimates and Errors
PAS 10, Events after the Reporting Period
PAS 11, Construction Contracts
PAS 12, Income Taxes
PAS 16, Property, Plant and Equipment
PAS 17, Leases
PAS 18, Revenue
PAS 19, Employee Benefits
PAS 20, Accounting for Government Grants and Disclosure
of Government Assistance
PAS 21, The Effects of Changes in Foreign Exchange Rates
PAS 23, Borrowing Costs
PAS 24, Related Party Disclosures
PAS 26, Accounting and Reporting by Retirement Benefit
Plans
PAS 27, Consolidated and Separate Financial Statements
PAS 28, Investments in Associates
PAS 29, Financial Reporting in Hyperinflationary Economies
PAS 31, Interests in Joint Ventures
PAS 32, Financial Instruments: Presentation
PAS 33, Earnings per Share
PAS 34, Interim Financial Reporting
PAS 36, Impairment of Assets
PAS 37, Provisions, Contingent Liabilities and Contingent
Assets
PAS 38, Intangible Assets
PAS 39, Financial Instruments: Recognition and
Measurement
PAS 40, Investment Property
PAS 41, Agriculture
Philippine Interpretation IFRIC–1, Changes in Existing
Decommissioning, Restoration and Similar Liabilities
Philippine Interpretation IFRIC–2, Members' Shares in Co-
Adopted/Not adopted/Not applicable
Not Applicable
Not Applicable
Not Applicable
Not Applicable
Not Applicable
Not Applicable
Adopted
Adopted
Adopted
Adopted
Adopted
Adopted
Adopted
Not Applicable
Adopted
Adopted
Adopted
Adopted
Adopted
Not Applicable
Adopted
Adopted
Adopted
Not Applicable
Adopted
Not Applicable
Not Applicable
Not Applicable
Adopted
Adopted
Adopted
Adopted
Adopted
Not Applicable
Adopted
Adopted
Not Applicable
Not Applicable
Not Applicable
PFRSs and PIC Q&As
operative Entities and Similar Instruments
Philippine Interpretation IFRIC–4, Determining whether an
Arrangement contains a Lease
Philippine Interpretation IFRIC–5, Rights to Interests arising
from Decommissioning, Restoration and Environmental
Rehabilitation Funds
Philippine Interpretation IFRIC–6, Liabilities arising from
Participating in a Specific Market - Waste Electrical and
Electronic Equipment
Philippine Interpretation IFRIC–7, Applying the Restatement
Approach under PAS 29 Financial Reporting in
Hyperinflationary Economies
Philippine Interpretation IFRIC–9, Reassessment of
Embedded Derivatives
Philippine Interpretation IFRIC–10, Interim Financial
Reporting and Impairment
Philippine Interpretation IFRIC–12, Service Concession
Arrangements
Philippine Interpretation IFRIC–13, Customer Loyalty
Programmes
Philippine Interpretation IFRIC–14, PAS 19 - The Limit on a
Defined Benefit Asset, Minimum Funding Requirements and
their Interaction
Philippine Interpretation IFRIC–16, Hedges of a Net
Investment in a Foreign Operation
Philippine Interpretation IFRIC–17, Distributions of Non-cash
Assets to Owners
Philippine Interpretation IFRIC–18, Transfers of Assets from
Customers
Philippine Interpretation IFRIC–19, Extinguishing Financial
Liabilities with Equity Instruments
Philippine Interpretation SIC–7, Introduction of the Euro
Philippine Interpretation SIC–10, Government Assistance - No
Specific Relation to Operating Activities
Philippine Interpretation SIC–12, Consolidation - Special
Purpose Entities
Philippine Interpretation SIC–13, Jointly Controlled Entities Non-Monetary Contributions by Venturers
Philippine Interpretation SIC–15, Operating Leases –
Incentives
Philippine Interpretation SIC–21, Income Taxes - Recovery of
Revalued Non-Depreciable Assets
Philippine Interpretation SIC–25, Income Taxes - Changes in
the Tax Status of an Entity or its Shareholders
Philippine Interpretation SIC–27, Evaluating the Substance of
Transactions Involving the Legal Form of a Lease
Philippine Interpretation SIC–29, Service Concession
Arrangements: Disclosures
Philippine Interpretation SIC–31, Revenue - Barter
Transactions Involving Advertising Services
Philippine Interpretation SIC–32, Intangible Assets - Web Site
Costs
PIC Q&A No. 2006-01: PAS 18, Appendix, paragraph 9 –
Revenue recognition for sales of property units under precompletion contracts
PIC Q&A No. 2006-02: PAS 27.10(d) – Clarification of
criteria for exemption from presenting consolidated financial
statements
PIC Q&A No. 2007-03: PAS 40.27 – Valuation of bank real
Adopted/Not adopted/Not applicable
Adopted
Not Applicable
Not Applicable
Not Applicable
Not Applicable
Adopted
Not Applicable
Not Applicable
Adopted
Not Applicable
Adopted
Not Applicable
Adopted
Not Applicable
Not Applicable
Not Applicable
Not Applicable
Not Applicable
Adopted
Not Applicable
Not Applicable
Not Applicable
Not Applicable
Not Applicable
Adopted
Adopted
Not Applicable
PFRSs and PIC Q&As
and other properties acquired (ROPA)
PIC Q&A No. 2008-01 (Revised): PAS 19.78 – Rate used in
discounting post-employment benefit obligations
PIC Q&A No. 2008-02: PAS 20.43 – Accounting for
government loans with low interest rates under the
amendments to PAS 20
PIC Q&A No. 2009-01: Framework.23 and PAS 1.23 –
Financial statements prepared on a basis other than going
concern
PIC Q&A No. 2010-01: PAS 39.AG71-72 – Rate used in
determining the fair value of government securities in the
Philippines
PIC Q&A No. 2010-02: PAS 1R.16 – Basis of preparation of
financial statements
PIC Q&A No. 2011-01: PAS 1.10(f) – Requirements for a
Third Statement of Financial Position
Adopted/Not adopted/Not applicable
Not Applicable
Not Applicable
Not Applicable
Adopted
Adopted
Adopted
INDEX TO EXHIBITS
Form 17-A
No.
Page No.
(3)
Plan of Acquisition, Reorganization, Arrangement, Liquidation, or
Succession
*
(5)
Instrument Defining the Rights of Security Holders, Including Indentures
*
ARTICLE IV :
ARTICLE V :
ARTICLE VII :
ARTICLE VIII :
CERTIFICATE OF STOCK
TRANSFER OF SHARES OF STOCK
STOCKHOLDERS MEETING
AMENDMENTS
102
102
102
103
(8)
Voting Trust Agreement
*
(9)
Material Contracts
*
(10)
Annual Report to Security Holders, Form 11-Q or Quarterly Report to
Security Holders
*
(13)
Letters re Change in Certifying Accountant
*
(16)
Report Furnished to Security Holders
*
(18)
Subsidiaries of the Registrant
(19)
Published Report Regarding Matters Submitted to Vote of Security Holders
*
(20)
Consent of Experts and Independent Counsel
*
(21)
Power of Attorney
*
(29)
Additional Exhibits
*
* These exhibits are either not applicable to the Company or require no answer.
103
ARTICLE IV
CERTIFICATE OF STOCK
Each stockholder whose share of stock has been paid in full shall be entitled to a stock certificate or
certificates for such shares of stock.
The certificate of stock shall be in such form and design as may be determined by the Board of
Directors. Every certificate shall be signed by the President and countersigned by the Secretary and shall be
sealed with the Corporate seal and shall state on its face its number, the date of issue, the number of shares for
which it was issued, and the name of the person in whose favor it was issued.
Each share of stock will represent a pro-rate equity in the assets of the Corporation and the rights
represented in each and every share of stock shall be identical in all respects and shall be stated herein.
The stockholders shall have no pre-emptive right to subscribe to any issue or disposition of shares of
any class and all the stockholders, their transferees and/or assignees take the shares subject to this condition.
ARTICLE V
TRANSFER OF SHARES OF STOCK
Shares of stock shall be transferred by delivery of the certificate endorsed by the owner or his attorneyin-fact or other person legally authorized to make the transfer, but no transfer shall be valid except as between
the parties until the transfer is annotated in the books of the Corporation.
No surrendered certificate shall be cancelled by the Secretary before a new certificate in lieu thereof is
issued, and the Secretary shall keep the cancelled certificate as a proof of substitution. Any person claiming a
certificate of stock to be lost or destroyed shall make an affidavit of that fact and shall advertise the same in
such manner as the Board may require, and shall give the Corporation a bond of indemnity, in the form and with
the sureties satisfactory to the Board, in the sum at least double the par value of such certificate in lieu of the
one alleged to be lost or destroyed, always subject to the approval of the Board, and provided further that the
requirements of Republic Act No. 201 are first complied with.
ARTICLE VII
STOCKHOLDERS’ MEETING
1.
Place – All meetings of the stockholders shall be held at the principal office of the Corporation, unless
written notices of such meetings should fix another place within the City of Manila.
2. Proxy – Stockholders may vote at all meetings either in person or by proxy. All proxies, voting trusts, and
other voting arrangements must be received by the Corporate Secretary or the Assistant Corporate Secretary
at the corporation's head office not later than five (5) working days before the date of the meeting. Before
the deadline such proxies, voting trusts and other voting arrangements may be accepted or rejected by a
special committee of inspectors if they do not have the appearance of prima facie authenticity.
3.
Quorum – No stockholders’ meeting shall be competent to decide any matter or to transact any business
unless a majority of the subscribed capital stock is present or represented thereat, except in those cases in
which the Corporation law requires the affirmative vote of a greater proportion.
4.
Vote – Voting upon all questions at all meetings of the stockholders shall be by shares of stock and not per
capital.
5.
Annual Meeting – The annual meeting of the stockholders shall be held on the first Tuesday of June of each
calendar year, when the Board of Directors shall be elected by plurality of votes by ballot system or viva
voce.
Written notice of the annual meeting of the Corporation shall be sent to each registered stockholder at least
fifteen (15) working days prior to the date of such meeting. Waiver of such notice may only be made in
writing.
Only stockholders of record at the close of business hours thirty (30) calendar days prior to the date of such
meeting shall be entitled to receive the notice of said meeting and to vote and be voted thereat.
6.
Special Meeting – Special meetings of the stockholders may be called by the President at his discretion, or
on demand of stockholders holding the majority of the subscribed capital stock of the Corporation.
A written notice stating the day and place of the meeting and the general nature of the business to be
transacted shall be sent to each stockholder at least fifteen (15) working days before the date of such
special meeting; provided, that this requisite may be waived in writing by the stockholders.
Only stockholders of record at the close of business hours thirty (30) calendar days prior to the date of such
meeting shall be entitled to receive the notice of said meeting and to vote and be voted thereat.
7.
Minutes – Minutes of all meeting of the stockholders shall be kept and carefully preserved as a record of the
business transacted at such meetings. The minutes shall contain such entries as may be required by law.
ARTICLE VIII
AMENDMENTS
The provisions of these By-Laws may be amended or repealed by a majority vote of the Board of
Directors and the owners of at least a majority of the outstanding capital stock at a regular or special meeting
called for the purpose.
The power to amend or repeal these By-Laws may be delegated to the Board of Directors in the manner
provided by law.
EXHIBIT 18
SUBSIDIARIES OF THE REGISTRANT
Cityland Development Corporation has one (1) majority-owned subsidiaries, as follow:
Name
Jurisdiction
CITYPLANS, INC.
Philippines
2
COVER SHEET
7 7 8 2 3
SEC Registration Number
C I T Y L A N D
D E V E L O P ME N T
C O R P O R A T I O N
A N D
S U B S I D I A R I E S
(Company’s Full Name)
1 5 6
H . V .
D E L A
C O S T A
S T . ,
,
S A L C E D O
V I L L A G E ,
MA K A T I
C I T Y
(Business Address: No. Street City/Town/Province)
Rufina C. Buensuceso
893 – 6060
Contact Person
1 2
3 1
Month
Day
Fiscal Year
Company Telephone Number
1 7 - Q
FORM TYPE
Month
Day
Annual Meeting
(Secondary License Type, If Applicable)
C F D
Dept. Requiring this Doc.
Amended Articles Number / Section
Total Amount of Borrowings
Total No. of Stockholders
Domestic
Foreign
----------------------------------------------------------------------------------------------------------------------To be accomplished by SEC Personnel concerned
File Number
LCU
Document ID
Cashier
STAMPS
Remarks = pls. use black ink for scanning purposes
0
SECURITIES AND EXCHANGE COMMISSION
SEC FORM 17- Q
QUARTERLY REPORT PURSUANT TO SECTION 17
OF THE SECURITIES REGULATION CODE AND SECTION 141
OF THE CORPORATION CODE OF THE PHILIPPINES
1. For the fiscal year ended September 30, 2012
2. SEC Identification Number 77823
4.
3. BIR Tax Identification No. 000-527-103
CITYLAND DEVELOPMENT CORPORATION
Exact name of issuer as specified in its charter
5. Makati City, Philippines
Province, country or other jurisdiction
of incorporation
7.
6.
(SEC Use Only)
Industry Classification Code
2/F Cityland Condominium 10 Tower 1,
#156 H.V. Dela Costa St., Salcedo Village, Makati City
Address of Principal Office
1226
Postal Code
8.
(632)-893-60-60
Issuer's telephone number, including area code
9.
Former name, former address and former fiscal year, if changed since last report N/A
10. Securities registered pursuant to Sections 8 and 12 of the SRC, or Sec. 4 and 8 of the RSA
Title of Each Class
Unclassified Common Shares
Number of Shares of Common Stock Outstanding
3,239,855,939
11. Are any or all of these securities listed on a Stock Exchange.
Yes [ x ]
No [ ]
If yes, state the name of such stock exchange and the classes of securities listed therein:
Stock Exchange
Philippine Stock Exchange
Title of Each Class
Unclassified Common Shares
12. Check whether the issuer:
(a) Has filed all reports required to be filed by Section 17 of the SRC and SRC Rule 17 thereunder or Section
11 of the RSA and RSA Rule 11(a)-1 thereunder, and Sections 26 and 141 of the Corporation Code of the
Philippines during the preceding twelve (12) months (or for such shorter period that the registrant was
required to file such reports):
Yes [ x ]
No [ ]
(b) Has been subject to such filing requirements for the past 90 days.
Yes [ x ]
No [
]
1
PART I - FINANCIAL INFORMATION
Item 1. Financial Statements
The financial statements and accompanying notes are filed as part of this form (pages 5 to 23).
Item 2. Management’s Discussion and Analysis of Financial Condition and Results of Operations
On July 2012, the Company (CDC) launched Pines Peak Tower 1, a 27-storey residential condominium located at
Union corner Pines St., Barangka, City of Mandaluyong. Also, on June 2012, the Company’s subsidiary, City &
Land Developers, Inc. (CLDI) turned over, one year ahead of schedule, Manila Residences Bocobo, a 34-storey
office, commercial and residential condominium located in Jorge Bocobo St., Ermita, Manila City. CLDI is now
selling its remaining unsold units.
The Company and its subsidiaries are pre-selling the following on-going projects:
Grand Central Residences, a 40-storey office, commercial and residential condominium located at EDSA corner
Sultan St., Mandaluyong City, a project of CDC.
Makati Executive Tower IV, a 29-storey office, commercial and residential condominium located at Cityland
Square, Senator Gil Puyat Avenue, Pio del Pilar Makati City, a project of CDC.
Also, the Company and its subsidiaries are selling the following completed and operational projects:
Grand Emerald Tower, a 39-storey commercial, office and residential condominium located along Emerald corner
Ruby and Garnet Streets, Ortigas Center, Pasig City, a project of CLDI.
Makati Executive Tower III, a 37-storey office, commercial and residential condominium located at Cityland
Square, Senator Gil Puyat Avenue, Pio del Pilar Makati City, a project of CDC.
Mandaluyong Executive Mansion III, a residential condominium located at Mandaluyong Executive Mansion
Subdivision, G. Enriquez St., Brgy. Vergara, Mandaluyong City, a project of CDC.
Oxford Mansion, an 8-storey commercial and residential condominium located along Evangelista St., New Santolan,
Pasig City, a joint project of Cityplans, Inc. (CPI), a subsidiary of CDC and Cityland, Inc. (CI).
Windsor Mansion, an 8-storey commercial and residential condominium located at New Santolan, Pasig City, a joint
project of CPI and CI.
The Company has also a number of prime lots reserved for future projects. Its land bank is situated in strategic
locations ideal for horizontal and vertical developments.
Internal sources come from sales of condominiums and real estate projects, collection of installment receivables,
maturing short-term investments and other sources such as rental income, interest income and dividend income.
External sources come from SEC-registered commercial papers and Home Guaranty Corporation’s guaranteed
promissory notes.
The estimated development cost of P
=307.93 million as of September 30, 2012 representing the cost to complete the
development of real estate projects sold will be sourced through:
a)
b)
c)
d)
e)
Sales of condominium and real estate projects
Collection of installment receivables
Maturing short-term investments
Issuance of commercial papers
Availment of bank lines (bank lines as of September 30, 2012 amounted to =
P2.515 billion of which =
P2.515
billion is still unavailed).
Financial Condition (September 30, 2012 vs. December 31, 2011)
Total assets amounted to P
=8.226B as of the third quarter of 2012 as compared with the previous year’s ending
balance of P
=8.030B. Cash and cash equivalents stood at =
P2.163B as of September 2012, derived from net operating
activities, proceeds from loans and shift of funds to shorter term period investments. Although cash and cash
equivalents increased by 50.88%, total assets slightly increased by 2.44% due to the decrease in installment contracts
receivable, real estate properties for sale, investment properties and short term cash investments. Collection of
receivables decreased installment contracts receivables and sales of real estate properties decreased real estate
properties for sale. The launching of a project in July 2012 also decreased investment properties due to reclass of lot
to real estate properties for sale.
2
On the liabilities side, the Company’s payment of accounts payable and accrued expenses, income tax payable and
deferred tax liabilities resulted to the reduction of liabilities. However, loans and notes payable increased due to
additional issuance of notes payable, while increase in contracts payable was due to purchase of a property resulting
to a 2.16% reduction in total liabilities. Total stockholders’ equity stood at =
P5.602B as of September 30, 2012
higher by 4.75% from 2011 year end balance of =
P5.348B due to net income of =
P383.56M less cash dividends of =
P
138.45M plus other adjustment of P
=9.00M. As a result of the foregoing, the Company’s liquidity position improved
with acid-test and current ratio at 1.53:1 and 2.26:1 as of the third quarter of 2012 as compared to 1.21:1 and 2.01:1
in December 2011, respectively. Debt-equity ratio is also improved to 0.37:1 as of the third quarter of 2012, as
compared with 0.42 as of the same period of the previous year.
Results of Operation (September 30, 2012 vs. September 30, 2011)
Total revenues reached P
=1.377B as compared with last year’s figure of =
P1.473B. The decrease can be attributed to
lower sales of the subsidiary, CLDI because of the decrease of inventory of the condominium project, Grand
Emerald Tower as of December 2011. This project was already sold at 86.50% last year. On the cost side, lower
sales decreased cost of sales and operating expenses and income tax. Financial expenses decrease due to lower
interest rates. Altogether, the financial performance as of September 30, 2012 resulted to a net income of =
P383.56M
compared to the previous year of P
=404.91M. This translated to earnings per share and return on equity (both
annualized) of P
=0.11 and 7.56% as compared to the previous year of =
P0.12 and 9.07%, respectively.
Financial Soundness Indicators
Earnings per share *
Return on equity *
Acid-test ratio
Current ratio
Interest rate coverage ratio
Asset to equity ratio
Debt-equity ratio
September 2012
=0.11
P
7.56%
1.53
2.26
15.14
1.72
0.37
December 2011
=0.14
P
9.59%
1.21
2.01
14.14
1.75
0.34
September 2011
=0.12
P
9.07%
1.24
1.95
13.21
1.78
0.42
* annualized
Note: Earnings per share and return on equity are after retroactive effect of 10% stock dividends in 2012.
Manner of calculations:
Earnings per share
=
Return on equity
=
Acid – test ratio
=
Current ratio
Interest rate coverage ratio
=
=
Asset to equity ratio
=
Debt – equity ratio
=
____Net Income attributable to Equity Holders of Parent____
Average Number of Shares Issued and Outstanding
___ Net Income attributable to equity holders________
Total Stockholder’s Equity (Net of Minority Interest)
Cash and cash equivalents + Short-term Cash Investments + Financial Assets at Fair
Value Through Profit and Loss + Installment Contracts Receivable + Other Receivables
Total Current Liabilities
Total Current Assets / Total Current Liabilities
Net income before tax + Interest Expense + Depreciation Expense
Interest Expense
Total Assets
Stockholder’s Equity (net of Net Changes in Fair Value of AFS Investment)
Loans & Notes Payable___________________
Total Stockholder’s Equity (net of Net Changes in FV of Investments)
Any issuances, repurchases, and repayments of debt and equity securities
The Parent Company and its subsidiary issued SEC-Registered Short-Term Commercial Papers during the
period with outstanding balance of =
P616.40 million and =
P171.65 million, respectively as of September 30, 2012.
Any Known Trends, Events or Uncertainties (material impact on liquidity)
There are no known trends, event and uncertainties that have a material effect on liquidity.
Any unusual items affecting assets, liabilities, equity, net income or cash flows in the current interim financial
statements
There are no unusual items affecting assets, liabilities, equity and net income or cash flows in the current interim
financial statements.
3
Any significant changes in estimates of amounts reported in prior interim periods of the current financial
year or changes in estimates of amounts reported in prior year financial years that have a material effect in
the current interim period
There are no significant changes in estimates of amounts reported in prior interim periods of the current
financial year or changes in estimates of amounts reported in prior year financial years that have a material
effect in the current interim period.
Any material events subsequent to the end of the interim period that have not been reflected in the financial
statements for the interim period
There are no material events subsequent to the end of the interim period that have not been reflected in the
financial statements for the interim period.
Effects of changes in the composition of the issuer during the interim period, including business combinations,
acquisition or disposal of subsidiaries and long-term investments, restructuring, and discontinuing operations
There are no significant effects of changes in the composition of the issuer during the interim period, including
business combinations, acquisition or disposal of subsidiaries and long-term investments, restructuring, and
discontinuing operations.
Changes in contingent liabilities or contingent assets since the last balance sheet date
There are no changes in contingent liabilities or contingent assets since the last balance sheet date
Any Known Trend or Events or Uncertainties (Material Impact on Net Sales or Revenues or Income from
Continuing Operations)
There is no known trend, event or uncertainties that have a material effect on the net sales or revenues or income
from continuing operations.
Any Significant Elements of Income or Loss that did not arise from Registrants Continuing Operations
There is no significant element of income or loss that did not arise from registrants continuing operations.
Causes for any Material Changes from Period to Period in One or More Line of the Registrant's Financial
Statements
a)
b)
c)
d)
e)
f)
g)
h)
i)
j)
k)
l)
m)
n)
o)
p)
q)
r)
s)
t)
Increase in Cash and Cash Equivalent was due to collections from sales of real estate properties, proceeds from
notes payable and maturity of short term investments.
Decrease in Short Term Cash Investments was due to maturity of placements.
Decrease in Investment in Trust Funds was due to maturity and termination of pension plans.
Decrease in Installment Contracts Receivable was due to collections.
Decrease in Other Receivables was due to collection.
Decrease in Real Estate Properties for Sale-net was due to sales of real estate properties.
Increase in Real Estate Properties Held for Future Development was due to purchase of a property.
Decrease in Investment Properties was due to reclass of lot cost to real estate properties for sale.
Decrease in Property and Equipment was due to depreciation.
Decrease in Accounts Payable and Accrued Expenses was due to payment of development cost, trade payables,
director’s fee and deposits.
Increase in Loans and Notes Payable was due to contracts payable from the purchase of a lot and increase in
notes payable.
Decrease in Income Tax Payable was due to payment.
Decrease in Pre-need and Other Reserves was due to maturity and termination of plans.
Decrease in Deferred Tax Liabilities was due to lower financial income as compared to taxable income.
Increase in Capital Stock was due to 10% stock dividends.
Decrease in Net Changes in Fair Value of AFS Financial Asset was due to decrease in market value of stocks.
Decrease in Retained Earnings was due to declaration of stock and cash dividends.
Decrease in Sales of Real Estate was primarily due to lower sales of Grand Emerald Tower due to lower
inventory of units available for sale.
Decrease in Financial Income was due to decrease in interest income from sale of real estate properties and
money market.
Increase in Rent Income was due to increase in units available for lease.
do ;E"d
6lld
sr@B
! dh
5
CITYLAND DEVELOPMENT CORPORATION AND SUBSIDIARIES
CONSOLIDATED BALANCE SHEETS
UNAUDITED
September 2012
Dec. 2011
2,163,420,180
354,300,000
39,672,268
1,960,029,048
28,574,995
1,446,216,281
1,312,962,761
846,282,216
46,371,990
28,454,588
8,226,284,327
1,433,826,099
507,750,000
45,691,673
2,147,940,019
52,235,624
1,591,546,671
1,182,830,001
986,036,006
55,395,091
27,178,893
8,030,430,077
692,124,146
1,566,460,772
26,865,178
46,502,391
350,596,348
Total Liabilities
446,669,618
1,793,162,928
17,193,732
40,696,373
326,831,800
2,624,554,451
2,682,548,835
STOCKHOLDERS’ EQUITY
Capital Stock – P1 par value Authorized – 4,000,000,000 shares
Issued – 3,241,793,886 shares
Additional Paid-in Capital
Net Changes in Fair Values of Investments
Retained Earnings (Note 14)
Treasury Stock – 3,655,633shares
3,241,793,886
7,277,651
(85,995)
1,576,574,373
(32,339,737)
2,947,261,781
7,277,651
521,418
1,678,459,048
(32,405,913)
Minority Interest in Consolidated Subsidiaries
4,793,220,178
808,509,698
4,601,113,985
746,767,257
Total Stockholders’ Equity
Total Liabilities and Stockholders’ Equity
5,601,729,876
8,226,284,327
5,347,881,242
8,030,430,077
ASSETS
Cash and Cash Equivalents (Note 4)
Short-term Cash Investments
Investment in Trust Funds (Note 5)
Installment Contracts Receivable – net (Notes 6 & 23)
Other Receivables – net (Note 7 & 23)
Real Estate Properties for Sale – net (Note 8)
Real Estate Properties Held for Future Development
Investment Properties – net (Note 9)
Property & Equipment – net (Note 10)
Other Assets (Note 11)
Total Assets
LIABILITIES & STOCKHOLDERS’ EQUITY
Accounts Payable and Accrued Expenses (Note 12)
Notes and Loans Payable (Note 13)
Income Tax Payable
Pre-need Reserves
Deferred Tax Liabilities
See accompanying Notes to Financial Statements
6
CITYLAND DEVELOPMENT CORPORATION AND SUBSIDIARIES
CONSOLIDATED STATEMENTS OF INCOME
nd
nd
UNAUDITED
For the 9-month For the 9-month
ending Sept. ‘12 ending Sept. ‘11
3 Qtr
2012
3 Qtr
2011
294,144,263
108,849,692
6,958,676
5,044,075
414,996,706
336,520,748
119,734,997
6,736,403
6,400,995
469,393,143
1,007,526,356
333,263,044
20,804,958
15,270,558
1,376,864,916
1,076,397,975
363,874,702
17,078,339
15,652,693
1,473,003,709
176,449,060
74,681,949
10,997,922
212,810,458
79,135,554
14,761,505
616,406,745
261,853,743
34,848,294
660,951,093
290,826,253
42,538,957
262,128,931
306,707,517
913,108,782
994,316,303
152,867,775
162,685,626
463,756,134
478,687,406
23,776,448
27,095,890
80,199,203
73,777,309
129,091,327
135,589,736
383,556,931
404,910,097
271,820,577
303,171,559
111,736,354
101,738,538
0.084
0.094*
REVENUES
Sales from real estate
Financial income (Note 18)
Rental income
Other revenues
EXPENSES
Cost of sales
Operating expenses (Note 15)
Financial expenses (Note 18)
INCOME BEFORE INCOME TAX
PROVISION FOR INCOME TAX (Note 20)
NET INCOME
Attributable to:
Equity holders of the parent
Minority interests
EARNINGS PER SHARE
*After retroactive effect of 10% stock dividends in 2012.
7
CITYLAND DEVELOPMENT CORPORATION AND SUBSIDIARIES
CONSOLIDATED STATEMENT OF COMPREHENSIVE INCOME
nd
Net Income
Other comprehensive income (loss):
Changes in fair value of available-for-sale
financial assets
Total other comprehensive income (loss)
Total Comprehensive Income – net
Attributable to:
Equity holders of the parent
Minority interests
Earnings per share
*After retroactive effect of 10% stock dividends in 2012.
nd
UNAUDITED
For the 9-month For the 9-month
ending Sept. ‘12 ending Sept. ‘11
3 Qtr
2012
3 Qtr
2011
129,091,327
135,589,736
383,556,931
404,910,097
(124,950)
(3,315,577)
(505,970)
(3,287,839)
(124,950)
128,966,377
(3,315,577)
132,274,159
(505,970)
383,050,961
(3,287,839)
401,622,258
271,213,163
111,837,798
300,219,411
101,402,847
0.084
0.093*
8
CITYLAND DEVELOPMENT CORPORATION AND SUBSIDIARIES
CONSOLIDATED STATEMENT OF CHANGES IN STOCKHOLDERS’ EQUITY
Balance, January 1, 2012
Cash dividends
Stock dividends
Fractional Shares
Dividends received by CPI from CDC
Parent Company shares of stocks held
by CPI’s Inv in trust fund
Transfer of rev. inc. through sale &
depreciation
Total comprehensive income
Balance as of September 30, 2012
Balance, January 1, 2011
Cash dividends
Stock dividends
Fractional Shares
Dividends received by CPI from CDC
Parent Company shares of stocks held
by CPI’s Inv in trust fund
Transfer of rev. inc. through sale &
depreciation
Total comprehensive income
Balance as of September 30, 2011
Capital stock
2,947,261,781
Additional
paid-in capital
7,277,651
Net changes
in fair value
of investments
521,418
294,532,105
Retained
earnings
1,678,459,048
(88,359,715)
(294,532,105
(278)
51,531
Treasury
stock
(32,405,913)
Minority
interests
746,767,257
(50,095,357)
66,176
3,241,793,886
7,277,651
(607,413)
(85,995)
Capital stock
2,456,374,741
Additional
paid-in capital
7,277,651
Net changes
in fair value
of investments
512,786
490,887,040
9,135,316
271,820,576
1,576,574,373
Retained
earnings
1,844,992,886
(122,721,840)
(490,887,040)
(318)
71,570
(32,339,737)
Treasury
stock
(32,259,775)
66,176
111,837,798
808,509,698
Minority
interests
625,244,685
(38,962,926)
(292)
234,372
2,947,261,781
7,277,651
(2,952,148)
(2,439,362)
4,476,247
303,171,559
1,539,103,064
(32,025,403)
Total
5,347,881,242
(138,455,072)
-(278)
51,531
9,135,316
383,050,961
5,601,729,876
Total
4,902,142,974
(161,684,766)
-(610)
71,570
234,372
101,402,847
687,684,314
4,476,247
401,622,258
5,146,862,045
9
CITYLAND DEVELOPMENT CORPORATION AND SUBSIDIARIES
CONSOLIDATED STATEMENTS OF CASH FLOWS
Unaudited
As of
Sept. 2012
3rd Qtr
2012
3rd Qtr
2011
152,867,775
162,685,626
463,756,134
478,687,406
9,943,744
4,687,782
(108,848,281)
(556,633)
(1,411)
(2,348,301)
14,433,379
4,624,926
(119,733,759)
(652,659)
(1,238)
(2,544,120)
33,794,116
14,000,489
(333,242,258)
(1,918,623)
(20,786)
(6,121,516)
41,275,937
14,217,832
(363,851,130)
(1,735,147)
(23,572)
(5,163,802)
73,836,310
4,817,114
16,603,315
(128,270,883)
100,406,296
4,630,025
37,081,209
(129,980,701)
187,910,971
22,035,256
282,712,571
(130,132,760)
184,187,781
3,684,479
205,316,684
(130,774,906)
(31,662,523)
(8,931,992)
107,843,043
(31,779,620)
67,131,431
15,312,062
86,261,046
118,977,231
(36,807,472)
168,430,805
(246,184,027)
286,589,567
334,867,631
(104,499,876)
516,957,322
(38,070,304)
387,751,258
367,473,046
(132,427,217)
622,797,087
1,411
-(354,300,000)
2,531
1,944,251
(85,239)
1,238
-(219,150,000)
-2,571,435
(104,285)
20,786
(1,257,143)
153,450,000
-7,526,118
(614,912)
23,572
-884,500,028
-6,546,923
(318,690)
1,019,259
(905,470)
(352,323,257)
(1,572,566)
2,400,315
(215,853,863)
-(788,666)
158,336,183
(2,195,326)
8,667,218
897,223,725
254,061,748
(10,846,661)
(139,336,963)
103,878,124
133,876,628
(12,357,704)
(160,997,213)
(39,478,289)
226,702,156
(33,785,909)
(138,615,671)
54,300,576
(96,901,474)
(41,896,735)
(161,016,000)
(299,814,209)
(181,313,702)
(86,901,347)
729,594,081
1,220,206,603
2,344,733,882
1,898,100,514
1,433,826,099
590,992,564
2,163,420,180
1,811,199,167
2,163,420,180
1,811,199,167
As of
Sept. 2011
CASH FLOWS FROM OPERATING
ACTIVITIES
Income before income tax
Adjustments for:
Interest expense – net of amounts capitalized
Depreciation and amortization
Interest income
Trust fund income
Dividend income
Decrease in pre-need reserves
Changes in operating assets and liabilities
Decrease (increase) in:
Installment contracts receivable – net
Other receivables
Real estate properties for sale
Real estate properties for future development
Increase (decrease) in:
Accounts payable and accrued expenses
Net cash from (used in) operation
Interest received
Income taxes paid
Net cash flows from operating activities
CASH FLOWS FROM INVESTING ACTIVITIES
Dividends received
Additions to property and equipment
Proceeds from (purchase of) short-term cash inv.
Proceeds from available-for-sale investments
Withdrawals from trust funds
Contributions to trust funds
Decrease (increase) in:
Investment properties
Other assets
Net cash flows from (used in) investing activities
CASH FLOWS FROM FINANCING
ACTIVITIES
Net proceeds from (payment to) availment of loans
Interest paid
Cash dividends paid
Net cash flows used in financing activities
NET INCREASE (DECREASE) IN CASH AND
CASH EQUIVALENTS
CASH AND CASH EQUIVALENTS AT
BEGINNING OF PERIOD
CASH AND CASH EQUIVALENTS AT END OF
THE PERIOD
10
CITYLAND DEVELOPMENT CORPORATION AND SUBSIDIARIES
NOTES TO CONSOLIDATED FINANCIAL STATEMENTS
1.
Corporate Information
City land Development Corporation (the Parent Company) was incorporated in the Philippines on January 31, 1978.
It has two domestic subsidiaries, Cityplans, Incorporated (CPI) and City & Land Developers, Incorporated (CLDI).
The Parent Company’s and its subsidiaries’ (the Group) primary business purpose is to acquire, develop, improve,
subdivide, cultivate, lease, sublease, sell, exchange, barter and/or dispose of agricultural, industrial, commercial, and
residential and other real properties, as well as to construct, improve, lease, sublease, sell and/or dispose of houses,
buildings and other improvements thereon, and to manage and operate subdivisions and housing projects or
otherwise engage in the financing and trading of real estate. In addition, CPI is engaged in the business of
establishing, organizing, developing, maintaining, conducting, operating, marketing and selling educational
assistance and pension plans. The Company is 50.40% owned by Cityland, Inc. (CI), the ultimate parent company
incorporated in the Philippines, which also prepares consolidated financial statements.
The average number of employees of the Group was 215 as of September 30, 2012 and 220 as of December 31,
2011. The Group’s registered office and principal place of business is at 2nd floor, Cityland Condominium 10,
Tower 1, 156 H.V. Dela Costa Street, Ayala North, Makati City.
CPI’s securities, amounting to 600 million worth of pension plans, are registered with the Securities and Exchange
Commission (SEC) subject to the terms and conditions provided in SEC Circular No. 2, Series of 1984. CPI
obtained from the SEC the permit to sell the said pension plans. As of September 30, 2012 and December 31, 2011,
CPI has sold about P 297M worth of securities, respectively.
2.
Summary of Significant Accounting and Financial Reporting Policies
Basis of Preparation
The consolidated financial statements of the Group have been prepared using the historical cost basis, except for
investments in trust fund and available-for-sale financial assets that have been measured at fair values and certain
items of property and equipment which are stated at revalued amounts. These consolidated financial statements are
presented in Philippine peso (Peso), which is the Parent Company’s functional currency, and rounded to the nearest
Peso except when otherwise indicated.
Statement of Compliance
The consolidated financial statements have been prepared in compliance with Philippine Financial Reporting
Standards (PFRS).
Changes in Accounting Policies
The accounting policies adopted are consistent with those of the previous financial year except for the adoption of
the following new and amended Philippine Accounting Standards (PAS), PFRS and new Philippine Interpretations
based on International Financial Reporting Interpretations Committee (IFRIC) interpretations effective in 2011. The
adoption of the following revised PAS is relevant but does not have a significant impact on the consolidated
financial statements:
•
Revised PAS 24, Related Party Disclosures, simplifies the identification of related party relationships,
particularly in relation to significant influence and joint control. The amendment emphasizes a symmetrical
view on related party relationships as well as clarifies in which circumstances persons and key management
personnel affect the related party relationships of an entity. The amendment also introduces an exemption from
the general related party disclosure requirements, for transactions with a government and entities that are
controlled, jointly controlled or significantly influenced by the same government as the reporting entity. The
adoption of the amendment did not have any impact on the financial position and performance of the Group.
The adoption of the following new and amended PFRS, PAS and Philippine Interpretations are either not relevant to
or have no significant impact on the consolidated financial statements:
•
•
Amended PAS 32, Financial Instruments: Presentation - Clarification of Rights Issues
Amended IFRIC 14, Prepayments of a Minimum Funding Requirement
11
•
Philippine Interpretation IFRIC 19, Extinguishing Financial Liabilities with Equity Instruments
Improvements to PFRS
The annual improvements process has been adopted by the International Accounting Standards Board (IASB) to deal
with non-urgent but necessary amendments to PFRS. The following summarizes the amendments that are effective
on or after January 1, 2011. The adoption of the following amendments is relevant but does not have a significant
impact on the consolidated financial statements:
•
PFRS 7, Financial Instruments Disclosures, emphasizes the interaction between quantitative and qualitative
disclosures and the nature and extent of risks associated with financial instruments.
•
PAS 1, Presentation of Financial Statements, clarifies that an entity will present an analysis of other
comprehensive income for each component of equity, either in the statement of changes in equity or in the notes
to the financial statements.
•
PAS 27, Consolidated and Separate Financial Statements (Amended), clarifies that the consequential
amendments from PAS 27 made to PAS 21, The Effect of Changes in Foreign Exchange Rates, PAS 28,
Investment in Associates, and PAS 31, Interest in Joint Ventures, apply prospectively.
•
PAS 34, Interim Financial Reporting, provides guidance to illustrate how to apply disclosure principles in PAS
34 and requires additional disclosures on: (a) the circumstances likely to affect fair values of financial
instruments and their classification, (b) transfers of financial instruments between different levels of the fair
value hierarchy, (c) changes in the classification of financial assets and (d) changes in contingent liabilities and
assets.
Other amendments resulting from the following 2011 improvements to PFRS, PAS and Philippine Interpretations
did not have any significant impact on the accounting policies, financial position or performance of the Group.
•
•
PFRS 3, Business Combinations
Philippine Interpretation IFRIC 13, Customer Loyalty Programmes
Basis of Consolidation
The consolidated financial statements consist of the financial statements of the Parent Company and its subsidiaries
as of December 31 of each year. The financial statements of the subsidiaries are prepared for the same reporting
year as the Parent Company using consistent accounting policies.
The subsidiaries and the percentage of ownership are as follows:
CPI
CLDI
Percentage of
Ownership
90.81
49.73
Nature of
Activity
Pre-need pension plans
Real estate
Subsidiaries are entities over which the Parent Company has the power to govern the financial and operating
policies, generally accompanying a shareholding of more than one half of the voting rights. The existence and effect
of any potential voting rights that are currently exercisable or convertible are considered when assessing whether the
Parent Company controls another entity.
Subsidiaries are consolidated from the date on which control is transferred to the Parent Company and cease to be
consolidated from the date on which control is transferred out of the Parent Company.
The accounts of CLDI were consolidated since the Parent Company, some of its stockholders and affiliates (whose
stockholders also own equity ownership in the Parent Company) collectively own more than 50% of the equity of
CLDI, thereby giving the Parent Company effective control over the financial and operating policies of CLDI.
The equity, net income and total comprehensive income attributable to non-controlling interests of the consolidated
subsidiaries are shown separately in the consolidated balance sheet, consolidated statement of income and
consolidated statement of comprehensive income, respectively.
All significant intercompany accounts and transactions are eliminated.
12
Revenue and Costs Recognition
Revenue is recognized to the extent that it is probable that the economic benefits will flow to the Group and the
amount of revenue can be reliably measured. Revenue is measured at the fair value of the consideration received
excluding VAT. The Group assesses its revenue arrangements against specific criteria in order to determine if it is
acting as principal or agent. The Group has concluded that it is acting as a principal in all of its revenue
arrangements. The following specific recognition criteria must also be met before revenue is recognized:
Sales of real estate properties
Sales of condominium units and residential houses where the Group has material obligations under the sales contract
to provide improvements after the property is sold are accounted for under the percentage of completion method.
Under this method, revenue on sale is recognized as the related obligations are fulfilled.
Revenue from sales of completed residential lots and housing units, where a sufficient down payment has been
received, the collectability of the sales price is reasonably assured, the refund period has expired, the receivables are
not subordinated and the seller is not obligated to complete improvements, is accounted for under the full accrual
method. If the criterion of full accrual method was not satisfied, any cash received by the Group is included in the
“Accounts payable and accrued expenses” in the consolidated balance sheet until all the conditions for recording a
sale are met.
Cost of real estate sales
Costs of real estate sales are recognized consistent with the revenue recognition method applied. Cost of
condominium units sold before the completion of the development is determined on the basis of the acquisition cost
of the land plus its full development costs, which include estimated costs for future development works as
determined by the Group’s in-house technical staff.
In addition, cost of real estate sales of 100% completed projects represents the proportionate share of the sold units
to the total of the development cost which includes land, direct materials, labor cost and other indirect costs related
to the project. If the project is still under construction, the cost of real estate sales of the sold units is multiplied by
the percentage of completion. The cost referred to is the same total development costs and not only actual
expenditures. The percentage of completion is based on the technical evaluation of the project engineers as well as
management’s monitoring costs, progress and improvements of the projects.
Future Changes in Accounting Policies
The Group will adopt the following standards and interpretations when these become effective subsequent to 2011.
Except as otherwise indicated, the Group does not expect the adoption of these new, and amended and improvements
to PFRS, PAS and Philippine Interpretations to have significant impact on the consolidated financial statements.
Effective in 2012
• PFRS 7, Financial Instruments: Disclosures - Enhanced Derecognition Disclosure Requirements, requires
additional disclosure about financial assets that have been transferred but not derecognized to enable the user of
the consolidated financial statements to understand the relationship with those assets that have not been
derecognized and their associated liabilities.
•
Amended PAS 12, Income Taxes - Deferred Taxes: Recovery of Underlying Assets, introduces a rebuttable
presumption that deferred tax on investment properties measured at fair value will be recognized on a sale basis,
unless an entity has a business model that would indicate the investment property will be consumed in the
business.
Effective in 2013
• PFRS 7, Financial instruments: Disclosures - Offsetting Financial Assets and Financial Liabilities, requires an
entity to disclose information about rights of offset and related arrangements (such as collateral agreements).
The new disclosures are required for all recognized financial instruments that are offset in accordance with PAS
32.
• PFRS 10, Consolidated Financial Statements, replaces the portion of PAS 27 that addresses the accounting for
consolidated financial statements. The changes introduced by PFRS 10 will require management to exercise
significant judgment to determine which entities are controlled, and therefore, are required to be consolidated by
a parent, compared with the requirements that were in PAS 27.
•
PFRS 11, Joint Arrangements, replaces PAS 31, Interests in Joint Ventures and SIC-13, Jointly-controlled
Entities - Non-monetary Contributions by Venturers. PFRS 11 removes the option to account for jointly
controlled entities (JCEs) using proportionate consolidation. Instead, JCEs that meet the definition of a joint
venture must be accounted for using the equity method.
13
•
PFRS 12, Disclosure of Interests with Other Entities, includes all of the disclosures that were previously in PAS
27 related to consolidated financial statements, as well as all of the disclosures that were previously included in
PAS 31 and PAS 28. These disclosures relate to an entity’s interests in subsidiaries, joint arrangements,
associates and structured entities. A number of new disclosures are also required.
•
PFRS 13, Fair Value Measurement, establishes a single source of guidance under PFRS for all fair value
measurements. PFRS 13 does not change when an entity is required to use fair value, but rather provides
guidance on how to measure fair value under PFRS when fair value is required or permitted.
•
PAS 1, Financial Statements Presentation - Presentation of Items of Other Comprehensive Income, changes the
grouping of items presented in other comprehensive income (OCI). Items that would be reclassified (or
recycled) to profit or loss at a future point in time (e.g., upon derecognition or settlement) would be presented
separately from items that will never be reclassified
•
Revised PAS 19, Employee Benefits, includes a number of amendments that range from fundamental changes to
simple clarifications and re-wording.
•
PAS 27, Separate Financial Statements (Revised). As a consequence of the new PFRS 10 and PFRS 12, what
remains of PAS 27 is limited to accounting for subsidiaries, jointly controlled entities, and associates in separate
financial statements.
•
PAS 28, Investments in Associates and Joint Ventures. As a consequence of the new PFRS 11 and PFRS 12,
PAS 28 has been renamed PAS 28, Investments in Associates and Joint Ventures, and describes the application
of the equity method to investments in joint ventures in addition to associates.
•
Philippine Interpretation IFRIC 20, Stripping Costs in the Production Phase of a Surface Mine, applies to waste
removal costs that are incurred in surface mining activity during the production phase of the mine (“production
stripping costs”) and provides guidance on the recognition of production stripping costs as an asset and
measurement of the stripping activity asset.
Effective in 2014
• Amendments to PAS 32, Financial Instruments: Presentation - Offsetting Financial Assets and Financial
Liabilities, clarifies the meaning of “currently has a legally enforceable right to offset” and also clarify the
application of the PAS 32 offsetting criteria to settlement systems (such as central clearing house systems)
which apply gross settlement mechanisms that are not simultaneous.
Effective in 2015
• PFRS 9, Financial Instruments - Classification and Measurement, as issued reflects the first phase on the
replacement of PAS 39 and applies to classification and measurement of financial assets and financial liabilities
as defined in PAS 39. The Company will quantify the effect in conjunction with the other phases, when issued,
to present a comprehensive picture.
After consideration of the result of its impact evaluation, the Group has decided not to early adopt either PFRS 9
(2009) of PFRS 9 (2010) for its 2012 financial reporting, thus the interim report as of September 30, 2012 does
not reflect the application of the requirements and does not contain a qualitative and quantitative discussion of
the result of the company’s impact evaluation.
Standard Issued but not yet Effective
• Philippine Interpretation IFRIC 15, Agreements for the Construction of Real Estates, covers accounting for
revenue and associated expenses by entities that undertake the construction of real estate directly or through
subcontractors. The interpretation requires that revenue on construction of real estate be recognized only upon
completion, except when such contract qualifies as construction contract to be accounted for under PAS 11,
Construction Contracts, or involves rendering of services in which case revenue is recognized based on stage of
completion. The SEC and the Financial Reporting Standards Council (FRSC) have deferred the effectivity of
this interpretation until the final Revenue standard is issued by IASB and an evaluation of the requirements of
the final Revenue standard against the practices of the Philippine real estate industry is completed. The Group
will quantify the effect when the final Revenue standard is issued.
Additional disclosures required by these amendments will be included in the consolidated financial statements when
these amendments are adopted.
14
Events After the Balance Sheet Date
Post year-end events that provide additional information about the Group’s position at the end of reporting period
(adjusting events) are reflected in the consolidated financial statements. Post year-end events that are not adjusting
events are disclosed in the notes to the consolidated financial statements when material.
Segment Reporting
The Group’s operating business are organized and managed separately according to the nature of the products and
services provided, with each segment representing a strategic business unit that offers different products and serves
different markets. The Group’s asset-producing revenues are located in the Philippines (i.e., one geographical
location). Therefore, geographical segment information is no longer presented.
3.
Significant Accounting Judgments and Estimates
The preparation of the consolidated financial statements requires management to make judgments, estimates and
assumptions that affect the amounts reported in the consolidated financial statements and accompanying notes.
In the opinion of management, these consolidated financial statements reflect all adjustments necessary to present
fairly the results for the period presented. Actual results could differ from such estimates.
Judgments
In the process of applying the Group’s accounting policies, management has made the following judgments, apart
from those involving estimations, which has the most significant effect on the amounts recognized in the
consolidated financial statements:
4.
Cash and Cash Equivalents
Cash on hand and in banks
Cash equivalents
September 2012
9,158,606
2,154,261,574
2,163,420,180
Dec. 2011
14,849,936
1,418,976,163
1,433,826,099
Cash in banks earn interest at the respective bank deposit rates. Short-term deposits are made for varying periods up
to three months depending on the immediate cash requirements of the Group and earn interest at the respective shortterm investment rates.
Short-term cash investments amounting =
P354.30 million and P
=507.75 million as of September 30, 2012 and
December 31, 2011, respectively, are investments in banks with maturities of more than three months to one year
from dates of acquisition and earn interest at the prevailing market rates.
5.
Investment in Trust Funds
Pursuant to the provisions of SEC Memorandum Circular No. 6, Guidelines on the Management of the Trust Fund of
Pre-Need Corporation (SEC Circular No. 4), the SEC requires, among others, that companies engaged in the sale of
pre-need plans and similar contracts set up a trust fund to guarantee the delivery of property or performance of
service in the future. Withdrawals from these trust funds are limited to, among others, payments of pension plan
benefits, bank charges and investment expenses in the operation of the trust funds, termination value payable to plan
holders, contributions to the trust funds of cancelled plans and final taxes on investment income of the trust funds.
6.
Installment Contracts Receivable - Net
Installment contracts receivable arise from sales of real estate properties.
The installment contracts receivable on sales of real estate are collectible in monthly installments for periods ranging
from one to 10 years and bear monthly interest rates of 0.67% to 2% computed on the diminishing balance.
The portion due within one year (net of current unrealized gross profit, estimated development cost for sold units and
deferred vat) amounted to P
=509.65 million in September 2012 and P
=426.08 million in December 2011.
15
The Group and CI entered into a contract of guaranty under Retail Guaranty Line in the amount of P
=1,000.00 million
in 2012 with Home Guaranty Corporation (HGC). The Group paid a guarantee premium of 1%, based on
outstanding principal balance of the receivables enrolled in 2012 and 2011.
7.
Other Receivables
This account consists of:
Customers
Contractors
Accrued interest
Others
September 2012
14,328,483
1,091,409
5,533,420
7,621,683
28,574,995
Dec. 2011
32,255,888
4,289,589
7,158,793
8,531,354
52,235,624
The portion due within one year amounted to =
P25.66 million in September 2012 and P
=46.17 million in December
2011.
8.
Real Estate Properties for Sale and Held for Future Development
Real estate properties for sale consist of cost incurred in the development of condominium units and residential
houses for sale. This includes borrowing costs incurred in connection with the development of the properties. The
capitalization rates used to determine the amount of borrowing costs eligible for capitalization were 3.91% and
3.86% as of September 2012 and December 2011, respectively.
Cost of real estate sales include all direct materials and labor cost and those indirect costs related to contract
performance. In addition, cost of real estate sales of 100% completed projects represents the proportionate share of
the sold units to the total of the development cost which includes land, direct materials, labor cost and other indirect
costs related to the project. If the project is still under construction, cost of real estate sales of the sold unit is
multiplied by the percentage of completion. The percentage of completion is based on the technical evaluation of the
project engineers as well as management’s monitoring of costs, progress and improvements of the projects.
Real estate properties held for future development includes land properties reserved by the Group for its future
condominium projects. During 2012, the Company transferred portion of its real estate properties held for future
development to its newly launched projects accounted for under real estate properties for sale. Also, in 2012, the
Company’s subsidiary CLDI acquired a parcel of land amounting to P
=127.94 for future development.
9.
Investment Properties
In November 2011, the Company entered into a non-cancellable operating lease with third party that permits the
lessee to use the property as a fast food outlet. Other lease agreements with third parties are generally for a one-year
term renewable every year.
The future minimum lease payments for this non-cancellable operating lease as of September 30, 2012 are as
follows:
Within one year
After one year but not more than five years
Later than five years
4,098,600
25,082,386
20,253,549
49,434,535
These investment properties were appraised by independent firms of appraisers at various dates. Some investment
properties of the Group were used as collateral for loans availed from the omnibus credit line.
16
10. Property and Equipment
Office
Premises
At cost
Beginning balances
Additions (disposals)
Ending balances
Accumulated depreciation
Beginning balances
Depreciation for the year
Disposals
Ending balances
Net Book Value
At Deemed Cost
Beginning balances
Ending balances
Accumulated depreciation
Beginning balances
Depreciation for the year
Ending balances
Net Deemed Cost
Total
Furniture,
Fixtures and Transportation
Office Equip.
Equipment
Total
Sept. 2012
Total
Dec. 2011
----
28,530,802
-28,530,802
5,715,606
1,257,143
6,972,749
34,246,408
1,257,143
35,503,551
34,246,408
-34,246,408
------
27,914,576
312,120
-28,226,696
304,106
4,258,122
489,400
-4,747,522
2,225,227
32,172,698
801,520
-32,974,218
2,529,333
30,928,568
1,244,130
-32,172,698
2,073,710
259,448,852
259,448,852
---
---
259,448,852
259,448,852
259,448,852
259,448,852
206,127,471
9,478,724
215,606,195
43,842,657
43,842,657
----304,106
----2,225,227
206,127,471
9,478,724
215,606,195
43,842,657
46,371,990
193,489,171
12,638,300
206,127,471
53,321,381
55,395,091
As of September 30, 2012 the balances at cost of the office premises above are as follows:
Office premises
Less: Accumulated depreciation
September 2012
61,858,970
48,971,991
12,886,979
Dec. 2011
61,858,970
46,672,058
15,186,912
Office premises were appraised by independent firms of appraisers on various dates. The cost of fully depreciated
property and equipment amounted to P
=29.74 million as of September 30, 2012.
11. Other Assets
Available-for-sale financial assets
Retirement plan assets
Deposits and others
September 2012
1,841,758
10,887,820
15,725,010
28,454,588
Dec. 2011
1,354,728
10,887,820
14,936,345
27,178,893
September 2012
59,764,360
17,818,314
Dec. 2011
63,810,250
24,469,238
307,927,718
18,735,694
7,805,887
14,914,038
3,914,029
7,022,957
2,392,919
6,373,702
446,669,618
542,275,766
30,879,836
7,794,265
3,119,398
6,426,370
6,301,664
414,822
6,632,537
692,124,146
12. Accounts Payable and Accrued Expenses
Trade payables
Deposits
Accrued expenses:
Development costs
Director’s fee
Interest payable
Taxes, premiums, others
Withholding taxes
Dividends
VAT payable
Others
17
13. Loans and Notes Payable
Short-term commercial papers (STCP) with various maturities
and interest rate ranging from 2.63% to 5.31% in
September 2012 and from 2.19% to 5.39% in Dec. 2011
Short-term promissory notes with various maturities and
annual interest rates ranging 1.70% to 3.00% in
September 2012 and from 1.70% to 3.40% in Dec. 2011
Contracts Payable
September 2012
Dec. 2011
788,050,000
967,050,000
887,731,678
599,410,772
117,381,250
1,793,162,928
-1,566,460,772
On various dates in 2012 and 2011, the SEC authorized the Group to issue P
=1,200.00 million worth of STCP
registered with the SEC in accordance with the provision of the Securities Regulation Code and its implementing
rules and regulations, the code of Corporate Governance and other applicable laws and orders.
In 2012 and 2011, the Group entered a contract of guaranty under a Revolving Cash Guaranty Line with HGC in the
amount of P
=1,200.0 million. The guaranty covers the unpaid principal due on the outstanding STCP and unpaid
interest thereon of 10.00% per annum.
14. Stockholders' Equity
Dividends declared by the Parent Company from retained earnings were as follows:
Cash dividends:
Date Approved
May 18, 2012
May 30, 2011
May 31, 2010
Per Share
0.03000
0.05000
0.06000
Stockholders of
Record Date
Date Paid
June 15, 2012
July 11, 2012
June 13, 2011
July 08, 2011
June 30, 2010
July 26, 2010
Percentage
10%
20%
20%
Stockholders of
Record Date
Distribution Date
August 27, 2012
September 20, 2012
July 07, 2011
August 2, 2011
June 11, 2010
July 8, 2010
Stock dividends:
Date Ratified
June 05, 2012
June 07, 2011
June 01, 2010
On July 27, 2012, the Securities and Exchange Commission (SEC) approved the Amended Articles of Incorporation
on the application for increase in capital stock from P
=3,000,000,000 to =
P4,000,000,000 with a par value of P
=1 each.
The SEC also authorized the issuance of 10% stock dividends declared by the BOD last May 7, 2012 and ratified by
the stockholders on June 5, 2012.
As of September 30, 2012, the unappropriated retained earnings include the remaining balance of deemed cost
adjustment amounting to =
P301.30 million, net of related deferred tax of P
=129.13 million, related to real estate
properties for sale and lease which rose when the Company transitioned to PFRS in 2005. This amount has yet to be
absorbed through sales and depreciation and is restricted for the payment of dividends.
15. Operating Expenses
Personnel expenses (Note 16)
Taxes and licenses
Professional fees
Insurance
Depreciation (Note 17)
(Forward)
September 2012
130,491,217
38,312,357
16,180,245
15,291,885
14,000,489
September 2011
121,708,134
42,670,178
38,487,523
17,704,379
14,217,832
18
Membership dues
Outside services
Advertising and promotions
Brokers’ commission
Light, power and water
Postage, telephone and telegraph
Stationery and office supplies
Donations
Repairs and maintenance
Others
10,581,053
7,654,063
4,363,004
4,319,258
3,017,915
1,854,443
725,545
710,000
282,713
14,069,557
261,853,744
14,389,589
6,459,317
4,873,340
5,443,951
2,809,350
1,616,944
1,230,827
5,003,000
3,423,151
10,788,738
290,826,253
September 2012
73,149,946
50,293,153
7,048,118
130,491,217
September 2011
69,272,122
46,046,728
6,389,284
121,708,134
September 2012
3,720,245
10,280,244
14,000,489
September 2011
3,720,246
10,497,586
14,217,832
September 2012
September 2011
333,242,258
20,786
333,263,044
363,851,130
23,572
363,874,702
33,794,116
1,054,178
34,848,294
298,414,750
41,275,937
1,263,020
42,538,957
321,335,745
16. Personnel Expenses
Employee benefits and commissions
Salaries and wages
Other social charges
17. Depreciation
This consists of depreciation pertaining to the following:
Investments in real estate properties under lease
Property and equipment
18. Financial Income (Expenses)
Financial Income
Interest income
Dividend income
Financial Expenses
Interest expense
Finance charges
19. Retirement Costs
The Group, jointly with affiliated companies, has a funded, noncontributory defined benefit retirement plan covering
substantially all of its employees.
20. Income Taxes
Provision for income tax consists of:
Current
Deferred
Final tax on interest income
September 2012
80,307,286
(14,629,227)
14,521,144
80,199,203
September 2011
95,523,932
(34,831,946)
13,085,323
73,777,309
19
21. Related Party Transactions
Parties are considered to be related if one party has the ability to control, directly or indirectly, the other party or
exercise significant influence over the other party in making financial and operating decisions. It includes companies
in which one or more of the directors and/or shareholder of the Parent Company either has a beneficial controlling
interest or are in a position to exercise significant influence therein.
The Group discloses the nature of the related party relationship and information about the transactions and
outstanding balances necessary for an understanding of the potential effect of the relationship on the consolidated
financial statements, including, as a minimum, the amount of outstanding balances and its terms and conditions
including whether they are secured, and the nature of the consideration to be provided in settlement.
In the normal course of business, the Group has the following transactions with related parties:
1) Interest-bearing cash advances, which are always settled in full on the subsequent month, and non-interestbearing advances for reimbursable expenses.
Related Party
CI (Parent)
CLDI (Subsidiary)
CPI (Subsidiary)
Others (Affiliates)
Totals
Totals
Sept. 2012
Dec. 2011
Sept. 2012
Dec. 2011
Sept. 2012
Dec. 2011
Sept. 2012
Dec. 2011
Sept. 2012
Dec. 2011
Interest
Income on
Advances to
Related Parties
150,138
66,266
29,077
72,204
---146
179,215
138,616
Interest
Expense on
Advances from
Related Parties
232
209,143
19,503
98,217
----19,735
307,360
Amounts
Owed by Related
Parties
628,894
-1,598,427
1,060,034
41,460
-23,639
-2,292,420
1,060,034
Amounts
Owed to Related
Parties
196,834
-10,612
-5,507
---212,953
--
The Group has no standard arrangements with regards to the remuneration of its directors. Moreover, the Group
has no standard arrangement with regards to the remuneration of its existing officers aside from the
compensation received or any other arrangements in the employment contracts and compensatory plan. The
Group does not have any arrangements for stock warrants or options offered to its employees.
22. Earnings Per Share
Basic earnings per share amounts were computed as follows:
a. Net income
b. Weighted average number of shares
c. Earnings per share (a/b)
September 2012
271,820,577
3,239,855,939
0.084
September 2011
303,171,559
3,239,855,939
0.094*
*After retroactive effect of 10% stock dividends in 2012.
23. Financial Instruments
Financial Risk Management Objectives and Policies
The Group’s principal financial instruments comprise of bank loans and notes payables, cash and cash equivalents
and short-term cash investments. The main purpose of these financial instruments is to finance the Company’s
operations. The Group has other financial instruments such as available-for-sale investments, held-to-maturity
investments and financial assets at fair value through profit or loss, which are held for investing purposes. The
Group has various other financial assets and liabilities such as installment contracts receivable and trade payables,
which arise directly from its operations.
It is, and has been throughout the year under review, the Group’s policy that no trading in financial instruments shall
be undertaken. The Group has no investments in foreign securities.
20
The main risks arising from the Group’s financial instruments are cash flow interest rate risks, credit risk, foreign
currency risks and liquidity risk. The BOD reviews and approves policies for managing these risks and they are
summarized as follows:
Cash flow interest rate risk
The Group’s exposure to the risk for changes in market interest rates relates primarily to the Group’s short-term and
long-term loans payable, all with repriced interest rates. The Group’s policy in addressing volatility in interest rates
includes maximizing the use of operating cash flows to be able to fulfill principal and interest obligations even in
periods of rising interest rates.
A sensitivity analysis to a reasonable change in the interest rates (with all other variables held constant) of 0.0547%
higher or lower, would increase or decrease the Groups’ income before income tax of P
=980,860.
Credit risk
The Group trades only with recognized, creditworthy third parties. It is the Group’s policy that all customers that
wish to trade on credit terms are subject to credit verification procedures. In addition, receivable balances are
monitored on an on-going basis with the result that the Group’s exposure to bad debts is not significant. The
Group’s policy is to enter into transactions with a diversity of creditworthy parties to mitigate any significant
concentration of credit risk. There is no significant concentration of credit risk within the Group.
The table below shows the Group’s exposure to credit risk for the components of the balance sheets. The exposure
as of September 30, 2012 is shown at gross, before taking the effect of mitigation through the use of and collateral
agreements and at net, after taking the effect of mitigation through the use of collateral agreements.
Loans and receivables:
Cash and cash equivalents, excluding cash on hand
Short-term cash investments
Installment contract receivables
Other receivables
Available-for-sale financial assets
Investment in trust funds
Total credit risk exposure
Gross
Net
2,163,238,224
354,300,000
1,960,029,048
27,483,586
1,841,758
39,672,268
4,546,564,884
660,298,328
258,700,000
-12,136,253
-931,134,581
The following table summarizes the aging analysis and credit quality of the receivables as of September 30, 2012:
Current
Installment contracts
receivable
Other receivables:
Accrued interest
Customers
Retention
Others
Past due But Not
Impaired
31 - 60 days 61 - 90 days
>One Year
<30 days
Over 90 days
Total
494,159,232 1,450,378,977
4,289,186
2,315,479
1,808,747
7,077,427 1,960,029,048
5,533,420
2,912,159
-1,120,974
5,081,381
699,399
507,686,192 1,452,199,350
456,195
4,745,381
1,047,585
3,363,064
455,010
2,263,757
5,533,420
9,913,729
14,328,483
263,734
1,384,708
6,236,975
17,254,890 1,987,512,634
The table below shows the credit quality by class of asset for loan-related balance sheet lines, based on the Group’s
credit rating system as of September 30, 2012:
Financial asset at fair value through
profit or loss
Investments in trust funds
Loans and receivables:
Cash and cash equivalents, excluding
cash on hand
Short-term cash investments
Installment contract receivables
Other receivables:
TOTAL
*
**
High Grade*
Medium Grade**
Past due but
not impaired
Total
39,672,268
--
--
39,672,268
15,490,839
12,136,253
27,627,092
2,163,238,224
354,300,000
1,960,029,048
27,483,586
4,544,723,126
2,163,238,224
354,300,000
1,944,538,209
14,748,608
4,516,497,309
-598,725
598,725
High Grade - financial assets with reputable counterparties and which management believes to be reasonably assured to be recoverable.
Medium Grade - financial assets for which there is low risk on default of counterparties.
21
The main considerations for impairment assessment include whether any payments are overdue or if there are any
known difficulties in the cash flows of the counterparties. The Group assesses impairment into two areas:
individually assessed allowances and collectively assessed allowances.
The Group determines allowance for each significant receivable on an individual basis. Among the items that the
Group considers in assessing impairment is the inability to collect from the counterparty based on the contractual
terms of the receivables. The Company also considers the fair value of the real estate collateralized in computing the
impairment of the receivables. Receivables included in the specific assessment are those receivables under the
installment contracts receivable accounts.
Because the Group holds the title to the real estate properties with outstanding installment contracts receivable
balance and can repossess such real estate properties upon default of the customer in paying the outstanding balance,
the Group does not provide for allowance for impairment of its installment contracts receivable.
For collective assessment, allowances are assessed for receivables that are not individually significant and for
individually significant receivables where there is not yet objective evidence of individual impairment. Impairment
losses are estimated by taking into consideration the age of the receivables, past collection experience and other
factors that may affect collectibility.
Equity Price Risk
Equity price risk is the risk that the fair values of equities decrease as a result of changes in the market value of
individual stock. The Group is exposed to equity securities price risk because of investments held by the Group,
which are classified in the balance sheets as available-for-sale investments.
A sensitivity analysis to a reasonable change in the equity price (with all other variables held constant) of =
P0.05,
higher or lower, would increase or decrease the equity by P
=89,373.
Foreign currency risk
The Group’s transactional currency exposure arises from sales and purchases in currencies other than its functional
currency. However, the Group’s exposure to foreign currency risk is minimal.
Liquidity risk
The Group’s objective is to maintain a balance between continuity of funding and flexibility through the use of bank
loans.
The table below summarizes the maturity analysis of the Group’s financial liabilities as of September 30, 2012:
Accounts payable and accrued expenses*
Notes payable**
Contracts Payable
Up to One Year
194,737,488
1,741,321,500
117,381,250
2,053,440,238
Above One Year
245,625,182
245,625,182
Total
440,362,670
1,741,321,500
117,381,250
2,299,065,420
Fair Values
As defined in PAS 39, fair value approximates the carrying amounts of recorded financial assets and liabilities as of
September 30, 2012 and December 31, 2011:
September 2012
Carrying value
Fair Value
Financial Assets
Cash and cash equivalents
Short-term cash investments
Installment contracts receivables
Other receivables
Investment in trust funds
Available-for-sale investments
Financial Liabilities
Accounts payable and accrued
expenses *
Notes payable
*
**
December 2011
Carrying value
Fair value
2,163,420,180
354,300,000
1,960,029,048
27,483,586
39,672,268
1,841,758
4,546,746,840
2,163,420,180
354,300,000
1,960,029,048
27,483,586
39,672,268
1,841,758
4,546,746,840
1,433,826,099
507,750,000
2,147,940,019
47,946,035
45,691,673
1,354,728
4,184,508,554
1,433,826,099
507,750,000
2,147,940,019
47,946,035
45,691,673
1,354,728
4,184,508,554
440,362,670
1,793,162,928
2,233,525,598
440,362,670
1,793,162,928
2,233,525,598
685,106,482
1,566,460,772
2,251,567,254
685,106,482
1,566,460,772
2,251,567,254
Excludes statutory liabilities amounting to =
P 6,306,948 and =
P 7,017,664 as of September 30, 2012 and December 2011, respectively.
Includes interest expense amounting to =
P65,539,822.
22
Cash and cash equivalents, short-term cash investments, other receivables and accounts payable and accrued
expenses
Due to the short-term nature of the transactions, the fair value of cash and cash equivalents, short-term cash
investments, other receivables and accounts payable and accrued expenses approximate amount of consideration at
the time of initial recognition.
Financial assets at fair value through profit or loss and available-for-sale investments
Financial assets at fair value through profit or loss and available-for-sale investments are stated at fair value based on
quoted market prices.
Installment contracts receivable
The fair value of installment contracts receivable cannot be reasonably estimated due to the significant volume of
transactions and the varied terms and maturities.
Loans and notes payable
Due to the monthly/quarterly repricing of interest, loans and notes payable are stated at fair value.
24. Business Segments
The Group derives its revenues primarily from the sale and lease of real estate properties and marketing of pension
plans.
The Group does not have any major customers and all sales and leases of real estate properties and sales of pension
plans are made to external customers.
Segment revenues and expenses:
Sales of real estate
Rental income
Others
September 2012
1,266,540,080
20,804,958
89,519,878
1,376,864,916
91.99%
1.51%
6.50%
100.00%
September 2011
1,373,296,182
17,078,339
82,629,188
1,473,003,709
93.23%
1.16%
5.61%
100.00%
Except for expenses directly relating to the leasing and pension plan operations, operating expenses pertain primarily
to the real estate sales.
25. Contingencies
The Group is contingently liable for lawsuits or claims filed by third parties which are either pending decisions by
the courts or are under negotiation, the outcomes of which are not presently determinable. In the opinion of
management and its legal counsel, the eventual liability under these lawsuits or claims, if any, will not have a
material effect on the consolidated financial statements.
23
CITYLAND DEVELOPMENT CORPORATION
SCHEDULE OF FINANCIAL SOUNDNESS INDICATORS
As of and for the Period Ending September 30, 2012, December 31, 2011 & September 30, 2011
Financial Ratios
Earnings per share*
Return on Equity*
Interest Rate Coverage Ratio
September 30, 2012
(Unaudited)
P 0.11
7.56%
December 31, 2011
P 0.14
9.59%
September 30, 2011
P0.12
9.07%
15.14
14.14
13.21
Asset-to-equity Ratio
1.72
1.75
1.78
Debt-to-equity Ratio
0.37
0.34
0.42
Current ratio
2.26
2.01
1.95
Acid-test Ratio
1.53
1.21
1.24
* annualized
CITYLAND DEVELOPMENT CORPORATION
SCHEDULE OF GROSS AND NET PROCEEDS OF SHORT-TERM
COMMERCIAL PAPERS ISSUED
As of September 30, 2012
Description
(i)
As disclosed in
Actual
the Final
As of September 30,
Prospectus*
2012**
Total Issued Notes within the period
2,505,300,000
Less: Total Terminated Notes within the period
1,914,200,000
Total Outstanding Notes / Gross Proceeds
1,000,000,000
591,100,000
820,625
820,625
Legal and Accounting Fees
30,000
30,000
Publication Fees
29,000
29,792
5,000,000
2,961,029
30,000
51,500
994,090,375
3,892,946
Project-related Costs
473,000,000
330,000,000
Payment of maturing loans/ notes
480,090,375
244,413,250
41,000,000
12,793,804
994,090,375
587,207,054
Less: Expenses
Registration Fees
Documentary Stamps Tax
Printing costs
(ii)
Total Net Proceeds
(iii)
Use of Proceeds
Interest expense
Total
(iv)
Balance of proceeds as of September 30, 2012
* SEC-CFD Order No. 344, Series of 2011 dated November 25, 2011.
** For the Ten-month Period December 2011 to September 30, 2012.
--
--


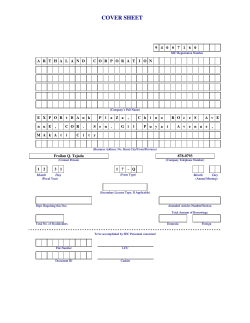


© Copyright 2026