
Determination of Sodium and Potassium Content Present in Water Sample
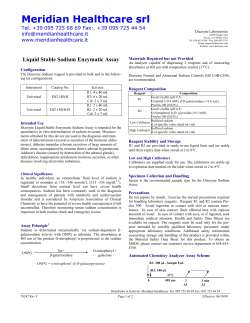
JPSBR: Volume 3, Issue 3: May June 2013 (105-107)
ISSN NO. 2271-3681
Determination of Sodium and Potassium Content Present in Water Sample
Collected from Girna and Godavari River by Flamephotometry
*
Amrutkar R. D. , Thube A.E., Kulkarni S. C.,
Mahatma Gandhi Vidyamanidr’s Samajshree Prashantdada Hiray College of Pharmacy, Loknete Vyankatrao Hiray Marg, Malegaon Camp, Malegaon-423105,
(Nashik), Maharashtra, India.
ABSTRACT:
Flame photometry (more accurately called flame atomic emission spectrometry) is a branch of atomic spectroscopy in which the
species examined in the spectrometer are in the form of atoms. Flame photometry is suitable for qualitative and quantitative
determination of several cations, especially for metals that are easily excited to higher energy levels at a relatively low flame
temperature (mainly Na, K, Rb, Cs, Ca, Ba, Cu). The major cation of the extracellular fluid is sodium and intracellular cation found
to be potassium. When the concentration level of the sodium cation in the human plasma decreases leads to cause
+
Hyponatraemia and hypernatraemia when the level is raised. In case of potassium cation hypokalaemia (lowered plasma [K ]),
+
+
hyperkalaemia (increased plasma [K ]) and hyperkaluria (increased urinary excretion of K ) The present article include the
Comparative studies on Sodium and Potassium content Present in Water Sample Collected from Girna in Malegaon and Godavari (
Nasik) River.
Key Words: Flame photometry, Sodium, Potassium.
INTRODUCTION:
Article history:
Received: 06 Jan 2012
Revised: 22 Jan, 2012
Accepted: 20 June 2013
Available online 13 July 2013
For Correspondence:
Mr. Rakesh D. Amrutkar
Mahatma Gandhi Vidyamanidr’s Samajshree
Prashantdada Hiray College of Pharmacy,
Loknete Vyankatrao Hiray Marg, Malegaon
Camp, Malegaon-423105, (Nashik),
Maharashtra, India.
Email: [email protected]
(www.jpsbr.org)
Amrutkar R. D. et al
Flame photometry (more accurately called flame atomic emission spectrometry) is
a branch of atomic spectroscopy in which the species examined in the
spectrometer are in the form of atoms. The other two branches of atomic
spectroscopy are atomic absorption spectrophotometry and inductively coupled
plasma-atomic emission spectrometry (ICP-AES, a relatively new and very
expensive technique not used in Standard base experiments). In all cases the atoms
under investigation are excited by light. Absorption techniques measure the
absorbance of light due to the electrons going to a higher energy level. Emission
techniques measure the intensity of light that is emitted as electrons return to the
lower energy levels. Flame photometry is suitable for qualitative and quantitative
determination of several cations, especially for metals that are easily excited to
higher energy levels at a relatively low flame temperature (mainly Na, K, Rb, Cs, Ca,
Ba, Cu).This technique uses a flame that evaporates the solvent and also
sublimates and atomizes the metal and then excites a valence electron to an upper
energy state. Light is emitted at characteristic wavelengths for each metal as the
electron returns to the ground state that makes qualitative determination possible.
Flame photometers use optical filters to monitor for the selected emission
105
JPSBR: Volume 3, Issue 3: May June 2013 (105-107)
wavelength produced by the analyte species. Comparison of
emission intensities of unknowns to either that of standard
solutions (plotting calibration curve), or to those of an internal
standard (standard addition method), allows quantitative
analysis of the analyst metal in the sample solution. Flame
photometry is based on measurement of intensity of light
emitted when metal is introduced into a flame.
A
photoelectric flame photometer is a device used in inorganic
chemical analysis to determine the concentration of certain
metal ions, among them sodium, potassium, lithium, and
calcium. The wavelengths of the colour tell us what the
element is and the color intensity tells us how much element
is present. Flame photometry is also named as flame emission
spectroscopy because of use of flame to provide the energy of
excitation to atoms introduced into the flame. In principle, it
is a controlled flame test with the intensity of the flame colour
quantified by photoelectric circuitry. The sample is introduced
to the flame at a constant rate. Filters select which colours the
photometer detects and exclude the influence of other ions.
Before use, the device requires calibration with a series of
standard solutions of the ion to be tested. The
spectrophotometric technique as proven to be one of the
most reliable and used techniques for the determination of
concentration of Sodium, Potassium, Calcium and Magnesium.
MATERIAL AND METHODS:
Material: Sodium Chloride, Potassium Chloride, Distilled
water, Water sample collected from Girna and Godavari River.
Instrument:
Figure 1 Flame photometer (Make-Elico-Model-CL220)
Apparatus: Volumetric flasks, beaker, Glass rod, Magnetic
stirrer.
Preparation of standard solution:
An analytical reagent quality sodium chloride (NaCl) is weigh
Amrutkar R. D. et al
ISSN NO. 2271-3681
and transfers it into 1 liter volumetric flask through a funnel.
Simultaneously weigh 1.909 gm of analytical reagent quality of
potassium chloride (KCl) and transfer it into the same
volumetric flask through the same funnel. Add double distilled
water to the flask, dissolved the crystals and make up the
solution to the mark with double distilled water. The stock
standard solution contains 1000 ppm/1000 ppm of sodium
and potassium. From this stock standard solution 100, 80, 60,
40, 20 ppm solution of lower concentration was prepared.
Aspirate Distilled Water and set the read out 00 by adjusting
the zero control. Aspirate the standard solution that has
higher concentration adjust the nobe to 100. For optimum
performance the instrument should be allow 15 min to warm
up during this warm up period a blank demonized water
sample should be aspirated. Emissions were noted for all
standard solution. Lastly water sample solutions were
aspirated and emission was noted.
PROCEDURE:
Operating instruction:
1.
2.
Switch the instrument on.
Open the lid of filter chamber. Insert appropriate filter for
the test opening and close the lids.
3. Insert the free end of the PVC take up capillary in distill
water or the reagent. Adjust set zero controls to obtain 00
display on read out.
4. Insert the free end of the PVC take up capillary in the
Na/Ca and K/Li working solution of highest concentration
of the element to be determined.
5. Set the coarse selector of the each channel to low, medium
or high range as depending on the working standard of
highest concentration. Calibration in each channel.
6. Adjust the control of each channel to obtain a display
exactly 100 on the read out of the channel.
7. Repeat operation of steps 3 and 6 to ensure 00 and 100
are display respectively when the blank and the working
standard solution of highest concentration are aspirated
into the flame.
8. Insert the free end of the PVC take up capillary in distilled
water for a minute or two to wash the mixing chamber
thoroughly before the actual test.
9. Insert the free end of the PVC take up capillary in the
sample read the value of the concentration as displayed in
the read out.
10. Feed the working standard solution of known
concentration from time to time in a series of test to check
the calibration. Check the 00 with the blank solutions.
beakers, Glass rod etc.
106
JPSBR: Volume 3, Issue 3: May June 2013 (105-107)
ISSN NO. 2271-3681
RESULT AND DISCUSSION:
Potassium content
Emission
+
For K
23
41
20
40
3
4
60
80
62
83
63
83
5
6
100
Unknown-I ( Girna river)
100
26
100
02
7
Unknown-II (Godavari river)
54
11
The development of flamephotometric method for the
determination of unknown concentration of ions present in
pharmaceuticals has been increases considerable in recent
years because of their importance in pharmaceutical analysis.
The concentration of sodium and potassium present in water
sample collected from river was compare against standard
solution (concentration in ppm) of sodium and potassium.
Table 1 Graph was plotted on Y axis (Intensity of emission)
verses X-axis (concentration in ppm).(Figure 1 and 2) The
concentration of sodium and potassium ions present in Girna
and Godavari river is 26 ppm and 2 ppm and 54 ppm and 11
ppm respectively. Concentration of sodium present in the
water sample is more than potassium.
100
10
0
un
kn
ow
nI
un
kn
ow
nII
80
0
80
60
20
60
40
40
40
20
Concentration in ppm
20
unknown-I
unknown-II
REFERENCES:
1.
2.
3.
5.
6.
unknown-II
Figure 2 Comparative Graph of Sodium content in standard
100
for unknown we take unknown sample collected from the
river. Therefore it could be an experiment recommended in
the routine pharmaceutical analysis practical for
undergraduate student.
unknown-I
Intensity of Emission
80
solution and water sample
100
60
60
Figure 3 Comparative Graph of Potassium content in standard
120
80
40
Intensity of Emission
4.
Sodium Content
20
10
0
un
kn
ow
nI
un
kn
ow
nII
1
2
Emission
+
For Na
22
38
80
Concentration in ppm
120
100
80
60
40
20
0
20
Sr. No.
Concentration in ppm
Table: 1 Emission for Na and K with respective concentration
and unknown sample
60
+
40
+
7.
Chatwal, G. and Anand, S., Instrumentals methods by
chemical analysis, Himalaya, publishing house Bombay,
1995, 2.367-3.388.
th
Remington, the science and practice of pharmacy, 20
edition. Volume-I by Lippincott Williams and Wilkins. 632.
D. A. Skoog - D. M. West - F. J. Holler: Fudamentals of
Analytical Chemistry (Saunders College Publishing, Fort
Worth, US 1992.)
Indian Pharmacopoeia 1996, government of Indian
ministry of health and family welfare, volume-I, Published
by controller of Publication, Delhi Pg.no.-A-72.
A. H. Beckett, J. B. Stenlake, Practical Pharmaceutical
Chemistry, Part-2, Published by CBS Publishers and
th
distributors 4 edition, Pg. no-258
Flame Photometric Analysis of Sodium and Potassium in
Nanogram Samples of Mammalian Nervous Tissue Journal
of Neurochemistry, 1968; 15 (7)547–562.
Worth H.G., A comparison of the measurement of sodium
and potassium by flame photometry and ion-selective
electrode". Ann. Clin. Biochem. 1985; 22, 343-50.
solution and water sample
CONCLUSION:
The obtained statistical information for determination of
Concentration of sodium and potassium ions in water sample
collected from rivers by flamephotometric method conclude
that Concentration of sodium present in the river water
sample is more than potassium. This method is simple and
accurate therefore Instead of taking the marketed formulation
for unknown we take unknown sample collected from the
Amrutkar R. D. et al
107


© Copyright 2026