
Mini-symposium 09: Large-Scale Structures and Galaxy Clusters Dec, 1998
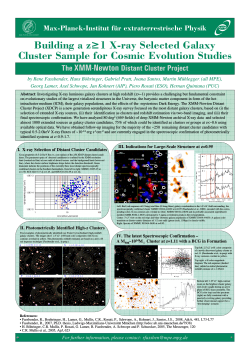
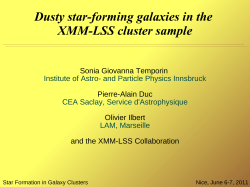
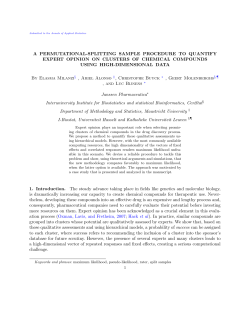
Dec,
Dec, 1998
1998
PARIS
Mini-symposium
Mini-symposium 09:
09: Large-Scale
Large-Scale Structures
Structures and
and Galaxy
Galaxy Clusters
Clusters
19TH TEXAS SYMPOSIUM
The Mass Function of an X-Ray Flux-Limited
Sample of Galaxy Clusters
Thomas H. Reiprich and Hans B¨
ohringer
Max-Planck-Institut f¨
ur extraterrestrische Physik
85740 Garching, Germany
Email: [email protected], [email protected]
Abstract. Using the brightest clusters in the ROSAT All-Sky Survey we compiled
an X-ray flux-limited sample of galaxy clusters. The clusters have been reanalysed
using ROSAT PSPC pointed observations if possible. The gravitational mass has
been determined individually for each cluster in a homogeneous way assuming
hydrostatic equilibrium. The mass function has been derived. We present the
preliminary results and a comparison to previous determinations.
1.
Introduction
Distribution functions of physical parameters of galaxy clusters can place important
constraints on cosmological scenarios. Comparison of the mass function with
analytical or numerical calculations can yield, e. g., the amplitude of the initial density
fluctuations. Comparison of the X-ray luminosity, gas temperature or mass function
in different redshift bins can give information about the cluster evolution.
Several authors have published an X-ray luminosity function, e. g., [1], [2], [3], [4],
[5]. Also a cluster temperature function has been determined, e. g., [6], [7]. A cluster
gas mass function has been given by Burns et al. (1996), [8], for an optically selected
cluster sample. A gravitational mass function has previously been determined by
Bahcall & Cen (1993), [9], Biviano et al. (1993), [10], and Girardi et al. [11]. Bahcall
& Cen used the galaxy richness and velocity dispersion to relate to cluster masses from
the optical side and a temperature-mass relation to convert the temperature function
of Henry & Arnaud (1991), [6], to a mass function from the X-ray side. Biviano
et al. and Girardi et al. used velocity dispersions for an optically selected sample to
determine the mass function.
Since there is now high quality X-ray data available for the sample selection – using
the ROSAT All-Sky Survey (RASS) – and detailed cluster analysis – using ROSAT
and ASCA pointed observations – we have derived for the first time the galaxy cluster
gravitational mass function using individually determined X-ray masses.
2.
The Sample
Completeness of a cluster sample is essential for the construction of the mass function.
We compiled the clusters from RASS-based cluster surveys of high completeness
(REFLEX, NORAS [12]) and compared also with other published catalogs [13], [14],
[15], [16], [17]. To avoid the high absorption and the crowded stellar field in which
Mini-symposium
Mini-symposium 09:
09: Large-Scale
Large-Scale Structures
Structures and
and Galaxy
Galaxy Clusters
Clusters
Dec,
Dec, 1998
1998
2
clusters are hardly recognized in the galactic plane, only clusters with a galactic
latitude |b| ≥ 20.0 have been included. For the same reasons the area around the
Magellanic Clouds has been excluded. In addition the Virgo cluster region has been
excluded here. The sky coverage is 26,720 deg2 .
We reanalysed the clusters using mainly ROSAT PSPC pointed observations and
determined the X-ray flux fX (0.1–2.4 keV). 63 clusters have a flux greater than or equal
to our adopted flux limit fXlim (0.1–2.4 keV)= 2.0 · 10−11 erg/s/cm2. We call this cluster
sample HiFluGCS (the Highest X-ray Flux Galaxy Cluster Sample). The distribution
of HiFluGCS in galactic coordinates can be seen in Fig. 1.
Figure 1. Distribution of HiFluGCS in galactic coordinates. Open Triangles
indicate clusters lying in the direction of the galactic plane, these are not included
in HiFluGCS.
3.
Data Reduction and Analysis
We used mainly high exposure ROSAT PSPC pointed observations to determine the
surface brightness profiles of the clusters, excluding obvious point sources. If no
pointed PSPC observations were available in the archive or if clusters were too large
for the field of view of the PSPC we used RASS data. To calculate the gas density
profile the standard β-model [18], [19] (equ. 1) has been used.
− 32 β
r2
ρgas (r) = ρgas (0) 1 + 2
rc
(1)
Mini-symposium
Mini-symposium 09:
09: Large-Scale
Large-Scale Structures
Structures and
and Galaxy
Galaxy Clusters
Clusters
Dec,
Dec, 1998
1998
3
−3β+ 12
R2
SX (R) = SX (0) 1 + 2
rc
(2)
Fitting the corresponding surface brightness formula (equ. 2) to the observed surface
brightness profiles gives the parameters needed to derive the gas density profile.
To check if the often detected central excess emission (central surface brightness
of a cluster exceeding the fit value) biases the mass determination we also fitted a
double β-model of the form SX = SX1 + SX2 and calculated the gas mass profile by
ρgas = ρ2gas1 + ρ2gas2 . Comparison of the single and double β-model gas masses shows
good agreement.
We compiled the values for the gas temperature from the literature, giving
preference to temperatures measured by the ASCA satellite [20], [21], [22], [23].
For clusters for which we did not find a published temperature we used the X-ray
luminosity-temperature relation given by Markevitch (1998), [7].
Assuming hydrostatic equilibrium the gravitational masses for the clusters can
be determined. Plugging equ. 1 into the hydrostatic equation and assuming the
intracluster gas to be isothermal yields the gravitational mass profile
1
3kTgas r3 β
.
(3)
Mtot (r) =
µmp G
r2 + rc2
Having aquired the gravitational mass profiles for the clusters it is now important
to determine the radius at which to determine the cluster mass. Simulations by
Evrard et al. (1996), [24], have shown that the assumption of hydrostatic equilibrium
is generally valid within a radius where the mean gravitational mass density is greater
than or equal to 500 times the critical density ρc = 4.7 · 10−30 g cm−3 , as long as
clusters undergoing strong merger events are excluded. This radius we call r500 . We
calculated the gravitational mass at r500 and also r200 which is usually referred to as
the virial radius. Using these definitions of the outer radius instead of a fixed length
also allows the uniform treatment of clusters of different size. Using r500 also saves
us from an extrapolation much beyond the significantly measured cluster emission in
general.
4.
Results
In Fig. 2 we show the X-ray luminosity function of HiFluGCS compared to
luminosity functions of other cluster samples. There is good agreement between these
determinations, if anything than HiFluGCS shows a marginally higher density.
In Fig. 3 we show the gravitational mass function for HiFluGCS for different
definitions of the outer radius. Also shown are the mass functions obtained by
Bahcall & Cen (1993), [9], and Girardi et al. (1998), [11], for an outer radius of
3 h−1
50 Mpc. Comparing our r500 mass function with that of Bahcall & Cen we find
increasing discrepancy towards lower mass clusters up to a factor of 7–8. For the
r200 mass function this discrepancy becomes less for the lower mass clusters but a
discrepancy arises towards the high mass end. In order to be able to directly compare
the mass function for the clusters in HiFluGCS with the two others shown in Fig. 3
we determined the gravitational mass also at a fixed radius of 3 h−1
50 Mpc. Apart from
the highest mass bin we almost exactly reproduce the mass function determined by
Bahcall & Cen in this way. The value given by Girardi et al. lying a factor 3–4 higher.
Mini-symposium
Mini-symposium 09:
09: Large-Scale
Large-Scale Structures
Structures and
and Galaxy
Galaxy Clusters
Clusters
Dec,
Dec, 1998
1998
4
Figure 2. Luminosity function of HiFluGCS compared to luminosity functions of
other cluster samples.
Figure 3. Cumulative gravitational mass function of HiFluGCS for different
definitions of the outer radius compared to previous determinations which used a
fixed radius of 3 h−1
50 Mpc.
Mini-symposium
Mini-symposium 09:
09: Large-Scale
Large-Scale Structures
Structures and
and Galaxy
Galaxy Clusters
Clusters
Dec,
Dec, 1998
1998
5
5.
Discussion
Two major points are of concern when deriving the mass function:
1) The sample completeness and 2) the reliability of the mass estimates.
1) We compiled the clusters from RASS-based cluster surveys. These surveys are
complete at the 90 % level. The incompleteness of these surveys is likely to be highest
at fluxes close to their adopted flux limit, which is much lower (factor ∼ 5) than the
flux limit adopted for HiFluGCS. Additionally we checked further published X-ray
cluster catalogs. Besides the fact that still some clusters need to be checked in more
detail we conclude that HiFluGCS is essentially complete.
2) For the first time we have determined a mass function with cluster masses determined individually and in a homogeneous way for each cluster using high quality
X-ray data. However, galaxy clusters are generally not spherically symmetric and
hydrostatic equilibrium may not always be reached. Simulations by Schindler (1996),
[25], and Evrard et al. (1996), [24], however, have shown independently that the determined and true mass do not differ dramatically (≤ 20 %) if extreme merger clusters
are excluded. Clusters also may not always be isothermal. For instance Markevitch
et al. (1998), [20], find a general trend that the temperature decreases with increasing
radius, with the effect that the assumption of isothermality leeds to an overestimation
of the gravitational mass in the outer parts (∼ 6 core radii) of clusters by ∼ 30 %.
However, also average relative temperature profiles of cluster samples have been found
which are consistent with being isothermal, e. g., Irwin et al. (1999), [26].
6.
Conclusions
By reanalysing the brightest clusters of RASS-based galaxy cluster surveys we
constructed a complete X-ray flux-limited sample of galaxy clusters (HiFluGCS), the
sky coverage being roughly 2/3 of the entire sky. We determined global physical
parameters for the clusters using mainly high exposure ROSAT PSPC pointed
observations. The luminosity function for HiFluGCS agrees well with previous
determinations. We determined the mass function for the first time by individually
determining the gravitational mass of each cluster in a homogeneous way assuming
hydrostatic equilibrium and isothermality. Comparison with previous determinations
shows a strong discrepancy especially towards lower mass clusters which is mainly due
to the definition of the outer radius. For comparison we also determined the cluster
masses at a fixed radius of 3 h−1
50 Mpc and apart from the highest mass bin we almost
exactly reproduce the mass function determined by Bahcall & Cen. However, we
suggest to use as outer boundary a radius which depends on the mean gravitational
mass density, e. g. r500 , r200 , in order to treat clusters of different size in a comparable
way.
Another consequence of the definition of the outer radius becomes visible when one
integrates the mass function to determine the mass density bound in galaxy clusters
ρbound . We find ρbound relative to the critical density ρc to be 1.0 % for clusters of
masses 2.5 · 1013 h−1
50 M and higher using r500 . The fraction increases slightly to 1.6 %
for clusters of masses 4.1 · 1013 h−1
50 M and higher when we use r200 . We find a larger
increase if we formally calculate the fraction for a fixed radius of 3 h−1
50 Mpc, which
M
and
higher.
Despite
these different
is 3.8 % for clusters of masses 1.3 · 1014 h−1
50
Mini-symposium
Mini-symposium 09:
09: Large-Scale
Large-Scale Structures
Structures and
and Galaxy
Galaxy Clusters
Clusters
Dec,
Dec, 1998
1998
6
results depending on the outer boundary, however, it is clear that only a small portion
of the total mass in the Universe is bound in galaxy clusters as the largest collapsed
entities, implying that most of the mass must be somewhere else.
References
[1] I. M. Gioia, J. P. Henry, T. Maccacaro, S. L. Morris, J. T. Stocke & A. Wolter, Astrophys J.,
356, L35 (1990).
[2] J. P. Henry, I. M. Gioia, T. Maccacaro, S. L. Morris, J. T. Stocke & A. Wolter, Astrophys J.,
386, 408 (1992).
[3] S. De Grandi, MPE Report, 263, 577 (1996).
[4] H. Ebeling, A. C. Edge, A. C. Fabian, S. W. Allen, C. S. Crawford & H. B¨
ohringer, Astrophys.
J., 479, L101 (1997).
[5] P. Rosati, R. Della Ceca, C. Norman & R. Giacconi, Astrophys. J., 492, L21 (1998).
[6] J. P. Henry & K. A. Arnaud, Astrophys. J., 372, 410 (1991).
[7] M. Markevitch, Astrophys. J., 504, 27 (1998).
[8] J. O. Burns, M. J. Ledlow, C. Loken, A. Klypin, W. Voges, G. L. Bryan, M. L. Norman & R. A.
White, Astrophys. J., 467, L49 (1996).
[9] N. A. Bahcall & R. Cen, Astrophys. J., 407, L49 (1993).
[10] A. Biviano, M. Girardi, G. Giuricin, F. Mardirossian & M. Mezzetti, Astrophys. J., 411, L13
(1993).
[11] M. Girardi, S. Borgani, G. Giuricin, F. Mardirossian, M. Mezzetti & W. Boschin, Astrophys. J.,
506, 45 (1998).
[12] H. B¨
ohringer et al., in prep.
[13] H. Ebeling, A. C. Edge, H. B¨
ohringer, S. W. Allen, C. S. Crawford, A. C. Fabian, W. Voges &
J. P. Huchra, MNRAS, 301, 881 (1998).
[14] H. Ebeling, W. Voges, H. B¨
ohringer, A. C. Edge, J. P. Huchra & U. G. Briel, MNRAS, 281, 799
(1996).
[15] J. Beuing, S. D¨
obereiner, H. B¨
ohringer & R. Bender, MNRAS, 302, 209 (1998).
[16] O. Lahav, A. C. Edge, A. C. Fabian & A. Putney, MNRAS, 238, 881 (1989).
[17] A. C. Edge, G. C. Stewart, A. C. Fabian & K. A. Arnaud, MNRAS, 245, 559 (1990).
[18] A. Cavaliere & R. Fusco-Femiano, Astron. Astrophys., 49, 137 (1976).
[19] P. Gorenstein, D. Fabricant, K. Topka, F. R. Harnden, Jr. & W. H. Tucker, Astrophys. J., 224,
718 (1978).
[20] M. Markevitch, W. R. Forman, C. L. Sarazin & A. Vikhlinin, Astrophys. J., 503, 77 (1998).
[21] Y. Fukazawa, Ph. D. thesis, University of Tokyo (1997).
[22] A. C. Edge & G. C. Stewart, MNRAS, 252, 414 (1991).
[23] L. P. David, A. Slyz, C. Jones, W. Forman & S. D. Vrtilek, Astrophys. J., 412, 479 (1993).
[24] A. E. Evrard, C. A. Metzler & J. F. Navarro, Astrophys. J., 469, 494 (1996).
[25] S. Schindler, Astron. Astrophys., 305, 756 (1996).
[26] J. A. Irwin, J. N. Bregman & A. E. Evrard, astro-ph/9901406, (1999).


© Copyright 2026