
Dusty star-forming galaxies in the XMM-LSS cluster sample Sonia Giovanna Temporin Pierre-Alain Duc
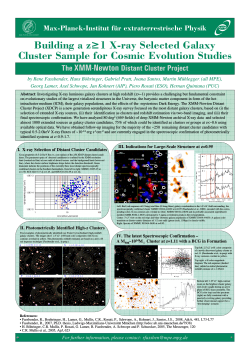
Dusty star-forming galaxies in the XMM-LSS cluster sample Sonia Giovanna Temporin Institute of Astro- and Particle Physics Innsbruck Pierre-Alain Duc CEA Saclay, Service d'Astrophysique Olivier Ilbert LAM, Marseille and the XMM-LSS Collaboration Star Formation in Galaxy Clusters Nice, June 6-7, 2011 Context — Star formation in clusters Local Universe Well established results: Star formation is suppressed in clusters (Kennicutt 1983, Gómez+ 2003). No LIRGs are found in clusters. Universe at z ~ 1 Enhanced star formation activity within higher density environments like groups (e.g. Elbaz+ 2007, Marcillac+ 2008). Intermediate redshifts: the obscured side of star formation LIRGs found in individual clusters ISO observations: e.g. Duc+ 2002, 2004; Coia+ 2005; Spitzer observations: e.g. Geach+ 2006; Marcillac+ 2007; Bai+ 2008; Haines+ 2009 AKARI observations: e.g. Koyama+ 2008 ... suggest an IR equivalent to the Butcher-Oemler effect Increasing fraction of 24 µm cluster galaxies with SFR > 4 Ms/yr from 3% @ z~ 0.02 to 13% @ z~0.8 (8 clusters, Spitzer data, Saintonge+ 2008). Evidence of excess of far-IR galaxies in 66 SDSS clusters @ <z> ~ 0.25 (Herschel-ATLAS, Coppin+ 2011). Possible triggering mechanisms? Pre-processing in infalling groups (e.g. Cortese+ 2006, Boué+ 2008); Ram-pressure stripping combined with interactions (e.g. simulations by Kronberger+ 2008 and Martig & Bournaud 2008). ... Investigating the IR Butcher-Oemler effect within the XMM-LSS C1 cluster sample: Is there a significant excess of mid-IR sources at given cluster radii? Goal Exploring dust-enshrouded star formation (and/or activity) out to the cluster periphery and its evolution with redshift as compared to the field. Method: statistical approach Studying the distribution of 24 µm-selected sources in a statistically significant, well-defined cluster sample and a sample of control fields extracted from the same dataset. Single-band mid-IR emission correlates well with total LIR => tracer of SF (e.g. Takeuchi+ 2005, Dale+ 2005). We derive LIR from F(24 μm) by using Chary & Elbaz (2001) templates → this is reasonable in our redshift range, up to z~1. XMM-LSS cluster sample “C1” sample (Pacaud+ 2007, Adami+ 2011, Clerc+ in prep.) over the 10 deg2 of the XMM-LSS, a surface brightness limited survey. Selection criteria: X-ray extension > 5''; extension likelihood > 33; detection likelihood > 32. Cluster confirmation based on optical photometry and spectroscopy. Redshift range: z ~ 0.05 – 1.05 Temperature range: ~ 0.6 – 4 keV M500 range ~ 1013 – 2x10¹⁴ M¯ Advantages X-ray selected clusters over a contiguous area of the sky; Well known selection function (Pacaud+ 2007); Spitzer/SWIRE (Lonsdale+ 2003) IRAC+MIPS mapping (~ 9 deg2) => Suited for statistical studies out to cluster periphery ● Sample of control fields from the same dataset; Availability of multiwavelength data, in particular: CFHTLS u*g'r'i'z' photometry => photometric redshifts with Le_Phare (Ilbert+ 2006, McCracken+ 2008 using T03 release). ● Enlarged C1 sample: 37 clusters over ~ 10 deg² of XMM-LSS out of which: 33 with Spitzer-MIPS data and 25 within CFHTLS W1 field with photo-z based on 5-bands (Ilbert, Le_Phare) Selection of 24µm sources: from SWIRE-XMM 2008 band-merged catalogue F24 > 180 µJy (with optical or IRAC counterpart, otherwise F > 400 µJy) r < 10' centered on X-ray position Same selection applied to randomly chosen control fields with available photo-z over the survey area free of X-ray clusters. Distribution of 24 µm sources Azimuthally averaged, projected surface density profiles of 24 µm sources. Surface densities are computed within 100 kpc-wide cluster-centric annuli. Individual clusters: the profiles suggest the presence of an excess of sources in some cases, but the signal is too weak (Temporin+ 2008, arXiv: 0810.5499). Improve the signal through stacking! two alternatives: 1) Stacked density profiles with a statistical subtraction of fore/background sources (Temporin+ 2009, AN 330, 915). 2) Stacked density profiles after pre-selection of sources according to photo-z. Results with method of statistical background subtraction Stacked density profiles in 4 redshift bins for clusters (solid lines) and field (dashed lines) Only mid-IR sources with flux > 5σ Clusters whose areas significantly overlap have been discarded Weak excess density of 24 µm sources at z > 0.3 for radii 200 – 500 kpc. Temporin et al. 2009, AN 330, 915 Subtraction of statistical background from cluster profiles Excess of ~ 3 sources/Mpc2 Stacked density profiles after pre-selection of candidate members with photo-z 24 µm sources with photo-z compatible with cluster membership (accounting for σ∆z/(1+z) ~ 0.05 and 3000 km/s velocity dispersion) out to 10'-radius. All sources Only LIRGs and ULIRGs Comparison with control fields Stacked density profiles for 82 control fields after pre-selection of 24 µm sources within the same redshift intervals used for clusters. Distributions are flat with typical densities of 1 – 2 IR sources/Mpc2 Stacked density profiles for 2 subsamples of 16 control fields (one in black, one in colour). The number of control fields and the redshift distribution match those of clusters in each redshift bin. Oscillations are smaller than the density peaks @ r < 1 Mpc for clusters in the 2 medium-z bins. Cluster profiles before and after subtraction of the average field distribution Density profiles on physical cluster scales Mid-IR source counts in annuli of width 0.2 * r500 centred on cluster X-ray position. Subsample of 17 clusters with completed X-ray analysis. LIRGs all 24 μm LIRGs LIRGs all 24 μm LIRGs Rest-frame Color-Magnitude Diagrams black: optical sources green: 24 µm sources LIR < 1011 Lsun red: 24 µm sources LIR > 1011 Lsun Photo-z pre-selection reduces efficiently fore/background contamination. MIR sources mainly in green valley. Some MIR sources on red sequence. Consistent with dusty, star-forming galaxies. Fraction of LIRGs increases steeply with z Population of CMD diagram (photo-z pre-selected sources) Optical sources 24 µm L< 1011L¯ 24 µm L> 1011L¯ The fraction of LIRGs w.r.t the total number of galaxies in clusters within radii of 500 kpc and 2.2 Mpc increases with redshift. The trend for the 2.2 Mpc radius is similar to the one observed in the field (only a few individual clusters show a clearly higher fraction than the field). Within 500 kpc radius, the fraction tends to be higher in clusters, though not in all of them. There are large variations between clusters at similar redshifts... why? Difference in mass? Difference in dynamical state of the clusters? incomplete Fraction of 24 µm sources per color interval in individual clusters as a function of redshift within radii of 200 kpc, 500 kpc, 1 Mpc, and 2.2 Mpc. “Green” sources dominate at r > 200 kpc, while “blue” sources dominate at r < 200 kpc. Summary & Conclusions First statistical study of the distribution of 24 µm-sources in clusters at z = 0.05 – 1.05 out to cluster periphery. Comparison of stacked, azimuthally averaged, surface density radial profiles of 24 µm sources for cluster sample and randomly selected control fields. 2 methods: statistical evaluation of bkg (27 clusters in 4 z-bins); pre-selection with photo-z (25 clusters in 4 z-bins) We find an excess of 24 µm sources (~ 3 sources/Mpc2) w.r.t. the field at cluster-centric radii ~ 200 – 500 kpc @ z ~ 0.3 – 0.8. At these intermediate redshifts the number of LIRGs in the explored region around clusters ranges between ~ 15 and 100 candidate cluster members. Color-magnitude diagrams show that mid-IR sources in clusters mostly populate the “green valley”, with a smaller number of objects falling on the red sequence, consistent with dusty star-forming galaxies. Color distribution of 24 µm sources within clusters suggests that bluer 24 µm sources are found also at r < 200 kpc, while green / red sources dominate at r > 200 kpc. These results need to be confirmed by spectroscopic follow-up.


© Copyright 2026