
Mother's House Cleaning Service - Sample Plan
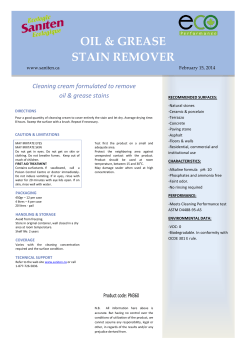
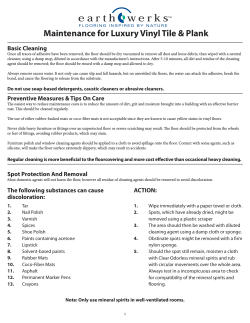
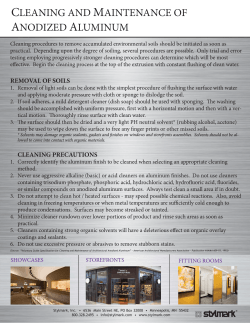
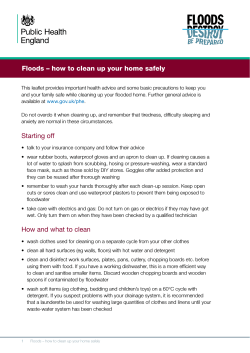
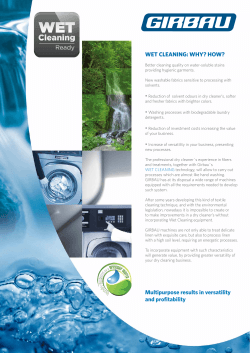
le
mp
Sa
ro
Mother's House Cleaning Service - Sample Plan
nP
This sample business plan was created using Business Plan Pro®business planning software published by Palo Alto Software.
This plan may be edited using Business Plan Pro and is one of 500+
sample plans available from within the software.
Pla
To learn more about Business Plan Pro and other planning products for
small and medium sized businesses, visit us at www.paloalto.com.
This is a sample business plan and the names, locations and numbers may have been
changed, and substantial portions of the original plan text may have been omitted to
preserve confidentiality and proprietary information.
ess
You are welcome to use this plan as a starting point to create your own, but you do not have
permission to resell, reproduce, publish, distribute or even copy this plan as it exists here.
sin
Requests for reprints, academic use, and other dissemination of this sample plan should be
emailed to the marketing department of Palo Alto Software at [email protected]. For
product information visit our Website: www.paloalto.com or call: 1-800-229-7526.
Bu
Copyright © Palo Alto Software, Inc., 1995-2007.
All rights reserved.
Confidentiality Agreement
mp
le
The undersigned reader acknowledges that the information provided by
_________________________ in this business plan is confidential; therefore, reader agrees
not to disclose it without the express written permission of _________________________.
It is acknowledged by reader that information to be furnished in this business plan is in all
respects confidential in nature, other than information which is in the public domain through
other means and that any disclosure or use of same by reader, may cause serious harm or
damage to _________________________.
Sa
Upon request, this document is to be immediately returned to _________________________.
___________________
Signature
ro
___________________
Name (typed or printed)
nP
___________________
Date
Bu
sin
ess
Pla
This is a business plan. It does not imply an offering of securities.
Copyright © Palo Alto Software, Inc. 1995-2007 All rights reserved. Not for resale, reproduction, publication, or distribution. www.paloalto.com
Table of Contents
Executive Summary . . . . . . . . . . . . . . . . . . . . . . . . . . . . . . . . . . . . . . . . . . . . . . . . . 1
1.1
Objectives . . . . . . . . . . . . . . . . . . . . . . . . . . . . . . . . . . . . . . . . . . . . . . . . . . . . 2
1.2
Mission . . . . . . . . . . . . . . . . . . . . . . . . . . . . . . . . . . . . . . . . . . . . . . . . . . . . . . 2
2.0
Company Summary . . . . . . . . . . . . . . . . . . . . . . . . . . . . . . . . . . . . . . . . . . . . . . . . . 3
2.1
Company Ownership . . . . . . . . . . . . . . . . . . . . . . . . . . . . . . . . . . . . . . . . . . . . 3
2.2
Start-up Summary . . . . . . . . . . . . . . . . . . . . . . . . . . . . . . . . . . . . . . . . . . . . . . 3
3.0
Services . . . . . . . . . . . . . . . . . . . . . . . . . . . . . . . . . . . . . . . . . . . . . . . . . . . . . . . . . . 5
4.0
Market Analysis Summary . . . . . . . . . . . . . . . . . . . . . . . . . . . . . . . . . . . . . . . . . . . .
4.1
Market Segmentation . . . . . . . . . . . . . . . . . . . . . . . . . . . . . . . . . . . . . . . . . . . .
4.2
Target Market Segment Strategy . . . . . . . . . . . . . . . . . . . . . . . . . . . . . . . . . . .
4.3
Competition and Buying Patterns . . . . . . . . . . . . . . . . . . . . . . . . . . . . . . . . . . . .
5
6
7
8
5.0
Strategy and Implementation Summary . . . . . . . . . . . . . . . . . . . . . . . . . . . . . . . . .
5.1
Competitive Edge . . . . . . . . . . . . . . . . . . . . . . . . . . . . . . . . . . . . . . . . . . . . . .
5.2
Sales Strategy . . . . . . . . . . . . . . . . . . . . . . . . . . . . . . . . . . . . . . . . . . . . . . . . .
5.2.1 Sales Forecast . . . . . . . . . . . . . . . . . . . . . . . . . . . . . . . . . . . . . . . . . . .
5.3
Milestones . . . . . . . . . . . . . . . . . . . . . . . . . . . . . . . . . . . . . . . . . . . . . . . . . . . .
8
8
9
10
11
6.0
Management Summary . . . . . . . . . . . . . . . . . . . . . . . . . . . . . . . . . . . . . . . . . . . . . . 12
6.1
Personnel Plan . . . . . . . . . . . . . . . . . . . . . . . . . . . . . . . . . . . . . . . . . . . . . . . . . 12
7.0
Financial Plan . . . . . . . . . . . . . . . . . . . . . . . . . . . . . . . . . . . . . . . . . . . . . . . . . . . . .
7.1
Important Assumptions . . . . . . . . . . . . . . . . . . . . . . . . . . . . . . . . . . . . . . . . . .
7.2
Break-even Analysis . . . . . . . . . . . . . . . . . . . . . . . . . . . . . . . . . . . . . . . . . . . . .
7.3
Projected Profit and Loss . . . . . . . . . . . . . . . . . . . . . . . . . . . . . . . . . . . . . . . . .
7.4
Projected Cash Flow . . . . . . . . . . . . . . . . . . . . . . . . . . . . . . . . . . . . . . . . . . . . .
7.5
Projected Balance Sheet . . . . . . . . . . . . . . . . . . . . . . . . . . . . . . . . . . . . . . . . . .
7.6
Business Ratios . . . . . . . . . . . . . . . . . . . . . . . . . . . . . . . . . . . . . . . . . . . . . . . .
Bu
sin
ess
Pla
nP
ro
Sa
mp
le
1.0
Copyright © Palo Alto Software, Inc. 1995-2007 All rights reserved. Not for resale, reproduction, publication, or distribution. www.paloalto.com
13
13
14
15
16
18
18
Mother's House Cleaning Service
1.0 Executive Summary
le
Mother's House Cleaning Service (MHCS) is a start-up organization based in Cleanly, WA.
MHCS specializes in high-end residential house cleaning. By offering a professional,
trustworthy, and effective service, Mother's will quickly grow their business.
mp
From the outset, MHCS has developed several ambitious objectives. The first is to always, with
every customer, exceed his or her expectations. Exceeding customer's expectations will ensure
repeat business and word of mouth referrals. Increasing their client base by 20% a year is
their second objective. The third is to achieve cash sustainability by the end of year one. The
last objective is to have a 30% conversion rate of prospective customers into clients.
Sa
The Market
ro
While there is plenty of competition in the residential cleaning industry, there are few
competitors that are considered professional and trustworthy. MHCS will target two distinct
market segments to go after, two income and one-income wealthy families. The affluent single
income households are growing at 11%. The two income families are growing at a slightly
faster rate of 13%.
Services Offered
Management
Pla
nP
As mentioned earlier, MHCS is a residential household cleaning service. They are able to
handle all sorts of residential needs, from general house cleaning to child and pet disasters. All
of their services are offered in the most professional manner possible. Professionalism,
trustworthiness and effectiveness are MHCS' mantras. By having the following characteristics
as mantras, customers immediately feel at ease with MHCS. This is indicated by the fact that it
is not uncommon for clients, after their first appointment, to provide MHCS with house keys so
they may come in unattended at their leisure to provide future services.
ess
With years in the industry, sole proprietor Sarah Tookleen has decided to take a stab at
opening her own business in the industry that she has so much knowledge and experience of.
Sarah initially spent several years at Sanitation Management, a nationwide cleaning service.
She then moved onto Immaculate Cleanception where Sarah received ample management
training. It was these experiences that gave Sarah the skills and confidence to open her own
business.
Bu
sin
MHCS is an exciting opportunity that combines the skills and passion of the principal with an
unmet need in Cleanly, WA. Profit margins will be 1.4% in year 1 and 14.7% in year three.
MHCS will generate over $188,000 in sales by the end of year one and $228,000 by the end of
year three.
Copyright © Palo Alto Software, Inc. 1995-2007 All rights reserved. Not for resale, reproduction, publication, or distribution. www.paloalto.com Page
1
Mother's House Cleaning Service
le
Highlights
mp
$250,000
$200,000
Sa
$150,000
$100,000
Gross Margin
Net Profit
ro
$50,000
Sales
$0
2003
2004
nP
2002
1.1 Objectives
1.2 Mission
ess
Pla
Mother's House Cleaning Service's objectives for the first three years of operation include:
• To create a service based company whose #1 goal is exceeding customer's
expectations.
• To increase our number of clients served by 20% per year through superior service.
• To develop a sustainable home-based business, living off its own cash flow.
• The utilization of Mother's House Cleaning Service on a regular basis by at least 30% of
the leads that contact us for more information.
Bu
sin
Mother's House Cleaning Service's mission is to provide the customer with all residential
cleaning services in an environmentally sound, completely trustworthy, and professional
manner. We exist to attract and maintain customers. When we adhere to this maxim,
everything else will fall into place. Our services will exceed the expectations of our customers.
Copyright © Palo Alto Software, Inc. 1995-2007 All rights reserved. Not for resale, reproduction, publication, or distribution. www.paloalto.com Page
2
Mother's House Cleaning Service
2.0 Company Summary
mp
le
Mother's House Cleaning Service (MHCS), soon to be located in Cleanly, WA, will offer
residential home cleaning services. MHCS will offer a wide range of services to the residential
client, from general room cleaning to child/pet disasters. We will be going after the upper end
of the market, typically the affluent whose spouse does not have a full-time job but chooses to
do other things with his/her time, or the two income family who chooses not to clean the home
themselves.
Sa
The business will be based out of Sarah Tookleen's home. Sarah will be responsible for
scheduling, estimates, training, inventory, ordering, payroll and customer care management.
The business organizational type will be a sole proprietorship, with six employees within the
first 12 months.
ro
According to sales forecasts, net profits per month will be 10% of sales by the end of the first
year and will grow to 14.7% by year three.
2.1 Company Ownership
nP
Mother's House Cleaning Service will be a sole proprietorship, owned by Sarah Tookleen.
2.2 Start-up Summary
Pla
Mother's House Cleaning Service's start-up costs include equipment needed for a home-based
business (to be detailed below), initial legal fees, marketing fees, cleaning equipment and
supplies, uniforms, and signs for employee vehicles.
ess
The home office equipment includes a computer system (with the following minimum
specifications: 500 mhz processor, 64 megabytes RAM, 6 gigabyte hard drive, printer, and CDRW). Also required for the office is an additional land phone line, fax machine, pager, and
cellular phone. A few pieces of furniture will also be needed.
The legal fees are used for the formation of the business as well as reviewing/generating
employee and client contracts.
Marketing fees are for the production of business cards and brochures.
sin
Cleaning equipment must also be purchased with one set of equipment per employee. The
major per employee expense is a commercial vacuum cleaner (consumer models will not
withstand continuous use) and assorted brooms, mops, and chemicals (biodegradable).
Uniforms will be used to give off a professional image.
Bu
Lastly, we will have a few magnetic company signs made to turn the employee car into the
appearance of a company car.
Copyright © Palo Alto Software, Inc. 1995-2007 All rights reserved. Not for resale, reproduction, publication, or distribution. www.paloalto.com Page
3
Mother's House Cleaning Service
Table: Start-up
le
Start-up
Start-up Assets Needed
Cash Balance on Starting Date
Start-up Inventory
Other Current Assets
Total Current Assets
$9,075
$0
$0
$9,075
$0
$9,075
$13,000
nP
Long-term Assets
Total Assets
Total Requirements
Current Liabilities
Accounts Payable
Current Borrowing
Other Current Liabilities
Current Liabilities
Pla
Funding
Investment
Investor 1
Investor 2
Other
Total Investment
Sa
$300
$50
$200
$500
$100
$800
$100
$100
$1,500
$75
$200
$0
$3,925
ro
Start-up Expenses
Legal
Stationery etc.
Brochures
Insurance
Uniforms
Cleaning Equipment
Office Furniture
Communication Equipment
Computer Equipment
Magnetic Car Signs
Cleaning Supplies
Other
Total Start-up Expenses
mp
Requirements
ess
Long-term Liabilities
Total Liabilities
$0
$0
$0
$0
$0
$0
($3,925)
$9,075
$9,075
Bu
sin
Loss at Start-up
Total Capital
Total Capital and Liabilities
$13,000
$0
$0
$13,000
Copyright © Palo Alto Software, Inc. 1995-2007 All rights reserved. Not for resale, reproduction, publication, or distribution. www.paloalto.com Page
4
Mother's House Cleaning Service
le
Start-up
mp
$14,000
$12,000
$10,000
Sa
$8,000
$6,000
$4,000
$0
Assets
Investment
Loans
nP
Expenses
ro
$2,000
3.0 Services
Pla
Mother's House Cleaning Service will provide a residential house cleaning service for the upper
end of the market. We will have two target customers:
1. The affluent who has a spouse who does not work, but is not inclined to do housework.
To many a maid/house cleaner is a symbol of wealth, and this idea symbolizes this
group of customers.
2. The two-income households whose opportunity costs are too great to spend time
cleaning the house.
ess
MHCS offers house cleaning to these targeted customers. House cleaning ranges from cleaning
of standard rooms such as kitchen, bathrooms, bedrooms, as well as more unusual jobs like
small disasters from children and pets.
sin
4.0 Market Analysis Summary
Bu
Mother's House Cleaning Service will target the upper end of the house cleaning market. It
would appear, at least if you opened the yellow pages, that there is not a need for another
house cleaning service. Make no mistake however, there is a need for a quality, honest
service. MHCS is offering a high quality, totally trustworthy service for high income
households. Our service will ooze professionalism. We are perfectionists and this will be clear
by our service.
Cleanly, WA currently has quite a range of different residential house cleaning services, from
independent companies to franchise services. No one else is specifically targeting the wealthy.
We will be targeting two wealthy populations:
1. Wealthy one-income households.
2. Affluent two-income households.
Copyright © Palo Alto Software, Inc. 1995-2007 All rights reserved. Not for resale, reproduction, publication, or distribution. www.paloalto.com Page
5
Mother's House Cleaning Service
le
Both of these targeted groups appreciate a professional, reliable, trustworthy, cleaning service
and are willing to pay a premium to get this top shelf level of service. We will be marketing our
service to these people through word of mouth referrals as well as through membership lists
from Cleanly's exclusive membership clubs.
mp
Cleanly, WA, like most cities, has lots of cleaning services. Although there are lots of
competitors, we are the only company to go after the upper socio/economic class exclusively.
Demand for a upper-end cleaning service will allow us to have steady growth.
4.1 Market Segmentation
ro
Sa
Mother's House Cleaning Service will be focusing on two upper socio/economic groups. The
first is the affluent where only one spouse works. Although the other spouse is at home and
has time to clean, he/she chooses not to. This spouse would rather volunteer for a public
interest organization, play tennis and golf, or just spend time how he/she chooses to. They
have no desire to clean the house. To them that is not enjoyable and they have the money to
pay someone to do that kind of work. This market has annual incomes over $200,000 and live
in expensive houses. While Cleanly, WA only has 650 families that fall into this category, this
group reliably uses cleaning services.
Pla
nP
Our second segment of the market that we are targeting is the two income family. Over the
last couple of decades, the number of two-income households have increased, to a point
where in parts of the country they exceed one income families. Our target customer is two
income families whose combined annual income is over $125,000. These families don't really
have the time to clean, can afford a cleaning service, and choose to hire a service because the
opportunity costs are too high to waste time cleaning their house. These households are
typically age 32-55 and live in houses valued over $250,000. Cleanly has approximately
10,000 families that fall into this demographic. It is this segment which has tremendous
potential for us. Nearly 80% of dual income households use an outside cleaning service for
some of their house cleaning according to the U.S. Department of Commerce.
ess
Additionally, there are some potential customers that MHCS has labeled as assorted "well-off"
households. These are families that have the money for our services that do not fit neatly into
the two previous categories.
Table: Market Analysis
Growth
11%
2002
7
2003
8
2004
9
2005
10
2006
11
CAGR
11.96%
13%
8
9
10
11
12
10.67%
6%
8
8
8
8
8
0.00%
7.75%
23
25
27
29
31
7.75%
Bu
sin
Market Analysis
Potential Customers
Wealthy One-income
Households
Affluent Two-income
Households
Assorted "Well-off"
Households
Total
Copyright © Palo Alto Software, Inc. 1995-2007 All rights reserved. Not for resale, reproduction, publication, or distribution. www.paloalto.com Page
6
Mother's House Cleaning Service
mp
le
Market Analysis (Pie)
Wealthy One-income Households
Sa
Affluent Two-income Households
nP
ro
Assorted "Well-off" Households
4.2 Target Market Segment Strategy
Pla
MHCS is focusing on these people because they appreciate a professional, reliable,
trustworthy, and immaculate house cleaning service, and are more than willing to pay for this.
While Cleanly, WA has several different cleaning services, we are the only one that targets the
affluent exclusively. The wealthy are consistent customers. Whether they have a house
cleaning service does not depend on the finances each month. These groups always have the
money for our services, just as they always need/desire a clean house.
ess
The affluent desire quality and are willing to pay a premium for a service that that they can
trust 100%, that extrudes professionalism, and basically allows them to forget that they have
to deal with whatever it takes to get a clean house. We do all of this in a seamless, customer
centric manner.
Bu
sin
We will market our company through a two-pronged approach. One prong is the distribution of
a color brochure detailing our services. The distribution of this document will be targeted to hit
our chosen segment. This will be done by setting up strategic relationships with organizations
or clubs whose members fits our targeted customer profile. Examples of this would be higherend athletic clubs, country clubs, wine connoisseur clubs, etc. We will gain access to these
clubs membership through deals where the club owners will receive our services for
themselves to test the quality so they then feel comfortable with helping us by being a
"cheerleader" for our service.
The second prong of our approach will be through word of mouth referrals. We will offer an
economic incentive (such as a free visit) to our customers if they bring in new business for us.
We believe this will be effective because the financial incentive will motivate their behavior,
and people naturally like to share good things with their friends.
Copyright © Palo Alto Software, Inc. 1995-2007 All rights reserved. Not for resale, reproduction, publication, or distribution. www.paloalto.com Page
7
Mother's House Cleaning Service
4.3 Competition and Buying Patterns
mp
le
Although there are lots of competitors in the cleaning service space, there is good reason for
this competition, demand is high. Plenty of maid/janitorial services have waiting lists, they are
unable to meet demand. Additionally, many of the maid and janitorial services are "mom and
pop" operations without enough employees. Cleaning service customers want quality, and not
everyone in the cleaning service space offers quality. How often when you ask one of your
friends for a referral do they tell you they have been using a bunch of different companies and
they have yet to find one that they are truly happy with.
ro
Sa
The residential house cleaning niche is a subset of the larger cleaning business. Within the
cleaning business, there are both residential as well as commercial cleaners. The commercial
cleaners are typically a janitorial service that offers a wide range of services from general
office cleaning, to carpet cleaning, to window cleaning. Janitorial services are a one-stop
service offering for commercial businesses. There are also residential cleaning services. The
residential house cleaning market is serviced predominately by independent companies. There
are however, a few large franchises. Residential services are divided into a couple of different
categories, maid or house cleaners, carpet cleaners, window cleaners, and a variety of other
services that are required on a less frequent basis. They are far more restricted in their range
of offered services relative to the commercial janitorial services.
nP
We charge a premium for our services, and people are willing to pay to get our unsurpassed
level of professionalism, trustworthiness, and attention to detail. We provide the most pleasant
experience possible.
Pla
5.0 Strategy and Implementation Summary
ess
Mother's House Cleaning Service will be courting the high income families in Cleanly, WA. We
will be attractive to these customers because of our commitment to professional, trustworthy
service. We will achieve this high level of service through extensive training and a continuous
learning process. MHCS will be qualifying leads over the phone with estimates and more
importantly, with in-house meetings. This sales strategy should yield a steady increase in jobs
starting from month two.
5.1 Competitive Edge
Bu
sin
Our competitive advantage will be based on our large investment in human capital. MHCS
begins with a rigorous training program for new employees. At the outset, employees with be
trained on how to clean. Granted everyone has some idea on how to clean, but we will show
them a methodical way producing a far cleaner home more efficiently. We will then be training
employees to work effectively on teams. While there are some households that prefer
individual cleaners instead of a team, a request that we are more then happy to oblige, we
generally work in teams as they are more efficient. Working efficiently on a team takes
training, and through this team training, we are able to make significant gains in efficiency.
The next topic of training involves professionalism. We provide our employees the tools
necessary to impress our most affluent clients. Professionalism is a skill that is used
throughout the service call, from the way the employee greets and interacts with the client, to
the way they clean, to the way they act when they break that priceless vase (which in the
inevitable case that we do break something, we have specific guidelines for the employee to
follow to resolve the conflict).
Copyright © Palo Alto Software, Inc. 1995-2007 All rights reserved. Not for resale, reproduction, publication, or distribution. www.paloalto.com Page
8
Mother's House Cleaning Service
We finally train our employees to know what the expectations of our clients are. We will
provide them the tools needed to exceed these expectations.
mp
le
This extensive training, both up front, as well as continuously (called our continuous learning
system) builds a trust relationship between our company and the client. It is the bond of trust
that will not only earn MHCS the loyalty of that customer but also the referral of several more
of their friends. Satisfied customers like to tell their friends about service providers that they
are happy with, people like to "spread the wealth" with their friends.
Lastly we will emphasize our use of environmentally sound chemicals. Other companies also
use environmentally sound chemicals so this is not a huge differentiation, but it is something
that we are proud of, and will be mentioned.
Sa
We will also be creating the appearance of professionalism through the use of uniforms and
large magnetic sign affixed to the side of the vehicles we use.
ro
5.2 Sales Strategy
Pla
nP
The sales process will begin through the qualification of leads generated from our marketing
campaign. The marketing campaign will primarily generate leads through interest sparked
from our brochures. Someone will call to receive more information about our service, while we
will be able to give them an estimate over the phone, we would prefer to be able to get into
their home and speak with them. On one hand we would be able to offer them a more
accurate estimate. More importantly however, it provides us an opportunity to impress them
with our company. We feel confident that since we are dealing with the affluent, who for many
services are less price sensitive, are more likely to be impressed with our professionalism,
"feel" an immediate trust bond forming, and sign up for the service.
ess
For those clients whom we are only able to speak with over the phone, we will initially quote
them a price. Because they are less price sensitive then the general population, we will then
detail why our service is priced a bit higher than most. Mother's House Cleaning Service will
explain all of the different training systems and methodologies that each employee goes
through, and what expectations are reasonable for the customer to form about our superior
service. This conversation will leave the prospective customer the impression that MHCS is
indeed different from the run of the mill residential cleaning services and that the price
differential is justified.
Bu
sin
Lastly, we will be qualifying the leads by explaining up front that our service is more
expensive. This is not a fact that we are trying to hide. We are setting up an expectation for
the customer that they can indeed expect more with our service. This "angle" is based on the
assumption that many people are not thrilled with their current cleaning service. Sure they
clean adequately, but there is not a trust bond formed as if you had the same house cleaner
for 20 years who helped raise your children. This is how we will differentiate ourselves and
ultimately win over new customers.
Copyright © Palo Alto Software, Inc. 1995-2007 All rights reserved. Not for resale, reproduction, publication, or distribution. www.paloalto.com Page
9
Mother's House Cleaning Service
5.2.1 Sales Forecast
mp
le
The first month will be used to set up the business. It is unlikely much/any business will be
officially transacted. In addition to dealing with legal and accounting issues for the business,
office equipment will be purchased and set up. Once the physical office is ready we will then
develop the employee policy and procedure manual. Then we will develop our training
program. This will take a bit of time therefore it is very important it is set up at the outset,
ensuring that it is completed and done properly when there are far less time constraints.
Sa
The second month will begin to see some activity. We will begin to field inquiries over the
phone and expect to turn some of those into contracts. The first week of jobs will be done as a
team, with Sarah and one employee. As the number of contracts begin to pick up at the end of
the second month an additional person will be hired to form the first employee team. By the
end of month four we will have built up enough demand that a new team of two will be trained
and begin working. Having two teams of two will be sufficient until month seven when two
more people will be brought on. We expect to remain with a six person head count into midyear two when we expect to bring on one more team.
Pla
Table: Sales Forecast
nP
ro
The sales forecast is based on the assumption that increased demand will occur at a steady
pace. This is based on the assumption that a large part for our new clients after month two will
be from word of mouth referrals. The logic is that we will incrementally gain customers as we
continue to serve current customers. We will need a couple of visits before we can turn a new
client into a referral service. All this will happen steadily and incrementally. This forecast is on
the conservative side, it is possible that because we are superior to competing services that
things really take off, however, it would not be prudent to take that aggressive of a forecast. It
is always better to err on the side of caution.
2002
$61,633
$126,937
$188,570
2003
$67,796
$139,631
$207,427
2004
$74,576
$153,594
$228,170
Direct Cost of Sales
Wealthy One-income Households
Affluent Two-income Households
Subtotal Direct Cost of Sales
2002
$1,601
$3,907
$5,508
2003
$1,681
$4,102
$5,783
2004
$1,765
$4,307
$6,073
Bu
sin
ess
Sales Forecast
Sales
Wealthy One-income Households
Affluent Two-income Households
Total Sales
Copyright © Palo Alto Software, Inc. 1995-2007 All rights reserved. Not for resale, reproduction, publication, or distribution. www.paloalto.comPage
10
Mother's House Cleaning Service
le
Sales Monthly
mp
$30,000
$25,000
$20,000
$15,000
Wealthy One-income Households
Sa
Affluent Two-income Households
$10,000
$5,000
nP
ro
$0
5.3 Milestones
ess
Pla
Mother's House Cleaning Service will have several milestones early on:
1. Business plan completion. This will be done as a roadmap for the organization. While
we do not need a business plan to raise capital, it will be an indispensable tool for the
ongoing performance and improvement of the company.
2. Set up the office. This will be done within the first month. This includes setting up the
physical office where business will be transacted.
3. Set up the supply room. This will be done in Sarah's garage. It will occur in the first
month and will be the place where all of the bulk, environmentally sound, chemicals will
be mixed into the proper concentrations.
4. Training program. This will be the development of a training program for the
employees. The employees will receive initial sessions of training up-front, but will
undergo constant training, part of our constant learning process.
5. Welcoming our sixth employee.
sin
Table: Milestones
Bu
Milestones
Milestone
Business Plan Completion
Office Set-up
Set-up Supply Room
Training Program
Welcome Sixth Employee
Totals
Start Date
1/1/10
1/1/01
1/1/01
1/1/01
6/1/01
End Date
2/1/01
2/1/01
2/1/01
2/1/01
6/1/01
Budget
$0
$0
$0
$0
$0
$0
Manager
Tookleen
Tookleen
Tookleen
Tookleen
Everyone
Department
Management
Management
Management
Management
Everyone
Copyright © Palo Alto Software, Inc. 1995-2007 All rights reserved. Not for resale, reproduction, publication, or distribution. www.paloalto.comPage
11
Mother's House Cleaning Service
6.0 Management Summary
le
Mother's House Cleaning Service is owned and operated by Sarah Tookleen. It will be formed
as a sole proprietorship. There is no compelling need to incorporate. The advantage of
incorporation, limited liability, can be offset by good insurance.
ro
Sa
mp
Sarah Tookleen, founder and owner, has a degree in History from Alfred University. Sarah
spent three of her four years in college working for a Sanitation Management cleaning service.
Sanitation Management was both a residential and commercial cleaning service. Sarah worked
on a cleaning crew with two other individuals. By the end of Sarah's third year she was
promoted to crew manager and was responsible for coordinating the jobs for that crew, as well
as all customer interactions. After college, Sarah moved from New York to Seattle where she
was employed as a Manager of Immaculate Cleanception, a residential house cleaning service.
Sarah managed the 23 person organization for two years. Her responsibilities included all
facets of management including, hiring, training, customer service, inventory control, and
purchasing. It was her experience at Immaculate Cleanception that provided Sarah with the
skills and confidence to open up her own company. She decided to move Cleanly, an upscale
suburb of Seattle with her husband and start her own company.
nP
6.1 Personnel Plan
The staff will consist of Sarah working full time for MHCS. Initially Sarah will be working in both
the office as well as on jobs, by the end of month two she will be working only in the office and
will have hired an additional employee. Month five will see an additional two people hired, and
month six will see two more hired for a total of six employees.
ess
Pla
We will be paying our employees $12 an hour, quite a bit more than minimum wage. This is
calculated to attract a much higher caliber employee that is not looking for temporary
employment, but a stable job environment. This is compounded by the fact that in order to
make our training cost effective for us, we need this person to be a part of the company for an
extended period of time, not just a few months until a better job comes along. In addition to
paying an above market wage, we will be offering extensive training. This personal
development will be another attraction for the high caliber employee. The need for the higher
class employee is necessitated because of the upper end clients that we serve. In order to
exceed the customer's expectations of our services, we need to have the right employee that
has been properly trained and feels a sense of empowerment on the job.
sin
Sarah will be paid a salary of $2,000 a month. The rest of the profits will remain within the
business.
Table: Personnel
Personnel Plan
Bu
Owner
Employees
Total People
Total Payroll
2002
$24,000
$120,776
0
$144,776
2003
$25,200
$126,815
0
$152,015
2004
$26,460
$133,156
0
$159,616
Copyright © Palo Alto Software, Inc. 1995-2007 All rights reserved. Not for resale, reproduction, publication, or distribution. www.paloalto.comPage
12
Mother's House Cleaning Service
7.1 Important Assumptions
See following table for MHCS' general assumptions.
General Assumptions
2002
1
10.00%
10.00%
14.58%
0.00%
2003
2
10.00%
10.00%
25.00%
0.00%
2004
3
10.00%
10.00%
14.58%
0.00%
$144,776
$182,754
$6,207
$152,015
$191,465
$5,834
$159,616
$202,302
$6,104
Bu
sin
ess
Pla
nP
ro
Plan Month
Current Interest Rate
Long-term Interest Rate
Tax Rate
Other
Calculated Totals
Payroll Expense
New Accounts Payable
Inventory Purchase
Sa
Table: General Assumptions
mp
The following subtopics will provide more financial information.
le
7.0 Financial Plan
Copyright © Palo Alto Software, Inc. 1995-2007 All rights reserved. Not for resale, reproduction, publication, or distribution. www.paloalto.comPage
13
Mother's House Cleaning Service
7.2 Break-even Analysis
mp
le
The break-even analysis is based on the figure of $25.00 for the average billing unit. The
calculations are based on a $1.00 unit of revenue and costs a percentage of $1.00.
Break-even Analysis
$20,000
$15,000
Sa
$10,000
$5,000
$0
($5,000)
ro
($10,000)
($15,000)
$0
$6,000
$12,000
$18,000
$24,000
$30,000
nP
Monthly break-even point
Pla
Break-even point = where line intersects with 0
Table: Break-even Analysis
15,224
$15,224
Assumptions:
Average Per-Unit Revenue
Average Per-Unit Variable Cost
Estimated Monthly Fixed Cost
$1.00
$0.03
$14,755
Bu
sin
ess
Break-even Analysis:
Monthly Units Break-even
Monthly Revenue Break-even
Copyright © Palo Alto Software, Inc. 1995-2007 All rights reserved. Not for resale, reproduction, publication, or distribution. www.paloalto.comPage
14
Mother's House Cleaning Service
7.3 Projected Profit and Loss
$3,000
Sa
$2,000
$1,000
$0
ro
($1,000)
($2,000)
($4,000)
nP
($3,000)
Jul Aug Sep Oct Nov Dec
Pla
Jan Feb Mar Apr May Jun
Table: Profit and Loss
mp
Profit Monthly
le
The following table will indicate projected profit and loss.
Pro Forma Profit and Loss
Sales
Direct Cost of Sales
Production Payroll
Other
sin
ess
Total Cost of Sales
Gross Margin
Gross Margin %
Expenses:
Payroll
Depreciation
Chemicals and Supplies
Gas/Mileage Reimbursement
Leased Equipment
Utilities
Insurance
Rent
Payroll Taxes
Contract/Consultants
Bu
Total Operating Expenses
Profit Before Interest and Taxes
Interest Expense
Taxes Incurred
Net Profit
Net Profit/Sales
Include Negative Taxes
TRUE
2002
$188,570
$5,508
$0
$0
-----------$5,508
$183,062
97.08%
2003
$207,427
$5,783
$0
$0
-----------$5,783
$201,644
97.21%
2004
$228,170
$6,073
$0
$0
-----------$6,073
$222,097
97.34%
$144,776
$960
$1,665
$4,048
$0
$1,200
$2,400
$0
$21,716
$300
-----------$177,065
$5,997
$0
$3,351
$2,645
1.40%
$152,015
$960
$1,920
$4,048
$0
$1,200
$2,400
$0
$22,802
$0
-----------$185,345
$16,299
$0
$4,075
$12,224
5.89%
$159,616
$960
$4,048
$4,048
$0
$1,200
$2,400
$0
$23,942
$0
-----------$196,214
$25,883
$0
$3,775
$22,109
9.69%
TRUE
TRUE
Copyright © Palo Alto Software, Inc. 1995-2007 All rights reserved. Not for resale, reproduction, publication, or distribution. www.paloalto.comPage
15
Mother's House Cleaning Service
7.4 Projected Cash Flow
$16,000
$14,000
Sa
$12,000
mp
Cash
le
The following table will indicate projected cash flow.
$10,000
$8,000
$6,000
Cash Balance
ro
$4,000
Net Cash Flow
$2,000
$0
nP
($2,000)
($4,000)
Jul Aug Sep Oct Nov Dec
Bu
sin
ess
Pla
Jan Feb Mar Apr May Jun
Copyright © Palo Alto Software, Inc. 1995-2007 All rights reserved. Not for resale, reproduction, publication, or distribution. www.paloalto.comPage
16
Mother's House Cleaning Service
Table: Cash Flow
2002
Cash Received
Cash from Operations:
Cash Sales
Cash from Receivables
Subtotal Cash from Operations
$188,570
$0
$188,570
Additional Cash Received
Non Operating (Other) Income
Sales Tax, VAT, HST/GST Received
New Current Borrowing
New Other Liabilities (interest-free)
New Long-term Liabilities
Sales of Other Current Assets
Sales of Long-term Assets
New Investment Received
Subtotal Cash Received
$0
$0
$0
$0
$0
$0
$0
$0
$188,570
$0
$0
$0
$0
$0
$0
$0
$0
$207,427
$0
$0
$0
$0
$0
$0
$0
$0
$228,170
2002
2003
2004
$2,910
$179,204
$182,114
$2,828
$191,565
$194,393
$2,831
$202,298
$205,129
$0
$0
$0
$0
$0
$0
$0
$0
$182,114
$0
$0
$0
$0
$0
$0
$0
$0
$194,393
$0
$0
$0
$0
$0
$0
$0
$0
$205,129
$6,456
$15,531
$13,034
$28,566
$23,041
$51,606
Sa
mp
$228,170
$0
$228,170
Bu
sin
ess
Pla
nP
Additional Cash Spent
Non Operating (Other) Expense
Sales Tax, VAT, HST/GST Paid Out
Principal Repayment of Current Borrowing
Other Liabilities Principal Repayment
Long-term Liabilities Principal Repayment
Purchase Other Current Assets
Purchase Long-term Assets
Dividends
Subtotal Cash Spent
2004
$207,427
$0
$207,427
ro
Expenditures
Expenditures from Operations:
Cash Spending
Payment of Accounts Payable
Subtotal Spent on Operations
Net Cash Flow
Cash Balance
2003
le
Pro Forma Cash Flow
Copyright © Palo Alto Software, Inc. 1995-2007 All rights reserved. Not for resale, reproduction, publication, or distribution. www.paloalto.comPage
17
Mother's House Cleaning Service
The following table will indicate the projected balance sheet.
Pro Forma Balance Sheet
2002
$15,531
$699
$0
$16,230
$0
$960
($960)
$15,270
Long-term Liabilities
Total Liabilities
7.6 Business Ratios
$0
$2,880
($2,880)
$49,507
2003
$3,451
$0
$0
$3,451
2004
$3,454
$0
$0
$3,454
$0
$3,550
$0
$3,451
$0
$3,454
$13,000
($3,925)
$2,645
$11,720
$15,270
$11,720
$13,000
($1,280)
$12,224
$23,944
$27,395
$23,944
$13,000
$10,944
$22,109
$46,053
$49,507
$46,053
Pla
Paid-in Capital
Retained Earnings
Earnings
Total Capital
Total Liabilities and Capital
Net Worth
2004
$51,606
$780
$0
$52,387
2002
$3,550
$0
$0
$3,550
nP
Accounts Payable
Current Borrowing
Other Current Liabilities
Subtotal Current Liabilities
$0
$1,920
($1,920)
$27,395
ro
Liabilities and Capital
2003
$28,566
$749
$0
$29,315
Sa
Assets
Current Assets
Cash
Inventory
Other Current Assets
Total Current Assets
Long-term Assets
Long-term Assets
Accumulated Depreciation
Total Long-term Assets
Total Assets
mp
Table: Balance Sheet
le
7.5 Projected Balance Sheet
Bu
sin
ess
The following table contains important business ratios from the building maintenance services
industry, as determined by the Standard Industry Classification (SIC) Index code 7349.
Copyright © Palo Alto Software, Inc. 1995-2007 All rights reserved. Not for resale, reproduction, publication, or distribution. www.paloalto.comPage
18
Mother's House Cleaning Service
Table: Ratios
Ratio Analysis
2003
10.00%
2004
10.00%
Industry Profile
7.30%
Percent of Total Assets
Accounts Receivable
Inventory
Other Current Assets
Total Current Assets
Long-term Assets
Total Assets
0.00%
4.58%
0.00%
106.29%
-6.29%
100.00%
0.00%
2.73%
0.00%
107.01%
-7.01%
100.00%
0.00%
1.58%
0.00%
105.82%
-5.82%
100.00%
24.70%
3.80%
44.90%
73.40%
26.60%
100.00%
Current Liabilities
Long-term Liabilities
Total Liabilities
Net Worth
0.00%
0.00%
0.00%
100.00%
0.00%
0.00%
0.00%
100.00%
0.00%
0.00%
0.00%
100.00%
44.40%
16.40%
60.80%
39.20%
Percent of Sales
Sales
Gross Margin
Selling, General & Administrative Expenses
Advertising Expenses
Profit Before Interest and Taxes
100.00%
97.08%
94.22%
0.93%
3.18%
100.00%
97.21%
93.58%
1.06%
7.86%
100.00%
97.34%
91.63%
1.03%
11.34%
100.00%
0.00%
81.70%
1.30%
2.00%
4.57
4.37
23.25%
51.16%
39.27%
8.50
8.28
12.60%
68.07%
59.50%
15.17
14.94
6.98%
56.20%
52.28%
1.67
1.33
60.80%
3.50%
9.00%
2002
$0
2003
$0
2004
$0
Industry
$22,170
56.61%
2002
1.40%
22.57%
2003
5.89%
51.05%
2004
9.69%
48.01%
0.00
0
12.00
51.48
4
12.35
0.00
0
7.99
55.49
80
7.57
0.00
0
7.94
58.57
75
4.61
n.a
n.a
n.a
n.a
0.30
1.00
0.14
1.00
0.07
1.00
n.a
n.a
$12,680
0.00
$25,864
0.00
$48,933
0.00
n.a
n.a
0.08
23%
4.37
16.09
0.00
0.13
13%
8.28
8.66
0.00
0.22
7%
14.94
4.95
0.00
n.a
n.a
n.a
n.a
n.a
Additional Ratios
Net Profit Margin
Return on Equity
ess
Activity Ratios
Accounts Receivable Turnover
Collection Days
Inventory Turnover
Accounts Payable Turnover
Payment Days
Total Asset Turnover
sin
Debt Ratios
Debt to Net Worth
Current Liab. to Liab.
Liquidity Ratios
Net Working Capital
Interest Coverage
Additional Ratios
Assets to Sales
Current Debt/Total Assets
Acid Test
Sales/Net Worth
Dividend Payout
Bu
mp
Sa
ro
nP
Business Vitality Profile
Sales per Employee
Survival Rate
Pla
Main Ratios
Current
Quick
Total Debt to Total Assets
Pre-tax Return on Net Worth
Pre-tax Return on Assets
le
2002
0.00%
Sales Growth
n.a
n.a
n.a
Copyright © Palo Alto Software, Inc. 1995-2007 All rights reserved. Not for resale, reproduction, publication, or distribution. www.paloalto.comPage
19
Appendix
Appendix Table: Sales Forecast
Sales Forecast
Sales
Wealthy One-income Households
Affluent Two-income Households
Total Sales
Jan
$1,700
$4,150
$5,850
Feb
$1,700
$4,150
$5,850
Mar
$2,745
$4,745
$7,490
Apr
$2,900
$4,900
$7,800
May
$5,308
$9,197
$14,505
Jun
$5,600
$9,558
$15,158
Jul
$5,812
$10,400
$16,212
Aug
$6,900
$14,880
$21,780
Sep
$6,954
$15,300
$22,254
Direct Cost of Sales
Wealthy One-income Households
Affluent Two-income Households
Subtotal Direct Cost of Sales
Jan
$60
$151
$211
Feb
$60
$151
$211
Mar
$65
$160
$225
Apr
$68
$165
$233
May
$132
$354
$486
Jun
$145
$365
$510
Jul
$154
$371
$525
Aug
$165
$387
$552
Sep
$174
$412
$586
u
B
n
i
s
s
e
P
s
n
la
r
P
S
o
Copyright © Palo Alto Software, Inc. 1995-2007 All rights reserved. Not for resale, reproduction, publication, or distribution. www.paloalto.com
m
a
e
l
p
Oct
$7,014
$15,311
$22,325
Nov
$7,100
$17,041
$24,141
Dec
$7,900
$17,305
$25,205
Oct
$181
$445
$626
Nov
$187
$457
$644
Dec
$210
$489
$699
Page 1
Appendix
Appendix Table: Personnel
Personnel Plan
Jan
$2,000
$2,250
0
$4,250
Owner
Employees
Total People
Total Payroll
u
B
n
i
s
s
e
Feb
$2,000
$3,185
0
$5,185
Mar
$2,000
$6,200
0
$8,200
P
s
Apr
$2,000
$6,254
0
$8,254
May
$2,000
$10,029
0
$12,029
n
la
Jun
$2,000
$10,111
0
$12,111
r
P
Jul
$2,000
$10,115
0
$12,115
Aug
$2,000
$13,874
0
$15,874
S
o
Copyright © Palo Alto Software, Inc. 1995-2007 All rights reserved. Not for resale, reproduction, publication, or distribution. www.paloalto.com
Sep
$2,000
$14,001
0
$16,001
m
a
e
l
p
Oct
$2,000
$14,654
0
$16,654
Nov
$2,000
$15,001
0
$17,001
Dec
$2,000
$15,102
0
$17,102
Page 2
Appendix
Appendix Table: General Assumptions
General Assumptions
Plan Month
Current Interest Rate
Long-term Interest Rate
Tax Rate
Other
Calculated Totals
Payroll Expense
New Accounts Payable
Inventory Purchase
u
B
Jan
1
10.00%
10.00%
0.00%
0.00%
Feb
2
10.00%
10.00%
0.00%
0.00%
Mar
3
10.00%
10.00%
0.00%
0.00%
Apr
4
10.00%
10.00%
0.00%
0.00%
May
5
10.00%
10.00%
0.00%
0.00%
Jun
6
10.00%
10.00%
25.00%
0.00%
Jul
7
10.00%
10.00%
25.00%
0.00%
Aug
8
10.00%
10.00%
25.00%
0.00%
$4,250
$5,520
$422
$5,185
$6,851
$211
$8,200
$10,321
$239
$8,254
$10,385
$241
$12,029
$15,164
$739
$12,111
$15,026
$534
$12,115
$15,268
$540
$15,874
$19,865
$579
n
i
s
s
e
P
s
n
la
r
P
S
o
Copyright © Palo Alto Software, Inc. 1995-2007 All rights reserved. Not for resale, reproduction, publication, or distribution. www.paloalto.com
e
l
p
Sep
9
10.00%
10.00%
25.00%
0.00%
Oct
10
10.00%
10.00%
25.00%
0.00%
Nov
11
10.00%
10.00%
25.00%
0.00%
Dec
12
10.00%
10.00%
25.00%
0.00%
$16,001
$20,116
$620
$16,654
$20,741
$666
$17,001
$21,448
$662
$17,102
$22,049
$754
m
a
Page 3
Appendix
Appendix Table: Profit and Loss
Pro Forma Profit and Loss
Sales
Direct Cost of Sales
Production Payroll
Other
Total Cost of Sales
Gross Margin
Gross Margin %
Expenses:
Payroll
Depreciation
Chemicals and Supplies
Gas/Mileage Reimbursement
Leased Equipment
Utilities
Insurance
Rent
Payroll Taxes
Contract/Consultants
15%
Total Operating Expenses
Profit Before Interest and Taxes
Interest Expense
Taxes Incurred
Net Profit
Net Profit/Sales
Include Negative Taxes
u
B
n
i
s
Jan
$5,850
$211
$0
$0
-----------$211
$5,639
96.39%
Feb
$5,850
$211
$0
$0
-----------$211
$5,639
96.39%
Mar
$7,490
$225
$0
$0
-----------$225
$7,265
97.00%
Apr
$7,800
$233
$0
$0
-----------$233
$7,567
97.01%
May
$14,505
$486
$0
$0
-----------$486
$14,019
96.65%
Jun
$15,158
$510
$0
$0
-----------$510
$14,648
96.64%
Jul
$16,212
$525
$0
$0
-----------$525
$15,687
96.76%
$4,250
$80
$0
$0
$0
$100
$200
$0
$638
$0
-----------$5,268
$372
$0
$0
$372
6.35%
$5,185
$80
$135
$368
$0
$100
$200
$0
$778
$0
-----------$6,846
($1,207)
$0
$0
($1,207)
-20.63%
$8,200
$80
$135
$368
$0
$100
$200
$0
$1,230
$0
-----------$10,313
($3,048)
$0
$0
($3,048)
-40.69%
$8,254
$80
$135
$368
$0
$100
$200
$0
$1,238
$0
-----------$10,375
($2,808)
$0
$0
($2,808)
-36.00%
$12,029
$80
$155
$368
$0
$100
$200
$0
$1,804
$0
-----------$14,736
($717)
$0
$0
($717)
-4.95%
$12,111
$80
$155
$368
$0
$100
$200
$0
$1,817
$0
-----------$14,831
($183)
$0
($46)
($137)
-0.90%
$12,115
$80
$155
$368
$0
$100
$200
$0
$1,817
$0
-----------$14,835
$852
$0
$213
$639
3.94%
s
e
P
s
n
la
r
P
S
o
Copyright © Palo Alto Software, Inc. 1995-2007 All rights reserved. Not for resale, reproduction, publication, or distribution. www.paloalto.com
e
l
p
Aug
$21,780
$552
$0
$0
-----------$552
$21,228
97.47%
Sep
$22,254
$586
$0
$0
-----------$586
$21,668
97.37%
Oct
$22,325
$626
$0
$0
-----------$626
$21,699
97.20%
Nov
$24,141
$644
$0
$0
-----------$644
$23,497
97.33%
Dec
$25,205
$699
$0
$0
-----------$699
$24,506
97.23%
$15,874
$80
$155
$368
$0
$100
$200
$0
$2,381
$0
-----------$19,158
$2,070
$0
$517
$1,552
7.13%
$16,001
$80
$160
$368
$0
$100
$200
$0
$2,400
$0
-----------$19,309
$2,359
$0
$590
$1,769
7.95%
$16,654
$80
$160
$368
$0
$100
$200
$0
$2,498
$0
-----------$20,060
$1,639
$0
$410
$1,229
5.51%
$17,001
$80
$160
$368
$0
$100
$200
$0
$2,550
$0
-----------$20,459
$3,038
$0
$759
$2,278
9.44%
$17,102
$80
$160
$368
$0
$100
$200
$0
$2,565
$300
-----------$20,875
$3,631
$0
$908
$2,723
10.80%
m
a
Page 4
Appendix
Appendix Table: Cash Flow
Pro Forma Cash Flow
Cash Received
Cash from Operations:
Cash Sales
Cash from Receivables
Subtotal Cash from Operations
Additional Cash Received
Non Operating (Other) Income
Sales Tax, VAT, HST/GST Received
New Current Borrowing
New Other Liabilities (interest-free)
New Long-term Liabilities
Sales of Other Current Assets
Sales of Long-term Assets
New Investment Received
Subtotal Cash Received
0.00%
Jan
Feb
Mar
Apr
May
Jun
Jul
$5,850
$0
$5,850
$5,850
$0
$5,850
$7,490
$0
$7,490
$7,800
$0
$7,800
$14,505
$0
$14,505
$15,158
$0
$15,158
$16,212
$0
$16,212
$0
$0
$0
$0
$0
$0
$0
$0
$5,850
$0
$0
$0
$0
$0
$0
$0
$0
$5,850
$0
$0
$0
$0
$0
$0
$0
$0
$7,490
$0
$0
$0
$0
$0
$0
$0
$0
$7,800
$0
$0
$0
$0
$0
$0
$0
$0
$14,505
$0
$0
$0
$0
$0
$0
$0
$0
$15,158
$0
$0
$0
$0
$0
$0
$0
$0
$16,212
May
Jun
r
P
Aug
e
l
p
Sep
m
a
Oct
Nov
Dec
$21,780
$0
$21,780
$22,254
$0
$22,254
$22,325
$0
$22,325
$24,141
$0
$24,141
$25,205
$0
$25,205
$0
$0
$0
$0
$0
$0
$0
$0
$21,780
$0
$0
$0
$0
$0
$0
$0
$0
$22,254
$0
$0
$0
$0
$0
$0
$0
$0
$22,325
$0
$0
$0
$0
$0
$0
$0
$0
$24,141
$0
$0
$0
$0
$0
$0
$0
$0
$25,205
Jul
Aug
Sep
Oct
Nov
Dec
S
o
Expenditures
Expenditures from Operations:
Cash Spending
Payment of Accounts Payable
Subtotal Spent on Operations
Jan
Feb
Mar
Apr
$89
$4,745
$4,835
$125
$6,536
$6,662
$151
$10,100
$10,251
$151
$10,380
$10,531
$231
$14,467
$14,698
$213
$15,182
$15,396
$240
$15,038
$15,278
$310
$19,260
$19,569
$323
$20,003
$20,326
$315
$20,804
$21,119
$353
$21,118
$21,472
$408
$21,571
$21,979
Additional Cash Spent
Non Operating (Other) Expense
Sales Tax, VAT, HST/GST Paid Out
Principal Repayment of Current Borrowing
Other Liabilities Principal Repayment
Long-term Liabilities Principal Repayment
Purchase Other Current Assets
Purchase Long-term Assets
Dividends
Subtotal Cash Spent
$0
$0
$0
$0
$0
$0
$0
$0
$4,835
$0
$0
$0
$0
$0
$0
$0
$0
$6,662
$0
$0
$0
$0
$0
$0
$0
$0
$10,251
$0
$0
$0
$0
$0
$0
$0
$0
$10,531
$0
$0
$0
$0
$0
$0
$0
$0
$14,698
$0
$0
$0
$0
$0
$0
$0
$0
$15,396
$0
$0
$0
$0
$0
$0
$0
$0
$15,278
$0
$0
$0
$0
$0
$0
$0
$0
$19,569
$0
$0
$0
$0
$0
$0
$0
$0
$20,326
$0
$0
$0
$0
$0
$0
$0
$0
$21,119
$0
$0
$0
$0
$0
$0
$0
$0
$21,472
$0
$0
$0
$0
$0
$0
$0
$0
$21,979
($812)
$9,279
($2,761)
$6,518
($2,731)
$3,787
($193)
$3,594
($238)
$3,356
$934
$4,290
$2,211
$6,501
$1,928
$8,430
$1,206
$9,636
$2,669
$12,305
$3,226
$15,531
Net Cash Flow
Cash Balance
s
e
$1,015
$10,090
u
B
n
i
s
P
s
n
la
Copyright © Palo Alto Software, Inc. 1995-2007 All rights reserved. Not for resale, reproduction, publication, or distribution. www.paloalto.com
Page 5
Appendix
Appendix Table: Balance Sheet
Pro Forma Balance Sheet
Assets
Current Assets
Cash
Inventory
Other Current Assets
Total Current Assets
Long-term Assets
Long-term Assets
Accumulated Depreciation
Total Long-term Assets
Total Assets
Starting Balances
$9,075
$0
$0
$9,075
Jan
$10,090
$211
$0
$10,301
Feb
$9,279
$211
$0
$9,490
Mar
$6,518
$225
$0
$6,743
Apr
$3,787
$233
$0
$4,020
May
$3,594
$486
$0
$4,080
Jun
$3,356
$510
$0
$3,866
$0
$0
$0
$9,075
$0
$80
($80)
$10,221
$0
$160
($160)
$9,330
$0
$240
($240)
$6,503
$0
$320
($320)
$3,700
$0
$400
($400)
$3,680
$0
$480
($480)
$3,386
Accounts Payable
Current Borrowing
Other Current Liabilities
Subtotal Current Liabilities
$0
$0
$0
$0
Jan
$775
$0
$0
$775
Feb
$1,090
$0
$0
$1,090
Mar
$1,311
$0
$0
$1,311
Apr
$1,316
$0
$0
$1,316
May
$2,013
$0
$0
$2,013
Long-term Liabilities
Total Liabilities
$0
$0
$0
$775
$0
$1,090
$0
$1,311
$0
$1,316
$0
$2,013
$13,000
($3,925)
$0
$9,075
$9,075
$9,075
$13,000
($3,925)
$372
$9,447
$10,221
$9,447
$13,000
($3,925)
($835)
$8,240
$9,330
$8,240
$13,000
($3,925)
($3,883)
$5,192
$6,503
$5,192
$13,000
($3,925)
($6,691)
$2,384
$3,700
$2,384
$13,000
($3,925)
($7,409)
$1,666
$3,680
$1,666
Liabilities and Capital
Paid-in Capital
Retained Earnings
Earnings
Total Capital
Total Liabilities and Capital
Net Worth
u
B
n
i
s
s
e
P
s
n
la
r
P
Jun
$1,857
$0
$0
$1,857
$0
$1,857
$13,000
($3,925)
($7,546)
$1,529
$3,386
$1,529
Jul
$4,290
$525
$0
$4,815
Aug
$6,501
$552
$0
$7,053
S
o
Sep
$8,430
$586
$0
$9,016
m
a
e
l
p
Oct
$9,636
$626
$0
$10,262
Nov
$12,305
$644
$0
$12,949
Dec
$15,531
$699
$0
$16,230
$0
$800
($800)
$9,462
$0
$880
($880)
$12,069
$0
$960
($960)
$15,270
$0
$560
($560)
$4,255
$0
$640
($640)
$6,413
$0
$720
($720)
$8,296
Jul
$2,087
$0
$0
$2,087
Aug
$2,693
$0
$0
$2,693
Sep
$2,806
$0
$0
$2,806
Oct
$2,743
$0
$0
$2,743
Nov
$3,072
$0
$0
$3,072
Dec
$3,550
$0
$0
$3,550
$0
$2,087
$0
$2,693
$0
$2,806
$0
$2,743
$0
$3,072
$0
$3,550
$13,000
($3,925)
($6,907)
$2,168
$4,255
$2,168
$13,000
($3,925)
($5,354)
$3,721
$6,413
$3,721
$13,000
($3,925)
($3,585)
$5,490
$8,296
$5,490
$13,000
($3,925)
($2,356)
$6,719
$9,462
$6,719
$13,000
($3,925)
($78)
$8,997
$12,069
$8,997
$13,000
($3,925)
$2,645
$11,720
$15,270
$11,720
Copyright © Palo Alto Software, Inc. 1995-2007 All rights reserved. Not for resale, reproduction, publication, or distribution. www.paloalto.com
Page 6


© Copyright 2026