
ASTRONOMY & ASTROPHYSICS JUNE II 1997, PAGE 411 SUPPLEMENT SERIES
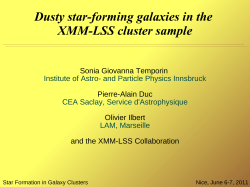
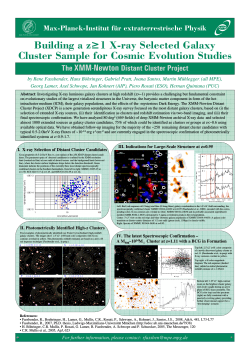
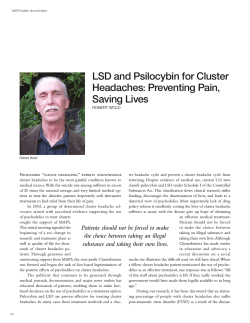
ASTRONOMY & ASTROPHYSICS
JUNE II 1997, PAGE 411
SUPPLEMENT SERIES
Astron. Astrophys. Suppl. Ser. 123, 411-422 (1997)
A sample of galaxy clusters to study the fundamental
plane: Redshift measurements?
S. Maurogordato1, D. Proust1, A. Cappi2 , E. Slezak3 , and J.M. Martin4
1
DAEC, CNRS, Observatoire de Paris-Meudon, 5 place J. Janssen, 92195 Meudon, France
e-mail: [email protected]
2
Osservatorio Astronomico di Bologna, via Zamboni 33, I–40126 Bologna, Italy
e-mail: [email protected]
3
Observatoire de Nice, B4229, Le Mont-Gros, 06304 Nice Cedex 4, France
e-mail: [email protected]
4
ARPEGES, Observatoire de Paris-Meudon, 5 place J. Janssen, 92195 Meudon, France
e-mail: [email protected]
Received June 24; accepted October 7, 1996
Abstract. We present the results of spectroscopic observations of galaxies in a sample of nearby clusters. We
measured galaxy redshifts and estimated cluster velocity
dispersions. These observations were carried out at the
Observatoire de Haute Provence as part of a program aiming at a more detailed study of the Cluster Fundamental
Plane.
Key words: galaxies: clusters of; redshifts — Cosmology:
observations
1. Introduction
Clusters of galaxies are the largest gravitationally bound
systems, with three components contributing to their total
mass: the dark matter (the dominant one), the hot X–ray
emitting gas (the dominant baryonic component), and the
optically luminous stars in galaxies. Determining the distribution of these three components and their correlations
represents a key problem in modern cosmology.
A possible approach is offered by studying the relations between those global cluster properties that can
be more or less directly and easily measured, such as
the velocity dispersion σ, the total luminosity L, and
the effective radius Re . Correlations between intrinsic
parameters have effectively been found for galaxy clusters, as for instance between richness and velocity dispersion (Danese et al. 1980; Cole 1989), and between radius
Send offprint requests to: S. Maurogordato
?
Based on observations made at Haute-Provence
Observatory, CNRS, France.
and luminosity (West et al. 1989). However these relations have a high dispersion. Schaeffer, et al. (1993, hereafter SMCB) analysed a sample of 19 clusters for which
luminosities, radii (West et al. 1989) and velocity dispersions (Struble & Rood 1991) were available. In addition to the radius–luminosity relation found by West
et al. (1989), R ∝ L0.5±0.1, SMCB have also defined
a luminosity–velocity dispersion relation, L ∝ σ2.0±0.4
(much better than the old richness–velocity dispersion relation). By analogy with elliptical galaxies, for which the
above three parameters can be combined in one relation
(Dressler et al. 1987; Djorgovski & Davis 1987) defining
the so–called “fundamental plane”, and given that virialized systems should show a relation between mass, radius and velocity dispersion, SMCB have minimized the
relation L ∝ Rα σβ , and found a best fit with a considerably lower dispersion than the one–independent parameter relations. The parameters α = 0.89 ± 0.15 and
β = 1.28 ± 0.10 have values similar to those measured for
the fundamental plane of elliptical galaxies.
The number of clusters for which the three parameters L, R and σ are reliably measured is however small.
Therefore we have started an observational program to increase the cluster database, a necessary condition for further studies of the Cluster Fundamental Plane. We present
in this paper the results of our spectroscopic observations
of a sample of nearby clusters (redshifts of member galaxies and preliminary estimates of velocity dispersions).
2. The sample
Targets were selected in order to cover a large spread of
masses (richness class 1 to 4) and redshifts (0.04 to 0.25):
they constitute a sample of 16 Abell/ACO clusters.
412
S. Maurogordato et al.: The cluster fundamental plane
Sufficiently nearby clusters, i.e. A195, A1035, A1045,
A1126, A1413, A1468, A1781, A1831, A2034, A2245,
A2312, A2457 have been observed at the Observatoire de
Haute-Provence, and the results are presented in this paper. The farthest ones, A222, A223, A520, A521, have
been observed using the capabilities for multi–object spectroscopy at CFHT and ESO and will be analysed in a
separate paper.
The sample was a priori composed of relatively regular
clusters, in order to derive “unambiguous” velocity dispersions. Nevertheless, in a few cases the velocity distribution
(cf. Sect. 4) has shown evidence of subclustering, projection effects or bimodality, which obviously affect the estimate of the velocity dispersion. For this reason the three
clusters A1035, A1781, A1831 with a complex velocity distribution will not be included in future in our analysis.
In addition to the spectroscopic data, we have also
obtained photometric measurements based on automatic
scans of POSSII plates, which will be presented in a forthcoming paper.
3. Observations and data reduction
A catalogue of galaxies up to magnitude mR = 18.5 has
been built applying the algorithms described in Slezak et
al. (1988) to automatic scans of POSSII plates, thanks
to the MAMA facilities; this catalogue included the coordinates of galaxies within a radius of one degree from
each cluster centre. Selected galaxies have been observed
at the 193 cm telescope of the Observatoire de HauteProvence, using the Carelec spectrograph in long slit mode
(Lemaitre et al. 1990). The choice of the grating represented a compromise between good resolution and reasonable exposure time, and was also constrained by the wavelength range suited for line identification at low–redshift
(∼ 3600 − 7300 ˚
A). The dispersion was 260 ˚
A/mm, corresponding to ∼ 7 ˚
A/pixel with the CCD TK512 (512 × 512
pixels of 27 µm), and with the slit aperture of 100 the
spectral resolution was 8 ˚
A. The following results are
based on four observing runs (7 nights each one) in
April and September 1993, and in April and May 1994.
Unfortunately more than half of the nights were lost for
bad weather conditions.
The exposure time was 45 minutes; two exposures were
taken for faint objects. Wavelength calibrations were done
using an He lamp and an Ar lamp before each exposure.
Standard stars were observed each night (HD 102494,
HD 171232, HD 112299, HD 140913). We obtained the
spectra of about 8/10 objects per night. Usually we obtained one spectrum per exposure, but in some cases,
for instance when sampling the core of rich clusters, we
rotated the spectrograph in order to get simultaneously
the spectra of a few objects. At the end, we have collected 93 spectra with a sufficient signal-to-noise ratio
to allow a good redshift determination. Data reduction
was carried out with IRAF, using the MULTIRED package. MULTIRED is an integrated multi–slit spectra reduc-
tion task (Le F`evre et al. 1995) which allows to process
raw 2D spectra CCD frames (with one or several spectra) into bias/flat/sky corrected 2D spectra and wavelength calibrated 1D spectra. Radial velocities have been
determined using the cross–correlation technique (Tonry
& Davis 1979) implemented in the RVSAO package (developed at the Smithsonian Astrophysical Observatory).
Finding charts for each cluster are displayed in Fig. 1.
They cover 150 × 150 square regions extracted from the
Space Telescope Science Institute Digital Sky Survey1
around the position of the cluster in the Abell/ACO catalogue (300 × 300 for A1413, A1781 and A2457). An identifying number is displayed to the right of each target.
Velocity measurements are listed in Table 1. The
columns are as follows:
Column (1): Abell cluster number (Abell et al. 1989);
Column (2): identification number of each target galaxy
in the cluster as shown in the finding charts; Columns (3)
and (4): right ascension and declination (J2000.0) of the
target galaxy; Column (5): best estimate of the radial
velocity resulting from the cross–correlation technique;
Column (6): estimated error; Column (7): other published
measurement of the radial velocity. The subscript e indicates that the measurement refers to the emission line
velocity.
4. Velocity analysis of the clusters
The number of measured redshifts per cluster is often
quite small (from 5 to 20 galaxies). It is therefore difficult to have reliable estimates of the velocity dispersion.
Using the NED database2 we searched for other galaxies
with measured redshifts within a radius of one degree from
the center of each target cluster. This allowed us to add
one more velocity to A1035 (Batuski et al. 1991), three to
A1413 (Stocke et al. 1991; Allen et al. 1992), one to A1045
(Allen et al. 1992), sixteen to A1831 (NED 1992 and Owen
et al. 1995), two to A2034 (Crawford et al. 1995), four to
A195 (Giovanelli & Haynes 1993), four to A2245 (from
Rhee & Katgert (1988) and NED 1992), six to A 2457
1
Based on photographic data of the National Geographic
Society – Palomar Observatory Sky Survey (NGS-POSS)
obtained using the Oschin Telescope Palomar Mountain.
The NGS-POSS was funded by a grant from the National
Geographic Society to the California Institute of Technology.
The plates were processed into the present compressed digital form with their permission. The Digitized Sky Survey was
produced at the Space Telescope Science Institute under US
Government grant NAG W-2166.
c
Copyright 1994,
Association of Universities for Research
in Astronomy, Inc. All rights reserved.
2
The NASA/IPAC Extragalactic Database (NED) is operated by the Jet Propulsion Laboratory, California Institute of
Technology, under contract with the National Aeronautics and
Space Administration.
S. Maurogordato et al.: The cluster fundamental plane
413
Fig. 1. a) to l): Finding charts for our nearby sample of clusters: a) A195, b) A1035, c) A1045, d) A1126, e) A1413, f )
A1468, g) A1781, h) A1831, i) A2034, j) A2245, k) A2312, l) A2457. These frames are extracted from the Digital Sky Survey
414
Fig. 1. c-d) continued
S. Maurogordato et al.: The cluster fundamental plane
S. Maurogordato et al.: The cluster fundamental plane
Fig. 1. e-f ) continued
415
416
Fig. 1. g-h) continued
S. Maurogordato et al.: The cluster fundamental plane
S. Maurogordato et al.: The cluster fundamental plane
Fig. 1. i-j) continued
417
418
Fig. 1. k-l) continued
S. Maurogordato et al.: The cluster fundamental plane
S. Maurogordato et al.: The cluster fundamental plane
419
Table 1. Heliocentric redshifts for galaxies
CLUSTER
NUMBER
A195
1
2
3
4
5
6
7
8
9
1
2
3
4
5
6
7
8
9
10
11
12
13
14
15
16
17
18
19
1
2
3
4
1
2
3
4
1
2
3
4
5
6
7
8
1
2
3
4
5
6
7
A1035
A1045
A1126
A1413
A1468
A1781
1
2
3
4
5
6
7
R.A.
(2000)
01 26 43.0
01 26 41.6
01 26 51.8
01 26 59.2
01 27 07.0
01 27 06.2
01 26 47.6
01 27 27.9
01 27 32.5
10 32 14.0
10 32 12.6
10 32 05.9
10 32 05.0
10 31 56.9
10 31 53.5
10 31 47.6
10 31 42.5
10 31 45.7
10 31 45.4
10 32 24.8
10 32 24.0
10 32 15.2
10 32 23.3
10 32 11.0
10 31 52.8
10 31 44.9
10 31 56.7
10 31 30.6
10 35 00.2
10 34 52.2
10 35 09.3
10 35 00.9
10 54 02.7
10 53 56.3
10 53 50.2
10 53 45.3
11 54 37.6
11 55 37.6
11 54 58.4
11 55 14.9
11 55 00.5
11 55 09.0
11 55 13.9
11 55 35.9
12 05 24.9
12 05 26.5
12 05 37.1
12 05 28.3
12 05 24.2
12 05 28.5
12 05 51.3
DEC.
(2000)
19 09 13.4
19 10 01.2
19 11 23.1
19 11 49.2
19 08 39.3
19 06 57.4
19 13 19.3
19 14 19.5
19 10 42.8
40 16 15.2
40 17 26.4
40 17 25.0
40 19 03.5
40 18 21.0
40 16 07.7
40 17 19.5
40 16 34.2
40 13 46.6
40 13 58.4
40 13 12.0
40 12 48.0
40 10 09.8
40 10 09.7
40 17 00.5
40 10 56.3
40 09 58.5
40 14 11.0
40 14 51.3
30 41 37.5
30 41 40.4
30 46 03.1
30 45 55 0
16 51 27.6
16 51 13.2
16 51 00.4
16 50 43.3
23 12 50.6
23 14 14.1
23 25 19.4
23 27 53.6
23 22 17.2
23 26 24.3
23 28 48.1
23 13 01.3
51 20 07.0
51 20 22.4
51 21 41.6
51 24 08.7
51 24 47.5
51 28 47.6
51 28 01.9
HEL. VEL.
V ( km s−1 )
12464
12369
12318
ERROR
∆V ( km s−1 )
37
34
52
12626
12924
12682
14066
5212
23261
23869
21714
13025
23669
20761
22222
24436
19874
22801
20169
23939
20054
20092
24460
20438
19799
20036
19900
41164
39408
40507
36072
25516
41
58
51
65
29
35
43
35
95
51
74
78
49
40
69
59
16
49
33
41
78
97
49
38
182
142
215
145
61
25735
186
42693
29708
39846
45886
33341
42913
29398
29825
48
42
83
74
76
65
136
78
25590
24452
25249
25288
25589
25596
125
69
54
69
51
52
13
13
13
13
13
13
13
29
29
29
29
29
29
29
13699
18094
17577
17394
15308
18909
11940
126
141
117
147
66
126
91
41
44
44
45
44
44
44
59.7
52.6
14.1
00.0
11.6
05.3
19.2
46
46
48
48
34
54
55
53.2
16.9
14.8
55.0
59.1
03.6
59.2
Other measurements
V ( km s−1 )
420
S. Maurogordato et al.: The cluster fundamental plane
Table 1. continued
CLUSTER
NUMBER
R.A.
(2000)
DEC.
(2000)
HEL. VEL.
V ( km s−1 )
ERROR
∆V ( km s−1 )
A1831
1
2
3
4
5
6
7
8
9
10
11
1
2
3
1
2
3
4
5
6
7
8
9
10
11
12
1
2
3
4
5
6
7
13
13
13
13
13
13
13
13
13
13
13
15
15
15
17
17
17
17
17
17
17
17
17
17
17
17
18
18
18
18
18
18
18
59
59
59
59
59
59
59
59
59
59
59
10
10
10
02
02
02
02
02
02
03
03
03
02
02
02
53
53
54
54
53
54
53
14.9
17.2
08.7
08.8
39.2
36.5
13.5
14.4
08.7
08.2
00.0
11.8
12.7
13.15
59.7
53.3
48.7
45.2
39.3
31.9
17.1
12.8
03.9
17.1
24.6
33.1
29.5
40.6
06.4
15.6
45.5
07.3
28.7
27
27
28
28
28
28
27
28
27
27
28
33
33
33
33
33
33
33
33
33
33
33
33
33
33
33
68
68
68
68
68
68
68
58
56
01
03
03
05
59
00
54
55
04
29
29
29
33
34
34
30
30
31
32
32
32
29
30
30
23
23
22
22
23
20
28
32.3
06.0
17.5
23.3
39.0
29.7
13.2
55.2
48.1
00.0
01.0
11.0
32.5
50.2
15.7
00.0
24.0
25.2
50.5
20.3
43.1
40.0
34.7
27.4
10.7
59.6
39.8
28.4
55.3
44.1
58.7
56.4
34.1
22762
17974
19367
19701
10863
21978
24078
24727
18272
22568
18817
33416
33766
34314
25336
27
17
14
27
45
32
44
62
33
18
65
50
113
118
149
26843
27470
24553
-107
-146
105
78
117
101
65
1
2
3
4
5
6
7
22
22
22
22
22
22
22
35
35
36
36
35
35
35
40.8
28.0
15.3
11.0
54.4
48.9
41.9
01
01
01
01
01
01
01
29
28
24
24
29
26
39
05.2
14.7
03.5
29.2
12.3
51.3
31.9
8
22 35 41.3
18861
27786
25508
25895
27091
26882
28325
-92
29394
26229
7499
7548e
17447
17455
17589
17732
16605
18597
16888
16962e
17226
71
70
112
65
93
62
56
51
42
66
72
15*
221
185
83
170
286
286
117
100
222
A2034
A2245
A2312
A2457
01 36 53.7
Other measurements
V ( km s−1 )
33277 ± 300 CEF95
25452 RK88
25932 RK88
17388 SSG 94
* emission lines [OII], Hβ , [OIII], Hα , [SI].
(Quintana & Ramirez 1995; Hewett et al. 1995; Watson
et al. 1991). Velocity histograms are shown in Fig. 2.
We have applied to our cluster data set the updated
ROSTAT package (version 1.2) developed by Beers et al.
(1990). We chose the most appropriate estimators according to Beers et al. (1990), taking into account the number
of available velocities Nv . The results are listed in Table
2. In the “tiny case”, when Nv ∼ 5, we have used the
median vM and the bi–weight vBI as location estimators.
In the small–intermediate case (10 < Nv < 20), we used
the median vM and the bi–weight vBI as estimators of the
location, and the canonical standard deviation SSD , the
bi–weight SBI , the gapper Sgap . The mean estimator of
the location has also been listed, although it is known
to be a poor estimator in the case of a non–Gaussian
distribution. Table 2 lists in Col. (1), the Abell cluster
S. Maurogordato et al.: The cluster fundamental plane
421
Table 2. Estimates of the redshift and velocity dispersion of the clusters
CLUSTER
A195
A1035 (a)
(b)
A1045
A1413
A1468
A1831 (a)
(b)
A2034
A2245
A2312
A2457
10
R.A.
(2000)
01 26 54
10 32 07
DEC.
(2000)
19 10 33
40 12 33
10
11
12
13
35
55
05
59
00
22
38
10
30
23
51
27
41
22
25
59
28
18
18
28
15
17
18
22
10
02
53
35
13
44
38
45
33
33
68
01
31
31
21
28
40
48
53
33
10
A1035
5
zBI
zµ
zM
zprevious
Ref.
SSD
SBI
Sgap
Nv
0.0429
0.0669
0.0785
0.1351
0.1424
0.0849
0.0620
0.0764
0.1134
0.0862
0.0918
0.0582
0.0431
0.0671
0.0782
0.1328
0.1418
0.0844
0.0617
0.0764
0.1134
0.0864
0.0920
0.0580
0.0428
0.0669
0.0792
0.1351
0.1424
0.0849
0.0614
0.0760
0.1135
0.0852
0.0905
0.0582
0.0422 (3)
SR87
0.0799
0.1381
0.1427
0.0844
0.0613
0.0733
0.151
0.085
0.0928
0.0585
SR87
AEF92
SR87
SR87
SR91
SR91
EPS92
RK88
PHG92
QR95
530
(280)
860
530
(270)
890
540
(280)
880
(1460)
(370)
(1410)
730
(790)
670
(820)
710
(860)
(1100)
(1160)
(1150)
550
420
530
11
9
10
5
9
6
18
7
4
9
5
14
A1045
5
0
0
v (km/s)
10
v (km/s)
10
A1413
5
A1468
5
0
0
v (km/s)
10
v (km/s)
10
A1831
5
5
0
0
A2034
v (km/s)
10
v (km/s)
10
A2245
5
A2312
5
0
0
v (km/s)
10
v (km/s)
10
A2457
5
A195
5
0
0
v (km/s)
v (km/s)
Fig. 2. The line–of–sight velocity histograms for our target
clusters
number, in Col. (2) and (3) the right ascension and declination of the cluster center (Abell, et al. 1989) precessed
at J2000.0, in Cols. 4, 5 and 6, bi-weight, median and mean
estimates of the redshift of the cluster from our analysis,
in Col. 7 the previous measurement of the cluster redshift
from literature (referenced in Col. 10) and the number of
galaxies used for this estimate, in Cols. 11, 12 and 13, the
standard deviation, bi-weight, and gap estimates of the
velocity dispersion within the cluster, and in Col. 13 the
number of cluster members used for the previous determinations. The velocity analysis is indeed limited by the
small number of galaxies with available redshift by cluster.
The various estimates of velocity dispersions are listed in
(1)
(1)
(2)
(2)
(11)
(3)
(1)
(4)
(3)
(1)
Table 2 so that the degree of self-consistency can easily
be checked. Determinations for clusters with less that 10
redshift measured are listed between braces.
Note on individual clusters
Some clusters of our sub-sample show a complex velocity distribution. For instance, it is clear from Fig. 2
that the velocity distribution of A1035 is bimodal,
with a group of 9 galaxies clustered around vBI =
20052 km s−1 with small dispersion (σ ∼ 280 km s−1 ) and
a group of 10 galaxies belonging a to a more massive structure around vBI = 23530 km s−1 (σ ∼ 880 km s−1 ).
A1781 shows a complex structure that cannot be well
sampled with our data. The field of this cluster was recently examined in detail by Ramella et al. (1995; RGHT),
as a loose group of galaxies at z ∼ 0.04 is found in
that region of the sky. This results in a projection of
the loose group on the more distant Abell cluster (at
z ∼ 0.065 from Postman et al. 1992), of which galaxies
2, 3, 4, and 6 are probably genuine members. In Fig. 3),
the chain of four galaxies in the north corresponds to a
foreground structure, the redshifts of these galaxies being
respectively, from south to north, 11019 km s−1 (RGHT),
13699 km s−1 (our galaxy No.1), 11928 km s−1 (RGHT),
and 11940 km s−1 (our galaxy No. 7).
A1831 shows two peaks in the velocity histogram,
at vBI = 18585 km s−1 and vBI = 22907 km s−1 , with
velocity dispersions of respectively ∼ 700 km s−1 and
∼ 820 km s−1 . As mentioned before, we will not pursue
the analysis of the three previous clusters.
A1413 shows a main concentration of 9 galaxies at a
mean velocity of vBI = 42686 km s−1 (including the central cD galaxy) identified as the main cluster. The estimate of its velocity dispersion (listed in Table 2) is SSD =
1460 km s−1 . This value is quite different from the estimate with the bi–weighted method (SBI = 370 km s−1 ).
This can mean that the number of galaxies is still not sufficient to use the bi–weighted technique. Previous estimates
422
S. Maurogordato et al.: The cluster fundamental plane
of the velocity dispersion in A1413 have to be taken with
care until more redshift measurements are available.
Finally, we note the presence of a foreground group of
4 galaxies around v = 30000 km s−1 .
In A2457, the spectrum of galaxy 7 (Fig. 3) shows
three very broad systems of emission lines. The first complex includes a blend of Hγ and [O III], with a FWHM of
about 89 ˚
A, the second one (with a FWHM of ∼ 140 ˚
A)
includes Hβ and the [OIII] doublet in the tail of Hβ, the
third one (FWHM ∼ 115 ˚
A) includes a blend of Hα and
[N II]. Accurate fits with a gaussian could be done when
deblending the [OIII] doublet and the Hα and [N II] components, giving a mean velocity of v = 16962±100 km s−1 .
The cross–correlation technique for the absorption lines
gives v = 16888 ± 117 km s−1 . This object has been included for its Hα and [SII] lines in the catalog of the
Palomar Transit Grism Survey (Schneider et al. 1994),
which gives a velocity v = 17388 ± 300 km s−1 . The difference with our estimate is easily explained by the fact
that in the case of the PTGS Hα and [N II] could not
be deblended, given the low–resolution of that survey; as
a consequence, the wavelength of the Hα line –and the
redshift– is overestimated.
The existence of very broad permitted emission lines
and narrower forbidden ones suggests that this object is a
Seyfert 1 galaxy.
Fig. 3. The sky-subtracted spectrum of galaxy 7 in A2457.
This object shows emission lines characteristic of a Seyfert I
galaxy
5. Conclusion
We have presented the first results of an observational
program devoted to the measure of cluster redshifts and
velocity dispersions. At the present stage of this work, estimates of the velocity dispersions have to be considered
as preliminary results as a consequence of the small number of measured redshifts per cluster. As a second step, we
are carrying on further spectroscopical observations with
multi–object facilities in order to increase efficiently the
data for each cluster. The information which can be derived from these data is of course useful for various studies,
from large–scale structure to cluster dynamics. Our main
aim is to use this database to constrain the parameters
defining the cluster fundamental plane.
Acknowledgements. We would like to thank all the staff of
the Observatoire de Haute Provence for their efficient assistance during the successive observational runs. S.M. would like
to thank V´eronique Cayatte, Catherine Boisson and Philippe
Prugniel for fruitful discussions. We are grateful to Jean
Guibert and the MAMA team for their scans of the POSSII
plates. This research has made use of the NASA/IPAC extragalactic database (NED) which is operated by the Jet
Propulsion Laboratory, Caltech, under contract with the
National Aeronautics and Space Administration.
References
Abell G.O., Corwin H.G., Olowin R.P., 1989, ApJS 70, 1
Allen S.W., Edge A.C., Fabian A.C., et al., 1992, MNRAS 259,
67
Beers T., Flynn K., Gebhart K., 1990, AJ 100, 32
Batuski D.J., Burns J.O., Newberry M.V., et al., 1991, AJ 101,
1983
Cole S., 1989, PhD Thesis
Crawford C.S., Edge A.C., Fabian A.C., et al., 1995, MNRAS
274, 75
Danese L., de Zotti G., di Tullio G., 1980, A&A 82, 322
Dressler A., Lyndel–Bell D., Burstein D., et al., 1987, ApJ 313,
42
Djorgovski G., Davis M., 1987, ApJ 313, 59
Elvis M., Plummer D., Schachter J., Fabbiano G., 1992, ApJS
80, 257
Giovanelli R., Haynes M.P., 1993, AJ 105, 1271
Hewett P.C., Foltz C.B., Chaffee F.H., 1995, AJ 109, 1498
Le F`evre O., Crampton C., Lilly S.J., Hammer F., Tresse L.,
1995, ApJ 455, 60
Lemaitre G., et al., 1990, A&A 228, 546
Owen F., Ledlow M., Keel W., 1995, AJ 109, 140
Postman M., Huchra J., Geller M., 1992, ApJ 384, 404
Quintana H., Ramirez A., 1995, ApJS 96, 343
Ramella M., Geller M.J., Huchra J.P., Thorstensen J.R., 1995,
AJ 109, 1458
Rhee G., Katgert P., 1988, A&AS 72, 243
Schaeffer R., Maurogordato S., Cappi A., Bernardeau F, 1993,
MNRAS 263, L21 (SMCB)
Schneider D., Schmidt M., Gunn J., 1994, AJ 107, 1245
Slezak E., Bijaoui A., Mars G., 1988, A&A 201, 9
Stocke J.T., Morris S.L., Gioia I.M., et al., 1991, ApJS 76, 813
Struble M.F., Rood, H.J., 1987, ApJS, 63, 543
Struble M.F., Rood, H.J., 1991, ApJS 77, 363
Tonry J., Davis, M., 1981, ApJ 84, 1511
Watson F.G., Oates A.P., Shanks T., Hale–Sutton D., 1991,
MNRAS 253, 222
West M.J., Dekel A., Oemler A., 1987, ApJ 316, 1
West M.J., Oemler A., Dekel A., 1989, ApJ 346, 539
Zabludoff A.I., Huchra J.P., Geller M.J., Vogeley M.S., 1993,
AJ 106, 1273


© Copyright 2026