
Measurement of Chloramphenicol in Honey Using Automated Sample Preparation with LC-MS/MS Introduction
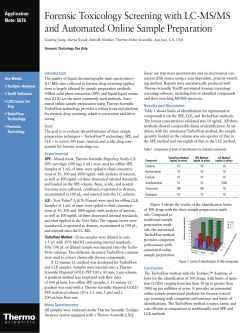
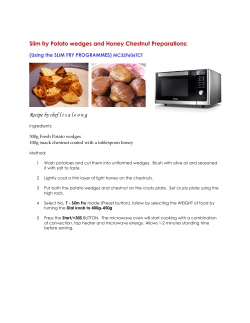
Application
Note: 473
Measurement of Chloramphenicol in Honey
Using Automated Sample Preparation
with LC-MS/MS
Catherine Lafontaine, Yang Shi, Francois Espourteille, Thermo Fisher Scientific, Franklin, MA USA
Key Words
• Aria TLX-1
• TurboFlow
technology
• TSQ Vantage
mass
spectrometer
• Food safety
Introduction
Goal
Chloramphenicol (CAP) (Figure 1) is a bacteriostatic
antimicrobial previously used in veterinary medicine. CAP
has been found to be potentially carcinogenic, which
makes it an unacceptable substance for use with any foodproducing animals, including honey bees. The United
States, Canada, and the European Union (EU), as well as
many other countries, have completely banned the usage
of CAP in the production of food. The EU has set a
minimum required performance level (MRPL) for CAP in
food of animal origin at a level of 0.3 µg/kg1.
Currently sample preparation for the detection of CAP
in honey by liquid chromatography-mass spectrometry
(LC-MS/MS) involves complex offline extraction methods
such as solid phase extraction, QuEChERS, or
liquid/liquid extraction, all of which require additional
sample concentration and reconstitution in an appropriate
solvent. These sample preparation methods are timeconsuming, often taking 2 hours or more per sample, and
are more vulnerable to variability due to errors in manual
preparation. To offer a high sensitivity (low ppbs) CAP
detection method and timely, automated analysis of
multiple samples, our approach is to use the Thermo
Scientific Aria TLX-1 system powered by TurboFlow™
automated sample preparation technology coupled to the
detection capabilities of a high-sensitivity Thermo
Scientific TSQ Vantage triple stage quadrupole mass
spectrometer.
Develop a quick, automated sample preparation,
LC-MS/MS method for chloramphenicol (CAP) in honey
by negative ion heated electrospray ionization (H-ESI)
using a deuterated internal standard (CAP-d5).
Figure 1: Chemical structure of chloramphenicol
Experimental
Sample Preparation
Organic wildflower honey used in this analysis for the
preparation of blanks, QCs, and standards was obtained
from a local supermarket. CAP was obtained from SigmaAldrich, US (Fluka) and CAP-d5 (100 µg/mL in
acetonitrile) from Cambridge Isotope Labs, Inc. (Andover,
MA, USA). A CAP working solution was prepared in 1:1
methanol/water at 100 ng/mL. The honey was diluted by
adding 30 mL of purified water to 10 g of honey
(1:3 w/v). CAP standards and QC standards were serially
diluted to the target concentrations with 1:3 honey/water
containing 250 pg/mL CAP-d5 as an internal standard.
Target standard concentrations ranged from 0.024 µg/kg
to 1.5 µg/kg. Four samples of honey obtained
internationally and one sample obtained from a local
grocery store were analyzed as “samples” and prepared by
dissolving 5 g of honey in 15 mL of purified water. The
internal standard was added to a final concentration of
250 pg/mL. The injection volume was 25 µL.
Method
The honey extract clean-up was accomplished using the
Thermo Scientific TurboFlow method run on an Aria™
TLX-1 LC system using a TurboFlow Cyclone polymerbased extraction column. Simple sugars were un-retained
and moved to waste during the loading step, while the
analyte of interest was retained on the extraction column.
This was followed by organic elution to a Thermo
Scientific Hypersil GOLD end-capped silica-based C18
reversed-phase analytical column and gradient elution to a
TSQ Vantage™ triple stage quadrupole MS with a H-ESI
source. CAP precursor m/z 321 → 257, 152, and
194 high resolution selective reaction monitoring
(H-SRM) transitions were monitored in the negative
ionization mode. The 257 m/z product ion for CAP was
used for quantitation and the 152 and 194 m/z product
ions were used as confirmation. Precursor 326 m/z → 157
m/z and 262 m/z H-SRM transitions were monitored for
CAP-d5. The total LC-MS/MS method run time was
about 5 minutes.
Aria TLX-1 System Parameters
Columns
Thermo Scientific TurboFlow Cyclone column (0.5 x 50 mm)
Thermo Scientific Hypersil GOLD (3 x 50 mm, 3 µm particle size)
The analytical column was kept at 30 °C
Mobile Phases
Loading Pump
Mobile Phase A:
Mobile Phase B:
Mobile Phase C:
0.02% Acetic Acid (aq)
Methanol
1:1:1 Acetone/Acetonitrile/Isopropanol with 0.3%
Formic Acid
Elution Pump
Mobile Phase A:
Mobile Phase B:
0.02% Acetic Acid (aq)
Methanol
Mass Spectrometer Parameters
MS analysis was carried out on a TSQ Vantage™ triple
stage quadrupole mass spectrometer. The MS conditions
were as follows:
Ion Polarity:
Spray Voltage:
Vaporizer Temperature:
Capillary Temperature:
Sheath Gas Pressure (N2):
Auxiliary Gas Pressure (N2):
Ion Sweep Gas Pressure (N2):
Scan Type:
Chrom Filter Peak Width:
Collision Gas Pressure:
Declustering Voltage:
Negative ion mode
1000 V
526 °C
225 °C
60 units
35 units
0.500 units
H-SRM
5.0 s
1.1 mTorr
0V
Scan Width:
Scan Time:
Q1 Resolution:
Q3 Resolution:
S-Lens (m/z 321):
Collision Energy (m/z 321 > 257):
0.002 m/z
0.200 s
0.200 Da FWHM
0.700 Da FWHM
65 V
12 V
The entire experiment was controlled by Aria operating
software 1.6.2. The data was processed with Thermo
Scientific LCQUAN 2.5.6 quantitative software using
Thermo Scientific Xcalibur 2.0.7 SP1 data system
software.
Results and Discussion
Figure 2 shows comparison chromatography of CAP and
CAP-d5 in 1:3 honey/water matrix pre-blank, at the lower
limit of quantitation (LLOQ), the upper limit of
quantitation (ULOQ), and a post-high standard blank. By
comparing pre- and post- blanks, it is clearly indicated
that the carryover level has been minimized by using
TurboFlow technology. Matrix-matched calibration
standards of CAP showed a linear response at greater than
two orders of magnitude with r2 = 0.9944 (Figure 3). All
%CVs (n=3) were less than 19% for the LLOQ and less
than 8% for all other points of the curve. Internal
standard % relative standard deviation (RSD) was less
than 9%. Chloramphenicol was not detected in any of the
honey samples obtained internationally nor from the US.
The calculation of actual concentrations of CAP in honey
was based on a density of honey equal to 1.367 kg/L2.
Signal suppression effects were examined by comparing
the recovery of CAP and CAP-d5 in three neat (purified
water) standards (0.19, 0.38, and 1.5 µg/kg) with their
counterparts in 1:3 honey/water. The average recovery
corrected by the internal standard was 80.9%, 96.0%,
and 92.1% for 0.19, 0.38, and 1.5 µg/kg respectively.
Table 1 highlights current published results of
detection methods for chloramphenicol in honey by
LC-MS compared to the results of this study. Sample
preparation in our study was between 7 and 24 times
faster (estimated) than the three current alternative
methods discussed. The LC-MS method run time was
equal to or as much as four times faster. The limit of
detection (LOD) was between 5.7 and 20 times lower
than those that reported their LOD. Finally, the LLOQ
was between 3.7 and 27 times lower.
Conclusion
A quick, automated online extraction, LC-MS/MS method
has been developed here that is sensitive enough to detect
0.023 µg/kg (LOD) and quantify 0.047 µg/kg (LLOQ) of
CAP in honey for screening purposes. This is significantly
lower than the MRPL of 0.3 µg/kg (ppb) set by the EU.
This method eliminates the need for time-consuming
sample preparation procedures such as solid phase
extraction, QuEChERS, and liquid-liquid extraction.
Dilution with water to reduce sample viscosity is the only
pretreatment required. The LC-MS/MS method run time is
5 minutes, and the sample throughput can be improved by
multiplexing on an Aria TLX-4 system.
Figure 2: Chromatography comparison of CAP SRM m/z 257 transition (upper traces) and CAP-d5 (lower traces) in Pre-Blank Honey Matrix (panel A), at LLOQ
of 0.047 µg/kg (panel B), at ULOQ of 1.5 µg/kg (panel C), and in Post-High Standard Blank (panel D)
Figure 3: Linear regression curve of CAP in honey:water matrix standards based on area ratio with
internal standard CAP-d5 (1/X weighting) showing linearity over two orders of magnitude using the
TurboFlow method.
Sample prep time (min)
LC/MS Method Runtime (min)
Sample Extraction
Analytical Column
TurboFlow Method
(on-line)
SPE
(off-line)
QuEChERS
(off-line)
Liquid/Liquid Extraction
(off-line)
In addition to these
5
5
TurboFlow Cyclone column
(0.5 X 50 mm) on-line
LC extraction
Thermo Scientific
Hypersil GOLD,
3 x 50 mm, 3 um
120 (estimated)
12
J.T. Baker 500-mg
Bakerbond C18 SPE
35 (estimated)
5 or 10
“Modified”
QuEChERS
60 (estimated)
20
Hexane/Acetonitrile
Extraction, Evaporation,
and Redissolution
Phenomenex C18 Luna
column, 2 X 150 mm, 5 µm
Scientific maintains
Injection volume (µL)
HPLC system
Detector
LLOD (µg/kg)
LLOQ (µg/kg)
Reference
25
TLX-1
Thermo Scientific
TSQ Vantage
Triple Quadrupole MS
0.024
0.047
Data presented herein.
Macherey-Nagel
Nucleosil 100-5 C18
HD column, 2 X 70 mm
100 mm × 4.6 mm
RP-18e monolithic
column (Merck USA)
or a 4.6 mm × 250 mm,
5-µm particle,
XDB conventional
column (Agilent)
10
10
HP 1100 Binary pump Agilent 1100 Binary pump
Micromass
ESI-MS (Not specified)
QuattroMicro Triple
Quadrupole MS
0.2
Not specified.
0.5
0.20
2004 by Ortelli et al. (3) 2006 by Pan et al. (4)
20
Agilent 1100 Binary pump
Applied Biosystems API
3000 Triple Quadrupole MS
0.11
0.14
2007 by Rodziewicz et al. (5)
Table 1: Comparison of CAP detection in honey by TurboFlow method with current sample prep alternatives.
References and Acknowledgements
1. Commission Decision of 13 March 2003 amending Decision
2002/657/EC as regards the seating of minimum required performance
limits (MRPLs) for certain residues in food animal origin (2003/18/EC),
Official Journal of the European Communities, L71 (2003).
2. Rainer Krell, (1996). Value-Added Products from Beekeeping (Fao
Agricultural Services Bulletin). Food & Agriculture Organization of the
UN (FA. ISBN 92-5-103819-8).
3. D. Ortelli, P. Edder, and C. Corvi. Analysis of Chloramphenicol Residues
in Honey by Liquid Chromatography-Tandem Mass Spectrometry.
Chromatographia 2004, 59, January (No.1/2).
4. C. Pan, H. Zhang, S. Chen, Y. Xu, and S. Jiang. Determination of
Chloramphenicol Residues in Honey by Monolithic Column Liquid
Chromatography-Mass Spectrometry After Use of QuEChERS Clean-Up.
Acta Chromatographica, No. 17 (2006).
5. L. Rodziewicz and I. Zawadzka. Rapid Determination of
Chloramphenicol Residues in Honey by Liquid Chromatography Tandem
Mass Spectrometry and the Validation of Method Based on
2002/657/EC. APIACTA 42 (2007), pp. 25-30.
offices, Thermo Fisher
a network of representative organizations
throughout the world.
Africa-Other
+27 11 570 1840
Australia
+61 2 8844 9500
Austria
+43 1 333 50 34 0
Belgium
+32 2 482 30 30
Canada
+1 800 530 8447
China
+86 10 8419 3588
Denmark
+45 70 23 62 60
Europe-Other
+43 1 333 50 34 0
Finland / Norway /
Sweden
+46 8 556 468 00
France
+33 1 60 92 48 00
Germany
+49 6103 408 1014
India
+91 22 6742 9434
Italy
+39 02 950 591
Japan
+81 45 453 9100
Latin America
+1 608 276 5659
Middle East
+43 1 333 50 34 0
Netherlands
+31 76 579 55 55
South Africa
+27 11 570 1840
Spain
+34 914 845 965
Switzerland
+41 61 716 77 00
UK
+44 1442 233555
USA
+1 800 532 4752
www.thermo.com
Legal Notices
©2009 Thermo Fisher Scientific Inc. All rights reserved. All trademarks are the property of Thermo Fisher Scientific Inc. and its subsidiaries. This information
is presented as an example of the capabilities of Thermo Fisher Scientific Inc. products. It is not intended to encourage use of these products in any manners
that might infringe the intellectual property rights of others. Specifications, terms and pricing are subject to change. Not all products are available in all
countries. Please consult your local sales representative for details.
View additional Thermo Scientific LC/MS application notes at: www.thermo.com/appnotes
Thermo Fisher Scientific,
San Jose, CA USA is ISO Certified.
AN63115_E 08/09S
Part of Thermo Fisher Scientific


© Copyright 2026