
Document 269730
MTW Research Ltd 2013
Lighting Market
Research & Analysis
UK 2013
REPORT SAMPLE
Nb. Figures & Charts Changed for Sample Purposes
Lighting, Lamps, LED & Luminaires Market Size & Trends 2007-2013; SWOT &
PEST Analysis, Share by Product 2007-2017; Distribution Channel Share 20072017; Leading Manufacturers Profiles & 4 Year Financials, Independent Retailers
Ranking, Retailers Profiles & 4 Year Financials; 2017 Forecasts
3rd Edition
October 2013
1
MTW Research Ltd 2013
Research & Analysis Report Contents
1.
1. 1
1. 2
INTRODUCTION TO RESEARCH & ANALYSIS REPORTS
Key Features & Benefits of this Research & Analysis Report
Introduction to this Research & Analysis Report
7
7
8
2.
2.1
22
2.2.1
2.2.2
2.2.3
2.2.4
2.3
2.3.1
2.3.2
2.3.3
2.3.4
UK LIGHTING MARKET SIZE & TRENDS 2007-2017
MARKET DEFINITION & EXECUTIVE SUMMARY & MARKET OVERVIEW
LIGHTING MARKET VALUE & TRENDS 2007-2017
Lighting Market Value 2007-2017 – Current Prices
Lighting Market Size 2007-2017 – Constant Prices
Future Prospects
Future Growth – Share by Ansoff Strategic Option 2013-2017
KEY MARKET INFLUENCES, PEST & SWOT ANALYSIS
PEST ANALYSIS – Illustration of Key Market Forces
Political & Legal Influences & Trends
Economic Influences & Trends
SWOT Analysis – Strengths, Weaknesses, Opportunities, Threats
9
9
10
10
13
16
18
22
22
23
24
31
3.
3.1
3.2.
3.2.1
3.2.2
3.2.3
3.2.4
3.2.5
3.2.6
3.3
3.3.1
3.3.2
3.3.3
3.3.4
3.3.5
3.4
3.4.1
3.4.2
3.5
3.5.1
3.5.2
3.5.3
3.5.4
3.5.5
LIGHTING MARKET PRODUCT MIX & SALES 2007-2017
Share by Product Sector 2007, 2013 & 2017
Domestic Luminaires Market Size & Trends 2007-2017
Share by Key Product – Domestic Luminaires Market 2007, 2013 & 2017
Floor Standing Luminaires Market 2007-2017
Table / Desk Lamps Market 2007-2017
Wall / Ceiling / Spotlights Market 2007-2017
Chandeliers, Pendants & Light Shades Market 2007-2017
Security & Garden Lighting Market 2007-2017
Domestic Lamps Market Size & Trends 2007-2017
Share by Key Product for Domestic Lamps 2007, 2013 & 2017
Domestic Incandescent Lamp Market Size 2007-2017
Domestic Fluorescent Lamp Market Size 2007-2017
Domestic CFL Market Size 2007-2017
Domestic Tungsten Halogen Lamp Market Size 2007-2017
Non-Domestic Luminaires Market Size & Trends 2007-2017
Share by Commercial Luminaire Type 2007, 2013 & 2017
Specification Criteria & Processes for Non-Domestic Luminaires
Non-Domestic Lamps Market Size & Trends 2007-2017
Non Domestic Lamps Share by Key Product 2007, 2013 & 2017
Commercial Incandescent Lamp Market Size 2007-2017
Commercial Tungsten Halogen Market Size 2007-2017
Commercial Discharge Lamps Market Size 2007-2017
Non-Domestic Fluorescent Lamps Market 2007-2017
Linear Fluorescent Lamps Market Size 2007-2017
Compact Fluorescent Lamps Market Size 2007-2017
UK LED Lighting Market 2007-2017
LED Lighting Market Definition
LED Lighting Market Sales & Trends 2007-2017 £M
LED Lamps, Modules & Engines Market Trends
LED Lamp Trends 2013-2017
LED Engines & LED Modules Market Trends 2013-2017
LED Lighting Supply & End Use Trends 2013-2017
33
33
36
38
40
41
43
44
46
49
50
52
53
55
56
59
60
64
67
69
71
72
74
76
76
77
80
80
80
81
81
83
85
4.
UK LIGHTING MANUFACTURERS 1 PAGE PROFILES & 4 YEAR FINANCIALS
280+ Lighting Manufacturers -1 Page Company Overview & ‘At a Glance’ 4 Yr
Financials
87
87-370
5.
5.1
5.2
5.2.1
5.2.2
5.2.3
UK LIGHTING DISTRIBUTION SHARES & TRENDS 2007-2017
UK Lighting Distribution Structure Chart 2013
Lighting Market Distribution Channel Shares 2007-2017
Lighting Sales Share by Distribution Channel 2013
Lighting Sales Share by Distribution Channel 2007
Distribution Channel Share for Lighting Forecasts 2013
371
371
372
372
373
374
6.
6.1
6.2
INDEPENDENT LIGHTING RETAILERS MARKET SIZE & TRENDS 2007-2017
Lighting Retailers Industry Competitor Listing
Lighting Retailers Market Performance 2007-2017
375
376
377
3.6
3.6.1
3.6.2
3.6.3
2
MTW Research Ltd 2013
6.2.1
6.2.2
6.2.3
6.2.4
6.2.5
6.3
6.3.1
6.3.2
6.3.3
6.3.4
6.3.5
6.3.6
Lighting Retailers Market Sales Revenue 2007-2017
Lighting Retailers Market Profit 2007-2017
Lighting Retailers Market Assets 2007-2017
Lighting Retailers Market Liabilities 2007-2017
Lighting Retailers Market Net Worth 2007-2017
Lighting Retailers Industry Trend Indicators
Lighting Retailers Market Share by Growth, Decline & Static Sales
Lighting Retailers Industry – Structural Changes Over Last 12 Months
UK Lighting Retailers Industry – Volume Share by Risk Rating 2013
Lighting Retailers Market Structure –Share by Region 2013
Lighting Retailers Market–Share by Number of Employees 2013
Lighting Retailers Market Structure –Share by Turnover Band 2013
377
378
380
381
382
383
383
384
385
386
387
388
7.
7.1
7.2
7.2.1
7.2.2
7.3
7.4
7.5
7.6
INDEPENDENT LIGHTING RETAILERS COMPANY RANKINGS
Introduction to the Rankings
Lighting Retailers Companies’ Sales Estimates & Turnover Rank
Lighting Retailers Ranking by Turnover - 2012
Individual Lighting Retailers Company Sales Revenues
Lighting Retailers Ranking by Profit
Company Ranking by Total Assets
Company Ranking by Net Worth
Ranking by Number of Employees
389
389
390
390
391
392
393
394
395
8.
LIGHTING RETAILERS 1 PAGE PROFILES & 4 YEAR FINANCIALS
90+ Lighting Retailers - Company Overview & ‘At a Glance’ 4 Year Financials
396
396491
3
MTW Research Ltd 2013
Market Report Tables & Charts
Figure 1: Lighting Market – UK 2007 – 2017 By Value £m MSP
Figure 2: Lighting Market – UK 2007 – 2017 Constant Prices £M
Figure 3: Lighting Market Growth Share & Values by Ansoff Strategy 2013-2017
Figure 4: PEST Analysis for UK Lighting Market in 2013
Figure 5: UK Economic Annual Performance– GDP 2007-2017
Figure 6: UK Economic Annual Performance– Inflation (CPI) 2007-2017
Figure 7: UK Economic Annual Performance– Interest Rates (Bank of England) 2007-2017
Figure 8: UK Unemployment Numbers 2007-2017
Figure 9: Key Strengths & Weaknesses in the Lighting Market 2013-2017
Figure 10: Key Opportunities & Threats in the Lighting Market 2013-2017
Figure 11: Share by Key Product Sector in Lighting Market 2013
Figure 12: Historical Share by Key Sector in Lighting Market 2007
Figure 13: Forecast Share by Key Sector in Lighting Market 2017
Figure 14: UK Domestic Luminaires Market by Value 2007-2017 £M
Figure 15: Share by Key Product in Domestic Luminaires Market 2013
Figure 16: Share by Key Product in Domestic Luminaires Market 2007
Figure 17: Share by Key Product in Domestic Luminaires Market Forecast 2017
Figure 18: UK Domestic Floorstanding Luminaires Market by Value 2007-2017 £M
Figure 19: UK Domestic Table / Desk Luminaires Market by Value 2007-2017 £M
Figure 20: UK Domestic Wall / Ceiling / Spotlights Market by Value 2007-2017 £M
Figure 21: UK Domestic Chandeliers, Pendants & Light Shades Market by Value 2007-2017
£M
Figure 22: UK Domestic Security & Garden Lighting Market by Value 2007-2017 £M
Figure 23: Share by Key Product in Domestic Garden Decoration Market 2013
Figure 24: UK Domestic Lamps Market by Value 2007-2017 £M
Figure 25: Share by Key Product Sector in Domestic Lamps Market 2013
Figure 26: Share by Key Product Sector in Domestic Lamps Market 2007
Figure 27: Share by Key Product Sector in Consumer Lamps Market 2017
Figure 28: UK Domestic Incandescent Lamp Market by Value 2007-2017 £M
Figure 29: UK Domestic Linear Flourescent Lamp Market by Value 2007-2017 £M
Figure 30: UK Domestic CFL Market by Value 2007-2017 £M
Figure 31: UK Domestic Tungsten Halogen Lamps Market by Value 2007-2017 £M
Figure 32: UK Commercial Luminaires Market by Value 2007-2017 £M
Figure 33: Share by Luminaire Type in Non-Domestic Luminaire Market 2013
Figure 34: Share by Luminaire Type in Non-Domestic Luminaire Market 2007
Figure 35: Share by Luminaire Type in Non-Domestic Luminaire Market 2017
Figure 36: Typical Design Processes for Non-Domestic Lighting Projects
Figure 37: UK Commercial Lamps Market by Value 2007-2017 £M
Figure 38: Share by Type of Lamp in Non-Domestic Lamp Market in 2013
Figure 39: Share by Type of Lamp in Non-Domestic Lamp Market in 2007
Figure 40: Share by Type of Lamp in Non-Domestic Lamp Market in 2017
Figure 41: UK Commercial Incandescent Lamps Market by Value 2007-2017 £M
Figure 42: UK Commercial Tungsten Halogen Lamps Market by Value 2007-2017 £M
Figure 43: UK Commercial Discharge Lamps Market by Value 2007-2017 £M
Figure 44: Typical Efficacy Levels of Non-Domestic Lamps
Figure 46: UK Commercial Linear Fluorescent Lamps Market by Value 2007-2017 £M
Figure 47: UK Commercial Compact Fluorescent Lamps Market by Value 2007-2017 £M
Figure 48: UK LED Lighting Market Sales 2007-2017 £M
Figures 49-331: 280+ Lighting Manufacturers' 1 Page Profile, 4 Yr Accounts, "At a Glance" KPIs
Figure 332: UK Lighting Distribution Channels Structure 2013
Figure 333: Share by Key Distribution Channel for Lighting in 2013
Figure 334: Sales of Lighting Share by Key Distribution Channel 2007
10
13
18
22
26
28
29
30
31
32
33
34
35
36
38
38
39
40
41
43
44
46
48
49
51
51
52
53
54
55
57
60
61
61
62
66
67
69
69
70
71
73
75
76
77
78
81
87-370
371
372
373
4
MTW Research Ltd 2013
Figure 335: Forecast Share for Lighting Sales by Distribution Channel 2017
Figure 336: Lighting Retailers Company Listing
Figure 337: Lighting Retailers Market Sales 2007-2017(£M MSP)
Figure 338: Lighting Retailers Market Total Profit 2007-2017
Figure 339: Lighting Retailers Market Total Assets (Current & Fixed) 2007-2017
Figure 340: Lighting Retailers Market Total Liabilities (Current & Long Term) 2007-2017
Figure 341: Lighting Retailers Industry Net Worth 2007-2017
Figure 342: Lighting Retailers Industry – Market Share by 12 Month Sales Performance
Figure 343: Lighting Retailers Industry – Market Share by Structural Market Changes
Figure 344: Lighting Retailers Industry Structure– Market Share by Credit Rating October 2013
Figure 345: Lighting Retailers Industry Structure –Share by Geographical Region 2013
Figure 346: Lighting Retail Industry - Share by Employees by Volume October 2013
Figure 347: Lighting Retailers Industry Structure - Share by Turnover Band by Volume 2013
Table 348: Ranking by Turnover 2012 - Lighting Retailers
Table 349: Turnover Estimates (£M) 2012 - Lighting Retailers
Table 350: Ranking by Profit 2012 - Lighting Retailers
Table 351: Ranking by Assets 2012– Lighting Retailers
Table 352: Ranking by Net Worth 2007 – Lighting Retailers
Table 353: Ranking by Number of Employees
Figures 354-451: 80+ Lighting Retailers 1 Page Profile, 4 Yr Accounts, "At A Glance" KPIs
374
376
377
379
380
381
382
383
384
385
386
387
388
390
391
392
393
394
395
396492
5
MTW Research Ltd 2013
Published in 2013 by
This report reflects MTW Research’s independent view of the market which may
differ from other third party views. Whilst we try to ensure that our reports are an
accurate depiction of their respective markets, it must be emphasised that the
figures and comment contained therein are estimates based on a mix of primary
and secondary research, and should therefore be treated as such.
Terms & Conditions of Use
The information contained within this report remains the copyright of MTW Research. Subject to these Terms and
Conditions (this "Agreement"), MTW Research ("we", "our", "us") makes available this publication and data or information
contained therein (the "Report"). Your use of this report constitutes your acknowledgment and assent to be bound by this
Agreement.
Permitted Use, Limitations on Use
You may access purchased Reports only as required to view the Reports for your individual use, and may print/copy a
purchased Report once for your use. You may copy extracts from purchased Reports onto your own documents, provided
that all citations are attributed to "MTW Research", and are for internal use only. You may not republish, resell or
redistribute any Report, or do anything else with any Report, which is not specifically permitted in this Agreement. You may
not reproduce, store in a retrieval system or transmit by any means, electronic or mechanical, any report without the prior
permission of MTW Research.
Limitation of Liability
You are entirely liable for activities conducted by you or anyone else in connection with your use of the Report. We take no
responsibility for any incorrect information supplied to us during the research process. Market information is based on
telephone interviews and secondary sources whose accuracy we cannot guarantee. You acknowledge when ordering that
MTW Research Reports are for your internal use and not for general publication or disclosure to third parties, unless
otherwise agreed. Neither MTW Research nor any of its affiliates, owners, employees or other representatives will be liable
for damages arising out of or in connection with the use of the Report or the information, content, materials or products
included in the Report. This is a comprehensive limitation of liability that applies to all damages of any kind, including
(without limitation) compensatory, direct, indirect or consequential damages, loss of data, income or profit, loss of or
damage to property and claims of third parties.
Applicable Law
This Agreement will be governed by and construed in accordance with the laws of England and Wales without giving effect to
the principles of conflict of laws thereof, and to the extent permitted by applicable law, you consent to the jurisdiction of
courts situated in England and Wales in any action arising under this agreement.
Intellectual Property Rights
You acknowledge that legal and beneficial interest in Intellectual Property Rights in connection with the Report belong to us.
This includes all Intellectual Property Rights in any Material. You have no rights in or to the Report and you may not use
any Material other than as permitted under this Agreement. We grant you a non-exclusive, non-transferable licence to use
the Intellectual Property Rights referred to above solely for the use of Material as permitted under this agreement.
Companies Included
Whilst MTW endeavour to ensure that the majority of the major companies active in the market with which this
report is concerned are included, it should be noted that the list of companies included in this report is not exhaustive
and the inclusion or otherwise of a company in this report does not necessarily indicate, nor should be interpreted as,
a company’s relevance or otherwise in a particular market. Whilst we endeavour to attain high levels of accuracy, it
should be borne in mind that the rankings and other information provided within this report contain an element of
estimation, should be regarded as such and treated with a degree of caution.
Estimates Provided
In order to enable benchmarking, competitor analysis and facilitate further market research, MTW have provided
estimates for turnover, profit before tax and number of employees for small, medium sized and other companies who
are not obliged to submit this information to Companies House. As such, in the interests of clarity, all data relating to
turnover, profit and number of employees provided in this report should be regarded as independent estimates by
MTW. Whilst we endeavour to attain high levels of accuracy with these estimates, they may not reflect the actual
figures of a company and should therefore be treated with caution.
6
MTW Research Ltd 2013
1.
1. 1
Introduction to Research & Analysis Reports
Key Features & Benefits of this Research & Analysis Report
MTW’s “Research & Analysis” market reports provide an independent, comprehensive review of recent,
current and future market size and trends in an easy to reference format. Each report provides vital
market intelligence in terms of size, product mix, end user mix, key trends and influences and forecasts
of market size for the next 4 years. In addition, rankings by turnover, profit and other key financials for
the market leaders are provided as well as a 1 page profile for each key player in the market. Contact,
telemarketing & mailing details are also provided for each company to enable the reader to quickly
develop sales leads.
Based on company sales returns which provide higher confidence levels and researched by market
research professionals with experience in the industry, MTW’s Research and Analysis reports are used as
a foundation for coherent, strategic decision making, based on sound market intelligence and for
developing effective marketing plans. MTW reports can also used as an operational sales and marketing
tool by identifying market leaders, enabling the reader to quickly grow sales to new clients and focus
marketing budgets.
This report includes:•
Market Size – Historical, Current & Future
Based on sales data from a representative proportion of the industry, this report provides market size by
value over a ten-year period. As they are based on quantitative data as well as qualitative input from
the industry, our reports are more accurate than other qualitative based reports and offer better value
for money. By combining the best of both quantitative and qualitative input, we offer our clients greater
confidence in our market forecasts as well as discussing key market trends and influences from a
qualitative perspective.
•
Product Mix – Current & Future
This report identifies the key product sectors in the market and provides historical, current and forecast
market share estimates for each, alongside qualitative discussion on key trends for each segment of the
industry. With input for this report being both qualitative and quantitative we are able to offer an
effective insight into the core components of the market, as well as forecasting future market shares.
•
Distribution Channel Mix – Current & Future
The report identifies the key distribution channels that drive demand for this market and provide a
current, historical & future market share estimate for each. This enables the reader to identify the key
driving forces behind current market demand and adapt business tactics accordingly. With forecasts of
market share by key end use sectors also provided, the reader is able to undertake strategic decisions
with greater confidence as well as basing marketing strategies on solid market intelligence.
•
Market Leaders Ranking
This report identifies the key players in the market and ranks them by a number of criteria, including
turnover and profitability. This enables the reader to identify the most relevant potential key customers
in a market, understand their current position in the market and quickly identify new targets. Also, MTW
provide a turnover estimate for every company included in the report, enabling the reader to develop
market share estimates.
•
Company Profiles & Sales Leads
This report includes a 1 page profile for each company including full contact details for developing fast
sales leads; 4 years of the most recent key financial indicators; and MTW’s ‘at a glance’ chart, enabling
the reader to quickly gauge the current financial health of a company.
•
Relevant Companies, Saving You Time
MTW Research have been researching and writing market reports in these sectors since 1999 and as
such we are able to develop a company listing which is more relevant to the market, rather than
automatically selecting companies to be included by industry code. Our reports represent excellent
value for money and don’t bombard you with irrelevant financial data; they are designed to enable you
to engage in fast and effective market analysis. We focus on providing what’s important in an easy to
reference and use format.
7
MTW Research Ltd 2013
1. 2
Introduction to this Research & Analysis Report
In order to provide a comprehensive review of the market, this report includes:THE MARKET, PRODUCTS & END USERS
Market Size & Key Market Trends 2007-2017 – Value of the market since 2007 is provided
with current market size estimates provided based on quantitative sales figures from the industry.
Profitability, assets, liabilities and net worth are also illustrated in easy to read charts. In addition, yearly
forecasts of market size and other key financial indicators are also provided to 2017. Key market trends
are also identified and discussed providing the report with both ‘quantitative’ and ‘qualitative’
characteristics.
PEST Review & Key Market Influences – A review of the key issues and influences which are
impacting market demand at present and in the future are also provided. These issues range from
economic, political, environmental, social and technological and are identified and discussed where
appropriate, providing the reader with a greater depth of market intelligence. A strategic PEST review
for this market is also illustrated in chart format for faster reference.
Product Mix & Trends – This report identifies the key sectors which comprise the overall
market and provide a current & historical share by value. This data is supported by qualitative comment
where appropriate in order to offer more substantive market knowledge. Forecasts to 2017 are also
provided to offer more insightful market intelligence and facilitate strategic and operational decision
making.
SWOT Analysis – A strategic SWOT analysis for the market is also provided based on input
from primary and secondary sources in the industry. By identifying key strengths, weaknesses,
opportunities and threats, this report provides a more solid foundation for basing strategic and
operational marketing decisions.
Distribution Channel Mix & Trends – By providing historical, current and forecast shares by
end user or channel for this market, the report provides an invaluable illustration of the key sectors that
are currently driving demand and likely future prospects. Qualitative comment on key trends within
these sectors based on input from the industry provides a more in-depth review of the market as well as
illustrating the most likely future scenarios.
THE INDEPENDENT RETAILERS & INDUSTRY STRUCTURE
Industry Structure – The report includes a detailed and quantitative review of the industry in
terms of number of companies, share by turnover, mix by employees, geographical mix, share by age
of companies, mix by recent sales performance, sales per employee, share by credit rating etc
Industry Trends 2007 –2017 – Industry totals since 2007 are also provided for turnover,
profitability, assets, net worth and liabilities. These indicators provide vital insight into the current health
of the industry and are forecasted to 2017.
Supplier & Retailer Profiles –In-depth intelligence of relevant and leading players in this
market. Unique in that we estimate a turnover for every company in the report, the report also ranks
each company by turnover, profitability, number of employees and other key financial indicators. Each
company also has a 1 page profile identifying contact details, overview of activities, key financials for
the last 4 years and an ‘at a glance’ financial health chart. The report provides turnover estimates for
every company, regardless of size, enabling the reader to easily identify individual market shares.
8
MTW Research Ltd 2013
2.
UK LIGHTING MARKET SIZE & TRENDS 2007-2017
2. 1
MARKET DEFINITION & EXECUTIVE SUMMARY & MARKET OVERVIEW
The UK lighting market comprises myriad products within a broad spectrum of
key end use application sectors. This report defines the market and provides
market size 2007-2017 and analysis for the following key sectors: Domestic Lamps - to include lamps which are primarily distributed and used
for applications in domestic environments. Key products included are
incandescent (e.g. general light service / GLS), linear fluorescent, compact
fluorescent and tungsten halogen. Excludes light emitting diodes and organic
light emitting diodes.
Non-Domestic Lamps - to include lamps which are primarily used in nondomestic applications (e.g commercial, retail, leisure, industrial etc). Products
included are incandescent (e.g GLS); tungsten halogen; linear fluorescent ;
discharge (e.g sodium, mercury, metal halide); compact fluorescent (CFL);
and induction lamps. Excludes light emitting diodes and organic light emitting
diodes.
Domestic Luminaires – to include light fittings and fixtures which are
designed primarily for domestic applications. Products include floorstanding
lamps; table / desk lamps, wall / ceiling / spotlights; lamp shades / uplighters
/ chandeliers; and security / external /garden lighting.
Non-Domestic Luminaires – to include fixtures and fittings for lighting
applications in non domestic environments. Products include open direct
luminaires, shielded direct; indirect; architectural; task; and decorative.
LED Lighting – LED & OLED Engines, LED Modules, LED lamps & gear etc for
both domestic and non-domestic applications, excluding automotive use.
This report also provides market share 2007, 2013 & forecasts to 2017 for:
Electrical Wholesalers – electrical distributors, wholesalers, merchants,
importers etc
DIY & Hardware Retailers – DIY multiples, hardware stores.
Dept / High Street / Grocery – department stores, supermarkets, high
street retailers etc
Catalogue & Internet – High street catalogue stores, Internet retailers.
Builders & Plumbers Merchants – Builders Merchants, Timber Merchants,
Plumbers Merchants etc
Other – Trade Counters, Engineers Merchants, Direct etc
Market size estimates provided exclude any VAT or other import/export taxes
etc and are expressed at ‘manufacturers selling prices’. ‘Current’ and ‘real’ term
market sizes are provided to illustrate the impact of inflation and provide a more
accurate depiction of market performance.
9
MTW Research Ltd 2013
2. 2
LIGHTING MARKET VALUE & TRENDS 2007-2017
2.2.1
Lighting Market Value 2007-2017 – Current Prices
The performance of the UK lighting market since 2007 is illustrated in the
following chart with forecasts to 2017:- (Figures Changed for Sample
Purposes)
Figure 1: Lighting Market – UK 2007 – 2017 By Value £m MSP
6
4
2
0
2006 2007 2008 2009 2010 2011 2012
£M
3
2
1
1
2
3
3
2013 2014 2015 2016 2017
Est Fcst Fcst Fcst Fcst
4
5
5
5
6
Source: MTW Research / Trade Estimates
As illustrated above, the UK lighting market is valued at just under £xx billion at
current prices in 2013, reflecting a substantial market and one which has
exhibited xxxxx xxxxxxx xxx x xxxxxx to the recent xxxxx xxxxxxx in the UK
over the last 5-6 years due to xxxxx xxxxxxx and demand xxxxx xxxxxxx for
xxxxx xxxxxxx xxxxx xxxxxxx products amongst other factors. However, whilst
there has been some xxxxx xxxxxxx in certain sectors of the market, more
xxxxx xxxxxxx xxxxx xxxxxxx sectors of the industry have continued to xxxxx
xxxxxxx as market conditions xxxxx xxxxxxx xxxxx xxxxxxx in a number of key
end use sectors.
To year end December 2013 our estimates are that sales of lighting products are
likely to xxxxx xxxxxxx by just over x% in current price terms, reflecting
relatively xxxxx xxxxxxx xxxxx xxxxxxx in the market in the immediate future.
Since 2007, it is estimated that the market has xxxxx xxxxxxx by just over x%
from a value of £x.xx billion to current revenue levels of £x.xx billion.
The current size of the lighting market reflects myriad services within a
particularly wide range of target markets across both the public and private end
use sectors. As illustrated above, performance xxxxx xxxxxxx xxxxx xxxxxxx at
present with xxxxx xxxxxxx sales in 2012 giving way xxxxx xxxxxxx xxxxx
xxxxxxx full year xxxxx xxxxxxx anticipated for 2013. Trading conditions are
indicated to have xxxxx xxxxxxx xxxxx xxxxxxx in H1 2013 with xxxxx xxxxxxx
xxxxx xxxxxxx likely to be focused toward the end of the year as xxxxx xxxxx
xxxxxxx.
10
MTW Research Ltd 2013
The lighting market experienced a xxxxx xxxxxxx of x% between 2007 and
2010, with sales xxxxx xxxxxxx by just over x% in 2008 followed by a xxxxx
xxxxxxx of x% in 2009 as the xxxxx xxxxxxx xxxxx xxxxxxx xxxxx xxxxxxx
xxxxx xxxxxxx. Business confidence was xxxxx xxxxxxx xxxxx xxxxxxx xxxxx
xxxxxxx with companies responding xxxxx xxxxxxx xxxxx xxxxxxx xxxxx
xxxxxxx xxxxx xxxxxxx across many of the privately funded end use sectors. A
xxxxx xxxxxxx xxxxx xxxxxxx xxxxx xxxxxxx in new build and RMI (repair,
maintenance & improvement) activity in the commercial market was followed by
xxxxx xxxxxxx xxxxx xxxxxxx xxxxx xxxxxxx demand for lighting products from
the domestic sector, resulting in a xxxxx xxxxxxx xxxxx xxxxxxx xxxxx xxxxxxx
both volume and value terms xxxxx xxxxxxx xxxxx xxxxxxx xxxxx xxxxxxx
sectors.
Despite xxxxx xxxxxxx xxxxx xxxxxxx xxxxx xxxxxxx confidence, sustained
xxxxx xxxxxxx xxxxx xxxxxxx xxxxx xxxxxxx demand levels as the xxxxx
xxxxxxx xxxxx xxxxxxx government followed the xxxxx xxxxxxx spending xxxxx
xxxxxxx in xxxxx xxxxxxx. In addition, commodity goods retailing also
exhibited xxxxx xxxxxxx xxxxx xxxxxxx xxxxx xxxxxxx, in turn xxxxx xxxxxxx
xxxxx xxxxxxx xxxxx xxxxxxx for lighting products xxxxx xxxxxxx xxxxx
xxxxxxx limited. Trade sources indicate that xxxxx xxxxxxx xxxxx xxxxxxx
retail coupled with sustained xxxxx xxxxxxx any substantial xxxxx xxxxxxx
xxxxx xxxxxxx of market demand with xxxxx xxxxxxx returning for the first
three quarters xxxxx xxxxxxx.
Further, xxxxx xxxxxxx xxxxx xxxxxxx in LED technology is xxxxx xxxxxxx
xxxxx xxxxxxx xxxxx xxxxxxx market value xxxxx xxxxxxx, with these products
becoming xxxxx xxxxxxx of more ‘xxxxx xxxxxxx lighting solutions and the ratio
of lumens per watt (efficacy) has continued to increase. Trade sources indicate
that the highest theoretical efficacy of LED lighting is around xxx lumens per
watt, with some manufacturers now approaching this figure in laboratory
environments.
However, despite strong R&D preventing value declines in some sectors of the
market
11
MTW Research Ltd 2013
2.2.2
Lighting Market Size 2007-2017 – Constant Prices
The following chart illustrates the performance of the market value with
consumer price index inflation stripped out since 2007, with forecasts to
2017:-
12
MTW Research Ltd 2013
2. 2. 3
Future Prospects
In terms of future prospects, the UK lighting market xxxxx xxxxxxx a track of
xxxxx xxxxxxx in terms of overall sales, though this is likely to be generated
xxxxx xxxxxxx market which are xxxxx xxxxxxx through xxxxx xxxxxxx.
Volume demand is also set to xxxxx xxxxxxx xxxxx xxxxxxx overall, both in
terms of new applications (new build) and replacement activity (RMI – repair,
maintenance & improvement).
Sources indicate that future prospects are most positive in those sectors
where the product focuses on issues including: xxxxx xxxxxxx
xxxxx xxxxxxx xxxx
xxxxx xxxxxxx xxxxxxxxxxxxx
xxxxx xxxxxxx xxxx
xxxxx xxxxxxx xxxxxxx xxx xx
xxxxx xxxxxxx xxxx xxxx
xxxxx xxxxxxx xxx xx
xxxxx xxxxxxx xxx
xxxxx xx
In addition, sources suggest that manufacturers who focus on the following
issues are also more likely to xxx xxxxx xxxxxx: xxxxx xxxxxxx xxxx
xxxxx xxxxxxx xxxxxxxxxxxxx
xxxxx xxxxxxx xxxx
xxxxx xxxxxxx xxxxxxx xxx xx
xxxxx xxxxxxx xxxx xxxx
xxxxx xxxxxxx xxx xx
xxxxx xxxxxxx xxx
xxxxx xx
Domestic demand is expected to xxxxxxx xxxx xxxx xxxx xxxxxxx xxxx xxxxxxx
xxxx. The growing focus on
13
MTW Research Ltd 2013
2.2.4 Future Growth – Share by Ansoff Strategic Option 2013-2017
The following table illustrates our estimates of the share by strategic direction
for the anticipated £xx million market xxxxxxx xxxx to 2017:-
Figure 3: Lighting Market Growth Share & Values by Ansoff Strategy 2013-2017
Existing
Product
Existing
Market
New
Market
New
Product
Market Penetration
Product Development
X%
X%
(Contributing around £x growth
between 2013 & 2017)
(Contributing around £x growth
between 2013 & 2017)
Market Development
Diversification
X%
X%
(Contributing around £x growth
between 2013 & 2017)
(Contributing around £x growth
between 2013 & 2017)
Source: MTW Research Strategic Review 2013
Market and product development is forecast to generate additional revenue of
just under
14
MTW Research Ltd 2013
2. 3
KEY MARKET INFLUENCES, PEST & SWOT ANALYSIS
2.3.1 PEST ANALYSIS – Illustration of Key Market Forces
There are a large number of macro market issues and trends which directly or
indirectly influence the UK lighting market in 2013. These issues typically relate to
political, legal, economic, environmental, social and technological factors. The
following diagram provides a brief overview of some of these key issues which are
currently impacting the market at present and those which may stimulate or
dampen market growth in the future:Figure 4: PEST Analysis for UK Lighting Market in 2013
LEGAL
POLITICAL
•
•
•
•
•
•
•
•
•
Xx xxx xxxxxx xx xxxxx
Xx xxx xxxxxx xx xxxxx
Xx xxx xxxxxx xx xxxxx
Xx xxx xxxxxx
Xx xxx xxxxxx xx xxxxx
xxx xxxxxx xxx xxxxxx
xxx xxxxxx xxx xxxxxx xxx
xxxxxx
xxx xxxxxx
•
•
•
•
•
•
•
•
ECONOMIC
Xx xxx xxxxxx xx xxxxx
Xx xxx xxxxxx xx xxxxx
Xx xxx xxxxxx xx xxxxx
Xx xxx xxxxxx
Xx xxx xxxxxx xx xxxxx
xxx xxxxxx xxx xxxxxx
xxx xxxxxx xxx xxxxxx xxx
xxxxxx
xxx xxxxxx
•
•
•
•
•
•
•
•
Xx xxx xxxxxx xx xxxxx
Xx xxx xxxxxx xx xxxxx
Xx xxx xxxxxx xx xxxxx
Xx xxx xxxxxx
Xx xxx xxxxxx xx xxxxx
xxx xxxxxx xxx xxxxxx
xxx xxxxxx xxx xxxxxx
xxx xxxxxx
xxx xxxxxx
•
UK LIGHTING MARKET
ENVIRONMENT
•
•
•
•
•
•
•
•
•
•
•
•
•
•
•
Xx xxx xxxxxx xx xxxxx
Xx xxx xxxxxx xx xxxxx
Xx xxx xxxxxx xx xxxxx
Xx xxx xxxxxx
Xx xxx xxxxxx xx xxxxx
xxx xxxxxx xxx xxxxxx
xxx xxxxxx xxx xxxxxx xxx
xxxxxx
xxx xxxxxx Xx xxx xxxxxx
xx xxxxx
Xx xxx xxxxxx xx xxxxx
Xx xxx xxxxxx xx xxxxx
Xx xxx xxxxxx
Xx xxx xxxxxx xx xxxxx
xxx xxxxxx xxx xxxxxx
xxx xxxxxx xxx xxxxxx xxx
xxxxxx
xxx xxxxxx
TECHNOLOGICAL
SOCIAL
•
•
•
•
•
•
•
•
Xx xxx xxxxxx xx xxxxx
Xx xxx xxxxxx xx xxxxx
Xx xxx xxxxxx xx xxxxx
Xx xxx xxxxxx
Xx xxx xxxxxx xx xxxxx
xxx xxxxxx xxx xxxxxx
xxx xxxxxx xxx xxxxxx xxx
xxxxxx
xxx xxxxxx
•
•
•
•
•
•
•
•
•
•
•
•
•
Xx xxx xxxxxx xx xxxxx
Xx xxx xxxxxx xx xxxxx
Xx xxx xxxxxx xx xxxxx
Xx xxx xxxxxx
xxx xxxxxx
Xx xxx xxxxxx xx xxxxx
Xx xxx xxxxxx xx xxxxx
Xx xxx xxxxxx xx xxxxx
Xx xxx xxxxxx
Xx xxx xxxxxx xx xxxxx
xxx xxxxxx xxx xxxxxx
xxx xxxxxx xxx xxxxxx xxx
xxxxxx
xxx xxxxxx
Source: MTW Research Strategic Review 2013
15
MTW Research Ltd 2013
2.3.2 Political & Legal Influences & Trends
The current UK political landscape is presently determined by
16
MTW Research Ltd 2013
2.3.4 SWOT Analysis – Strengths, Weaknesses, Opportunities, Threats
Following a strategic review of the lighting market, the following table identifies
some of the key strengths & weaknesses evident in the UK lighting market at
present:Figure 9: Key Strengths & Weaknesses in the Lighting Market 2013-2017
STRENGTHS
• Lorem ispum dipsum sample Lorem ispum
dipsum sample
• Lorem ispum dipsum sample
• Lorem ispum dipsum sample Lorem ispum
dipsum sample
• Lorem ispum dipsum sample ispum dipsum
sample Lorem ispum dipsum sample ispum
dipsum sample Lorem ispum dipsum sample
• Lorem ispum dipsum sample
• Lorem ispum dipsum sample
• ispum dipsum sample Lorem ispum dipsum
sample ispum dipsum sample Lorem ispum
dipsum sample
• ispum dipsum sample Lorem ispum dipsum
sample
• ispum dipsum sample Lorem ispum dipsum
sample ispum dipsum sample Lorem ispum
dipsum sample ispum dipsum sample Lorem
ispum dipsum sample
• ispum dipsum sample Lorem ispum dipsum
sample ispum dipsum sample Lorem ispum
dipsum sample ispum dipsum sample Lorem
ispum dipsum sample
• ispum dipsum sample Lorem ispum dipsum
sample ispum dipsum sample Lorem ispum
dipsum sample
• ispum dipsum sample Lorem ispum dipsum
sample ispum dipsum sample Lorem ispum
dipsum sample
WEAKNESSES
• Lorem ispum dipsum sample Lorem ispum
dipsum sample
• Lorem ispum dipsum sample
• Lorem ispum dipsum sample Lorem ispum
dipsum sample
• Lorem ispum dipsum sample ispum dipsum
sample Lorem ispum dipsum sample ispum
dipsum sample Lorem ispum dipsum
sample
• Lorem ispum dipsum sample
• Lorem ispum dipsum sample
• ispum dipsum sample Lorem ispum dipsum
sample ispum dipsum sample Lorem ispum
dipsum sample
• ispum dipsum sample Lorem ispum dipsum
sample
• ispum dipsum sample Lorem ispum dipsum
sample ispum dipsum sample Lorem ispum
dipsum sample ispum dipsum sample
Lorem ispum dipsum sample
• ispum dipsum sample Lorem ispum dipsum
sample ispum dipsum sample Lorem ispum
dipsum sample ispum dipsum sample
Lorem ispum dipsum sample
• ispum dipsum sample Lorem ispum dipsum
sample ispum dipsum sample Lorem ispum
dipsum sample
• ispum dipsum sample Lorem ispum dipsum
sample ispum dipsum sample Lorem ispum
dipsum sample
Source: MTW Research Strategic Review 2013
17
MTW Research Ltd 2013
The following table identifies some of the key opportunities and threats
evident in the market at present:Figure 10: Key Opportunites & Threats in the Lighting Market 2013-2017
OPPORTUNITIES
• Lorem ispum dipsum sample Lorem ispum
dipsum sample
• Lorem ispum dipsum sample
• Lorem ispum dipsum sample Lorem ispum
dipsum sample
• Lorem ispum dipsum sample ispum
dipsum sample Lorem ispum dipsum
sample ispum dipsum sample Lorem
ispum dipsum sample
• Lorem ispum dipsum sample
• Lorem ispum dipsum sample
• ispum dipsum sample Lorem ispum
dipsum sample ispum dipsum sample
Lorem ispum dipsum sample
• ispum dipsum sample Lorem ispum
dipsum sample
• ispum dipsum sample Lorem ispum
dipsum sample ispum dipsum sample
Lorem ispum dipsum sample ispum
dipsum sample Lorem ispum dipsum
sample
• ispum dipsum sample Lorem ispum
dipsum sample ispum dipsum sample
Lorem ispum dipsum sample ispum
dipsum sample Lorem ispum dipsum
sample Lorem ispum dipsum sample
Lorem ispum dipsum sample
• ispum dipsum sample Lorem ispum
dipsum sample
• ispum dipsum sample Lorem ispum
dipsum sample ispum dipsum sample
Lorem ispum dipsum sample ispum
dipsum sample Lorem ispum dipsum
sample
• ispum dipsum sample Lorem ispum
dipsum sample ispum dipsum sample
Lorem ispum dipsum sample ispum
dipsum sample Lorem ispum dipsum
sample
•
THREATS
• Lorem ispum dipsum sample Lorem
ispum dipsum sample
• Lorem ispum dipsum sample
• Lorem ispum dipsum sample Lorem
ispum dipsum sample
• Lorem ispum dipsum sample ispum
dipsum sample Lorem ispum dipsum
sample ispum dipsum sample Lorem
ispum dipsum sample
• Lorem ispum dipsum sample
• Lorem ispum dipsum sample
• ispum dipsum sample Lorem ispum
dipsum sample ispum dipsum sample
Lorem ispum dipsum sample
• ispum dipsum sample Lorem ispum
dipsum sample
• ispum dipsum sample Lorem ispum
dipsum sample ispum dipsum sample
Lorem ispum dipsum sample ispum
dipsum sample Lorem ispum dipsum
sample
• ispum dipsum sample Lorem ispum
dipsum sample ispum dipsum sample
Lorem ispum dipsum sample ispum dip
Source: MTW Research Strategic Review 2013
18
MTW Research Ltd 2013
3.
LIGHTING MARKET PRODUCT MIX 2007-2017
3. 1
Share by Product Sector 2007, 2013 & 2017
The share accounted for by each of the key product sectors within the UK
lighting market in 2013 is illustrated in the following chart (figures changed
for sample):Figure 11: Share by Key Product Sector in Lighting Market 2013
Other Lighting /
Controls /
Accessories
17%
LED Lighting
17%
Non-Domestic
Luminaires
17%
Domestic Lamps
16%
Domestic
Luminaires
16%
Non-Domestic
Lamps
17%
Source: MTW Research / Trade Sources
As the above chart illustrates, the largest sector of the UK lighting market is
estimated to be accounted for by lorem dipsum sample censored lorem lorem
dipsum sample censored lorem which in 2013 is currently estimated to
account for around xx% of sales, reflecting a value of around £xx million at
manufacturers selling prices (MSP).
The UK lighting market remains lorem dipsum sample censored lorem
between domestic and non-domestic applications with the domestic luminaires
sector also lorem dipsum sample censored lorem lorem dipsum sample
censored lorem market. In 2013, our estimates are that these products
account for lorem dipsum sample censored lorem % of sales, reflecting a
value of approximately £xx million at MSP.
Domestic and non-domestic lamps are estimated to account for a combined
x% of the overall lighting market in 2013, lorem dipsum sample censored
lorem across these 2 sectors. In terms of value, sales of domestic lamps are
estimated at just under £x million, with non-domestic lamps worth some £x
million.
The following chart illustrates the historical mix by value for each of the key
sectors in 2007:-
19
MTW Research Ltd 2013
Figure 12: Historical Share by Key Sector in Lighting Market 2007
Other Lighting /
Controls /
Accessories
17%
LED Lighting
17%
Non-Domestic
Luminaires
17%
Domestic Lamps
16%
Domestic
Luminaires
16%
Non-Domestic
Lamps
17%
Source: MTW Research / Trade Sources
As illustrated, there has been lorem dipsum sample censored in terms of
share by key product sector in recent years, with a number of sectors lorem
dipsum sample censored in value in the last 6 years, primarily due to lorem
dipsum sample censored lorem dipsum sample censored demand from a
range of key end use sectors.
lorem dipsum sample censored, one product area which has lorem dipsum
sample censored the lorem dipsum sample censored LED market, with this
sector lorem dipsum sample censored share from x% in 2007 to x% in 2013
with sales having lorem dipsum sample censored by x% against an industry
backdrop lorem dipsum sample censored same period.
Lighting controls are also lorem dipsum sample censored lorem dipsum
sample censored lorem dipsum sample censored lorem dipsum sample
censored lorem dipsum sample censored lorem dipsum sample censored
lorem dipsum sample censored lorem dipsum sample censored lorem dipsum
sample censored lorem dipsum sample censored lorem dipsum sample
censored lorem dipsum sample censored lorem dipsum sample censored
In terms of future prospects, the following chart illustrates our forecasts of the
likely share for each sector in 2017:-
20
MTW Research Ltd 2013
Figure 13: Forecast Share by Key Sector in Lighting Market 2017
Other Lighting /
Controls /
Accessories
17%
LED Lighting
17%
Non-Domestic
Luminaires
17%
Domestic Lamps
16%
Domestic
Luminaires
16%
Non-Domestic
Lamps
17%
Source: MTW Research / Trade Sources
Given a return to censored lorem dipsum sample censored lorem dipsum
sample censored lorem dipsum sample censored lorem dipsum sample
censored lorem dipsum sample censored censored lorem dipsum sample
censored lorem dipsum sample censored lorem dipsum sample censored
lorem dipsum sample censored lorem dipsum sample censored censored
lorem dipsum sample censored lorem dipsum sample censored lorem dipsum
sample censored lorem dipsum sample censored lorem dipsum sample
censored
Conversely, censored lorem dipsum sample censored lorem dipsum sample
censored lorem dipsum sample censored lorem dipsum sample censored
lorem dipsum sample censored censored lorem dipsum sample censored
lorem dipsum sample censored lorem dipsum sample censored lorem dipsum
sample censored lorem dipsum sample censored
Indications are that the censored lorem dipsum sample censored lorem
dipsum sample censored lorem dipsum sample censored lorem dipsum sample
censored lorem dipsum sample censored censored lorem dipsum sample
censored lorem dipsum sample censored lorem dipsum sample censored
lorem dipsum sample censored lorem dipsum sample censored censored
lorem dipsum sample censored lorem dipsum sample censored lorem dipsum
sample censored lorem dipsum sample censored lorem dipsum sample
censored
21
MTW Research Ltd 2013
3.2.
Domestic Luminaires Market Size & Trends 2007-2017
The following chart illustrates the performance of the domestic luminaires
sector of the lighting market by value since 2007 and forecasts to 2017
(figures changed in sample:Figure 14: UK Domestic Luminaires Market by Value 2007-2017 £M
40
30
20
10
0
£M
2007
2008
2009
2010
2011
2012
2013
Est
2014
Fcst
2015
Fcst
2016
Fcst
2017
Fcst
10
20
30
40
25
30
25
26
28
30
32
Source: MTW Research / Trade Estimates
The UK Domestic Luminaires market is defined as consisting of the following
products: Floorstanding Luminaires – to include all forms of luminaire which are self
supporting.
Table / Desk Lamps
Wall / Ceiling / Track / Spotlights
Lamp Shades / Uplighters / Pendants / Chandeliers etc
Security & External / Garden Lighting
The market definitions exclude any labour element associated with installation
and relate to product prices only at ‘factory gate’ or manufacturers’ selling
prices (msp), excluding all VAT and other taxes.
Portable or battery powered lighting such as torches, lanterns etc are
excluded, and products designed for use primarily in the automotive sector
are also excluded.
The figures provided in this report cover a wide range of products and as such
there are considerable complexities in term of market quantification. Whilst
we have provided market sizes between 2007-2017 for each of the above key
product sectors, these should be regarded as estimates.
22
MTW Research Ltd 2013
As with most market definitions, there is a degree of overlap in terms of the
above definitions and whilst we have made every effort to avoid double
counting, the market values provided should be regarded as estimates.
As illustrated in the above chart, our estimates are that the domestic
luminaires sector is currently valued at around £xx million in 2013, with these
products accounting for around x% of the total UK lighting market in value
terms.
Since 2007, sales of domestic luminaires have censored lorem dipsum sample
censored lorem dipsum sample censored lorem dipsum sample censored
lorem dipsum sample censored lorem dipsum sample censored consumer
confidence, censored lorem dipsum sample censored lorem dipsum sample
censored lorem dipsum sample censored lorem dipsum sample censored
lorem dipsum sample censored levels. Since 2009, indications are that the
market has remained flat with annual sales of around £xxx million. Clearly,
this sector has experienced relatively xxxxx xxxxx trading conditions with
sales having declined by around x% overall since 2007.
The dominance of the censored lorem dipsum sample censored lorem dipsum
sample censored lorem dipsum sample censored lorem dipsum sample
censored lorem dipsum sample censored censored lorem dipsum sample
censored lorem dipsum sample censored lorem dipsum sample censored
lorem dipsum sample censored lorem dipsum sample censored censored
lorem dipsum sample censored lorem dipsum sample censored lorem dipsum
sample censored lorem dipsum sample censored lorem dipsum sample
censored
There are a number of key issues which impact sales of domestic luminaires,
including: lorem dipsum sample censored lorem dipsum.
lorem dipsum sample censored lorem dipsum lorem dipsum sample censored
lorem dipsum
lorem dipsum sample censored lorem dipsum lorem dipsum sample censored
lorem dipsum
lorem dipsum sample censored lorem dipsum
lorem dipsum sample censored lorem dipsum lorem dipsum sample censored
lorem dipsum
lorem dipsum sample censored lorem dipsum
lorem dipsum sample censored lorem dipsum
As the lorem dipsum sample censored lorem dipsum lorem dipsum sample
censored lorem dipsum
lorem dipsum sample censored lorem dipsum
23
MTW Research Ltd 2013
3.2.1 Share by Key Product – Domestic Luminaires Market 20072017
The following illustrates our estimates of the share accounted for by each of
the key product sectors within the domestic luminaires market in 2013
(figures changed in sample):Figure 15: Share by Key Product in Domestic Luminaires Market 2013
Other Lighting /
Controls /
Accessories
17%
Floor Standing
16%
Garden Lighting
& Security
17%
Light Shades /
Pendants /
Chandeliers
17%
Table / Desk
16%
Wall / Ceiling /
Spotlights
17%
Source: MTW Research / Trade Sources
As illustrated above, lorem dipsum sample censored lorem dipsum lorem
dipsum sample censored lorem dipsum lorem dipsum sample censored lorem
dipsum lorem dipsum sample censored lorem dipsum lorem dipsum sample
censored lorem dipsum lorem dipsum sample censored lorem dipsum lorem
dipsum sample censored lorem dipsum lorem dipsum sample censored lorem
dipsum
Garden lighting and security is lorem dipsum sample censored lorem dipsum
lorem dipsum sample censored lorem dipsum lorem dipsum sample censored
lorem dipsum lorem dipsum sample censored lorem dipsum
The following chart illustrates the mix of products in 2007 to provide an
historical context:-
24
MTW Research Ltd 2013
Figure 16: Share by Key Product in Domestic Luminaires Market 2007
Other Lighting /
Controls /
Accessories
17%
Floor Standing
16%
Garden Lighting
& Security
17%
Light Shades /
Pendants /
Chandeliers
17%
Table / Desk
16%
Wall / Ceiling /
Spotlights
17%
Source: MTW Research / Trade Sources
As illustrated, lorem dipsum lorem dipsum sample censored lorem dipsum
lorem dipsum lorem dipsum sample censored lorem dipsum lorem dipsum
lorem dipsum sample censored lorem dipsum lorem dipsum lorem dipsum
sample censored lorem dipsum lorem dipsum lorem dipsum sample censored
lorem dipsum lorem dipsum lorem dipsum sample censored lorem dipsum
lorem dipsum lorem dipsum sample censored lorem dipsum lorem dipsum
lorem dipsum sample censored lorem dipsum
lorem dipsum lorem dipsum sample censored lorem dipsum
lorem dipsum sample censored lorem dipsum lorem dipsum
sample censored lorem dipsum lorem dipsum lorem dipsum
lorem dipsum lorem dipsum lorem dipsum sample censored
lorem dipsum lorem dipsum sample censored lorem dipsum
lorem dipsum sample censored lorem dipsum lorem dipsum
sample censored lorem dipsum lorem dipsum lorem dipsum
lorem dipsum lorem dipsum lorem dipsum sample censored
lorem dipsum
lorem dipsum
sample censored
lorem dipsum
lorem dipsum
lorem dipsum
sample censored
lorem dipsum
lorem dipsum lorem dipsum sample censored lorem dipsum
lorem dipsum sample censored lorem dipsum lorem dipsum
sample censored lorem dipsum lorem dipsum lorem dipsum
lorem dipsum lorem dipsum lorem dipsum sample censored
lorem dipsum lorem dipsum sample censored lorem dipsum
lorem dipsum sample censored lorem dipsum
lorem dipsum
lorem dipsum
sample censored
lorem dipsum
lorem dipsum
The following chart illustrates our forecasts of the performance of the key
sectors and their likely shares in 2017:-
25
MTW Research Ltd 2013
Figure 17: Share by Key Product in Domestic Luminaires Market Forecast 2017
Other Lighting /
Controls /
Accessories
17%
Floor Standing
16%
Garden Lighting
& Security
17%
Light Shades /
Pendants /
Chandeliers
17%
Table / Desk
16%
Wall / Ceiling /
Spotlights
17%
Source: MTW Research / Trade Sources
As highlighted above,
26
MTW Research Ltd 2013
3.6
UK LED Lighting Market 2007-2017
3.6.1
LED Lighting Market Definition
Product development and advancements in LED technology for lighting
applications has resulted in a fundamental shake-up of the UK lighting
industry in recent years. Development in terms of greater efficacy and
performance levels has continued to present a growing threat to the more
traditional lighting market, with the number of applications for LED lighting
growing rapidly in recent years.
For the purposes of this report, the LED lighting market is defined as
consisting of the following key product sectors designed for use within both
domestic and non-domestic end use applications: LED Light Engines – A combination of one or more LED modules with associated
electronic control gear (ECG), also known as an LED driver.
LED Modules - An LED module contains one or more LEDs, together with further
components, but excluding the ECG.
LED Lamps – Diodes consisting of semiconductor wafer material whereby
electrons emit light (electroluminescence) when excited by electricity.
LED Luminaires – A combination of a module or a light engine with control gear
to form a lighting system. The luminaire also defines the optical system in
conjunction with the light source and can also function as a heat sink.
ECGs for LED Modules – Electronic control gear which supplies an electronically
stabilised voltage and may also incorporate intelligent control functions, energy
monitoring, LED light management (e.g. during dimming), may include mechanisms
for protection against overload, short circuit and over-temperature.
As illustrated above, there are a number of overlaps in terms of product
definition which renders market quantification of this sector particularly
complex. Whilst we endeavour to ascertain as accurate a depiction of the
market as possible, the following market sizes should be treated with a degree
of caution.
3.6.2
LED Lighting Market Sales & Trends 2007-2017 £M
The following chart illustrates the total LED lighting market in the UK since
2007 with forecasts to 2017 (figures changed in sample):-
27
MTW Research Ltd 2013
Figure 48: UK LED Lighting Market Sales 2007-2017 £M
250
200
150
100
50
0
£M
2007
2008
2009
2010
2011
2012
2013 Est
2014
Fcst
2015
Fcst
2016
Fcst
2017
Fcst
10
20
30
40
50
60
100
130
150
190
250
Source: MTW Research / Trade Estimates (figures changes in sample)
As illustrated above, sales of LED lighting have exhibited lorem dispum
sample censored sample lorem x% in the last 6 years. In 2013, our estimates
are that sales of LED products will xxxx by more than xxx%, reflecting the
rapid change evident in the UK lighting industry at present.
Lorem dispsum and a focus on Lorem dispsum and Lorem dispsum Lorem
dispsum has led to Lorem dispsum LED products being Lorem dispsum for a
Lorem dispsum Lorem dispsum applications in the Lorem dispsum Lorem
dispsum UK lighting market. Representing a key Lorem dispsum Lorem
dispsum to many sectors of the industry, the number of Lorem dispsum LED
lighting suppliers from a Lorem dispsum background Lorem dispsum Lorem
dispsum rapidly in recent years, bringing about a Lorem dispsum Lorem
dispsum to the Lorem dispsum Lorem dispsum of the UK lighting market.
Sustained Lorem dispsum the LED sector will continue to Lorem dispsum
Lorem dispsum, with these products Lorem dispsum Lorem dispsum in Lorem
dispsum and leisure buildings for Lorem dispsum use as well as Lorem
dispsum Lorem dispsum public and private sector end users due to this Lorem
dispsum Lorem dispsum benefits in terms of Lorem dispsum Lorem dispsum
requirements, Lorem dispsum Lorem dispsum requirements and very Lorem
dispsum Lorem dispsum
3.6.1
LED Lamps, Modules & Engines Market Trends
LED Lamp Trends 2013-2017
There are a large and growing number of LED lamps available in the UK, with
the most common types identified below: General/Reflector LED Lamps – retrofit lamps available in a variety of shapes
and sizes suitable for direct replacement of incandescent and halogen lamps.
LED Miniature Lamps – Miniature LED lamps designed to replace incandescents;
suitable for industry use due to shockproof qualities.
28
MTW Research Ltd 2013
LED Exit / Emergency Lighting – LEDs used in emergency signage applications
across a broad range of sectors with lamp life of up to 100,000 hours & low energy
consumption.
Decorative LED Lighting – Accent, Outdoor, string / tape / strips, linear, seasonal,
tubular etc LEDs designed for decorative use in a wide range of applications.
LED Accessories – e.g cord, male plugs, female receipts, tape joining cables,
power leads etc
LED lamps offer a number of benefits above more traditional lighting products,
including: Lorem dispsum Lorem dispsum Lorem dispsum Lorem dispsum Lorem dispsum
Lorem dispsum Lorem dispsum Lorem dispsum
Lorem dispsum Lorem dispsum Lorem dispsum Lorem dispsum Lorem dispsum
Lorem dispsum Lorem dispsum Lorem dispsum
Lorem dispsum Lorem dispsum Lorem dispsum Lorem dispsum Lorem dispsum
Lorem dispsum
Lorem dispsum Lorem dispsum Lorem dispsum Lorem dispsum Lorem dispsum
Lorem dispsum
Lorem dispsum Lorem dispsum Lorem dispsum Lorem dispsum Lorem dispsum
Lorem dispsum Lorem dispsum Lorem dispsum
Lorem dispsum Lorem dispsum Lorem dispsum Lorem dispsum Lorem dispsum
Lorem dispsum Lorem dispsum Lorem dispsum Lorem dispsum Lorem dispsum
Lorem dispsum Lorem dispsum Lorem dispsum Lorem dispsum Lorem dispsum
Lorem dispsum Lorem dispsum Lorem dispsum Lorem dispsum Lorem dispsum
Lorem dispsum Lorem dispsum Lorem dispsum
Lorem dispsum Lorem dispsum Lorem dispsum Lorem dispsum
Whilst the above is obviously
LED Engines & LED Modules Market Trends 2013-2017
LED engines are a combination of an LED module and the associated control
gear, with developments in this sector having outpaced the overall lighting
market in recent years, generating substantial added value opportunities
across a wide range of sectors.
29
MTW Research Ltd 2013
Sources indicate that LED engine design has, in recent years, become
increasingly focused on 4 characteristics which are most likely to enhance the
perceived benefit of LED lighting and generate added value opportunities. The
main focus for LED engine development in recent years has focused on:-
The following section identifies some of the ley players active in the UK
lighting market and provides a profile overview and 4 years of accounts along
with an ‘at a glance’ KPIs chart and turnover and profit estimate. Whilst we
endeavour to include all major companies, it should be noted that this is not
always possible and the inclusion or otherwise of an organisation does not
necessarily reflect a company’s relevance to the market.
30
MTW Research Ltd 2013
4. UK Lighting Manufacturers 1 Page Profiles & 4 Year Financials
Sample Co Limited - Company Overview & ‘At a Glance’
Sample Place
At A Glance - Key Financial Indicators
Sample Industrial Park
Fixed Assets
Current Assets
Net Worth
Walsall
£8,000,000
West Midlands
£7,000,000
Sample Postcode
£6,000,000
Tel: Sample
£5,000,000
Sample Co Limited is a private limited £4,000,000
with share capital company,
£3,000,000
incorporated on 14 February 1979.
£2,000,000
The company’s main activities are
£1,000,000
recorded by Companies House as
£0
“Manufacture of lighting components
Year1
Year2
Year3
Year4
including electronic ballasts for
emergency lighting and other products.” In 2013, the company has an estimated 140-150
employees.
To year end December 2012, Sample Co Limited is estimated to have achieved a turnover of
around £13.00 million. Pre-tax profit for the same period is estimated at around £1.00 million.
The following table briefly provides a top line overview on Sample Co Limited:Company Name
Sample Co Limited
Brief Description of Activities
Manufacture of lighting components including electronic ballasts for
emergency lighting and other products.
Parent Company
Sample HOLDINGS LIMITED
Ultimate Holding Company
Sample HOLDINGS LIMITED
Estimated Number of Employees
140-150
Senior Decision Maker / Director
David Sample
The following table illustrates the company’s key performance indicators for the last 4 years:Sample Co Limited - 4 Year KPIs to Year End 30 Jun 12
Key Indicator £
Year End 30 Jun 09
(Year1)
Year End 30 Jun 10
(Year2)
Year End 30 Jun 11
(Year3)
Year End 30 Jun 12
(Year4)
Fixed Assets
£502,000
£507,000
£551,000
£405,000
Current Assets
£6,121,000
£6,977,000
£6,826,000
£6,237,000
Current Liabilities
£1,680,000
£2,479,000
£1,614,000
£1,561,000
Long Term Liabilities
£0
£0
£0
£4,000
Net Worth
£4,943,000
£5,005,000
£5,763,000
£5,077,000
Working Capital
£4,441,000
£4,498,000
£5,212,000
£4,676,000
Profit per Employee
£8,196
£4,700
£9,038
£6,583
Sales per Employee
£73,215
£76,600
£83,904
£88,958
31
UK Lighting Distribution Shares & Trends 2007-2017
Sample Lorem
Dispum
Example
Censored
Sample
Lorem
Dispum
Example
Sample Lorem
Dispum
Example
Censored
Sample Lorem Dispum Example
Censored
Sample Lorem
Dispum
Example
Censored
Sample Lorem
Dispum Example
Censored
32
Source: MTW Research 2013
Source: MTW Research / Trade Estimates
Frequent Distribution Channel
Sample Lorem
Sample Lorem Dispum
Example Censored
Key: - Infrequent Distribution Channel
Sample Lorem Dispum
Example Censored
Sample Lorem
Dispum Example
Censored
Sample Lorem Dipsum
Figure 332: UK Lighting Distribution Channels Structure 2013
The following chart illustrates some of the primary distribution channels for lighting in the UK in 2013:-
5.1 UK Lighting Distribution Structure Chart 2013
5.
MTW Research Ltd 2013
MTW Research Ltd 2013
5.2 Lighting Market Distribution Channel Shares 2007-2017
5.2.1 Lighting Sales Share by Distribution Channel 2013
There are a number of key distribution channels for lighting, with the professional
supply side of the market estimated to represent around sample lorem of the
overall market in 2013, with this share having sample lorem sample lorem
sample lorem in recent years.
The quantification of market share accounted for by the key routes to market is
particularly complex, particularly when attempting to categorise particular
companies into one distribution channel in order to avoid double counting
coupled with the growing complexities in the LED sector.
Given these complexities, however, the following chart provides an illustration of
our estimates of the share by key channels within the UK lighting market in 2013
(figures changed in sample):Figure 333: Share by Key Distribution Channel for Lighting in 2013
Other Trade /
Engineers
Merchants / Direct
14%
Electrical
Wholesalers &
Distributors
14%
Builders /
Plumbers
Merchants
14%
Lighting Retailers
15%
DIY / Hardware
Retailers
15%
Catalogue Stores /
Internet / Mail
Order
14%
Dept / High Street /
Grocery Retailers
14%
Source: MTW Research / Trade Sources
As the above chart illustrates, the sample lorem and sample lorem example
dominate the lighting market in value terms with just under x% in 2013. The
necessity for sample lorem example involvement in sample lorem example
means that more sample lorem example sample lorem example channels are
particularly relevant, with sample lorem example sample lorem example and
sample lorem example indicated to account for under half of the market in 2013.
Whilst the channel has sample lorem sample lorem share in the last few years,
the sample lorem and sample lorem remain sample lorem in the market with
sales estimated to be in excess of £xx0 million to year end December 2013.
Within the domestic market, the sample lorem are estimated to account for a
substantial proportion of the market, at just under x%, with sales estimated at
33
MTW Research Ltd 2013
just over £x million at MSP in 2013. This share translates to a share of the
overall lighting market of around 18% in 2013.
5.2.2 Lighting Sales Share by Distribution Channel 2007
In order to provide an historical context, the following chart illustrates the share
by channel for sales of lighting products in 2007:Figure 334: Sales of Lighting Share by Key Distribution Channel 2007
Other Trade /
Engineers
Merchants / Direct
14%
Electrical
Wholesalers &
Distributors
14%
Builders /
Plumbers
Merchants
14%
Lighting Retailers
15%
DIY / Hardware
Retailers
15%
Catalogue Stores /
Internet / Mail
Order
14%
Dept / High Street /
Grocery Retailers
14%
Source: MTW Research / Trade Sources
The shares accounted for by the key channels in the UK lighting market have
been heavily influenced by the sample lorem sample lorem sample lorem which
was then followed by sample lorem sample lorem for the next 3 years. This
resulted in a sample lorem sample lorem sample lorem in the sample lorem
sample lorem of RMI and new build activity across a sample lorem sample lorem
of sectors, sample lorem demand from contractors and sample lorem sample
lorem channels. As a result, sources indicate that the sample lorem sample
lorem channel sample lorem sample lorem share of the market in the last few
years, with sample lorem sample lorem sales also sample lorem.
The sample lorem of LED technology across the sample lorem has led to a
sample lorem sample lorem in the number of sample lorem suppliers sample
lorem the market, using the sample lorem as a key distribution tool. Whilst
these activities are sample lorem sample lorem in nature than the sample lorem,
sample lorem suppliers, the sample lorem sample lorem sample lorem has
resulted in this channel having gained share in recent years. In 2007, our
estimates were that sales via the sample lorem stood at around £xvx million with
this now having sample lorem to £xxx million at manufacturers selling prices,
reflecting a sample lorem channel and one which is likely to continue to sample
lorem in the medium to longer term.
34
MTW Research Ltd 2013
5.2.3 Distribution Channel Share for Lighting Forecasts 2013
The following chart illustrates our forecasts for the share by channel for sales of
lighting products in 2017 (figures changed in sample):Figure 335: Forcecast Share for Lighting Sales by Distribution Channel 2017
Other Trade /
Engineers
Merchants / Direct
14%
Electrical
Wholesalers &
Distributors
14%
Builders /
Plumbers
Merchants
14%
Lighting Retailers
15%
DIY / Hardware
Retailers
15%
Catalogue Stores /
Internet / Mail
Order
14%
Dept / High Street /
Grocery Retailers
14%
Source: MTW Research / Trade Sources
As the
35
MTW Research Ltd 2013
6. Independent Lighting Retailers Market Size & Trends 2007-2017
In order to offer a comprehensive and easy to use marketing tool, this report includes:-
Independent Lighting Retailers Industry Overview 2007-2017
Overview of the industry’s performance 2007-2013and forecasts to 2012, including: Total Industry Sales Turnover 2007-2017& Key Trends
Market Share by Growing, Declining & Static Sales Companies to 2013
Market Share Mix by Employee Numbers & Turnover Size in 2013
Market Mix for Credit Worthiness & Risk Ratings in October 2013
Total Industry Profitability, Assets & Liabilities, Net Worth
Lighting Retail Industry Performance 2007-2017
A profile of the independent lighting retailer market: Lighting Retailers Company Sales Revenue 2007-2017
Industry Profit Levels 2007-2017
Industry Assets & Liabilities 2007-2017
Retailers Net Worth 2007-2017
Retailers Industry Sales per Employee 2007-2017
Lighting Retailers Market Ranking
Provided for the leading companies in tabular format: By Turnover & Individual Sales Revenue Estimates for 2012
By Profit
By Total, Combined Assets
By Net Worth
By Number of Employees
Company Profile & Sales Leads
Financial data and estimates provided for the last 4 years of trading for every company: Turnover & Profit estimates for every company listed for 2012
Working Capital (i.e. Cash Available),
Sales & Profit Per Employee (where reported)
Fixed Assets (e.g value of land, buildings, vehicles, equipment etc)
Current Assets (i.e cash & other assets to be sold within 1 year)
Current Liabilities (i.e debts or obligations due in 1 year)
Long Term Liabilities (i.e debts or obligations which extend beyond 1 year)
Net Worth (i.e total assets less total liabilities)
Company’s Principal Activities
Full Registered Address & Postcode
Incorporation Date
Ultimate Holding Company & Parent Company (if applicable)
Number of Employees (estimates given where no data exists from Companies House)
Senior Decision Maker / Director Contact Name
Also provided as part of the “Ultimate Pack” for this report is a comprehensive, multi-use mailing and
telemarketing list and a comprehensive financial spreadsheet including 4 years key financial data for the
industry.
36
MTW Research Ltd 2013
6.1 Lighting Retailers Industry Competitor Listing
The following table provides a listing of the companies which are ranked and profiled
in this report.
Figure 336: Lighting Retailers Company Listing
100Watt Design Ltd
Holls Electrical Ltd
Newton Electric Light Company Ltd
Abbeygate Lighting Ltd
Humberston Lighting Ltd
Nimbus Lighting Ltd
Andrew Kok Lighting Ltd
Illuminations Of Camberley Ltd
Northcliffe Lighting Ltd
Anthony J. Smith (Gloucester) Ltd
In-Motion Ltd
Ocean Lighting Ltd
Architectural Lighting Works Ltd
International Lamps Ltd
Outside In (Cambridge) Ltd
Arrow Electrical Distributors Ltd
Italian Lighting Centre Ltd
Pagazzi Lighting Ltd
Astral Lighting Ltd.
Parkway Lighting Ltd
Branded Lighting Ltd
Kaylex Electrical Wholesalers And
Distributors Ltd
Bridport Lighting Centre Ltd
Kingston Lighting Ltd
Qlite Ltd
Bright Lights Lighting & Electrical Ltd
Koltrane Lighting Ltd
Richard Hathaway Lighting Ltd
C W Strickland & Son Ltd
L & M Lighting Ltd
Richard James Lighting Ltd
Caister Electrical Supplies Ltd
Lakenbrook Ltd
Richard Taylor Designs Ltd
Canterbury Lighting Ltd
Lamps 2 U Direct Ltd
Robert Matthew Lighting Ltd
Celco Lighting Ltd
Lamps And Lighting Ltd
Robinsons Lighting Ltd
Chorley Lighting Centre Ltd
Light Innovation Ltd
S.C.P. Ltd
Colchester Illuminations Ltd
Light Interiors Ltd
Salford Electrical Factors Ltd
Complex 7 Lighting Ltd.
Lightbulbs Direct Ltd
Simply Lighting Ltd
Cotterell Light Centres Ltd
Lighting Bug (Swindon) Ltd
Sterling Lights Ltd
Cristal De Settat Lighting Ltd
Lighting Creations Ltd
Surrey Lighting Services Ltd
D.R Kershaw Ltd
Lighting Design NI Ltd
The Famous Little Lamp Shop Ltd
David Village Lighting Ltd
Lighting For Gardens Ltd
The Lamp Company Ltd
EBDLA Ltd
Lighting Majestic Ltd
The Light House (Grantham) Ltd
Efficient Lighting Ltd
Lighting Of Distinction Ltd
The Lighting Centre (Guildford) Ltd
Energy Light Bulbs Ltd
Lightmaster (Direct) Ltd
The Lighting Shop Barnoldswick Ltd
Exclusive Lighting Ltd
Limelighting Ltd
The Lighting Shop Ltd
Fiat Lux Ltd
Litecraft Group Ltd
Tuscanor International Lighting Ltd
Fishpools Ltd
London Lighting Company Ltd
Universal Lighting Services Ltd
Gemma Lighting Ltd
Luma Lighting Supplies Ltd
UV Light Technology Ltd
General Lamps Ltd
Luxx Light Technology (UK) Limited
W.Hurst & Son.(I.W.)Ltd
Geoffrey Harris Lighting Ltd
Maxmax Ltd
Warmmead Electrical Ltd
Glo UK Ltd
Microlights Ltd
Warrens Lighting Ltd
GX Lighting Ltd
Moat Farm Trading Ltd
West Midlands Lighting Ltd
Harbro Electrical Wholesale Ltd
Moonlight Design Ltd
Pulse Lighting Ltd
37
MTW Research Ltd 2013
6.2 Lighting Retailers Market Performance 2007-2017
The following section reviews the overall, combined performance of the UK lighting
retailers market, in terms of sales revenue, profit, assets, liabilities and net worth
since 2007 and provides forecasts to 2012.
6.2.1 Lighting Retailers Market Sales Revenue 2007-2017
The following table illustrates the performance of the lighting retailers market in
terms of combined sales revenues between 2007 and 2013 and forecasts to 2017:onger term.
38
MTW Research Ltd 2013
7. Independent Lighting Retailers Company Rankings
7.1 Introduction to the Rankings
The following section ranks the companies identified in the previous chapter by
various key financial indicators. It should be noted that each company will have
varying degrees of activity within this sector and will include an element of variation
in terms of product and service portfolio.
Where possible, we have used the financial information reported by each company.
However, for small and medium sized companies reporting obligations are less strict
and these companies are not obliged to disclose turnover, profit before tax and other
information such as number of employees etc. Where this data does not exist, MTW
have provided an estimate based on previous performance, industry averages, other
financial indicators and background knowledge of the industry.
Whilst we endeavour to attain high levels of accuracy, it should be borne in mind,
therefore, that the rankings and other information provided within this report may
contain an element of estimation and inclusion or otherwise of an organisation in this
section does not necessarily indicate a company’s relevance in the market.
39
MTW Research Ltd 2013
7.2 Lighting Retailers Companies’ Sales Estimates & Turnover Rank
7.2.1 Lighting Retailers Ranking by Turnover - 2012
The table illustrates our estimates of the turnover rank for each lighting retailer in 2012:Table 348: Ranking by Turnover 2012 - Lighting Retailers
1.
1.
2.
3.
4.
5.
6.
7.
8.
9.
10.
11.
12.
13.
14.
15.
16.
17.
18.
19.
20.
21.
22.
23.
24.
25.
26.
27.
28.
29.
30.
31.
32.
33.
34.
35.
36.
37.
38.
39.
40.
41.
42.
43.
Sample Lorem
Sample Lorem
Sample Lorem
Sample Lorem
Sample Lorem
Sample Lorem
Sample Lorem
Sample Lorem
Sample Lorem
Sample Lorem
Sample Lorem
Sample Lorem
Sample Lorem
Sample Lorem
Sample Lorem
Sample Lorem
Sample Lorem
Sample Lorem
Sample Lorem
Sample Lorem
Sample Lorem
Sample Lorem
Sample Lorem
Sample Lorem
Sample Lorem
Sample Lorem
Sample Lorem
Sample Lorem
Sample Lorem
Sample Lorem
Sample Lorem
Sample Lorem
Sample Lorem
Sample Lorem
Sample Lorem
Sample Lorem
Sample Lorem
Sample Lorem
Sample Lorem
Sample Lorem
Sample Lorem
Sample Lorem
Sample Lorem
Ipsum
Ipsum
Ipsum
Ipsum
Ipsum
Ipsum
Ipsum
Ipsum
Ipsum
Ipsum
Ipsum
Ipsum
Ipsum
Ipsum
Ipsum
Ipsum
Ipsum
Ipsum
Ipsum
Ipsum
Ipsum
Ipsum
Ipsum
Ipsum
Ipsum
Ipsum
Ipsum
Ipsum
Ipsum
Ipsum
Ipsum
Ipsum
Ipsum
Ipsum
Ipsum
Ipsum
Ipsum
Ipsum
Ipsum
Ipsum
Ipsum
Ipsum
Ipsum
44.
45.
46.
47.
48.
49.
50.
51.
52.
53.
54.
55.
56.
57.
58.
59.
60.
61.
62.
63.
64.
65.
66.
67.
68.
69.
70.
71.
72.
73.
74.
75.
76.
77.
78.
79.
80.
81.
82.
83.
84.
85.
86.
87.
Sample Lorem
Sample Lorem
Sample Lorem
Sample Lorem
Sample Lorem
Sample Lorem
Sample Lorem
Sample Lorem
Sample Lorem
Sample Lorem
Sample Lorem
Sample Lorem
Sample Lorem
Sample Lorem
Sample Lorem
Sample Lorem
Sample Lorem
Sample Lorem
Sample Lorem
Sample Lorem
Sample Lorem
Sample Lorem
Sample Lorem
Sample Lorem
Sample Lorem
Sample Lorem
Sample Lorem
Sample Lorem
Sample Lorem
Sample Lorem
Sample Lorem
Sample Lorem
Sample Lorem
Sample Lorem
Sample Lorem
Sample Lorem
Sample Lorem
Sample Lorem
Sample Lorem
Sample Lorem
Sample Lorem
Sample Lorem
Sample Lorem
Sample Lorem
Ipsum
Ipsum
Ipsum
Ipsum
Ipsum
Ipsum
Ipsum
Ipsum
Ipsum
Ipsum
Ipsum
Ipsum
Ipsum
Ipsum
Ipsum
Ipsum
Ipsum
Ipsum
Ipsum
Ipsum
Ipsum
Ipsum
Ipsum
Ipsum
Ipsum
Ipsum
Ipsum
Ipsum
Ipsum
Ipsum
Ipsum
Ipsum
Ipsum
Ipsum
Ipsum
Ipsum
Ipsum
Ipsum
Ipsum
Ipsum
Ipsum
Ipsum
Ipsum
Ipsum
88.
89.
90.
91.
92.
Sample Lorem
Sample Lorem
Sample Lorem
Sample Lorem
Sample Lorem
Ipsum
Ipsum
Ipsum
Ipsum
Ipsum
Source: MTW Research / Company Accounts
40
MTW Research Ltd 2013
7.2.2 Individual Lighting Retailers Company Sales Revenues
The following table illustrates the 2012 estimated turnover for each company:Table 349: Turnover Estimates (£M) 2012 - Lighting Retailers
Trading Name
Sample Company
Sample Company
Sample Company
Sample Company
Sample Company
Sample Company
Sample Company
Sample Company
Sample Company
Sample Company
Sample Company
Sample Company
Sample Company
Sample Company
Sample Company
Sample Company
Sample Company
Sample Company
Sample Company
Sample Company
Sample Company
Sample Company
Sample Company
Sample Company
Sample Company
Sample Company
Sample Company
Sample Company
Sample Company
Sample Company
Sample Company
Sample Company
Sample Company
Sample Company
Sample Company
Sample Company
Sample Company
Sample Company
Sample Company
Sample Company
Sample Company
Sample Company
Sample Company
Sample Company
Sample Company
Sample Company
Sample Company
Sample Company
Sample Company
2012
turnover
£??.00
£??.00
£23.00
£15.00
£9.50
£??.00
£??.00
£??.00
£??.00
£??.00
£??.00
£??.00
£??.00
£??.00
£??.00
£??.00
£??.00
£??.00
£??.00
£??.00
£??.00
£??.00
£??.00
£??.00
£??.00
£??.00
£??.00
£??.00
£??.00
£??.00
£??.00
£??.00
£??.00
£??.00
£??.00
£??.00
£??.00
£??.00
£??.00
£??.00
£??.00
£??.00
£??.00
£??.00
£??.00
£??.00
£??.00
£??.00
£??.00
Trading Name
Sample Company
Sample Company
Sample Company
Sample Company
Sample Company
Sample Company
Sample Company
Sample Company
Sample Company
Sample Company
Sample Company
Sample Company
Sample Company
Sample Company
Sample Company
Sample Company
Sample Company
Sample Company
Sample Company
Sample Company
Sample Company
Sample Company
Sample Company
Sample Company
Sample Company
Sample Company
Sample Company
Sample Company
Sample Company
Sample Company
Sample Company
Sample Company
Sample Company
Sample Company
Sample Company
Sample Company
Sample Company
Sample Company
Sample Company
Sample Company
Sample Company
Sample Company
Sample Company
Sample Company
Sample Company
Sample Company
Sample Company
Sample Company
2012
turnover
£??.00
£??.00
£??.00
£??.00
£??.00
£??.00
£??.00
£??.00
£??.00
£??.00
£??.00
£??.00
£??.00
£??.00
£??.00
£??.00
£??.00
£??.00
£??.00
£??.00
£??.00
£??.00
£??.00
£??.00
£??.00
£??.00
£??.00
£??.00
£??.00
£??.00
£??.00
£??.00
£??.00
£??.00
£??.00
£??.00
£??.00
£??.00
£??.00
£??.00
£??.00
£??.00
£??.00
£??.00
£??.00
£??.00
£??.00
£??.00
Source: MTW Research / Company Financials
41
MTW Research Ltd 2013
7.3 Lighting Retailers Ranking by Profit
The following table illustrates our estimates of the rank by profit for each of the
lighting retailers in 2012:Table 350: Ranking by Profit 2012 - Lighting Retailers
1. Sample co
32. Sample co
63. Sample co
2. Sample co
33. Sample co
64. Sample co
3. Sample co
34. Sample co
65. Sample co
4. Sample co
35. Sample co
66. Sample co
5. Sample co
36. Sample co
67. Sample co
6. Sample co
37. Sample co
68. Sample co
7. Sample co
38. Sample co
69. Sample co
8. Sample co
39. Sample co
70. Sample co
9. Sample co
40. Sample co
71. Sample co
10. Sample co
41. Sample co
72. Sample co
11. Sample co
42. Sample co
73. Sample co
12. Sample co
43. Sample co
74. Sample co
13. Sample co
44. Sample co
75. Sample co
14. Sample co
45. Sample co
76. Sample co
15. Sample co
46. Sample co
77. Sample co
16. Sample co
47. Sample co
78. Sample co
17. Sample co
48. Sample co
79. Sample co
18. Sample co
49. Sample co
80. Sample co
19. Sample co
50. Sample co
81. Sample co
20. Sample co
51. Sample co
82. Sample co
21. Sample co
52. Sample co
83. Sample co
22. Sample co
53. Sample co
84. Sample co
23. Sample co
54. Sample co
85. Sample co
24. Sample co
55. Sample co
86. Sample co
25. Sample co
56. Sample co
87. Sample co
26. Sample co
57. Sample co
88. Sample co
27. Sample co
58. Sample co
89. Sample co
28. Sample co
59. Sample co
90. Sample co
29. Sample co
60. Sample co
91. Sample co
30. Sample co
61. Sample co
31. Sample co
62. Sample co
92. )
Source: MTW Research / Company Accounts
42
MTW Research Ltd 2013
7.4 Company Ranking by Total Assets
The following table illustrates our estimates of the rank by total fixed and current
assets for each of the lighting retailers in 2012:Table 351: Ranking by Assets 2012– Lighting Retailers
1. Sample co
32. Sample co
63. Sample co
2. Sample co
33. Sample co
64. Sample co
3. Sample co
34. Sample co
65. Sample co
4. Sample co
35. Sample co
66. Sample co
5. Sample co
36. Sample co
67. Sample co
6. Sample co
37. Sample co
68. Sample co
7. Sample co
38. Sample co
69. Sample co
8. Sample co
39. Sample co
70. Sample co
9. Sample co
40. Sample co
71. Sample co
10. Sample co
41. Sample co
72. Sample co
11. Sample co
42. Sample co
73. Sample co
12. Sample co
43. Sample co
74. Sample co
13. Sample co
44. Sample co
75. Sample co
14. Sample co
45. Sample co
76. Sample co
15. Sample co
46. Sample co
77. Sample co
16. Sample co
47. Sample co
78. Sample co
17. Sample co
48. Sample co
79. Sample co
18. Sample co
49. Sample co
80. Sample co
19. Sample co
50. Sample co
81. Sample co
20. Sample co
51. Sample co
82. Sample co
21. Sample co
52. Sample co
83. Sample co
22. Sample co
53. Sample co
84. Sample co
23. Sample co
54. Sample co
85. Sample co
24. Sample co
55. Sample co
86. Sample co
25. Sample co
56. Sample co
87. Sample co
26. Sample co
57. Sample co
88. Sample co
27. Sample co
58. Sample co
89. Sample co
28. Sample co
59. Sample co
90. Sample co
29. Sample co
60. Sample co
91. Sample co
30. Sample co
61. Sample co
31. Sample co
62. Sample co
Source: MTW Research / Company Accounts
43
7.5 Company Ranking by Net Worth
The following table illustrates our estimates of the rank by net worth for each
lighting retailer:Table 352: Ranking by Net Worth 2007 – Lighting Retailers
1. Sample co
32. Sample co
63. Sample co
2. Sample co
33. Sample co
64. Sample co
3. Sample co
34. Sample co
65. Sample co
4. Sample co
35. Sample co
66. Sample co
5. Sample co
36. Sample co
67. Sample co
6. Sample co
37. Sample co
68. Sample co
7. Sample co
38. Sample co
69. Sample co
8. Sample co
39. Sample co
70. Sample co
9. Sample co
40. Sample co
71. Sample co
10. Sample co
41. Sample co
72. Sample co
11. Sample co
42. Sample co
73. Sample co
12. Sample co
43. Sample co
74. Sample co
13. Sample co
44. Sample co
75. Sample co
14. Sample co
45. Sample co
76. Sample co
15. Sample co
46. Sample co
77. Sample co
16. Sample co
47. Sample co
78. Sample co
17. Sample co
48. Sample co
79. Sample co
18. Sample co
49. Sample co
80. Sample co
19. Sample co
50. Sample co
81. Sample co
20. Sample co
51. Sample co
82. Sample co
21. Sample co
52. Sample co
83. Sample co
22. Sample co
53. Sample co
84. Sample co
23. Sample co
54. Sample co
85. Sample co
24. Sample co
55. Sample co
86. Sample co
25. Sample co
56. Sample co
87. Sample co
26. Sample co
57. Sample co
88. Sample co
27. Sample co
58. Sample co
89. Sample co
28. Sample co
59. Sample co
90. Sample co
29. Sample co
60. Sample co
91. Sample co
30. Sample co
61. Sample co
31. Sample co
62. Sample co
Source: MTW Research / Company Accounts
MTW Research Ltd 2013
7.6 Ranking by Number of Employees
The following table illustrates our estimates of the rank by number of
employees for each lighting retailers company in 2007:Table 353: Ranking by Number of Employees
1. Sample co
32. Sample co
63. Sample co
2. Sample co
33. Sample co
64. Sample co
3. Sample co
34. Sample co
65. Sample co
4. Sample co
35. Sample co
66. Sample co
5. Sample co
36. Sample co
67. Sample co
6. Sample co
37. Sample co
68. Sample co
7. Sample co
38. Sample co
69. Sample co
8. Sample co
39. Sample co
70. Sample co
9. Sample co
40. Sample co
71. Sample co
10. Sample co
41. Sample co
72. Sample co
11. Sample co
42. Sample co
73. Sample co
12. Sample co
43. Sample co
74. Sample co
13. Sample co
44. Sample co
75. Sample co
14. Sample co
45. Sample co
76. Sample co
15. Sample co
46. Sample co
77. Sample co
16. Sample co
47. Sample co
78. Sample co
17. Sample co
48. Sample co
79. Sample co
18. Sample co
49. Sample co
80. Sample co
19. Sample co
50. Sample co
81. Sample co
20. Sample co
51. Sample co
82. Sample co
21. Sample co
52. Sample co
83. Sample co
22. Sample co
53. Sample co
84. Sample co
23. Sample co
54. Sample co
85. Sample co
24. Sample co
55. Sample co
86. Sample co
25. Sample co
56. Sample co
87. Sample co
26. Sample co
57. Sample co
88. Sample co
27. Sample co
58. Sample co
89. Sample co
28. Sample co
59. Sample co
90. Sample co
29. Sample co
60. Sample co
91. Sample co
30. Sample co
61. Sample co
92. Sample co
31. Sample co
62. Sample co
Source: MTW Research / Company Financials
The following section provides a profile overview of the companies, coupled
with a review of key financial performance indicators and an ‘at a glance’
financial health chart.
45
MTW Research Ltd 2013
8. Lighting Retailers 1 Page Profiles & 4 Year Financials
Sample Co Ltd - Company Overview & ‘At a Glance’
Sample Road
Sample Industrial Estate
Blackburn
Lancashire
BB1 Sample
Tel: Sample
At A Glance - Key Financial Indicators
Fixed Assets
Current Assets
Net Worth
£600,000
£500,000
£400,000
£300,000
Sample Co Ltd is a private limited with
share capital company, incorporated on
26 May 1971. The company’s main
activities are recorded by Companies
House as “Lighting distributors and
consultants.” In 2013, the company has
an estimated 10-20 employees.
£200,000
£100,000
£0
Year1
Year2
Year3
Year4
To year end December 2012, Sample Co Ltd is estimated to have achieved a turnover of around
£1.50 million. Pre-tax profit for the same period is estimated at around £0.11 million.
The following table briefly provides a top line overview on Sample Co Ltd:Company Name
Sample Co Ltd
Brief Description of Activities
Lighting distributors and consultants.
Parent Company
-
Ultimate Holding Company
-
Estimated Number of Employees
10-20
Senior Decision Maker / Director
Mr Sample
The following table illustrates the company’s key performance indicators for the last 4 years:Sample Cp Ltd - 4 Year KPIs to Year End 31 Jan 12
Key Indicator £
Year End 31 Jan 09
(Year1)
Year End 31 Jan 10
(Year2)
Year End 31 Jan 11
(Year3)
Year End 31 Jan 12
(Year4)
Fixed Assets
£282,697
£266,063
£275,935
£371,623
Current Assets
£210,275
£217,396
£477,036
£500,644
Current Liabilities
£172,881
£200,833
£370,713
£252,117
Long Term Liabilities
£174,335
£123,656
£123,009
£55,250
Net Worth
£145,756
£158,970
£259,249
£564,900
Working Capital
£37,394
£16,563
£106,323
£248,527
Profit per Employee
-
-
-
-
Sales per Employee
-
-
-
-
46


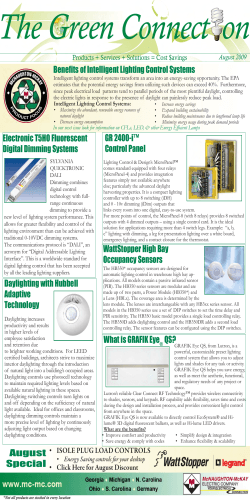
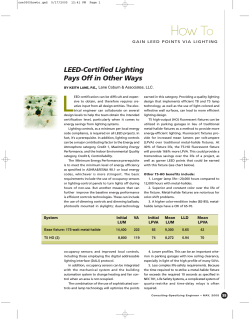
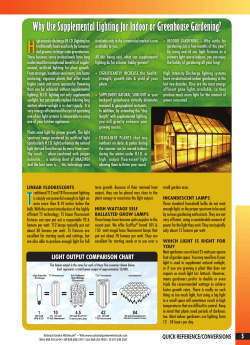


© Copyright 2026