
2010 Mobile Banking Vendor Analysis: Detailed Comparison of Top 12 Providers and Strategies to Address Market Shifts
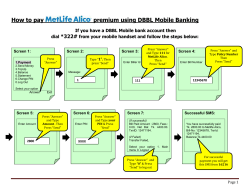
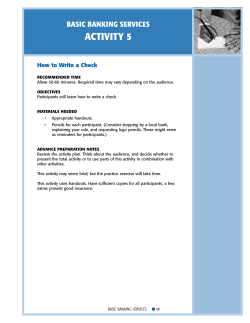
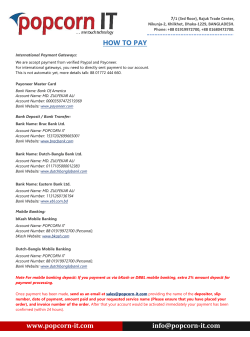
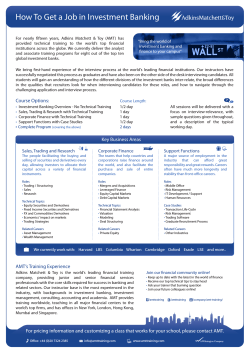
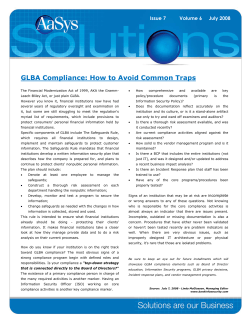
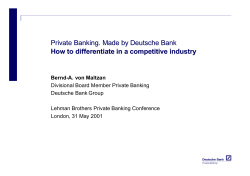
Syndicated Sample Report 2010 Mobile Banking Vendor Analysis: Detailed Comparison of Top 12 Providers and Strategies to Address Market Shifts J u n e 20 10 T +1 925 225 9100 ∙ F +1 925 225 9101 ∙ 4301 Hacienda Dr. ∙ Pleasanton, CA 94588 USA ∙ [email protected] ∙ www.javelinstrategy.com Syndicated Sample Report 2010 Mobile Banking Vendor Analysis: Detailed Comparison of Top 12 Providers and Strategies to Address Market Shifts Audience: Overview Financial institutions: mobile banking, marketing; mobile banking vendors, mobile network operators. Authors: Mobile banking has now been around for 10 years. Although it is here to stay this time around, consumer adoption is still a challenge for the industry and the onus is on financial institutions to help drive adoption as they own the customer. Mark Schwanhausser, Senior Analyst, Multichannel Financial Services Mary Monahan, Managing Partner and Research Director Contributors: This report aims to: •
for their mobile banking strategies •
States •
Provide FIs with an overview of the key mobile banking vendors that are active in the United Alan Raby, Consultant, Mobile John Kenderski, Associate Analyst Publication Date: Price: Length: Provide financial institutions (FIs) with a guideline Provide an overview and ranking of the product functionality offered by the 12 mobile banking vendors surveyed June 2010 •
Identify the various modes of mobile banking (mobile browser, SMS text banking and $2,000 smartphone applications) and which ones seem to ► 59 pages ► 22 charts/graphs be gaining more traction among consumers Primary Questions •
What are the key criteria FIs should consider when crafting their mobile banking strategy? •
What are the various mobile banking offerings, and which ones do consumers seem to be using? •
Competitive analysis of 12 vendors that offer mobile banking platforms via browser‐based solutions, downloadable applications, SMS texting and smartphone applications. Of the 12 vendors analyzed, who scored the best? T +1 925 225 9100 ∙ F +1 925 225 9101 ∙ 4301 Hacienda Dr. ∙ Pleasanton, CA 94588 USA ∙ [email protected] ∙ www.javelinstrategy.com Syndicated Sample Report 2010 Mobile Banking Vendor Analysis: Detailed Comparison of Top 12 Providers and Strategies to Address Market Shifts Methodology This report is based mainly on data collected online from a random‐sample panel of 5,211 households in March 2010. The survey targeted respondents based on representative proportions of gender, age and income compared to the overall U.S. online population. Overall margin of sampling error is ±1.36% at the 95% confidence level. This report is also based on data collected online from a random‐sample panel of 3,000 respondents with mobile phones in July 2009, with an overall margin of sampling error of ±1.79 percentage points at the 95% confidence level. The data in this report is further based on information collected during April and May 2010. A total of four FIs and 12 vendors were surveyed, and executive interviews were conducted. The 12 vendors were analyzed on a ten point scale, with 6 points allocated to product functionality, security, and back office channel management. Three points were allocated to methods of access provided. One point was given if the vendor had a strategic partnership in place with organizations that can assist the vendor with sales and implementation of their offerings. The six points that analyze product functionality, security, and back office and channel management are broken down as follows. Product functionality (60%), security (20%), and back office and channel management (20%). A one through six score was applied in regards to the above weighted score by the following criteria. •
0 points: More than two standard deviations lower than the mean •
1 point: More than one standard deviation lower than the mean •
2 points: Less than one standard deviation lower than the mean •
3 points: Equal to the mean •
4 points: Less than one standard deviation above the mean •
5 points: More than one standard deviation from the mean •
6 points: More than two standard deviations from the mean The majority of Javelin data for online banking financial alerts is based on “online households” vs. “individual consumers.” This is a typical way of presenting online banking data because account management is typically collected on a per‐household basis. In 2009, the U.S. population was estimated to comprise 307 million people.1 That includes 232 million adults, 118 million households, and 87 million households that are online. On average, there are about 2.6 people per household. Javelin also collects online‐banking data using a base of all consumers for comparison purposes. T +1 925 225 9100 ∙ F +1 925 225 9101 ∙ 4301 Hacienda Dr. ∙ Pleasanton, CA 94588 USA ∙ [email protected] ∙ www.javelinstrategy.com Syndicated Sample Report 2010 Mobile Banking Vendor Analysis: Detailed Comparison of Top 12 Providers and Strategies to Address Market Shifts Table of Contents Overview ...................................................................................................................................................................................... 4 Primary Questions .......................................................................................................................................................... 4 Key Findings ................................................................................................................................................................... 4 Methodology ................................................................................................................................................................................ 6 Executive Summary ...................................................................................................................................................................... 7 The History of Mobile Banking in North America ......................................................................................................................... 9 1999 – 2003 .................................................................................................................................................................... 9 2005 to 2007 – Déjà vu? .............................................................................................................................................. 11 2007 and Onward ......................................................................................................................................................... 14 U.S. Demographic Shifts ............................................................................................................................................................. 20 Key Criteria FIs Should Consider When Crafting Their Mobile Banking Strategy ....................................................................... 24 Mobile Banking Vendor Profiles ................................................................................................................................................. 26 Explanation of Vendor Analysis, Target Grid and Vendor Rankings ............................................................................. 26 Criteria Used To Rank Vendors .................................................................................................................................... 27 Mobile Banking Vendor Profiles ................................................................................................................................................. 28 ClairMail ....................................................................................................................................................................... 29 FIS ................................................................................................................................................................................. 31 Firethorn (Qualcomm) ................................................................................................................................................. 33 Fundamo ...................................................................................................................................................................... 35 Harland Financial Solutions .......................................................................................................................................... 37 Jack Henry & Associates ............................................................................................................................................... 39 M‐Com/Fiserv .............................................................................................................................................................. 41 mFoundry ..................................................................................................................................................................... 43 MShift ........................................................................................................................................................................... 45 Monitise Americas ....................................................................................................................................................... 47 Sybase .......................................................................................................................................................................... 49 Tyfone .......................................................................................................................................................................... 51 Appendix A – iPhone and Android Owners Penetration Among Mobile Bankers ...................................................................... 53 Appendix B – Smartphone Penetration vs. Mobile Phone Penetration ..................................................................................... 54 Appendix C – Consumer Mobile Banking Adoption ......................................................... ……………..……………………………………….55 Appendix D – Vendor Functionality‐Detailed ............................................................................................................................. 56 Related Research ........................................................................................................................................................................ 58 Companies Mentioned ............................................................................................................................................................... 59 T +1 925 225 9100 ∙ F +1 925 225 9101 ∙ 4301 Hacienda Dr. ∙ Pleasanton, CA 94588 USA ∙ [email protected] ∙ www.javelinstrategy.com Syndicated Sample Report 2010 Mobile Banking Vendor Analysis: Detailed Comparison of Top 12 Providers and Strategies to Address Market Shifts Table of Figures Figure 1: Summary of Vendor Rankings ....................................................................................................................................... 8 Figure 2: Early Devices That Supported Mobile Banking ............................................................................................................. 9 Figure 3: Technology S Curve ..................................................................................................................................................... 10 Figure 4: Mobile Phone Users Vs. Personal Computers Per‐100 Population ............................................................................. 11 Figure 5: Types of Mobile Banking Access ................................................................................................................................. 12 Figure 6: Why Certain Mobile Phone Owners Have Not Tried Mobile Banking ......................................................................... 13 Figure 7: Top 10 Paid and Free Financial Applications – Apple App Store ................................................................................. 14 Figure 8: Smartphone Market Share By Handset Manufacturer ............................................................................................... 15 Figure 9: Smartphone Penetration vs. Feature Phone Penetration ........................................................................................... 16 Figure 10: Mobile Banking Smartphone Usage .......................................................................................................................... 17 Figure 11: How Consumers Access Mobile Banking Data .......................................................................................................... 18 Figure 12: Financial Applications Are Already Available for the iPad......................................................................................... 19 Figure 13: US Demographic Projections ..................................................................................................................................... 20 Figure 14: Mobile Banking Usage by Ethnicity ........................................................................................................................... 21 Figure 15: Mobile Banking Users by Ethnicity ‐ Received a Financial Alert by E‐mail ................................................................ 22 Figure 16: Mobile Banking Users by Ethnicity ‐ Received a Financial Alert by SMS ................................................................... 23 Figure 17: Sample Vendor Target Grid ....................................................................................................................................... 26 Figure 18: Sample Vendor Comparison Table ............................................................................................................................ 27 Figure 19: Mobile Banking Percentage by Smartphone ............................................................................................................. 53 Figure 20: Mobile Phone and Smartphone Penetration Among U.S. Adults for March 2008 to March 2010 ........................... 54 Figure 21: Consumer Adoption of Mobile Banking .................................................................................................................... 55 Figure 22: Vendor Functionality Detailed .................................................................................................................................. 56 T +1 925 225 9100 ∙ F +1 925 225 9101 ∙ 4301 Hacienda Dr. ∙ Pleasanton, CA 94588 USA ∙ [email protected] ∙ www.javelinstrategy.com Syndicated Sample Report 2010 Mobile Banking Vendor Analysis: Detailed Comparison of Top 12 Providers and Strategies to Address Market Shifts Companies Mentioned Companies Mentioned ClairMail Mint American Express Monitise Americas Android Motorola Apple MShift AT&T NCR Corp. Bancorp South PayPal Bank of America RIM Bank of Montreal Samsung Bloomberg Sprint Chase SunTrust Citibank Sybase CNBC Symbian E*Trade T‐Mobile Firethorn (Qualcomm) Tyfone First Bank US Bank FIS USAA Fundamo Verizon Harland Financial Solutions Wachovia HTC Wells Fargo Jack Henry & Associates Windows M‐Com/Fiserv Western Union mFoundry T +1 925 225 9100 ∙ F +1 925 225 9101 ∙ 4301 Hacienda Dr. ∙ Pleasanton, CA 94588 USA ∙ [email protected] ∙ www.javelinstrategy.com 2010 Mobile Banking Vendor Analysis: Detailed Comparison of Top 12 Providers and Strategies to Address Market Shifts For a vendor to score the maximum number of points (10), it strategic partners that can not only help it sell mobile banking would need to score “high” in product depth, offer all three applications into the FIs and credit unions, but provide modes of mobile banking (applications/browser/SMS) and have implementation services as well. Vendor Rankings Vendor E
G
A
P
E
L
P
M
SA
Target Market Product Depth Multimodal Strategic Partners Total Score ClairMail L
M
CU
5
3
1
9
Firethorn Mobile L
M
S
CU
5
3
1
9
FIS L
M
S
CU
4.5
3
1
8.5
Fundamo L
M
S
CU
4
3
1
8
Harland FS L
M
S
CU
4
3
1
8
Jack Henry M
S
CU
3
3
1
7
M‐Com/Fiserv L
M
S
CU
2
3
1
6
mFoundry L
M
S
CU
2
2
1
5
Monitise Americas L
M
2
2
1
5
MShift S
CU
1
3
1
5
Sybase S
CU
1
3
1
5
Tyfone M
CU
2
3
0
5
Target Market: Large = (L), Midsized = (M), Small = (S) and Credit Union = (CU)
Maximum Score ‐ 10
© 2010 Javelin Strategy & Research Figure 1: Summary of Vendor Rankings © Copyright 2010 Javelin Strategy & Research. All rights reserved. It is protected by copyright and other intellectual property laws. You may display or print the content available for your use only. You may not sell, publish, distribute, re‐transmit or otherwise provide access to the content of this report. 8 2010 Mobile Banking Vendor Analysis: Detailed Comparison of Top 12 Providers and Strategies to Address Market Shifts During this period, FIs once again treated mobile banking as an 2009 survey results, the top reason consumers did not adopt extension of their online bank offering. Early mobile banking mobile banking was that they did not see the value of mobile functionality offered by FIs included: check balances (both DDA banking. Interestingly, lack of a consumer value proposition was and credit), view recent transactions (both DDA and credit), view also one of the key reasons cited by consumers from 1999 to any other accounts, bill pay, transfer funds between accounts 2003 for not doing mobile banking. Smartphone owners, 4
within the same financial institution and ATM/branch locator. however, are less likely to cite this as a reason for not using With the advent of smartphones, many FIs began offering mobile banking (25%). 5 smartphone applications. For example, consumers could visit the Security of mobile banking also continues to be a main inhibitor Apple App Store and download mobile banking applications for for all consumers (42%) – and it is far and away the top reason different FIs. that smartphone users do not mobile bank (53%).6 These E
G
A
P
E
L
P
M
SA
Despite advances made in mobile handsets during this period, findings stress the need for financial institutions to educate consumers about mobile banking security and to ensure that the consumer adoption remained a challenge for the mobile banking correct systems are in place to protect customers. Since security channel, as Javelin explored in our September 2009 report, remains a top obstacle to adoption, this perception must be “Mobile – Banking and Smart Phone Forecast: Essential addressed for users to more fully accept and adopt mobile Strategies for a Fast Growing, Evolving Market.” According to our banking. Compelling Value Proposition Still Needed to Spur Mobile Banking Adoption 44%
I don't see the value of mobile banking
42%
Security of mobile banking
34%
The cost of data access on my wireless plan
Cost or hidden fees from my bank for using the
service
10%
Dropped or lost telecommunications connections
9%
It is not offered by my bank or credit union
8%
6%
Potential limitations in wireless plans
5%
New technology, it may not work correctly
4%
My bank offers it but I don't have access to it
Set up process to register accounts
I don't have a formal banking relationship
3%
1%
14%
Other, please specify
0%
10%
20%
30%
40%
50%
Percent of Consumers
Q6: You indicated you do not use mobile banking. For what
reasons do you not use mobile banking? (select up to three)
July 2009, n= 2,396
Base: All consumers with mobile
who do not mobile bank.
© 2010 Javelin Strategy & Research
Figure 6: Why Certain Mobile Phone Owners Have Not Tried Mobile Banking 4
2008 U.S. Mobile Banking Benchmark Study: Mobile Access, Features, and Security – What Banks Are Offering Now, Javelin Strategy & Research, May 2008. Mobile Banking Behaviors 2010: Fewer Handsets in the U.S., yet Smartphone Growth Exceeds Expectations, Javelin Strategy & Research, May 2010. Ibid. 5 6 © Copyright 2010 Javelin Strategy & Research. All rights reserved. It is protected by copyright and other intellectual property laws. You may display or print the content available for your use only. You may not sell, publish, distribute, re‐transmit or otherwise provide access to the content of this report. 13 2010 Mobile Banking Vendor Analysis: Detailed Comparison of Top 12 Providers and Strategies to Address Market Shifts Our March 2010 financial services survey further bears out the Consumer device preference for accessing mobile banking significance of smartphones when it comes to mobile banking. services is shown in Figure 10. Appendix A provides an overview of mobile banking percentages The findings above were further supported by all of the vendors by smartphone. Although RIM (BlackBerry) devices may be used by 39% of the population surveyed, owners of the iPhone and Android‐equipped handsets use mobile banking services far more than BlackBerry owners, by a margin of 20%. Android usage is growing significantly, but FIs should be advised that in December an increase in consumers accessing their banking information via smartphones. Vendors whose main thrust is either mobile browser and/or SMS are now supporting smartphones such as E
G
A
P
E
L
P
M
SA
the iPhone, BlackBerry or Android. Interestingly, both vendors 2009, phishing malware was discovered in the Android app market posing as mobile banking apps for more than 50 banks and FIs reported that mobile banking users tend to use different modes to access their financial information depending on the and credit unions (which did not have Android smartphone applications). As part of their Android mobile banking strategy, FIs need to ensure they have adequate security controls in place to protect consumers from malware as well as other potential security risks. and FIs surveyed as part of this report. All participants reported situation they find themselves in. For example, a person waiting in line in a store might use an SMS text message to find out what his account balance is, because SMS can be accessed more rapidly. FIs are also using SMS to help transfer consumers out of Smartphone Apps for the Future: More IPhone and Android Users Access M‐Banking iPhone
49%
Android-based "Google" phone
48%
BlackBerry
29%
All consumers
0%
17%
10%
20%
30%
40%
50%
60%
Percent of Consumers
Q12: Please indicate the last time you conducted each
of the following at your primary bank: Used mobile
banking (i.e. checked balances or reviewed
transactions through your mobile phone or by text
message) In the last 90 days only, other options apply.
March 2010, n= 238, 119, 390, 4,979
Base: All consumers with respective
smartphones, all consumers.
© 2010 Javelin Strategy & Research
Figure 10: Mobile Banking Smartphone Usage © Copyright 2010 Javelin Strategy & Research. All rights reserved. It is protected by copyright and other intellectual property laws. You may display or print the content available for your use only. You may not sell, publish, distribute, re‐transmit or otherwise provide access to the content of this report. 17 Syndicated Sample Report 2010 Mobile Banking Vendor Analysis: Detailed Comparison of Top 12 Providers and Strategies to Address Market Shifts Place Your Order as Follows: 1) Call us at (925) 225‐9100 Ext. 31 2) Email us at [email protected] 3) Fax or Mail using the form below: Report Title Name: Publication Date Organization: Division or group: Email: Phone: Price Title: Fax: Address: Signature to confirm your order: Payment Method: [ ] Payment card [ ] Check Enclosed [ ] Invoice me Exp date: ___/___ Visa, MC, AE or Disc. card #: Name on Card: Signature: For invoicing, provide PO number: (Invoicing is available to financial institutions or publicly owned firms) Note: Reports are provided in electronic PDF form only. Javelin reports are subject to standard terms and conditions, as described on our web site. Javelin will contact you in the future to provide our free research newsletter or other mailings. If you do not wish to receive our newsletter or other mailings, you may advise us of this. Your contact information will not be sold to other organizations. T +1 925 225 9100 ∙ F +1 925 225 9101 ∙ 4301 Hacienda Dr. ∙ Pleasanton, CA 94588 USA ∙ [email protected] ∙ www.javelinstrategy.com


© Copyright 2026