
Document 274361
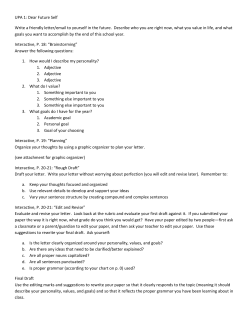
European Journal of Psychological Assessment, Vol. 20, Issue 2, pp. 134–146
M. Gomà-i-Freixanet et al.: Zuck erman-Kuhlman Personality
EJPA 20 (2),Questionnaire
© 2004 Hogrefe
in &
a Spanish
Huber Publishers
Sample
Psychometric Properties
of the Zuckerman-Kuhlman
Personality Questionnaire
in a Spanish Sample
Montserrat Gomà-i-Freixanet1, Sergi Valero2,
Joaquim Puntí1, and Marvin Zuckerman3
1
Department of Health Psychology, Autonomous University of Barcelona, Catalonia, Spain
Servei de Psiquiatria, Hospital Universitari de la Vall d’Hebron, Barcelona, Catalonia, Spain
3
Department of Psychology, University of Delaware, Newark, DE, USA
2
Keywords: Personality traits, ZKPQ, AFFM, cultural generalizability.
Summary: An important question in trait theory is how many major traits are necessary to describe personality
and exactly what traits these are. Several investigators have made attempts to answer these questions with
solutions of 3, 5, and even 16 primary factors. The Zuckerman-Kuhlman Personality Questionnaire (ZKPQ) is
a questionnaire aimed at the evaluation of a five-factor model, which emerged from factor analyses of scales
and items. The results were five basic factors, similar in men and women: Neuroticism-Anxiety, Activity,
Sociability, Impulsive Sensation-Seeking, and Aggression-Hostility. This study assesses the psychometric properties of the Catalan translation of the ZKPQ. The ZKPQ was administered to a total sample of 933 subjects
with an age range from 17 to 25 years. The results obtained show good internal consistency of all the scales and
good discriminant validity shown by the lack of correlation among scales. Gender differences are also in the
predicted directions. Finally, the replicability of the original five-component structure was also demonstrated.
The present findings show this Catalan version to be a reliable tool for research in the field of personality
structure and demonstrate the cross-cultural reliability of the factor structure developed from American subjects.
Introduction
In the last two decades many efforts have been made to
find the minimum number of dimensions necessary to
describe personality structure (Digman, 1990). Some emphasized a three-factor model (Eysenck, 1967; Tellegen,
1985), others a five-factor model (Costa & McCrae, 1985;
Goldberg 1992) or an older model of 16 factors (Cattell,
Eber, & Tatsuoka, 1970). “The Big Five” model (Digman,
1990) is currently the most popular model although there
is some dissent concerning its superiority to other models
(Tellegen 1985; Eysenck, 1992a; Zuckerman, 1992;
EJPA 20 (2), © 2004 Hogrefe & Huber Publishers
DOI: 10.1027/1015-5759.20.2.134
Block, 1995). According to the Five-Factor Model of personality (FFM), most personality traits can be described
in terms of five basic dimensions, namely: Neuroticism
vs Emotional Stability (N); Extraversion or Surgency (E);
Openness to Experience or Intellect, or Culture (O);
Agreeableness vs Antagonism (A); and Conscientiousness (C). This model started with the early work of Fiske
(1949), and Tupes and Christal (1961), and was continued
by Norman (1963) and revived by Goldberg (1981). The
FFM of personality was originally based on the lexical
approach to personality structure which maintained that
because personality traits are so central to human interactions, all important traits will have been encoded in natural
M. Gomà-i-Freixanet et al.: Zuckerman-Kuhlman Personality Questionnaire in a Spanish Sample
language. It was assumed that these dimensions could be
found in self- or peer-ratings using trait adjectives as well
as in questionnaires (McCrae & John, 1992). The FFM is
most often measured by the NEO questionnaire (Costa &
McCrae, 1992), which seems to show good cross-cultural
replicability across the different languages and cultures
studied, suggesting the universality of the FFM (McCrae
& Costa, 1997).
Although this model may be very helpful in describing one’s personality with self-reports or observer ratings, it has little utility in explaining behavior. As Eysenck has stated elsewhere (Eysenck, 1992a; 1992b), one
way of determining which are the basic traits of personality is using a nomological network or a theoretical underpinning to guide better taxonomic studies and lead to
theoretical advances. Another way is providing evidence
for a biological link between genetic causation and behavioral organization. In relation to the FFM, much is
known about the biological bases of N and E, but less is
known about C, A, and O.
Zuckerman, Kuhlman, Joireman, Teta, and Kraft
(1993) have proposed an alternative five-factor model
(AFFM). The model emerged from a series of factor analyses of scales believed to measure basic dimensions of
personality or temperament, particularly those used in
psychobiological research (Zuckerman, Kuhlman, &
Camac, 1988; Zuckerman, Kuhlman, Thornquist, &
Kiers, 1991). The basic traits in the AFFM measured by
the Zuckerman-Kuhlman Personality Questionnaire
(ZKPQ) are: Neuroticism-Anxiety (N-Anx), Activity
(Act), Sociability (Sy), Impulsive Sensation Seeking
(ImpSS) and Aggression-Hostility (Agg-Host). Like
Guilford (1975), Eysenck and Zuckerman view Openness-Intellect as a domain separate from temperament and
so it was deliberately excluded from the AFFM. In this
model, the broad Extraversion dimension is divided into
the separate factors of Activity and Sociability. Activity
emerged as a distinct factor in the five-factor analyses of
scales in earlier studies (Zuckerman et al., 1988; Zuckerman et al., 1991). Because of its identification as a basic
developmental trait (see, for example, Thomas & Chess,
1977; Buss & Plomin, 1984) activity level merits a distinctive assessment as a major trait of temperament or
personality in the adult human as well as in the child. The
distinction between Hostility and Anxiety is also important because both traits have different psychobiological
bases (Gray, 1982), and should not be confounded within
a single factor as found in the N dimension of Costa and
McCrae’s (NEO) model. On the other hand, Impulsivity
and Sensation Seeking are closely related and, with Socialization, form a distinctive factor in five-factor analyses of scales (Zuckerman et al., 1991) and items. These
two traits also have many important psychobiological correlates (Zuckerman, 1983, 1984, 1991, 1994).
135
The Zuckerman-Kuhlman Personality Questionnaire
contains five scales measuring the five aforementioned
basic traits and an additional scale named Infrequency to
control for inaccurate responding or social desirability.
This questionnaire has demonstrated good internal reliability and temporal stability (Zuckerman et al., 1993)
and some studies have already been conducted demonstrating its validity, e.g., characteristics of drug abusers
and prediction of therapy course (Ball, 1995), characteristics of psychopathology (Thornquist & Zuckerman,
1995) and risk taking (Zuckerman & Kuhlman, 2000).
The aim of the present study was to test the cultural generalizability of the AFFM, i.e., if the five factors postulated by the alternative model can be replicated in a different culture. For this purpose the ZKPQ was translated
into the Catalan language and administered to a Spanish
sample with demographic characteristics similar to the
original American one.
Materials and Methods
Subjects
The participants (n = 1045) were college students
(freshmen and sophomores) from four different schools
in Barcelona (Catalonia, Spain). Only those who responded to every one of the 99 items of the ZKPQ scales
were included in the data analyses. The total sample (n
= 933) consisted of 330 males (35.4%) and 603 females
(64.6%). The ages of the respondents ranged from 17
to 25 years (M = 19.16; SD = 1.19). The ZKPQ was
administered anonymously to groups in classroom settings. All subjects volunteered to take part in the study
and did not receive any credit for their participation.
Test-retest reliability coefficients with two weeks between testing were calculated using a second sample,
similar to the previous one, of 97 university students
whose ages ranged from 18 to 56 years (M = 20.43; SD
= 4.88).
Translation
The adaptation of the ZKPQ was done using the backtranslation method. Due to methodological concerns related to adaptation processes (Flaherty, Gaviria, Pathak,
Mitchell, Wintrob, Richman, & Birz, 1988), all the researchers were psychologists, and some of them had
experience with cultural studies. The first author who is
proficient in both languages, translated the English version into the Catalan language, paying special attention
EJPA 20 (2), © 2004 Hogrefe & Huber Publishers
136
M. Gomà-i-Freixanet et al.: Zuckerman-Kuhlman Personality Questionnaire in a Spanish Sample
to the content of the items and the scale they belonged
to. A second bilingual psychologist, living in the UK,
translated the Catalan version back into English. Afterwards, both translators met and compared the original
source and the back-translated items for equivalence of
meaning. Any discrepancy was discussed until an
agreement was reached. This version was then refined
by paying special attention to the use of frequent and
well-known words, and using a correct and easy grammar in order to ensure the items were well understood
for every level of education. Then, where applicable,
items were worded in a way that acknowledged the
gender of the subject because the Catalan language offers this possibility. Finally, this last version was given to the University Language Advisor for final correction.
Measures and Procedure
Subjects completed the translated version of the ZKPQ,
which consisted of five content scales, plus the Infrequency scale, containing a total of 99 items in a “truefalse” answering format. The five scales can be described
in terms of their typical content:
1. Neuroticism-Anxiety (N-Anx, 19 items) items describe
frequent emotional upset, tension, worry, fearfulness,
indecision, lack of self-confidence, and sensitivity to
criticism.
2. Activity (Act, 17 items) items describe the need for
general activity, an inability to relax and do nothing
when the opportunity arises, and a preference for hard
and challenging work, an active, busy life, and a high
energy level.
3. Sociability (Sy, 17 items) items describe the number of
friends one has and the amount of time spent with
them, outgoingness at parties, and a preference for
being with others as opposed to being alone and engaging in solitary activities.
4. Impulsive Sensation-Seeking (ImpSS, 19 items) items
involve a lack of planning and the tendency to act
impulsively without thinking and the seeking of excitement, novel experiences, and the willingness to
take risks for these types of experiences. The ImpSS
items are general in content and do not describe specific activities such as drinking or sex.
5. Aggression-Hostility (Agg-Host, 17 items) items describe a readiness to express verbal aggression; rude,
thoughtless, or antisocial behavior; vengefulness and
spitefulness; having a quick temper, and impatience
with others.
EJPA 20 (2), © 2004 Hogrefe & Huber Publishers
This questionnaire also includes an Infrequency scale
(Infreq, 10 items). Rather than being regarded as a scale
in the normative sense, it should only be used to detect
inattention to the task or simply as a validity measure for
the individual test-taker. The items are mostly exaggerated, true scored, socially desirable but unlikely to be
completely true statements about anyone. This scale is
highly skewed, with most scores around 0 or 1.
In the unpublished manual for the ZKPQ, Zuckerman
states that, in the USA samples, only 4% of the subjects
have scores greater than 3 in the Infreq scale. Thus, the
cut-off for the American samples was 3 and anyone with
a score of 4 or more was eliminated. In the Spanish
sample, the scores of the Infreq scale ranged from 0 to
7 (M = 1.58, SD = 1.45) with a mode of 1 and only 3.7%
of the subjects had a score greater than 4. In our study
we decided not to use the American cut-off. From other
studies of questionnaire adaptations to a population
similar to ours, see e.g., the Catalan adaptation of the
EPQ (Eysenck, García, Torrubia, Avila & Ortet, 1992)
or from our own experience (Gomà-i-Freixanet, 1995,
1997, 2001; Gomà-i-Freixanet & Wismeijer, 2002) we
know that the scores of the Lie scale in our country are
higher than the ones found in the UK samples. On the
other hand, the same pattern has been found in the Italian adaptation (V. De Pascalis, personal communication, July, 2000) as well as in a Castilian adaptation of
the ZKPQ (Gutiérrez-Zotes, Ramos & Saiz, 2001)
showing higher scores on the Infreq scale than the
American samples. As our aim was to test the cultural
generalizability of the AFFM, we thought it would be
more adequate to use the whole sample without introducing any “a priori” bias.
In order to replicate the results found in the USA sample, we used a sample of university students similar to
the original one. Means and standard deviations for the
scales were obtained for the total sample as well as for
males and females and t-tests were used to compare the
means as a function of sex. The internal consistencies of
the scales were calculated using Cronbach’s α coefficients and the intercorrelations of the scales were subsequently calculated. Finally, in order to investigate the
internal structure of the ZKPQ, an exploratory factor
analysis of Principal Component with Varimax rotation
for males and females as well as for the total sample was
carried out. As Messick (1989) has stated elsewhere, one
of the most powerful procedures to validate the structure
of a certain construct is its confirmation by means of
factor analysis. Additionally, the coefficients of congruence (Tucker, 1951) between the loading matrices obtained in the USA sample and the Catalan sample were
also computed for males and females, as well as within
the Catalan sample.
M. Gomà-i-Freixanet et al.: Zuckerman-Kuhlman Personality Questionnaire in a Spanish Sample
137
Table 1. Means, standard deviations, skewness, kurtosis and α coefficients of the Catalan version of the ZKPQ.
Scales
M
SD
Total sample
n = 933
Skewness
N-Anx
Act
Sy
ImpSS
Agg-Host
Infreq
9.45
8.05
8.95
9.78
7.67
1.58
4.56
3.55
3.41
4.11
3.05
1.45
.09
.09
–.41
–.00
–.19
.96
Total sample
n = 933
Kurtosis
–.91
–.64
–.26
–.74
–.45
.66
Men
n = 330
Cronbach’s α
.84
.74
.76
.79
.67
.45
Women
n = 603
.79
.73
.76
.75
.69
.47
.83
.75
.75
.80
.66
.39
Notes: N-Anx = Neuroticism-Anxiety, Act = Activity, Sy = Sociability, ImpSS = Impulsive Sensation Seeking, Agg-Host = Aggression-Hostility, Infreq = Infrequency.
sample, correlations among scales ranged from –.19 to
.22 with an absolute mean interscale correlation of .06.
Although the absolute values were very low, almost all
of the correlations were significant due to the large sample size.
Results
Descriptives, α Coefficients, t-Test
Comparisons of Gender and Correlation
Matrix
Table 1 shows the means, standard deviations, skewness,
and kurtosis of the total sample, and Cronbach’s α coefficients for males and females, as well as for the total
sample, as indices of internal consistency. The magnitude
of the coefficients α was adequate and very similar to that
found in the original American version. The mean α for
the ZKPQ scales for the total sample was .76, with values
ranging from .67 to .84. N-Anx scale had the highest reliability (.84) and Agg-Host had the lowest (.67); Act, Sy,
and ImpSS were intermediate (.74–.79). Test-retest reliabilities with two weeks between tests were N-Anx = .87,
Act = .89, Sy = .90, ImpSS = .91 and Agg-Host = .77,
indicating that the scales were reliable and stable.
Means and standard deviations for men and women,
and differences among genders, are shown in Table 2.
The genders differed significantly on the N-Anx, Sy,
ImpSS, and Infreq scales. Women scored significantly
higher on the N-Anx and Sy scales and men were higher
on ImpSS and Infreq. There were no significant gender
differences on Act and on Agg-Host scales.
Table 3 presents the correlation matrix for the total
sample and for men and women separately. In the total
Exploratory Factor Analysis
The structure of the translated version of the ZKPQ for
the total sample was checked through exploratory factor
analysis. Factor analysis of the 89 items remaining after
excluding the items of the Infrequency scale was done
with Principal Component analysis followed by normalTable 2. Means, standard deviations and t-test comparisons between men and women of the Catalan version of the ZKPQ scales.
Scales
Men (n = 330) Women (n = 603)
M
SD
M
SD
N-Anx
Act
Sy
ImpSS
Agg-Host
Infreq
7.39
7.81
8.26
10.45
7.57
2.03
4.00
3.47
3.53
3.86
3.19
1.60
10.57
8.17
9.32
9.41
7.73
1.33
4.46
3.59
3.29
4.20
2.98
1.29
t
11.14***
1.49
4.53***
3.71***
0.76
6.75***
Notes: ***p < .001; N-Anx = Neuroticism-Anxiety, Act = Activity,
Sy = Sociability, ImpSS = Impulsive Sensation Seeking, Agg-Host
= Aggression-Hostility, Infreq = Infrequency.
Table 3. Correlations among scales of the Catalan version of the ZKPQ.
Scale
N-Anx
N-Anx
Act
Sy
ImpSS
Agg-Host
Infreq
–.05 (.02)
–.11* (–.12*)
.09* (.10)
.09* (.17*)
–.17* (–.06)
Act
Sy
–.01
–.06
.13*
.11* (.15*)
.20* (.21*)
.11* (.03)
.15* (.14*)
.22* (.24*)
.11* (.11)
–.00 (–.08)
ImpSS
.04
.20*
.20*
.20* (.28*)
.08 (.00)
Agg-Host
.12*
.08*
.11*
.22*
Infreq
–.19
.13*
–.07*
.07*
–.08*
–.12* (–.02)
Notes: *p < .05; N-Anx = Neuroticism-Anxiety, Act = Activity, Sy = Sociability, ImpSS = Impulsive Sensation Seeking, Agg-Host =
Aggression-Hostility, Infreq = Infrequency. In the upper-right side are reported correlations obtained for the total sample; in the
lower-left side are correlations obtained for women and men (correlations for men are in parentheses).
EJPA 20 (2), © 2004 Hogrefe & Huber Publishers
138
M. Gomà-i-Freixanet et al.: Zuckerman-Kuhlman Personality Questionnaire in a Spanish Sample
Table 4. Result of the principal component analysis followed by a Varimax rotation of the five principal components from the ZKPQ scales
for the Catalan male sample, a priori factor assignment, item communalities, percentage of variance explained, and congruence
coefficients with the USA sample.
it__61
it__25
it__30
it__90
it__15
it__7
it__80
it__35
it__76
it__41
it__71
it__46
it__51
it__20
it__66
it__56
it__96
it__82
it__85
it__99
it__50
it__23
it__2
it__39
it__55
it__65
it__24
it__34
it__75
it__45
it__28
it__60
it__14
it__79
it__84
it__95
it__53
it__64
it__87
it__17
it__68
it__43
it__63
it__78
it__12
it__58
it__22
it__9
it__37
it__48
it__92
it__98
it__77
it__86
it__72
A priori
Scale
N-Anx
FI
ImpSS
FII
Sy
FIII
Agg-Host
FIV
Act
FV
h2
N-Anx
N-Anx
N-Anx
N-Anx
N-Anx
N-Anx
N-Anx
N-Anx
N-Anx
N-Anx
N-Anx
N-Anx
N-Anx
N-Anx
N-Anx
N-Anx
N-Anx
Sy
N-Anx
Act
ImpSS
Act
N-Anx
ImpSS
ImpSS
ImpSS
ImpSS
ImpSS
ImpSS
ImpSS
Act
ImpSS
ImpSS
ImpSS
ImpSS
ImpSS
Sy
Act
Sy
Sy
Sy
Sy
Sy
Sy
Sy
Sy
Sy
Sy
Sy
Sy
Sy
Sy
Agg-Host
Agg-Host
Agg-Host
0.648
0.597
0.574
0.548
0.515
0.478
0.477
0.474
0.463
0.429
0.411
0.405
0.397
0.391
0.388
0.381
0.347
0.344
–0.335
0.307
0.299
0.289
0.216
–0.085
0.076
0.032
0.036
–0.073
0.002
–0.041
–0.006
–0.135
0.178
–0.011
0.184
0.066
0.096
0.060
0.032
0.013
0.104
0.108
0.031
–0.163
–0.009
–0.149
–0.149
–0.031
–0.139
–0.075
–0.011
0.111
–0.124
–0.034
0.003
–0.037
0.117
0.138
0.069
0.180
–0.027
0.084
0.034
–0.051
–0.149
–0.137
–0.006
0.063
0.043
0.106
0.106
–0.127
0.157
0.076
0.166
0.056
–0.032
0.116
0.644
0.598
0.555
0.546
0.482
0.476
0.467
0.452
0.436
0.435
0.406
0.358
0.315
0.291
0.226
0.025
0.202
0.068
–0.071
0.232
0.214
0.050
0.034
0.196
0.206
–0.093
0.397
0.177
0.172
0.183
0.141
0.131
–0.145
–0.144
–0.102
–0.257
–0.102
–0.198
–0.028
0.034
0.021
0.064
0.063
–0.052
0.020
–0.018
–0.185
–0.020
0.097
0.213
–0.056
0.137
–0.021
–0.132
0.036
0.058
–0.052
–0.001
0.016
–0.118
–0.075
0.072
0.000
0.058
0.100
0.064
0.065
0.232
0.255
–0.075
–0.607
–0.558
–0.529
–0.519
–0.516
0.510
–0.472
0.438
0.437
0.414
–0.412
0.397
0.309
0.210
–0.037
0.081
–0.032
–0.002
0.236
0.147
0.165
0.238
–0.078
–0.011
0.060
0.095
–0.015
–0.085
0.188
–0.197
0.186
–0.162
–0.043
–0.154
0.106
–0.116
0.200
0.238
0.037
0.081
0.057
0.186
0.034
0.075
–0.124
–0.040
0.034
–0.051
–0.013
0.190
0.057
–0.028
0.166
0.183
0.003
0.086
0.061
–0.014
0.160
0.012
–0.065
–0.051
0.031
0.066
0.190
0.039
0.010
0.150
0.102
0.565
–0.554
0.487
–0.101
0.077
0.092
–0.045
–0.014
–0.234
0.071
0.066
0.005
0.080
–0.083
0.038
–0.233
0.009
0.095
0.042
–0.007
0.007
0.000
0.267
–0.136
–0.202
–0.086
0.025
0.022
0.054
–0.009
–0.140
0.103
0.118
0.277
0.095
–0.077
0.003
0.017
–0.040
–0.001
0.208
0.068
–0.024
–0.052
0.022
–0.068
0.092
0.180
–0.093
–0.088
0.230
–0.056
0.217
–0.077
0.136
–0.049
0.062
0.197
0.453
0.452
0.389
0.401
0.365
0.330
0.240
0.235
0.227
0.217
0.206
0.204
0.255
0.190
0.231
0.160
0.169
0.200
0.134
0.251
0.168
0.144
0.075
0.429
0.401
0.313
0.305
0.287
0.245
0.240
0.284
0.221
0.273
0.173
0.167
0.186
0.192
0.104
0.382
0.357
0.298
0.312
0.326
0.345
0.260
0.225
0.264
0.303
0.202
0.369
0.155
0.115
0.372
0.339
0.294
EJPA 20 (2), © 2004 Hogrefe & Huber Publishers
M. Gomà-i-Freixanet et al.: Zuckerman-Kuhlman Personality Questionnaire in a Spanish Sample
it__21
it__91
it__62
it__89
it__97
it__70
it__27
it__47
it__3
it__31
it__42
it__8
it__57
it__67
it__11
it__36
it__44
it__33
it__74
it__38
it__83
it__5
it__94
it__29
it__1
it__59
it__54
it__18
it__13
it__16
it__88
it__19
it__49
it__6
% variance
Congruence
A priori
Scale
N-Anx
FI
ImpSS
FII
Sy
FIII
Agg-Host
FIV
Act
FV
h2
Agg-Host
Agg-Host
Agg-Host
ImpSS
Agg-Host
Imp
Sy
Agg-Host
Agg-Host
Agg-Host
Agg-Host
Agg-Host
Agg-Host
Agg-Host
Agg-Host
Agg-Host
Act
Act
Act
Act
Act
Act
Act
ImpSS
ImpSS
Act
Act
Act
Act
Agg-Host
Act
ImpSS
Act
ImpSS
–0.017
0.231
–0.090
0.072
–0.014
0.168
0.001
–0.157
0.135
–0.157
–0.078
0.103
0.091
0.095
0.042
0.153
–0.071
–0.070
0.053
0.016
0.020
0.002
–0.172
–0.021
–0.002
0.052
0.171
0.000
0.048
–0.040
0.068
–0.159
–0.028
–0.033
0.021
0.183
0.114
0.407
0.064
0.322
0.077
–0.043
0.109
0.082
0.050
–0.043
–0.017
0.101
0.173
–0.014
–0.098
0.138
0.253
0.067
0.219
0.100
0.235
–0.151
0.194
0.152
0.096
0.249
0.115
–0.090
0.007
0.188
0.006
–0.128
0.043
–0.014
0.177
0.227
0.075
0.217
0.288
–0.039
0.005
0.035
0.095
0.122
–0.192
0.040
0.150
–0.095
–0.140
0.202
0.090
–0.110
0.005
–0.089
0.037
–0.039
–0.002
0.309
–0.090
–0.269
–0.034
–0.237
0.082
0.061
0.108
0.068
–0.482
0.447
–0.416
0.409
0.391
0.355
0.352
0.347
0.346
–0.345
0.343
0.318
–0.310
0.286
0.269
0.257
–0.077
0.021
–0.061
0.008
–0.071
0.010
–0.105
0.031
0.088
–0.190
0.165
–0.204
0.202
–0.120
–0.106
–0.035
0.027
–0.152
–0.088
–0.024
0.014
0.087
–0.033
–0.110
0.144
0.194
0.119
0.067
0.224
–0.010
0.208
–0.107
–0.134
–0.113
–0.600
0.558
0.526
–0.516
0.495
0.455
0.408
0.408
–0.401
0.357
0.349
0.320
0.306
0.264
–0.258
–0.244
–0.233
0.191
0.243
0.287
0.226
0.397
0.163
0.317
0.234
0.186
0.164
0.156
0.186
0.129
0.185
0.114
0.145
0.111
0.401
0.377
0.356
0.283
0.299
0.225
0.264
0.192
0.206
0.284
0.196
0.279
0.151
0.150
0.089
0.125
0.067
0.082
5.58
0.90
5.37
0.84
4.68
0.92
4.41
0.85
4.35
0.91
139
Notes: N-Anx = Neuroticism-Anxiety, ImpSS = Impulsive Sensation Seeking, Sy = Sociability, Agg-Host = Aggression-Hostility, Act =
Activity, h2 = communality.
ized Varimax rotation. Figure 1 shows the plot of the first
40 eigenvalues in order to evaluate more precisely the
course of the eigenvalues.
Eigenvalues began to level off after five factors and
factors beyond the sixth showed little change. The first
seven eigenvalues were as follows: 6.98, 6.69, 4.24,
4.05, 3.13, 2.14, and 2.04. Therefore, the first five factors
of the total sample explained 25.09% of the variance.
Additionally, factor analyses were conducted separately
for males and females and five factors were extracted and
rotated. Factor loadings of each item in the rotated components retained are presented in Tables 4 and 5, as well
as item communalities and percentage of explained variance by each component. In the male sample (Table 4),
the first two factors were N-Anx and ImpSS, and accounted for 5.6% and 5.4% of the explained variance,
respectively. The next three factors were Sy, Agg-Host,
and Act, which accounted for 4.7%, 4.4%, and 4.4% of
the explained variance, respectively. In the female sample (Table 5), the first two factors were N-Anx and
ImpSS, which accounted for 6.4% and 5.9% of the explained variance, respectively. The next three factors
were Act, Sy, and Agg-Host, which accounted for 4.9%,
4.4%, and 3.8% of the explained variance, respectively.
Additionally, Tucker’s congruence coefficients between the American sample and the Catalan sample for
males and females were calculated. Two components are
identical if Tucker’s φ denotes 0.85 or higher (Haven &
ten Berge, 1977). This coefficient is taken as a good index of factor similarity, thus evidencing recoverableness
of the corresponding components. We found φ coefficients ranging from 0.84 to 0.96 (see Tables 4 and 5) and
generally being in the nineties, indicating excellent factor replicability. Thus, recoverability is demonstrated
EJPA 20 (2), © 2004 Hogrefe & Huber Publishers
140
M. Gomà-i-Freixanet et al.: Zuckerman-Kuhlman Personality Questionnaire in a Spanish Sample
Table 5. Result of the principal component analysis followed by a Varimax rotation of the five principal components from the ZKPQ scales
for the Catalan female sample, a priori factor assignment, item communalities, percentage of variance explained and congruence
coefficients with the USA sample.
it__61
it__30
it__90
it__25
it__80
it__15
it__7
it__51
it__35
it__96
it__71
it__46
it__85
it__66
it__76
it__41
it__99
it__20
it__50
it__56
it__2
it__36
it__39
it__84
it__14
it__65
it__24
it__55
it__89
it__1
it__34
it__29
it__95
it__6
it__70
it__75
it__79
it__48
it__28
it__19
it__60
it__45
it__92
it__53
it__27
it__83
it__33
it__44
it__94
it__74
it__38
it__59
it__5
it__54
it__13
A priori
Scale
N-Anx
FI
ImpSS
FII
Act
FIII
Sy
FIV
Agg-Host
FV
h2
N-Anx
N-Anx
N-Anx
N-Anx
N-Anx
N-Anx
N-Anx
N-Anx
N-Anx
N-Anx
N-Anx
N-Anx
N-Anx
N-Anx
N-Anx
N-Anx
Act
N-Anx
ImpSS
N-Anx
N-Anx
Agg-Host
ImpSS
ImpSS
ImpSS
ImpSS
ImpSS
ImpSS
ImpSS
ImpSS
ImpSS
ImpSS
ImpSS
ImpSS
ImpSS
ImpSS
ImpSS
Sy
Act
ImpSS
ImpSS
ImpSS
Sy
Sy
Sy
Act
Act
Act
Act
Act
Act
Act
Act
Act
Act
0.636
0.626
0.612
0.578
0.562
0.561
0.553
0.529
0.518
0.518
0.477
0.436
–0.433
0.427
0.425
0.384
0.384
0.381
0.327
0.316
–0.242
0.148
–0.044
0.038
0.102
–0.009
–0.052
0.062
0.051
0.014
–0.012
–0.026
0.085
–0.021
0.010
–0.024
0.026
–0.185
–0.234
–0.094
–0.043
–0.024
0.125
0.002
–0.110
0.072
–0.005
–0.004
–0.190
–0.038
0.022
–0.098
0.014
0.231
0.081
–0.076
0.192
0.161
0.221
0.128
0.210
–0.041
–0.024
–0.136
–0.101
–0.013
0.050
0.116
–0.011
–0.002
–0.119
0.169
–0.004
0.181
–0.003
0.085
0.014
0.681
0.557
0.538
0.522
0.519
0.510
0.491
0.476
0.474
–0.474
0.452
–0.430
0.428
0.414
0.384
0.361
0.340
0.333
0.304
0.284
0.254
0.244
0.237
0.070
0.055
0.032
0.045
0.079
0.138
0.151
–0.029
0.015
0.095
–0.134
0.041
–0.021
0.144
–0.018
0.101
–0.159
–0.110
–0.118
0.029
–0.108
–0.040
0.058
0.132
–0.022
–0.125
0.234
0.089
–0.092
0.105
–0.009
–0.060
0.087
0.075
–0.036
0.137
0.120
0.103
0.071
–0.225
0.003
0.208
0.039
0.060
–0.070
0.225
0.096
0.190
0.291
–0.184
0.196
0.235
0.023
0.056
0.203
0.655
0.644
–0.638
0.568
0.556
–0.516
0.492
0.465
0.368
0.365
0.008
–0.052
–0.205
–0.094
–0.080
–0.045
0.000
0.020
0.110
0.042
0.051
0.032
0.050
–0.040
–0.172
0.188
0.009
–0.061
–0.047
–0.010
–0.025
0.011
–0.041
0.025
0.087
–0.013
–0.047
–0.053
0.051
–0.026
–0.133
0.006
0.269
–0.010
0.172
–0.101
0.087
0.324
–0.051
–0.017
0.143
0.068
0.217
0.115
0.227
–0.040
0.102
–0.096
0.072
0.075
0.020
0.033
–0.016
–0.043
–0.021
–0.118
0.072
0.094
0.156
–0.045
0.054
–0.199
–0.193
0.057
–0.074
–0.075
0.133
–0.237
0.115
0.184
0.155
0.320
–0.014
0.159
0.073
–0.021
0.141
0.051
0.120
0.256
0.003
0.048
0.101
0.346
–0.037
–0.064
0.134
0.055
–0.036
0.134
–0.120
–0.034
–0.012
0.151
–0.039
0.024
0.048
–0.001
0.037
0.117
–0.004
–0.011
0.036
0.047
–0.044
0.118
–0.154
–0.013
0.072
0.056
0.442
0.438
0.452
0.437
0.341
0.375
0.372
0.330
0.316
0.286
0.248
0.213
0.263
0.215
0.245
0.237
0.333
0.157
0.176
0.117
0.067
0.046
0.478
0.332
0.374
0.291
0.291
0.287
0.371
0.280
0.247
0.286
0.289
0.190
0.236
0.247
0.166
0.306
0.280
0.155
0.154
0.144
0.128
0.077
0.175
0.440
0.428
0.419
0.368
0.325
0.300
0.299
0.218
0.196
0.152
EJPA 20 (2), © 2004 Hogrefe & Huber Publishers
M. Gomà-i-Freixanet et al.: Zuckerman-Kuhlman Personality Questionnaire in a Spanish Sample
it__18
it__23
it__64
it__88
it__58
it__87
it__22
it__12
it__63
it__68
it__17
it__43
it__78
it__37
it__9
it__82
it__49
it__98
it__97
it__67
it__77
it__72
it__91
it__86
it__42
it__21
it__8
it__57
it__62
it__11
it__31
it__47
it__16
it__3
% variance
Congruence
A priori
Scale
N-Anx
FI
ImpSS
FII
Act
FIII
Sy
FIV
Agg-Host
FV
h2
Act
Act
Act
Act
Sy
Sy
Sy
Sy
Sy
Sy
Sy
Sy
Sy
Sy
Sy
Sy
Act
Sy
Agg-Host
Agg-Host
Agg-Host
Agg-Host
Agg-Host
Agg-Host
Agg-Host
Agg-Host
Agg-Host
Agg-Host
Agg-Host
Agg-Host
Agg-Host
Agg-Host
Agg-Host
Agg-Host
–0.101
0.282
0.053
0.066
–0.036
0.119
–0.017
0.019
–0.026
0.114
–0.048
0.215
–0.163
–0.060
–0.167
0.217
0.038
0.023
–0.029
0.019
–0.063
–0.013
0.187
–0.020
–0.293
–0.054
0.162
–0.020
–0.002
0.061
–0.139
–0.201
–0.051
0.004
0.100
0.028
0.149
–0.031
0.033
–0.072
0.083
–0.012
0.259
0.061
0.279
–0.141
0.174
–0.162
0.215
0.046
0.074
0.182
–0.023
0.092
0.220
0.120
0.080
0.042
0.073
–0.014
0.149
–0.127
0.128
0.000
0.100
0.043
–0.040
–0.049
0.321
–0.289
0.220
–0.183
0.004
0.050
–0.096
0.114
0.006
0.056
0.005
–0.019
0.279
–0.149
0.298
0.010
–0.194
0.131
–0.003
0.068
0.040
0.199
0.161
0.036
0.126
0.045
0.049
0.155
0.068
–0.226
0.029
0.089
–0.012
–0.012
–0.272
–0.099
–0.080
0.104
0.662
–0.633
0.600
–0.560
–0.545
–0.531
–0.523
–0.467
0.402
–0.389
0.302
0.279
0.198
0.184
0.111
–0.055
0.094
–0.070
–0.010
0.002
0.068
0.149
0.043
–0.029
0.087
0.101
–0.038
0.180
–0.085
–0.079
0.029
–0.176
0.019
–0.076
–0.014
0.040
0.058
0.005
–0.103
–0.031
–0.102
0.056
–0.040
0.009
0.112
0.068
–0.046
–0.044
0.535
0.535
0.520
0.519
0.451
–0.442
0.430
–0.418
0.391
–0.361
–0.315
0.276
–0.273
0.220
–0.181
0.094
0.198
0.204
0.080
0.055
0.441
0.424
0.380
0.327
0.375
0.303
0.364
0.287
0.298
0.203
0.266
0.132
0.086
0.087
0.300
0.303
0.333
0.329
0.271
0.199
0.297
0.202
0.205
0.172
0.128
0.141
0.106
0.131
0.044
0.018
6.44
0.96
5.93
0.94
4.90
0.93
4.44
0.93
3.82
0.88
141
Notes: N-Anx = Neuroticism-Anxiety, ImpSS = Impulsive Sensation Seeking, Act = Activity, Sy = Sociability, Agg-Host = Aggression-Hostility, h2 = communality.
throughout the four groups of subjects with only one exception, Catalan males compared with USA males for the
ImpSS scale. However, the coefficient obtained is extremely close to Haven & ten Berge’s criterion (0.844).
Therefore, the results obtained in this study clearly indicate the strong congruence with the original American
factor structure in the Catalan sample.
Table 6 shows the factorial solution for the total sample. The first two factors were N and ImpSS, and the next
three factors were Act, Sy, and Agg-Host. Of the items
with loadings equal or higher than .30, two items (48 and
28) loaded highest on a different component having the
second highest loading on the target component (the
magnitude of these loadings being practically equal) and
only 1 item failed to load on the target component (Item
99 “other people often urge me to take it easy”), which
had a primary loading on N-Anx instead of Act. This item
was originally assigned to the Activity scale, but its content could also be easily understood in the sense of worrisomeness and anxious tension.
In order to replicate the original five-component structure of the AFFM within the present study, Tucker’s congruence coefficients between Catalan males and females
were calculated. The obtained coefficients were N-Anx
= .95, Act = .91, Sy = .91, ImpSS = .90, and Agg-Host =
.85. Thus, the criterion was met for all of the five scales
for the Catalan males and females. If we adhere to Haven
and ten Berge’s (1977) demonstration, the obtained results show the replicability of the original five-component structure of the AFFM, both within the present study
for males and females, as well as between the present
study and the original one.
EJPA 20 (2), © 2004 Hogrefe & Huber Publishers
142
M. Gomà-i-Freixanet et al.: Zuckerman-Kuhlman Personality Questionnaire in a Spanish Sample
Table 6. Result of the principal component analysis followed by a Varimax rotation of the five principal components from the ZKPQ scales
for the total Catalan sample, a priori factor assignment, item communalities, and percentage of variance explained.
it__61
it__25
it__30
it__80
it__90
it__15
it__35
it__7
it__41
it__51
it__46
it__85
it__71
it__76
it__96
it__66
it__20
it__99
it__56
it__82
it__2
it__50
it__39
it__55
it__14
it__24
it__65
it__84
it__89
it__95
it__34
it__1
it__70
it__29
it__79
it__75
it__48
it__6
it__28
it__60
it__45
it__19
it__53
it__92
it__98
it__33
it__83
it__44
it__74
it__94
it__38
it__5
it__59
it__54
it__18
it__13
A priori
Scale
N-Anx
FI
ImpSS
FII
Act
FIII
Sy
FIV
Agg-Host
FV
h2
N-Anx
N-Anx
N-Anx
N-Anx
N-Anx
N-Anx
N-Anx
N-Anx
N-Anx
N-Anx
N-Anx
N-Anx
N-Anx
N-Anx
N-Anx
N-Anx
N-Anx
Act
N-Anx
Sy
N-Anx
ImpSS
ImpSS
ImpSS
ImpSS
ImpSS
ImpSS
ImpSS
ImpSS
ImpSS
ImpSS
ImpSS
ImpSS
ImpSS
ImpSS
ImpSS
Sy
Sy
Act
Act
Act
Act
Sy
Sy
Sy
Act
Act
Act
Act
Act
Act
Act
Act
Act
Act
Act
0.654
0.615
0.612
0.585
0.585
0.552
0.541
0.537
0.469
0.465
0.460
–0.455
0.452
0.446
0.440
0.432
0.428
0.411
0.395
0.298
–0.295
0.290
–0.071
0.048
0.094
–0.020
0.032
0.066
0.072
0.053
–0.000
–0.087
0.048
0.065
–0.028
0.013
–0.123
–0.019
–0.154
–0.004
0.028
–0.169
0.012
0.083
0.003
0.016
0.119
–0.026
0.014
–0.145
0.047
–0.009
–0.106
0.218
–0.089
0.057
–0.060
0.184
0.189
0.070
0.146
0.219
–0.104
–0.027
–0.171
0.032
0.016
0.127
–0.041
–0.016
–0.079
0.009
–0.011
0.144
–0.012
0.073
0.138
0.176
0.663
0.535
0.524
0.522
0.506
0.504
0.455
0.440
0.439
0.436
0.429
–0.416
0.413
0.408
0.360
–0.349
0.339
0.323
0.317
0.310
0.286
0.263
0.223
0.062
0.076
–0.019
0.118
0.071
0.092
0.019
0.179
0.040
0.122
0.114
–0.127
0.113
0.034
0.015
–0.050
0.049
–0.030
–0.194
–0.036
–0.167
–0.017
0.019
–0.121
–0.025
–0.020
0.127
0.075
0.255
0.109
0.032
–0.059
–0.129
0.098
0.096
–0.045
0.113
0.158
0.058
0.096
0.003
0.008
–0.308
–0.082
0.305
0.060
0.225
0.230
0.117
0.334
0.190
0.237
–0.210
0.038
–0.023
0.105
0.619
0.619
–0.613
0.558
0.536
–0.490
0.449
0.426
0.348
0.337
0.329
0.052
0.110
0.088
0.022
0.243
0.085
–0.107
0.072
–0.194
0.004
–0.014
0.026
–0.051
0.113
–0.044
0.078
0.010
–0.071
–0.026
–0.265
0.052
0.067
0.025
0.081
–0.055
0.032
–0.002
–0.020
–0.110
–0.219
0.107
0.084
–0.165
–0.057
–0.040
0.084
–0.354
–0.033
0.030
–0.113
–0.079
0.032
–0.141
–0.234
–0.145
–0.153
–0.009
0.094
–0.082
–0.088
–0.004
0.076
–0.082
0.070
0.286
0.054
–0.080
0.168
0.076
–0.042
0.097
0.096
0.055
–0.165
0.093
–0.206
0.151
–0.173
–0.091
0.154
–0.126
–0.009
0.079
0.256
0.036
0.089
0.017
0.177
0.047
0.137
0.219
0.059
0.012
0.060
0.366
0.082
–0.084
–0.006
0.210
0.102
–0.017
–0.100
–0.013
–0.061
0.092
0.014
0.040
–0.030
0.086
0.025
0.006
–0.005
–0.030
0.003
–0.052
–0.006
0.089
–0.015
–0.164
0.101
–0.055
0.103
0.457
0.465
0.425
0.350
0.434
0.371
0.319
0.359
0.297
0.287
0.235
0.254
0.232
0.236
0.218
0.209
0.196
0.326
0.170
0.173
0.113
0.168
0.457
0.323
0.337
0.290
0.282
0.266
0.368
0.251
0.211
0.300
0.264
0.284
0.177
0.235
0.323
0.141
0.259
0.153
0.165
0.171
0.111
0.132
0.082
0.411
0.403
0.386
0.335
0.321
0.259
0.208
0.258
0.185
0.221
0.138
EJPA 20 (2), © 2004 Hogrefe & Huber Publishers
M. Gomà-i-Freixanet et al.: Zuckerman-Kuhlman Personality Questionnaire in a Spanish Sample
it__23
it__49
it__64
it__88
it__87
it__58
it__68
it__17
it__63
it__22
it__12
it__43
it__78
it__37
it__9
it__27
it__77
it__72
it__97
it__86
it__67
it__91
it__21
it__42
it__8
it__62
it__57
it__47
it__31
it__11
it__3
it__36
it__16
% variance
A priori
Scale
N-Anx
FI
ImpSS
FII
Act
FIII
Sy
FIV
Agg-Host
FV
Act
Act
Act
Act
Sy
Sy
Sy
Sy
Sy
Sy
Sy
Sy
Sy
Sy
Sy
Sy
Agg-Host
Agg-Host
Agg-Host
Agg-Host
Agg-Host
Agg-Host
Agg-Host
Agg-Host
Agg-Host
Agg-Host
Agg-Host
Agg-Host
Agg-Host
Agg-Host
Agg-Host
Agg-Host
Agg-Host
0.246
–0.039
0.069
0.088
0.031
–0.060
0.058
–0.084
–0.056
–0.038
–0.037
0.135
–0.163
–0.080
–0.130
–0.082
–0.069
0.065
0.029
–0.028
0.008
0.157
–0.017
–0.221
0.183
–0.080
0.026
–0.116
–0.193
0.060
0.004
0.116
0.007
0.047
0.093
0.160
–0.025
–0.040
0.061
0.064
0.248
0.236
0.131
–0.003
–0.104
0.202
–0.166
0.235
0.210
0.206
0.071
–0.020
0.060
0.116
0.157
–0.028
0.060
0.079
0.145
–0.101
–0.033
0.106
0.057
0.052
0.028
–0.113
–0.288
–0.232
0.226
–0.195
0.040
–0.041
0.007
–0.009
–0.013
–0.081
0.136
–0.024
0.222
–0.102
0.272
0.166
0.020
0.231
0.016
0.062
0.004
0.077
0.015
0.168
0.026
0.037
0.175
0.144
0.031
–0.175
0.033
–0.107
0.103
0.147
0.129
0.075
–0.108
0.649
–0.579
0.554
0.553
0.550
–0.549
0.543
0.504
–0.436
0.376
–0.324
–0.229
–0.051
0.014
–0.133
–0.032
0.046
0.063
–0.137
–0.085
–0.098
–0.083
0.088
–0.142
0.041
–0.120
0.090
0.055
0.106
–0.107
–0.019
0.004
–0.082
0.069
–0.010
–0.019
–0.038
–0.044
0.050
–0.020
0.087
–0.054
0.024
0.133
0.200
0.542
0.516
0.495
–0.488
0.442
0.441
–0.428
0.411
0.358
–0.352
–0.352
0.296
–0.293
0.292
0.223
0.193
0.143
6.46
5.66
4.73
4.47
3.77
143
h2
0.179
0.081
0.087
0.065
0.430
0.344
0.315
0.376
0.364
0.329
0.315
0.291
0.310
0.186
0.268
0.171
0.344
0.329
0.264
0.247
0.211
0.253
0.203
0.256
0.178
0.160
0.173
0.143
0.137
0.137
0.061
0.066
0.055
Notes: N-Anx = Neuroticism-Anxiety, ImpSS = Impulsive Sensation Seeking, Act = Activity, Sy = Sociability, Agg-Host = Aggression-Hostility, h2 = communality.
Figure 1. Scree plot of the first 40 eigenvalues
for the factor analysis of the ZKPQ.
EJPA 20 (2), © 2004 Hogrefe & Huber Publishers
144
M. Gomà-i-Freixanet et al.: Zuckerman-Kuhlman Personality Questionnaire in a Spanish Sample
Discussion
This study investigated the psychometric properties of
the Catalan adaptation of the ZKPQ. The magnitude of
the α coefficients in the Catalan ZKPQ scales was practically equal to the coefficient estimates for the original
USA sample, except for the Agg-Host scale, which appeared to be somewhat less internally consistent. In our
sample the N-Anx scale was the most reliable, and the
Agg-Host scale was the least reliable. The same general
trend for the α reliabilities was found in other translations of the ZKPQ questionnaire to different languages:
Italian (V. De Pascalis, personal communication, July,
2000), German (Ostendorf & Angleitner, 1994), Chinese
(Wu, Wang, Du, Li, Jiang, & Wang, 2000), Japanese
(D. M. Kuhlman, personal communication, July 2002),
and in two different Castilian versions (Peñate, Ibáñez,
& González, 1999; Gutiérrez-Zotes, Ramos, & Saiz,
2001), i.e., N-Anx being the highest and Agg-Host the
lowest. All these studies, along with ours, conducted in
six different languages, provide support for cross-language convergence of the ZKPQ at the scale level. Nevertheless, the fact that the Agg-Host scale has the lowest
internal consistency in all of these studies – with different samples, languages, and cultures – may indicate either a translation or a cultural problem.
The means of the scales of the Catalan version of the
ZKPQ were very similar to those of the American version (Zuckerman et al., 1993) and they follow the general
trend found in the gender difference literature, i.e., women score significantly higher on N-Anx and Sy, and men
on ImpSS. However, unlike the results of the original
study, there were no significant gender differences on
Act and on Agg-Host scales. Women were significantly
higher than men on N-Anx in every national sample tested and women also scored significantly higher on Sy in
the German and Japanese sample. Other gender differences found in the American sample such as men being
higher on Act and Agg-Host were not found in other
groups and in the German sample the university women
were actually higher than men on Agg-Host (F. Ostendorf, personal communication, January, 2002). Perhaps
the lack of gender differences in some of the scales in
European countries may have to do with the type of
women who elect to take higher education studies.
The ZKPQ also has good discriminant validity shown
by the low intercorrelations among scales, thus empirically replicating the relative independence of scales derived from factor analysis. An interesting correlational
pattern was found for the Infrequency scale. If this scale
had to be considered as measuring social desirability, as
the Lie scale of the EPQ does, the pattern of correlations
should be totally different, showing high and positive
EJPA 20 (2), © 2004 Hogrefe & Huber Publishers
correlations with the more desirable traits (i.e., Act and
Sy) and high but negative with the less desirable traits
(i.e., N-Anx, ImpSS and Agg-Host). However, this pattern was not found, therefore, the Infrequency scale of
the ZKPQ seems to detect careless responding or inattention to the task, rather than social desirability.
The results of the Principal Component analysis, using orthogonal Varimax rotation, demonstrated the replicability of the original five-component structure of the
AFFM of personality in the Catalan language. For comparative purposes we performed two principal component analyses, one with the whole sample and another
using the cut-off point of 3 in the Infrequency scale, as
in the American sample, and the loadings of the items on
the factors were very similar. Unlike the American study,
which did not include data from the subjects exceeding
the validity scale cut-off, in the Catalan study we did, but
since the results were practically the same, we can conclude that the inclusion of subjects with high scores on
the Infrequency scale apparently does not interfere much
with the replicability of the AFFM. The percentage of
explained variance of the present translation is not different from the ones found in other translations, which
range from 20.75% (Wu et al., 2000) to 28% (in the Japanese sample).
Additionally, Tucker’s coefficients of congruence
with the original sample, as well as within the Catalan
sample were calculated. Haven and ten Berge (1977)
have demonstrated that when Tucker’s coefficients of
congruence “are as high as .85, then the interpretations
of the corresponding components are judged equal by
factor analysis experts. Therefore, one may adopt congruence of .85 or higher as evidence of recoverableness.”
All the coefficients were equal or higher than .85, except
for the ImpSS scale when comparing USA males with
Catalan males. If we adhere to Haven and ten Berge’s
demonstration, the congruence coefficients obtained in
the Catalan adaptation of the ZKPQ are in favor of the
replicability of the original five-component structure of
the AFFM both within the Catalan males and females as
well as between the Catalan sample and the original USA
sample.
All in all, the results obtained from the Catalan adaptation of the Zuckerman-Kuhlman Personality Questionnaire showed good internal consistency of its scales, gender differences in the expected directions, independence
among the scales derived from factor analysis and recoverableness of the original five-component structure. This
questionnaire has proved useful as a personality tool to
determine the characteristics of drug abusers (Ball,
1995) and other related psychopathologies (Thornquist
& Zuckerman, 1995). As such, the ZKPQ has not only
theoretical value but also applied value and research purposes as well.
M. Gomà-i-Freixanet et al.: Zuckerman-Kuhlman Personality Questionnaire in a Spanish Sample
Author’s Notes
This research was supported by the Autonomous University of Barcelona (Spain) with grant EMER99–18. We
especially thank D. Michael Kuhlman (University of
Delaware), Jos M. F. ten Berge (University of Groningen), and Eduardo Doval (Autonomous University of
Barcelona). Comments by the anonymous referees are
gratefully acknowledged.
A copy of the Catalan ZKPQ questionnaire can be
requested from the first author.
References
Ball, S.A. (1995). The validity of an alternative five factor measure of personality in cocaine abusers. Psychological Assessment, 7, 148–154.
Block, J. (1995). A contrarian view of the five-factor approach to
personality description. Psychological Bulletin, 117, 187–215.
Buss, A.H., & Plomin, R. (1984). Temperament: Early developing
personality traits. Hillsdale, NJ: Erlbaum.
Cattell, R.B., Eber, H.W., & Tatsuoka, M.M. (1970). The handbook for the Sixteen Personality Factor Questionnaire. Champaign, IL: Institute for Personality and Ability Testing.
Costa, P.T., Jr., & McCrae, R.R. (1985). The NEO Personality
Inventory. Odessa, FL: Psychological Assessment Resources.
Costa, P.T., Jr., & McCrae, R.R. (1992). Revised NEO Personality
Inventory (NEO-PI-R) and NEO Five-Factor Inventory (NEOFFI) professional manual. Odessa, FL: Psychological Assessment Resources.
Digman, J.M. (1990). Personality structure: Emergence of the
five-factor model. Annual Review of Psychology, 41, 417–440.
Eysenck, H.J. (1967). The biological basis of personality. Springfield, IL: CC Thomas.
Eysenck, H.J. (1992a). Four ways five factors are not basic. Personality and Individual Differences, 13, 667–673.
Eysenck, H.J. (1992b). A reply to Costa and McCrae. P or A and
C – The role of theory. Personality and Individual Differences,
13, 867–868.
Eysenck, S.B.G., García Sevilla, L., Torrubia, R., Avila, C., &
Ortet, G. (1992). Versió catalana de l’EPQ per a adults: un
instrument per a la mesura de la personalitat [Catalan version
of the EPQ for adults: A tool for personality measurement].
Annals de Medicina, 78, 223–230.
Fiske, D.W. (1949). Consistency of the factorial structures of personality ratings from different sources. Journal of Abnormal
and Social Psychology, 44, 329–344.
Flaherty, J.A., Gaviria, F.M., Pathak, D., Mitchell, T., Wintrob, R.,
Richman, J.A., & Birz, S. (1988). Developing instruments for
cross-cultural psychiatry research. Journal of Nervous and
Mental Disease, 176, 257–263.
Goldberg, L.R. (1981). Language and individual differences: The
search for universals in personality lexicons. In L. Wheeler
(Ed.), Review of personality and social psychology
(pp. 141–165). Beverly Hills, CA: Sage.
Goldberg, L.R. (1992). The development of markers for the bigfive factor structure. Psychological Assessment, 4, 26–42.
Gomà-i-Freixanet, M. (1995). Prosocial and antisocial aspects of
145
personality. Personality and Individual Differences, 19,
125–134.
Gomà-i-Freixanet, M. (1997). Consensual validity of the EPQ:
Self-report and spouse-reports. European Journal of Psychological Assessment, 13, 179–185.
Gomà-i-Freixanet, M. (2001). Prosocial and antisocial aspects of
personality in women: A replication study. Personality and Individual Differences, 30, 1401–1411.
Gomà-i-Freixanet, M., & Wismeijer, A.A. (2002). Applying personality theory to a group of police bodyguards: A physically
risky prosocial prototype? Psicothema, 14, 387–392.
Gray, J.A. (1982). The neuropsychology of anxiety: An enquiry
into the functions of the septo-hippocampal system. New York:
Oxford University Press.
Guilford, J.P. (1975). Factors and factors of personality. Psychological Bulletin, 82, 802–814.
Gutiérrez-Zotes, J.A., Ramos, J.A., & Saiz, J. (2001). Desarrollo
de la versión española del cuestionario de personalidad Zuckerman-Kuhlman (ZKPQ-III) y propiedades psicométricas [Development of the Spanish version of the ZKPQ questionnaire
and psychometric properties]. Psiquis, 22, 239–250.
Haven, S., & ten Berge, J.M.F. (1977). Tucker’s coefficient of congruence as a measure of factorial invariance: An empirical
study. Unpublished manuscript, University of Groningen, The
Netherlands (cited in J.M.F. ten Berge, 1986).
McCrae, R.R., & Costa, P.T., Jr. (1997). Personality trait structure
as a human universal. American Psychologist, 52, 509–516.
McCrae, R.R., & John, O.P. (1992). An introduction to the fivefactor model and its applications. Journal of Personality, 60,
175–215.
Messick, S. (1989). Validity. In R.L. Lynn (Ed.), Educational measurement (3rd ed., pp. 13–103). New York: Macmillan.
Norman, W.T. (1963). Toward an adequate taxonomy of personality attributes: Replicated factor structure in peer nomination
personality ratings. Journal of Abnormal and Social Psychology, 66, 574–583.
Ostendorf, F., & Angleitner, A. (1994). A comparison of different
instruments proposed to measure the Big Five. European Review of Applied Psychology, 44, 45–53.
Peñate,W., Ibáñez, I., & González, M. (1999). La cuantía y naturaleza de las dimensiones básicas de personalidad: una aproximación empírica [The quantity and nature of basic personality
dimensions: An empirical approach]. Análisis y Modificación
de Conducta, 25, 103–130.
Tellegen, A. (1985). Structures of mood and personality and their
relevance to assessing anxiety with an emphasis on self-report.
In A. H. Tuma & J. D. Maser (Eds.), Anxiety and the anxiety
disorders (pp. 681–706). Hillsdale, NJ: Erlbaum.
ten Berge, J.M.F. (1986). Rotation to perfect congruence and the
cross-validation of component weights across populations.
Multivariate Behavioral Research, 21, 41–64.
Thomas, A., & Chess, S. (1977). Temperament and development.
New York: Brunner/Mazel.
Thornquist, M.H., & Zuckerman, M. (1995). Psychopathy, passive-avoidance learning, and basic dimensions of personality.
Personality and Individual Differences, 19, 525–534.
Tucker, L.R. (1951). A method for synthesis of factor analysis
studies (Personnel Research Section Report No. 984). Washington, DC: Dept of the Army (cited in J.M.F. ten Berge, 1986).
Tupes, E.C., & Christal, R.E. (1961). Recurrent personality factors based on trait ratings. U. S. Air Force, ASD Technical
Reports (No. 61–79).
Wu, Y., Wang, W., Du, W., Li, J., Jiang, X., & Wang, Y. (2000).
Development of a Chinese version of the Zuckerman-Kuhlman
EJPA 20 (2), © 2004 Hogrefe & Huber Publishers
146
M. Gomà-i-Freixanet et al.: Zuckerman-Kuhlman Personality Questionnaire in a Spanish Sample
personality questionnaire: Reliabilities and gender/age effects.
Social Behavior and Personality, 28, 241–250.
Zuckerman, M. (1983). Biological bases of sensation seeking, impulsivity, and anxiety. Hillsdale, NJ: Erlbaum.
Zuckerman, M. (1984). Sensation seeking: A comparative approach to a human trait. Behavioral and Brain Sciences, 7,
413–417.
Zuckerman, M. (1991). Psychobiology of personality. New York:
Cambridge University Press.
Zuckerman, M. (1992). What is a basic factor and which factors
are basic? Turtles all the way down. Personality and Individual
Differences, 13, 675–681.
Zuckerman, M. (1994). Behavioral expressions and biosocial bases of sensation seeking. New York: Cambridge University
Press.
Zuckerman, M., & Kuhlman, D.M. (2000). Personality and risktaking: Common biosocial factors. Journal of Personality, 68,
999–1029.
Zuckerman, M., Kuhlman, D.M., & Camac, C. (1988). What lies
beyond E and N? Factor analyses of scales believed to measure
basic dimensions of personality. Journal of Personality and
Social Psychology, 54, 96–107.
Zuckerman, M., Kuhlman, D.M., Joireman, J., Teta, P., & Kraft,
EJPA 20 (2), © 2004 Hogrefe & Huber Publishers
M. (1993). A comparison of three structural models for personality: the big three, the big five, and the alternative five. Journal
of Personality and Social Psychology, 65, 757–768.
Zuckerman, M., Kuhlman, D.M., Thornquist, M., & Kiers, H.
(1991). Five (or three): Robust questionnaire scale factors of
personality without culture. Personality and Individual Differences, 12, 929–941.
Montserrat Gomà-i-Freixanet, PhD.
Department of Health Psychology
Autonomous University of Barcelona
Edifici B,
E-08193 Bellaterra
Catalonia, Spain
Tel. +34 93 581-3854
Fax +34 93 581-2125
E-mail [email protected]


© Copyright 2026