
R , e , L
Race, ethnicity,
and
Language data
Standardization for Health
Care Quality Improvement
Subcommittee on Standardized Collection of Race/Ethnicity Data for Healthcare Quality Improvement
Board on Health Care Services
Cheryl Ulmer, Bernadette McFadden, and David R. Nerenz, Editors
THE NATIONAL ACADEMIES PRESS
500 Fifth Street, N.W.
Washington, DC 20001
NOTICE: The project that is the subject of this report was approved by the Governing Board of the National Research Council,
whose members are drawn from the councils of the National Academy of Sciences, the National Academy of Engineering, and
the Institute of Medicine. The members of the committee responsible for the report were chosen for their special competences
and with regard for appropriate balance.
This study was supported by Task No. #HHSP233200800005T between the National Academy of Sciences and the Agency
for Healthcare Research and Quality. Any opinions, findings, conclusions, or recommendations expressed in this publication
are those of the author(s) and do not necessarily reflect the view of the organizations or agencies that provided support for
this project.
International Standard Book Number-13: 978-0-309-14012-6
International Standard Book Number-10: 0-309-14012-9
Additional copies of this report are available from the National Academies Press, 500 Fifth Street, N.W., Lockbox 285, Washington, DC 20055; (800) 624-6242 or (202) 334-3313 (in the Washington metropolitan area); Internet, http://www.nap.edu.
For more information about the Institute of Medicine, visit the IOM home page at: www.iom.edu.
Copyright 2009 by the National Academy of Sciences. All rights reserved.
Printed in the United States of America
The serpent has been a symbol of long life, healing, and knowledge among almost all cultures and religions since the beginning
of recorded history. The serpent adopted as a logotype by the Institute of Medicine is a relief carving from ancient Greece, now
held by the Staatliche Museen in Berlin.
Suggested citation: IOM (Institute of Medicine). 2009. Race, Ethnicity, and Language Data: Standardization for Health Care
Quality Improvement. Washington, DC: The National Academies Press.
“Knowing is not enough; we must apply.
Willing is not enough; we must do.”
—Goethe
Advising the Nation. Improving Health.
The National Academy of Sciences is a private, nonprofit, self-perpetuating society of distinguished scholars engaged in
scientific and engineering research, dedicated to the furtherance of science and technology and to their use for the general
welfare. Upon the authority of the charter granted to it by the Congress in 1863, the Academy has a mandate that requires it to
advise the federal government on scientific and technical matters. Dr. Ralph J. Cicerone is president of the National Academy
of Sciences.
The National Academy of Engineering was established in 1964, under the charter of the National Academy of Sciences, as a
parallel organization of outstanding engineers. It is autonomous in its administration and in the selection of its members, sharing with the National Academy of Sciences the responsibility for advising the federal government. The National Academy of
Engineering also sponsors engineering programs aimed at meeting national needs, encourages education and research, and recognizes the superior achievements of engineers. Dr. Charles M. Vest is president of the National Academy of Engineering.
The Institute of Medicine was established in 1970 by the National Academy of Sciences to secure the services of eminent
members of appropriate professions in the examination of policy matters pertaining to the health of the public. The Institute acts
under the responsibility given to the National Academy of Sciences by its congressional charter to be an adviser to the federal
government and, upon its own initiative, to identify issues of medical care, research, and education. Dr. Harvey V. Fineberg
is president of the Institute of Medicine.
The National Research Council was organized by the National Academy of Sciences in 1916 to associate the broad community of science and technology with the Academy’s purposes of furthering knowledge and advising the federal government.
Functioning in accordance with general policies determined by the Academy, the Council has become the principal operating
agency of both the National Academy of Sciences and the National Academy of Engineering in providing services to the government, the public, and the scientific and engineering communities. The Council is administered jointly by both Academies
and the Institute of Medicine. Dr. Ralph J. Cicerone and Dr. Charles M. Vest are chair and vice chair, respectively, of the
National Research Council.
www.national-academies.org
SUBCOMMITTEE ON STANDARDIZED COLLECTION OF
RACE/ETHNICITY DATA FOR HEALTHCARE QUALITY IMPROVEMENT
DAVID R. NERENZ (Chair), Director, Center for Health Services Research, Henry Ford Health
System, Detroit, MI
MARGARITA ALEGRÍA, Professor, Department of Psychiatry, Harvard Medical School, and
Director, Center for Multicultural Mental Health Research, Cambridge Health Alliance,
Boston, MA
JOHN Z. AYANIAN, Professor of Medicine and Health Care Policy, Harvard Medical School and
Brigham and Women’s Hospital, Boston, MA
IGNATIUS BAU, Program Director, The California Endowment, Oakland, CA
RODERICK J. HARRISON, Senior Research Scientist, Office of the Vice President for Research
and Compliance, Howard University, Washington, DC
ROMANA HASNAIN-WYNIA, Director, Center for Healthcare Equity and Associate Professor,
Research, Feinberg School of Medicine, Northwestern University, Chicago, IL
NINEZ PONCE, Associate Professor, Department of Health Services, UCLA School of Public
Health, Los Angeles, CA
WAYNE S. RAWLINS, National Medical Director, Aetna Government Health Plans, Aetna,
Hartford, CT
PAUL M. SCHYVE, Senior Vice President, The Joint Commission, Oakbrook Terrace, IL
ALAN M. ZASLAVSKY, Professor of Health Care Policy (Statistics), Harvard Medical School,
Boston, MA
Study Staff
Cheryl Ulmer, Study Director
Bernadette McFadden, Research Associate
Michelle Bruno, Research Associate
Adam Schickedanz, Mirzayan Science and Technology Fellow1
Cassandra Cacace, Senior Program Assistant
Roger Herdman, Board Director, Board on Health Care Services
1
Served through May 2009.
v
Reviewers
This report has been reviewed in draft form by individuals chosen for their diverse perspectives and technical
expertise, in accordance with procedures approved by the National Research Council’s Report Review Committee.
The purpose of this independent review is to provide candid and critical comments that will assist the institution
in making its published report as sound as possible and to ensure that the report meets institutional standards for
objectivity, evidence, and responsiveness to the study charge. The review comments and draft manuscript remain
confidential to protect the integrity of the deliberative process. We wish to thank the following individuals for
their review of this report:
OLIVIA CARTER-POKRAS, Department of Epidemiology and Biostatistics, College of Health and
Human Performance, University of Maryland, College Park, MD
SIMON P. COHN, Kaiser Permanente Medical Care Program, Oakland, CA
HAROLD P. FREEMAN, National Cancer Institute, Rockville, MD and Columbia University,
New York, NY
DEEANA L. JANG, Asian & Pacific Islander American Health Forum, Washington, DC
JENNIE R. JOE, Native American Research and Training Center, University of Arizona, Tucson, AZ
ERIC B. LARSON, Center for Health Studies, Group Health Cooperative of Puget Sound, University of
Washington, Seattle, WA
DENISE LOVE, National Association of Health Data Organizations, Salt Lake City, UT
JOHN LUMPKIN, Health Care Group, Robert Wood Johnson Foundation, Princeton, NJ
MARY A. PITTMAN, Public Health Institute, Oakland, CA
KENNETH PREWITT, School of International and Public Affairs, Columbia University, New York, NY
Although the reviewers listed above have provided many constructive comments and suggestions, they were
not asked to endorse the conclusions or recommendations nor did they see the final draft of the report before
its release. The review of this report was overseen by Faith Mitchell, Grantmakers In Health, and Edward B.
Perrin, University of Washington. Appointed by the National Research Council and Institute of Medicine, they
were responsible for making certain that an independent examination of this report was carried out in accordance
with institutional procedures and that all review comments were carefully considered. Responsibility for the final
content of this report rests entirely with the authoring committee and the institution.
vii
Foreword
The Institute of Medicine report Unequal Treatment: Confronting Racial and Ethnic Disparities in Healthcare
(2002) called attention to poorer access to health care and worse health outcomes among certain racial and ethnic
groups. According to reports from the Agency for Healthcare Research and Quality and others, disparities in the
quality of care and in health outcomes persist. Accelerating progress toward eliminating these disparities depends
in part on our ability to identify and track experiences in health care among individuals from a variety of racial
and ethnic backgrounds and who speak a variety of languages other than English.
This report offers an approach to identifying racial, ethnic, and language categories that bear on disparities
in health care and health outcomes. Extending beyond the broad racial and ethnic categories used by the Office
of Management and Budget, this report provides a more granular classification of ethnicity and language needs.
This standardized approach to classification will both help measure progress in eliminating disparities and assure
that comparisons across different settings are based on similar groupings of individuals.
I want to express my appreciation to the subcommittee and staff for the tremendous effort that has gone into
this report. Their work represents another positive step toward the goal of high quality health care for everyone.
Harvey V. Fineberg, M.D., Ph.D.
President, Institute of Medicine
August 2009
ix
Preface
Calling attention to the need for improvement in quality of care has been a central theme for many Institute of
Medicine (IOM) reports. Crossing the Quality Chasm: A New Health System for the 21st Century noted significant
shortcomings in the nation’s health care delivery system in terms of safety, effectiveness, timeliness, efficiency,
patient-centeredness, and equity, while Unequal Treatment: Confronting Racial and Ethnic Disparities in Healthcare documented that in a variety of organizational settings and clinical domains, members of racial and ethnic
minority groups receive poorer quality care than their White counterparts.
While many studies published since the 2003 release of Unequal Treatment have shown similar patterns, there
is evidence of some progress. Disparities in some domains (e.g., process of care measures such as use of beta blockers or aspirin after heart attack) have been shown to be shrinking over time for some populations but not others.
Individual health plans, hospitals, and medical groups have organized quality improvement projects aimed at reducing disparities and have succeeded in doing so. The underlying reasons for disparities are increasingly understood
so that initiatives to address disparities can be focused on factors that are likely to have the greatest positive effect.
The impact of language, culture, and socioeconomic status, along with race and ethnicity, are also more clearly
understood. Yet studies reveal that disparities remain on both process of care and outcome measures.
Continued work in addressing disparities requires the collection and use of data on race, ethnicity, and language in all health and health care data systems, as called for in 2004 by the National Research Council report,
Eliminating Health Disparities: Measurement and Data Needs. These data provide the opportunity to monitor
and analyze disparities, and are informative in identifying individuals and groups to whom quality improvement
or other interventions can be directed. Across a range of organizational levels, from the Agency for Healthcare
Research and Quality National Healthcare Disparities Report at one end, to the work carried out by individual
physician offices and community health centers at the other, the collection and use of data on race, ethnicity, and
language are key parts of the process of identifying health care needs and eliminating disparities.
Quality improvement can be organized as a collaborative effort at a local, regional, statewide, or even national
level. Even when projects are carried out by individual organizations, the process of benchmarking involves sharing information from organization to organization. For some quality improvement projects, literal data sharing is
important, as an entity collecting race, ethnicity, or language data (e.g., a multispecialty group practice) may provide
that information to another entity (e.g., a managed care plan) in order for the second entity to use the information
for analyses of quality of care data. Additionally, regional, state, and national health care agencies may wish to
pool data from individual organizations to address disparities in a broader geographic context.
xi
xii
PREFACE
The collection of data on race, ethnicity, and language will, in principle, have the greatest impact if it is done
according to standards that allow for comparison of data across organizations, sharing of individual-level data
from one to another, and combining of data from multiple sources. The Subcommittee on Standardized Collection
of Race/Ethnicity Data for Healthcare Quality Improvement was asked to examine the issue of how data on race,
ethnicity, and language are collected in various contexts associated with health care, and to offer recommendations on standardization of the categories for these variables. This report addresses data collection challenges and
proposes a framework for moving forward with standardized data collection across health care entities. Previous
reports have reiterated the importance of collecting more detailed ethnicity data than are captured by the Office
of Management and Budget (OMB) standard categories; this report proposes templates of granular ethnicity and
language categories for national adoption so that entities wishing to collect detailed data can do so in systematic,
uniform ways. The recommendations presented here provide guidance to entities on data collection to support
their efforts to improve quality and eliminate disparities.
David R. Nerenz, Chair
Subcommittee on Standardized
Collection of Race/Ethnicity Data for
Healthcare Quality Improvement
Acknowledgments
The subcommittee and staff are grateful to many individuals and organizations who contributed to this study.
Most specifically, the subcommittee would like to thank members of the Institute of Medicine Committee on Future
Directions for the National Healthcare Quality and Disparities Reports for their guidance and comments on the
report. The committee members include:1
SHEILA BURKE (Chair), Faculty Research Fellow, Malcolm Weiner Center for Social Policy, John F.
Kennedy School of Government, Harvard University, Boston, MA
ANNE BEAL, Assistant Vice President, The Commonwealth Fund, New York, NY
E. RICHARD BROWN, Professor, UCLA School of Public Health and Director, UCLA Center for Health
Policy Research, Los Angeles, CA
MARSHALL H. CHIN, Professor of Medicine, University of Chicago, Chicago, IL
JOSE J. ESCARCE, Professor of Medicine, Division of General Internal Medicine and Health Services
Research, UCLA School of Medicine, Los Angeles, CA
KEVIN FISCELLA, Associate Professor, University of Rochester, Rochester, NY
ELLIOT S. FISHER, Professor of Medicine and Community and Family Medicine, Dartmouth Medical
School, and Director, Center for Health Policy Research, Dartmouth Institute for Health Care Policy
and Clinical Practice, Lebanon, NH
DAWM M. FITZGERALD, CEO, QSource, Memphis, TN
FOSTER GESTEN, Medical Director, Office of Health Insurance Programs, New York State Department
of Health, Albany, NY
BRENT C. JAMES, Chief Quality Officer and Executive Director, Intermountain Health Care, Inc.
Institute for Health Care Delivery Research, Salt Lake City, UT
JEFFREY KANG, Chief Medical Officer and Senior Vice President for Medical Strategy and Policy,
CIGNA Corporation, Hartford, CT
SHARON-LISE T. NORMAND, Professor, Department of Health Care Policy, Harvard Medical School,
Boston, MA
CHRISTOPHER QUERAM, President/CEO, Wisconsin Collaborative for Healthcare Quality, Middleton, WI
1
Subcommittee members Ignatius Bau, David Nerenz, and Paul Schyve are also members of the Committee.
xiii
xiv
ACKNOWLEDGMENTS
SARAH SCHOLLE, Assistant Vice President for Research and Analysis, National Committee for Quality
Assurance, Washington, DC
BRUCE SIEGEL, Director, Center for Health Care Quality, The George Washington University School of
Public Health and Health Services, Washington, DC
The subcommittee acknowledges Constance Citro, director of the Committee on National Statistics, National
Research Council of the National Academies, for her insight and contacts within the statistical community as well
as the help of Thomas Plewes in locating materials on limited English proficiency.
In addition, the subcommittee benefited from the testimony before the committee and subcommittee during
public workshops: Karen Adams (National Quality Forum), Donald Berwick (Institute for Healthcare Improvement), Andrew Bindman (UCSF and CA Medicaid Research Institute), Carolyn Clancy (Agency for Healthcare
Research and Quality), Kathryn L. Coltin (Harvard Pilgrim Health Care), Brenda Edwards (Division of Cancer
Control & Population Sciences, National Cancer Institute), Marc Elliott (RAND Corporation), Irene Fraser (Agency
for Healthcare Research and Quality), Allen Fremont (RAND Corporation), Ron Hays (Division of General Internal Medicine and Health Services Research, UCLA), Karen Humes (U.S. Census Bureau), Deeana Jang (Asian
& Pacific Islander American Health Forum, speaking on behalf of Out of Many, One’s Health Data Taskforce),
Marjorie Kagawa-Singer (UCLA School of Public Health), Karen Kmetik (American Medical Association and The
Physician Consortium for Performance Improvement), David Lansky (Pacific Business Group on Health), Nicole
Lurie (RAND Corporation, Center for Population Health and Health Disparities), Jennifer Madans (National Center
for Health Statistics), Paul McGann (Office of Clinical Standards and Quality, Centers for Medicare and Medicaid
Services), Ernest Moy (Agency for Healthcare Research and Quality), Marsha Regenstein (The George Washington
University), Thomas Reilly (Office of Research, Development and Information, Centers for Medicare and Medicaid
Services), Michael Rodriguez (Department of Family Medicine, David Geffen School of Medicine, UCLA), Patrick
Romano (Divisions of General Medicine and General Pediatrics, Center for Healthcare Policy and Research, UC
Davis), Joachim Roski (Engelberg Center for Health Care Reform, The Brookings Institution), Maribeth Shannon
(Market and Policy Monitor Program, California HealthCare Foundation), Gayle Tang (National Diversity, Kaiser
Permanente), Kalahn Taylor-Clark (Engelberg Center for Healthcare Reform, The Brookings Institution), Grace
Ting (Health Equities Programs, Wellpoint, Inc.), Katherine K. Wallman (U.S. Office of Management and Budget),
Thomas Williams (Integrated Healthcare Association), and Mara Youdelman (National Health Law Program).
Many others provided valuable advice on the issues under study; these include Mona L. Bormet (Asian &
Pacific Islander American Health Forum), Erin Bowman (California Health Care Safety Net Institute), Rita Carreón
(America’s Health Insurance Plans), Olivia Carter-Pokras (University of Maryland), Coralie Chan (Kaiser Permanente), Francis Frasier (Indian Health Service), Sundak Ganesan (Centers for Disease Control and Prevention
Vocabulary and Messaging Team), Sheldon Greenfield (University of California, Irvine), Kirk Greenway (Indian
Health Service), Brady Hamilton (National Center for Health Statistics), William E. Hammond (Duke University),
George Isham (HealthPartners), Wendy Jameson (California Health Care Safety Net Institute), Charles Jarvis
(NextGen, Executive Team HIMSS EHRA), Ashish Jha (Harvard School of Public Health), Sherrie Kaplan (University of California, Irvine), Theodore Klein (Klein Consulting), Diane Louise Leach (Indian Health Service),
Mark Leavitt (Certification Commission for Healthcare Information Technology), Denise Love (National Association of Health Data Organizations), Martin Martinez (California Pan-Ethnic Health Network), Vickie M. Mays
(Department of Health Services, UCLA), Mark McClellan (The Brookings Institution), JeanHee Moon (Center
for Health Care Strategies), Jeannette Noltenius (Out of Many, One), Edna Paisano (Indian Health Service), Ruth
Perot (Summit Health Institute for Research and Education), Daniel Pollack (Centers for Disease Control and
Prevention), Kenneth Prewitt (School of International and Public Affairs, Columbia University), Richard Pride
(University of Mississippi Medical Center), Alisa Ray (Certification Commission for Healthcare Information Technology), C. Sue Reber (Certification Commission for Healthcare Information Technology), Bob Rehm (America’s
Health Insurance Plans), Yvette Roubideaux (University of Arizona College of Medicine), Barbara Rudolph (The
Leapfrog Group), Hyon Shin (U.S. Census Bureau), Jane Sisk (National Center for Health Statistics, Centers for
Disease Control and Prevention), Brian Smedley (Joint Center for Political and Economic Studies), Benjamin P.
Smith (Indian Health Service), Phillip L. Smith (Indian Health Service), Benjamin Steffen (Maryland Health Care
ACKNOWLEDGMENTS
xv
Commission), Otilia Tiutin (Contra Costa Health Plan), Alan Trachtenberg (Indian Health Service), William Vega
(David Geffen School of Medicine, UCLA), Lucie Vogel (Indian Health Service), Robin Weinick (Institute of
Health Policy, Massachusetts General Hospital), and Ellen Wu (California Pan-Ethnic Health Network).
California state government representatives were generous in their time discussing issues with respect to collection of data and implementation of SB 853. These included Cindy Ehnes and Hattie Hanley of the Department
of Managed Health Care; Shelley Rouillard and Ernesto Sanchez, Managed Risk Medical Insurance Board; David
Carlisle, Candace Diamond, Serena Beltran, and Ron Spingarn, Office of Statewide Health Planning and Development; Sandra Perez and Ed Mendoza, California Office of the Patient Advocate; and Rita Marowitz, Medi-Cal
Managed Care Division.
Many within the IOM were helpful throughout the study process, including Karen Anderson, Lyla Hernandez,
Laura Levitt, Rose Martinez, and Sharyl Nass. In addition, we would like to thank Clyde Behney, Linda Kilroy,
Abbey Meltzer, Vilija Teel, Lauren Tobias, Jackie Turner, and Jordan Wyndelts for their continuing support throughout the project to ensure release of this expedited report. We also wish to acknowledge the editing provided by
Rona Briere.
Funding for this study was provided by the Agency for Healthcare Research and Quality (AHRQ). The subcommittee appreciates its support for the project as well as substantive support from AHRQ staff, particularly
Roxanne Andrews, Carolyn Clancy, and Ernest Moy. The California Endowment has provided additional funding
to ensure widespread distribution of this report’s summary brief in Spanish and Chinese.
Contents
SUMMARY
1
1
INTRODUCTION
13
2
EVIDENCE OF DISPARITIES AMONG ETHNICITY GROUPS
31
3
DEFINING CATEGORIZATION NEEDS FOR RACE AND ETHNICITY DATA
61
4
DEFINING LANGUAGE NEED AND CATEGORIES FOR COLLECTION
93
5
IMPROVING DATA COLLECTION ACROSS THE HEALTH CARE SYSTEM
127
6
IMPLEMENTATION
147
APPENDIXES*
A
B
C
D
E
F
G
H
I
Acronyms and Abbreviations
Legislation Cited in Report
Workshop Agendas
Subcommittee Member and Staff Biographies
Subcommittee Template: Developing a National Standard Set of Granular Ethnicity Categories and
a Rollup Scheme
Granular Ethnicities with No Determinate OMB Race Classification
Kaiser Permanente: Evolution of Data Collection on Race, Ethnicity, and Language Preference
Information
Contra Costa Health Plan Language Assistance Database and Ethnicity Categories
Subcommittee Template: Developing a National Standard Set of Spoken Language Categories and
Coding
*Appendixes E through I can be found online at http://www.nap.edu.
xvii
163
167
171
177
183
199
201
221
237
Boxes, Figures, and Tables
Summary
Box
S-1
Statement of Task: Subcommittee on Standardized Collection of Race/Ethnicity Data for Healthcare
Quality Improvement, 2
Figure
S-1
Recommended variables for standardized collection of race, ethnicity, and language need, 3
Chapter 1
Boxes
1-1
1-2
1-3
Barriers to Collection of Race, Ethnicity, and Language Data, 18
The 1997 OMB Revisions to the Standards for the Classification of Federal Data on Race and Hispanic
Ethnicity, 20
Statement of Task: Subcommittee on Standardized Collection of Race/Ethnicity Data for Healthcare
Quality Improvement, 23
Figures
1-1
A framework for reducing disparities in health care systems, 14
1-2
Williams, Lavizzo-Mourey, and Warren’s framework for understanding the relationships between race,
medical/health care, and health, 18
1-3
Overview of purposes and uses of race, ethnicity, and language data to guide subcommittee’s
investigation of issues of categorization and collection, 24
Table
1-1
Categories and Definitions Promulgated by the OMB and the U.S. Bureau of the Census, 17
xix
xx
BOXES, FIGURES, AND TABLES
Chapter 2
Tables
2-1
2-2
2-3
2-4
2-5
2-6
2-7
Census 2000 Population by Race and Hispanic Ethnicity, 33
Selected Characteristics of the Hispanic/Latino/Spanish Population in the United States, 37
Selected Characteristics of the Black Population in the United States, 42
Selected Characteristics of the Asian Population in the United States, 45
Selected Characteristics of the NHOPI Population in the United States, 49
Selected Characteristics of the White Population in the United States, 51
Selected Characteristics of the American Indian or Alaska Native (AIAN) Population in the United
States, 54
Chapter 3
Boxes
3-1
3-2
3-3
3-4
Race and Ethnicity Categories in the HCUP Databases, 68
The Use of Data Linkages to Improve Data Coverage and Quality in Cancer Registries, 69
The Challenge of Categorizing Filipino Respondents, 71
Realizing the Necessity of Collecting Data: The University of Mississippi Medical Center, 80
Figures
3-1
Reproduction of questions of race and Hispanic origin from Census 2000, 71
3-2
Geographic distribution of the Asian population, 76
3-3
CDC ethnicities rolled up to the OMB minimum categories for race and Hispanic ethnicity with
subcommittee annotations, 82
3-4
Models for data collection instruments to collect race, Hispanic ethnicity, and granular
ethnicity data, 88
Tables
3-1
3-2
3-3
3-4
3-5
3-6
OMB Race and Hispanic Ethnicity Categories According to a One- and Two-Question Format, 62
Race and Ethnicity Categories Collected by Various Data Sources, 64
Race and Hispanic Ethnicity Categories Used by State Medicaid and CHIP Programs, 67
Hispanic and Non-Hispanic Population Distribution by Race for the United States: 2000, 72
Comparison of Granular Ethnicity Categorization and Coding Systems, 78
Examples of Instructions, Phrasing, and Terminology to Capture Race and Ethnicity Data, 86
Chapter 4
Boxes
4-1
4-2
Language Concordance Between Patients and Providers, 95
Assessing Whether Language Assistance Needs Are Met, 96
Figures
4-1
4-2
4-3
4-4
Census 2000 questions about language, 100
Karliner algorithm, 104
Most spoken languages in North Dakota, Minnesota, Texas, and Maine, 2005, 112
Number of languages spoken in each state, 114
BOXES, FIGURES, AND TABLES
Tables
4-1
4-2
4-3
4-4
Summary of Question Types and Categories, 103
Correlations Between Self-Reported English Ability in Speaking, Reading, and Writing, 106
Relationship of Speaking and Reading Ability, 107
Language Categories in Selected Collection Instruments, 110
Chapter 5
Boxes
5-1
5-2
5-3
5-4
5-5
5-6
Statewide Race and Ethnicity Data Collection: Massachusetts, 131
Collecting and Using Data: The Alliance of Chicago Community Health Services, 132
Collecting Data in Small Physician Practices, 133
Successful Collection of Data by a Health Plan: Aetna, 134
Standardizing Direct Data Collection, 138
The Use of Indirectly Collected Data by a Health Plan: Wellpoint, Inc., 142
Figures
5-1
A snapshot of data flow in a complex health care system, 129
5-2
Opportunities to collect data within the health care system, 130
Chapter 6
Figure
6-1
Recommended variables for standardized collection of race, ethnicity, and language need, 149
xxi
Summary
The goal of eliminating disparities in health care in the United States remains elusive. The findings of the
National Healthcare Disparities Report reveal that even as quality improves on specific measures, disparities often
persist (AHRQ, 2008a, 2008b). Addressing these disparities must begin with the fundamental step of bringing
the nature of the disparities and the groups at risk for those disparities to light by collecting health care quality
information stratified by race, ethnicity and language data. Then attention can be focused on where interventions
might be best applied, and on planning and evaluating those efforts to inform the development of policy and the
application of resources. A lack of standardization of categories for race, ethnicity, and language data has been
suggested as one obstacle to achieving more widespread collection and utilization of these data. Many types of
entities participate in initiatives to improve the quality of health care; health plans, hospitals, other providers, and
health systems can and should obtain race, ethnicity, and language data so these data can be used to identify gaps
and improve care for all individuals.
The purpose of this report is to identify standardized categories for the variables of race, ethnicity, and
language that can be used to facilitate the sharing, compilation, and comparison of quality data stratified by the
standard categories. The Institute of Medicine, under a contract with the Agency for Healthcare Research and
Quality (AHRQ), Department of Health and Human Services (HHS), formed the Subcommittee on Standardized
Collection of Race/Ethnicity Data for Healthcare Quality Improvement to identify current models for collecting and
coding race, ethnicity, and language data; to ascertain the challenges involved in obtaining these data in health care
settings; and to make recommendations for improvement. The language in the statement of task (Box S-1)—“in
healthcare quality improvement” and “assess and report on quality of care”—led the subcommittee to focus its
discussion and recommendations on data collection in the domain of health care services.
ExISTING GUIDANCE ON RACE, ETHNICITY, AND LANGUAGE CATEGORIES
The concepts of race and ethnicity are defined socially and culturally and, in the case of federal data collection, by legislative and political necessity (Hayes-Bautista and Chapa, 1987). With the aim of identifying important
cultural and social groups for statistical reporting and civil rights monitoring, the Office of Management and Budget
(OMB) has developed a minimum set of standardized categories for reporting on race and Hispanic ethnicity by
federal agencies and recipients of federal funds (OMB, 1977, 1997b). The five race categories are now Black or
African American, White, Asian, American Indian or Alaska Native, and Native Hawaiian or Other Pacific Islander.
1
2
RACE, ETHNICITY, AND LANGUAGE DATA
BOX S-1
Statement of Task: Subcommittee on Standardized Collection of
Race/Ethnicity Data for Healthcare Quality Improvement
A subcommittee of experts will report to the IOM Committee on Future Directions for the National
Healthcare Quality and Disparities Reports regarding the lack of standardization of collection of race and
ethnicity data at the federal, state, local, and private sector levels due to the fact that the federal government has yet to issue comprehensive, definitive guidelines for the collection and disclosure of race and
ethnicity data in healthcare quality improvement. The subcommittee will focus on defining a standard set of
race/ethnicity and language categories and methods for obtaining this information to serve as a standard
for those entities wishing to assess and report on quality of care across these categories. The subcommittee will carry out an appropriate level of detailed, in-depth analysis and description which can be included
in the overall report by the committee and as a separate stand alone report.
OMB describes these categories as the minimum set and encourages the collection of more detailed data provided
those data can be aggregated back to the minimum categories (OMB, 1997a). Progress has been made in incorporating these categories into the collection and presentation of data in health care settings. However, some health
care–related data collection efforts still do not employ these basic standard categories.
While OMB has not established a list of language categories, the collection of language data has been pivotal
in determining whether there has been discrimination by “national origin” under Title VI of the Civil Rights Act
of 1964,1,2 and federal policies state that “reasonable steps” need to be taken so that persons of limited English
proficiency can have “meaningful access” to programs or activities without charge for language services. 3 Additionally in 2000, HHS released its National Standards on Culturally and Linguistically Appropriate Services (CLAS),
which encourage all health care organizations and individual providers “to make their practices more culturally
and linguistically accessible,” including the use of race, ethnicity, and language data in program assessments and
incorporation of these data into health records and organizational management systems (HHS, 2007).
CATEGORIZING RACE AND ETHNICITY DATA
The OMB race and Hispanic ethnicity categories represent broad population groups used for an array of statistical reporting and analytic purposes, including health care quality assessment and identification of disparities
(AHRQ, 2008a; Cohen, 2008; Flores and Tomany-Korman, 2008; IOM, 2008; Kaiser Family Foundation, 2009).
Chapter 2 illustrates that these categories alone, however, are insufficient to illuminate many disparities and to
target quality improvement efforts where they may be most needed. Since disparities can exist within those broad
OMB categories, there is value in collecting and utilizing data incorporating more fine-grained categories than
those of OMB (Blendon et al., 2007; Jerant et al., 2008; Read et al., 2005; Shah and Carrasquillo, 2006). The
subcommittee recommends a separate question to collect data on granular ethnicity—defined as “a person’s ethnic
origin or descent, ‘roots,’ or heritage, or the place of birth of the person or the person’s parents or ancestors…”
(U.S. Census Bureau, 2008)—in addition to soliciting data in the OMB race and Hispanic ethnicity categories
(Figure S-1). Research also shows that not all individuals identify with the current OMB race categories so the
subcommittee recommends expanding the race categories to six choices by including a “Some other race” option
1
The Civil Rights Act of 1964, Public Law 88-352, 78 Stat. 241, 88th Cong., 2nd sess. (July 2, 1964).
Lau v Nichols, 414 U.S. 563 (1974).
3 Improving Access to Services for Persons with Limited English Proficiency, Executive Order 13166, August 11, 2000.
2
Race and Ethnicity
SUMMARY
OMB Hispanic
Ethnicitya
OMB Race
(Select one or more)
• Hispanic or Latino
• Not Hispanic or Latino
• Black or African
American
• White
• Asian
• American Indian or
Alaska Native
• Native Hawaiian or
Other Pacific Islander
• Some other raceb
Language Need
Spoken English Language
Proficiencyd
•
•
•
•
Very well
Well
Not well
Not at all
(Limited English proficiency is
defined as “less than very well”)
Granular Ethnicity
• Locally relevant
choices from a
national standard list
of approximately 540
categories with
CDC/HL7 codesc
• “Other, please
specify:___” response
option
• Rollup to the OMB
categories
Spoken Language Preferred
for Health Care
• Locally relevant choices from a
national standard list of
approximately 600 categories
with coding to be determined
• “Other, please specify:___”
response option
• Inclusion of sign language in
spoken language need list and
Braille when written language is
elicited
FIGURE S-1 Recommended variables for standardized collection of race, ethnicity, and language need.
NOTE: Additional categories for HIT tracking might include whether respondents have not yet responded (unavailable), refuse
to answer (declined), or do not know (unknown), as well as whether responses are self-reported or observer-reported.
a The preferred order of questioning is Hispanic ethnicity first, followed by race, as OMB recommends, and then granular
ethnicity.
b The U.S. Census Bureau received OMB permission to add “Some other race” to the standard OMB categories in Census
2000 and subsequent Census collections.
c Additional codes will be needed for categories added to the CDC/HL7 list.
d Need is determined on the basis of two questions, with asking about proficiency first. Limited English proficiency is
defined for health care purposes as speaking English less than very well.
SOURCES: CDC, 2000; Office of Management and Budget, 1997b; Shin and Bruno, 2003; U.S. Census Bureau, 2002.
4
RACE, ETHNICITY, AND LANGUAGE DATA
to provide a response category for those Hispanics and others who do not relate to the current choices. Additionally, the subcommittee favors the collection and retention for analysis of specific multiple-race combinations (i.e.,
having data on each race that an individual selects), rather than losing that detail by only offering the more general
category of “multiracial,” whenever possible.
In Chapter 3, the subcommittee considers whether a national “OMB Plus” set of 10 to 15 granular ethnicity
categories, similar to the Census Bureau approach, should be identified that would be optimal for collection by
all health care entities. However, such a set would not be specific to and appropriate for the diverse communities in which health care entities operate. Instead, the subcommittee concludes that individual entities should
select the granular ethnicity categories representative of their service population selected from a national list of
standardized categories. Whenever a limited list of categories is offered to respondents, the list should include
an open-ended response option of “Other, please specify:__” so that each individual who desires to do so can
self-identify.
Recommendation 3-1: An entity collecting data from individuals for purposes related to health and
health care should:
• Collect data on granular ethnicity using categories that are applicable to the populations it
serves or studies. Categories should be selected from a national standard list (see Recommendation 6-1a) on the basis of health and health care quality issues, evidence or likelihood of disparities, or size of subgroups within the population. The selection of categories
should also be informed by analysis of relevant data (e.g., Census data) on the service or
study population. In addition, an open-ended option of “Other, please specify:__” should
be provided for persons whose granular ethnicity is not listed as a response option.
• Elicit categorical responses consistent with the current OMB standard race and Hispanic
ethnicity categories, with the addition of a response option of “Some other race” for persons who do not identify with the OMB race categories.
While several organizations provide lists of granular ethnicities (e.g., Centers for Disease Control and Prevention
[CDC]/Health Level 7 [HL7] and the Commonwealth of Massachusetts/Brookings Institution), none of these lists is
sufficient for a standard national set from which locally relevant choices could be made (CDC, 2000; Taylor-Clark
et al., 2009). A merged list provides a template from which such a national standard set can be developed (see
Appendix E). When a person does not check off an OMB race or Hispanic ethnicity and provides only a granular
ethnicity response, a process for rolling granular ethnicity categories up to the OMB categories will, in some cases,
be necessary for analysis and reporting purposes. However, some ethnicities do not correspond to a single OMB
race category, necessitating a “no determinate OMB race classification” for analytic purposes (see Appendix F).
Recommendation 3-2: Any entity collecting data from individuals for purposes related to health
and health care should collect granular ethnicity data in addition to data in the OMB race and
Hispanic ethnicity categories and should select the granular ethnicity categories to be used from a
national standard set. When respondents do not self-identify as one of the OMB race categories or
do not respond to the Hispanic ethnicity question, a national scheme should be used to roll up the
granular ethnicity categories to the applicable broad OMB race and Hispanic ethnicity categories
to the extent feasible.
Eliciting accurate and reliable race, Hispanic ethnicity, and granular ethnicity data depends on the ways in
which the questions are asked, the instructions provided to respondents (e.g., “Select one or more”), and the format
of the questions (i.e., OMB one-question versus two-question format). This latter issue is especially relevant to
how Hispanic populations self-identify. Pilot projects and further study are necessary to confirm the best ways to
collect accurate data that are useful for health care quality improvement.
SUMMARY
Recommendation 3-3: To determine the utility for health and health care purposes, HHS should
pursue studies on different ways of framing the questions and related response categories for collecting race and ethnicity data at the level of the OMB categories, focusing on completeness and
accuracy of response among all groups.
• Issues addressed should include use of the one- or two-question format for race and Hispanic ethnicity, whether all individuals understand and identify with the OMB race and
Hispanic ethnicity categories, and the increasing size of populations identifying with “Some
other race.”
• The results of such studies, together with parallel studies by the Census Bureau and other
agencies, may reveal the need for an OMB review across all agencies to determine the best
format for improving response among all groups.
IMPROVING THE COLLECTION OF DATA ON LANGUAGE
Compelling evidence exists that having limited English proficiency (LEP) affects the delivery and quality of
health care and can result in significant disparities in access to care (Hu and Covell, 1986; Weinick and Krauss,
2000), a decreased likelihood of having a usual source of care (Kirkman-Liff and Mondragon, 1991; Weinick and
Krauss, 2000), an increased probability of receiving unnecessary diagnostic tests (Hampers et al., 1999), more
serious adverse outcomes from medical errors (Divi et al., 2007), and more drug-related complications (Gandhi
et al., 2000). To achieve safe, effective, patient-centered communication, attention must be paid to the language
needs of patients, as addressed in Chapter 4.
Language Questions
Assessing each individual’s language need is an essential first step toward ensuring effective health care
communication. The subcommittee concludes that spoken language need can best be assessed by asking two
questions: one aimed at determining whether an individual speaks English less than very well and a second aimed
at identifying the individual’s preferred spoken language during a health care encounter (Figure S-1). Having this
information for each individual allows its use to ensure the quality of services in subsequent encounters, in analysis
of health care disparities, and in system-level planning (e.g., determining the need for interpreters and matching
patients to language-concordant providers).
The subcommittee establishes a hierarchy among the possible language questions, with questions about English
proficiency and preferred spoken language identified as a higher priority than questions on language spoken at
home or on preferred language for written materials. On average, 55 percent of those who speak another language
at home speak English very well (Shin and Bruno, 2003), but asking about language spoken at home helps provide
a window into the health beliefs and practices of the home environment. The correlation between those who need
spoken and written language assistance appears to be high in many settings.
Recommendation 4-1: To assess patient/consumer language and communication needs, all entities
collecting data from individuals for purposes related to health and health care should:
• At a minimum, collect data on an individual’s assessment of his/her level of English proficiency and on the preferred spoken language needed for effective communication with
health care providers. For health care purposes, a rating of spoken English-language proficiency of less than very well is considered limited English proficiency.
• Where possible and applicable, additionally collect data on the language spoken by the
individual at home and the language in which he/she prefers to receive written materials.
When the individual is a child, the language need of the parent/guardian must be determined. Similarly, if an adult
has a guardian/conservator, that individual’s language need must be assessed.
6
RACE, ETHNICITY, AND LANGUAGE DATA
Languages in Use
More than 600 languages are in use in the United States although a smaller number may be in use in health
care contexts. In Chapter 4 the subcommittee evaluates options for determining what language categories entities
should use for data collection (e.g., a uniform set for all entities, percentage or numerical thresholds based on the
presence of languages in a service area, or local choice). Local choice informed by data on the languages spoken
most frequently in the service area by persons with LEP is the preferred option. A single list does not suit all areas
given that the top non-English languages vary greatly from area to area (for instance, Spanish is in the top 10 languages in 3,122 of 3,141 counties in the United States, while Turkish is in the top 10 in 12 counties, Laotian in 125,
Navaho in 74, SerboCroatian in 58, and Portuguese in 229) (U.S. English Foundation, 2009). The aim is to have data
on each individual’s specific language need, but when an entity designs its collection instruments, whether paper or
electronic, it may, because of space considerations, have to use a limited number of response categories. Therefore,
such a response list should always include an “Other, please specify:__” option. Some electronic data collection
systems are more sophisticated, and by using keystroke recognition can accommodate hundreds of languages.
Recommendation 4-2: The choice of response categories for spoken and written language questions
should be informed by analysis of relevant data on the service area (e.g., Census data) or service
population, and any response list should include an option of “Other, please specify:__” for persons
whose language is not listed.
The subcommittee has developed a template of languages used in the United States based on Census data and
the experiences of certain health care providers. This template can serve as a basis for the national standard set
called for in recommendations in Chapter 6 (see Appendix I for template). A uniform set of codes can facilitate
sharing of data. Two possible language coding systems already exist (the Census and International Organization
for Standardization [ISO] code sets) (SIL International, 2009; U.S. Census Bureau, 2007).
Recommendation 4-3: When any health care entity collects language data, the languages used as
response options or categories for analysis should be selected from a national standard set of languages in use in the United States. The national standard set should include sign language(s) for
spoken language and Braille for written language.
IMPROVING DATA COLLECTION ACROSS THE HEALTH CARE SYSTEM
As discussed in Chapter 5, while each of the entities involved in the nation’s health care system has some
capability for the collection of race, ethnicity, and language data, some are better positioned than others to collect
these data through self-report, the generally agreed-upon best way to define a person’s racial and ethnic identity.
In the future, information infrastructure may enable integrated data exchange so that all entities will not need to
collect all data. For now, however, all health and health care entities have roles to play in collecting these data
directly from individuals. Hospitals, community health centers, physician practices, health plans, and local, state,
and federal agencies can all identify next steps toward improving or implementing direct data collection by understanding the unique contexts in which they operate. Across all these entities, these data must be collected and stored
responsibly. Training of staff, upgrades to health information technology (HIT) systems, and communication with
patients and enrollees are potential avenues for improved data collection and building of trust.
In the subcommittee’s proposed framework, optional categories are offered (e.g., declined, unavailable,
unknown, self-reported, observer-reported); these are not for patient response, but for tracking the portion of the
patient population for which an entity has been able to collect data or the nature of the data collection. Until directly
collected data are sufficient for analytic and quality improvement purposes, indirect estimation of race and ethnicity
through techniques such as geocoding and surname analysis is useful for bridging data gaps.
SUMMARY
Recommendation 5-1: Where directly collected race and ethnicity data are not available, entities
should use indirect estimation to aid in the analysis of racial and ethnic disparities and in the development of targeted quality improvement strategies, recognizing the probabilistic and fallible
nature of such indirectly estimated identifications.
• Race and ethnicity identifications based on indirect estimation should be distinguished from
self-reports in data systems, and if feasible, should be accompanied by probabilities.
• Interventions and communications in which race and ethnicity identifications are based on
indirect estimation may be better suited to population-level interventions and communications and less well suited to use in individual-level interactions.
• An indirectly estimated probability of an individual’s race and ethnicity should never be
placed in a medical record or used in clinical decision making.
• Analyses using indirectly estimated race and ethnicity should employ statistically valid
methods that deal with probabilistic identifications.
IMPLEMENTING COLLECTION OF STANDARDIZED DATA
Now is an opportune time for action on standardization of the categories used to collect race, ethnicity, and
language data. Efforts to share and evaluate quality data across states, regions, or payers would be facilitated by
standardized categories.
HHS is a prime locus of the subcommittee’s recommendations in Chapter 6 for implementation of improved
collection of standardized data because of its focus on resolving health and health care disparities and its history
of promoting the collection of race, ethnicity, and language data to ensure compliance with applicable statutes
and regulations. National development of standardized categories and coding by HHS, along with a responsive
updating process, would relieve each state and entity of having to develop its own set of categories and coding
scheme, which could be incompatible with others. The subcommittee templates of categories along with an updated
CDC/HL7 Code Set can form the basis for standardized race, Hispanic ethnicity, and granular ethnicity data while
a determination will have to be made on coding for languages.
Recommendation 6-1a: HHS should develop and make available national standard lists of granular
ethnicity categories and spoken and written languages, with accompanying unique codes and rules
for rollup procedures.
• HHS should adopt a process for routine updating of those lists and procedures as necessary.
Sign languages should be included in national lists of spoken languages and Braille in lists
of written languages.
• HHS should ensure that any national hierarchy used to roll up granular ethnicity categories to the broad OMB race and Hispanic ethnicity categories takes into account responses
that do not correspond to one of the OMB categories.
Standardization would support achievement of the goal set forth in the American Recovery and Reinvestment Act of 20094 (ARRA) of having a national electronic health record (EHR)5 for each individual by 2014
that incorporates collection of data on the person’s race, ethnicity, and primary language. Having the standards
adopted by the other components of the health care industry, including the makers of HIT systems, would help
ensure that a sufficient set of data fields are available to accommodate each element recommended for collection
by the subcommittee.
4
American Recovery and Reinvestment Act of 2009, Public Law 111-5 § 3002(b)(2)(B)(vii), 111th Cong., 1st sess. (February 17, 2009).
In this document, EHR means a patient record owned and maintained by a provider entity; a personal health record is a medical or health
record owned and maintained by a patient him- or herself.
5
RACE, ETHNICITY, AND LANGUAGE DATA
Recommendation 6-1b: HHS and the Office of the National Coordinator for Health Information
Technology (ONC) should adopt as standards for including in electronic health records the variables of race, Hispanic ethnicity, granular ethnicity, and language need identified in this report.
Recommendation 6-1c: HHS and ONC should develop standards for electronic data transmission
among health care providers and plans that support data exchange and possible aggregation of
race, Hispanic ethnicity, granular ethnicity, and language need data across entities to minimize
redundancy in data collection.
Performance incentive programs tend not to be designed with reduction of disparities in mind, yet can have
positive or negative effects on disparities in health care and on underresourced primary care safety net providers
(Chien et al., 2007; Rust and Cooper, 2007; Williams, 2009). The subcommittee does not take a stand on whether
incentive payments in HIT programs should exist, but when they do exist, the collection of race, ethnicity, and
language data would be one activity for which positive incentives should be offered.
Recommendation 6-1d: The Centers for Medicare and Medicaid Services (CMS), as well as others
sponsoring payment incentive programs, should ensure that the awarding of such incentives takes
into account collection of the recommended data on race, Hispanic ethnicity, granular ethnicity,
and language need so these data can be used to identify and address disparities in care.
Numerous past and present legislative and policy efforts stress the importance of collecting race, ethnicity,
and language data in federal programs. HHS administers programs supporting the health care delivery system to
provide care to persons at risk of receiving suboptimal care, and these programs present opportunities to influence the quality of care delivered to millions of Americans. Because the subcommittee’s charge relates to health
care, the following recommendation focuses on the HHS programs that deliver health cares services, pay for those
services through insurance mechanisms, or administer surveys that increase knowledge on health care needs and
outcomes. The Secretary, however, may find it useful to extend the standardized approach of this report to other
HHS health-related programs or other data gathering activities.
Recommendation 6-1e: HHS should issue guidance that recipients of HHS funding (e.g., Medicare,
the Children’s Health Insurance Program [CHIP], Medicaid, community health centers) include
data on race, Hispanic ethnicity, granular ethnicity, and language need in individual health records
so these data can be used to stratify quality performance metrics, organize quality improvement
and disparity reduction initiatives, and report on progress.
Having quality-of-care information from large federal delivery systems such as the Department of Veterans
Affairs, the Department of Defense, and other federally funded programs, such as community health centers, stratified by the same variables and categories recommended in this report would provide rich sources for comparative
analysis.
Recommendation 6-2: HHS, the Department of Veterans Affairs, and the Department of Defense
should coordinate their efforts to ensure that all federally funded health care delivery systems collect the variables of race, Hispanic ethnicity, granular ethnicity, and language need as outlined in
this report, and include these data in the health records of individuals for use in stratifying quality performance metrics, organizing quality improvement and disparity reduction initiatives, and
reporting on progress.
Accreditation organizations and other professional and standards-setting bodies can play a key role in fostering
the collection of race, ethnicity, and language data. Hospitals, health plans, and physicians have reported that a
lack of standardization has been a barrier to using these data in quality improvement efforts (Bilheimer and Sisk,
9
SUMMARY
2008; Lurie et al., 2008; NCQA, 2009; Siegel et al., 2008). The Joint Commission, the National Committee for
Quality Assurance (NCQA), and URAC6 have developed CLAS-like standards for their organizational reviews.
The National Quality Forum (NQF) encourages the collection of race, ethnicity, and language data in accordance
with the Health Research & Educational Trust (HRET) Toolkit (NQF, 2008); the subcommittee’s recommendations include modifications to that toolkit. The American Medical Association, the National Medical Association,
and the National Hispanic Medical Association’s Commission to End Health Care Disparities have reaffirmed
their collective commitment to bringing an end to health care disparities by increasing awareness in the physician
community and promoting better data collection (AMA, 2005, 2009).
Recommendation 6-3: Accreditation and standards-setting organizations should incorporate the
variables of race, Hispanic ethnicity, granular ethnicity, and language need outlined in this report
and associated categories (as updated by HHS) as part of their accreditation standards and performance measure endorsements.
• The Joint Commission, NCQA, and URAC should ensure collection in individual health
records of the variables of race, Hispanic ethnicity, granular ethnicity, and language
need as outlined in this report so these data can be used to stratify quality performance
metrics, organize quality improvement and disparity reduction initiatives, and report on
progress.
• NQF should review and amend its recommendations on the collection and use of data on
race, Hispanic ethnicity, granular ethnicity, and language need to accord with the categories and procedures outlined in this report.
• Medical societies and medical boards should review and endorse the variables, categories,
and procedures outlined in this report and educate their members on their use for quality
improvement.
States have an opportunity to shape the level of detail of race, ethnicity, and language data collected in their
programs whether for use in reporting on quality measures by insurance programs, in disease registries, in hospital
discharges, in health care surveys, in patient safety reporting, or in other activities. Through Medicaid and CHIP
programs, states have leverage with managed care organizations and providers to require collection of the recommended data and their use in quality improvement. Medicaid provides coverage for a large portion of minority
groups, and states have an interest in ensuring that the population covered is receiving appropriate quality care
(Angeles and Somers, 2007).
Recommendation 6-4: Through their certification, regulation, and monitoring of health care providers and organizations within their jurisdiction, states should require the collection of data on the
race, Hispanic ethnicity, granular ethnicity, and language need variables as outlined in this report
so these data can be used to stratify quality performance metrics, organize quality improvement
and disparity reduction initiatives, and report on progress.
CONCLUSION
Efforts are under way to establish national standards for health care technology, performance measurement, and
data aggregation and exchange that complement local data collection and experiences with performance improvement and reporting (Roski, 2009). To date, it has been difficult to either combine or compare performance data
stratified by race, ethnicity, or language need across payment and delivery systems, which has limited the utility
of such data for assessing the performance of the health system as a whole or in specific geographic regions with
respect to disparities. Yet, these analyses have implications for the design of appropriate interventions by federal,
state, and local policy makers and health care plans and providers.
6
Formerly known as the Utilization Review Accreditation Commission.
10
RACE, ETHNICITY, AND LANGUAGE DATA
Standardization of the categories used to collect these data would promote greater comparability of patientfocused data collected directly by care providers or health plans, or, for instance, transferred from providers to
multiple plans. Standardization would also eliminate the need for all health care entities to develop their own
categorization schemes. Still, additional resources and leadership at the local, state, and national levels will be
required to implement these recommendations. Although broad application of EHRs will take a number of years,
the data collection issues for current systems do not differ significantly from those involved in future EHR applications, so providers could institute today the processes for the capture and sharing of race, ethnicity, and language
data proposed in this report.
There is strong evidence that the quality of health care varies by race, ethnicity, and language. Quality metrics
stratified by race, Hispanic ethnicity, granular ethnicity and language need can inform point-of-care services,
application of resources, and decisions in patient–provider interactions in ways that can assist in improving overall
quality and reducing disparities.
REFERENCES
AHRQ (Agency for Healthcare Research and Quality). 2008a. National Healthcare Disparities Report. Rockville, MD: AHRQ.
———. 2008b. The National Healthcare Quality Report. Rockville, MD: AHRQ.
AMA (American Medical Association). 2005. Opinion 9.121 - racial and ethnic health care disparities. http://www.ama-assn.org/ama/pub/physician-resources/medical-ethics/code-medical-ethics/opinion9121.shtml (accessed May 22 2009).
———. 2009. Commission to End Health Care Disparities, five year summary. Chicago, IL: American Medical Association.
Angeles, J., and S. A. Somers. 2007. From policy to action: Addressing racial and ethnic disparities at the ground-level. Hamilton, NJ: Center
for Health Care Strategies, Inc.
Bilheimer, L. T., and J. E. Sisk. 2008. Collecting adequate data on racial and ethnic disparities in health: The challenges continue. Health Affairs
27:383-391.
Blendon, R. J., T. Buhr, E. F. Cassidy, D. J. Perez, K. A. Hunt, C. Fleischfresser, J. M. Benson, and M. J. Herrmann. 2007. Disparities in health:
Perspectives of a multi-ethnic, multi-racial America. Health Affairs 26(5):1437-1447.
CDC (Centers for Disease Control and Prevention). 2000. Race and ethnicity Code set version 1.0. Atlanta, GA: Centers for Disease Control
and Prevention.
Chien, A. T., M. H. Chin, A. M. Davis, and L. P. Casalino. 2007. Pay for performance, public reporting, and racial disparities in health care: How
are programs being designed? Medical Care Research and Review 64(5 Suppl):283S-304S.
Cohen, L. L. 2008. Racial/ethnic disparities in hospice care: A systematic review. Journal of Palliative Medicine 11(5):763-768.
Divi, C., R. G. Koss, S. P. Schmaltz, and J. M. Loeb. 2007. Language proficiency and adverse events in US hospitals: A pilot study. International
Journal for Quality in Health Care 19(2):60-67.
Flores, G., and S. C. Tomany-Korman. 2008. Racial and ethnic disparities in medical and dental health, access to care, and use of services in
US children. Pediatrics 121(2):e286-e298.
Gandhi, T. K., H. R. Burstin, E. F. Cook, A. L. Puopolo, J. S. Haas, T. A. Brennan, and D. W. Bates. 2000. Drug complications in outpatients.
Journal of General Internal Medicine 15(3):149-154.
Hampers, L. C., S. Cha, D. J. Gutglass, H. J. Binns, and S. E. Krug. 1999. Language barriers and resource utilization in a pediatric emergency
department. Pediatrics 103(6 Pt 1):1253-1256.
Hayes-Bautista, D. E., and J. Chapa. 1987. Latino terminology: Conceptual bases for standardized terminology. American Journal of Public
Health 77:61-68.
HHS (U.S. Department of Health and Human Services), Office of Minority Health (OMH). 2007. National standards on culturally and linguistically appropriate services (CLAS). http://www.omhrc.gov/templates/browse.aspx?lvl=2&lvlID=15 (accessed May 13, 2009).
Hu, D. J., and R. M. Covell. 1986. Health care usage by Hispanic outpatients as function of primary language. Western Journal of Medicine
144(4):490-493.
IOM (Institute of Medicine). 2008. Challenges and successes in reducing health disparities: Workshop summary. Washington, DC: The National
Academies Press.
Jerant, A., R. Arellanes, and P. Franks. 2008. Health status among US Hispanics: Ethnic variation, nativity, and language moderation. Medical
Care 46(7):709-717.
Kaiser Family Foundation. 2009. Putting women’s health care disparities on the map: Examining racial and ethnic disparities at the state level.
Menlo Park, CA: The Henry J. Kaiser Family Foundation.
Kirkman-Liff, B., and D. Mondragon. 1991. Language of interview: Relevance for research of Southwest Hispanics. American Journal of Public
Health 81(11):1399-1404.
Lurie, N., A. Fremont, S. A. Somen, K. Coltin, A. Gelzer, R. Johnson, W. Rawlins, G. Ting, W. Wong, and D. Zimmerman. 2008. The National Health Plan Collaborative to reduce disparities and improve quality. Joint Commission Journal on Quality and Patient Safety
34(5):256-265.
NCQA (National Committee for Quality Assurance). 2009. Supporting small practices: Lessons for health reform. Washington, DC: NCQA.
SUMMARY
11
NQF (National Quality Forum). 2008. National voluntary consensus standards for ambulatory care—measuring healthcare disparities. Washington, DC: National Quality Forum.
OMB (Office of Management and Budget). 1977. Statistical policy directive No. 1, race and ethnic standards for federal statistics and administrative reporting. http://wonder.cdc.gov/wonder/help/populations/bridged-race/Directive15.html (accessed August 3, 2009).
———. 1997a. Recommendations from the Interagency Committee for the Review of the Racial and Ethnic Standards to the Office of Management and Budget concerning changes to the standards for the classification of federal data on race and ethnicity. Federal Register
(3110-01):36873-36946.
———. 1997b. Revisions to the standards for the classification of federal data on race and ethnicity. Federal Register 62:58781-58790.
Read, J. G., B. Amick, and K. M. Donato. 2005. Arab immigrants: A new case for ethnicity and health? Social Science and Medicine
61(1):77-82.
Roski, J. 2009. Road map for better performance information through distributed data network. Quality Alliance Steering Committee. Presentation to the IOM Committee on Future Directions for the National Healthcare Quality and Disparities Reports, February 10, 2009.
Washington, DC. PowerPoint Presentation.
Rust, G., and L. A. Cooper. 2007. How can practice-based research contribute to the elimination of health disparities? Journal of the American
Board of Family Medicine 20(2):105-114.
Shah, N. S., and O. Carrasquillo. 2006. Twelve-year trends in health insurance coverage among Latinos, by subgroup and immigration status.
Health Affairs 25(6):1612-1619.
Shin, H. B., and R. Bruno. 2003. Language use and English-speaking ability: 2000. Washington, DC: U.S. Census Bureau.
SIL International. 2009. Relationship between ISO 69- and the other parts of ISO 69. http://www.sil.org/iso639-3/relationship.asp (accessed
July 20, 2009).
Siegel, B., J. Bretsch, K. Jones, V. Sears, L. Vaquerano, and M. J. Wilson. 2008. Expecting Success: Excellence in cardiac care. Results from
Robert Wood Johnson Foundation Quality Improvement Collaborative. Princeton, NJ: Robert Wood Johnson Foundation.
Taylor-Clark, K., A. B. Anise, Y. Joo, and M. Chin. 2009. Massachusetts Superset. Washington, DC: The Brookings Institution.
U.S. Census Bureau. 2002. Modified race data summary file: 2000 Census of population and housing, technical documentation. http://www.
census.gov/popest/archives/files/MRSF-01-US1.html#fig1 (accessed February 25, 2009).
———. 2007. Census 2000 Summary File : Technical Documentation. http://www.census.gov/prod/cen2000/doc/sf3.pdf (accessed August 3,
2009).
———. 2008. Ancestry. http://www.census.gov/population/www/ancestry/ancoverview.html (accessed May 24, 2009).
U.S. English Foundation. 2009. Languages in America. http://www.usefoundation.org/view/29 (accessed May 26, 2009).
Weinick, R. M., and N. A. Krauss. 2000. Racial/ethnic differences in children’s access to care. American Journal of Public Health 90(11):
1771-1774.
Williams, T. 2009. Healthcare quality and disparities: Implications for pay for performance. Integrated Health Association. Presentation to the
IOM Committee on Future Directions for the National Healthcare Quality and Disparities Reports, March 12, 2009. Newport Beach, CA.
PowerPoint Presentation.
1
Introduction
Ensuring the delivery of high-quality, patient-centered care requires understanding the needs of the populations served. The nation’s health care data infrastructure does not provide the necessary level of detail
to understand which groups are experiencing health care disparities or would benefit from targeted quality
improvement efforts. Categories for collection and methods of aggregation for reporting race, ethnicity,
and language data vary. Challenges to improving data quality include nonstandardized categories, a lack
of understanding of why data are collected, health information technology (HIT) limitations, and a lack
of sufficiently descriptive response categories, among others. Throughout the course of this report, the
subcommittee addresses these challenges as it recommends a standardized approach to eliciting race,
ethnicity, and language data and defines a standard set of categories for these data.
Hennepin County Medical Center in Minneapolis, Minnesota, may very well be one of the Midwest’s most
diverse hospitals. Its patient population includes persons of Somali, Mexican, Ecuadorian, Russian, Vietnamese,
and Bosnian heritage, born in this country or elsewhere, to name but a few of the populations in a state that has
historically been populated by persons identifying themselves as White and of German and Scandinavian origin. As
a March 2009 New York Times profile of the hospital emphasized, each of these ethnic groups brings “distinctive
patterns” of illness, injury, language, and health beliefs (Grady, 2009), all of which affect how health professionals
can best provide safe, timely, effective, patient-centered, efficient, and equitable care, as delineated in the Institute of
Medicine’s 2001 report Crossing the Quality Chasm: A New Health System for the 21st Century (IOM, 2001).
Cultural lifestyle patterns (e.g., food choices and smoking habits) and beliefs about the use of health care
influence the quality of care received regardless of the person’s country of origin, language, immigration status,
or socioeconomic status (SES). The importance of knowing a patient’s race, ethnicity, and language need is not
limited to understanding the issues facing recent immigrants’ health access or outcomes; race, ethnicity, and
language data can reveal risks for health care disparities in native-born as well as foreign-born populations. Such
data ideally allow:
• T
argeted interventions by health plans and health system providers when certain populations have higher
than average or potentially avoidable hospitalizations;
1
14
RACE, ETHNICITY, AND LANGUAGE DATA
• I dentification of differentials in health status, quality of care, and outcomes among populations (even
when insurance status is the same) by agencies such as the Centers for Medicare and Medicaid Services
(CMS);
• Planning of language assistance services to support physicians and other staff that interact directly with
diverse patient populations; and
• D
evelopment of health promotion outreach strategies to specific groups (e.g., outreach efforts to Somali
women who are susceptible to vitamin D deficiency to prevent later, more costly emergency department
visits for diagnosis and pain treatment) by public health departments and health care providers working in
collaboration.
One of the biggest barriers most health systems face in improving quality and reducing disparities within their
own walls is systematically identifying the populations they serve, addressing the needs of these populations, and
monitoring improvements over time. This systematic analysis may reveal no disparities in the delivery of health
care, but that different groups may have different health care needs (e.g., educating Somali women on the need for
vitamin D, earlier cancer screening for racial and ethnic groups at increased risk, addressing ethnocultural beliefs
regarding temperature and onset of childhood asthma among Puerto Ricans, therapeutic strategies to reduce risk
of diabetic kidney disease among Pima Indians) (American Cancer Society, 2009; Grady, 2009; Pachter et al.,
2002; Pavkov et al., 2008). Identification of differences has the ultimate goal of being able to improve the quality
of care for each person to enhance his or her health.
Strong evidence exists that there are disparities in health and the quality of health care received by different populations (AHRQ, 2008; IOM, 2003; Kaiser Family Foundation, 2009). In conceptualizing an approach to
addressing disparities in health care systems, Kilbourne and colleagues describe three critical phases: detection of
disparities, understanding of factors, and development and implementation of interventions (Figure 1-1) (Kilbourne
et al., 2006). The detection phase includes three key components: defining health care disparities, identifying
vulnerable populations, and developing valid measures. The detection phase requires organizations to systematically collect relevant demographic data and to link these data to measures of quality. This phase brings health
systems one step closer to understanding where the disparities (or differential health care needs) exist, which can
lead to understanding why they exist and identifying some of the causal factors. Once systems have detected and
understood disparities, they are better positioned to develop and implement targeted interventions to reduce those
disparities (Kilbourne et al., 2006). The fundamental step is collecting data that adequately describe populations,
allowing for the stratification of quality measures at a level of detail that can identify variation in health and health
care among at-risk groups (Hasnain-Wynia and Rittner, 2008).
FIGURE 1-1 A framework for reducing disparities in health care systems.
SOURCE: Kilbourne et al., 2006.
1
INTRODUCTION
The subcommittee’s task is to develop recommendations on standardized categories of race, ethnicity, and
language data to support the processes of recognizing differential needs in health care, and identifying and reducing
or eliminating disparities. Race, ethnicity, and language information can inform point of care needs, application
of resources, and decisions in patient–provider interactions in ways that improve absolute levels of health care
quality for all. At the microsystem level, physician practices and individual hospitals can use data to understand
the population being served, address disparities in care that exist, and monitor improvements over time. At an
intermediate level, data can be used—for example by health plans or states—to make cross-institutional comparisons to detect variations in quality of care between entities serving similar populations. And at the macro level,
through national reporting and aggregation, population data can indicate where consistent disparities in care exist
nationally (Thomas, 2001).
This chapter provides background on key issues and challenges surrounding the categorization and collection
of race, ethnicity, and language data for health care quality improvement. First, the complexity of defining the
concepts of race and ethnicity is explored. Next, the chapter examines challenges to the collection of these demographic data, the impetus for standardization, the utility of the current Office of Management and Budget (OMB)
race and Hispanic ethnicity categories, and the need for more detailed data on race, ethnicity, and language need.
The chapter concludes by reviewing the subcommittee’s study charge and providing an overview of the remainder
of this report.
DEFINING RACE AND ETHNICITY
The concepts of race and ethnicity are defined socially and culturally and, in the case of federal data collection,
by legislative and political necessity (Hayes-Bautista and Chapa, 1987). OMB, for example, states that race and
ethnicity categories “are social-political constructs and should not be interpreted as being scientific or anthropological in nature” (OMB, 1997a). Scientific findings provide empirical evidence that there is more genetic variation
within than among racial groups; thus, racial categories do not represent major biological distinctions (Cooper
and David, 1986; Williams, 1994; Williams et al., 1994) and instead capture socially constructed intersections of
political, historical, legal, and cultural factors.
People have been racially categorized by the federal government since the first U.S. Census was conducted in
1790 (Bennett, 2000). Since then, the national statistical system has employed a variety of racial categories, most
of which stem from racial classifications that originated in the mid-eighteenth century (Witzig, 1996). Commentators have noted that it is remarkable how little the categories have changed, despite what is now known about
the lack of correlation between racial phenotypes and genetic differences (Cavalli-Sforza et al., 1994; Diamond,
1994; Witzig, 1996).
The complex history of racial identification in the United States (Byrd and Clayton, 2000; Smedley, 1999) results
in concepts of race and ethnicity that not only have changed over time,1 but also are subject to self-perceptions,
which may also change (Ford and Kelly, 2005; Hahn, 1992); technical decisions defining who belongs in which
category; and the perceptions of a person recording another individual’s race. In the latter instance, for example,
individuals who self-identify as American Indians are frequently classified as White by health care workers when
a determination is made by observation alone, without self-report (Izquierdo and Schoenbach, 2000).
Imprecision in defining and using the terms race and ethnicity is apparent in the conflicting and overlapping
terminologies used even by the government bodies responsible for statistical data collection and classification. In
some instruments, the federal government considers race and ethnicity to be distinct concepts (Grieco and Cassidy,
2001); in other instruments, questions on race include racial, national origin, and ethnicity response options. The
term race is often used synonymously with ethnicity, ancestry, nationality, and culture (Williams, 1994; Yankauer,
1987). For example, Census 2000 and 2010 forms ask, “What is this person’s race?” (U.S. Census Bureau,
2009) and provide response categories that blur definitions of race, national origin, and ethnicity. Such practices
1 The 2000 Census: Counting Under Adversity provides an extensive review of the historical development of the racial and ethnic classifications used by the Bureau of the Census. Chapter 3 in Multiple Origins, Uncertain Destinies: Hispanics and the American Future reviews the
origins of Hispanic ethnicity and its relationship to race.
16
RACE, ETHNICITY, AND LANGUAGE DATA
both reflect and reinforce the lack of uniformity in how the term ethnicity is perceived (Macdonald et al., 2005;
Thernstrom et al., 1980). The term Hispanic is often listed alongside terms that define racial groups (e.g., Asian
and White), resulting in many Hispanics beginning to view themselves as a separate race. Thus, when Hispanics
are required to choose a race in addition to their Hispanic ethnicity, many self-identify as “Some other race” (NRC,
2006). The Census Bureau’s definition of “Some other race” is included in Table 1-1.
Race and ethnicity can be important statistical predictors of an individual’s risk for good or poor health outcomes and access to care (NRC, 2004b; Wallman et al., 2000; Williams, 1994). However, a multitude of factors that
are both correlated with and independent of race and ethnicity may affect group differences in health and health
care. The model presented in Figure 1-2 indicates the complex relationships between environmental conditions,
socioeconomic status, discrimination, racism, and health care. In this model, health care (called medical care in
the figure), or lack thereof, is viewed as both a risk factor and resource that impacts an individual’s health status.
Because of the complex relationships depicted in this model, the concepts of race and ethnicity should be dealt
with deliberatively, purposefully, and thoughtfully (Williams et al., 1994).
A 2004 National Research Council committee charged with defining the measurement of racial discrimination
concluded that “race is a salient aspect of social, political, and economic life” and that collecting data on race and
ethnicity is therefore necessary to “monitor and understand differences in opportunities and outcomes for population groups” (NRC, 2004c, p. 33). Thus, while there have been flaws in applying the terms race and ethnicity, the
terms remain important to use in distinguishing the diversity of the U.S. population.
While recognizing a certain lack of precision and consistency in the terms race and ethnicity for defining
population groups that would be unacceptable with any other variable used in scientific inquiry (Kagawa-Singer,
2009), the subcommittee chose to adopt the definitions put forth in the 2003 IOM report Unequal Treatment:
Confronting Racial and Ethnic Disparities in Healthcare. Race is considered a “socioeconomic concept wherein
groups of people sharing certain physical characteristics are treated differently based on stereotypical thinking,
discriminatory institutions and social structures, a shared worldview, and social myths” (IOM, 2003, p. 525). 2 For
the purposes of this report, the subcommittee considers ethnicity to be a concept referring to a shared culture and
way of life, especially reflected in language, religion, and material culture products (IOM, 2003). The subcommittee makes a distinction between the limited OMB and Census Bureau use of the term ethnicity to connote solely
Hispanic ethnicity and the concept of granular ethnicity advanced in this report and further defined in Chapters 2
and 3. Additionally, the subcommittee recognizes that linguistic barriers can present significant challenges to both
patients and providers and thus has adopted a definition of language that is inclusive of communication needs.
This report develops an approach to the collection of data on these key variables and offers a framework of race,
ethnicity, and language categories and questions for the collection and use of these data in health care quality
improvement efforts.
CHALLENGES TO COLLECTING RACE, ETHNICITY, AND LANGUAGE DATA
A variety of entities, such as states, health plans, health professionals, hospitals, community health centers,
nursing homes, and public health departments—as well as the public—play roles in obtaining, sharing, and using
race, ethnicity, and language data. All of these entities, though, have different reasons for and ways of categorizing,
collecting, and aggregating these data. In interviews and testimony before the subcommittee, representatives of
hospitals, health plans, physicians, and custodians of federal health care databases consistently identified several
challenges to improving the quality and availability of race, ethnicity, and language data in patient–provider encounters and at various levels of the health care system (Box 1-1). The principal challenges in obtaining these data for
use in quality improvement assessments include a lack of standardization of categories to foster data sharing and
aggregation (Lurie et al., 2005; Siegel et al., 2007), a lack of understanding of why the data are being collected
2
Other definitions of race abound. For example, OMB states that race and ethnicity should not be interpreted as being primarily biological
or genetic in reference, but rather, thought of in terms of social and cultural characteristics as well as ancestry (OMB, 1997b). The Census
Bureau complies with the OMB standards, noting that the standards “generally reflect a social definition of race recognized in this country.
They do not conform to any biological, anthropological or genetic criteria” (U.S. Census Bureau, 2001).
1
INTRODUCTION
TABLE 1-1 Categories and Definitions Promulgated by the OMB and the U.S. Bureau of the Census
OMB Category
OMB Definition of Category
Census Definition of Category
American Indian or
Alaska Native
A person having origins in any of the original
peoples of North and South America (including
Central America), and who maintains tribal
affiliation or community attachment
People having origins in any of the original peoples
of North and South America (including Central
America), and who maintain tribal affiliation or
community attachment, including, for example,
Rosebud Sioux, Chippewa, or Navajo
Asian
A person having origins in any of the original
peoples of the Far East, Southeast Asia, or the
Indian subcontinent including, for example,
Cambodia, China, India, Japan, Korea, Malaysia,
Pakistan, the Philippine Islands, Thailand, and
Vietnam
People having origins in any of the original peoples
of the Far East, Southeast Asia, or the Indian
subcontinent including, for example, people who
have indicated their race as Asian Indian, Chinese,
Filipino, Korean, Japanese, Vietnamese, Burmese,
Hmong, Pakistani, or Thai
Black or African
American
A person having origins in any of the black
racial groups of Africa. Terms such as “Haitian”
or “Negro” can be used in addition to “Black or
African American”
People having origins in any of the black racial
groups of Africa, including, for example, Black,
African American, Negro, Nigerian, or Haitian
Hispanic or Latino
A person of Mexican, Puerto Rican, Cuban, South A person of Mexican, Puerto Rican, Cuban, South
or Central American, or other Spanish culture
or Central American, or other Spanish culture or
or origin, regardless of race. The term, “Spanish
origin, regardless of race
origin,” can be used in addition to “Hispanic or
Latino”
Native Hawaiian or
Other Pacific Islander
A person having origins in any of the original
People having origins in any of the original peoples
peoples of Hawaii, Guam, Samoa, or other Pacific of Hawaii, Guam, Samoa, or other Pacific Islands,
Islands
including people who identify as Native Hawaiian,
Chamorro, Tahitian, Mariana Islander, or Chuukese
White
A person having origins in any of the original
peoples of Europe, the Middle East, or North
Africa
Some Other Race
People having origins in any of the original peoples
of Europe, the Middle East, or North Africa,
including Irish, German, Italian, Lebanese, Near
Easterner, Arab, or Polish
All other responses not classifiable in the White,
Black or African American, American Indian or
Alaska Native, Asian, and Native Hawaiian or
Other Pacific Islander race categories; respondents
providing write-in entries such as multiracial,
mixed, interracial, “American,” or a Hispanic/
Latino group (e.g., Mexican, Puerto Rican, Cuban)
NOTE: The Indian Health Service uses a narrower definition applicable to Alaska Natives and American Indians that have an affiliation with
a tribal group of the United States to establish eligibility for their programs; thus, it does not include indigenous people of Latin America or
Canada. “Any individual who (1), irrespective of whether he or she lives on or near a reservation, is a member of a tribe, band, or other organized
group of Indians, including those tribes, bands, or groups terminated since 1940 and those recognized now or in the future by the State in which
they reside, or who is a descendent, in the first or second degree, of any such member, or (2) is an Eskimo or Aleut or other Alaska Native, or (3)
is considered by the Secretary of the Interior to be an Indian for any purpose, or (4) is determined to be an Indian under regulations promulgated
by the Secretary” (The Indian Healthcare Improvement Act, Public Law 94-437, 25 U.S.C. 1603(c)-(d)).
SOURCES: OMB, 1997b; U.S. Census Bureau, 2000.
1
RACE, ETHNICITY, AND LANGUAGE DATA
Racism
(racial ideology,
prejudice, or
discrimination)
Social statuses
Macrosocial factors
(historical conditions,
economic structures,
political order, legal
codes, and social
cultural institutions)
Geographic origins &
biological factors
(morphological,
physiological,
biochemical, or genetic)
(race or ethnicity,
socioeconomic status,
sex, social roles,
geographic location,
age)
Biological &
psychological
mechanisms
Health status
Risk factors &
resources
(health behaviors,
stress, medical care,
social ties,
psychological, cultural,
or religious factors)
FIGURE 1-2 Williams, Lavizzo-Mourey, and Warren’s framework for understanding the relationships between race, medical/
health care, and health.
SOURCE: Adapted, with permission, from Public Health Reports 2009. Copyright 1994 Public Health Reports.
(Hasnain-Wynia et al., 2007; Regenstein and Sickler, 2006), a lack of space on collection forms and in collection
systems (Coltin, 2009; Hasnain-Wynia et al., 2007; Ting, 2009), health information technology (HIT) limitations
(e.g., field capacity and linkages among systems) (Coltin, 2009), and the fact that the current OMB categories
are not sufficiently descriptive of locally relevant population groups (Friedman et al., 2000; NRC, 2004b). These
issues, though challenging, are not insurmountable; thus, the subcommittee seeks to identify options for moving
forward and improving the categorization, collection, and aggregation of race, ethnicity, and language data so
BOX 1-1
Barriers to Collection of Race, Ethnicity, and Language Data
System Level
Patient–Provider Encounter
• Lack of standardization of categories
• Lack of standardization of categories
• Lack of understanding why data are
• Lack of understanding why data are collected
collected
• Provided response categories not sufficiently
• Provided response categories not
descriptive for local populations to
sufficiently descriptive to relate to
self-identify with
local populations
• Privacy concerns
• HIT limitations (number of fields,
comparability of categories among systems)
• Space on collection forms (paper or electronic)
• Discomfort on part of person collecting
19
INTRODUCTION
they can be used to stratify quality performance metrics, organize quality improvement and disparity reduction
initiatives, and report on progress.
Standardizing Categories
The reasons for standardizing race, ethnicity, and language categories for data collection for health care quality improvement are four-fold: (1) ensuring that equivalent categories are being collected and compared across
settings; (2) minimizing the reporting burden that arises when multiple entities require different sets of incompatible categories; (3) optimizing the ability to share data across systems of payers, health care settings, government
agencies, and political jurisdictions; and (4) going beyond the OMB categories to develop response options that are
more relevant for the identification of needs for quality improvement. Sharing and comparing data across systems
calls for a common vocabulary to avoid omission of categories that might be critical to monitoring disparities and
to allow mapping of categories from one system to another.
The expansion of electronic health records (EHRs)3 and integration of data systems creates an opportunity to
establish uniform categories and coding practices. Developing linkages among health data systems would provide
a more comprehensive picture of health care quality. Doing so would be greatly facilitated by having the ability
to “read” comparable data from disparate sources, a proposition that requires standardized categories, coding, and
procedures for aggregating granular data to broader categories whenever necessary.
Current Status of National Standards for Categorizing and Collecting Race, Ethnicity, and Language Data
In specifying a system that can provide uniformity and comparability in the collection and use of data by
federal agencies, OMB provides a minimum standard for collecting and presenting data on Hispanic ethnicity and
race (see Box 1-2) (OMB, 1997b). The driving force for the development of this standard in the 1970s was the need
for comparable data for civil rights monitoring; thus the categories reflect legislatively based priorities for data
on particular population groups, including congressionally mandated separate counts of the Hispanic population
(Wallman et al., 2000). Because the standard was not designed with regard to health or health care specifically,
the groups identified by the OMB categories may not be the only analytic groups useful for advancing health care
quality improvement.
The OMB standard was envisioned as a minimum reporting requirement, and more discrete categorization
is encouraged as long as these categories can be rolled up to the six OMB race and Hispanic ethnicity categories
(OMB, 1997a). For example, the Census Bureau and some Department of Health and Human Services (HHS)–sponsored national surveys use the OMB minimum categories plus other categories that can be aggregated into the
minimum categories for analysis and reporting.
No nationally standardized minimum set of languages comparable to the OMB race and Hispanic ethnicity
categories exists. HHS, in conformance with Department of Justice principles to prevent discrimination and to
ensure access to federally funded programs, has provided guidance on the importance of collecting language data
(HHS, 2003) in its Culturally and Linguistically Appropriate Services (CLAS) standards. Four of the 14 standards
are federally mandated for all health care organizations that receive federal funds. These organizations must offer
and provide competent language assistance services and must make documents available in “the languages of the
commonly encountered groups and/or groups represented in the service area.” The CLAS standards do not list language categories to be used for data collection and analysis but seek to ensure the provision of language assistance
services and culturally competent care in all health care settings (Office of Minority Health, 2001).
In agencies that are not federal or organizations that do not receive federal funds or federal contracts, race,
ethnicity, and language data may not be collected because state, local, and private sector data collection is not
universally mandated. Furthermore, those data that are collected do not necessarily adhere to a uniform set of
categories; hospitals, health plans, community health centers, employers, and providers collect data in disparate
ways.
3
EHRs are further defined in Chapter 6 of this report.
20
RACE, ETHNICITY, AND LANGUAGE DATA
BOX 1-2
The 1997 OMB Revisions to the Standards for the
Classification of Federal Data on Race and Hispanic Ethnicity
Hispanic Ethnicity
• Hispanic or Latino origin
• Not of Hispanic or Latino origin
Race
•
•
•
•
•
American Indian or Alaska Native
Asian
Native Hawaiian or Other Pacific Islander
Black or African American
White
Features
• Designed to be minimum categories. Additional categories can be used provided they can be aggregated into the standard categories
• Requires separate collection of Hispanic ethnicity and race data
• Requires Hispanic ethnicity question before race question, when the two-question format is used
• Requires allowance for selection of more than one race category (e.g., “Select one or more”)
• Preference for self-reported race and Hispanic ethnicity
Use of the Standards
• Used at a minimum for all federally sponsored statistical data collections that include data on race
and ethnicity
An Approach to Improving the Categorization and Aggregation of Data
The OMB categories are not sufficiently descriptive to distinguish among locally relevant ethnic populations
that face unique health problems and may have dissimilar patterns of care and outcomes (Hasnain-Wynia and
Baker, 2006). When more detailed data are collected and used locally, aggregation to the OMB categories loses
detailed quality-related information for specific populations. As linkages among quality reporting systems become
more common and allow aggregation of data from multiple sources, consistent methods of identifying subgroups
will facilitate more robust analyses of detailed population data at the local, regional, state, and national levels.
Any national standard list of categories for those subgroups must capture the full diversity of the U.S. population.
The keys to the usefulness of such a list across the country are balancing that comprehensiveness with the desired
level of granularity to describe locally pertinent groups, and resolving any administrative and logistical barriers to
collecting a sufficient number of informative categories to help guide quality improvement.
The three principal means of obtaining race, ethnicity, and language data are self-report, observation, and
indirect estimation. Self-report, which reflects how individuals view themselves, is the widely preferred approach
as it has been adopted by OMB (OMB, 1997b) and is considered by researchers to be the “gold standard” (Higgins
and Taylor, 2009; Wei et al., 2006). The Interagency Committee for the Review of the Racial and Ethnic Standards
reviewed the OMB standards prior to the 1997 revisions and determined that self-report respects “individual dignity” by allowing an individual to determine how he or she classifies himself or herself as opposed to classification
being assigned by another person (OMB, 1997a).
The Health Research and Educational Trust (HRET) Toolkit and the National Health Plan Collaborative
21
INTRODUCTION
(NHPC) have provided guidance on collecting data on race, Hispanic ethnicity, more detailed ethnicity, and language need (Hasnain-Wynia et al., 2007; NHPC, 2008). The HRET Toolkit was recently endorsed by the National
Quality Forum (NQF, 2008); however, the languages are limited to those most common at the national level, it
includes a single “multiracial” category instead of an instruction to allow persons to “Select one or more,” and there
is no “Other, please specify:__” option to capture additional categories with which individuals identify. Therefore,
the framework for categorization and collection spelled out by this report provides a national standard for more
thorough categorization and collection than has previously been put forth.
Addressing the Legality and Understanding the Purposes of Data Collection
The collection of data is impaired when its need is not well understood by health professionals and intake
workers, and especially by patients themselves. Clinicians and administrators too often misperceive legal barriers and furthermore do not expect to see any disparities in their practice. Despite evidence of disparities at all
levels of health and health care systems, hospital executives, physicians, and staff, for example, may believe that
disparities are not a problem in their respective institutions (Weinick et al., 2008). Some worry that soliciting the
information may put them at risk for offending patients, or if disparities are found, for accusations of discrimination (Hasnain-Wynia et al., 2004). Similarly, health plans have been concerned that they could be viewed as subjecting certain populations to discriminatory treatment by asking for such data in advance of enrollment. In fact,
a few states prohibit the acquisition of race and ethnicity data at enrollment, but not thereafter. 4 A 2009 analysis
of federal and state laws found no federal laws or regulations prohibiting health plans from collecting race and
ethnicity data (AHIP, 2009).
The HRET Toolkit, the National Health Law Program (NHeLP), and the HHS Office of Minority Health (OMH)
all emphasize that the collection of race, ethnicity, and language data is permitted under Title VI of the Civil Rights
Act of 1964 and is, in fact, necessary to ensure compliance with the statute (Berry et al., 2001; Hasnain-Wynia et
al., 2007; Perot and Youdelman, 2001).5 The Civil Rights Act requires recipients of federal financial assistance to
collect information that demonstrates compliance, including “racial and ethnic data showing the extent to which
members of minority groups are beneficiaries of and participants in federally-assisted programs.” 6 Furthermore,
a July 2008 law7 mandated the Secretary of HHS to implement the collection of race, ethnicity, and gender data
in the Medicare program in fee-for-service plans, Medicare Advantage private plans, and Part D prescription drug
plans. The American Recovery and Reinvestment Act of 2009 (ARRA)8 also lays out expectations for the collection of race, ethnicity, and language data by specifying the inclusion of these variables in EHRs.
Although the legal basis for the collection of race and ethnicity data is well documented (AHIP, 2009; Perot
and Youdelman, 2001; Rosenbaum et al., 2007; Youdelman and Hitov, 2001) and at least 80 program-specific
statutes require the reporting and collection of race, ethnicity, and language data (Youdelman and Hitov, 2001),
health care organizations may still perceive legal barriers, including concerns about the applicability of Health
Insurance Portability and Accountability Act of 1996 (HIPAA)9 regulations, to collecting, sharing, and reporting
these data. HIPAA restricts the use and disclosure of identifiable health information, but does not limit the collection of demographic data for quality improvement purposes (Kornblet et al., 2008).
A 2007 National Committee on Vital Health Statistics (NCVHS) report addresses the concern of the potential of
harm arising from the use of data enabled by their collection and exchange through HIT. The report acknowledges
the potential for “discrimination, personal embarrassment, and group-based harm” when the data are compiled
and exchanged (NCVHS, 2007, p. 5). The report recommends the protection of all uses of health data by all users
4
California, Maryland, New Hampshire, New Jersey, New York, and Pennsylvania prohibit insurers from requesting an applicant’s race,
ethnicity, religion, ancestry, or national origin in applications, but the states allow insurers to request such information from individuals after
enrollment (AHIP, 2009).
5 A list of legislation relevant to race, ethnicity, and language data is included in Appendix B.
6 The Civil Rights Act of 1964, Public Law 88-352, 78 Stat. 241, 88th Cong., 2d sess. (July 2, 1964).
7 Medicare Improvements for Patients and Providers Act of 200, Public Law 110-275 § 118, 110th Cong., 2d sess. (July 15, 2008).
8 American Recovery and Reinvestment Act of 2009, Public Law 111-5 § 3002(b)(2)(B)(vii), 111th Cong., 1st sess. (February 17, 2009).
9 Health Insurance Portability and Accountability Act of 1996, Public Law 104-191, 104th Cong., 2d sess. (August 21, 1996).
22
RACE, ETHNICITY, AND LANGUAGE DATA
under a framework of data stewardship, a concept that encompasses “the responsibilities and accountabilities
associated with managing, collecting, viewing, storing, sharing, disclosing, or otherwise making use of personal
health information” (AMIA, 2007), and the subcommittee agrees.
Efforts to collect these data may also be hampered by intake workers and patient registration staff who feel
uncomfortable soliciting them from patients, and who feel burdened by collecting data whose importance they do
not understand and cannot adequately explain if patients challenge the need for these data. Patients, meanwhile,
may be hesitant to provide race, ethnicity, and language data because of concerns about privacy and their own
uncertainty as to why these data are needed. Perceived experiences of discrimination in medical care have been
found to be associated with greater apprehension about providing race and ethnicity information among, for
example, Blacks, Hispanics, and Mandarin/Cantonese-speaking Asians (Kandula et al., 2009). Potential health
plan enrollees, for instance, may fear discriminatory access to coverage, while hospital patients may worry that
language questions serve as a proxy for questions about immigration status.
Addressing Health Information Technology (HIT) Issues
Advances in HIT, including recent federal government financing and support, may open doors to advance
data collection. Currently, however, collecting and utilizing race, ethnicity, and language data in health care settings may be complicated by challenges in capturing sufficient data and in linking available data from disparate
sources (Schoenman et al., 2007). For example, many hospitals and physician offices that collect these data enter
them with other demographic characteristics at intake. These demographic data, then, are typically included in
practice management systems, which are separate from the HIT systems that capture clinical information used in
quality measurement.
In many health care settings, space on data collection forms and space constraints in HIT systems can be
barriers to including detailed demographic data (Hasnain-Wynia et al., 2007). For example, while OMB stipulates
the separate collection of race and Hispanic ethnicity data, some legacy HIT systems allow only one field for
capturing both elements. Similarly, some HIT systems are unable to collect the multiple responses that result from
the “Select one or more” approach required by OMB (Coltin, 2009).
Some HIT collection systems utilize drop-down screens and keystroke pattern matching to increase the
number of category choices they can offer. Other paper and electronic systems default to lengthy lists that are
time-consuming for both staff and patients to comb through, or use shorter lists and classify many persons under
an indiscriminant “other” category. Open-ended questions (e.g., “Other, please specify:__”), which allow writein responses, may improve self-identification but can impose additional administrative burdens if labor-intensive
manual coding must be undertaken in the absence of automated systems or optical scanning technology. However,
the use of “Other, please specify:__” as an adjunct check-off box captures respondent answers and is thus useful
to more accurately describing all members in a service population.
STUDY CHARGE AND APPROACH
The IOM, under a contract with the Agency for Healthcare Research and Quality (AHRQ), formed the Subcommittee on Standardized Collection of Race/Ethnicity Data for Healthcare Quality Improvement to report on
the issue of standardization of race, ethnicity, and language variables; define a standard set of race, ethnicity, and
language categories; and define methods of obtaining race, ethnicity, and language data (Box 1-3). To address this
charge, the subcommittee identifies categories and types of questions that allow for the development of uniform
standards for the collection, aggregation, and reporting of race, ethnicity, and language data for quality improvement in health care settings.
The subcommittee’s title and its charge refer specifically to health care but not health in general. The subcommittee recognizes that health care is one element that contributes to people’s health, and that the effects of
race, ethnicity, and language on health in general are important. However, the language in the statement of task,
specifically “in healthcare quality improvement” and “report on quality of care,” led the subcommittee to focus its
discussion and recommendations on the health care domain. In its recommendations regarding the collection of
2
INTRODUCTION
BOX 1-3
Statement of Task: Subcommittee on Standardized Collection of
Race/Ethnicity Data for Healthcare Quality Improvement
A subcommittee of experts will report to the IOM Committee on Future Directions for the National
Healthcare Quality and Disparities Reports regarding the lack of standardization of collection of race and
ethnicity data at the federal, state, local, and private sector levels due to the fact that the federal government has yet to issue comprehensive, definitive guidelines for the collection and disclosure of race and
ethnicity data in healthcare quality improvement. The subcommittee will focus on defining a standard set of
race/ethnicity and language categories and methods for obtaining this information to serve as a standard
for those entities wishing to assess and report on quality of care across these categories. The subcommittee will carry out an appropriate level of detailed, in-depth analysis and description which can be included
in the overall report by the committee and as a separate stand alone report.
race, ethnicity, and language data, the subcommittee emphasizes areas such as care delivery sites (e.g., hospitals,
physician practices) and public and private insurers involved in measuring and improving the quality of health
care. Nonetheless, recommendations can apply to data collection activities in public health (e.g., state-sponsored
immunization registries) when those data can be used to target interventions and resources to ensure equity in
care and health outcomes. The subcommittee’s recommendations include surveys addressing the quality of care
or the utilization of care.
Vital statistics data sets present a special case, since data from birth or death certificates may be linked to data
from health care settings to identify disparities in health care and health outcomes. Knowledge about differentials
in mortality along race and ethnicity lines can help care providers focus inquiries about specific populations to
determine the quality of their care. However, these data collection activities are organized and supported for purposes beyond health care and health care quality improvement, and recommendations set in the narrower context
of health care quality improvement may conflict with other important considerations. The subcommittee did not
focus its discussions on vital statistics data collection processes, nor do its recommendations specifically include
those processes. New national standards have been set for birth and death records, incorporating categories beyond
those set by OMB; states and localities are free to use additional categories and are encouraged to do so along the
lines of the subcommittee’s recommendations.
The subcommittee was formed in conjunction with the Committee on Future Directions for the National
Healthcare Quality and Disparities Reports. The subcommittee met in person four times during the course of the
four-month study and conducted additional deliberations through telephone conferences. It heard public testimony
from a wide range of experts during two public workshops and additional interviews. Staff and committee members
met with and received information from a variety of stakeholders and interested organizations, including health
plans, advocacy groups, health services researchers, and HIT implementation experts.
The subcommittee has approached its task by evaluating the two interrelated purposes and uses of data collection (Figure 1-3): improvements in individual patient–provider care interactions, and system-level improvement. In
patient–provider interactions, effective two-directional communication is essential to the provision of high-quality,
patient-centered care. Quality care can depend on a provider’s identification and understanding of the cultural
beliefs and experiences of his or her patients, and on the expression and understanding of health care needs communicated by patients. Health services researchers have adopted the term cultural competence to describe the
goal of creating a health care system and workforce that are capable of delivering high-quality care to all patients
through an array of efforts, including training of physicians and availability of health care interpreters (Betancourt
et al., 2005). Knowledge of a patient’s race, ethnicity, and language and communication needs can assist in the
24
RACE, ETHNICITY, AND LANGUAGE DATA
TASK
Define a standard set of race, ethnicity, and language categories and
methods for obtaining information
PURPOSE
System Level
To improve population health, health
care quality, and equity
Patient-Provider Level
To improve communication by identifying
and understanding the cultural beliefs
and experiences of racial and ethnic
groups and by the communication of
health care needs and information in the
language the patient best understands
USES
AREAS OF INVESTIGATION
System Level
• Define population being served or not
being served
• Plan for services (e.g., interpreters,
targeted outreach, translation of
materials, cultural competency training)
• Analyze quality metrics by race,
ethnicity, and language
• Adequacy of OMB categories
• Needed level of granularity for race and
ethnicity variables
• Desirability of information on spoken
and written language
• Nomenclature for categories
• Hierarchical rollup for aggregation
• Coding practices
• Key points of leverage
Patient-Provider Level
• Understand if there are patterns in
access and outcomes for different
segments of the patient population
• Save time by having interpretation
services available at visit
• Increase patient and provider
understanding
FIGURE 1-3 Overview of purposes and uses of race, ethnicity, and language data to guide subcommittee’s investigation of
issues of categorization and collection.
provision of patient-centered care by accounting for the “impact of emotional, cultural, social, and psychological
issues on the main biomedical ailment” (Hedrick, 1999, p. 154). At the system level, race, ethnicity, and language
data serve an evidentiary purpose for improving population health, health care quality, and equity by identifying
variations related to these characteristics. System-level analyses include variations across a broad range of health
care entities, including physician practices, community health centers, hospitals, health plans, state government
bodies, and federal agencies.
The subcommittee approached its task by defining two terms in its framework for recommendations; the term
variable refers to the dimensions of race, ethnicity, and language on which is it important to have data; the term
categories refers to the possible discrete groupings of individuals that can occur in any variable. The subcommittee
developed principles to guide its deliberations, including the need for:
• N
omenclature for each variable and its categories that would maximize individuals’ ease and consistency
of identification with those categories;
• L
ocal decision making about categories that would be useful given the size and diversity of the population served or surveyed, as well as the consideration that quality improvement activities tend to be locally
based;
• A
framework that would allow some flexibility in approaches to collection but retain uniform categories,
in recognition of the different capacities of information systems; and
• F
ostering comparability across the variety of actors that collect and use these data.
Building on Previous Studies
In developing its rationale and framework for standardization, the subcommittee considers previous research
on the categorization, collection, and use of race, ethnicity, and language data in health care settings. In 2000,
2
INTRODUCTION
Congress asked the National Academies to assess the ability of HHS data collection systems to measure racial,
ethnic, and socioeconomic disparities. The request resulted in the 2004 National Research Council report Eliminating Health Disparities: Measurement and Data Needs, which recommends actions for HHS to take to ensure the
routine collection and reporting of race and ethnicity data. The report acknowledges the importance of collecting
data on race, ethnicity, socioeconomic status, and language and acculturation for use in making statistical inferences about disparities, but notes the lack of standardized collection and reporting of these data across all entities
(NRC, 2004b).
NCVHS has historically emphasized to its HHS counterparts the necessity and benefits of collecting race,
ethnicity, and language data, among other variables, under the premise that these data are essential to monitoring
the health of the nation (NCVHS, 2001, 2004, 2005). In several reports over the past decade, the NCVHS Subcommittee on Populations has discussed challenges to collecting and using these data. The present report addresses
these data collection challenges and proposes a framework for moving forward with standardized data collection
across all health and health care entities, not just within HHS agencies or by recipients of federal funds. Previous
reports have reiterated the importance of collecting more detailed ethnicity data than are captured by the OMB
standard categories; this report proposes a template of categories so that entities wishing to collect detailed data
can do so in systematic, uniform ways.
Limitations of the Study
Like previous IOM committees, the subcommittee recognizes the linkages among socioeconomic status,
health literacy, and immigration with race, ethnicity, and language; however, these dimensions were beyond the
scope of its charge. Lower socioeconomic status has been associated in the literature with poor health outcomes
and high mortality rates since at least the early twentieth century (Isaacs and Schroeder, 2004; Link and Phelan,
1996; Lutfey and Freese, 2005). Time in the United States and immigration status also have implications for one’s
health and access to health care (Kagawa-Singer, 2006, 2009; Oh et al., 2002; Portes and Hao, 2002; Wadsworth
and Kubrin, 2007).
While the subcommittee focuses exclusively on the categorization of race, ethnicity, and language—as it
was charged to do—it recognizes that some differences in health care among racial, ethnic, and language groups
reflect differences in socioeconomic status, immigration, and health literacy. Studying the roles of these constructs
nevertheless presumes categorizations of race, ethnicity, and language of reasonable credibility and consistency
for patients from whom the data are collected, providers who collect the data, and those analyzing the data for
quality improvement purposes.
While the subcommittee concludes that a full consideration of HIT technicalities is beyond the scope of its
charge, its members are mindful of HIT considerations in its recommendations. The subcommittee also notes the
timeliness and relevance of its work to Section 13001 of ARRA.10 The intersection between the subcommittee’s
work and emerging HIT standards will be further discussed in Chapter 6 of this report.
OVERVIEW OF THE REPORT
The subcommittee is charged with recommending standards for the categorization and collection of race,
ethnicity, and language data. Collection of data at various levels of the health care system implies that the data
must be amenable to reporting and aggregation in consistent ways. To frame how the purposes and uses outlined
in Figure 1-3 could best be met, the subcommittee addresses the following areas:
• D
efining the specific variables to be collected: race (including the applicability of the OMB categories),
ethnicity (whether limited to Hispanic ethnicity or expanded to other groupings), language (whether
encompassing English language proficiency and spoken and/or written language needed for effective
communication);
10
Section 13001 is known as the Health Information Technology for Economic and Clinical Health Act or the HITECH Act.
26
RACE, ETHNICITY, AND LANGUAGE DATA
• D
escribing the nomenclature for each variable to ensure that the categories for each contain as valid and
reliable data as possible;
• Defining a classification system for race and ethnicity that allows a hierarchical rollup so categorical data
can be combined;
• S
uggesting standardized approaches to coding race, ethnicity, and language categories to foster data linkages; and
• Addressing key points of leverage to ensure both patient–provider and system-level improvement.
Chapter 2 reviews the available research on how more discrete categorization of ethnicity can reveal disparities and allow more precise targeting of initiatives for health care quality improvement. Chapter 3 addresses the
utility of the OMB categories in capturing important cultural and social groups for statistical reporting before
considering the collection of more granular ethnicity data and how standard coding of categories can allow for
the sharing of data beyond a single service site. The chapter examines the geographic distribution of racial and
ethnic groups across the United States and the need for balance between nationally uniform categories for data
collection and flexibility in how different subsets of categories are used for local quality improvement. Chapter
4 reviews different approaches germane to the collection of language data, explores the need for data on spoken
and written language, and examines language coding practices. Chapter 5 covers the challenges and barriers faced
by health care organizations and providers of care in collecting these variables. The chapter explores how these
challenges can be addressed through direct collection methods and use of indirect estimation techniques. Chapter
6 examines the role of various entities in informing and shaping the uptake of standardized categories of race,
ethnicity, and language data. The chapter describes the opportunities afforded through the adoption of EHRs and
more integrated HIT systems that are likely to extend the capabilities of health care providers at all levels to collect and use these data systematically.
Race, ethnicity, and language data are tools for fighting discrimination, understanding disparities, and providing culturally and linguistically relevant services (Burdman, 2003). Thus, these data are useful and important for
identifying and, ultimately, acting to reduce and eliminate disparities in health status and health care. These data
alone, however, cannot address how to fix the issues brought to light in Chapter 2. Measurement cannot ensure the
provision of culturally and linguistically appropriate care that incorporates racial and ethnic sensitivities, accommodates diverse views and approaches, and reduces disparities by improving access and quality.
REFERENCES
AHIP (America’s Health Insurance Plans). 2009. A legal perspective for health insurance plans: Data collection on race, ethnicity, and primary
language. Washington, DC: America’s Health Insurance Plans.
AHRQ (Agency for Healthcare Research and Quality). 2008. National Healthcare Disparities Report. Rockville, MD: AHRQ.
American Cancer Society. 2009. Can breast cancer be found early? http://www.cancer.org/docroot/CRI/content/CRI_2_4_3X_Can_breast_
cancer_be_found_early_5.asp (accessed June 13, 2009).
AMIA (American Medical Informatics Association). 2007. Data stewardship definition. http://www.amia.org/files/definition_of_data_stewardship.pdf (accessed July 7, 2009).
Bennett, C. 2000. Racial categories used in the decennial censuses, 1790 to the present. Government Information Quarterly 17(2):161-180.
Berry, E. R., S. Hitov, J. Perkins, D. Wong, and V. Woo. 2001. Assessment of state laws, regulations and practices affecting the collection and reporting of racial and ethnic data by health insurers and managed care plans. Washington, DC: National Health Law Program (NHeLP).
Betancourt, J. R., A. R. Green, J. Emilio Carrillo, and E. R. Park. 2005. Cultural competence and health care disparities: Key perspectives and
trends. Health Affairs 24(2):499-505.
Burdman, P. 2003. Exposing the truth and fiction of racial data. California Journal 11:40-46.
Byrd, W., and L. Clayton. 2000. A medical history of African Americans and the problem of race: Beginnings to 1900, An American health
dilemma, Volume 1. New York: Routledge.
Cavalli-Sforza, L. L., P. Menozzi, and A. Piazza. 1994. The history and geography of human genes. Princeton, NJ: Princeton University Press.
Coltin, K. 2009. Implementation challenges for health plan collection of race, ethnicity & language data. Harvard Pilgrim Health Care. Presentation to the IOM Committee on Future Directions for the National Healthcare Quality and Disparities Reports, February 9, 2009.
Washington DC. PowerPoint Presentation.
Cooper, R., and R. David. 1986. The biological concept of race and its application to public health and epidemiology. Journal of Health Politics,
Policy and Law 11(1):97-116.
Diamond, J. 1994. Race without color. Discover 15:82-89.
INTRODUCTION
2
Ford, M. E., and P. A. Kelly. 2005. Conceptualizing and categorizing race and ethnicity in health services research. Health Services Research
40(5):1658-1675.
Friedman, D. J., B. B. Cohen, A. R. Averbach, and J. M. Norton. 2000. Race/ethnicity and OMB Directive 15: Implications for state public
health practice. American Journal of Public Health 90:1714-1719.
Grady, D. 2009. Foreign ways and war scars test hospital. New York Times, March 28, A1.
Grieco, E. M., and R. C. Cassidy. 2001. Overview of race and Hispanic origin. Washington, DC: U.S. Census Bureau.
Hahn, R. A. 1992. The state of federal health statistics on racial and ethnic groups. JAMA 267(2):268-271.
Hasnain-Wynia, R., and D. W. Baker. 2006. Obtaining data on patient race, ethnicity, and primary language in health care organizations: Current
challenges and proposed solutions. Health Services Research 41(4):1501-1518.
Hasnain-Wynia, R., and S. S. Rittner. 2008. Improving quality and equity in health care by reducing disparities. Chicago, IL: Northwestern
University.
Hasnain-Wynia, R., D. Pierce, and M. A. Pittman. 2004. Who, when, and how: The current state of race, ethnicity, and primary language data
collection in hospitals. New York: The Commonwealth Fund.
Hasnain-Wynia, R., D. Pierce, A. Haque, C. H. Greising, V. Prince, and J. Reiter. 2007. Health Research and Educational Trust Disparities
Toolkit. www.hretdisparities.org (accessed December 18, 2008).
Hayes-Bautista, D. E., and J. Chapa. 1987. Latino terminology: Conceptual bases for standardized terminology. American Journal of Public
Health 77:61-68.
Hedrick, H. L. 1999. Cultural competence compendium. Chicago, IL: American Medical Association.
HHS (U.S. Department of Health and Human Services). 2003. Guidance to federal financial assistance recipients regarding Title VI prohibition against national origin discrimination affecting limited English proficient persons. Washington, DC: U.S. Department of Health &
Human Services.
Higgins, P. C., and E. F. Taylor. 2009. Measuring racial and ethnic disparities in health care: Efforts to improve data collection. Princeton, NJ:
Mathematica Policy Research.
IOM (Institute of Medicine). 2001. Crossing the quality chasm: A new health system for the 21st Century. Washington, DC: National Academy
Press.
———. 2003. Unequal treatment: Confronting racial and ethnic disparities in healthcare. Edited by B. D. Smedley, A. Y. Stith and A. R. Nelson. Washington, DC: The National Academies Press.
Isaacs, S. L., and S. A. Schroeder. 2004. Class: The ignored determinant of the nation’s health. New England Journal of Medicine
351(11):1137-1142.
Izquierdo, J. N., and V. J. Schoenbach. 2000. The potential and limitations of data from population-based state cancer registries. American
Journal of Public Health 90(5):695-698.
Kagawa-Singer, M. 2006. Population science is science only if you know the population. Journal of Cancer Education 21:S22-S31.
———. 2009. Measure of race, ethnicity and culture: Population science isn’t science unless you know the population. UCLA School of Public
Health. Presentation to the IOM Committee on Future Directions for the National Healthcare Quality and Disparities Reports, March 12,
2009. Newport Beach, CA. PowerPoint Presentation.
Kaiser Family Foundation. 2009. Putting women’s health care disparities on the map: Examining racial and ethnic disparities at the state level.
Menlo Park, CA: The Henry J. Kaiser Family Foundation.
Kandula, N., R. Hasnain-Wynia, J. Thompson, E. Brown, and D. Baker. 2009. Association between prior experiences of discrimination and
patients’ attitudes towards health care providers collecting information about race and ethnicity. Journal of General Internal Medicine
24(7):789-794.
Kilbourne, A. M., G. Switzer, K. Hyman, M. Crowley-Matoka, and M. J. Fine. 2006. Advancing health disparities research within the health
care system: A conceptual framework. American Journal of Public Health 96(12):2113-2121.
Kornblet, S., J. Prittsa, M. Goldstein, T. Perez, and S. Rosenbaum. 2008. Policy brief 4: Patient race and ethnicity data and quality reporting: A
legal “roadmap” to transparency. Washington, DC: The George Washington University School of Public Health and Health Services.
Link, B. G., and J. C. Phelan. 1996. Understanding sociodemographic differences in health: The role of fundamental social causes. American
Journal of Public Health 86:471-473.
Lurie, N., M. Jung, and R. Lavizzo-Mourey. 2005. Disparities and quality improvement: Federal policy levers. Health Affairs 24(2):354-364.
Lutfey, K., and J. Freese. 2005. Toward some fundamentals of fundamental causality: Socioeconomic status and health in the routine clinic visit
for diabetes. The American Journal of Sociology 110(5):1326-1372.
Macdonald, S., V. Stone, R. Arshad, and P. de Lima. 2005. Ethnic identity and the Census. http://www.scotland.gov.uk/Resource/Doc/54357/0013571.
pdf (accessed September 2, 2009).
NCVHS (National Committee on Vital and Health Statistics). 2001. Medicaid managed care data collection and reporting. Hyattsville, MD:
U.S. Department of Health and Human Services.
———. 2004. Recommendations on the nation’s data for measuring and eliminating health disparities associated with race, ethnicity, and
socioeconomic position. Hyattsville, MD: U.S. Department of Health and Human Services.
———. 2005. Eliminating health disparities: Strengthening data on race, ethnicity, and primary language in the United States. Hyattsville,
MD: U.S. Department of Health and Human Services.
———. 2007. Enhanced protections for uses of health data: A stewardship framework for ‘secondary uses’ of electronically collected and
transmitted health data. Hyattsville, MD: U.S. Department of Health and Human Services.
2
RACE, ETHNICITY, AND LANGUAGE DATA
NHPC (National Health Plan Collaborative). 2008. Toolkit to reduce racial & ethnic disparities in health care. Washington, DC: National Health
Plan Collaborative.
NQF (National Quality Forum). 2008. National voluntary consensus standards for ambulatory care—measuring healthcare disparities. Washington, DC: National Quality Forum.
NRC (National Research Council). 2004a. The 2000 Census: Counting Under Adversity. Edited by C. F. Citro, D. L. Cork, and J. L. Norwood.
Washington, DC: The National Academies Press.
———. 2004b. Eliminating health disparities: Measurement and data needs. Edited by M. V. Ploeg and E. Perrin. Washington, DC: The National Academies Press.
———. 2004c. Measuring racial discrimination. Edited by R. M. Blank, M. Dabady and C. F. Citro. Washington, DC: The National Academies
Press.
———. 2006. Multiple origins, uncertain destinies: Hispanics and the American future. Edited by M. Tienda and F. Mitchell. Washington, DC:
The National Academies Press.
Office of Minority Health. 2001. National standards for culturally and linguistically appropriate services in health care. Washington, DC: U.S.
Department of Health and Human Services.
Oh, Y., G. F. Koeske, and E. Sales. 2002. Acculturation, stress and depressive symptoms among Korean immigrants in the United States. Journal
of Social Psychology 142:511-526.
OMB (Office of Management and Budget). 1997a. Recommendations from the Interagency Committee for the Review of the Racial and Ethnic
Standards to the Office of Management and Budget concerning changes to the standards for the classification of federal data on race and
ethnicity. Federal Register (3110-01):36873-36946.
———. 1997b. Revisions to the standards for the classification of federal data on race and ethnicity. Federal Register 62:58781-58790.
Pachter, L. M., S. C. Weller, R. D. Baer, J. E. Garcia, A. Garcia, R. T. Trotter, M. Glazer, and R. Klein. 2002. Variation in asthma beliefs and
practices among mainland Puerto Ricans, Mexican-Americans, Mexicans and Guatemalans. Journal of Asthma 39(2):119-134.
Pavkov, M. E., W. C. Knowler, R. L. Hanson, and R. G. Nelson. 2008. Diabetic nephropathy in American Indians, with a special emphasis on
the Pima Indians. Current Diabetes Reports 8:486-493.
Perot, R. T., and M. Youdelman. 2001. Racial, ethnic, and primary language data collection in the health care system: An assessment of federal
policies and practices. New York, NY: The Commonwealth Fund.
Portes, A., and L. Hao. 2002. The price of uniformity: Language, family, and personality adjustment in the immigrant second generation. Ethnic
and Racial Studies 25:889-912.
Regenstein, M., and D. Sickler. 2006. Race, ethnicity, and language of patients: Hospital practices regarding collection of information to address disparities in health care. Princeton, NJ: Robert Wood Johnson Foundation.
Rosenbaum, S., S. Kornblet, and P. C. Borzi. 2007. An assessment of legal issues raised in “high performing” health plan quality and efficiency
tiering arrangements: Can the patient be saved? Washington, DC: The George Washington University School of Public Health and Health
Services.
Schoenman, J. A., J. P. Sutton, A. Elixhauser, and D. Love. 2007. Understanding and enhancing the value of hospital discharge data. Medical
Care Research and Review 64(4):449-468.
Siegel, B., J. Bretsch, V. Sears, M. Regenstein, and M. Wilson. 2007. Assumed equity: Early observations from the first Hospital Disparities
Collaborative. Journal for Healthcare Quality 29(5):11-15.
Smedley, A. 1999. Race in North America: Origin and evolution of a worldview, second edition. Boulder, Colorado: Westview Press.
Thernstrom, S., A. Orlov, and O. Handlin. 1980. Harvard encyclopedia of American ethnic groups, second edition. Boston, MA: Harvard University Press.
Thomas, S. B. 2001. The color line: Race matters in the elimination of health disparities. American Journal of Public Health 91(7):1046-1048.
Ting, G. 2009. Applications of indirect estimation of race/ethnicity data in health plan activities. Wellpoint. Presentation to the IOM Committee on Future Directions for the National Healthcare Quality and Disparities Reports, March 12, 2009. Newport Beach, CA. PowerPoint
Presentation.
U.S. Census Bureau. 2000. State & County QuickFacts. http://quickfacts.census.gov/qfd/meta/long_68184.htm (accessed June 14, 2009).
———. 2001. Questions and answers for Census 2000 data on race. http://www.census.gov/Press-Release/www/2001/raceqandas.html (accessed
April 17, 2009).
———. 2009. United States Census 2010 Form D-1(UL). Washington, DC: U.S. Census Bureau.
Wadsworth, T., and C. E. Kubrin. 2007. Hispanic suicide in U.S. metropolitan areas: Examining the effects of immigration, assimilation, affluence, and disadvantage. The American Journal of Sociology 112(6):1848-1885.
Wallman, K. K., S. Evinger, and S. Schechter. 2000. Measuring our nation’s diversity: Developing a common language for data on race/ethnicity. American Journal of Public Health 90(11):1704-1708.
Wei, I. I., B. A. Virnig, D. A. John, and R. O. Morgan. 2006. Using a Spanish surname match to improve identification of Hispanic women in
Medicare administrative data. Health Services Research 41(4):1469-1481.
Weinick, R. M., K. Flaherty, and S. J. Bristol. 2008. Creating equity reports: A guide for hospitals. Boston, MA: The Disparities Solution Center
at Massachusetts General Hospital.
Williams, D. R. 1994. The concept of race in health services research: 1966 to 1990. Health Services Research 29(3):261-274.
Williams, D. R., R. Lavizzo-Mourey, and R. C. Warren. 1994. The concept of race and health status in America. Public Health Reports
109(1):26-41.
INTRODUCTION
29
Witzig, R. 1996. The medicalization of race: Scientific legitimization of a flawed social construct. Annals of Internal Medicine
125(8):675-679.
Yankauer, A. 1987. Hispanic/Latino: What’s in a name? American Journal of Public Health 77(1):15-17.
Youdelman, M., and S. Hitov. 2001. The current federal landscape in health care regarding the collection and reporting of data on race, ethnicity
and primary language: A survey of the laws, regulations, policies, practices and data collection vehicles. In Racial, ethnic and primary
language data collection: An assessment of federal policies, practices and perceptions, volume 2. Washington, DC: National Health Law
Program (NHeLP).
2
Evidence of Disparities Among Ethnicity Groups
Research studies help provide an understanding of the extent of the health and health care disparities
experienced by different racial and ethnic groups. While the Office of Management and Budget (OMB)
race and Hispanic ethnicity categories can reveal many inequities, they also mask important disparities
in health and health care. More discrete ethnicity groups, based on ancestry, differ in the extent of risk
factors, degree of health problems, quality of care received, and outcomes of care. More granular ethnicity data could inform the development and targeting of interventions to ameliorate disparities in health
care that contribute to poorer health.
The Institute of Medicine’s landmark report on racial and ethnic disparities in health care, Unequal Treatment:
Confronting Racial and Ethnic Disparities in Healthcare, emphasizes the need for standardized collection and
reporting of race and ethnicity data (IOM, 2003). While Unequal Treatment recommends the Office of Management
and Budget (OMB) race and ethnicity categories as the minimum standard by which collected race and ethnicity
data should be parsed and reported, the recommendations go further, calling for better data on racial and ethnic
populations “to reflect the diversity within racial and ethnic populations (e.g., subgroups of Hispanics, African
Americans, Asian Americans, etc.), particularly at the local level” (IOM, 2003, p. 233).
Since the release of Unequal Treatment, evidence of disparities in health and health care among racial categories at the broad OMB level (Black or African American, Asian, Native Hawaiian or Other Pacific Islander
[NHOPI], White, and American Indian or Alaska Native [AIAN]) has continued to be documented. Similarly,
distinct differences continue to be shown between the broad Hispanic and non-Hispanic ethnic categories. For
example, there is more information on varying life expectancy (IOM, 2008) and mortality risks or rates for certain medical conditions (Murthy et al., 2005; Wang et al., 2006), along with knowledge of disparities in general
health status, access to health care, and utilization rates of services among these larger population categories
(AHRQ, 2008a; Cohen, 2008; Flores and Tomany-Korman, 2008; Kaiser Family Foundation, 2008, 2009; Ting
et al., 2008). Even as quality-of-care indicators such as screening for colorectal cancer show improvement for
the overall population, disparities persist among the OMB race and Hispanic ethnicity categories (AHRQ, 2008a,
2008b; Moy, 2009; Trivedi et al., 2005).
In contrast, systematic analysis of similar quality-related data as a function of more discrete ethnic groups
within the OMB categories has hardly progressed. After defining the term granular ethnicity, this chapter summarizes the evidence showing health and health care disparities at more fine-grained levels of ethnic categoriza1
2
RACE, ETHNICITY, AND LANGUAGE DATA
tion. The literature has more to say about ethnicity and disparities in health than about ethnicity and disparities
in health care; this is reflected in the balance of articles reviewed in this chapter. To complement the research
studies, data are also presented for selected population characteristics that can place people at risk of disparities
(e.g., low education levels, poverty, lack of facility with English among those speaking a non-English language
at home, and place of origin).
This focus on literature with respect to more granular detail on subgroups is not to negate the important differences found among the OMB racial groups and for Hispanics compared with non-Hispanics, but to learn more
about where to focus interventions when categorical differences are masked by the OMB categories. Being able
to focus interventions at the more granular level has been posited as a way to use resources most efficiently to
reduce disparities.
Awareness of health and health care disparities has been heightened through the release of multiple documents besides Unequal Treatment, including—Healthy People 2010 and the National Healthcare Disparities
Reports (AHRQ, 2008a; HHS, 2000), and successful initiatives have addressed some disparities using a variety
of approaches. For example, some successful initiatives have applied general quality improvement concepts and
techniques, while others have developed and used culturally sensitive outreach and education materials for health
plan members, and still others have involved training of staff in culturally competent communications. Common to
virtually all successful projects are some fundamental steps, including the acquisition of data on race and ethnicity,
the stratification of quality-of-care data by race and ethnicity, the use of race and ethnicity to identify members
of a target population to whom elements of an intervention would apply, and reanalysis of stratified quality data
to evaluate the impact of the activities. Data on race and ethnicity are a fundamental requirement for disparity
reduction initiatives. Without these data, it is impossible to identify disparities and track the impact of initiatives
over time, and it is difficult to target those aspects of interventions that involve direct contact with individuals.
The presence of data on race and ethnicity does not, in and of itself, guarantee any subsequent actions in terms
of analysis of quality-of-care data to identify disparities or any actions to reduce or eliminate disparities that are
found. The absence of data, however, essentially guarantees that none of those actions will occur.
DEFINING RACIAL AND ETHNIC POPULATIONS IN THE UNITED STATES
The United States is a diverse country whose composition is changing. Table 2-1 shows the results of Census
2000 on the size and percentage distribution of the total U.S. population primarily by the broad OMB racial
and Hispanic ethnic groupings. The Black and Hispanic groups are of equivalent size; the Census has multiple
check-off boxes for specific Hispanic groups (i.e., Mexican, Puerto Rican, Cuban, and a write-in option for other
groups) that it routinely reports, but there are no such more specific check-off boxes under the Black or White
races. Asians and Pacific Islanders have many specific groups listed on the Census form from which to choose as
well. There are efforts to legislatively mandate expansions to the current Census categories (e.g., add Caribbeans
in general and Dominicans specifically).1 The groups included in the OMB race and Hispanic ethnicity categories
are defined in Chapter 1 (see Table 1-1).
Defining Ethnicity
Ethnicity is a concept that the subcommittee, for standardization purposes, distinguishes from race. The term
ethnicity represents a common ancestral heritage that gives social groups a shared sense of identity that exists
even though a particular ethnic group may contain persons who self-identify with different race categories. The
OMB categories use the term ethnicity only in conjunction with Hispanic ethnicity. The U.S. Census captures
data on a few discrete ethnic groups both under the Hispanic ethnicity question, by having check-off boxes for
some Hispanic groups (e.g., Puerto Ricans, Dominicans), and under the race question, by listing some groups of
1
In the first session of the 111th Congress, bills were introduced to include check-off boxes on Census Bureau questionnaires for Dominican
ethnicity (HR 1504 and SB 1084) and for Caribbean ethnicity in general (HR 2071 and SB 1083).
EVIDENCE OF DISPARITIES AMONG ETHNICITY GROUPS
TABLE 2-1 Census 2000 Population by Race and Hispanic Ethnicity
Number
(in millions)
Population Group
Percent of
U.S. Population
Total Population
281.4
100
Hispanic Ethnicitya
Not Spanish, Hispanic, Latino
Spanish, Hispanic, Latino
Mexican, Mexican American, Chicano
Puerto Rican
Cuban
Other Hispanic
246.1
35.2
(20.9)
(3.4)
(1.3)
(9.6)
87.5
12.5
(7.4)
(1.2)
(0.4)
(3.4)
Raceb
One Race
White
Black, African American, or Negro
American Indian or Alaska Native
Asian
Native Hawaiian or Other Pacific Islander
Some Other Race
Two or More Races
211.4
34.7
2.5
10.2
0.4
15.4
6.8
75.1
12.3
0.9
3.6
0.1
5.5
2.4
NOTE: The number and percents on race in this table differ somewhat from later tables in this chapter because later
tables combine persons that report a single race alone or in combination with other races (e.g., persons who are Black
race alone plus multi-race persons who identify with both Black race and another race), whereas this table focuses on
single-race reporting.
a Ramirez, 2004.
b Grieco and Cassidy, 2001.
Asian and Pacific Islander heritage (e.g., Japanese, Samoan) and leaving an option for American Indian and Alaska
Natives to indicate a tribal affiliation.
Where one is born can make a significant difference in access to and use of health care, but the subcommittee
adopts the concept of ethnicity (equated with one’s ancestry) as more encompassing than questions about country
of birth or origin. A person born in the United States might identify culturally with a specific ethnicity in ways
that can affect his or her health-related behaviors and approach to utilizing health services. Also the subcommittee
prefers the use of ethnicity over questions such as national origin because inquiring about national origin could
engender mistrust on the part of respondents that they are being asked about immigration status (Carter-Pokras
and Zambrana, 2006).2
Defining Granular Ethnicity
Granularity means a fine level of detail; the greater the level of granularity, the more finely detailed the data
category is. The subcommittee adopts the term granular ethnicity to describe groups at a more specific level of
categorization than the broad OMB categories, such as the ethnic groups that the Census lists as subgroups in its
Hispanic ethnicity and race questions. The subcommittee, as will be examined in Chapter 3, believes a separate
question on granular ethnicity would complement the OMB categories for race and Hispanic ethnicity without
further intermingling the constructs of race and ethnicity. Additionally, this approach would allow more discrete
categorization of large groups of the population who now have the option only of White or Black on the race
question.
2
Personal communication, O. Carter-Pokras, University of Maryland School of Public Health, April 13, 2009.
4
RACE, ETHNICITY, AND LANGUAGE DATA
The term granular has been used in describing more detailed categories in the Hospital Research & Educational Trust (HRET) Toolkit (Hasnain-Wynia et al., 2007), and the notion of the need for more detailed subgroup
data has been raised in Unequal Treatment and by many others. Kaiser Permanente also uses the term granular
ethnicity in describing its collection of more detailed information beyond the OMB categories (Tang, 2009).
More detailed ethnicity categories provide a useful way of analyzing quality data about the populations served by
providers, health plans, state and federal programs, and others to determine whether there are differential health
needs and disparities in access to and use of appropriate health services. The level of detail for analysis for quality improvement can be influenced by the size of the ethnic population under study; the number or proportion of
those ethnicities that might have a specific condition such as diabetes or be of an age at which immunization for
pneumonia is needed; and the actual associations among ethnicity, other correlated factors (e.g., income, insurance coverage), and quality of care. While there are hundreds of possible ethnic categories, not all will have local
relevance nor always have added value for designing targeted approaches to remediate health care needs. This
report’s recommendations are driven by a need to identify and address quality differentials not simply to collect
information to classify and count people.
OVERVIEW OF DIFFERENTIALS IN CARE AND POTENTIAL
QUALITY IMPROVEMENT INTERVENTIONS
Health is the physical, mental, and functional status of an individual or a population. Health has been shown
to be the result of multiple factors, including nutrition, educational level, socioeconomic level, and lifestyle, and
of the health care that the individual or population receives. Health care comprises the prevention, treatment, and
rehabilitation interventions that are provided to an individual to maintain or improve health. Disparities in health
care (e.g., in access, in the rate at which a treatment is provided when indicated, or in the incidence of adverse
events in care) can be the cause of disparities in health (e.g., in the incidence or severity of a disease, in functional level, or in mortality rate). Therefore, analyses of disparities in health care can help identify opportunities
for quality improvement in care provision that will reduce disparities in health. For the most part, entities use the
same categories of race, ethnicity and language whether data are collected for health or health care purposes so
the connections between health disparities and health care disparities can be drawn more easily.
Illustration of Differences Among Ethnic Groups Within Broad OMB Categories
A study by Blendon and colleagues (2007) illustrates the concept of differences among subgroups residing
in the United States, even after controlling for demographic characteristics such as income, education, age, and
sex. A number of differences in health care service utilization and satisfaction can be seen among more granular
Black, Asian, and Hispanic ethnic groups. Blendon and colleagues’ telephone survey of 4,157 randomly selected
adults in the United States found that fewer Caribbean- and African-born Blacks received any care than U.S.born African Americans in the past year but it was the latter group that rated their care more poorly than Whites.
Certain Hispanic American groups (Mexican and Central/South American Hispanic) and Asian American groups
(Chinese, Korean, and Vietnamese) also received significantly less health care in the last year compared with
Whites, even though other ethnicities within these broad OMB race and ethnicity categories fared as well as
Whites. Native Americans also received less care compared with Whites and less often rated their care as good
or excellent—the lowest rating of any of the groups. Regressions that controlled for demographic characteristics
reduced the number of groups receiving no care in the past year by half, but significant differences remained for
African-born Americans, Mexican Americans, Chinese Americans, and Korean Americans compared with Whites
that were independent of the demographic factors (Blendon et al., 2007). While for some groups the access and
utilization issues may stem from economic challenges, the reality remains that there are differences among ethnic
groups in utilization and ratings of caregiving within the broad OMB categories.
EVIDENCE OF DISPARITIES AMONG ETHNICITY GROUPS
Potential Applications for Quality Improvement
Cooper and colleagues (2002) review a variety of successful interventions, and note that while there are many
well-identified potential opportunities for certain conditions and services, there is a lack of information on “ethnic
subgroups.” They also stress the need to improve the science of evaluating interventions to reduce disparities now
that there is widespread acknowledgment of the existence of inequalities. A fundamental component of improving quality is collecting reliable demographic data to use in focusing attention on where interventions might be
best applied.
Fiscella also observes that, “because disparities in healthcare represent inequities in the process of healthcare,
they are potentially addressable through interventions designed to impact health delivery” (Fiscella, 2007, p. 142).
Entities that collect race and detailed ethnicity data might use them in various ways to examine whether there are
differentials in health care needs and to plan targeted interventions. For example, having read in published research
that certain ethnic groups are at higher risk for cancer mortality and delays in care, a health plan could target educational calls to persons of these ethnic groups to make screening appointments for different site-specific cancers
rather than having to contact a much larger number of persons (Bates et al., 2008). Or a hospital could look at the
characteristics of patients who did not receive care according to evidenced-based protocols for acute myocardial
infarction. Then the hospital could assess whether there were specific barriers that interfered with the appropriate
delivery of care to specific populations and make concerted efforts to remove those barriers. Or the hospital might
also want to take what it learned from that effort to institute strategies that could be applied universally to ensure
that all patients with that condition receive the right care at the right time. Another hospital might be experiencing a
high readmission rate; analysis of its readmission data might reveal a higher than expected rate for a specific ethnic
group. From there, the hospital could determine whether culturally specific interventions at discharge planning are
necessary to prevent unnecessary readmissions, and whether this patient group needs access to regular primary
care. Similarly, a health center might find that women of a certain group are not coming in for prenatal care until
late in their pregnancy; this finding could lead the health center to send community health workers out into the
community to change attitudes and practices related to seeking timely care. Physicians receiving feedback on their
practice patterns might discover that they are not giving the same evidence-based care to all patients, even though
they believe they are, and when this is called to their attention, their practice improves. Fiscella reviews a variety
of quality improvement tools, including reminders, provider feedback, provider education, intensive outreach,
practice guidelines, patient education, cultural competency training, and organizational change/practice redesign
and community-based interventions, and concludes that “the elimination of healthcare disparities will require the
development and implementation of tailored interventions directed at multiple levels. Success will depend on the
vision, leadership commitment, and allocation of resources by government, health plans, hospitals, communities,
and practices…” (2007, p. 164).
The following sections examine further evidence of differences within the aggregate OMB categories. These
studies are illustrative of how more granular ethnicity data reveal more precise opportunities for targeting health
care quality improvement initiatives.3 Notations are made when the studies are controlled for socio-economic
factors when comparing health or health care differences among populations. Statistically significant associations
and trends are emphasized.
HISPANIC OR LATINO GROUPS
In Census 2000, 12.5 percent of the U.S. population (35.2 million people) self-identified as Hispanic, with
persons of Mexican origin representing the largest ethnicity group at almost 60 percent of the Hispanic population
(Ramirez, 2004). Hispanic is the one distinct ethnicity included in the OMB basic categories and is defined by the
Census and OMB as a “person of Mexican, Puerto Rican, Cuban, South or Central American, or other Spanish
3
To identify relevant evidence on health and health care for this chapter, Medline articles were queried using keywords “subgroup,” “subpopulation,” “health disparities,” “racial,” “ethnic,” “Hispanic,” “Latino,” “African,” “Black,” “White,” and “Asian” in various combinations.
Literature since 1997 was scanned and culled, first by title, then abstract, then full text. Reference sections of relevant articles were also
scanned to find other relevant literature.
6
RACE, ETHNICITY, AND LANGUAGE DATA
culture or origin regardless of race” (OMB, 1997; Ramirez, 2004). The question about Hispanic ethnicity used by
the Census includes additional labels, such as Latino and Spanish, to delineate more clearly who is included since
different people identify with one of the terms but not the others.
Demographic Characteristics
This ethnic category usually has been subdivided in the literature according to ancestry or according to regional
designations of South and Central America (Table 2-2).4 From this table, one sees that individual Hispanic groups5
have different characteristics with respect to U.S. nativity, proficiency with English, educational attainment, and
risk of poverty―factors that have been shown to impact the quality of care those populations receive and their health
outcomes. More than 40 percent of most ethnic groups who speak Spanish at home do not speak English very
well, and some groups have almost twice the poverty rate of others (Ramirez, 2004).
Health-Related Differences Among Hispanic or Latino Groups
Differences in dimensions of health and health care among specific Hispanic or Latino populations in the
United States have been identified and studied more extensively than other racial and ethnic populations. The available literature includes studies of health and health care disparities between Hispanic groups by overall self-rated
health, access to care, mental health, cancer and cancer screening, low birthweight, asthma, and cardiovascular
health.
Overall Self-Rated Health
In a national study comparing the overall mental and physical health of multiple Hispanic ethnicity groups,
the Mexican group tended to have better scores on both components of the SF-12 than Whites and other Hispanic
groups, whether those of Mexican ancestry were born in the United States or Mexico (Jerant et al., 2008). The study
is based on cross-sectional analyses of linked data from the 1998–2004 National Health Interview Survey (NHIS)
and the 1999–2005 Medical Expenditure Panel Survey (MEPS); the study population compared four Hispanic
groups—Mexican (13,522 persons), Cuban (778), Puerto Rican (1,360) and Dominican (829) including persons
born in the United States and elsewhere—with 45,422 English-speaking Whites born in the United States. After
regressions adjusting for demographic and socioeconomic variables, those of Cuban ancestry had the worst mental
health scores, while those of Puerto Rican heritage had the worst physical health scores; the scores for Cuban,
Puerto Rican and Dominican groups on both components were worse than Whites. The authors’ suggest that the
“paradox” of better health status among the Mexican group even with low socioeconomic status can mask poorer
health status of other smaller groups of Hispanics when the Hispanic data are examined as one group. The authors
also underscored that the observed ethnic differences within the Hispanic groups on the mental health component
met a criterion for clinical significance.
Access to Health Care Services
Shah and Carrasquillo (2006) used cross-sectional analyses of the Census Bureau’s Current Population Survey
(CPS) to examine differences in insurance coverage, focusing on Hispanic populations. As of 2004, those identifying with the Mexican ethnicity category had the highest rate of uninsurance (35.6 percent), and the Puerto Rican
category the lowest rate (17.6 percent), with Cuban (22.1 percent), Dominican (25.3 percent) and other Hispanic
4
The form for this survey had check-off boxes for three specific categories (Mexican, Puerto Rican, Cuban), followed by a check-off box
for “Other Spanish, Hispanic/Latino,” accompanied by a space for writing in another specific Hispanic origin group. The numerous other
identified subgroups are based on the “other” responses.
5 The Census Bureau allows people of Brazilian heritage to self-identify whether they are Hispanic or not, but the Census does not automatically classify Brazilians who speak Portuguese as Hispanics. About half of Brazilians identified as non-Hispanic in both Census 2000 and the
Current Population Survey (del Pinal and Schmidley, 2000).
20.9
3.4
1.2
1.8
(0.07)
(0.37)
(0.22)
(0.18)
(0.09)
(0.66)
(0.10)
1.4
(0.10)
(0.04)
(0.07)
(0.47)
(0.26)
(0.01)
(0.23)
(0.02)
(0.09)
(0.06)
0.8
0.1
5.5
35.3
281.4
Hispanic Groups
Mexican
Puerto Rican
Cuban
Central American
Costa Ricanc
Guatemalan
Honduran
Nicaraguan
Panamanian
Salvadoran
Other
South American
Argentinean
Bolivian
Chilean
Colombian
Ecuadorian
Paraguayan
Peruvian
Uruguayan
Venezuelan
Other South American
Dominican
Spaniard
Other Hispanicc
Total Hispanic
Total U.S. Population
NA
59.3
9.7
3.5
5.1
(0.2)
(1.1)
(0.6)
(0.5)
(0.3)
(1.9)
(0.3)
4.0
(0.3)
(0.1)
(0.2)
(1.3)
(0.7)
(0.0)
(0.7)
(0.1)
(0.3)
(0.2)
2.2
0.3
15.7
100
Percent of
U.S. Hispanic
Population
31.8
59.8
72.4
59.8
0.3
—
2.0
NA
88.9
23.4
0.5
12.5
58.5
98.6b
31.5
24.5
Native
Born (%)
7.4
1.2
0.4
0.6
Percent of
U.S.
Population
8.1
53.7
25.3
29.8
40.6
47.6
43.1
26.7
45.9
56.8
b
Population 25 and older.
Persons born in Puerto Rico are automatically U.S. citizens. In the case of Puerto Ricans, they are not considered foreign-born.
c Includes general responses such as Hispanic, Spanish, and Latino.
SOURCE: Ramirez, 2004.
a
Number
(in millions)
Speak a Language
Other Than English
at Home and Speak
English Less Than
“Very Well” (%)
TABLE 2-2 Selected Characteristics of the Hispanic/Latino/Spanish Population in the United States
19.6
48.9
23.0
40.0
47.6
23.9
54.2
36.7
37.1
54.0
Less Than
High School
Graduationa (%)
12.4
27.5
12.8
21.5
22.6
15.0
23.5
25.8
14.6
19.9
Poverty Rate (%)
RACE, ETHNICITY, AND LANGUAGE DATA
groups (32.5 percent) having intermediate values (Shah and Carrasquillo, 2006). The socioeconomic profile of
the groups did not always parallel the rate of uninsurance, for example the subgroups with the greatest proportion under 200 percent of poverty were Mexican and Puerto Rican. Weinick and colleagues (2004) using MEPS
data similarly showed that persons identifying with Mexican ethnicity had higher uninsurance rates than Cuban
and Puerto Rican groups, but persons with Central American and Caribbean ethnicities had even higher rates of
uninsurance than the Mexican group.
Additionally, Weinick and colleagues (2004) examined differences in use of four health care services (ambulatory care visits, emergency department [ED] visits, prescription medications, and inpatient hospitalizations).
After controlling for sociodemographics, including income and health insurance coverage, multivariate regression analyses of MEPS data showed that persons of Mexican and Cuban ancestry had lower rates of ED visits
than other Hispanics. Additionally, more recent immigrants were less likely to have made any ambulatory care or
emergency department visits in the past year. The English-speaking subgroups had a higher rate of ED visits and
hospitalizations, and foreign-born Hispanics showed lower rates of ambulatory visits, ED visits, and prescription
medications. Based on these results, the authors concluded that understanding disparities in health care utilization
will require disaggregation of patient demographic data by ethnic groups, language, and length of U.S. residence
(Weinick et al., 2004).
Mental Health
Alegría and colleagues (2007) examined the prevalence of depressive, anxiety, and substance use disorders
among Hispanics living in the United States using data from the National Latino and Asian American Study
(NLAAS).6 Weighted logistic regression analyses controlled for age. In terms of lifetime prevalence, compared
with the comparable Puerto Rican gender group, those of Mexican ethnicity showed lower rates of depressive
disorders whether male or female and lower rates of substance abuse disorders for women, and lower overall
psychiatric disorders for men. Cuban men were less likely to suffer from anxiety disorders and overall psychiatric
disorders. Puerto Ricans tended to have the highest rates of lifetime and past year depressive, anxiety, substance
use, and overall psychiatric disorders. Looking at all Hispanic groups in combination, those with higher English
proficiency were significantly more likely to suffer from overall lifetime or past year psychiatric disorders than
those with fair or poor English skills.
Cancer and Cancer Screening
Gorin and Heck (2005) used the 2000 NHIS to examine data from 5,377 Latinos on the use in the past 12 months
of Pap smears, mammograms, breast self-examinations, and clinical breast exams among women; prostate-specific
antigen (PSA) tests among men; and fecal occult blood tests (FOBT), sigmoidoscopy, colonoscopy, and proctoscopy
among both men and women. Cancer risk factors such as smoking varied by ethnic group (e.g., over 25 percent of
Puerto Rican and “other” Hispanics smoked while 13.9 percent of Dominicans did). For persons of average risk
for cancer (i.e., did not have a personal or family history of cancer), ethnic group variations were apparent in use
of Pap smears and clinical breast exams, but differed less on some tests such as FOBT where use was low for all
groups. Multivariate logistic regression analyses revealed that Dominican women were 2.4 times more likely to
have had mammography than other Latino women. Puerto Rican and the Central or South American groups had
half the rate of colorectal cancer screening by endoscopy of others. Cuban males were five times more likely to
have had a PSA test. Additionally persons with health insurance were 1.5 to 2.2 times as likely to have screening
tests compared with the uninsured. Having visited a doctor in the past year, increased the odds of having screening
tests to a level similar to having insurance, with the exception of PSA screening where the odds were almost five-
6 A survey of 2,554 Latinos aged 18 years and older, half monolingual Spanish, 868 Mexican, 495 Puerto Rican, 577 Cuban, and 614 other
Hispanics. The NLAAS population was similar to the Census 2000 population distribution by gender, age, education, marital status, and
geographic distribution, but differed in terms of nativity and household income.
EVIDENCE OF DISPARITIES AMONG ETHNICITY GROUPS
9
fold greater. Greater acculturation,7 visits to a primary care provider, and use of other screening tests, predicted the
likelihood of Pap smear screening. Clinical breast exam rates were also predicted by greater acculturation, visits to
a primary care provider in the last month, and use of other screening tests, along with having a bachelor’s degree
and a personal history of cancer (Gorin and Heck, 2005).
Using multiple logistic regression analyses of NHIS data pooled from 1990 and 1992, Zambrana (1999) compared the use of three cancer screening practices (Pap smear, mammogram, and clinical breast exam) for five categories of Hispanic women including women who identify as Mexican versus Mexican-American. While Mexican
women were the least likely to have been screened in the past three years, no statistically significant differences
were found in the rates between the Mexican-American (referent group) and any of the other Hispanic groups. In
this study, access measures such as having a usual source of care and knowledge of other clinical cancer screening
techniques were more strongly associated than ethnic or language factors with screening rates for the population
studied (Zambrana et al., 1999). The authors posit that the higher than expected rates of screening in the sample population may be attributable largely to contemporaneous intervention strategies and community outreach to increase
screening among Hispanic women, concluding that such efforts appeared effective and should be expanded.
The National Cancer Institute’s Surveillance, Epidemiology, and End Results (SEER) data from 1992–1995
showed that while all Hispanic women had a greater likelihood of larger tumor size and advanced tumor stage
than non-Hispanic Whites, women born in Latin America had higher odds of large tumors (e.g., larger than 1 cm
and 2 cm) than Hispanic women born in the United States (Hedeen and White, 2001). The researchers were only
able to identify the ethnic subgroup for 38 percent of the Hispanic women in the SEER database.
Low Birthweight
Logistic regressions on 2002 U.S. Natality Detail Data (n = 634,797) showed that after controlling for a variety
of demographic, educational and clinical factors, foreign-born Latino mothers had a lower risk of having low-birthweight infants compared with U.S.-born Latino women. However, nativity patterns among Mexican-origin women
explained these overall trends among Latino women and infants. Foreign-born women with Mexican ethnicity had
about a 21 percent reduced risk of low birthweight, but the same phenomenon was not observed for other Latino
women who were born outside the continental United States (i.e., Puerto Ricans, Cubans, Central/South Americans)
(Acevedo-Garcia et al., 2007). Across each of the three regression models, Puerto Rican women had higher odds
than other Hispanic subgroups of having a low-birthweight infant. The regression models for this study did not
control for income or insurance status.
Asthma
Large differences also exist in asthma burden among Hispanic children. Based on weighted logistic regression
analyses of merged 1997–2001 NHIS data, Puerto Rican children had the highest prevalence (26 percent) and rate
of recent asthma attacks (12 percent) compared with children of Mexican heritage whose prevalence and recent
attack rates were 10 percent and four percent, respectively (Lara et al., 2006). Rates for Cuban and Dominican
ethnicities were intermediate and similar to Black children. Adjusted odds ratios followed the same relative pattern among Hispanic subgroups (e.g., lifetime odds of 2.3 for Puerto Rican children vs. 0.90 for Mexican children
compared with the non-Hispanic White referent group). Birthplace influenced the association between ethnicity
and lifetime asthma diagnosis differently for Puerto Rican and Mexican children. When both Puerto Rican children
and their parents were born in the continental United States, the adjusted odds ratio (OR) was 1.95 (95 percent CI
1.48–2.57) but 2.5 (95 percent CI 1.51–4.13) for those who were island-born; the odds ratios were calculated using
as the referent group U.S.-born non-Hispanic White children whose parents were born in the United States (Lara et
al., 2006). In contrast, U.S.-born Mexican families had a higher adjusted OR for lifetime asthma diagnosis of 1.05
(95 percent CI 0.90–1.22) than the 0.43 (95 percent CI 0.29–0.64) for those born outside of the continental United
States. Similar patterns were observed for recent asthma attacks. Birthplace was the only co-variant that affected
7
Acculturation was measured using a modified Marin Short Acculturation Scale.
40
RACE, ETHNICITY, AND LANGUAGE DATA
the Hispanic subgroup results; numerous factors were considered including family income and insurance status.
Overall Hispanic data mirror the Mexican ethnicity data, thus masking the results for Puerto Rican children.
Cardiovascular Health
Borrell and Crawford used NHIS data (1997–2005) to perform descriptive and logistic regression analyses assessing the strength of association between Hispanic ethnic groups and self-reported hypertension; self-report was based
on the question of whether they had ever been told by a health professional that they had hypertension. Dominican
ethnicity and non-Hispanic Black adults had an adjusted odds ratio of 1.67 and 1.48, respectively, compared with the
referent group of non-Hispanic Whites. Results were adjusted for age, sex, marital status, survey year, U.S. region,
nativity status/length in the United States, health insurance, education, income, and occupation. In contrast, persons of
Cuban, Central or South American, Mexican (whether born in the United States or not), and other Hispanic groups all
had lower odds than non-Hispanic Whites or Blacks or those of Dominican ethnicity (Borrell and Crawford, 2008).
Another study examined hypertension-related mortality rates among women of various Hispanic subgroups
using data from the National Vital Statistics System’s Multiple Cause Mortality Files and further tracked whether
changes occurred over time (1995–1996 to 2001–2002). In 1995–1996, the age-standardized death rate per 100,000
for hypertension-related mortality was higher among the Puerto Rican group (248.5) than for non-Hispanic Whites
(188.7), while Mexican American (185.4), and Cuban (139.7) rates were lower. Over time, the mortality rate
decreased for Puerto Rican (215.5), non-Hispanic White (171.9), and Cuban American (104.6) women, with each
group keeping their relative position. At the same time the rate for Mexican American women increased to 205.5,
now making their risk higher than non-Hispanic White women. The authors suggest the need for strengthening interventions to reach these higher risk ethnicity groups and those who provide their care (Zambrana et al., 2007).
Summary
In the broad Hispanic ethnicity category, more granular ethnicities are associated with different levels on health
indicators and access to and utilization of health care depending on ancestry. The authors of the studies reviewed
in this section stress the importance of not viewing the Hispanic population as monolithic, and they point out the
masking effect that the larger Mexican ethnicity group has on overall statistics when data are viewed to represent
all Hispanic groups as one. Even after adjustment for factors such as insurance, education, and income, many
ethnic differences were found to remain. The authors also comment on how Hispanic populations beyond Mexican,
Cuban and Puerto Rican ethnicity are not well characterized, because in surveys their numbers are small resulting
in heterogeneous groups being lumped into an “other” Hispanic category.
BLACK OR AFRICAN AMERICAN GROUPS
In Census 2000, 12.9 percent of the U.S. population (36.2 million people) self-identified with the Black or
African American category.8 The OMB and Census definition for the Black or African American race category is
“a person having origins in any of the Black racial groups of Africa” (OMB, 1997; U.S. Census Bureau, 2000).
Demographic Characteristics
The Black population, like the AIAN and White populations, is more likely than other groups to be born in
the United States (nearly 94 percent vs. 89 percent for the total U.S. population, as compared with 59.8 percent
of Hispanics, 31.1 percent of Asians, and 80.1 percent of NHOPI). The origins of foreign-born Blacks are as
follows: approximately 59 percent from the Caribbean, 24 percent from Africa, and 13 percent from Central and
8 12.2 percent reported Black alone with the remainder reporting more than one race; of those checking more than one race, the largest
combinations in order were 784,764 reporting both Black and White, followed by 417,249 reporting Black and “Some other race,” generally
Hispanic, and then 182,494 reporting Black and American Indian/Alaska Native.
EVIDENCE OF DISPARITIES AMONG ETHNICITY GROUPS
41
South America (McKinnon and Bennett, 2005). While English is the primary language of 94 percent of Blacks,
nearly one-third of those over age 5 who speak a language other than English at home speak English less than
“very well”; additional detail is provided in Table 2-3 on groups who speak a language other than English at home.
One in four Blacks live in poverty; 14 percent over age 25 have a bachelor’s degree, while 19.6 percent have not
graduated from high school.
Health-Related Differences Among Black or African American Groups
For the most part, few studies subdivide the Black population for study; when they are, the literature has generally subdivided this category into U.S.-born Blacks, Caribbean-born Blacks, and African-born Blacks although
some have distinguished other groups by using additional countries of birth which may not necessarily represent
ethnicity (e.g., born in Europe to African parents). The available literature has examined health and health care
differences among these groups by overall self-rated health, mental health, cancer, low birthweight, and cardiovascular health.
Overall Self-Rated Health
In a study comparing U.S.-born, European-born, African-born, and West-Indian-born Black ethnic groups
aged 18 and older (utilizing merged 2000–2001 NHIS data), groups were examined for differences in self-rated
health status, any self-assessed activity limitation in general and then specifically due to hypertension (Read et
al., 2005b). Multivariate regression analyses adjusted for demographic characteristics and socioeconomic status
including educational attainment, insurance status and income. The study does not distinguish between Blacks
of different ethnicities born in the United States. U.S.- and European-born Blacks had worse ratings on all the
measures compared with those born in Africa or Whites born in the United States. West Indian-born Blacks had
poorer self-rated health status, more activity limitation, and more hypertension-related activity limitation compared
with those born in Africa. European-born Blacks had the worst results of all categories; those who are African
born had the best values. These findings lead the authors to conclude that the health advantage ascribed to Black
immigrants in other studies can be due to the influence of data on African-born groups.
Mental Health
Williams and colleagues (2007) studied mental health among Caribbean Black groups of different ethnicities
as well as African Americans with no Caribbean roots by using data derived from the National Survey of American Life. The Caribbean groups included persons born in the United States as well as those who immigrated to
this country. Caribbean Black women had significantly lower odds than African-American women of suffering
from any mental disorder in terms of either lifetime prevalence or occurrence in the last 12 months. Caribbean
Black men were significantly more likely to suffer from any disorder in the past 12 months but not for lifetime
prevalence compared with U.S. African American men. Among the Caribbean ethnicities, those whose ethnic origins were in Spanish-speaking countries had higher odds of lifetime prevalence of any disorder than those from
English speaking countries. Using first-generation Blacks as the reference group, third-generation immigrants had
greater odds of lifetime prevalence of any disorder. The authors note the importance of understanding associations
between ethnicity and other factors in order to better describe heterogeneous populations, concluding “that the
mental health risk profile of Caribbean Blacks differs from that of other African-Americans. Moreover, the Black
Caribbean immigrant category itself masks considerable heterogeneity” (p. 57) as is illustrated by the differences
exhibited for Spanish- and English-speaking countries of origin.
Rates of Cancer Mortality
Data on differences in cancer mortality rates among Blacks at more granular ethnicity levels are limited. One
study, based on New York City death certificates dating from 1988–1992 linked with U.S. Census data, found that
0.06
0.06
Blacks speaking
Asian and Pacific
Islander languages
at home
Blacks speaking all
other languages at
home
0.2
0.2
2.5
0.02
0.02
0.3
0.5
12.8
NA
8.6
0.6
0.5
3.1
Percent of
U.S.
Population
55.8
67.7
39.6
78.7
92.8
88.9
99.0
30.4
68.3
91.0
Native Born
(%)
24.3
27.6
21.2
38.8
27.7d
19.6
32.3
31.1
21.1
22.4
36.1c
8.1
37.5c
38.5c
29.8c
28.4c
b
Less Than
High School
Graduationb (%)
―c
34.2c
―c
Speak a Language
Other Than English
at Home and Speak
English Less Than
“Very Well” (%)
Black race alone and in combination.
Population 25 and older (20.8 million).
c U.S. Census Bureau, 2006b. Calculations using Census data. Black race alone. Population 5 years and older.
d U.S. Census Bureau, 2006a. Calculations using Census data.
SOURCES: McKinnon and Bennett, 2005, and Subcommittee tabulations from the 2000 Public Use Microdata Sample (PUMS).
a
0.9
Blacks speaking other
Indo-European
languages at home
4.0
100.0
12.8
36.6
285.2
1.5
67.0
4.4
4.2
24.5
Percent of
U.S. Black
Population
24.5
1.6
1.5
9.0
Blacks speaking
Spanish at home
African-American
Afro-Caribbean
African
Other or no ancestry
reported
Total Black
Total U.S. population
Black Groups
Numbera
(in millions)
TABLE 2-3 Selected Characteristics of the Black Population in the United States
28.7
16.7
20.3
30.1
24.3
12.4
23.2
15.5
22.3
29.8
Poverty Rate (%)
42
EVIDENCE OF DISPARITIES AMONG ETHNICITY GROUPS
4
Caribbean-born non-Hispanic Blacks had lower rates than U.S.-born non-Hispanic Blacks for the types of cancer
studied with the exception of prostate cancer. For that, the Caribbean-born group rate was significantly higher
than that of any other group (Fang et al., 1997). The authors posit that differences in the Caribbean diet may be
protective for certain types of cancers such as colon, rectum, and breast. Descriptive statistics indicated that more
Caribbean Blacks graduated from high school, but cancer rates were not adjusted for educational attainment.
Low Birthweight
Pallotto and colleagues (2000) used vital records from Illinois (1985–1990) to assess the low- birthweight distributions for infants born to U.S.-born Black women, Caribbean-born Black women, and U.S.-born White women.
They classified women into low and high risk categories based on reproductive risk factors (e.g., trimester, parity)
and socioeconomic risk factors (e.g., age, education). Even for the lowest risk mothers, there were differences
in relative risks for moderately low birthweight infants (1,500–2,499 g); compared with infants of non-Hispanic
White mothers, the risk for infants delivered of U.S.-born non-Hispanic Black mothers was 2.7 (95 percent CI
2.1–3.4) and for infants delivered of Caribbean-born Black mothers 1.2 (95 percent CI 0.4–3.1). This mirrored the
relative risk profile for delivery of moderately low birthweight infants among all mothers in these ethnic groups
regardless of whether they themselves were assessed as high or low risk for low birthweight outcomes. The relative
risk for very low birthweight infants (less than 1,500 g) was elevated for both groups of Black mothers compared
with non-Hispanic White mothers, but the Black groups were not significantly different from each other. A similar
study of deliveries in Illinois found lower relative risk of low birthweight for infants whose mothers were born
in Africa; in fact, for women classified as low risk on demographics and reproductive factors, the relative risk
was similar for women born in Africa and for U.S. born White women, yet the risk remained high for U.S. born
African-American women (David and Collins, 1997).
Cardiovascular Health
A study by Lancaster and colleagues (2006) used data from the National Health and Nutrition Examination
Survey (NHANES) III to assess differences in dietary intake, coronary heart disease (CHD) risk factors, and
predicted 10-year risk of CHD for subgroups of Black adults (non-Hispanic Blacks born in the United States and
both non-Hispanic and Hispanic Blacks born outside of the United States). Multivariate analyses controlled for
education as a socioeconomic marker as well as for age, sex, and body mass index. The study found that nonHispanic Black, U.S.-born participants had a higher intake of calories and fat; a lower intake of fruits, fiber and
micronutrients; and a higher predicted 10-year risk of developing CHD (5.8 percent) than both immigrant groups
(non-Hispanic Black 3.7 percent, p <0.001; Hispanic Black 4.7 percent, p = 0.017). However, it is notable that there
are differences between the two immigrant groups in terms of their 10-year risk as well. In addition, proportionally more non-Hispanic Black immigrants had elevated fasting glucose, while more Hispanic Blacks had elevated
serum triglycerides and low HDL cholesterol. The authors conclude that there is a need to study dietary and health
differences within the Black population and tailor dietary interventions to subgroups of Blacks.
Summary
In the Black category, U.S.-born Blacks disproportionately suffered worse mental health and cardiovascular
outcomes and were at greater risk for having low-birth-weight infants than Blacks born in the Caribbean or Africa.
A few notable exceptions were found, such as a significantly elevated incidence of prostate cancer among Caribbean
men. The authors of these studies and other studies describe heterogeneity within the Black population in health and
cultural factors such as diet, and the need to continue to examine the Black population in greater detail (Kington
and Nickens, 2001). Differentials have been primarily explored by distinguishing Black populations born in the
United States and elsewhere. Heterogeneity, however, was also described among various immigrant ethnicities.
44
RACE, ETHNICITY, AND LANGUAGE DATA
ASIAN GROUPS
While Census 1990 collected data for the single category “Asian or Pacific Islander,” Census 2000 split the
categories into “Asian” and “Native Hawaiian or Other Pacific Islander,” as required by the 1997 OMB standards.
The Census and OMB definition for who fits into the Asian category includes “people having origins in any of the
original peoples of the Far East, Southeast Asia, or the Indian subcontinent” (OMB, 1997; U.S. Census Bureau,
2000).
Demographic Characteristics
In Census 2000, 4.2 percent of the U.S. population (11.8 million people) self-identified with the Asian category.9 The largest Asian ethnic groupings are listed in Table 2-4. Each group has different characteristics pertaining to amount of time in the United States, English proficiency, educational attainment, and risk of poverty. Many
of Chinese and Japanese ethnicity have lived in the United States for generations, while Vietnamese and Hmong
populations are more often recent immigrants. The median age for Japanese is almost 43 years compared with the
Hmong population, which has a median age of 16 years (Reeves and Bennett, 2004).
Health-Related Differences Among Asian Groups
For the most part, the Asian categories have been subdivided according to country of ancestry, although some
authors also include more general categories (e.g., South Asian). The available literature has examined access to
and utilization of health care, cancer and cancer screening, low birthweight, and asthma outcomes.
Access to and Utilization of Health Care Services
Huang and Carrasquillo (2008) used cross-sectional analyses of CPS data to examine differences in insurance
coverage across the six largest distinct groups of Asian populations in the United States: Chinese, Filipino, Indian,
Korean, Vietnamese, and Japanese. Differences among Asian subgroups in coverage can be greater than the difference between all Asians and non-Hispanic Whites. Persons of Korean heritage had the highest overall proportion
lacking coverage (29.8 percent), followed by 21.5 percent in the Vietnamese group and 16.8 percent in the Chinese
group (Huang and Carrasquillo, 2008). U.S. born-Koreans reported about twice the rate of uninsurance of other
Asian subgroups born in the United States. People of Asian Indian, Filipino, and Japanese heritage had insurance
rates similar or better than those of non-Hispanic Whites. The authors note that insurance expansions based solely
on income may not resolve the higher rates of uninsurance for Koreans who may have incomes too high to qualify
for public programs, but as small business owners find affordability of insurance an issue.
A lack of health coverage can lead to problems in having a usual source of health care. A recent study released
by the Kaiser Family Foundation and the Asian and Pacific Islander American Health Forum found that uninsured
Asians are more than four times as likely to lack a usual source of care compared with insured Asians (Kaiser
Family Foundation and APIAHF, 2008). The same study found that 20 percent of Asian Indians and 21 percent
of those falling into the Other Asian category lack a usual source of care, while Chinese and Filipino Americans
have rates similar to those for non-Hispanic Whites. The percentage of uninsured persons having a doctor’s visit
in the past year also varies among subgroup ethnicities. The differential among Asian American groups—for
example, fewer insured Filipinos lack a usual source of care (7 percent) compared with insured Asian Indians
(13 percent)—is greater than a comparison of the broad Asian category (11 percent) with insured non-Hispanic
Whites (9 percent).
Analyses of NHIS survey data from 2004−2006 reveal differences among Asian subgroups in access and
utilization (CDC, 2008). For example, 25 percent of Korean adults are without a usual source of car, about twice
9 3.6 percent reported Asian alone; Hispanic Asians make up about 1.0 percent of the Asian population. Of those checking more than one
race, the largest combinations in order were Asian and White (0.9 million, 0.3 percent of the total population), Asian and “Some other race”
(0.2 million, 0.1 percent), Asian and NHOPI (0.1 million), and Asian and Black or African American (0.1 million).
Chinese
Filipino
Asian Indian
Vietnamese
Korean
Japanese
Cambodian
Hmong
Laotian
Pakistani
Thai
Other Asiansc
100
NA
23.8
18.3
16.2
10.9
10.5
7.8
1.8
1.7
1.6
1.5
1.1
4.7
Percent of
U.S. Asian
Population
NA
4.21
1.02
0.85
0.66
0.43
0.44
0.41
0.08
0.07
0.07
0.07
0.05
0.20
Percent of
U.S.
Population
31.1
88.9
29.1
32.3
24.6
23.9
22.3
60.5
34.2
44.4
31.9
24.5
22.2
43.5
Native Born (%)
39.5
8.1
49.6
24.1
23.1
62.4
50.5
27.2
53.5
58.6
52.8
31.7
46.9
32.7
Speak a Language
OtherTthan
English at Home
and Speak
English Less
Than “Very Well”
(%)
19.6
19.6
23.0
12.7
13.3
38.1
13.7
8.9
53.3
59.6
49.6
18.0
20.9
19.1
Less Than
High School
Graduationb (%)
12.6
12.4
13.5
6.3
9.8
16.0
14.8
9.7
29.3
37.8
18.5
16.5
14.4
15.6
Poverty Rate
(%)
b
Asian alone and in combination.
Population 25 and older.
c Bangladeshi, Bhutanese, Burmese, Indo Chinese, Indonesian, Iwo Jiman, Malaysian, Maldivian, Nepalese, Okinawan, Singaporean, Sri Lankan, Taiwanese.
SOURCES: Barnes and Bennett, 2002; Reeves and Bennett, 2004.
a
11,859
281,412
2,858
2,385
1,855
1,212
1,226
1,152
212
184
196
209
150
561
Asian Groups
Total Asian
Total U.S. Population
Numbera
(in 000s)
TABLE 2-4 Selected Characteristics of the Asian Population in the United States
4
46
RACE, ETHNICITY, AND LANGUAGE DATA
the rate of other Asian subgroups. Vietnamese adults are more likely to identify a clinic or a health center as their
usual source of care (23 percent) compared with other groups (13–14 percent for Japanese, Asian Indians, and
Filipinos). The Japanese group was more likely than others to receive influenza and pneumonia vaccinations; Asian
Indians are more likely to have received hepatitis B vaccines. A study of Asian and Pacific Islander children using
NHIS data from 1997–2000 showed that children identified as falling into the heterogeneous “other Asian and
Pacific Islander” category were the most likely to lack a usual source of care (6.3 percent) compared with Chinese
(3.8), Filipino children (3.6), Asian Indian (1.9) and non-Hispanic Whites (1.7) (Yu et al., 2004). The poverty rate
was greatest among these categories for the Asian Indian and other Asian and Pacific Islander families, but their
rates of access differed.
Health Status
Asian Americans tend to rate their health status more highly than do other groups, just 11 percent of Asian
Americans rate their health status as fair or poor, compared with 13 percent of non-Hispanic Whites, 18 percent of
Hispanics, 22 percent of African Americans, and 23 percent of American Indians/Alaska Natives (Kaiser Family
Foundation and APIAHF, 2008). Among Asian American ethnic groups, the proportion rating their health status as
fair or poor ranges from 8 percent among those of Japanese ethnicity to 15 percent among those of Vietnamese or
South East Asian extraction. Thus, the difference among some Asian groups is greater than the difference revealed
by simply comparing the rates for all Asian Americans to non-Hispanic Whites.
Cancer and Cancer Screening among Asian Ethnicities
Breast and cervical cancer screening rates are lower for Asian American women than for any other ethnic group
in California. To better understand Asian intragroup differences, Kagawa-Singer and colleagues (2007) used the 2001
California Health Interview Survey to evaluate Pap smear and mammography screening rates for a representative
sample of 2,239 Asian American women. Reported rates of Pap test use for those aged 18 and older ranged from 81
percent (Filipina) to 61 percent (Vietnamese). Reported mammography rates for women aged 40 and older ranged
from 78 percent (Japanese) to 53 percent (Korean). Somewhat surprisingly, Korean and Japanese immigrants with
more than 10 years of U.S. residency had higher rates of Pap screening than their U.S. born counterparts, but this
pattern did not hold up for Korean immigrants on mammogram screening. While trends suggested increased used of
screening with increasing income, the difference was only found to be significant for Chinese Americans utilizing
Pap tests. For women whose income was less than 200 percent of the federal poverty limit (FPL), the Pap screening
rates still varied by ethnicity from 53 percent for Chinese Americans to 78 percent for Filipina Americans. Similarly
among insured women, the range was 64 percent for Vietnamese and Cambodian Americans to 82 percent for Filipina
Americans. Utilization of mammography among women below 200 percent of FPL also varied by ethnicity, from
53 percent for Korean American women to 86 percent among Asian Indian women. Rates for insured women also
varied from 59 percent among Korean Americans to 78 percent among Japanese American women. The authors
stress that “different factors were independently associated with lower screening rates for each group” (p. 706), and
thus it is important to tailor interventions to specific ethnic subgroups.
Asian groups differ with respect to not only screening rates but also mortality. Using data from the California
Cancer Registry, which collects approximately 140,000 new cancer case reports annually, the Kaplan-Meier method
was applied to calculate 5- and 10-year survival probabilities for cervical cancer by Asian subgroup, and the Cox
proportional hazard method was applied for calculating adjusted survival rates (Bates et al., 2008). Among the
California women, once adjusted for age, socioeconomic status, stage, and treatment, the risk of mortality was
found to be significantly lower for all groups compared to non-Hispanic Whites except Chinese and Japanese
women. Of the six groups studied (Chinese, Filipino, Japanese, Korean, South Asian, and Vietnamese), South
Asian women were found to have the highest unadjusted survival rates at both 5 and 10 years (85.8 percent for
both), followed by Korean (85.7 and 82.5 percent), and Vietnamese (82.1 and 79.7 percent) groups, compared with
non-Hispanic Whites (77.5 and 75.4 percent) and Japanese (72.3 and 69.5 percent). Incidence rates are highest
among Vietnamese, Filipino, and Korean ethnic groups and lowest among Chinese, Japanese, and South Asian
EVIDENCE OF DISPARITIES AMONG ETHNICITY GROUPS
4
groups; the authors note that incidence rates tend to mirror rates found in international surveillance reports for
distinct ethnicities with a few exceptions.
The Centers for Disease Control and Prevention (CDC, 2008, p. 2) states that “although cancer mortality rates
for Asian Americans are low compared with other U.S. populations, Asian Americans have the highest incidence
rates of liver and stomach cancer for both sexes compared with Hispanic, non-Hispanic Whites, or non-Hispanic
Blacks” (CDC, 2008). Furthermore, subgroup differences can be illustrated by differential mortality rates for liver
cancer for different Asian ethnicities in California data: specifically 54.3 per 100,000 males for Vietnamese, 33.9
for Korean, 23.3 for Chinese, 16.8 for Filipino, and 9.3 for Japanese compared with a rate of 6.8 for non-Hispanic
White males in the state. Disproportionate risks exist for some Asian subgroups, but not all, for a variety of other
conditions, including chronic obstructive pulmonary disease, chronic hepatitis B, tuberculosis, and diabetes.
Low Birthweight
Comparisons of the birthweight outcomes for two Asian subgroups (Asian Indian and Chinese) were derived
from analysis of the National Center for Health Statistics Natality File for 293,211 singleton births during
1998−2003. Even when the mothers were themselves born in the United States there were ethnic differences in
outcomes. Infants born to Asian Indian mothers were more likely to have a lower mean birthweight as well as higher
proportions of very low birthweight (VLBW) and moderately low birthweight (MLBW) compared with Chinese
mothers, once data were adjusted for age, education, marital status, and parity. Infants born of U.S.-born Asian
Indian mothers were 1.87 times as likely to be VLBW and 1.59 times more likely to be MLBW than infants born
to U.S.-born Chinese mothers. The likelihood of VLBW and MLBW infants was even higher for non-U.S.-born
Asian Indian mothers compared with non-U.S.-born Chinese mothers (Hayes et al., 2008).
Asthma
A large study published by Davis and colleagues (2006) compared asthma prevalence among various Asian
American and Pacific Islander ethnic groups using data from the California Healthy Kids Survey on 462,147 public
school students in the state from school years spanning 2001–2002 and 2002–2003. While the analyses could not
adjust for sociodemographic characteristics beyond grade and gender, the existence of distinct rates among the
groups is clear. Pacific Islander and Filipino groups had higher lifetime prevalence rates for asthma (21.0 and 23.8
percent, respectively) than eight other subgroups (e.g., Korean [10.9 percent], Vietnamese [13.6 percent], Chinese
[14.4 percent], and Asian Indians [16.3 percent]). The authors note that prevalence studies can be influenced
substantially by the composition of the population under study, and recommend more precise categorization by
subgroups for utilization in such studies.
Summary
In the Asian category, differences exist across ethnic groups, and disparities differ on health care and health
measures. For example, Japanese persons appear less likely to experience cancer screening disparities compared
with the reference population, while differences were often noted for Korean, and Vietnamese subgroups. Yet
Japanese women have high cervical cancer mortality. Each study stresses the importance of distinct reporting by
subgroup to illuminate differences in order to tailor responses accordingly. Pooling of data over several years is
often necessary to have a substantial sample to distinguish among subgroups.
NATIVE HAWAIIAN OR OTHER PACIFIC ISLANDER GROUPS
In Census 2000, 0.31 percent of the U.S. population (860,965 people) self-identified with the Native Hawaiian or Other Pacific islander (NHOPI) category.10 This grouping is defined by the Census and OMB as “people
10
0.13 percent (378,782) reported being NHOPI alone.
4
RACE, ETHNICITY, AND LANGUAGE DATA
having origins in any of the original peoples of Hawaii, Guam, Samoa, or other Pacific Islands” (OMB, 1997;
U.S. Census Bureau, 2000).
Demographic Characteristics
The largest NHOPI groups are listed in Table 2-5. Native Hawaiians, Samoans, and Guamanians make up
74 percent of the Pacific Islander population. Fully 80 percent of NHOPIs are native to the United States since
persons born in American Samoa, Guam, or Hawaii are included in the native-born population. Native Hawaiians
fare better on ability to speak English, graduation from high school, and having a lower poverty rate relative to
most of the other Pacific Islander subgroups (Harris and Jones, 2005).
Health-Related Differences Among Native Hawaiian or Other Pacific Islander Groups
The NHOPI group has been subdivided for analysis according to islands of ancestry. Few studies are available for examining this population in greater detail. Philippine Islanders are classified under the Asian category
according the OMB convention; however, some studies examine their health and health care profile along with
groups classified as Pacific Islanders by OMB definition.
Access to and Utilization of Health Care Services
A study using a three-year average from CPS data found that the most recent estimate of uninsurance for the
NHOPI population was 20.5 percent (DeNavas-Walt et al., 2008). Another study found that the level of uninsurance to be 24 percent (Kaiser Family Foundation and APIAHF, 2008). Several studies also note the low health
care utilization rates of Native Hawaiian women compared with other Asian populations (Blaisdell-Brennan and
Goebert, 2001; Van Ta and Chen, 2008).
Cancer among Pacific Islander Groups
Among Pacific Islander groups living in all 17 SEER registry sites of the United States, significant health
disparities have been found for Native Hawaiian and Samoan groups (Goggins and Wong, 2007; Miller et al.,
2008). A study by Goggins and Wong (2007) showed that Samoans were significantly more likely to present with
advanced cancer and had the poorest cause-specific survival of all groups studied, including Native Hawaiians,
other Pacific Islanders, African Americans, Native Americans, and Whites. While all Pacific Islander ethnicities
had poorer cause-specific survival than Whites, Samoan women had an especially elevated risk of mortality from
breast cancer (relative risk [RR] = 3.05, 95 percent CI 2.31–4.02) and Samoan men had an especially elevated
risk of mortality from prostate cancer (RR = 4.82, 95 percent CI 3.38–6.88). Similar findings are presented in a
study by Miller and colleagues (2008), where overall cancer incidence rates were lower for Asians and Pacific
Islanders in the sample (i.e., Asian Indians, Chinese, Filipinos, Guamanians, Japanese, Koreans, Native Hawaiians, Samoans, and Vietnamese) compared with White non-Hispanics in the United States; the one exception was
Native Hawaiian women. The age-adjusted all cancer mortality rate among Asian and Pacific Islander men was
highest for Native Hawaiians (263.7 per 100,000) and Samoans (293.9) in contrast to Guamanians (147.0) and
Asian populations such as Japanese (173.7) or Vietnamese (159.9). The pattern of mortality rates among women
was the same. The authors suggest that the higher risk for poor outcomes among Samoans may be due to failure
to target interventions to small groups whose outcomes are masked when their data are combined with all Pacific
Islander and Asian data.
Summary
Pacific Islander groups are little studied in comparative research, but among those studied, Samoans appear
to suffer disproportionate rates of poor cancer outcomes. Additional data sources indicate that NHOPIs experience
860
281,412
400
128
91
37
14
7
209
(3.3)
(0.6)
(0.1)
(0.5)
(3.4)
(0.2)
(0.2)
(0.7)
(0.7)
(0.4)
(0.2)
(0.2)
(0.03)
(0.02)
(193.6)
100
NA
36.8
22.5
14.6
7.3
2.7
1.5
14.6
Percent of
U.S. NHOPI
NA
0.31
0.14
0.05
0.03
0.01
0.01
―
0.07
Percent of U.S.
Population
80.1
88.9
97.8
79.1
87.6
48.6
22.4
23.9
61.7
Native Born
(%)
14.5
08.1
04.3
19.5
15.4
32.7
25.2
41.4
19.4
Speak a Language
Other Than English
at Home and Speak
English Less Than
“Very Well” (%)
21.7
19.6
16.8
24.2
22.2
34.7
33.2
32.3
23.3
Less Than
High School
Graduationc (%)
17.7
12.4
15.6
20.2
13.7
19.5
10.5
38.3
21.4
Poverty Rate (%)
b NHOPI
for Pacific Islanders living in the U.S. Island Areas of Guam, American Samoa, and the Commonwealth of the Northern Mariana Islands are not included in the count.
alone and in combination.
c Population 25 and older.
d Ethnicities of Other Pacific Islanders from Grieco, 2001a.
SOURCE: Harris and Jones, 2005.
a Data
Total NHOPI
Total U.S. Population
Native Hawaiian
Samoan
Guamanian
Tongan
Fijian
Marshallese
Other Pacific Islander
Tahitiand
Tokelauan
Mariana Islander
Saipanese
Palauan
Carolinian
Kosraean
Pohnpeian
Chuukese
Yapese
I-Kiribati
Papua New Guinea
Solomon Islander
Ni-Vanuatu
Unspecified
NHOPI Groups
Numberb
(in 000s)
TABLE 2-5 Selected Characteristics of the NHOPI Population in the United States a
49
0
RACE, ETHNICITY, AND LANGUAGE DATA
high levels of health disparities compared with other groups in the United States as well. For example, Native
Hawaiians aged 36–65 are nearly 1.5 times as likely to experience heart disease as other racial groups in the United
States (Asian & Pacific Islander American Health Forum, 2006). In California, NHOPI and Filipino adults have
higher rates of obesity and being overweight (70 and 46 percent, respectively) compared with the state average
(34 percent) (Ponce et al., 2009). Native Hawaiians also have the second highest rate of Type II diabetes among
racial groups in the United States (Mau et al., 2001). However, sparse information on Pacific Islander subgroups
may be related to the fact their numbers are proportionately small nationally and thus are not reflected in sufficient
numbers for analysis in national surveys.
WHITE GROUPS
In Census 2000, 77 percent of the U.S. population (216.9 million people) self-identified with the White race
(Grieco, 2001b).11 Because this is the largest racial group in the United States, it heavily influences reported levels
of quality of health and health care achieved in the nation, as well as national rates of indicators, such as poverty.
The OMB definition for the White race is “a person having origins in any of the original peoples of Europe, the
Middle East, or North Africa,” (OMB, 1997) and the Census Bureau definition further elaborates with examples
including Irish, German, Italian, Lebanese, Near Easterner, Arab, or Polish (U.S. Census Bureau, 2000).
Demographic Characteristics
The poverty rate among those of White race alone in 2007 was 10.5 percent, nearly the same as the overall
average rate for Asian and Pacific Islanders but half the rate among Blacks and Hispanics. The national poverty
rate for the total U.S. population as of 2007 was 12.5 percent (DeNavas-Walt et al., 2008). With respect to the
number of persons in poverty, however, there are more Whites (25.1 million) in poverty than Blacks (9.2 million)
and Hispanics (9.9 million) combined. Similarly, as of 2000, White non-Hispanics included a lower percentage
of persons aged 25 and older who did not graduate from high school (14.5 percent) compared with Blacks (27.7
percent) and Hispanics of any race (47.6 percent) (U.S. Census Bureau, 2006a)—a rate that still translates into
19.4 million White non-Hispanics over age 25 without a high school diploma (U.S. Census Bureau, 2003a). The
White population, like the AIAN and Black populations, is more likely to be born in the United States than other
racial groups (Malone et al., 2003). (See Table 2-6.)
Comparative information on different ethnicities within the White population is limited for both demographics and health and health care differences. The Census has published only one in depth analysis of an ancestry
grouping that falls within the White category, and that is of the U.S. Arab population. Three-fifths of the Arab
population is of Lebanese, Syrian, and Egyptian ancestry (de la Cruz and Brittingham, 2003), but Lebanese are
the largest group, consisting of more than a quarter (28.8 percent) of the U.S. Arab population (Brittingham and
de la Cruz, 2005). About half of all Arabs in the country were born here (46.4 percent) (Brittingham and de la
Cruz, 2005). Of those who speak Arabic at home, approximately one in four speak English less than very well.
Sixteen percent of Arabs here over age 25 have not graduated from high school. The overall poverty rate for U.S.
Arab groups (16.7 percent) is somewhat higher than the national rate (12.5 percent) (Brittingham and de la Cruz,
2005); some Arab ancestry groups (e.g., Palestinian, Moroccan, Iraqi) have higher poverty rates. About half of
the Arab population resides in only five states: California, Florida, Michigan, New Jersey, and New York (de la
Cruz and Brittingham, 2003).
11 The number identifying as White alone or in combination was 216.9 million, 211.5 of which were White alone, followed by White in
combination with “Some other race” at 2.2 million, White and AIAN at 1.1 million, White and Asian at 0.9 million, and White and Black at
0.8 million.
4.6
0.2
0.03
2.7a
8.6a
0.4a
0.1a
Whites speaking only English
at home
Whites speaking Spanish at
home
Whites speaking other IndoEuropean languages at home
Whites speaking Asian and
Pacific Islander languages at
home
Whites speaking all other
languages at home
71.2
93.2
0.02
0.1
3.3
1.0
66.7
Percent of
U.S. Population
95.4
88.9
61.5
59.0
46.5
91.5
97.9
Native
Born (%)
41.4 (31.3) c
8.1
29.4c
26.7c
32.9c
46.7c
14.2
19.6
19.0
12.6
23.8
13.6
Speak a Language
Other Than English
at Home and Speak Less Than
English Less Than High School
“Very Well” (%)
Graduationb (%)
8.1
12.4
16.8
10.0
11.6
11.0
Poverty Rate (%)
b
White non-Hispanic alone and in combination, 5 years of age and older.
Population 25 and older (186.8 million).
c U.S. Census Bureau, 2003b, 2006b. Calculations using Census data. 41.4 is the White alone population aged 5 and older, and 31.3 is the White alone, not Hispanic or
Latino figure.
d 262.4 was used as a denominator for this column (U.S. Census Bureau, 2003b).
SOURCES: Grieco, 2001b, and Subcommittee tabulations from the 2000 Public Use Microdata Sample (PUMS).
a
NA
NA
1.4
175.0a
186.8a
281.4
93.7
Number
(in millions)
White Groups Based on
Language Ability
Total White
Total U.S. Population
Percent of U.S.
non-Hispanic
White
Populationd
TABLE 2-6 Selected Characteristics of the White Population in the United States
1
2
RACE, ETHNICITY, AND LANGUAGE DATA
Health-Related Differences Among Select White Groups
While recent research is limited in this area, differences in health care and health outcomes among ethnicities
who categorize themselves as White among the OMB categories have been documented. The sections that follow
review more recent evidence on this topic, with an emphasis on differences found between groups of Arab and
European descent. Reliable data on differences among other ethnic groups within the broad White category could
not be identified, representing an area that could benefit from more study that would be informed by granular
ethnicity data collection.
Self-Reported Health
Naturalized Middle Eastern immigrants reported worse health compared with their non-naturalized Middle
Eastern counterparts in a study based on data from the NHIS. Overall, however, Arab Americans were less likely
to report health-related limitations than U.S.-born Whites of European descent (Read et al., 2005a).
Cancer Screening
Lower rates of mammography have been found among Middle Eastern women than in the population as a
whole. One telephone survey of 365 Arab American women in metropolitan Detroit found that only 70 percent
reported ever having had a mammogram, compared with the overall rate for Michigan of 92.6 percent (Schwartz
et al., 2008). This 70 percent rate is lower than the rate for other racial and ethnic groups nationally for mammograms as well. One group, Lebanese women, was considerably more likely than other groups of Arab women to
have ever had a mammogram. Other predictors of screening among Middle Eastern women in this sample included
being married, having health insurance, and having resided in the United States for 10 or more years (Schwartz
et al., 2008).
Cultural beliefs pertaining to cancer among Middle Eastern immigrants in New York appear to be significantly different from those of their White peers of European descent and can affect their access to optimal care.
In a qualitative study of focus groups designed to explore barriers to cancer care for Arab immigrants, barriers
that emerged included experiences of discrimination, fears of immigration enforcement, and differences in beliefs
surrounding causes of cancer (Shah et al., 2008).
However, another study that examined participation in breast cancer genetic counseling found no correlation between ethnicity of the participants in the study, which included European American women and women
of Ashkenazi Jewish ancestry, and willingness to accept such counseling (Culver et al., 2001). This study did not
control for socioeconomic factors except for level of education attained, because the genetic counseling was being
offered at no charge in order to remove cost and access barriers for the participants.
Preterm Birth
A study found lower rates of preterm birth among mothers of Middle Eastern nativity than among those who
were U.S.-born of Middle Eastern descent and U.S.-born non-Hispanic Whites (El Reda et al., 2007).
Summary
Disparities in health for non-Hispanic Whites compared with other racial groups include high levels of mortality from melanoma, chronic lower respiratory deaths, and prostate cancer, each of which is potentially responsive
to health care interventions (Keppel, 2007). While the data on differences among White subgroups is very limited,
significant differences can be found among persons of Middle Eastern and European descent. International statistics provide some insight into the differences among European nations, which make up the ancestry of significant
portions of the U.S. citizenry as well as the recent immigrant population (Brittenham and de la Cruz, 2004). For
example, life expectancy in Eastern European countries and Russia is lower than in Western Europe (Ginther, 2009;
EVIDENCE OF DISPARITIES AMONG ETHNICITY GROUPS
WHO, 2009). Foodways, the eating practices and customs of a group of people (e.g., lack of vitamin C intake
among Russian men), and high rates of smoking and alcohol consumption all contribute. A high incidence of more
lethal cancers, particularly of lung cancer, is common in Eastern Europe (Bray et al., 2002). Men and women in
these countries also have the highest mortality rates from ischemic heart disease of all the Organisation for Economic Co-operation and Development (OECD) countries (OECD, 2007). Breast cancer incidence and mortality
differs across Europe, being higher in Denmark than other northern European nations (Althuis et al., 2005). These
findings represent very preliminary evidence in favor of the collection and reporting of more granular ethnicity
data separately for White subgroups. It remains to be seen which other White subgroups experience considerable
differences in care or health outcomes, and collecting granular ethnicity data will make the picture clearer.
AMERICAN INDIAN OR ALASKA NATIVE GROUPS
The number and proportion of persons in the American Indian or Alaska Native (AIAN) racial group is heavily influenced by whether the numbers are for AIAN alone or AIAN in combination with other racial groups. In
Census 2000, 2.4 million persons (0.87 percent) in the U.S. population, fell in the AIAN alone group, but AIAN
in combination with other races numbered 4.3 million (1.5 percent of the U.S. population). 12 The Census and the
OMB define the term AIAN as referring to persons with origins in the indigenous persons of North, Central, or
South America (Ogunwole, 2006), while the Indian Health Service (a U.S. Department of Health and Human Services agency responsible for providing federal health services to AIAN persons) uses its own narrower definition,
which is confined to those enrolled in any of the federally or state-recognized tribes within the United States.13
To accommodate these identifications, Census 2000 provided space for a respondent to write in the name of his
or her enrolled or principal tribe or affiliation.
Demographic Characteristics
As in the previous sections, Table 2-7 presents the larger population figures for the AIAN population alone
and in combination with other races, along with variations in English proficiency and poverty rates for selected
tribes. Not displayed in the table is the place of residence of the AIAN populations; one-third of American Indians
live in tribal areas, 2.4 percent in Alaska Native villages, and the remaining 64.1 percent outside of tribal areas.
Outside of tribal areas, 27.2 percent of AIAN individuals over age of 25 have less than a high school education,
compared with 31.8–33.1 percent living in tribal areas (Ogunwole, 2006).
Health-Related Differences Among American Indian or Alaska Native Tribal Groups
In the literature, the AIAN group has been subdivided primarily based on tribal affiliation and/or geographic
location. The available literature has examined health differences among these groups by measures of cancer, endstage renal disease (ESRD), type II diabetes, and metabolic syndrome.
Cancer
Cancer rates among AIAN populations vary and are often misreported because of misclassification of race/
ethnicity data in national AIAN cancer registries (Wiggins et al., 2008). This has posed problems for cancer surveillance, research, and overall public health practice (Johnson et al., 2009; Wiggins et al., 2008). Using population-based cancer registries, Wiggins and colleagues (2008) examined the incidence rates of cancer in AIAN and
non-Hispanic Whites during 1999–2004 and found that national data masks regional and thereby tribal variation.
When combining incidence rates for all cancer sites, AIAN rates were found to be higher than non-Hispanic White
rates in the Northern Plains (538.1 versus 464.8 per 100,000), Southern Plains (492.6 versus 461.2), and Alaska
12
13
The most frequent combinations reported are AIAN and White (1.0 million), AIAN and Black (0.18 million).
The Indian Healthcare Improvement Act, Public Law 94-437, 25 U.S.C. 1603(c)-(d).
b
AIAN alone and in combination.
Population 25 and older.
SOURCE: Ogunwole, 2006.
a
Total AIAN
Total U.S. Population
AI, one tribe
Apache
Cherokee
Chippewa
Choctaw
Creek
Iroquois
Lumbee
Navajo
Pueblo
Sioux
AN, one tribe
Alaskan Athabascan
Aleut
Eskimo
Tlingit-Haida
One or more other specified tribe
Unspecified tribal grouping
AIAN Tribal Groupings
4.32
281.41
2.88
(0.10)
(0.88)
(0.16)
(0.17)
(0.08)
(0.09)
(0.06)
(0.31)
(0.07)
(0.17)
0.12
(0.02)
(0.02)
(0.06)
(0.02)
1.78
1.01
Numbera
(in millions)
NA
Percent of
U.S. AIAN
NA
1.53
1.02
0.04
0.31
0.06
0.06
0.03
0.03
0.02
0.11
0.03
0.06
0.04
0.01
0.01
0.02
0.01
0.45
0.36
Percent of
U.S. Population
10.3
8.1
9.9
12.4
2.0
1.6
4.3
2.4
2.0
0.8
24.5
17.5
3.4
9.3
3.8
3.0
15.7
1.7
Speak a Language
Other Than English
at Home and Speak
English Less Than
“Very Well” (%)
29.1
19.6
27.4
31.0
23.4
22.1
20.4
18.1
20.4
35.3
37.3
23.7
23.8
25.4
24.6
22.5
29.7
17.6
Less Than
High School
Graduationb (%)
TABLE 2-7 Selected Characteristics of the American Indian or Alaska Native (AIAN) Population in the United States
25.7
12.4
25.8
33.9
18.1
23.7
18.5
18.0
19.0
18.2
37.0
29.1
38.9
19.5
22.9
15.0
21.3
15.2
Poverty Rate (%)
4
EVIDENCE OF DISPARITIES AMONG ETHNICITY GROUPS
(511.0 versus 486.8). Rates in the Southwest, Pacific Coast, and the East, however, were found to be lower in
AIANs than non-Hispanic Whites (218.3–308.9 per 100,000 vs. 398.9–574.4 per 100,000, respectively). When
separating by cancer type, lung cancer, and colorectal cancer rates were found to be higher in AIANs than nonHispanic Whites in Alaska and the Northern Plains. Stomach, gallbladder, kidney, and liver cancer rates were also
found to be higher among AIANs than among non-Hispanic Whites overall, in Alaska, in the Plains regions, and
in the Southwest (Wiggins et al., 2008). The analyses were limited to persons living within the Contract Health
Service Delivery Areas of the Indian Health Service.
Kelly and colleagues (2006) found subgroup differences when comparing the cancer incidence rates of American Indians from New Mexico and Alaska.14 Between 1993 and 2002, Alaska Indians had a higher incidence rate
for all cancer sites combined than either New Mexico Indians or U.S. Whites; in-fact, the overall cancer incidence
rate of Alaska Indians was 2.5 times higher than that of New Mexico Indians. The largest variations between the
two Indian groups were found in rates of oral cavity/pharynx, esophagus, colon and rectum, pancreas, larynx, lung,
prostate, and bladder cancer. Differences in esophageal, larynx, prostate, and bladder cancer were found only in
men, while both Alaska Indian men and women had 7 to 10 times higher rates of lung cancer and approximately
two-fold rates of all cancers. Cultural use of tobacco was credited as a major factor in these differences (Kelly et
al., 2006). No data were collected on income in the different populations.
End-Stage Renal Disease
Using data from the U.S. Renal Data System, Hochman and colleagues (2007) examined the prevalence and
incidence of ESRD in 200,000 adult members of the Navajo Nation in Arizona, New Mexico, and Utah. Prevalence and incidence rates are compared for ESRD among all adults in the United States; all Native Americans in
the country; and Native Americans living in Arizona, New Mexico, and Utah and Colorado (outside of the Navajo
Reservation). After adjusting for age, they found that the prevalence of ESRD in the Navajo Nation was 0.63 percent, higher than that in all U.S. adults (0.19 percent) and Native American adults (0.36 percent). However, this
rate was lower than the prevalence among other Native American adults in the Southwest (0.89 percent) (Hochman
et al., 2007). Incidence rates followed the same pattern. The study did not control for socioeconomic status.
Type II Diabetes
Type II diabetes affects a disproportionate number of AIANs; the highest rates in the country are among the
Pima Indians of Arizona (Knowler, 1978). From 1990 to1997, the number of AIANs diagnosed with diabetes
increased dramatically, from 43,262 to 64,474 (Burrows et al., 2000). While documentation of specific tribal differences is limited, Burrows and colleagues found prevalence to vary by region (3.0 percent in the Alaska region
vs. 17.4 percent in the Atlantic region), suggesting tribal differences in population rates of diabetes (Burrows et al.,
2000). Since no socioeconomic data were analyzed in this study, it is difficult to determine whether the regional
differences alone are the underlying cause of the perceived tribal differences in diabetes rates, or regional location
is correlated with other factors that could influence these rates.
Metabolic Syndrome
Often a predictor of diabetes, metabolic syndrome varies widely in prevalence across different AIAN adult
populations. Shumacher and colleagues examined the prevalence of metabolic syndrome 15 among four groups,
including the Navajo Nation from the southwestern United States and three within Alaska (Schumacher et al.,
14
Alaska Native people comprise three major ethnic groups: Eskimo, Indian, and Aleut.
The National Cholesterol Education Program defines metabolic syndrome “by a group of metabolic risk factors in one person…. Abdominal obesity (excessive fat tissue in and around the abdomen); Atherogenic dyslipidemia (blood fat disorders—high triglycerides, low HDL
cholesterol and high LDL cholesterol—that foster plaque buildups in artery walls); Elevated blood pressure; Insulin resistance or glucose
intolerance (the body can’t properly use insulin or blood sugar); Prothrombotic state (e.g., high fibrinogen or plasminogen activator inhibitor-1
in the blood); Proinflammatory state (e.g., elevated C-reactive protein in the blood)” (American Heart Association, 2009).
15
6
RACE, ETHNICITY, AND LANGUAGE DATA
2008). Rates were age-adjusted to the 2000 U.S. adult population and compared with the rates of U.S. Whites,
using NHANES data. Among those from the Navajo Nation, 43.2 percent of men and 47.3 percent of women had
metabolic syndrome. These were much higher than rates in Alaska, where prevalence varied by region among men
from 18.9 percent in western Alaska to 35.1 percent in southeast Alaska, and among women from 22.0 percent in
western Alaska to 38.4 percent in southeast Alaska.
Summary
Studies have shown that disparities exist among AIAN groups. For conditions such as cancer, for which
disparities appear to be even greater when one adjusts for misclassification of race/ethnicity, standardized collection of tribal identification as a granular ethnicity could provide the basis for better, more tailored health care
responses.
SUMMARY
The available evidence on health and heath care disparities among granular ethnic groups in the U.S. population is limited primarily to those groups for which discrete categorization on national survey instruments currently
exists. Many studies include large data sets, often national ones, pooled over multiple years that usually provide
information that is sufficiently powered to support reliable inferences and conclusions. Evidence of health and
heath care disparities among population subgroups is only beginning to emerge and our gaps in knowledge from
the published literature are substantial. This is especially true for groups not captured in national data sets that
may be of interest to local quality improvement efforts. However, the research reviewed in this chapter consistently
finds significant variation across some of subgroups under each of the OMB categories, confirming the utility
of collection and reporting of racial and ethnic data at a group level. Indeed, the need for further disaggregation
beyond OMB race and ethnicity categories was emphasized by authors of many of the studies reviewed (Bilheimer
and Sisk, 2008; Borrell and Crawford, 2008; Canino et al., 2006; Davis et al., 2006; Hayes et al., 2008; Huang
and Carrasquillo, 2008; Jerant et al., 2008; Kagawa-Singer et al., 2007; Lancaster et al., 2006; Read et al., 2005b).
After controlling for socioeconomic conditions, many of these differential effects remain.
The scientific findings in this chapter demonstrate the existence of disparities in health and health care at a
level of categorization that is more detailed than the OMB categories of race and Hispanic ethnicity. Therefore,
the subcommittee concludes that use of the broad OMB categories alone can mask identification of disparities at
the more granular level.
Standardization of categories of granular ethnicity would enable valid comparisons across settings, across
geographic locations, and over time. The level of granularity necessary for analysis will vary according to the
composition of the population being served or studied, whether the size of subgroups is sufficiently large to make
statistically reliable comparisons, and whether the pattern of differences experienced by subgroups identifies distinct needs that are not already revealed by data aggregated into broader categories. A recommendation regarding
how ethnicity data should be collected to help inform improvements in health and health care quality among racial
and ethnic subgroups is discussed in the next chapter.
REFERENCES
Acevedo-Garcia, D., M. J. Soobader, and L. F. Berkman. 2007. Low birthweight among US Hispanic/Latino subgroups: The effect of maternal
foreign-born status and education. Social Science and Medicine 65(12):2503-2516.
AHRQ (Agency for Healthcare Research and Quality). 2008a. National Healthcare Disparities Report. Rockville, MD: AHRQ.
———. 2008b. National Healthcare Quality Report. Rockville, MD: AHRQ.
Alegría, M., N. Mulvaney-Day, M. Torres, A. Polo, Z. Cao, and G. Canino. 2007. Prevalence of psychiatric disorders across Latino subgroups
in the United States. American Journal of Public Health 97(1):68-75.
Althuis, M. D., J. M. Dozier, W. F. Anderson, S. S. Devesa, and L. A. Brinton. 2005. Global trends in breast cancer incidence and mortality
1973-1997. International Journal of Epidemiology 34(2):405-412.
American Heart Association. 2009. Metabolic syndrome. http://www.americanheart.org/presenter.jhtml?identifier=4756 (accessed April 30,
2009).
EVIDENCE OF DISPARITIES AMONG ETHNICITY GROUPS
Asian & Pacific Islander American Health Forum. 2006. Health brief: Native Hawaiians in the United States. San Francisco, CA: Asian &
Pacific Islander American Health Forum.
Barger, S. D., and L. C. Gallo. 2008. Ability of ethnic self-identification to partition modifiable health risk among US residents of Mexican
ancestry. American Journal of Public Health 98(11):1971-1978.
Barnes, J. S., and C. E. Bennett. 2002. The Asian population: 2000. Washington, DC: U.S. Census Bureau.
Bates, J. H., B. M. Hofer, and A. Parikh-Patel. 2008. Cervical cancer incidence, mortality, and survival among Asian subgroups in California,
1990-2004. Cancer 113(10 Suppl.):2955-2963.
Bilheimer, L. T., and J. E. Sisk. 2008. Collecting adequate data on racial and ethnic disparities in health: The challenges continue. Health Affairs
27(2):383-391.
Blaisdell-Brennan, H. K., and D. Goebert. 2001. Health care utilization among women on O’ahu: Implications for Native Hawaiian women.
Pacific Health Dialog 8(2):274-279.
Blendon, R. J., T. Buhr, E. F. Cassidy, D. J. Perez, K. A. Hunt, C. Fleischfresser, J. M. Benson, and M. J. Herrmann. 2007. Disparities in health:
Perspectives of a multi-ethnic, multi-racial America. Health Affairs 26(5):1437-1447.
Borrell, L. N., and N. D. Crawford. 2008. Disparities in self-reported hypertension in Hispanic subgroups, non-Hispanic Black and nonHispanic White adults: The National Health Interview Survey. Annals of Epidemiology 18:803-812.
Bray, F., R. Sankila, J. Ferlay, and D. M. Parkin. 2002. Estimates of cancer incidence and mortality in Europe in 1995. European Journal of
Cancer 38(1):99-166.
Brittingham, A., and G. P. de la Cruz. 2005. We the people of Arab ancestry in the United States. Washington, DC: U.S. Census Bureau.
Burrows, N. R., L. S. Geiss, M. M. Engelgau, and K. J. Acton. 2000. Prevalence of diabetes among Native Americans and Alaska Natives, 19901997: An increasing burden. Diabetes Care 23(12):1786-1790.
Canino, G., D. Koinis-Mitchell, A. N. Ortega, E. L. McQuaid, G. K. Fritz, and M. Alegría. 2006. Asthma disparities in the prevalence, morbidity,
and treatment of Latino children. Social Science and Medicine 63:12:2926-2937.
Carter-Pokras, O., and R.E. Zambrana. 2006. Collection of legal status information: Caution! American Journal of Public Health 96(3):399.
CDC (Centers for Disease Control and Prevention). 2008. Health characteristics of the Asian adult population: United States, 2004–2006.
http://www.cdc.gov/nchs/data/ad/ad394.pdf (accessed June 15, 2009).
Cohen, L. L. 2008. Racial/ethnic disparities in hospice care: A systematic review. Journal of Palliative Medicine 11(5):763-768.
Cooper, L. A., M. N. Hill, and N. R. Powe. 2002. Designing and evaluating interventions to eliminate racial and ethnic disparities in health care.
Journal of General Internal Medicine 17:477-486.
Culver, J., W. Burke, Y. Yasui, S. Durfy, and N. Press. 2001. Participation in breast cancer genetic counseling: The influence of educational level,
ethnic background, and risk perception. Journal of Genetic Counseling 10(3):215-231.
David, R. J., and J. W. Collins. 1997. Differing birth weight among infants of U.S.-born Blacks, African-born Blacks, and U.S.-born Whites.
New England Journal of Medicine 337(17):1209-1214.
Davis, A. M., R. Kreutzer, M. Lipsett, G. King, and N. Shaikh. 2006. Asthma prevalence in Hispanic and Asian American ethnic subgroups:
Results from the California Healthy Kids Survey. Pediatrics 118(2):e363-e370.
de la Cruz, G. P., and A. Brittingham. 2003. The Arab population: 2000. Washington, DC: U.S. Census Bureau.
del Pinal, J. and D. Schmidley. 2005. Matched race and Hispanic origin responses from Census 2000 and Current Population Survey February
to May 2000. Working paper 79. Washington DC: U.S. Census Bureau.
DeNavas-Walt, C., B. D. Procter, and J. Smith. 2008. Current populations report. Income, poverty, and health insurance coverage in the United
States: 200. Washington, DC: U.S. Census Bureau.
El Reda, D. K., V. Grigorescu, S. F. Posner, and A. Davis-Harrier. 2007. Lower rates of preterm birth in women of Arab ancestry: An epidemiologic paradox–Michigan, 1993-2002. Maternal and Child Health Journal 11(6):622-627.
Fang, J., S. Madhavan, and M. H. Alderman. 1997. Influence of nativity on cancer mortality among Black New Yorkers. Cancer
80(1):129-135.
Fiscella, K. 2007. Eliminating disparities in healthcare through quality improvement. In Eliminating healthcare disparities in America: Beyond
the IOM report, edited by Williams, R. A. Totawa, NJ: Humana Press, Inc.
Flores, G., and S. C. Tomany-Korman. 2008. Racial and ethnic disparities in medical and dental health, access to care, and use of services in
US children. Pediatrics 121(2):e286-e298.
Ginther, E. 2009. Diets of Central Europeans and Russians. http://www.faqs.org/nutrition/Ca-De/Central-Europeans-and-Russians-Dietsof.html (accessed June 16, 2009).
Goggins, W. B., and G. K. Wong. 2007. Poor survival for US Pacific Islander cancer patients: Evidence from the Surveillance, Epidemiology,
and End Results Database: 1991 to 2004. Journal of Clinical Oncology 25(36):5738-5741.
Gorin, S. S., and J. E. Heck. 2005. Cancer screening among Latino subgroups in the United States. Preventive Medicine 40(5):515-526.
Grieco, E. M. 2001a. The Native Hawaiian and Other Pacific Islander population: 2000. Washington, DC: U.S. Census Bureau.
———. 2001b. The White population: 2000. Washington, DC: U.S. Census Bureau.
Grieco, E. M., and R. C. Cassidy. 2001. Overview of race and Hispanic origin. Washington, DC: U.S. Census Bureau.
Harris, P. M., and N. A. Jones. 2005. We the people: Pacific Islanders in the United States. Washington, DC: U. S. Census Bureau.
Hasnain-Wynia, R., D. Pierce, A. Haque, C. H. Greising, V. Prince, and J. Reiter. 2007. Health Research and Educational Trust Disparities
Toolkit. www.hretdisparities.org (accessed December 18, 2008).
Hayes, D. K., S. L. Lukacs, and K. C. Schoendorf. 2008. Heterogeneity within Asian subgroups: A comparison of birthweight between infants
of US and non-US born Asian Indian and Chinese mothers. Maternal and Child Health Journal 12:549–556.
RACE, ETHNICITY, AND LANGUAGE DATA
Hedeen, A. N., and E. White. 2001. Breast cancer size and stage in Hispanic American women, by birthplace: 1992-1995. American Journal of
Public Health 91(1):122-125.
HHS. 2000. Healthy People 2010: Understanding and improving health. Washington, DC: U.S. Department of Health and Human Services.
Hochman, M. E., J. P. Watt, R. Reid, and K. L. O’Brien. 2007. The prevalence and incidence of end-stage renal disease in Native American
adults on the Navajo reservation. Kidney International 71(9):931-937.
Huang, K., and O. Carrasquillo. 2008. The role of citizenship, employment, and socioeconomic characteristics in health insurance coverage
among Asian subgroups in the United States. Medical Care 46(10):1093–1098.
IOM (Institute of Medicine). 2003. Unequal treatment: Confronting racial and ethnic disparities in healthcare. Edited by Smedley, B. D., A. Y.
Stith and A. R. Nelson. Washington, DC: The National Academies Press.
———. 2008. Challenges and successes in reducing health disparities: Workshop summary. Washington, DC: The National Academies Press.
Jerant, A., R. Arellanes, and P. Franks. 2008. Health status among US Hispanics: Ethnic variation, nativity, and language moderation. Medical
Care 46(7):709-717.
Johnson, J. C., A. S. Soliman, D. Tadgerson, G. E. Copeland, D. A. Seefeld, N. L. Pingatore, R. Haverkate, M. Banerjee, and M. A. Roubidoux.
2009. Tribal linkage and race data quality for American Indians in a state cancer registry. American Journal of Preventive Medicine
36(6):549-554.
Kagawa-Singer, M., N. Pourat, N. Breen, S. Coughlin, T. A. McLean, T. S. McNeel, and N. Ponce. 2007. Breast and cervical cancer screening
rates of subgroups of Asian American women in California. Medical Care Research and Review 64(6):706-730.
Kaiser Family Foundation and Asian & Pacific Islander American Health Forum (APIAHF). 2008. Race, ethnicity and health care: Fact sheet.
Health coverage and access to care among Asian Americans, Native Hawaiians and Pacific Islanders. Menlo Park, CA: The Henry J.
Kaiser Family Foundation.
———. 2009. Putting women’s health care disparities on the map: Examining racial and ethnic disparities at the state level. Menlo Park, CA:
The Henry J. Kaiser Family Foundation.
Kelly, J. J., A. P. Lanier, S. Alberts, and C. L. Wiggins. 2006. Differences in cancer incidence among Indians in Alaska and New Mexico and
U.S. Whites, 1993-2002. Cancer Epidemiology, Biomarkers and Prevention 15(8):1515-1519.
Keppel, K. G. 2007. Ten largest racial and ethnic health disparities in the United States based on Healthy People 2010 objectives. American
Journal of Epidemiology 166(1):97-103.
Kington R.S. and H.W. Nickens. 2001. Racial and ethnic differences in health: recent trends, current patterns, future directions. In America
becoming: racial trends and their consequences Vol. II, edited by Smelser, N.J., W.J. Wilson, and F. Mitchell. Washington, DC: National
Research Council.
Knowler, W. C., P. H. Bennett, R. F. Hamman, and M. Miller. 1978. Diabetes incidence and prevalence in Pima Indians: A 19-fold greater incidence than in Rochester, Minnesota. American Journal of Epidemiology 108(6):497-505.
Lancaster, K. J., S. O. Watts, and L. B. Dixon. 2006. Dietary intake and risk of coronary heart disease differ among ethnic subgroups of Black
Americans. Journal of Nutrition 136:446-451.
Lara, M., L. Akinbami, G. Flores, and H. Morgenstern. 2006. Heterogeneity of childhood asthma among Hispanic children: Puerto Rican children bear a disproportionate burden. Pediatrics 117(1):43-53.
Malone, N., K. F. Baluja, J. M. Costano, and C. J. Davis. 2003. The foreign-born population: 2000. Washington, DC: U.S. Census Bureau.
Mau, M. K., K. Glanz, R. Severino, J. S. Grove, B. Johnson, and J. D. Curb. 2001. Mediators of lifestyle behavior change in Native Hawaiians.
Diabetes Care 24(10):1770-1775.
McKinnon, J. D., and C. E. Bennett. 2005. We the people: Blacks in the United States. Washington, DC: U.S. Census Bureau.
Miller, B., K. Chu, B. Hankey, and L. Ries. 2008. Cancer incidence and mortality patterns among specific Asian and Pacific Islander populations
in the U.S. Cancer Causes and Control 19(3):227-256.
Moy. 2009. Lessons learned in developing NHQR and NHDR. Agency for Healthcare Research and Quality. Presentation to the IOM Committee on Future Directions for the National Healthcare Quality and Disparities Reports, February 9, 2009. Washington, DC. PowerPoint
Presentation.
Murthy, B. V. R., D. A. Molony, and A. G. Stack. 2005. Survival advantage of Hispanic patients initiating dialysis in the United States is modified by race. Journal of the American Society of Nephrology 16(3):782-790.
OECD (Organisation for Economic Co-operation and Development). 2007. Health at a glance 200: OECD indicators. http://www.oecd.org/
health/healthataglance (accessed June 16, 2009).
Ogunwole, S. U. 2006. We the people: American Indians and Alaska Natives in the United States. Washington, DC: U.S. Census Bureau.
OMB (Office of Management and Budget). 1997. Revisions to the standards for the classification of federal data on race and ethnicity. Federal
Register 62:58781-58790.
Pallotto, E. K., J. W. Collins, and R. J. David. 2000. Enigma of maternal race and infant birth weight: A population-based study of US-born
Black and Caribbean-born Black women. American Journal of Epidemiology 151(11):1080-1085.
Ponce, N., W. Tseng, P. Ong, Y. L. Shek, S. Ortiz, M. Gatchell, and The University of California Asian American & Pacific Islander Policy
Multi-Campus Research Program (MRP). 2009. The state of Asian American, Native Hawaiian and Pacific Islander health in California
report. Sacramento, CA: California Asian Pacific Islander Joint Legislative Caucus.
Ramirez, R. R. 2004. We the people: Hispanics in the United States: Census 2000 special reports. Washington, DC: U.S. Census Bureau.
Read, J. G., B. Amick, and K. M. Donato. 2005a. Arab immigrants: A new case for ethnicity and health? Social Science and Medicine
61(1):77-82.
EVIDENCE OF DISPARITIES AMONG ETHNICITY GROUPS
9
Read, J. G., M. O. Emerson, and A. Tarlov. 2005b. Implications of Black immigrant health for U.S. racial disparities in health. Journal of Immigrant Health 7(3):205-212.
Reeves, T. J., and C. E. Bennett. 2004. We the people: Asians in the United States. Washington, DC: U.S. Census Bureau.
Schumacher, C., E. D. Ferucci, A. P. Lanier, M. L. Slattery, C. D. Schraer, T. W. Raymer, D. Dillard, M. A. Murtaugh, and L. Tom-Orme. 2008.
Metabolic syndrome: Prevalence among American Indian and Alaska Native people living in the Southwestern United States and in
Alaska. Metabolic Syndrome & Related Disorders 6(4):267-273.
Schwartz, K., M. Fakhouri, M. Bartoces, J. Monsur, and A. Younis. 2008. Mammography screening among Arab American women in metropolitan Detroit. Journal of Immigrant & Minority Health 10(6):541-549.
Shah, N. S., and O. Carrasquillo. 2006. Twelve-year trends in health insurance coverage among Latinos, by subgroup and immigration status.
Health Affairs 25(6):1612-1619.
Shah, S. M., C. Ayash, N. A. Pharaon, and F. M. Gany. 2008. Arab American immigrants in New York: Health care and cancer knowledge, attitudes, and beliefs. Journal of Immigrant & Minority Health 10(5):429-436.
Tang, G. 2009. Defining race, ethnicity and language populations. Kaiser Permanente. Presentation to the IOM Committee on Future Directions
for the National Healthcare Quality and Disparities Reports, March 11, 2009. Newport Beach, CA. PowerPoint Presentation.
Ting, H. H., E. H. Bradley, Y. Wang, J. H. Lichtman, B. K. Nallamothu, M. D. Sullivan, B. J. Gersh, V. L. Roger, J. P. Curtis, and H. M. Krumholz. 2008. Factors associated with longer time from symptom onset to hospital presentation for patients with ST-elevation myocardial
infarction. Archives of Internal Medicine 168(9):959-968.
Trivedi, A. N., A. M. Zaslavsky, E. C. Schneider, and J. Z. Ayanian. 2005. Trends in the quality of care and racial disparities in Medicare managed care. New England Journal of Medicine 353(7):692-700.
U.S. Census Bureau. 2000. State & county quickfacts. http://quickfacts.census.gov/qfd/meta/long_68184.htm (accessed June 14, 2009).
———. 2003a. Educational attainment: 2000. Washington, DC: U.S. Census Bureau.
______. 2003b. PHC-T-37 Table 1a. In Ability to Speak English by Language Spoken at Home. Washington, DC: U.S. Census Bureau.
———. 2006a. PHC-T-41 Table 3. In A Half-Century of Learning: Historical Statistics on Educational Attainment in the United States, 1940
to 2000. Washington, DC: U.S. Census Bureau.
———. 2006b. PHC-T-42 Table 1a. In America Speaks: A Demographic Profile of Foreign-Language Speakers for the United States: 2000.
Washington, DC: U.S. Census Bureau.
Van Ta, M., and T. Chen. 2008. Substance abuse among Native Hawaiian women in the United States: A review of current literature and recommendations for future research. Journal of Psychoactive Drugs 40(Suppl 5):411-422.
Wang, J., D. E. Williams, K. M. V. Narayan, and L. S. Geiss. 2006. Declining death rates from hyperglycemic crisis among adults with diabetes,
U.S., 1985-2002. Diabetes Care 29(9):2018-2022.
Weinick, R. M., E. A. Jacobs, L. C. Stone, A. N. Ortega, and H. Burstin. 2004. Hispanic healthcare disparities: Challenging the myth of a monolithic Hispanic population. Medical Care 42(4):313-320.
WHO (World Health Organization). 2009. European Health for All Database (HFA-DB). http://www.euro.who.int/hfadb (accessed June 16,
2009).
Wiggins, C. L., D. K. Espey, P. A. Wingo, J. S. Kaur, R. T. Wilson, J. Swan, B. A. Miller, M. A. Jim, J. J. Kelly, and A. P. Lanier. Cancer among
American Indians and Alaska Natives in the United States, 1994-2004. Cancer 113 (Suppl 5):1142-1152.
Williams, D. R., R. Haile, H. M. Gonzalez, H. Neighbors, R. Baser, and J. S. Jackson. 2007 The mental health of Black Caribbean immigrants:
Results from the National Survey of American Life. American Journal of Public Health 97(1):52-59.
Yu, S. M., Z. J. Huang, and G. K. Singh. 2004. Health status and health services utilization among U.S. Chinese, Asian Indian, Filipino, and
Other Asian/Pacific Islander children. Pediatrics 113(1):101-107.
Zambrana, R., C. Ayala, O. Carter-Pokras, J. Minaya, and G. A. Mensah. 2007. Disparities in hypertension-related mortality among selected
Hispanic subgroups and non-Hispanic White women ages 45 years and older - United States, 1995–1996 and 2001–2002. Ethnicity and
Disparities 17(3):434-440.
Zambrana, R. E., N. Breen, S. A. Fox, and M. L. Gutierrez-Mohamed. 1999. Use of cancer screening practices by Hispanic women: Analyses
by subgroup. Preventive Medicine 29(6):466-477.
3
Defining Categorization Needs for
Race and Ethnicity Data
The collection of data in the Office of Management and Budget (OMB) race and Hispanic ethnicity categories is improving across a variety of health care entities, but all entities do not yet collect or report
data using these categories. Moreover, disparities within the broad groups represented by these categories
support the case for collection of granular ethnicity data beyond the OMB categories. Given variations
in locally relevant populations, no single national set of additional ethnicity categories is best for all
entities that collect these data. Collection of data in the OMB race and Hispanic ethnicity categories,
supplemented by more granular ethnicity data, is recommended, with tailoring of the latter through
locally relevant categories chosen from a standardized national set. In most cases, rolling up the data on
granular ethnicities to the OMB categories will be possible, but it will be necessary to exercise care as
there are certain ethnicities that do not correspond with any one race. However, when questions about
race and granular ethnicity are both answered, rollup is not necessary.
Collecting and maintaining demographic data in medical records and enrollment files allows for analyses
stratified by race and ethnicity to identify needed improvements in health care, and for identification of individuals
or population groups that might be the focus of interventions designed to address health care needs. The resultant
analyses can be used, for example, to plan specific features of interventions (e.g., the use of culturally relevant
content in outreach communications about preventive services) and to compare the quality of care being provided
by various entities serving similar populations. The primary reason for standardizing categories for the variables
of race and ethnicity is to enable consistent comparison or aggregation of the data across multiple entities (e.g.,
state-level analyses of providers under Medicaid or a health plan’s analysis of disparities in multiple states where
it is operating). At the same time, standardized categories must enable persons to self-identify with the categories
and increase the utility of the data to the entity collecting them.
Both federal and state agencies (e.g., the Social Security Administration and state Medicaid programs) classify
individuals by their race or ethnicity to obtain useful information for health and health care purposes (Mays et
al., 2003). Other entities, such as health plans, health professionals, hospitals, community health centers, nursing
homes, funeral directors, public health departments, and the public, play roles in categorizing, collecting, reporting, and using these data for quality improvement purposes. Coordinating efforts of these stakeholders to ensure
accurate collection and reporting of uniformly categorized race and ethnicity data could lead to more powerful
61
62
RACE, ETHNICITY, AND LANGUAGE DATA
TABLE 3-1 OMB Race and Hispanic Ethnicity Categories According to a One- and Two-Question Format
Responses for Hispanic ethnicity in
two-question format
Hispanic or Latino
Not Hispanic or Latino
Responses for race in two-question
format
American Indian or Alaska Native
Asian
Black or African American
Native Hawaiian or Other Pacific Islander (NHOPI)
White
Responses to a single question
combining race and Hispanic
ethnicity (one-question format)
American Indian or Alaska Native
Asian
Black or African American
Hispanic or Latino
Native Hawaiian or Other Pacific Islander (NHOPI)
White
SOURCE: OMB, 1997b.
analyses of aggregated data (Sequist and Schneider, 2006). While progress has been made in the past few years to
incorporate the existing national standard set of categories promulgated by OMB (see Table 3-1) into the collection
and presentation of data, many data collection efforts still do not fully employ these basic standard categories.
All health and health care entities are not required to collect data on race and ethnicity, but if they do, the OMB
categories are the minimum that a federal agency or recipient of federal funds must include in its categorization
and reporting. The OMB standards have acknowledged imperfections, though. The categories are often, as shown
by the literature review in Chapter 2, too broad for effectively identifying and targeting disparities in health and
health care. Additionally, a substantial portion of Hispanics do not relate to the race options, leading to many
Hispanics being reported in Census data as “Some other race” because they do not choose any of the five OMB
race categories (del Pinal et al., 2007; NRC, 2006; OMB, 1997a). While OMB allows two formats for the race
and Hispanic ethnicity questions—one combining both race and Hispanic ethnicity in a single question and the
other asking about them in two separate questions, with the Hispanic ethnicity question being asked first (Table
3-1)—OMB explicitly prefers the latter two-question format (OMB, 1997b). As discussed later in the chapter, the
format used may have implications for Hispanic response rates (Baker et al., 2006; Laws and Heckscher, 2002;
Taylor-Clark, 2009).
This chapter examines approaches to categorizing race and ethnicity by (1) reviewing the current state of
standardized collection of race and ethnicity data, with a focus on the sufficiency of the OMB categories and their
uptake in various areas of health care data collection; (2) examining the utility of the continued use of the current
OMB categories; and (3) considering how the OMB race and Hispanic ethnicity categories can be combined with
locally tailored, more detailed ethnicity categories selected from a national standard set, with standardized coding
and rollup procedures, to capture important variations among ethnic groups. The chapter concludes by exploring
approaches to eliciting responses on race, Hispanic ethnicity, and granular ethnicity, and reviewing models for
data collection.
CURRENT STATE OF STANDARDIZED COLLECTION OF RACE AND ETHNICITY DATA
As previously noted, a variety of entities, many of which fall under the purview of the Department of Health
and Human Services’ (HHS’) 1997 inclusion policy, collect race and ethnicity data for a variety of purposes. The
HHS inclusion policy mandates the collection of at least OMB race and Hispanic ethnicity data in specific circumstances, such as in administrative records, surveys, research projects, and contract proposals associated with direct
DEFINING CATEGORIZATION NEEDS FOR RACE AND ETHNICITY DATA
6
federal service programs. While the policy does not state which specific categories should be collected in addition
to the OMB categories, it encourages the collection and reporting of subgroup data (HHS Data Council, 1999).
Exploring the current state of data categorization provides insight into the challenges faced by health- and
health care-related entities in categorizing and collecting the data. Table 3-2 shows the categories used by various federally funded health surveys, state birth records, and cancer registries. Many of these data sources are
national-level collection systems designed—among other purposes—to make comparisons across time, providers,
and geographic areas (Madans, 2009). These surveys collect race and Hispanic ethnicity data in the six categories
specified by OMB and a usually common set of 9 to 12 additional ethnicity categories. For example, the National
Health Interview Survey (NHIS), National Survey on Drug Use and Health (NSDUH), and Medical Expenditure
Panel Survey (MEPS) all include the OMB categories plus Mexican, Cuban, Puerto Rican, Asian Indian, Chinese,
Filipino, Japanese, Korean, and Vietnamese categories, among others. These categories generally correspond to
the 15 response check-off boxes included in Census 2000, Census 2010, and intercensal American Community
Survey (ACS) questions on race and ethnicity (see Table 3-2).
Despite HHS’ inclusion policy, some HHS agencies have not collected even the minimum OMB categories
(e.g., Medicare enrollment files). In general, HHS-funded or -sponsored surveys collect the minimum OMB
categories—and often additional categories—but all categories are not necessarily reported or analyzed because of
small sample sizes. As specific stratifying variables are applied to survey data, for example, the pool of applicable
respondents gets smaller (e.g., receipt of diabetes care services by age and race), which may make the number of
cases of small racial or ethnic groups too small for analysis. In contrast to surveys, most national administrative
datasets are case-rich, meaning they may contain enough data to allow for analyses of even small ethnic groups.
For example, the Medicare databases contain a large number of cases and thereby could play an important role in
stratifying data by race and ethnicity.
Race and Ethnicity Categorization in Medicare Data
Medicare, a large source of quality improvement data, has limited race and ethnicity data in the enrollment
files for its 44.8 million beneficiaries. Because of the history of how race and ethnicity data have been captured
(Reilly, 2009), the available race and ethnicity data are often of low accuracy and quality (Bilheimer and Sisk,
2008; Bonito et al., 2008; Eicheldinger and Bonito, 2008; Ford and Kelly, 2005; U.S. House Committee on Ways
and Means Subcommittee on Health, 2008). Analyses of Medicare administrative enrollment data found that while
the validity of individual data on race and ethnicity was high for Whites and Blacks (the sensitivity was 97 and
96 percent, respectively), only 52 percent of Asian, 33 percent of Hispanic or Latino, and 33 percent of American
Indian or Alaska Native beneficiaries were correctly identified (McBean, 2006). Medicare has historically relied
on the race and ethnicity data individuals provided when they applied for a Social Security number (SSN). Before
1980, the SSN application form limited respondents to choosing Black, White, and Other. Since most people age
65 and older today received a SSN prior to 1980, their racial and ethnic identifiers were limited to these responses
unless the individual changed enrollment to a specific health plan. The current SSN application combines race
and ethnicity into a single question and includes only five of the six OMB categories. 1 Consequently, Medicare
data have been of limited use in studying differences in patterns of care for populations identified by the OMB
categories (Bilheimer and Sisk, 2008; Bonito et al., 2008; Eicheldinger and Bonito, 2008; Ford and Kelly, 2005;
U.S. House Committee on Ways and Means Subcommittee on Health, 2008).
The limitations of the Medicare data for race and Hispanic ethnicity have been acknowledged by Centers for
Medicare and Medicaid Services (CMS) officials, and CMS is actively working to improve its coding of race and
ethnicity data by working with the Social Security Administration (SSA) to ensure the capture of data according
to the OMB minimum standards (Reilly, 2009). CMS has also explored a variety of indirect estimation techniques
1
The OMB-approved SSA Application for a Social Security Card instructs applicants to “Check one only”: Asian, Asian-American or
Pacific Islander; Hispanic; Black (Not Hispanic); American Indian or Alaska Native; or White (Not Hispanic). These five categories do not
correspond to the 1997 OMB standards, which split Asians and Pacific Islanders into separate categories, nor do the instructions to “Check
one only” allow multirace individuals to “Mark one or more.”
Asian, Asian-American or Pacific
Islander
Asian/Pacific Islander
Hispanic
Black (Not Hispanic)
North American Indian or Alaskan
Native
American Indian/Alaskan Native
White (Not Hispanic)
Yes/Hispanic or Latino
No/Not Hispanic or Latino/Not of
Spanish, Hispanic, Latino origin
Puerto Rican
Cuban/Cuban American
Dominican (Republic)
Mexican
Mexican American
Mexican/Mexican American/
Mexicano/Chicano
Central or South American
Central American
South American
Spanish (from Spain)
Spanish
Spanish-Caribbean
Other Latin American
Other Hispanic/ Latino/Spanish,
Specify
Other Hispanic/Latino, Specify
Other Spanish/Hispanic, Specify
Refused
Don’t know/Unknown
Categories Collected
Responses to combined
race and Hispanic
ethnicity format
Responses for Hispanic ethnicity question in two-question format
X
X
X
X
X
Census
2010
and ACS
(2009)
X
X
X
X
X
X
X
X
X
X
X
X
NHIS
(2008)
X
X
X
X
X
X
X
X
X
X
X
X
NIS
(2007)
X
X
X
X
X
X
X
X
X
X
X
NSDUH
(2008)
3-1
X
X
X
X
X
X
X
X
X
X
X
X
MEPS
(2006)
TABLE 3-2 Race and Ethnicity Categories Collected by Various Data Sources
X
X
NAMCS
(2008)
X
X
NHAMCS
(2009)
X
X
X
X
X
Application
for a SSN
(update
unknown)
X
X
X
X
X
CMS
Nursing
Home
Minimum
Data Set
(updated
2000)
X
X
X
X
X
Standard
Certificate
of Birth and
Death
(updated
2003)
X
X
X
X
X
X
X
X
X
SEER
(updated
2008)
64
Categories Collected
White
Black/African American
Black
Black, African Am., or Negro
American Indian
Alaska Native
American Indian or Alaska Native
American Indian or Alaska Native – Print
name of enrolled or principal tribe
American Indian, Aleutian, Alaskan Native,
or Eskimo
Native Hawaiian
Native Hawaiian or Other Pacific Islander
Samoan
Guamanian or Chamorro
Micronesian
Polynesian
Tahitian
Tongan
Melanesian
Fiji Islander
New Guinean
Other Pacific Islander, Specify
Asian
Asian Indian
Asian Indian, Pakistani
Chinese
Filipino
Japanese
Korean
Vietnamese
Other Asian: Specify
Laotian
Hmong
Kampuchean (including Khmer and
Cambodian)
Thai
Some other race, Specify
Refused
Don’t know/Unknown
Responses to race question in two-question format
X
X
X
X
X
X
X
X
X
X
X
X
X
X
X
X
X
X
X
X
X
X
X
X
X
X
X
X
X
X
X
X
X
X
X
X
X
X
X
X
X
X
X
X
X
X
X
X
X
X
X
X
X
X
MEPS
X
X
X
X
X
NAMCS
X
X
X
X
X
NHAMCS
X
X
Application
for a SSN
Minimum
Data Set
Certificate of
Birth and Death
X
X
X
X
X
X
X
X
X
X
X
X
X
X
X
X
NSDUH
X
X
X
X
X
NIS
X
X
X
X
X
NHIS
X
X
3-29
X
X
X
Census
2010
DEFINING CATEGORIZATION NEEDS FOR RACE AND ETHNICITY DATA
X
X
X
X
X
X
X
X
X
X
X
X
X
X
X
X
X
X
X
X
X
X
X
X
X
X
SEER
X
6
66
RACE, ETHNICITY, AND LANGUAGE DATA
to improve analyses of race and ethnicity differentials among individuals currently in the Medicare data system
(Bonito et al., 2008; Wei et al., 2006).2 Under the Medicare Improvements for Patients and Providers Act of 2008,3
CMS is required to address quality reporting by race and ethnicity. A report by CMS detailing its proposed actions
is due to Congress in January 2010.
Race and Ethnicity Categorization in State-Administered Programs
Much, but not all, of the collection of standardized data at the state level is done under federally funded
programs, including Medicaid and the Children’s Health Insurance Program (CHIP). Other state data collection
systems, such as hospital discharge data systems and cancer registries, aim to use race and ethnicity data categories
that are consistent with nationally collected denominator data (Friedman et al., 2000; Laws and Heckscher, 2002).
States face difficulties, though, in consistently collecting accurate and reliable data that are uniformly classified.
Medicaid and CHIP
The Children’s Health Insurance Program Reauthorization Act of 2009,4 signed into law in February 2009,
stipulates the development, by January 2011, of quality measures designed to identify and eliminate racial and
ethnic disparities in child health and health care. This legislation has the potential to improve measurement of
disparities for children in federally funded programs as it specifies that “data required for such measures is [sic]
collected and reported in a standard format that permits comparison of quality and data at a State, plan, and provider level.” A national standard set of race and ethnicity categories is necessary to stratify and compare these
quality metrics across the nation.
Although states are mandated to submit Medicaid claims data electronically to CMS, there are anomalies in
the submitted data (CMS, 2009). For example, in 2003, race and Hispanic ethnicity were listed as ‘‘unknown’’
for more than 20 percent of enrollees in New York, Rhode Island, and Vermont (McAlpine et al., 2007). A 2004
survey noted that while the majority of states were collecting self-reported race and Hispanic ethnicity from their
Medicaid and CHIP beneficiaries, most commonly during the enrollment process (Llanos and Palmer, 2006), few
states were collecting the six OMB minimum categories (Palmer, 2004). Many states were including Hispanic
as an option in the race question instead of asking a separate question about ethnicity (McAlpine et al., 2007);
as noted earlier, OMB permits this format but explicitly prefers the two-question format. The subcommittee’s
research indicates that some progress has been made in the past six years on the collection of Medicaid data using
the OMB standards. The subcommittee examined state Medicaid and CHIP application forms and found improved
standardization, most notably in collecting the Asian and Native Hawaiian or Other Pacific Islander (NHOPI)
categories (Table 3-3).
Vital Statistics Data
Failure to use standard categories and nonreporting or misreporting of data complicate efforts to calculate
national and state birth, mortality, and morbidity rates by the OMB race and Hispanic ethnicity categories or for
more detailed categories. The National Vital Statistics System (NVSS), hospital discharge data, and state registries
provide data needed to calculate these rates, but the data may not be collected and reported according to the OMB
categories or may be of poor quality. While the standard birth, death, and fetal death certificates now include
2 A 2009 white paper by the U.S. Senate Finance Committee presented proposals to improve patient care and health delivery. One proposal
included a comprehensive database required of CMS to expand existing data sources, data sharing, and matching across federal and state
claims and payment data, including HHS; SSA; the Departments of Veterans Affairs (VA), Defense (DOD), and Justice (DOJ); and the Federal
Employees Health Benefit Program (FEHBP) (U.S. Senate Finance Committee, 2009). The results of this and other proposals to revise payment
systems and policies in the Medicare program remain to be seen.
3 Medicare Improvements for Patients and Providers Act of 200, Public Law 110-275 § 118, 110th Cong., 2d sess. (July 15, 2008).
4 Children’s Health Insurance Program Reauthorization Act of 2009, Public Law 111-3, 111th Cong., 1st sess. (February 4, 2009).
6
DEFINING CATEGORIZATION NEEDS FOR RACE AND ETHNICITY DATA
TABLE 3-3 Race and Hispanic Ethnicity Categories Used by State Medicaid and CHIP Programs
OMB Race and Hispanic
Ethnicity Categories
2004: State
Medicaid Programs
Using (out of 21)a
2009: State
Medicaid Programs
Using (out of 33)b
2009: State
CHIP Programs
Using (out of 38)c
White
20
32
37
American Indian or Alaska Native
20
31
37
Black or African American
19
32
37
Hispanic or Latino
19d
32e
35f
Asian
16
32
37
Native Hawaiian or Other Pacific Islander
14
30
36
Other
9
5
8
a
SOURCE: Palmer, 2004.
b 37 state applications were available online. Four states provided space to write-in a free-text response, so they are not included
in the denominator. Of the remaining 33 states, all applications except one solicited race and ethnicity information with specific
category choices.
c 45 state applications were available online. Seven states provided space to write-in a free-text response, so the categories collected
by these states are not included. Of the remaining 38 states, all applications except one solicited race and ethnicity information with
specific category choices.
d Seven of the 19 states also collected data on Not Hispanic or Latino, indicating differences in using the one-question versus twoquestion format.
e 18 of the 32 states also collected data on Not Hispanic or Latino, indicating about an equivalent number of states using the oneversus two-question format.
f 18 of the 35 states also collected data on Not Hispanic or Latino.
the OMB categories plus 13 other categories,5 not all jurisdictions have adopted these standard certificates. As
of April 1, 2009, 32 jurisdictions (56 percent) had adopted the 2003 standard birth and death certificates, and 22
jurisdictions (39 percent) had adopted the 2003 standard fetal death report. The percentage of these vital events
covered by the states that have adopted the 2003 standard certificates is higher, however, because they are states
with larger populations.6
Death certificates provide the numerator for calculating death rates, while Census data provide the denominator. A deceased individual’s race and ethnicity are often identified by the funeral director relying on his or her own
observation, which is often inaccurate, particularly for racial and ethnic groups with a large number of multiracial
individuals (Arias et al., 2008; Durch and Madans, 2001). For example, an individual who may self-identify as
White and American Indian or Alaska Native may be categorized as only White by a funeral director, resulting in
undercounting of deaths in the American Indian or Alaska Native population. Misclassification on death certificates produces a substantial net underestimate of mortality rates for Hispanic, Asian, American Indian or Alaska
Native, and NHOPI populations (Arias et al., 2008; Durch and Madans, 2001). An assessment of the quality of
death rates found them to be understated by 11 percent for both Asians and Pacific Islanders and about 21 percent
for American Indians and Alaska Natives (Rosenberg et al., 1999).
Hospital Discharge Data
Hospital discharge records sometimes lack race and ethnicity information (Gold et al., 2008; Schoenman et
al., 2005) because hospitals either are not required to collect and report this information or choose not to do so
(Romano et al., 2003). As of May 2009, at least 39 states included some race and ethnicity data in their discharge
5
6
The categories collected on the standard death certificate are included in Table 3-2.
Personal communication, J. Madans, National Center for Health Statistics, April 17, 2009.
6
RACE, ETHNICITY, AND LANGUAGE DATA
BOX 3-1
Race and Ethnicity Categories in the HCUP Databases
The Healthcare Cost and Utilization Project (HCUP), a family of health care databases sponsored by
the Agency for Healthcare Research and Quality (AHRQ), relies on the voluntary participation of 40 states
to submit hospital discharge data. HCUP databases contain clinical and nonclinical information, including
patient demographics, diagnoses, procedures, discharge status, and charges for all patients, regardless
of payer (e.g., persons covered by Medicare, Medicaid, and private insurance, as well as no insurance).
One HCUP data element contains source-specific information about the race and ethnicity of the patient:
“race” retains information on the race of the patient as provided by the data source, and “Hispanic” retains
information on Hispanic ethnicity as provided by the data source.
Only 31 of the 40 participating states provide race and ethnicity data to HCUP. Some states report on
all the OMB standard categories (e.g., Arizona, Missouri), some states (e.g., Hawaii, Massachusetts, New
Jersey) collect more detailed ethnicity data, and some states do not report on the minimum OMB categories (e.g., Arkansas, North Carolina, Utah). HCUP recodes the data into the race and Hispanic ethnicity
categories by which it analyzes and stratifies data: White, Black, Hispanic, Asian or Pacific Islander, Native
American, and Other. These categories are similar to but do not in totality mirror the OMB standards.
SOURCES: AHRQ, 2006; Fraser and Andrews, 2009.
data reporting requirements. These data fields, however, are often added without additional resources to support
complete and consistent reporting. Consequently, collection and coding practices vary, and data quality may be
poor.7
Forty states voluntarily participate in the HCUP databases, but only 31 of these provide HCUP with race and
ethnicity data. Of these 31 states, several do not report data using the minimum OMB race and Hispanic ethnicity categories, and others report the data in different categories that HCUP must recode to allow multistate and
national-state comparisons (see Box 3-1) (AHRQ, 2006).
Cancer Registries
State cancer registries collect, classify, consolidate, and link information on new cancer cases from hospital
reports, medical records, pathology reports, hospital discharge data, and death certificates (CDC, 2009). Cancer
registries operate in 45 states, the District of Columbia, Puerto Rico, and the U.S. Pacific Islands, providing surveillance capabilities for identifying patterns, trends, and variation in disease burden and care among racial and
ethnic groups. Difficulties may arise, however, in coding race and ethnicity from such disparate sources including,
for example, the hand-written observations of physicians (Izquierdo and Schoenbach, 2000).
The National Cancer Institute’s Surveillance, Epidemiology and End Results (SEER) Program coding manual
includes two of the OMB categories directly (e.g., White and Black) and more granular ethnicity categories that
correspond to the other OMB standard categories (e.g., instead of a broad Hispanic ethnicity category, SEER asks
more specifically whether a person is Puerto Rican or Cuban) (see Table 3-2 for the categories coded by SEER);
altogether there are 34 categories. Because SEER stratifies the data whenever possible by more discrete groups,
registries are instructed to categorize a patient’s ancestry by one of the 34 categories (Johnson and Adamo, 2008).
SEER supplements and improves the data it receives from states by, for example, linking with the Indian Health
Service to improve American Indian or Alaska Native data (see Box 3-2). SEER also uses an indirect estimation
7
Personal communication, D. Love, National Association of Health Data Organizations, June 5, 2009.
DEFINING CATEGORIZATION NEEDS FOR RACE AND ETHNICITY DATA
69
BOX 3-2
The Use of Data Linkages to Improve Data Coverage
and Quality in Cancer Registries
The American Indian or Alaska Native population makes up just over one percent of the U.S. population and is dispersed throughout the country. This complicates the collection and aggregation of data on
cancer incidence, an especially important task because unique circumstances of culture, locale, history,
and health care produce unusual patterns of cancer occurrence among American Indian or Alaska Native
populations (Cobb et al., 2008). Alaska Natives, for example, have rates of lung, colon, and breast cancer
five times higher than those of Southwestern Indians.
Studies have demonstrated that many American Indian or Alaska Natives are misclassified as another
race in cancer registry data, and dividing these numerators with population denominators from the Bureau
of the Census has the effect of underestimating cancer rates for American Indian or Alaska Natives. To
address this problem, SEER cancer registries (which cover 26 percent of the total U.S. population and 42
percent of the American Indian or Alaska Native population) have been linked with Indian Health Service
(IHS) beneficiary records using LinkPlus, a probabilistic linkage software program developed by the Centers
for Disease Control and Prevention (CDC), to identify records representing the same individual in the IHS
and registry databases (Espey et al., 2008).
algorithm based on Spanish surnames and birthplace to improve Hispanic classification, and an algorithm based
on surnames and birthplace to improve data on Asian and NHOPI ethnic groups (Edwards, 2009).
Review of the State of Standardization
This review of categories currently used in various data collection activities highlights that there are substantial efforts nationally, by a number of states, and by various health care organizations to collect race and Hispanic
ethnicity data according to the OMB standards. However, not all of these efforts have yet achieved that level of
categorization, and national surveys, nationally standardized birth and death certificates, and cancer registries have
found it useful to use more fine-grained categorizations beyond the basic OMB categories. Efforts to standardize
categorization and collection will eliminate some of the problems with comparability among data collected by
disparate systems.
CONTINUED USE OF THE OMB CATEGORIES
The OMB race and Hispanic ethnicity categories were deemed to represent the country’s broad population
groups most necessary or useful for a variety of reporting and analytic purposes not specific to health care. The
1997 Revisions to the Standards for the Classification of Federal Data on Race and Ethnicity were developed over
a 4-year period during which an interagency taskforce weighed public input, expert testimony, and other evidence
to consider whether and how to modify OMB’s 1977 standards (OMB, 1977, 1997b). OMB has no plans to change
its current standards (Wallman, 2009).
Chapter 2 documented important variations in health and health care that may be masked when data are analyzed using only the OMB race and Hispanic ethnicity categories. Notwithstanding this limitation, a large body of
studies has revealed disparities in health and health care among the groups represented by those categories. Thus,
use of the OMB categories yields important data for quality improvement analyses and reporting efforts (AHRQ,
2008; Cohen, 2008; Flores and Tomany-Korman, 2008; IOM, 2008; Kaiser Family Foundation, 2009). Additionally, because OMB-level reporting is required by various federal agencies and recipients of federal funds, the
0
RACE, ETHNICITY, AND LANGUAGE DATA
OMB categories serve as a denominator for many comparisons related to health and health care. Thus, the OMB
categories are useful for high-level analysis, reporting, and policy intervention (e.g., in the National Healthcare
Disparities Report), as well as more local uses. If all entities were to collect race and ethnicity data using the OMB
categories, the process of combining or comparing data across reporting entities (e.g., hospitals in states contributing to HCUP or health plans’ Healthcare Effectiveness Data and Information Set [HEDIS] data stratified by race
and ethnicity) would be greatly facilitated. While the OMB categories do not define more specific subgroups and
do not address how to include all difficult-to-categorize groups, they provide a useful common minimum platform
for analyzing disparities in health care.
Past Activities to Improve the Collection of Data in the OMB Categories
One assumption underlying self-identified race and ethnicity data collection is that the categories and designations are recognized and accepted by the populations questioned (CDC, 1993; Lin and Kelsey, 2000). Improving
the likelihood that respondents can identify with the races and ethnicities offered as response options is therefore
essential to the quality of the data collected. Challenges in capturing accurate and reliable OMB-level data include
the lack of detailed categories to which individuals can relate and the format of the questions used to elicit Hispanic ethnicity.
Categorizing Diverse Populations
A wide range of cultures, languages, and health-related behaviors are encompassed by each of the six OMB
race and Hispanic ethnicity categories. For example, the Asian category blurs ancestry distinctions and vast cultural
and geographic diversity (Holup et al., 2007). As a result, the Asian race identification may not resonate with all
individuals of Pakistani, Vietnamese, or Filipino descent, for example, who might prefer to self-identify according
to their ancestry (see Box 3-3) (Laws and Heckscher, 2002).
Similarly, the Black or African American, White, American Indian or Alaska Native, and NHOPI populations
consist of heterogeneous groups and persons within these groups may not identify with the broader race categories
(Bailey, 2001; Mays et al., 2003). The Census Bureau has recognized that check-off boxes that represent more
detailed categories in addition to the broad OMB categories resonate better with respondents. The Census includes
several ancestry options on the Hispanic origin question and several Asian and NHOPI ancestries on the race question (see Figure 3-1). Additionally, the inclusion of space to write in a free-text response permits individuals who
do not identify with any of the provided check-off boxes to self-identify.
In Census 2000, about 15.4 million respondents were classified in the “Some other race” alone category, which
was added to the OMB categories; this represents 5.5 percent of the total U.S. population. 8 More than 97 percent of
those who chose this category were Hispanic (Rothenberg, 2006), and the remaining write-in responses included a
range of answers, such as German and Guyanese. As Table 3-4 illustrates, 42.2 percent of the 35.2 million Hispanic
respondents identified with the response category “Some other race.” High rates of reporting “Some other race”
on the Census may indicate that Dominicans, for example, are uncomfortable with saying “I am Black,” or “I am
White,” and instead prefer to identify with a separate, distinct group (Bailey, 2001). 9
Hispanics (discussed below) dwarf the other ethnicities in the “Some other race” category by virtue of their
numbers, but individuals of other ethnicities, such as Cape Verdeans and Guyanese, also often do not self-identify
with any of the OMB race and Hispanic ethnicity categories (Hernandez-Ramdwar, 1997; Laws and Heckscher,
2002; Model and Fisher, 2008). Consequently, these individuals, as well as many people of Filipino descent, among
others, may not respond to the race question or may check “Some other race” if the option is available. The sub-
8
The 2005 Omnibus Appropriations Bill, at the urging of Congressman José E. Serrano (D-NY), directed that any collection of Census
data on race identification must include “Some other race” as a response category. In previous censuses, the Census Bureau had sought and
received OMB approval to include “Some other race” as a response category (U.S. Census Bureau, 2002b).
9 Dominicans (58 percent) were the group most likely to self-identify as “Some other race” in Census 2000 (NRC, 2006; Tafoya, 2004).
DEFINING CATEGORIZATION NEEDS FOR RACE AND ETHNICITY DATA
BOX 3-3
The Challenge of Categorizing Filipino Respondents
The Philippines consist of over 7,000 islands set in the western Pacific Ocean. The OMB standards
define persons of Filipino descent as Asian. To evaluate Asian subgroup responses to race and ethnicity
inquiries, Holup and colleagues (2007), asked a subset of adults participating in the Hemochromatosis and
Iron Overload Screening Study to complete both the OMB-minimum and the expanded race and ethnicity
measure used in the National Health Interview Survey (NHIS). The expanded measure used in the NHIS
includes response categories for Asian Indian, Chinese, Filipino, Japanese, Korean, Vietnamese, and Other
Asian. While 89 percent of single-heritage Filipinos marked Asian in the OMB-minimum categorization, the
remaining 11 percent marked primarily NHOPI. Filipinos have also been known to categorize themselves
as Spanish (Mays et al., 2003), Pacific Islander, Asian American, or, if multiracial, White (Yu and Liu, 1992).
Holup and colleagues note that while OMB’s decision to separate the Asian and Pacific Islander category
in the 1997 OMB revisions was a positive step, specification or provision of definitions when using the
minimum OMB categories is “prudent.”
�
NOTE: Please answer BOTH Questions 5 and 6.
5. Is this person Spanish /Hispanic /Latino? Mark � the
"No" box if not Spanish /Hispanic /Latino.
No, not Spanish / Hispanic / Latino
Yes, Puerto Rican
Yes, Mexican, Mexican Am., Chicano
Yes, Cuban
Yes, other Spanish / Hispanic / Latino — Print group.
6. What is this person’s race? Mark � one or more races to
indicate what this person considers himself/herself to be.
White
Black, African Am., or Negro
American Indian or Alaska Native — Print name of enrolled or principal tribe.
Asian Indian
Japanese
Chinese
Korean
Filipino
Vietnamese
Other Asian — Print race.
Native Hawaiian
Guamanian or Chamorro
Samoan
Other Pacific Islander — Print race.
Some other race — Print race.
FIGURE 3-1 Reproduction of questions on race and Hispanic origin from Census 2000.
1
2
RACE, ETHNICITY, AND LANGUAGE DATA
TABLE 3-4 Hispanic and Non-Hispanic Population Distribution by Race for the United States: 2000
Race
Hispanic or Latino
Ethnicity (%)
Not Hispanic or
Latino Ethnicity (%)
One race
White
Black or African American
American Indian or Alaska Native
Asian
Native Hawaiian or Other Pacific Islander (NHOPI)
Some other race
Two or more races
47.9
2.0
1.2
0.3
0.1
42.2
6.3
79.1
13.8
0.8
4.1
0.1
0.2
1.9
SOURCE: Grieco and Cassidy, 2001.
committee concludes that making this option available in addition to the OMB categories would allow individuals
who do not identify with one of the OMB race categories to respond (see Recommendation 3-1 below).
Format of the Race and Hispanic Ethnicity Questions
One of the principal challenges in capturing race and ethnicity data for purposes of improving health care is
determining how best to capture the Hispanic or Latino population, a population comprising groups that vary widely
in their characteristics (McKenney and Bennett, 1994; NRC, 2006). Many Hispanic individuals, including persons
of Mexican, Puerto Rican, and Cuban heritage, prefer to self-identify using their specific ancestry as opposed to the
general category Hispanic or Latino (Bowman, 1994; Gimenez, 1989; Hayes-Bautista and Chapa, 1987). The term
“Hispanic” may not resonate with immigrants, in particular, because it is not used outside the United States (NRC,
2006). Many Hispanics choose “Some other race” instead of the OMB race options when given the opportunity
to do so, or refuse to answer the race question when it is asked (Hasnain-Wynia et al., 2008). In a study of birth
certificate data, for example, approximately two-thirds of the 15,074 mothers of Hispanic ethnicity reported their
race as “Some other race” (Buescher et al., 2005). Research indicates that children of immigrants may be even
more likely than their parents to self-identify as “Some other race” (NRC, 2006; Portes and Rumbaut, 2001).
As previously stated, the OMB standards encourage, “whenever feasible,” the separation of questions on race
and Hispanic ethnicity, a distinction stemming from a 1976 law requiring documentation of the size and growth
of the Hispanic population.10 Some research prior to the 1997 OMB revisions indicated that the separate, twoquestion format in which Hispanic ethnicity is elicited before race11 best identifies an OMB race category for as
many Hispanic individuals as possible and allows analyses of combined race and Hispanic ethnicity categories
(e.g., Hispanic Black and non-Hispanic Black). The two-question format may capture important health differences
among groups. A 2006 study, for example, found that non-Hispanic Blacks have higher risks of developing coronary disease (5.8 percent) than Hispanic Blacks (4.7 percent, P = 0.017) (Lancaster et al., 2006). Additionally, a
yet-to-be-released study of data from the NHIS indicates that Hispanic Blacks have a different health services and
health status profile from that of either Hispanics or Blacks (Austin et al., 2009). However, the need for the dual
categorization of Hispanic ethnicity and race for health care improvement purposes is not well studied.
At the same time, some research suggests that Hispanic respondents better identify with questions on race
and Hispanic ethnicity when a one-question instead of a two-question format is used (Baker et al., 2006; Laws
and Heckscher, 2002; Taylor-Clark, 2009). For example, the Census Bureau’s 1996 Racial and Ethnic Targeted
Test (RAETT), which was administered to a sample of households in preparation for Census 2000, experimented
with combining race and Hispanic ethnicity into a single question. Nonresponse to the one-question format was
10
Joint resolution relating to the publication of economic and social statistics for Americans of Spanish-origin or descent, Public Law 94311 (15 U.S.C. 1516a), 94th Cong. (June 16, 1976).
11 Non-response to the Hispanic origin question decreased to 5.2 percent from 8.6 percent when the Hispanic origin question was asked
before rather than after the race question (U.S. Census Bureau, 1996b).
DEFINING CATEGORIZATION NEEDS FOR RACE AND ETHNICITY DATA
significantly lower than nonresponse to the two-question format. However, in the one-question format, many
people who had identified as Hispanic and White or Black in the two-question format changed their response
to only Hispanic, despite being permitted to “Select one or more” categories (Bennett et al., 1997). 12 Yet while
conventional wisdom indicates that the combined format maximizes response among Hispanics (Hirschman et
al., 2000; OMB, 1997a; Tucker et al., 1996; U.S. Census Bureau, 1996a), survey research has been inconclusive
regarding the best way to capture information on race and Hispanic ethnicity among this population. Continued
testing of a combined-question format during the 2010 Census may reveal additional information on this issue
(Humes, 2009; NRC, 2009).
Legislative efforts are under way to increase the options on the Census 2020 forms to include Caribbean,
Dominican, and other populations. In the first session of the 111th Congress, Representative Charles Rangel
(D-NY) and Senator Kirsten Gillibrand (D-NY) introduced bills HR 1504 and SB 1084, respectively, to require
that in Census questionnaires, a check-off box be included so that respondents may indicate Dominican ethnicity.
Also in the first session, Representative Yvette D. Clarke (D-NY) and Senator Charles Schumer (D-NY) introduced
bills HR 2071 and SB 1083, respectively, to include a Caribbean check-off box on all future Census forms. These
efforts indicate a continued call for more detailed ethnicity data. The need for more detailed data and concerns
about Hispanic response may require OMB to review its standards. Most important, the subcommittee concludes
there is a need for an assessment of the extent to which lack of identification with the OMB categories interferes
with accurate data collection for use in quality improvement efforts (see Recommendation 3-3 below).
Identification of Multiracial Individuals
The 1997 OMB standards require that respondents be allowed to report more than one race and recommend
“Mark one or more” and “Select one or more” as the included instruction. Approximately 2.4 percent of the
country’s population (6.8 million persons) reported multiple races in Census 2000 (U.S. Census Bureau, 2000);
this percentage can be expected to increase in the coming years (Edmonston et al., 2000). The largest percentage
of multirace responses are from Hispanics; in Census 2000, Hispanics were more than three times as likely as
non-Hispanics to self-identify with multiple race responses (NRC, 2006). As a result, like the “Some other race”
category, multirace reporting is expected to increase with the growth of the Hispanic population. Additionally, in
some areas of the country, the proportion of the population self-identifying as multiracial is substantial. In Census
2000, there were 14 states where the multiracial population was above the nationwide average of 2.4 percent. For
example, the multiracial population in Hawaii totaled 21 percent, followed at a distance by Alaska at 5.4 percent
(Jones and Smith, 2001).
In analysis and reporting, organizations often collapse reported multiracial combinations into an aggregate
“more than one race” or a “multiracial” category because the sample sizes for the individual combinations are
usually too small for analysis. The Census’ 1996 RAETT found that the option to “Select one or more” captures
the same number of individuals as a single, multiracial/biracial category (Hirschman et al., 2000). The former
instruction, though, allows for the identification of specific races, whereas the latter does not. Where possible,
information on specific combinations of races and ethnicities should be preserved so the data can be aggregated
over enough reporting units or periods to provide more informative analyses and the basis for targeted interventions. A single category labeled “multiracial” or “more than one race” may mask valuable information that could
be used in analyses. More accurate analyses may require detail on each category selected by a respondent.
Some health information technology (HIT) systems are unable to support the collection and reporting of data
in a “Select one or more” manner.13 OMB guidance stipulates that civil rights enforcement agencies must include
the four “double-race” combinations most frequently reported. The U.S. Department of Housing and Urban
12
Sutter Health collects the five OMB race categories with a Hispanic/Non-Hispanic notation. For example, an individual may self-identify
as Black/Hispanic or Black/Non-Hispanic (Personal communication, T. Van, Sutter Health, July 22, 2009). This is another way to capture
these data in accordance with the OMB standards.
13 All possible combinations of the six OMB categories results in 64 combinations.
4
RACE, ETHNICITY, AND LANGUAGE DATA
Development, for example, tabulates respondents by the five OMB race categories and four specific multiple-race
combinations:
•
•
•
•
American Indian or Alaska Native and White
Asian and White
Black or African American and White
American Indian or Alaska Native and Black or African American
A sampling of the local service population or an examination of applicable Census data could reveal the most
common combinations that an organization might want to capture if its information system does not allow all
combinations under the “Select one or more” option.
Counting multiracial individuals as members of each individual race they select (e.g., counting individuals who
self-identify as Black and Native Hawaiian in both the Black and NHOPI categories) may double-count respondents
and inflate the number of respondents in denominator data. Therefore, this practice may come “at the expense of
misstating disparities in the health of specific racial/ethnic groups” (Mays et al., 2003, p. 89), especially among
populations in which the ratio of responses involving multiple races to a single race is high (e.g., American Indian
or Alaska Native and NHOPI populations). On the other hand, this practice allows analyses to include all those
who identify with a specific group.
To avoid double-counting, prioritization schemes, commonly referred to as trumping rules, recategorize multiracial individuals into a single race category and facilitate comparison of the data with data from systems that
allow only single-race categories. For example, OMB guidelines stipulate that when addressing civil rights claims,
“responses that combine one minority race and white are allocated to the minority race” (OMB, 2000).
Prioritization schemes reflect a lack of consideration of multiracial respondents’ preference, aversion, or indifference to identifying primarily with one race. The NHIS and the California Health Interview Survey (CHIS) ask
respondents who report more than one race whether there is a category with which they most identify, providing an
opportunity to categorize individuals in a way that most closely matches their preferred self-identification. Those
responses then can be used to inform the assigning of multiracial individuals to single-race categories in a manner
more informative than arbitrary prioritization schemes (Holup et al., 2007). However, while many multiracial
individuals identify with one race (Mays et al., 2003), some multiracial individuals may hesitate to choose one
racial identity over another. Asking such a question also requires the collection and coding of data on an additional
variable, which may be burdensome for some data systems. The subcommittee concludes that retaining specific
combinations or codes for more common combinations in data systems allows for more thorough analysis and
reporting. Different ways of aggregating multiracial categories may be appropriate for different purposes; therefore,
the subcommittee does not endorse any single analytic approach but concludes that, whenever possible, each race
an individual selects on a collection form be available for analysis.
NEED FOR LOCALLY RELEVANT GRANULAR ETHNICITY CATEGORIES
As noted earlier, the OMB categories, when used alone, can mask important within-group variations in quality of care (Blendon et al., 2007; Jerant et al., 2008; Read et al., 2005; Shah and Carrasquillo, 2006). While the
OMB standards include only two ethnicity categories (Hispanic and not Hispanic), many other ethnicities exist.
Assessing and reducing disparities within the broad race and Hispanic ethnicity categories requires ethnicity data
at a greater level of detail than is mandated by the OMB standards.
The subcommittee evaluated the necessary level of ethnicity detail beyond Hispanic ethnicity and considered whether it should include national origin, place of birth, and ancestry. The Supreme Court has interpreted
national origin to refer to “the country where a person was born, or, more broadly, the country from which his or
her ancestors came.”14 Thus, a person may identify with a national origin if he or she shares physical, cultural,
or linguistic characteristics with the group. This terminology, however, may indicate only country of birth to
14
Espinoza v. Farah Mfg. Co., 414 U.S. 86, 88 (1973).
DEFINING CATEGORIZATION NEEDS FOR RACE AND ETHNICITY DATA
some respondents. Therefore, the subcommittee determines that ancestry, which the Census Bureau defines as “a
person’s ethnic origin or descent, ‘roots,’ or heritage, or the place of birth of the person or the person’s parents
or ancestors before their arrival in the United States,” is the ethnicity concept most encompassing of the detail
necessary in health care settings (U.S. Census Bureau, 2008). To distinguish the definition of ethnicity adopted
by OMB (i.e., Hispanic ethnicity) from this more encompassing definition, the subcommittee refers to the latter
concept as granular ethnicity.
Importance of Flexibility in Choosing Locally Relevant Categories
The subcommittee considered whether to recommend the OMB race and Hispanic ethnicity categories plus
a uniform set of 10 to 15 additional ethnicity categories (i.e., an “OMB Plus” set similar to the categories used in
national surveys outlined in Table 3-2). Demographic distributions confirm, however, that a uniform set beyond
the OMB categories would include groups not relevant to all communities. The subcommittee concludes that, to
allow for better understanding and serving of local populations, the categories collected and analyzed need to
accurately reflect the population served. Thus, a fixed “OMB Plus” set of categories would be less desirable than
local selection of ethnicity categories in addition to the OMB categories.
Ethnicity data must be specific and appropriate to the communities in which health care providers operate
(Bilheimer and Sisk, 2008). Clustering of racial and ethnic groups in specific communities, such as a relatively
large population of White persons of French descent in Maine or a large population of White persons of Armenian
descent in Southern California, requires the use of locally relevant granular ethnicity categories. Figure 3-2 shows
the county-level distribution of the country’s Asian population, revealing that there are higher concentrations of
Asians in broad geographic regions (e.g., the West Coast and Northeast Corridor), as well as clustered within
specific counties or metropolitan areas (e.g., Collin County, Texas; Atlanta, Georgia). In areas with larger and
more diverse Asian populations, discrete categorizations are more useful than a single broad category for data
collection. Even in the state of Minnesota, which has a reasonably average concentration of Asians (3.5 percent),
the broad OMB Asian category masks the fact that a large portion of Asians in the state are Hmong, an important
consideration for locally tailored health care interventions. Similarly, a health care provider may care for a large
number of persons who belong to an ethnic group whose significant presence is masked even by county-level data
in the aggregate OMB categories.
Ethnicity Categories on Data Collection Instruments
Health care entities must determine an approach to collecting granular ethnicity data that allows all individuals,
if they desire, to self-identify and at the same time is feasible, given that the population of their service area may
include hundreds of granular ethnicities. Individual self-identification enables entities to learn about the composition of their service population so they can decide which ethnicity categories will yield the most responses on
data collection instruments, and can be used in analyses to generate information on where to target interventions.
Additionally, such individualized data collection has the potential benefit of preserving small subgroup identities
that might be of interest for analytic studies (assuming preservation of the specific identifiers during data transfer)
at the state, health plan, or national level but that might prove too small to reveal any group-specific quality issues
at the local level (e.g., higher cancer mortality among persons of Samoan descent). Of course, such aggregation
presumes standardization of categories across entities.
Presenting respondents with a list of hundreds of categories (see Appendix E) poses logistical challenges.
Models exist for the collection of data on highly diverse populations; Kaiser Permanente, for example, collects data
using approximately 260 categories of granular ethnicity through a separate question in addition to collecting the
OMB minimum categories (see Appendix G). Similarly, Contra Costa Health Plan uses 133 ethnicity categories
(see Appendix H). Both of these entities have resolved having lengthy lists through software applications that recognize keystrokes to present the most pertinent categories on screen. The Contra Costa software first identifies the
15 most frequently encountered ethnicities. Both of these organizations ask about granular ethnicity after asking
a single question to solicit the OMB race and Hispanic ethnicity categories.
6
RACE, ETHNICITY, AND LANGUAGE DATA
FIGURE 3-2 Geographic distribution of the Asian population.
SOURCE: Barnes and Bennett, 2002.
Respondents may find the task of self-identification from a lengthy list daunting or unreasonable when faced
with a paper-based form. Likewise, it would not be feasible for staff to read through such lengthy lists when collecting the data by phone, for example, during preregistration for hospitalization. Instead, some health care entities
ask patients to provide a response to an open-ended question and present no preselected response options, while
others provide patients and staff with a short list of categories, often accompanied by an “Other, please specify:__”
option. This latter response option is also open-ended, meaning individuals or staff can write in a self-identification if it is not included on the local list of response categories. Similarly, state or national surveys could have a
limited list of categories, but also present the open-ended response option.
There are advantages and disadvantages to both open-ended and closed-ended question formats. For example,
questions that list examples or check-off boxes may bias respondents to the given response options (Chesnut et al.,
2007). Census research has indicated higher response rates for the ethnicities listed as examples, indicating that
this question format may skew responses (Cresce et al., 2004; del Pinal et al., 2007). Traditionally, closed-ended
questions have been used to elicit race and Hispanic ethnicity data. But open-ended questions may have advantages for some entities collecting granular ethnicity data, including that this format reduces the amount of space
needed on paper data collection forms or electronic screens. However, collecting open-format data for hundreds
of thousands of enrollees or respondents on a survey can make it difficult to use the data unless resources are
devoted to coding those responses according to standardized categories. One of the difficulties with open-ended
questions is that respondents may leave the item blank. Census studies have indicated that this may be the result
DEFINING CATEGORIZATION NEEDS FOR RACE AND ETHNICITY DATA
of perceived redundancy when the open-ended ancestry question follows questions on race and Hispanic ethnicity
(del Pinal, 2004; Martin et al., 1990). Open-ended questions often provide examples so respondents know what
type of response is desired; for example, the Medi-Cal instruction sheet includes a list of nine examples of ethnicity (e.g., Hispanic, Cambodian, Asian Indian).
The subcommittee finds no positive evidence from a health care quality improvement standpoint to support
conclusions about requiring multiple responses to a question about granular ethnicity (i.e., “Select one or more”)
for each individual. Additionally, the subcommittee acknowledges the potential HIT challenges of having multiple
granular ethnicity responses. It is feasible and indeed required by OMB that entities collecting race and Hispanic
ethnicity data according to the OMB standards allow individuals to “Select one or more,” and these few categories
can yield 64 combinations. However, the number of possible combinations from a list of several hundred granular
ethnicities may increase the analytic burden, and multiple ethnicity combinations will result in small cell sizes
and thus may not be useful for identifying patterns of care in all circumstances. Furthermore, response variation, which occurs when individuals intentionally or inadvertently make inconsistent choices over time (Snipp,
1989), increases when individuals have a greater number of choices with which to self-identify (Snipp, 2003).
Kaiser Permanente’s initiative to capture race, Hispanic ethnicity, and granular ethnicity does not currently allow
multiple granular ethnicity responses because of collection and analytic considerations. However, there may be
some communities where combinations of ethnicities may regularly occur, and health entities would find these
combinations useful to collect.
Definition of a Standard National Set with Local Choices
To ensure standardized collection of race and ethnicity data, locally relevant choices of response categories
should be selected from a national standard set, with appropriate coding to facilitate sharing of the data. The
national standard set of categories needs to be comprehensive enough to capture changing demographic trends,
geographically isolated subgroups, and groups relevant to the provision of culturally and linguistically appropriate care. While several organizations provide lists of granular ethnicities (see Table 3-5), none of these include
all of the granular ethnicity categories required for a national set. Merging these sets, as is done in Appendix E,
provides a starting point from which a national standard set could be developed. These sets are further explored
in this section to identify the strengths and weaknesses of each.
The Centers for Disease Control and Prevention (CDC)/Health Level 7 (HL7) Race and Ethnicity Code Set
1.0 was developed to clarify the relationship of granular ethnicities to the broad OMB categories and to facilitate
data exchange and analysis. In formulating this set, CDC worked with HL7 and X12, the leading standards-setting
organizations for data interactions and for administrative transactions, respectively. The CDC/HL7 Code Set, which
was introduced in 2000, incorporates ethnicity categories derived from write-in responses to the Census questions
on race and Hispanic ethnicity, not responses to the Census ancestry question. Each ethnicity is assigned a permanent five-digit unique numerical code as well as a hierarchical code to associate with race or Hispanic ethnicity.
The CDC/HL7 Code Set, which has been under the jurisdiction of the National Center for Public Health Informatics, will be updated based on Census 2010 write-ins on the race and Hispanic ethnicity questions.15 The addition
of categories beyond those currently specified on the Census form (see Figure 3-1), however, requires respondents
to give free-text responses on lines provided under Hispanic or Latino, Asian, American Indian or Alaska Native,
and “Some other race.” Thus, for example, the granular ethnicities of African immigrants who simply check “Black
or African American” may not be represented in the CDC/HL7 Code Set. The current ethnicity list, for instance,
notably does not include groups such as Somalis, Russians, Cape Verdeans, or Brazilians.
The U.S. Census Bureau, in addition to cataloging write-in responses to questions on race and Hispanic ethnicity, asks a separate ancestry question for which respondents are asked to write in their ancestry or ethnic origin;
thus, a person might identify with an individual country (e.g., French), a region within a country (e.g., Corsican
15
Personal communication, S. Ganesan, Centers for Disease Control and Prevention, June 3, 2009.
RACE, ETHNICITY, AND LANGUAGE DATA
TABLE 3-5 Comparison of Granular Ethnicity Categorization and Coding Systems
Estimated Breakdown of Categories by OMB Race and
Hispanic Ethnicity Category
Category and Code Set
Total Number of Categories
CDC/HL7 Race and Ethnicity Code
Set 1.0 (2000)
Over 925 categories
Over 800 American Indian or Alaska Native categories
21 White categories
19 Black or African American categories
24 Asian categories/codes categories
23 NHOPI categories
38 Hispanic or Latino categories
Census Ancestry Codes
993 categories
212 broad “ancestry descriptions”
Approximately 780 more detailed response categories
Massachusetts Superset
173 categories
31 major ethnicities categories
140 sub-ethnicities categories
Kaiser Permanente Granular Ethnicity 268 categories
(2009)
59 American Indian or Alaska Native categories
206 additional ethnicities
Wisconsin Cancer Reporting System
Code Manual (2008)
648 categories
371 American Indian or Alaska Native categories
Contra Costa Health Plan Race and
Ethnicity
143 categories
129 White categories
37 Black or African American categories
41 NHOPI categories
14 Other Race categories
130 categories from the CDC/HL7 Code Set
9 additional ethnicity categories: American, Bosnian,
Brazilian, Kurdish, Mixtec, Portuguese, Punjabi, Russian,
and Yao, Mien
NOTE: The estimated categories in the third column may not equal the total number of categories in the middle column due to
additional response and coding options such as Unknown, Declined, and Unavailable.
SOURCES: CDC, 2000; Kaiser Permanente, 2009; Taylor-Clark, 2009; Tiutin, 2009; U.S. Census Bureau, 2005; Wisconsin Cancer Reporting
System, 2008.
or Breton), or a broader category (e.g., European).16 The Census maintains lists of write-in responses with corresponding three-digit numerical codes for its questions on race, Hispanic origin, and ancestry. The codes for each
of these lists differ, although the lists overlap with many of the same categories. For example, 101 is the code for
White on the Census Race Code List, the code for “Not Spanish/Hispanic” in the Hispanic or Latino Origin Code
List, and the code for Azerbaijani in the Census Ancestry Code List (U.S. Census Bureau, 2002a). Korean is coded
as 620 on the Census Race Code List and 750 on the Census Ancestry Code List.
The Massachusetts Division of Health Care Finance and Policy and the Massachusetts Quality and Cost
Council mandated that the state’s acute care hospitals and health plans, respectively, report uniform race and
ethnicity data (Weinick et al., 2007). These requirements spurred development of an ethnicity categorization and
coding list by the Brookings Institution. Entities responsible for the list’s development considered recommending
the CDC/HL7 Code Set but found it did not accurately capture all relevant population groups. 17 The category and
coding list developed by the Brookings Institution includes 31 ethnicity categories and additional “sub-ethnicities”
that are not required for reporting but that an organization can collect, if useful. Acute care hospitals and health
16
The separate ancestry question was included only on the Census “long form.” This form was sent to one in six households. The American
Community Survey (ACS), an annual survey sent to a sample of households, has replaced the Census “long form” and includes a question
about ancestry.
17 Personal communication, K. Taylor-Clark, The Brookings Institution, January 15, 2009.
DEFINING CATEGORIZATION NEEDS FOR RACE AND ETHNICITY DATA
9
plans are required to report (i.e., have the fields and categories available in their HIT systems) the basic OMB
race categories along with the 31 ethnicity categories (Massachusetts Executive Office of Health and Human
Services, 2009a, 2009b). When an organization collects any of the “sub-ethnicity” categories, it is required to roll
that category up to one of the 31 broader ethnicity categories for reporting. The Massachusetts Superset, which
is intended to serve as a guide for health plans and hospitals when they collect granular ethnicity beyond the 31
required categories, includes most of the CDC/HL7 categories and 87 additional categories representing African
nations (e.g., Sudanese, Somali), synonyms for existing CDC categories (e.g., La Raza, Chicano), Middle Eastern
nations (e.g., Saudi Arabian, Jordanian), and other ethnicities (e.g., Cape Verdean, Brazilian, Guyanese) (TaylorClark et al., 2009).
Similarly, Contra Costa Health Plan and the Wisconsin Cancer Reporting System (WCRS) developed their
own categorization and coding schemes (Tiutin, 2009; Wisconsin Cancer Reporting System, 2008). Contra Costa’s
code set is based on the CDC/HL7 Code Set, but includes nine additional granular ethnicities, including American
and Russian, which are two of Contra Costa’s top 15 response categories, but are not included in the CDC/HL7
Code Set (see Appendix H).
In 2004, Kaiser Permanente began collecting member race and ethnicity data using the OMB categories and
a limited number of detailed ethnicity groups. After implementation, Kaiser determined a need for more granular
ethnicity categories to allow for better self-identification and analyses of health care data. As a result, Kaiser
developed a list of granular ethnicities that could be used for self-reporting separately from the OMB race and
Hispanic ethnicity categories. The code set includes 268 categories, and continual review is planned to ensure
alignment with immigration trends and relevance to health care (Kaiser Permanente, 2009). Appendix G provides
more detail on Kaiser Permanente’s collection of data on race, ethnicity, and language need.
“Unavailable,” “declined,” and “unknown” codes, variations of which are included in the HRET Toolkit’s
suggested format, the Massachusetts Superset, the Contra Costa Health Plan code list, and the Kaiser Permanente
code list, are frequently used in survey analysis. These codes are not presented as response options, but are recorded
by registration/eligibility clerks or surveyors, for example, so that data systems can track the number of persons
for whom the organization has attempted to collect race and ethnicity data. The subcommittee suggests that such
categories be provided for individuals who have not responded (unavailable), refuse to answer (declined), or do
not know (unknown). The “unavailable” category allows data collectors to see that the respondent has not yet
provided the information, so the information should be solicited at a future point of contact with that individual.
In contrast, the “declined” category indicates the individual should not be asked again. In some instances, the
“unknown” category provides a response option if the respondent is adopted, for example, and does not know
his/her race and ethnicity (Taylor-Clark, 2009).
SELECTION OF LOCAL GRANULAR ETHNICITY CATEGORIES
The list of granular ethnicities in Appendix E provides a baseline template for a national standard set of granular ethnicity categories. An entity can decide, based on local circumstances, whether to use 10 or 100 categories
from the national standard list for collection and/or analysis. If the entity sees an increase in the use of the “Other,
please specify:__” option, it should consider adding categories to its local list. If an organization chooses not to
have a preset list of categories, it will need to compile responses according to the national standard list to ensure
comparability with data collected by other entities.
Determining which locally relevant categories to include may initially require subjective judgments about
subgroups believed to be present in large numbers. However, some organizations may not realize the diversity of
their service population and thus may not understand the need to collect the OMB categories and granular ethnicity
data (see Box 3-4). Therefore, specific, locally relevant categories can be determined using population estimates
from geographic-based Census data, school enrollment data that identify newer and growing populations in service areas, indirect estimation techniques, or surveying. However, even constructing a survey may require some
knowledge of persons in the service area; Anthem Blue Cross, for example, solicited through a mailed survey the
race and ethnicity of its California members, but focused on the six OMB race and Hispanic ethnicity categories
0
RACE, ETHNICITY, AND LANGUAGE DATA
BOX 3-4
Realizing the Necessity of Collecting Data:
The University of Mississippi Medical Center
When informed they were to begin collecting race, ethnicity, and language data from patients, employees at University of Mississippi Medical Center (UMMC) almost uniformly indicated that patients would
believe this information would be used to segregate services and would create racial tensions. In fact,
the director in charge of implementing the data collection was convinced that UMMC and the organizations funding and administering the data collection initiative (The Robert Wood Johnson Foundation and
The George Washington University through an Expecting Success project) were “taking gasoline and
pouring it on a blazing fire.”
The registration department initially thought registration staff were already asking for the patient’s race.
The director discussed this with staff and found out they were not asking the patients but were looking at
patients to determine their race. Staff informed management that patients might be offended or become
indignant when asked for the information. Observer report was indicating approximately 180 Hispanic
patients per year registered at UMMC. So what was the point of collecting additional race and ethnicity
data for a reasonably homogenous patient population?
With funding and support from Expecting Success, UMMC implemented a staff training program to
ensure patients would be asked directly their race, ethnicity, and language need. Within months of implementation, UMMC learned it was registering approximately 600 Hispanic individuals per month (approximately 1.5 percent of the 40,000 individuals registered per month) and the patient population was found
to be less homogenous than initially believed. Approximately 500 patients per month were from subgroups
the medical center did not even realize existed in their service area (e.g., Japanese and Russian). UMMC
found that between 3 and 4 percent of the population preferred to talk to a physician in a language other
than English. UMMC now has three full-time Spanish interpreters (where they previously had none) and
switched vendors to ensure their interpreter phone system could handle the types and numbers of interpreter services required. In-house physicians and researchers have begun to utilize the race, ethnicity, and
language data to stratify quality measures.
SOURCE: Personal communication with Richard Pride, UMMC, June 3, 2009.
and 61 additional ethnicity categories considered most pertinent to its enrollees. 18 As all granular ethnicity lists
should also include an “Other, please specify:__” option, the write-in responses may help organizations evaluate
and expand as necessary the granular ethnicity response options provided. If an organization is receiving numerous
write-in responses of “Russian,” for example, it may consider adding a Russian response option.
A variety of entities participate in the health care system, and while each has roles to play in capturing race
and ethnicity data, not all currently collect these data and those that do so may not use uniform methods or categories. There are other entities that collect and report detailed data in ways that comply with the OMB standards
and produce data useful to local and national quality improvement efforts. The subcommittee’s task is to provide
standardized categories “for entities wishing to assess and report on quality of care.” The subcommittee aims to
accomplish this by imposing the least possible data collection burden and without hindering the progress and
processes of entities already collecting detailed data.
The subcommittee focuses its recommendations on care delivery sites and public and private insurers, as these
health care entities are involved in measuring and improving quality, as well as on data collection activities that
provide information about equity in care, care outcomes, quality of care, or utilization of care (e.g., health surveys
18
Personal communication, G. H. Ting, Wellpoint, Inc., February 19, 2009.
DEFINING CATEGORIZATION NEEDS FOR RACE AND ETHNICITY DATA
1
asking about health care). Some public health activities involve delivery of care, but others do not. Because vital
statistics and other public health surveillance systems are organized and supported for purposes beyond health
care quality improvement, these collection activities may require different considerations. All entities related to
health and health care, though, are encouraged to collect race, Hispanic ethnicity, and granular ethnicity data in
accordance with the subcommittee’s recommendations.
The subcommittee considered a stepwise approach to collecting race and ethnicity data, where entities would
first emphasize collecting the data according to the OMB standards and then gradually implement granular ethnicity data collection over time. However, as discussed in Chapter 2, granular ethnicity data are useful for improving
health care quality in many settings, and thus the collection of these data should not be considered a secondary
aim in those settings. While the subcommittee recognizes that full implementation of its recommendations may
require HIT and process changes for some entities (see Chapter 5), race, Hispanic ethnicity, and granular ethnicity data are all necessary to effectively and efficiently target health care quality improvement to groups that are
at risk of suboptimal care.
Recommendation 3-1: An entity collecting data from individuals for purposes related to health and
health care should:
• Collect data on granular ethnicity using categories that are applicable to the populations it
serves or studies. Categories should be selected from a national standard list (see Recommendation 6-1a) on the basis of health and health care quality issues, evidence or likelihood of disparities, or size of subgroups within the population. The selection of categories
should also be informed by analysis of relevant data (e.g., Census data) on the service or
study population. In addition, an open-ended option of “Other, please specify:__” should
be provided for persons whose granular ethnicity is not listed as a response option.
• Elicit categorical responses consistent with the current OMB standard race and Hispanic
ethnicity categories, with the addition of a response option of “Some other race” for persons who do not identify with the OMB race categories.
Consistent Rollup of Granular Ethnicity to OMB Categories
While systems for rolling granular ethnicity categories up to broader categories have been developed by
CDC/HL7 and the Commonwealth of Massachusetts, among others, an agreed-upon rollup strategy for granular
ethnicities has not been determined or reviewed for its applicability nationwide and across the health care system.
For example, the Massachusetts Superset aggregates its set of granular ethnicities to 31 mid-level aggregations
whereas the CDC/HL7 Code Set aggregates its ethnicity categories to only the OMB race and Hispanic ethnicity
categories. A process for rolling granular ethnicity categories up to the OMB categories is key to achieving two
potentially contradictory objectives: on the one hand, consistency and standardization in analysis and reporting,
and on the other hand, data collection tailored to local circumstances. Rollup procedures will need to be employed
only when a person does not check off an OMB race or Hispanic ethnicity and only provides a granular ethnicity
response or when only granular ethnicities are collected; however, the subcommittee prefers separate collection
of granular ethnicity from OMB race and Hispanic ethnicity. The subcommittee chose not to define mid-level
aggregations between granular ethnicity and the OMB categories.
Rollup Issues
The CDC/HL7 Code Set was designed in a hierarchical fashion such that each ethnicity category corresponds
to one of the OMB race or Hispanic ethnicity categories (see Figure 3-3). This rollup scheme can be used when
reporting is required to conform to the OMB categories or when an analyst needs a consistent set of minimum
categories to make comparisons across systems reporting race and ethnicity at different levels of detail. For the vast
majority of individuals, mapping from ethnicity to race categories is not problematic. As discussed in Chapter 1,
however, ethnicity and race are two different concepts. Individuals who self-identify as Brazilian may also identify
2
RACE, ETHNICITY, AND LANGUAGE DATA
OMB Race and
Hispanic Ethnicity
Categories
Asian
Madagascar
has more
than one
major
racial and
ethnic
group
(Black Africans
and Asian
Indians)
Asian Indian
Bangladeshi
Bhutanese
Burmese
Cambodian
Chinese
Madagascar
Taiwanese
Filipino
Hmong
Indonesian
Korean
Laotian
Malaysian
Okinawan
Pakistani
Sri Lankan
Thai
Vietnamese
Iwo Jiman
Maldivian
Nepalese
Singaporean
Japanese
Hispanic or
Latino
Not all
South
Americans
are Hispanic
as there
are five
non-Spanish
speaking
territories
(Brazil, Guyana,
Suriname,
French Guiana,
and Belize)
Spaniard
Cuban
Andalusian
Costa Rican
Asturian
Guatemalan
Catalonian
Honduran
Castillian
Nicaraguan
South American
Panamanian
Belearic Islander
Salvadoran
Gallego
Central American Indian
Valencian
Canal Zone
Spanish Basque
Argentinean
Mexican
Bolivian
Mexican American
Colombian
Mexicano
Ecuadorian
Chicano
Paraguayan
La Raza
Peruvian
Mexican
Uruguayan
Criollo
Venezuelan
Latin American
South American
Puerto Rican
Indian
American Indian or
Alaska Native
Over 800 defined tribal groupings
Native Hawaiian or
Other Pacific Islander
Polynesian
Native Hawaiian
Samoan
Tahitian
Tongan
Tokelauan
Micronesian
Guamanian
Chamorro
Mariana Islander
Marshallese
Palauan
Carolinian
Kosraean
Pohnpeian
Saipanese
Kiribati
Chuukese
Yapese
Melanesian
Fijian
Papau New Guinean
Solomon Islander
New Hebrides
White
European
Armenian
English
French
German
Irish
Italian
Polish
Scottish
Syrian
Assyrian
Egyptian
Iranian
Iraqi
Lebanese
Palestinian
Afghanistani
Israeli
Arab
Middle Eastern
or North African
The U.S.
Census
groups
Afghanistani
with its
geographicallybased
Asian
category
Black or
African American
Black
African American
African
Botswanan
Ethiopian
Liberian
Namibian
Nigerian
Zairean
Bahamian
Barbadian
Dominican
Dominica Islander
Haitian
Jamaican
Tobagoan
Trinidadian
West Indian
Many
Dominicans
consider
themselves
Hispanic,
not Black
FIGURE 3-3 CDC ethnicities rolled up to the OMB minimum categories for race and Hispanic ethnicity with subcommittee
annotations.
as White, Black, or some combination of races, or may see themselves as falling into no category beyond Brazilian.
As a result, a rollup scheme that assumes all respondents who self-identify as Brazilian are White could wrongly
assign a race to a number of individuals.
Figure 3-3 highlights some problems with current CDC rollup procedures. For example, Brazilians may not
be considered Hispanic because they speak Portuguese rather than Spanish. Additionally, several national origins
correspond to two or more major racial populations. For instance, the population of Madagascar is of mixed African, Malayo-Indonesian, and Arab ancestry. This means that rolling up Madagascan to Asian, as recommended by
DEFINING CATEGORIZATION NEEDS FOR RACE AND ETHNICITY DATA
the CDC rollup scheme, would misclassify Africans of Madagascan descent as Asian. Rollup schemes are further
complicated by misclassifications introduced by the use of geographic boundaries. While the CDC rollup scheme
considers Afghanistan to be Middle Eastern and consequently categorizes Afghanis as White, the Census ancestry
list classifies Afghanistan as an Asian country. Additionally, the WCRS coding manual notes that descriptions of
religious affiliation should be “used with caution” when determining corresponding races. 19
The above discussion highlights some of the difficulties inherent in rolling up some ethnicities because
(1) ethnicities can include two or more major racial populations, (2) the geographic boundaries used to distinguish
major groups in different classification schemes are arbitrary, and (3) many individuals may not associate with a
specific race for cultural or other reasons. Thus, an individual’s race cannot always be presumed based on his or
her ethnicity. For this reason, the rollup assignment of a self-reported ethnicity to an OMB category should not
be placed in an individual’s health record or supersede a person’s direct self-report. Analysts should understand
that making an assignment using a 90 percent (or any other percent) threshold or an assignment based solely on
geography incurs a higher probability that the rollup assignment misclassifies individuals based upon how they
would self-identify their race. The rates of misclassification, even for granular ethnicities meeting a 90 percent
threshold, underscores the fact that rollup schemes only provide probabilistic assignments useful for analysis at
the group or population level.
Granular Ethnicities with an Indeterminate Race or Hispanic Ethnicity Classification
Various methods are used to distinguish ethnic groups that cannot be rolled up to a specific race category. For
example, in Census 2010, the Census Bureau will use OMB’s geographic definitions when it reclassifies ethnic
responses in the race question to an OMB race category (e.g., all entries reflecting a sub-Saharan African nation will
be counted as “Black”). In Census 2000, the Census Bureau applied a 90 percent rule to reclassify write-in responses
on the race question according to the OMB race categories (del Pinal et al., 2007).20 Single-ancestry responses were
cross-tabulated by race responses, and if 90 percent or more of respondents in a specific ancestry group selected a
particular race, that race was assigned to respondents who gave that ethnic response in the race question.
To determine whether groups included on the CDC, Census, Massachusetts, and WCRS category lists can
be rolled up to a specific OMB race category with some degree of certainty, the subcommittee evaluated 2000
Public Use Microdata Samples (PUMS) data and used the methodology of the Census Bureau’s 90 percent rule.
The subcommittee cross-tabulated write-in responses on ancestry with the “alone or in combination with one or
more other races” variable for each OMB race group. If fewer than 90 percent of respondents of a specific ancestry
group selected an OMB race either alone or in combination with another race, the ancestry group was identified
as being problematic for rolling up. The subcommittee did not have sufficient data on some granular ethnicity
groups to apply the 90 percent rule to each ancestry subgroup (see Appendix F). The subcommittee finds some
granular ethnicities could not be rolled up to an OMB race category with greater than 90 percent certainty. The
difficult-to-categorize granular ethnicity groups are included in Appendix F.
The subcommittee suggests that those ethnicities that do not meet the 90 percent threshold be classified
as “no determinate OMB race classification.” This classification differs from the “Some other race” category
because “Some other race” is a response option used by individuals who do not identify with a specific OMB
race category. The “no determinate OMB race classification” would be used to identify entire ethnic groups that
cannot be assumed to comprise one specific racial group. None of the granular ethnicities associated with the
19 The Census list of categories does not include religiously affiliated ancestries (e.g., Ashkenazi Jewish) because of the Bureau’s constitutionally rooted decision not to identify or count religious populations. For health care purposes, religion may be coded as a separate variable
from race and ethnicity. For example, the HL7 EHR System Functional Model states that systems shall provide the ability to capture, present,
maintain, and make available for clinical decisions patient preferences such as language, religion, spiritual practices, and culture (Fischetti
et al., 2007).
20 Write-in responses to the questions on race and Hispanic ethnicity were allocated to an OMB race or Hispanic ethnicity category using
the 90 Percent Rule only in the Census’ Modified Race-Age-Sex (MARS) file. The MARS file is used by other agencies seeking denominators
consistent with numerators collected in systems in which “Some other race” is not an option. Otherwise, write-in responses to “Some other
race” are reported as they were received in all data released and published by the Bureau.
4
RACE, ETHNICITY, AND LANGUAGE DATA
Hispanic ethnicity category can be assigned to an OMB race category with greater than 90 percent certainty.
Granular ethnicities that cannot easily be rolled up to the OMB Hispanic ethnicity category include individuals
identifying a granular ethnicity associated with the non-Spanish-speaking territories in South America (Guyana,
Suriname, Brazil, and Belize); additionally, these granular ethnicities should be considered “no determinate OMB
race classification” because they do not meet the 90 percent rule. Appendix F highlights some additional difficultto-categorize granular ethnicity groups, including persons of Moroccan, Brazilian, Cape Verdean, Dominican,
Guyanese, and South African descent.
Rollup Schemes
For interventions aimed at quality improvement and reduction of disparities at the local level, mapping granular
ethnicities to the OMB race categories may be unnecessary. Locally tailored quality improvement activities may
target subgroups without needing to relate those subgroups to a single OMB race category. Collecting race, Hispanic
ethnicity, and granular ethnicity data separately allows reporting of the OMB categories when necessary without
requiring rollup of the granular ethnicities, provided that individuals respond to all the questions asked.
Nonetheless, the subcommittee recognizes that some circumstances will require the use of a rollup scheme
to link granular ethnicities to broader categories to allow comparison or data aggregation. The Massachusetts
Superset was developed to guide health plans toward a uniform set of ethnicities; this set avoids rolling up granular
ethnicities to races and instead aggregates granular ethnicities into broader groups of ethnicities. Such an ethnicity
rollup scheme is useful when the sample of a granular ethnicity group is too small for analysis and needs to be
aggregated with others.
The subcommittee merged several ethnicity lists into a template of granular ethnicity categories. These categories are mapped to the OMB race and Hispanic ethnicity categories (see Appendix E). National agreement needs to
be reached on a rollup scheme, recognizing that all ethnicities do not necessarily map to an OMB race category, so
that some respondents will have “no determinate OMB classification.” The locus of responsibility for the development of a national standard set of ethnicity categories and a national rollup scheme is addressed in Chapter 6.
Recommendation 3-2: Any entity collecting data from individuals for purposes related to health
and health care should collect granular ethnicity data in addition to data in the OMB race and
Hispanic ethnicity categories and should select the granular ethnicity categories to be used from a
national standard set. When respondents do not self-identify as one of the OMB race categories or
do not respond to the Hispanic ethnicity question, a national scheme should be used to roll up the
granular ethnicity categories to the applicable broad OMB race and Hispanic ethnicity categories
to the extent feasible.
ELICITING RESPONSES ON RACE, HISPANIC ETHNICITY, AND GRANULAR ETHNICITY
The ways in which entities inquire about an individual’s race and ethnicity vary based on the setting in which
the questions are asked. For example, paper survey forms use minimal words in questions and category descriptions to solicit race and ethnicity information from respondents. In contrast, surveys administered via an in-person
interview can solicit more detailed information and explain the types of responses desired. Table 3-6 highlights
ways in which race and ethnicity data are captured and illustrates how the questions may be tailored to specific
contexts in health care.
Eliciting accurate and reliable race, Hispanic ethnicity, and granular ethnicity data depends on the ways in
which the questions are asked, the instructions provided to respondents (e.g., “Select one or more”), and the
format of the questions (i.e., one-question versus two-question format). As previously noted, this latter concern
is especially relevant to accurately classifying individuals who self-identify as Hispanic. Ensuring that as many
respondents as possible answer questions regarding their race and ethnicity will improve data quality. Pilot projects
and further study can help determine the best ways to elicit accurate data that are useful for health care quality
improvement and will guide current and future data collection systems.
DEFINING CATEGORIZATION NEEDS FOR RACE AND ETHNICITY DATA
Recommendation 3-3: To determine the utility for health and health care purposes, HHS should
pursue studies on different ways of framing the questions and related response categories for collecting race and ethnicity data at the level of the OMB categories, focusing on completeness and
accuracy of response among all groups.
• Issues addressed should include use of the one- or two-question format for race and Hispanic ethnicity, whether all individuals understand and identify with the OMB race and
Hispanic ethnicity categories, and the increasing size of populations identifying with “Some
other race.”
• The results of such studies, together with parallel studies by the Census Bureau and other
agencies, may reveal the need for an OMB review across all agencies to determine the best
format for improving response among all groups.
MODELS FOR DATA COLLECTION
Figure 3-4 shows models for the collection of data on race, Hispanic ethnicity, and granular ethnicity, taking
into account that the capacity of information systems may limit the number of questions that can be asked. This
report emphasizes the importance of collecting granular ethnicity data in addition to the OMB race and Hispanic
ethnicity questions. Using the approach preferred by OMB of asking two separate questions about Hispanic ethnicity and race and then asking additionally about granular ethnicity requires collecting three separate variables,
regardless of whether through paper-based or electronic collection modes (Model A). For organizations constrained
to two data fields, one collection field would be used to collect responses to the OMB combined race and Hispanic
ethnicity question, followed by a second collection field for granular ethnicity data (Model B).
A distinction needs to be made between limits on collection and storage of coded response information in
HIT systems; some organizations are limited in storage capacity by their legacy HIT systems, but could recode
responses from multiple inputs to occupy fewer fields in HIT systems. For example, if an individual self-identified
as non-Hispanic, White, and Russian on a paper form, the organization could store this information using one code
in its HIT system. Doing so would, of course, introduce a very large number of possible combinations for which
the organization would need to have codes.21 Ultimately, to achieve compatibility across data systems, it may be
necessary for organizations to upgrade their data collection and HIT systems to ensure the ability to collect, report,
and use data as recommended in this report.
SUMMARY
This chapter has explained the subcommittee’s rationale for recommending continued use of the OMB race and
Hispanic ethnicity categories, supplemented by locally relevant granular ethnicity categories. The health and health
care needs of all racial and ethnic groups can be best addressed through comprehensive strategies that recognize
the importance of documenting and addressing variations among and within the locally relevant groups, and that
further provide procedures for aggregating data to provide regional or national profiles.
To collect OMB race and ethnicity data, entities should use either the one-question or two-question format,
depending on their system’s field capacity. In accordance with OMB guidance, when the two-question format is
used, the Hispanic ethnicity question should be first, and a “Select one or more” instruction should be included;
OMB has indicated a preference for the two-question format. The recording of specific multiracial combinations
(e.g., American Indian or Alaska Native and Black) is preferred by the subcommittee over assigning a single
“multiracial” category to all persons of mixed race. A “Some other race” response category should be included
for questions on race for respondents who do not identify with any of the OMB race categories. The minimum
OMB categories to be collected are, then:
21
All possible combinations of just the six OMB categories results in 64 combinations. Introducing granular ethnicities would drastically
increase the possible combinations.
6
RACE, ETHNICITY, AND LANGUAGE DATA
TABLE 3-6 Examples of Instructions, Phrasing, and Terminology to Capture Race and Ethnicity Data
Source of Questions
Hispanic Ethnicity Question
OMB’s preferred format
Separate questions shall
be used wherever feasible.
Ethnicity shall be collected
first
Race Question
Granular Ethnicity Question
Respondents shall be offered
the option of selecting one
or more racial designations.
Recommended forms for the
instruction are “Mark one
Response options: Hispanic or or more” and “Select one or
Latino, Not Hispanic or Latino more”
Response options: American
Indian or Alaska Native, Asian,
Black or African American,
Native Hawaiian or Other
Pacific Islander (NHOPI),
White
Census 2000 long form
(paper form)
HRET Toolkit (in-person
interview)
National Health Interview
Survey (NHIS) (in-person
interview)
Is Person 1 of Hispanic,
Latino, or Spanish origin?
What is Person 1’s race? Mark
one or more boxes
What is this person’s ancestry
or ethnic origin?
Response options: Not of
Hispanic, Latino, or Spanish
origin; Mexican, Mexican Am.,
Chicano; Puerto Rican; Cuban;
Another Hispanic, Latino, or
Spanish origin
Response options: Five OMB
race options plus six additional
Asian origins, three additional
NHOPI origins, and an option
for “Some other race”
Response option: write-in
response
Do you consider yourself
Hispanic/Latino?
Which category best describes
your race?
Response options: Yes;
No; Declined; Unavailable/
Unknown
Response options: American
Indian or Alaska Native; Asian;
Black or African American;
NHOPI; White; Multiracial;
Declined; Unavailable/
Unknown
“I would like you to
describe your race or ethnic
background. You can use
specific terms such as Korean,
Mexican, Haitian, Somali.”
Do you consider yourself to be What race or races do you
Hispanic or Latino?
consider yourself to be? Please
select one or more of these
Response options: Yes; No;
categories
Refused; Don’t know
Response options: White;
Please give me the number of
Black/African American;
the group that represents your Indian (American); Alaska
Hispanic origin or ancestry.
Native; Guamanian; Samoan;
You may choose up to five, if
Other Pacific Islander; Asian
applicable
Indian; Chinese; Filipino;
Japanese; Korean; Vietnamese;
Response options: Puerto
Other Asian; Some other race;
Rico; Cuban/Cuban American; Refused; Don’t know
Dominican (Republic);
Mexican; Mexican American;
(If more than one race entered,
Central or South American;
which of these groups would
Other Latin American; Other
you say best represents your
Hispanic/Latino/Spanish;
race?)
Refused; Don’t know
Response option: free-text
response
DEFINING CATEGORIZATION NEEDS FOR RACE AND ETHNICITY DATA
TABLE 3-6 Continued
Source of Questions
Hispanic Ethnicity Question
Race Question
Granular Ethnicity Question
National Ambulatory Medical Ethnicity
Race, mark one or more
Care Survey (paper form)
Response options: Hispanic or Response options: White;
Latino; Not Hispanic or Latino Black/African American;
Asian; NHOPI; American
Indian or Alaska Native
Application for a Social
Security Card (paper form)
Race/ethnic description (check
one only)
Response options: Asian,
Asian-American or Pacific
Islander; Hispanic; Black (Not
Hispanic); North American
Indian or Alaskan Native;
White (Not Hispanic)
U.S. Standard Certificate of
Death (paper form)
Decedent of Hispanic origin?
Decedent’s race (check one
or more boxes to indicate
what the decedent considered
himself or herself to be)
Response options: No, not
Spanish/Hispanic/Latino;
Mexican, Mexican American,
Chicano; Puerto Rican; Cuban; Response options: Five OMB
Other Spanish/Hispanic/Latino race options plus six additional
(specify)
Asian origins, three additional
NHOPI origins, and other
(specify)
• H
ispanic or Latino (in the two-question format, this is a separate question, having the choice of Hispanic
or Latino and Not Hispanic or Latino)
• Black or African American
• White
• Asian
• American Indian or Alaska Native
• Native Hawaiian or Other Pacific Islander (NHOPI)
• Some other race
The categories used for the collection of granular ethnicity should be locally relevant and selected from a
national standard list. Each set of categories should include an “Other, please specify:__” option to allow individuals to self-identify if their category is not on the prespecified list. Similarly, state or national surveys might
limit the number of listed categories, but should also present the “Other, please specify:__” response option. An
open-ended approach with no pre-specific granular ethnicity response categories is acceptable in lieu of a specified list, but requires subsequent coding of responses according to the national standard set. The granular ethnicity
question, whether presented as a closed- or open-ended question, should be separate from the question(s) involving
the OMB categories.
Organizations may also want to use codes for tracking the current response status of individuals from whom
they have attempted to collect race and ethnicity data, indicating unavailable (no response), declined (refused to
answer), or unknown (respondent does not know) for those who fail to select a category.
RACE, ETHNICITY, AND LANGUAGE DATA
MODEL A
(three variables per individual)
MODEL B
(two variables per individual)
Hispanic Ethnicity Question
Combined Hispanic Ethnicity & Race Question
Example Questions:
v Is this person of Hispanic, Latino, or Spanish origin?
(Source: Census)
v Do you consider yourself Hispanic/Latino? (Source: HRET
Toolkit)
Response Categories:
v Hispanic or Latino
v Not Hispanic or Latino
Race Question
Example Questions:
v What is this person’s race? Select one or more boxes.
(Source: Census)
v Which category best describes your race? (Source:
HRET Toolkit) Check all that apply.
Response Categories:
v Black or African American
v White
v Asian
v American Indian or Alaska Native
v Native Hawaiian or Other Pacific Islander
v Some other race
Example Questions:
v Which category best describes your Hispanic ethnicity
and race? Select one or more.
Response Categories:
v American Indian or Alaska Native
v Asian
v Black or African American
v Hispanic or Latino
v Native Hawaiian or Other Pacific Islander
v White
v Some other race
Granular Ethnicity Question
Example Questions:
v What is this person’s ancestry or ethnic origin? (Source:
Census)
v What specific ethnic group are you? (Source: CHIS)
Response Categories:
v Locally relevant list of categories selected from a
national standard set
v Other, please specify:__
OR
v Open-ended question with responses coded from a
national standard set
FIGURE 3-4 Models for data collection instruments to collect race, Hispanic ethnicity, and granular ethnicity data.
DEFINING CATEGORIZATION NEEDS FOR RACE AND ETHNICITY DATA
9
REFERENCES
AHRQ (Agency for Healthcare Research and Quality). 2006. Databases and related tools from HCUP: Fact sheet. Rockville, MD: AHRQ.
———. 2008. National Healthcare Disparities Report. Rockville, MD: AHRQ.
Arias, E., W. Schauman, K. Eschbach, P. Sorlie, and E. Backlund. 2008. The validity of race and Hispanic origin reporting on death certificates
in the United States. Hyattsville, MD: National Center for Health Statistics.
Austin, C. J., R. J. Thorpe, C. Bell, and T. A. LaVeist. 2009. Are Black Hispanics Black or Hispanic? Understanding disparities at the intersection of race and ethnicity. Paper to be presented at the American Public Health Association Annual Meeting and Expo, Philadelphia, PA,
on November 10, 2009.
Bailey, B. 2001. Dominican-American ethnic/racial identities and United States social categories. International Migration Review
35(3):677-708.
Baker, D. W., K. A. Cameron, J. Feinglass, J. A. Thompson, P. Georgas, S. Foster, D. Pierce, and R. Hasnain-Wynia. 2006. A system for rapidly
and accurately collecting patients’ race and ethnicity. American Journal of Public Health 96(3):532-537.
Barnes, J. S., and C. E. Bennett. 2002. The Asian population: 2000. Washington, DC: U.S. Census Bureau.
Bennett, C., M. de la Puente, D. Griffin, B. Harris-Kojetin, R. Harrison, J. Hill, J. Hilton, T. Leslie, and E. Paisano. 1997. Population Division
Working Paper No. 1: Results of the 1996 Race and Ethnic Targeted Test. Washington, DC: U.S. Bureau of the Census.
Bilheimer, L. T., and J. E. Sisk. 2008. Collecting adequate data on racial and ethnic disparities in health: The challenges continue. Health Affairs
27:383-391.
Blendon, R. J., T. Buhr, E. F. Cassidy, D. J. Perez, K. A. Hunt, C. Fleischfresser, J. M. Benson, and M. J. Herrmann. 2007. Disparities in health:
Perspectives of a multi-ethnic, multi-racial America. Health Affairs 26(5):1437-1447.
Bonito, A. J., C. Bann, C. Eicheldinger, and L. Carpenter. 2008. Creation of new race-ethnicity codes and socioeconomic status (SES) indicators
for Medicare beneficiaries. Final report, sub-task 2. Rockville, MD: RTI International.
Bowman, K. H. 1994. What we call ourselves. The Public Perspective May/June:29-31.
Buescher, P. A., Z. Gizlice, and K. A. Jones-Vessey. 2005. Discrepancies between published data on racial classification and self-reported race:
Evidence from the 2002 North Carolina live birth records. Public Health Reports 120(4):393-398.
CDC (Centers for Disease Control and Prevention). 1993. Use of race and ethnicity in public health surveillance (Report RR-10). Atlanta, GA:
Centers for Disease Control and Prevention.
———. 2000. Race and ethnicity code set version 1.0. Atlanta, GA: Centers for Disease Control and Prevention.
———. 2009. National program of cancer registries facts, 200/2009. Atlanta, GA: Centers for Disease Control and Prevention.
Chesnut, J., J. Woodward, and E. Wilson. 2007. A comparison of closed- and open-ended question formats for select housing characteristics in
the 2006 American Community Survey Content Test. Washington, DC: U.S. Bureau of the Census.
CMS (Centers for Medicare and Medicaid Services). 2009. Physician quality reporting initiative. http://www.cms.hhs.gov/pqri (accessed May
22, 2009).
Cobb, N., P. A. Wingo, and B. K. Edwards. 2008. Introduction to the supplement on cancer in the American Indian and Alaska Native populations in the United States. Cancer 113(Suppl):1113-1116.
Cohen, L. L. 2008. Racial/ethnic disparities in hospice care: A systematic review. Journal of Palliative Medicine 11(5):763-768.
Cresce, A. R., A. D. Schmidley, and R. R. Ramirez. 2004. Identification of Hispanic ethnicity in Census 2000: Analysis of data quality for the
question on Hispanic origin. Washington, DC: U.S. Census Bureau.
del Pinal, J. 2004. Census 2000 testing, experimentation, and evaluation, program topic report No. 9, TR-9: Race and ethnicity in Census 2000.
Washington, DC: U.S. Census Bureau.
del Pinal, J., E. Martin, C. Bennett, and A. Cresce. 2007. Overview of results of new race and Hispanic origin questions in Census 2000. Washington, DC: U.S. Census Bureau.
Durch, J. S., and J. H. Madans. 2001. Methodological issues for vital rates and population estimates: The 1997 OMB standards for data on race
and ethnicity. Vital Health Statistics 4(31).
Edmonston, B., S. M. Lee, and J. S. Passell. 2000 September 22-23. Recent trends in intermarriage and immigration and their effects on the
future racial composition of the U.S. Population. Paper presented at Multiraciality: How Will the New Census Data be Used?, Bard College, Annandale-on-Hudson, New York.
Edwards, B. K. 2009. NCI surveillance research program: SEER, standards for collection of race/ethnicity, measuring health disparities in
cancer surveillance. NCI Surveillance Research Program. Presentation to the IOM Committee on Future Directions for the National
Healthcare Quality and Disparities Reports, February 9, 2009. Washington, DC. PowerPoint Presentation.
Eicheldinger, C., and A. Bonito. 2008. More accurate racial and ethnic codes for Medicare administrative data. Health Care Financing Review
29(3):27-42.
Espey, D. K., C. L. Wiggins, M. A. Jim, B. A. Miller, C. J. Johnson, and T. M. Becker. 2008. Methods for improving cancer surveillance data in
American Indian and Alaska Native populations. Cancer 113(5 Suppl):1120-1130.
Fischetti, L., D. Mon, J. Ritter, and D. Rowlands. 2007. HL EHR TC: Electronic health record system functional model, Release 1. Ann Arbor,
MI: Health Level Seven.
Flores, G., and S. C. Tomany-Korman. 2008. Racial and ethnic disparities in medical and dental health, access to care, and use of services in
US children. Pediatrics 121(2):e286-e298.
90
RACE, ETHNICITY, AND LANGUAGE DATA
Ford, M. E., and P. A. Kelly. 2005. Conceptualizing and categorizing race and ethnicity in health services research. Health Services Research
40(5):1658-1675.
Fraser, I., and R. Andrews. 2009. HCUP data in the National Healthcare Quality & Disparities Reports: Current strengths and potential
improvements. Agency for Healthcare Research and Quality. Presentation to the IOM Committee on Future Directions for the National
Healthcare Quality and Disparities Reports, February 10, 2009. Washington, DC. PowerPoint Presentation.
Friedman, D. J., B. B. Cohen, A. R. Averbach, and J. M. Norton. 2000. Race/ethnicity and OMB Directive 15: Implications for state public
health practice. American Journal of Public Health 90:1714-1719.
Gimenez, M. E. 1989. Latino/’Hispanic’―who needs a name: The case against a standardized terminology. International Journal of Health
Services 19:557-571.
Gold, M., A. H. Dodd, and M. Neuman. 2008. Availability of data to measure disparities in leading health indicators at the state and local levels.
Journal of Public Health Management Practice (Suppl):S36-S44.
Grieco, E. M., and R. C. Cassidy. 2001. Overview of race and Hispanic origin. Washington, DC: U.S. Census Bureau.
Hasnain-Wynia, R., R. Kang, M. B. Landrum, C. Vogeli, D. W. Baker, and J. S. Weissman. 2008 June 8. Disparities within and between hospitals for inpatient quality of care: Targeting resources to close the gap. Paper presented at the Academy Health 2008 Annual Research
Meeting, Washington, DC.
Hayes-Bautista, D. E., and J. Chapa. 1987. Latino terminology: Conceptual bases for standardized terminology. American Journal of Public
Health 77:61-68.
Hernandez-Ramdwar, C. 1997. Multiracial identities in Trinidad and Guyana: Exaltation and ambiguity. Latin American Issues 13(4). http://
webpub.allegheny.edu/group/LAS/LatinAmIssues/Articles/LAI_vol_13_section_IV.html (accessed June 18, 2009).
HHS Data Council. 1999. Improving the collection and use of racial and ethnic data in health and human services. Washington, DC: HHS.
Hirschman, C., R. Alba, and R. Farley. 2000. The meaning and measurement of race in the U.S. Census: Glimpses into the future. Demography
37(3):381-393.
Holup, J. L., N. Press, W. M. Vollmer, E. L. Harris, T. M. Vogt, and C. Chen. 2007. Performance of the U.S. Office of Management and Budget’s
revised race and ethnicity categories in Asian populations. International Journal of Intercultural Relations 31(5):561-573.
Humes, K. 2009. Remarks by Karen Humes, Assistant Division Chief for Special Population Statistics in the Population Division of the U.S.
Census Bureau. Presentation to the IOM Committee on Future Directions for the National Healthcare Quality and Disparities Reports,
February 9, 2009. Washington, DC.
IOM (Institute of Medicine). 2008. Challenges and successes in reducing health disparities: Workshop summary. Washington, DC: The National
Academies Press.
Izquierdo, J. N., and V. J. Schoenbach. 2000. The potential and limitations of data from population-based state cancer registries. American
Journal of Public Health 90(5):695-698.
Jerant, A., R. Arellanes, and P. Franks. 2008. Health status among US Hispanics: Ethnic variation, nativity, and language moderation. Medical
Care 46(7):709-717.
Johnson, C. H., and M. Adamo. 2008. The SEER program coding and staging manual 200. Bethesda, MD: National Cancer Institute.
Jones, N. A., and A. S. Smith. 2001. The two or more races population: 2000. Washington, DC: U.S. Census Bureau.
Kaiser Family Foundation. 2009. Putting women’s health care disparities on the map: Examining racial and ethnic disparities at the state level.
Menlo Park, CA: The Henry J. Kaiser Family Foundation.
Kaiser Permanente. 2009. Evolution of data collection on race, ethnicity, and language. Oakland, CA: Kaiser Permanente.
Lancaster, K. J., S. O. Watts, and L. B. Dixon. 2006. Dietary intake and risk of coronary heart disease differ among ethnic subgroups of Black
Americans. Journal of Nutrition 136:446-451.
Laws, M. B., and R. A. Heckscher. 2002. Racial and ethnic identification practices in public health data systems in New England. Public Health
Reports 117(1):50-61.
Lin, S. S., and J. L. Kelsey. 2000. Use of race and ethnicity in epidemiologic research: Concepts, methodological issues, and suggestions for
research. Epidemiologic Reviews 22(2):187-202.
Llanos, K., and L. Palmer. 2006. Using data on race and ethnicity to improve health care quality for Medicaid beneficiaries. Hamilton, NJ:
Center for Health Care Strategies.
Madans, J. H. 2009. Race/ethnic data collection: Population surveys and administrative records. National Center for Health Statistics. Presentation to the IOM Committee on Future Directions for the National Healthcare Quality and Disparities Reports, February 9, 2009.
Washington, DC. PowerPoint Presentation.
Martin, E., T. J. Demaio, and P. C. Campanelli. 1990. Context effects for Census measures of race and Hispanic origin. Public Opinion Quarterly 54:551-566.
Massachusetts Executive Office of Health and Human Services. 2009a. 129 CMR 2.00: Uniform reporting system for health care claims data
sets. Boston, MA: Massachusetts Health Care Quality and Cost Council.
———. 2009b. FY200 inpatient hospital discharge database documentation manual. Boston, MA: Division of Health Care Finance and
Policy.
Mays, V. M., N. A. Ponce, D. L. Washington, and S. D. Cochran. 2003. Classification of race and ethnicity: Implications for public health. Annual Review of Public Health 24:83-110.
McAlpine, D. D., T. J. Beebe, M. Davern, and K. T. Call. 2007. Agreement between self-reported and administrative race and ethnicity data
among Medicaid enrollees in Minnesota. Health Services Research 42(6p2):2373-2388.
McBean, A. 2006. Improving Medicare’s data on race and ethnicity, Medicare brief. Washington, DC: National Academy of Social Insurance.
DEFINING CATEGORIZATION NEEDS FOR RACE AND ETHNICITY DATA
91
McKenney, N. R., and C. E. Bennett. 1994. Issues regarding data on race and ethnicity: The Census Bureau experience. Public Health Reports
109(1):16-25.
Medi-Cal. 2009. Apply for Medi-Cal, individuals and families. http://www.dhcs.ca.gov/services/medi-cal/Pages/MCIndividual.aspx (accessed
June 2009).
Model, S., and G. Fisher. 2008. Penalized for race, penalized for ethnicity: The earnings of Cape Verdean immigrants. Paper presented at American Sociological Association Annual Meeting, Sheraton Boston and the Boston Marriott Copley Place, Boston, MA.
NRC (National Research Council). 2006. Multiple origins, uncertain destinies: Hispanics and the American future. Edited by M. Tienda and F.
Mitchell. Washington, DC: The National Academies Press.
———. 2009. Experimentation and evaluation plans for the 2010 Census: Letter report. Washington, DC: The National Academies Press.
OMB (Office of Management and Budget). 1977. Statistical policy directive No. 1, race and ethnic standards for federal statistics and administrative reporting. http://wonder.cdc.gov/wonder/help/populations/bridged-race/Directive15.html (accessed August 3, 2009).
———. 1997a. Recommendations from the Interagency Committee for the Review of the Racial and Ethnic Standards to the Office of Management and Budget concerning changes to the standards for the classification of federal data on race and ethnicity. Federal Register
(3110-01):36873-36946.
———. 1997b. Revisions to the standards for the classification of federal data on race and ethnicity. Federal Register 62:58781-58790.
———. 2000. OMB bulletin No. 00-02. http://www.whitehouse.gov/omb/bulletins/b00-02.html (accessed January 14, 2009).
Palmer, L. 2004. Learning from each other: Assessing how Medicaid agencies collect racial/ethnic data. Hamilton, NJ: Center for Health Care
Strategies. PowerPoint Presentation.
Portes, A., and R. G. Rumbaut. 2001. Legacies: The story of the immigrant second generation. Berkeley, CA: University of California Press and
Russell Sage Foundation.
Read, J. G., M. O. Emerson, and A. Tarlov. 2005. Implications of Black immigrant health for U.S. racial disparities in health. Journal of Immigrant Health 7(3):205-212.
Reilly, T. 2009. Data improvement efforts: Centers for Medicare & Medicaid Services. Centers for Medicare & Medicaid Services. Presentation
to the IOM Committee on Future Directions for the National Healthcare Quality and Disparities Reports, February 9, 2009. Washington,
DC. PowerPoint Presentation.
Romano, P. S., J. J. Geppert, S. Davies, M. R. Miller, A. Elixhauser, and K. M. McDonald. 2003. A national profile of patient safety in U.S.
hospitals. Health Affairs 22(2):154-166.
Rosenberg, H. M., J. D. Maurer, P. D. Sorlie, N. J. Johnson, M. F. MacDorman, D. L. Hoyert, J. F. Spitler, and C. Scott. 1999. Quality of death
rates by race and Hispanic origin: A summary of current research, 1999. Vital Health Statistics 2(128):1-13.
Rothenberg, P. S. 2006. Race, class, and gender in the United States: An integrated study, seventh edition. New York: Macmillan.
Schoenman, J. A., J. P. Sutton, S. Kintala, D. Love, and R. Maw. 2005. The value of hospital discharge databases. Rockville, MD: AHRQ.
Sequist, T. D., and E. C. Schneider. 2006. Addressing racial and ethnic disparities in health care: Using federal data to support local programs
to eliminate disparities. Health Services Research 41(4p1):1451-1468.
Shah, N. S., and O. Carrasquillo. 2006. Twelve-year trends in health insurance coverage among Latinos, by subgroup and immigration status.
Health Affairs 25(6):1612-1619.
Snipp, C. M. 1989. American Indians: The first of this land. New York: Russell Sage.
———. 2003. Racial measurement in the American Census: Past practices and implications for the future. Annual Review of Sociology
29:563-588.
Tafoya, S. 2004. Shades of belonging: Latinos and racial identity. Washington, DC: Pew Hispanic Center.
Taylor-Clark, K. 2009. Race/ethnicity/language data collection and reporting. The Brookings Institution. Presentation to the IOM Committee on Future Directions for the National Healthcare Quality and Disparities Reports, February 9, 2009. Washington, DC. PowerPoint
Presentation.
Taylor-Clark, K., A. B. Anise, Y. Joo, and M. Chin. 2009. Massachusetts Superset. Washington, DC: The Brookings Institution.
Tiutin, O. 2009. Language assistance data base (LADB), based on CDC race/ethnicity codes and ISO language codes. Martinez, CA: Contra
Costa Health Plan.
Tucker, C., R. McKay, B. Kojetin, R. Harrison, M. de la Puente, L. Stinson, and E. Robinson. 1996. Testing methods of collecting racial and
ethnic information: Results of the Current Population Survey Supplement on Race and Ethnicity. Washington, DC: Bureau of Labor
Statistics.
U.S. Census Bureau. 1996. Population division working paper No. 16: Findings on questions on race and Hispanic origin tested in the 1996
National Content Survey. Washington, DC: U.S. Census Bureau.
———. 2000. Census 2000 summary file 1: 100-percent data. Washington, DC: U.S. Census Bureau.
———. 2002a. Census 2000 summary file : Technical documentation. Washington, DC: U.S. Census Bureau.
———. 2002b. Modified race data summary file: 2000 Census of population and housing, technical documentation. http://www.census.gov/
popest/archives/files/MRSF-01-US1.html#fig1 (accessed February 25, 2009).
———. 2005. ACS 1-year PUMS ancestry code list. Washington, DC: U.S. Census Bureau.
———. 2008. Ancestry. http://www.census.gov/population/www/ancestry/ancoverview.html (accessed May 24, 2009).
U.S. House Committee on Ways and Means, Subcommittee on Health. 2008. Addressing disparities in health and healthcare: Issues for reform.
Washington, DC: U.S. House Committee on Ways and Means.
U.S. Senate Finance Committee. 2009. Description of policy options, transforming the health care delivery system: Proposals to improve patient
care and reduce health care costs. Washington, DC: U.S. Senate Committee on Finance.
92
RACE, ETHNICITY, AND LANGUAGE DATA
Wallman, K. K. 2009. Current and future federal standards for race/ethnicity/language data. U. S. Office of Management and Budget. Presentation to the IOM Committee on Future Directions for the National Healthcare Quality and Disparities Reports, February 9, 2009.
Washington, DC. PowerPoint Presentation.
Wei, I. I., B. A. Virnig, D. A. John, and R. O. Morgan. 2006. Using a Spanish surname match to improve identification of Hispanic women in
Medicare administrative data. Health Services Research 41(4):1469-1481.
Weinick, R. M., J. M. Caglia, E. Friedman, and K. Flaherty. 2007. Measuring racial and ethnic health care disparities in Massachusetts. Health
Affairs 26(5):1293-1302.
Wisconsin Cancer Reporting System. 2008. WCRS abstract code manual, 2nd edition. Madison, WI: Division of Public Health, Wisconsin
Department of Health Services.
Yu, E., and W. Liu. 1992. U.S. national health data on Asian Americans and Pacific Islanders: A research agenda for the 1990s. American Journal of Public Health 82(12):1645-1652.
4
Defining Language Need and Categories for Collection
Data on a person’s language and communication needs should be part of any minimum data set related to
health care delivery and quality improvement. The subcommittee recommends identifying spoken language
need by determining first how well an individual believes he/she speaks English and then what language
he/she needs for a health-related encounter. The subcommittee defines limited English proficiency (LEP)
in the health care context as speaking English less than very well. To simplify the collection of language
data, most entities should develop a list of common languages used by their service population, accompanied by an open-ended response option for those whose language does not appear on the list. When
an entity has the capacity to collect additional information, the language preferred for written materials
and the language spoken at home are also valuable. Locally relevant lists of language categories should
be derived from a national standard list, with coding to facilitate information flow across entities.
The collection of data on the language needs of patients is important to improving health and health care.
Collection of these data is necessary to meet legal obligations based on federal funding aimed at ensuring equitable
access to health services and preventing discrimination based on national origin or limited ability to speak English.
More important in the present context, however, knowledge of which patients have limited English proficiency
(LEP) and of what their language needs are allows medical services and related interventions (e.g., provision of
language assistance services, outreach, educational activities, translation of documents) to be targeted with the
aim of improving the quality of care and reducing disparities. Not all persons with LEP are foreign born; more
than one in four people aged 5 and over with LEP are born in the United States, and many more are naturalized
citizens or documented immigrants (U.S. Census Bureau, 2003d; Youdelman, 2008).
Evidence on variations in health outcomes, medical errors, and receipt of quality health care as a function of
English-language ability is persuasive that disparities exist, as reviewed in this chapter. Lack of English proficiency
is a barrier not just to effective communication with individual health care providers, but also to accessing care in
the first place. A review of the evidence base in this area convinced the subcommittee that the collection of data
on language and communication needs is essential to safe, accessible, and effective, quality health care.
The subcommittee reviews various approaches to the collection of language data for health care improvement
purposes. These approaches include practices of the U.S. Census Bureau because its data can easily be accessed
to identify the spoken languages most often in use in a given geographic area, as well as a local population’s
9
94
RACE, ETHNICITY, AND LANGUAGE DATA
proficiency with the English language. Additional guidance from the experiences of physicians, hospitals, health
plans, states, and advocacy groups informed the subcommittee’s deliberations. Issues surrounding the collection
of language data include understanding whether there is demand for language services in the health care sector
(e.g., among hospitals, physicians) and across states, whether data should be collected for both spoken and written
language needs, what languages would make up a national standard set of categories, and how those languages
should be coded for sharing of data beyond a single service site. It should be noted that the subcommittee’s definition of language is one that is inclusive of communication needs such as sign language.
This chapter begins by reviewing what is known about the role of language in the provision of quality health
care and health outcomes. It then summarizes estimates of populations needing language assistance and applicable
legislation and regulatory requirements. Next is a discussion of various approaches used to question patients about
their language needs. Language categories to be used by health care entities to collect these data and possible code
sets are then considered.
THE ROLE OF LANGUAGE IN HEALTH AND HEALTH CARE
Interactions with Patients Needing Language Assistance
The number of people nationwide needing language assistance is growing rapidly (Shin and Bruno, 2003), and
individuals with these needs interact with the health care system daily. The extent of this interaction is revealed by
recent surveys on encounters with LEP patients in hospitals, physician offices, and community health centers:
• E
ighty percent of hospitals provide services to LEP patients regularly, and 63 percent of hospitals encounter
these patients daily or weekly (Hasnain-Wynia et al., 2006);
• E
ighty-one percent of general internal medicine physicians commonly treat LEP patients (54 percent at
least once a day or a few times a week; 27 percent a few times a month) (American College of Physicians,
2007);1 and
• Eighty-four percent of federally qualified health centers provide clinical services each day to LEP patients—
45 percent see more than 10 LEP patients per day; 39 percent see from one to 10 per day (National Association of Community Health Centers, 2008).
One study of hospitals indicated that 80 percent of hospitals have a health information technology (HIT)
field dedicated to collection of language names, primarily to identify the languages needed for interpreter services
(Regenstein and Sickler, 2006). Health care entities use a number of different approaches to collect this information: some limit the response categories to English, Spanish, and an “other language” category, while others offer
respondents 200–300 languages from which to choose (Regenstein and Sickler, 2006; Tang, 2009). A study of
the practice of internal medicine physicians found that only 28 percent kept detailed records of primary language
needs, and about two-thirds of those who did record this information did so on paper rather than in a data system
(American College of Physicians, 2007). By contrast, Kaiser Permanente, a health plan and a service provider
covering eight states, began collecting data in 2009 in its electronic health record (EHR) system using a list of
131 spoken languages and 119 written languages (Tang, 2009).
Health care entities may serve LEP patients by using bilingual health care providers; other bilingual staff
trained in medical terminology; or, frequently, ad hoc interpreters, such as family members or bilingual staff with
no knowledge of medical terminology. The latter approach is particularly prone to error (Flores, 2005, 2006b).
Telephone interpretation services are also available from numerous sources; more than 200 different languages are
offered by some interpretation and translation services (ASIST Translation Services, 2009; Language Line Services, 2009). Depending on the diversity of the population served, an entity may encounter persons with language
assistance needs in just a few or many languages. New York Presbyterian Hospital, for example, reports providing
interpretation in 95 languages (NQF, 2009). Reimbursement for the provision of interpretation and translation
1
12 percent of active patients in overall practice.
DEFINING LANGUAGE NEED AND CATEGORIES FOR COLLECTION
9
BOX 4-1
Language Concordance Between Patients and Providers
Being able to speak to patients in their own language breaks down barriers, and some entities try to
assign patients to language-concordant providers whenever possible. A growing body of literature finds
that language concordance between patients and providers (i.e., both speak the patient’s primary language
well) results in greater patient understanding, leading to increased satisfaction (Green et al., 2005; NgoMetzger et al., 2007), better medication adherence (Manson, 1988), greater understanding of diagnoses
and treatment (Baker et al., 1996a), greater well-being and better functioning for persons with chronic
disease (Perez-Stable et al., 1997), and more health education (Eamranond et al., 2009; Ngo-Metzger et
al., 2007). When providers and patients are language discordant, some but not all effects can be mitigated
by having trained interpreters (e.g., health education improves but not ratings of interpersonal care) (NgoMetzger et al., 2007). To ensure qualified interpreters or fully fluent providers, there has been movement
toward training and certifying interpretation staff and ensuring the bilingual and cultural competence of
providers (Cooper and Powe, 2004; Kettrick, 2008; Moreno et al., 2007; Youdelman, 2008).
services is not always available (e.g., not under Medicare, or when states elect not to provide a match for Medicaid funding for such services) (Bagchi and Stevens, 2006; Chen et al., 2007; Ku and Flores, 2005; Minnesota
Department of Health Office of Rural Health Primary Care, 2008; Ponce et al., 2006b; Youdelman, 2007). Reauthorization of the Children’s Health Insurance Program (CHIP) in 2009 increased federal matching for language
services from 50 to 75 percent.2 An analysis of the adequacy of different means of providing language services
and the funding of such services is beyond the scope of this report, but the issues have been examined by others
(Gany and Ngo-Metzger, 2007; Karliner et al., 2007; Saha and Fernandez, 2007).
Too often, either ad hoc or no interpretation services are available when LEP individuals seek health care
services. There are no good estimates of how many LEP patients who need interpretation services fail to receive
them, but a figure of nearly 50 percent was found in one emergency room study (Baker et al., 1996a).
Uses of Language Data
Entities that collect language data may use the data in various ways. The most obvious ways are to provide
direct language assistance during a clinical encounter and information for follow-up care, such as chronic disease
management education or discharge instructions in a patient’s language. Categorical data on demand for language
assistance can inform hiring of bilingual staff or arrangements for interpretation services. An entity also might
want to make appointments for patients with providers who are language concordant (Box 4-1). A hospital might
want to track whether patients who receive language assistance have better outcomes on quality metrics compared
with those who do not receive those services, or it might want to track whether those services are timely (Box 4-2).
Language data also are useful for determining the need for translated materials; for example, Kaiser Permanente
translated its Health Care Glossary into six languages to communicate commonly used terms and explanatory
information about tests or conditions more effectively (NCQA, 2007). The California Healthy Families program
indicates in which languages health plans have written materials on coverage, medical care reminders, member
handbooks, and newsletters (California Healthy Families, 2008b).
Additionally, the profile of patients being served can be compared with the population statistics of the service area to identify populations not being served. Yet while evidence shows that some health care entities collect language data on their patients, most entities fail to use these data to assess how language barriers impact
2
Children’s Health Insurance Program Reauthorization Act of 2009, Public Law 111-3, 111th Cong., 1st sess. (February 4, 2009).
96
RACE, ETHNICITY, AND LANGUAGE DATA
BOX 4-2
Assessing Whether Language Assistance Needs Are Met
The Speaking Together: National Language Services Network program engaged 10 hospitals with diverse patient populations to examine how to improve the quality and availability of health care services for
LEP patients. According to Director Marsha Regenstein, “Screening for preferred language is a fundamental
component in any measurement strategy related to quality improvement in language services.” Screening for language service needs proved less difficult than linking data to patient care needs and assessing
timeliness of services. Some possible performance metrics emerged from the program, including percentage of patients who have been screened for preferred spoken language and percentage of patients with
language needs who receive an initial assessment and discharge instructions from assessed and trained
interpreters or bilingual providers.
Cambridge Health Alliance took advantage of its EHR system to identify whether an interpreter was
used, the time the interpreter spent, and the types of activities in which he/she engaged with patients (e.g.,
encounters with physician, informed consent, teaching, patient discharge). Another hospital tracked the
increasing portion of patients who were screened for depression in their own language. Speaking Together,
sponsored by The Robert Wood Johnson Foundation, offers a toolkit that details additional promising practices and lessons learned in implementation; see www.speakingtogether.org.
SOURCES: Regenstein, 2009; Regenstein and Sickler, 2006; RWJF, 2008.
the quality of care and ultimately patients’ health status (Regenstein and Sickler, 2006). It should be noted that
recommendations on which specific quality improvement actions should be undertaken by entities is beyond the
subcommittee’s charge.
Effect of Language on Health Status, Access to Care, Health Outcomes, and Patient Safety
It is well established that LEP patients encounter significant disparities in access to health care (Hu and
Covell, 1986; Weinick and Krauss, 2000), decreased likelihood of having a usual source of care (Kirkman-Liff
and Mondragon, 1991; Weinick and Krauss, 2000), increased probability of receiving unnecessary diagnostic
tests (Hampers et al., 1999), and more serious adverse outcomes from medical errors (Divi et al., 2007) and drug
complications (Gandhi et al., 2000).3 The evidence also suggests that language barriers can increase the likelihood
that patients will miss appointments, make less use of preventive care (Brach et al., 2005; Ku and Flores, 2005), or
feel dissatisfied with health care services (Carrasquillo et al., 1999; Weech-Maldonado et al., 2003). On the basis
of the findings detailed below, the subcommittee concludes that assessing language needs for each individual is an
essential first step toward ensuring effective health care communication, and that provision of language assistance
services is an actionable quality improvement option.
3
Search terms in PubMed included “health care quality,” “limited English proficiency,” “language barrier,” and “health care disparity.”
Selected articles from this review are cited due to space limitations. Few studies were identified that reported no language proficiency effects,
suggesting the possibility that the literature base itself is biased toward reporting positive effects. The few studies reporting no effects had
methodological issues (Enguidanos and Rosen, 1997; Estrada et al., 1990; Stone et al., 1998).
DEFINING LANGUAGE NEED AND CATEGORIES FOR COLLECTION
9
Effect of Language on Health Status
A growing literature documents a link between language barriers and poor quality health care (Pippins et
al., 2007; Woloshin et al., 1995) that can lead to lower health status (DuBard and Gizlice, 2008). Research also
indicates that this link can be broken by the use of interpreters. For example, use of interpreters is associated with
improvements in the rate of follow-up visits after a visit to the emergency department (Karliner et al., 2007), in
prescriptions written and filled (Flores et al., 2005), and in the need for obstetrical interventions.
Many studies that do not directly evaluate how language barriers impact health status examine how language
incompatibility or LEP leads to different medical management than that received by patients who do not have these
limitations or are provided with interpreters (Bard et al., 2004; Bernstein et al., 2004; Sarver and Baker, 2000;
Waxman and Levitt, 2000). For example, LEP patients who needed but did not receive interpreter services experienced less satisfaction with their health care interactions, including less friendliness, time spent, and perceived
concern for the patient, than those provided with or not needing interpreters (Baker, 1998). Recent studies have also
revealed how language barriers can result in delays in prehospital care (Grow et al., 2008), less social interaction
between dental staff and LEP patients (Hammersmith and Lee, 2008), and more negative clinical experiences in
health care settings (Hampers et al., 1999) relative to non-LEP patients. One survey of care provided mainly in
safety net hospitals found that the experiences of uninsured patients with access to an interpreter were comparable
to or better than those of insured patients with no need for an interpreter (Andrulis et al., 2002). Moreover, families
of non-English-speaking patients receive less information relevant to high-quality end-of life-care (Thornton et
al., 2009). Such evidence suggests that language is a central factor in being able to achieve optimal health status
and that bridging language gaps is essential to ensure quality care.
Language barriers prevent providers from obtaining accurate patient histories, impair the ability to engage
patients in joint patient–provider decision-making on treatment, and limit patients’ ability to obtain sufficient
information for self-care (Wisnivesky et al., 2009). Poor patient–provider communication has been linked, for
example, to poor asthma management practices in children (Chan et al., 2005) and in adults (Wisnivesky et al.,
2009). It has also been associated with poor adherence to medication regimens (David and Rhee, 1998; Derose
and Baker, 2000; Orrell et al., 2003) and concerns about unequal power dynamics between patients and providers
(Schlemmer and Mash, 2006).
Effect of Language on Access to Care
Language barriers are closely linked to limitations in access to care (Wu et al., 2004) and to underuse of
primary and preventive services (Woloshin et al., 1997), such as preventive cancer screenings (Jacobs et al., 2005;
Ponce et al., 2006a), immunizations (De Alba and Sweningson, 2006; Sun et al., 1998), and routine check-ups
(Pearson et al., 2008). In their examination of language-concordant and language-discordant patient–provider
interactions in emergency services, Sarver and Barker (2000) discovered that the latter patients were less likely
to receive follow-up appointments.
LEP is also associated with lower rates of prescription medication use, ambulatory visits, dental visits, and
appropriate mental health treatment (Brach et al., 2005; Derose and Baker, 2000; DuBard and Gizlice, 2008; Sentell
et al., 2007). This lower use of services may be associated with feelings of being discriminated against, as well
as lower levels of trust and less confidence in medical visits, for those with language barriers, noted in particular
among older Latinos (Mutchler et al., 2007). Language barriers have also been closely related to patient-perceived
quality of care; for example, 81 percent of English-speaking patients with colorectal cancer reported receiving
high-quality care, compared with only 52 percent of non-English-speaking patients (Ayanian et al., 2005). The
lower use of services by non-English speaking persons may also reflect the patient’s inability to articulate medical
or mental health concerns to health care providers that are less easily measured by objective laboratory tests so
that appropriate diagnoses can be made (Sentell et al., 2007).
The inability to communicate with insurance personnel can also create difficulties in enrolling in a health plan
(Feinberg et al., 2002), as well as in securing a usual source of care (Kirkman-Liff and Mondragon, 1991). One
study, for example, found reduced enrollment of Medicaid-eligible children in publicly funded health insurance
9
RACE, ETHNICITY, AND LANGUAGE DATA
programs because of parental difficulties in understanding enrollment forms (Feinberg et al., 2002). Similarly, a
study of LEP Medicare beneficiaries demonstrated poorer access to a usual source of care as compared with those
who were not LEP (Ponce et al., 2006a).
Research suggests that Spanish-speaking patients, as well as Spanish-speaking parents of pediatric patients,
experience worse communication with their provider as compared with their English-speaking counterparts and
less overall satisfaction with care (Jacobs et al., 2006). In one study, 89 percent of LEP Latinos who reported
having a usual source of care cited the presence of interpreters or bilingual providers (Brach and Chevarley, 2008),
implying that language capacity may be required to provide continuity of care for LEP patients. In addition, LEP
patients who are seen by language-concordant providers demonstrate decreased likelihood of omitting medications
and visiting the emergency department relative to those seen by language-discordant providers (Carter-Pokras et
al., 2004; Manson, 1988). Tocher and Larson found no differences in meeting quality-of-care guidelines for LEP
patients with diabetes (1998) or in the amount of time physicians spent with primary care patients (1999) in a
setting with certified interpretation services available.
Effect of Language on Health Outcomes
Research has documented that poor health outcomes are more likely when language and cultural barriers exist
between patients and providers (Anderson et al., 2003). Communication breakdowns occur when patients and providers are language discordant (Baker et al., 1998; Karliner et al., 2004). Results from several studies (Marcos et
al., 1973; Price and Cuellar, 1981) suggest that LEP patients provide more elaborate replies with greater disclosure
when interviewed in their primary language and that conducting the assessment in the patient’s primary language
may be particularly relevant for accurate diagnosis. The absence of language concordance between patient and
provider and consequent reliance on ad hoc interpreters may impede disclosure of sensitive information (Marcos,
1979). It also negatively impacts comprehension of instructions and other treatment information necessary for
adherence to and continuity of treatment (Wilson et al., 2005). Flores and colleagues (2005), for example, found
that LEP patients who need but lack access to an interpreter have a poorer understanding of their medical diagnosis
and treatment (Flores et al., 2005).
Language also appears to impact health outcomes by influencing the quality of the patient–provider relationship, including the development of trust, adherence to treatment, and follow-up (Rivadeneyra et al., 2000).
LEP patients are more likely than those with good English-language proficiency to report inaccurate diagnoses,
inadequate treatments, or negative health outcomes (Phelan and Parkman, 1995). Thus, if language barriers exist,
diagnostic assessments, symptom disclosure, confidentiality, and treatment adequacy may be compromised (Baker
et al., 1996b; Carrasquillo et al., 1999; Perez-Stable et al., 1997) and health outcomes suffer as a result.
Effect of Language on Patient Safety
Systematic literature reviews find that use of ad hoc interpreters is related to higher rates of communication
errors and increased likelihood of clinical errors (Flores et al., 2005; Karliner et al., 2007). Family members and
friends who act as ad hoc interpreters and do not understand the medical terminology involved or lack sufficient
fluency in both languages are likely to interpret with errors (Flores et al., 2003). Typical errors include omissions,
additions, condensations or abbreviations, substitutions, editorialization (interpreter adds or substitutes words
that change the message), and false fluency (use of inaccurate words or phrases) (Flores et al., 2003). Flores and
colleagues (2003) found that Spanish-speaking patients in an outpatient pediatric clinic experienced an average of
31 errors in medical interpretation by ad hoc interpreters and providers without sufficient language fluency, and
more than half of these patients could have experienced negative adverse effects as a consequence of those errors.
(It should be noted that, although research has documented a variety of interpretation errors during assessments,
the clinical significance of such errors has not been well characterized.) Elderkin-Thompson and colleagues also
found interpretation errors in more than 50 percent of videotaped encounters with nine Spanish-speaking nurses
untrained in medical topics they were regularly called upon to interpret for LEP patients (Elderkin-Thompson et
al., 2001).
DEFINING LANGUAGE NEED AND CATEGORIES FOR COLLECTION
99
Linguistic discordance can encompass differences in the concepts behind words and in the contexts giving
meaning to those words (Flores et al., 2005). As a result, some researchers recommend that providers partner with
trained interpreters who can bridge not only linguistic gaps but also cultural gaps that may challenge patient–provider communication (Dohan and Levintova, 2007).
Also of concern is that LEP patients without interpreters (compared with English-speaking patients and LEP
patients with professional interpreters) receive fewer tests and procedures, which could lead to an increased risk
for problems in the emergency department (Bernstein et al., 2004). Likewise, the lack of English language proficiency among the parents of pediatric patients has been correlated with a doubling of the risk of adverse medical
events during pediatric hospitalizations (Cohen et al., 2005). In addition, LEP patients evidenced increased risk
of misunderstanding prescription labels when seeing language-discordant providers compared with English-fluent
patients (Wilson et al., 2005). Similarly, in one study, 27 percent of patients who needed but failed to receive
interpreter services did not understand their medication instructions, compared with 2 percent who received such
services (Andrulis et al., 2002).4
ESTIMATES OF POPULATIONS NEEDING LANGUAGE
ASSISTANCE AND APPLICABLE REQUIREMENTS
This section examines national estimates of the numbers of people in the United States whose primary language at home is not English and the portion who is not proficient in English who therefore may need language
assistance during health care encounters. It also reviews applicable national legislative and regulatory requirements
that may guide the collection of language-related data.
Estimates of Populations Needing Language Services
Census questions provide a starting point for determining the language needs of individuals in different geographic areas through a comparable data set (Shin and Bruno, 2003). Since 1980, the Census has asked whether
each person aged 5 years and older speaks a language other than English at home. This population doubled in
absolute numbers from 1980 to 2000, and its percentage of the population over age 5 grew from 11 percent (23.1
million) in 1980 and 14 percent (31.8 million) in 1990 to 18 percent (47 million) in 2000 (Shin and Bruno, 2003).
Respondents who speak a language other than English at home are also asked to enter the language they speak on
an open-format response line and to rate their facility with spoken English (Figure 4-1). The same questions will
be posed in Census 2010 and on the American Community Surveys. The Census asks no questions about reading
or writing ability in English.
Assessment of Limited English-Speaking Ability
One simplified approach to assessing English-speaking ability is to ask people to rate themselves. The Census
asks people to rate their ability to speak English on a scale from “very well” to “not at all” (see Figure 4-1). These
ratings are based on self-defined and -perceived ability and not any specific test. Of the 47 million people aged 5 and
older who reported speaking a language other than English at home on Census 2000, 55 percent reported speaking
English “very well,” 22 percent “well,” 16 percent “not well,” and 7 percent “not at all” (Shin and Bruno, 2003).
The proportion who spoke English very well was similar in 1980, when it was at 56 percent (Kominski, 1989).
The criteria chosen to define LEP significantly affect the size of the LEP population. If LEP is defined as those
who speak English less than “very well,” the Census 2000 LEP population numbers 21.3 million people over the
age of 5 (more recent American Community Survey [ACS] LEP data estimate the total population at 23 million)
(Youdelman, 2008). If it is defined as those who fall into the categories of “not well” and “not at all,” the LEP
population numbers 10.9 million. The Census employs another measure called “linguistic isolation,” meaning that
no one ages 14 or older in the household speaks English. This population of 11.9 million is similar in size to that
4
New York State requires translation and interpretation services by pharmacies (Office of the Attorney General, 2008).
100
RACE, ETHNICITY, AND LANGUAGE DATA
FIGURE 4-1 Census 2000 questions about language.
SOURCE: Shin and Bruno, 2003.
resulting from the more constrained LEP definition (Shin and Bruno, 2003). LEP individuals may have someone
in their family that they can call upon when they need help with interpretation, but those in linguistically isolated
households must look elsewhere for language assistance.
Through schooling, children of immigrants eventually achieve a high degree of linguistic integration, and only
a minority of immigrants’ grandchildren retains bilingualism (Alba, 2005). A larger proportion of young people
(aged 5–17) than of those who are older, who live in homes where a non-English language is spoken, speak English
“very well” (U.S. Census Bureau, 2003b, 2003c). Even among first-generation immigrants to the United States,
most children develop English-speaking ability; for example, 79 percent of Mexican and 88 percent of Chinese
first-generation children speak English “well” or “very well,” even while they continue to speak a language other
than English at home (Alba, 2005). Thus, it is not surprising that children are often called upon to interpret for
their parents and grandparents. As discussed above, however, the appropriateness of this arrangement for health
care purposes has been questioned for several reasons, including the high frequency of errors with clinical consequences and the tendency to avoid sensitive and embarrassing subjects, such as those pertaining to sexual issues,
domestic violence, abuse of drugs or alcohol, and the possibility of death (Flores, 2006a; McQuillan and Tse,
1995). Reflecting this concern, the California state assembly passed a bill in 2005 prohibiting the use of children
under age 15 as medical interpreters; the bill was ultimately not enacted, however (EXODUS On-line, 2009).
Effect of Being Foreign Born
Being foreign born is not itself a marker for poor English skills: 39 percent of the 30.7 million foreign-born
people aged 5 and over now living in the United States speak English “very well” and indeed may come from a
country where English is spoken (e.g., Jamaica) (Grieco, 2003; Larsen, 2004; U.S. Census Bureau, 2003d). However, about three-fourths of the 21.3 million people identified in Census 2000, who are LEP by a definition of
speaking English “less than very well,” are foreign born; this accounts for 15.6 million people (U.S. Census Bureau,
2003d). More recent ACS data that estimate the LEP population at 23 million reveal that about 10.5 million are
native born or naturalized citizens, and approximately 4 million more are documented immigrants (Youdelman,
2008). The proportion of the immigrant population that is proficient in English increases with time in the United
States; for example, 36 percent of those in the country five years or less speak English very well, compared with
more than 70 percent in the country for more than 30 years (Siegel et al., 2001).
Proficiency is lower among low-wage workers and those with less than a high school diploma—population
groups that might be more likely to access public programs (Capps, 2003). High school graduation rates among
DEFINING LANGUAGE NEED AND CATEGORIES FOR COLLECTION
101
the foreign-born populations from Europe and Asia now living in the United States are comparable to those among
persons born in the United States—around 85–87 percent. However, the rate is much lower for immigrants from
Central America, at 37.7 percent (Larsen, 2004). This is important because more than one-third of the U.S. foreignborn population comes from this region, particularly Mexico (Malone et al., 2003). Low literacy can compound
the effect of a lack of English proficiency on understanding health-related information (Downey and Zun, 2007;
Sudore et al., 2009; Zun et al., 2006).
Applicable Legal Requirements
Civil Rights Act Requirements to Identify the Service Population
Title VI of the Civil Rights Act of 1964 prohibits discrimination on the basis of race or national origin by
those who receive federal funds:
No person in the United States shall, on the ground of race, color, or national origin, be excluded from
participation in, be denied the benefits of, or be subjected to discrimination under any program or activity
receiving Federal financial assistance.” {42 U.S.C § 2000d}
Language needs have been considered a factor in deciding discrimination cases based on national origin under
Title VI5 (Chen et al., 2007) and in determining whether there have been violations of equal access for language
minorities under the Voting Rights Act.6 Settlements have resulted in requirements to collect localized and granular data directly from those receiving services or indirectly through data descriptive of the service area (HHS,
2009c).
HHS’ Office for Civil Rights (OCR) states that HHS is “committed to enhancing access to HHS services by
LEP persons and closing the health care gap” (HHS, 2009b). Language assistance is to be made available at all
points of contact with federally funded programs—enrollment, registration, and direct medical services. HHS
describes LEP persons more broadly than the Census questions, which focus on spoken English. For HHS, LEP
includes persons:
• Who “are unable to communicate effectively in English because their primary language is not English and
they have not developed fluency in the English language.”
• Who “may have difficulty speaking or reading English.”
• Who “will benefit from an interpreter who will translate to and from the person’s primary language.”
• Who “may also need documents written in English translated into his or her primary language so the person
can understand important documents related to health and human services” (HHS, 2009a).
Executive Order 13166, Improving Access to Services for Persons with Limited English Proficiency, requires
each federal agency to review its services and develop and implement reasonable steps by which LEP persons can
have “meaningful access” to programs or activities without charge for language services (Executive Office of the
President, 2000). The guidance seeks to clarify the obligations of recipients of federal funds to provide language
assistance services. Additionally, LEP persons are to be notified that free interpretation services are available so
that they can make an informed choice about whether to use a friend or family member as an interpreter instead.
HHS Title VI Civil Rights guidance allows patients to choose whether to use a language service. But interpreter
services still must be provided if good medical practice might be compromised, the competence of the family
interpreter is in question, or issues of confidentiality or conflicting interests arise. The emphasis is on voluntary
compliance with these provisions.
The Department of Justice issued four Title VI “balancing factors” to be applied across all federal agency–
funded programs: the number or proportion of LEP persons in the service population, the frequency of contacts,
5
6
Lau v Nichols, 414 U.S. 563 (1974).
Department of Justice. 42 U.S.C. Chapter 20 § 1973aa-1a. The Public Health and Welfare Act, Elective Franchise.
102
RACE, ETHNICITY, AND LANGUAGE DATA
the importance of the services to the persons’ lives, and the resources available to support services (U.S. Department of Justice, 2002). HHS subsequently revised its guidance accordingly (HHS, 2009b). Yet lack of knowledge
of the requirements by both providers and patients or of willingness of LEP patients to pursue complaints when
faced with language barriers leaves many persons without meaningful access to health care, and few states have
comprehensive laws mirroring the federal requirements (Chen et al., 2007; Perkins and Youdelman, 2008).
Requirements of the Americans with Disabilities Act
Communication needs extend beyond spoken language capability to include barriers imposed by disabilities
affecting hearing, speech, and vision. The Americans with Disabilities Act (ADA) of 1990 and Section 504 of the
Rehabilitation Act of 1973 address nondiscrimination on the basis of such disabilities. Resolution of legal cases
has resulted in requiring the availability of qualified sign language interpreters within a certain time frame (e.g.,
2 hours) and the use of other auxiliary aids, such as TTY or TDD, 7 in venues such as hospitals (HHS, 2009c; U.S.
Department of Justice, 2003). Further examples of the types of auxiliary aids or services that might be required
to ensure accommodation of a person with a disability are outlined in regulations. 8
There are an estimated 1 million functionally deaf persons in the United States (Mitchell, 2005), and up to
36 million people have some degree of hearing loss (National Institute on Deafness and Other Communication
Disorders, 2009). Only rough estimates―of 360,000 to 517,000 persons―exist of the number of deaf individuals who
use sign language (Mitchell, 2005). Of note, immigrants who are deaf may have learned a different sign language
from that taught in the United States (Gordon, 2005).
State Laws
States have instituted a number of additional laws to address language access. These are not reviewed in detail
in this report. However, the status of laws nationally was recently reviewed by Perkins and Youdelman (Perkins
and Youdelman, 2008), and Au and colleagues focused on activities in three states—California, Massachusetts,
and New York (Au et al., 2009). These laws address the provision of direct language assistance, the setting of
thresholds for applicable languages, continuing medical education requirements for physicians, the availability of
interpreters for specific services (e.g., admissions to mental health facilities), facility licensure, and certification
of interpreters.
APPROACHES TO ELICITING LANGUAGE NEEDS
The subcommittee considered different approaches to questions to elicit language needs. Assessment of
English-language ability is widely used in studies evaluating the effects of language proficiency on disparities in
the quality of health and health care (Jacobs et al., 2001). Table 4-1 lists approaches to questioning about patients’
language needs that are employed by some health care entities. Questions address the individual’s English proficiency, primary or preferred spoken language, language spoken at home, and preferred written language.
English Proficiency
An advantage of using a question to assess English proficiency, such as that used on the Census (Figure 4-1), is
the ability to determine quickly whether a patient is likely to have language barriers that will limit his/her ability to
navigate the health care system and communicate effectively with health care providers. Proficiency level data can
be obtained for the entire population or matched to different languages (for example, among persons who speak a
language other than English at home, 66 percent of Vietnamese speak English less than very well, compared with
23 percent of Hindi-speaking Asian Indians) (Kagawa-Singer, 2009; U.S. Census Bureau, 2003e). When an entity
7
8
TTY stands for TeleTYwriter or text telephone, and TDD is telecommunication device for deaf persons.
Department of Justice. 28 CFR Part 36 § 36.303. ADA Standards for Accessible Design (July 1, 1994).
DEFINING LANGUAGE NEED AND CATEGORIES FOR COLLECTION
10
TABLE 4-1 Summary of Question Types and Categories
English Proficiency
Question Examples:
• How would you rate your ability to speak and understand English? (Hasnain-Wynia et al.,
2007)
• How well do you speak English? (Karliner et al., 2008)
Categories:
• Very well
• Well
• Not well
• Not at all (Shin and Bruno, 2003)
Spoken Language
Question Examples:
• What language do you feel most comfortable speaking with your doctor or nurse? (HasnainWynia et al., 2007)
• In what language do you prefer to receive your medical care? (Cambridge Health Alliance in
RWJF, 2008b; Karliner et al., 2008)
• What language do you want us to speak to you in? (California Healthy Families, 2008a)
• What language do you prefer to speak when you come to the medical center? What language
do you feel most comfortable speaking? (Tang, 2009)
Categories:
• Names of specific languages in use in the United States, approximately 600 categories
Plus:
• Other, please specify:____
• Sign language(s)
Language Spoken at Home
Question Examples:
• What language do you speak at home? (Shin and Bruno, 2003)
• What language(s) do you usually speak at home? (NCHS, 2009)
• What is the primary language spoken at home? (Cambridge Health Alliance in RWJF, 2008b)
Categories:
• Names of specific languages in use in the United States
• Census denominator available for many but not all languages
Written Language
Question Examples:
• In which language would you feel most comfortable reading medical or healthcare instructions?
(Hasnain-Wynia et al., 2007)
• What language should we write to you in? (California Healthy Families, 2008a)
• What is your preferred written language?a
• In what language do you prefer to read health-related materials? (Cambridge Health Alliance in
RWJF, 2008b)
• What language do you prefer for written materials? (Tang, 2009)
Categories:
• Names of specific languages in use in the United States
• Braille
Mandated:
• Threshold language categories may be required by law and applicable to an entity in different
states
a
Health Care Language Assistance Act of 200, California S.B. 853 § 1367 (October 8, 2003).
is considering which languages to list on its data collection instruments, knowing not just how many people speak
a language but also their level of English proficiency and thereby their need for services will be helpful.
Since the response is based on self-report, it is important to understand the question’s reliability in determining proficiency. The Census Bureau does not define which level of ability represents LEP (Griffin and Shin,
2007). However, the Census Bureau field tested the question to assess the validity of responses. Respondents who
indicated that they spoke English “less than very well” had difficulty with the tests administered in the English
104
RACE, ETHNICITY, AND LANGUAGE DATA
Language Proficiency Survey (ELPS), and researchers found a strong correlation between self-assessment of
speaking ability and understanding of tested concepts. The ELPS is a test of English-understanding ability and
was administered in people’s homes by the Census Bureau for the Department of Education. Those who rated
their English-speaking proficiency as “very well” scored similarly on the test to those who spoke English as their
first language, lending validity to the self-assessed ratings. Further analyses found that those who answered “not
at all” and “not well” represented a distinct population that would definitely need English assistance because they
rarely, if ever, spoke English and had limited reading skills as well (Kominski, 1989). Additionally, when setting
threshold languages under the Voting Right Act, it was determined that people who spoke English less than very
well were LEP (Kominski, 1985). Persons who fall into the category of speaking English “well” are assimilated to
varying degrees but still speak English less frequently than those who rate their ability as “very well” (Kominski,
1989). The Census Bureau has done no recent analyses on the association between the LEP question and Englishlanguage abilities (Griffin and Shin, 2007).
One could argue that a person may have to have greater proficiency in English for health care encounters than
for other daily tasks because of the unfamiliarity of health concepts and the complexity of medical terminology;
such situational factors can affect people’s assessment of their capability (Siegel et al., 2001). The association
between the Census English proficiency question and accurate and effective communication in English in the
health care setting remains undetermined. However, a recent article by Karliner and colleagues (2008) evaluated
How well
do you
speak
English?
(n = 302)
Not at all
Not well
(n = 166)
Well (n = 32)
Very well
(n = 104)
In what language do
you prefer to receive
your medical care?
Spanish
only
(n = 5)
Likely to benefit from
language assistance
(n = 171)
English or both equally
(English/Spanish)
(n = 27)
Unlikely to benefit from
language assistance
(n = 131)
FIGURE 4-2 Karliner algorithm.
SOURCE: With kind permission from Springer Science+Business Media: Journal of General Internal Medicine, Identification
of limited English proficient patients in clinical care, volume 23, 2008, page 1557, Figure 1.
DEFINING LANGUAGE NEED AND CATEGORIES FOR COLLECTION
10
the accuracy of the Census English proficiency question in predicting the ability of 302 patients from a cardiology
clinic to communicate effectively in English (Figure 4-2) (Karliner et al., 2008). The authors reported that in evaluating the sensitivity and specificity of four different questions in predicting outcomes of patient-reported ability
to discuss symptoms and to understand physician recommendations in English, “the Census-LEP item using the
high-threshold of less than ‘very well’ was the most sensitive for predicting both of the effective communication
outcomes” (p. 1558). Because the Census LEP question also had the lowest specificity, the authors recommend
using a combination of that question and preferred language for medical care as a way to increase specificity
with a marginal decrease in sensitivity. Different language groups may over- or underreport their competence; for
example, Asians tend to underreport and Hispanics to overreport (McArthur, 1991; Zun et al., 2006). Therefore,
health care entities may need to be mindful of their own population’s response patterns.
Primary or Preferred Spoken Language
OCR has used the term “primary language” to mean the language that an LEP individual identifies as the one
that he or she uses to communicate effectively and would prefer to use to communicate with service providers (HHS,
2008). The American Recovery and Reinvestment Act of 2009 (ARRA) similarly directs the inclusion of primary
language in electronic health records.9 The NQF cultural competency framework uses the following definition:
Primary written and spoken language—the self-selected language the patient wishes to use to communicate with his or her health care provider. (NQF, 2009)
Alternative phrasings of questions can elicit the name of a specific language (see examples in Table 4-1).The
Health Research & Education Trust (HRET) Toolkit suggests, “What language do you feel most comfortable
speaking with your doctor or nurse?” California regulations suggest, “What is your preferred spoken language?”
A Toolkit for Physicians developed for the California Academy of Family Physicians endorses a similarly phrased
question as best practice: “In what language do you (or the person for whom you are making the appointment)
prefer to receive your health care?” (Roat, 2005). It goes on to say, “Asking the question this way will provide
you information on the language the patient feels he or she needs to speak in a health-related conversation. If the
answer is a language other than English, you can plan to have language assistance available for the patient, and
you can add this information to the record” (Roat, 2005, p. 5).
A concern with using a preference question alone is that it may not always capture a person’s language need.
For example, respondents may answer English if they believe that not doing so might limit their access to good
medical providers. Similarly, respondents may state a preference for English because they know their providers
are not fluent in their primary language. These examples are based on anecdotal report, and there are no research
findings with which to assess the frequency of such occurrences. In practice, it is assumed that most people respond
with their primary language so they can access the services of an interpreter or language-concordant provider.
The HRET Toolkit, endorsed by NQF, asks both the Census LEP question and a preference question. The
subcommittee believes language need for effective communication with health care providers is defined by these
two questions, and encompasses those with English proficiency of less than “very well.” The subcommittee also
believes the LEP question should be used to screen patients before they are asked about preference.
Language Spoken at Home
The Census asks whether a person speaks a language other than English at home and then asks what that
language is (Figure 4-1). Detailed and comparable response data are available for states and localities on the languages spoken at home, so a health care entity can easily track what percentage of the population in its practice
area reports using a language other than English in the home environment. Other data collectors, including National
Health and Nutrition Examination (NHANES), ask about both language spoken at home and English proficiency.
9
2009).
American Recovery and Reinvestment Act of 2009, Public Law 115-5 § 3002(b)(2)(B)(vii), 111th Cong., 1st Sess. (February 17,
106
RACE, ETHNICITY, AND LANGUAGE DATA
Even when people speak English well, the language spoken at home is generally an indicator of one’s cultural
background, and that cultural knowledge may provide a window into beliefs about health care.
However, there are disadvantages in using solely a language spoken at home to evaluate individual needs and
to plan for language assistance capacity. More than half of people who state they speak a language other than
English at home also report speaking English very well (Glimpse, 2009; Shin and Bruno, 2003). This suggests
that using only this question in the assessment of language capacity could result in overestimating the need for
language assistance; this was a problem encountered in earlier national Censuses that helped lead to adding the
question on language proficiency (Kominski, 1989). Also of concern is that this question does not allow respondents to indicate language dominance when they are bilingual/multilingual.
Preferred Written Language
The approach to asking about written language has been to ask people their preference or some variation
thereof. For example, “In which language would you feel most comfortable reading medical or health care instructions?” (HRET Toolkit see Hasnain-Wynia, 2007) or “What language should we write to you in?” (California
Healthy Families, 2008a). The phrasing of a preferred-language question may need to be tailored to particular
circumstances (see Table 4-1). The phrasing of the first question would apply particularly within a health care
delivery setting, while that of the latter might be sufficient for health plan communications, such as for enrollment
or benefits information.
There is some evidence that the response to a written-language question will be the same as the response to
a spoken-language question. To determine whether English-language proficiency in speaking varies significantly
from that in writing and reading, the subcommittee conducted analyses using data on English-language proficiency
for reading, speaking, and writing from the National Latino and Asian American Study (NLAAS) (Alegría et al.,
2004a, 2004b). The NLAAS is a nationally representative household survey of Latinos and Asians aged 18 and
older residing in the coterminous United States, where these data were collected. The findings show high-weighted
Pearson correlation coefficients for English-language proficiency among speaking, reading, and writing ability.
For example, for the full sample (both Asians and Latinos), the correlation between speaking and reading was
0.93, between speaking and writing was 0.90, and between reading and writing was 0.94 (Table 4-2). These results
appear to indicate that English-language speaking proficiency can be extrapolated to English-language proficiency
in reading and writing.
The Census Bureau does not routinely ask a question about a person’s facility with written language. But two
TABLE 4-2 Correlations Between Self-Reported English Ability in Speaking, Reading, and Writing
English
Speak
Read
Write
Speak
Read
Write
1
0.9256
0.8974
1
0.9357
1
Latino
Speak
Read
Write
Speak
Read
Write
1
0.6735
0.6582
1
0.8548
1
Asian
Speak
Read
Write
Speak
Read
Write
1
0.8112
0.7736
1
0.925
1
SOURCE: Subcommittee analysis based on data from National Latino and Asian American Study (Alegría et al., 2004a, 2004b).
10
DEFINING LANGUAGE NEED AND CATEGORIES FOR COLLECTION
TABLE 4-3 Relationship of Speaking and Reading Ability
Reported English-Speaking Ability
Percent Who Say They Can
Read a Newspaper in English,
1986 (%)
Percent Who Report No
Difficulty Filling Out an
English Form, 1980 (%)
Very well
98
96
Well
Not well
93
69
78
38
Not at all
0
5
SOURCE: Siegel et al., 2001.
studies assessed how well people’s ability to read a newspaper or fill out a form (e.g., driver’s license, job application) in English conformed to their reported speaking ability (Table 4-3) (Kominski, 1989; Siegel et al., 2001).
Those who answered with the two lowest ratings clearly had diminished capability for reading, but the results were
equivocal for the “well” category. Another study testing language ability and comprehension in an emergency room
setting found that a person’s ranking on verbal and written competence was similar (Downey and Zun, 2007).
Because of the overlap between speaking, reading, and writing ability, an additional question about written
language may not be essential when an entity needs to limit the number of questions asked. At the same time,
a person who is relatively fluent in speaking English and answers “very well” on English proficiency may read
English “less well” or “not at all.” Knowledge of the education level of the population served can help illuminate the risk of lower or higher reading comprehension. One cannot assume language ability from ethnicity; for
example, Contra Costa Health Plan found that less than 2 percent of Hispanic commercial members wanted written
materials in Spanish.10
Reading many health-related materials with comprehension requires education at the high school level as
most materials are written at a 10th grade reading level or higher (D’Alessandro et al., 2001; Downey and Zun,
2007; IOM, 2004), and even when low-literacy health-related materials are available at the fifth-grade level or
below, medical terminology can be mystifying (Health Literacy Innovations, 2007; RTI International—University
of North Carolina Evidence-based Practice Center, 2009). Further it is noted that about 40 million people in the
United States read below the fifth-grade level, and this cannot always be attributed to a lack of spoken English
proficiency. To ensure effective communication, patients may need to discuss written materials with an interpreter
or bilingual provider even if the materials are translated into the patients’ primary language.
Medical information can be quite complex to understand even without the added barrier of having a primary
language other than English. Health literacy has been defined as:
The degree to which individuals have the capacity to obtain, process, and understand basic health information and services needed to make appropriate health decisions. (Ratzan and Parker, 2000, p. vi)
Half of LEP adults have a ninth-grade education or less (GCIR, 2008; Wrigley, 2003), making health-related
materials less accessible to those who are less literate even in their native tongue. Twenty-two percent of nonEnglish speakers indicate that they can read or write only in their own language, and 35 percent can be classified
as functionally illiterate (IHA, 2009). Additionally, similar words can be confused. For example, someone who
reads only Spanish might misread the English word “once” as meaning eleven times, creating the danger of taking
a medication an inappropriate number of times (ISMP, 1997).
The subcommittee concludes that a patient’s language preference for written materials is useful information,
but if a health care entity must limit the number of questions it asks because of either administrative burden or
HIT capacity, asking about written language is a lower priority than asking about spoken language since writtenlanguage needs can generally be inferred from responses about spoken language. Additionally, the subcommittee
10
Personal communication, O. Tiutin, Contra Costa Health Plan, August 4, 2009.
10
RACE, ETHNICITY, AND LANGUAGE DATA
believes more effective communication occurs when LEP patients have the opportunity to discuss translated documents with an interpreter or bilingual provider.
Assessment of Language Need
The subcommittee concludes that collection of data on language need is fundamental to improving service
delivery to LEP populations and to conducting research aimed at identifying disparities in access and outcomes.
The subcommittee explored various ways to determine patient spoken and written language needs so that steps
can be taken to best enhance effective communication between patients and providers. Patients’ proficiency with
English and the language needed for effective communication should be taken into account to gauge their ability to understand their options for health services and to follow through on care plans and self-management. The
subcommittee concludes that two questions define language need: one that determines whether English-language
proficiency is less than “very well” and a second that determines the preferred language needed for a health-related
encounter. The subcommittee sets a hierarchy among four possible types of language questions in widespread use
and based on the previous discussion, recommends:
Recommendation 4-1: To assess patient/consumer language and communication needs, all entities
collecting data from individuals for purposes related to health and health care should:
• At a minimum, collect data on an individual’s assessment of his/her level of English proficiency and on the preferred spoken language needed for effective communication with
health care providers. For health care purposes, a rating of spoken English-language proficiency of less than very well is considered limited English proficiency.
• Where possible and applicable, additionally collect data on the language spoken by the
individual at home and the language in which he/she prefers to receive written materials.
When the individual is a child, the language need of the parent/guardian must be determined. Similarly, if an adult
has a guardian/conservator, that person’s language information must be assessed.
LANGUAGE CATEGORIES TO BE USED BY HEALTH CARE ENTITIES
The subcommittee considered whether a single limited list of languages (e.g., the top 10 or top 40 nationwide)
should be used by all health care entities for quality improvement purposes. A precedent exists for recommending
use of such a list—the HRET Toolkit, endorsed by the National Quality Forum (NQF) for achieving more culturally competent organizations. The subcommittee reviewed Census data to determine the usefulness of such lists.
However, the subcommittee concludes that the language of each individual must be captured, regardless of whether
that language is present on any list developed to facilitate data collection and analysis locally or nationally.
Top Languages Nationally
The subcommittee first reviewed Census data on the top 10 languages reported to be spoken most frequently
at home besides English:
1. Spanish (28.1 million)
2. Chinese (2.0 million)
3. French (1.6 million)
4. German (1.4 million)
5. Tagalog (1.2 million)
6. Vietnamese (1.0 million)
7. Italian (1.0 million)
8. Korean (0.9 million)
DEFINING LANGUAGE NEED AND CATEGORIES FOR COLLECTION
109
9. Russian (0.7 million)
10. Polish (0.7 million) (Shin and Bruno, 2003; U.S. Census Bureau, 2003j) 11
A list of these 10 languages would cover 38.6 of the 46.9 million U.S. residents who speak a language other
than English at home—a figure that might argue for all entities to use this list for collecting data on language needs.
However, analysis reveals that this list fails to capture the top 10 languages in each state, as shown in a sample of
four states (Figures 4-3a–d). Numerous additional languages important for state-level planning—Navajo, Bengali,
Afrikaans, Hindi, Dakota, Norwegian, Laotian, Amharic, Cushite, Hmong, Arabic, Urdu, Tagalog, Persian, Portuguese, Mon-Khmer—are among the top languages spoken in just these four states. Likewise, while Spanish is
among the top 10 languages in 3,122 of 3,141 counties in the United States, numerous other languages are often
at the top―for example, Turkish in 12 counties, Laotian in 125, Navaho in 74, SerboCroatian in 58, and Portuguese
in 229 (U.S. English Foundation, 2009a, 2009b). Thus, focusing on the collection of language data to a top 10
national list would not always be useful even for system-level planning for states and counties, and certainly would
not capture the diversity among states or smaller jurisdictions or the specific needs faced by hospitals, health
plans, or individual provider practices. However, similar approaches have been used for some national purposes;
for example, section 118 of Medicare Improvements for Patients and Providers Act of 2008 (MIPPA) requires
translation of the Medicare Savings Program application form, at a minimum, into the 10 languages most used by
persons applying for the program.12
Additionally, some of the top 10 languages nationally are declining in use, while others are increasing because
of changing immigration patterns. The numbers of Italian, German, and Polish speakers have declined, while the
numbers of Spanish, Vietnamese, Chinese, Russian, Tagalog, Korean, Arabic, and French Creole speakers have
increased substantially since 1990 (Shin and Bruno, 2003). The number of Spanish speakers has increased by 62
percent since 1990, while the number speaking other Indo-European languages has increased by just 14 percent,
Asian and Pacific Islander languages by 55.6 percent, and all other languages by 51.2 percent (Shin and Bruno,
2003).
The subcommittee then reviewed a longer list based on the 39 languages on which the Census routinely reports,
consisting of 30 individual languages and the rest groups of languages (Table 4-4). The HRET Toolkit guidance
for hospital collection of demographic data includes 35 language or language group choices; it also provides
additional options for inclusion in the data system, such as the patient declined to answer. The HRET Toolkit list
closely mirrors but improves upon the commonly reported Census categories by adding American Sign Language.
The State of California requires under SB853 that each health plan survey its enrollees to understand the language
needs of its members (CPEHN, 2008). Table 4-4 includes the language categories of one such survey, by Anthem
Blue Cross, fielded in spring 2009. That list includes 37 individual languages or dialects, and also distinguishes
between American and other sign languages and recognizes other communication difficulties, including hearing
and speech loss (Ting, 2009). The list has many of the elements of the Census and HRET lists but incorporates
several additional languages specific to its service population.
In reviewing the applicability of the 39 Census-reported languages for national use, the subcommittee found
that in all but six states (Hawaii, Maine, New Hampshire, North Dakota, South Dakota, Vermont), people who speak
Spanish at home are the largest group. Those who speak Chinese are the next-largest group nationwide, with large
concentrations in California, New York, and Washington but located in every state. Although the penetration varies,
each of the 39 languages included in Census 2000 is reported as being spoken in some homes within each state,
with the following few exceptions: Gujarathi in Alaska; Navaho in Delaware and Vermont; Hmong in Delaware,
District of Columbia, Idaho, Kentucky, Louisiana, New Hampshire, New Mexico, North Dakota, Vermont, West
Virginia, and Wyoming; Mon-Khmer, Cambodian in Wisconsin and Wyoming; and Persian in Wyoming (U.S.
Census Bureau, 2003j). Depending on an entity’s collection approach, having 40 languages may prove unwieldy
(see the section below on collection considerations).
11 CDC has access on its website to a limited set of informational materials based on top languages spoken in the United States: Spanish,
German, Italian, Russian, Vietnamese, Chinese, French, Tagalog (CDC, 2008).
12 Medicare Improvements for Patients and Providers Act of 200, Public Law 110-275 § 118, 110th Cong., 2nd sess. (July 15, 2008).
110
RACE, ETHNICITY, AND LANGUAGE DATA
TABLE 4-4 Language Categories in Selected Collection Instruments
Census Broad
Categories
Census 39 Granular
Categories for Reporting
HRET Toolkit
Anthem Blue Cross, CA
English
English
English
English
Spanish
Spanisha
Spanish
Spanish
Other Indo-European
Armenianf
French (incl. Patois, Cajun)a,b
French Creolee
Germana,b
Greeke
Gujarathif
Hindi
Armenian
French
French Creole
German
Greek
Gujarathi
Hindi
Armenian
French
Italiana,c
Persianf
Polisha,d
Portuguese or
Portuguese Creolee
Russiana,c
Scandinavian languagese
Italian
Persian
Polish
Portuguese
Portuguese Creole
Russian
Scandinavian languages
Serbo-Croatiand
Serbo-Croatian
Urduf
Yiddishf
Urdu
Yiddish
German
Hindi
Irish
Italian
Persian/Farsi Polish
Portuguese
Russian
Scottish
Turkish
Pushto
Aramaic
Other
Other
Other
Other
Asian and Pacific
Islander
West Germanic languagese
Slavic languagesd
Indic languagese
Indo-European languagese
Chinesea,b
Chinese
Japanesed
Koreana,c
Laotiane
Miao Hmongf
Mon-Khmer Cambodianf
Japanese
Korean
Laotian
Miao Hmong
Mon-Khmer Cambodian
Tagaloga,c
Thaif
Vietnamesea,c
Other Asian languagese
Tagalog
Thai
Vietnamese
Cantonese
Chinese
Mandarin
Japanese
Korean
Lao
Hmong
Cambodian/Khmer
Mien
Tagalog
Thai
Vietnamese
Hawaiian
Ilokano
Indonesian
Samoan
Tahitian
Other Pacific Islander languagesf
Native American
Navajof
Other Native North American
languagesd
Navajo
Other Native North American
languages
American Indian
111
DEFINING LANGUAGE NEED AND CATEGORIES FOR COLLECTION
TABLE 4-4 Continued
Census Broad
Categories
Census 39 Granular
Categories for Reporting
HRET Toolkit
Other Languages
Other and Unspecified
African languagesd
Arabica,c
Hebrew
Hungarian
African languages
Arabic
Hebrew
Hungarian
NA
Unspecified or do not
know in “other”
NA
Anthem Blue Cross, CA
Other Non-English
Nigerian
Arabic
Hebrew
Do not know
Unavailable
Declined
Undetermined
American Sign Language
Sign Language American
Sign Language Other
Decline to state
Availability of Sign
Language or other auxiliary aids
or services
Hearing loss
Speech Loss
a
Top 10 non-English languages in the United States.
Top 10 of 50 individual states in addition to Spanish.
c Top 10 of 20 or more states in addition to Spanish.
d Top 10 of 10 or more states in addition to Spanish.
e Top 10 of 5 or more states in addition to Spanish.
f Top 10 of at least one state in addition to Spanish.
SOURCES: Hasnain-Wynia, 2007; Ting, 2009; U.S. Census Bureau, 2003e.
b
Neither the Census reporting list nor the HRET list captures all the top 10 languages in each state. For example,
numerous individual languages are consolidated under such categories as “Other Native Northern American languages” or “African languages.” Approximately 2.2 million people who speak a language other than English fall
into these general categories. These categories fail to capture, for example, Yupik, an Alaska Native language, that is
among Alaska’s top 10 languages; Dakota, an American Indian language among the top ones encountered in North
Dakota (Figure 4-3a); and Amharic, an African language, encountered in Minnesota (Figure 4-3b). In addition, it
should be noted that within individually reported languages, such as Chinese, there are various languages/dialects,
some of which are sufficiently different that they have been classified as separate languages by the Census Bureau
(e.g., Mandarin and Cantonese).
The number of languages spoken in each state is clearly diverse, in some states more so than others. As seen
in Figure 4-4, which is based on Census 2000 data, the number of languages reported to be spoken at home ranges
from 56 in Wyoming to 207 in California (U.S. English Foundation, 2009c). Thus, data collection instruments
must take into account the diversity of the population of the service area and the feasibility of collecting data in
lengthy lists of categories. This administrative issue is discussed later in this chapter in the section on collection
considerations.
The subcommittee concludes that mandating data collection using a single national list of a limited number
of languages might be useful for national population-level tracking and planning. For most entities, however, it
would be less useful than locally relevant lists for assessment and planning to meet the diverse language needs of
individuals, health care entities, and jurisdictions across the United States.
112
RACE, ETHNICITY, AND LANGUAGE DATA
FIGURE 4-3 Most spoken languages in North Dakota, Minnesota, Texas, and Maine, 2005.
SOURCE: Reprinted, with permission, from Modern Language Association, 2009b. Copyright 2009 by Modern Language
Association.
a. Most spoken languages in North Dakota in 2005
English is spoken by 93.83 percent of people over 5 years old in North Dakota.
Languages other than English are spoken by 6.16 percent.
Speakers of languages other than English are divided up as noted.
b. Most spoken languages in Minnesota in 2005
English is spoken by 90.34 percent of people over 5 years old in Minnesota.
Languages other than English are spoken by 9.65 percent.
Speakers of languages other than English are divided up as noted.
DEFINING LANGUAGE NEED AND CATEGORIES FOR COLLECTION
c. Most spoken languages in Texas in 2005
English is spoken by 66.35 percent of people over 5 years old in Texas.
Languages other than English are spoken by 33.64 percent.
Speakers of languages other than English are divided up as noted.
d. Most spoken languages in Maine in 2005
English is spoken by 92.87 percent of people over 5 years old in Maine.
Languages other than English are spoken by 7.12 percent.
Speakers of languages other than English are divided up as noted.
11
114
RACE, ETHNICITY, AND LANGUAGE DATA
FIGURE 4-4 Number of languages spoken in each state.
SOURCE: Reprinted, with permission, from U.S. English Foundation, 2009c. Copyright 2009 by U.S. English Foundation.
Selection of a List Relevant to the Service Population
A variety of sources can be helpful for determining languages of interest in a service population. One approach
is to survey the service recipients. For example, to assess which languages are most needed by their enrollees,
managed care plans in California must survey their enrollees.13 Mailed survey responses alone, however, can
skew results if the responses are not representative. An entity’s previous experience with language services or
the most common languages in Census data on the service area can provide guidance on which languages may
be most commonly spoken at home and which language groups represent the greatest proportion of people with
LEP. Census tract data provide one indirect check on the proportions of different language groups; they can also
reveal the languages of potential patients an entity might wish to serve but for whom lack of language outreach
has presented a barrier.
The Census publishes detailed tables on English-language proficiency by language category for 39 individual
languages or groupings nationally and by state (U.S. Census Bureau, 2003a). For example, more than a million
people in the United States speak French at home, but 75 percent of them speak English very well, resulting in
300,000 persons in this language category who are LEP by the subcommittee’s definition. Other language groups
may have a smaller portion who can speak English proficiently (e.g., 34 percent of those speaking Vietnamese
at home and 43 percent of Russian speakers) (U.S. Census Bureau, 2003e). Moreover, the proportion of persons
who speak English very well can differ from state to state for the same language—for example, in Alabama the
proportions are 43 percent for Vietnamese speakers and 56 percent for Russian speakers, while in Iowa they are 26
and 53 percent, respectively, and in Washington State 30 and 38 percent, respectively (U.S. Census Bureau, 2003f,
2003g, 2003h). These data are readily available for all geographic areas; using the Census 2000 Summary File 3
and the American Community Survey Factfinder allows one to investigate the ability to speak English by Census
block group and higher geographic summary levels, including zip code, Census tract, and county.
The Modern Language Association, using data from the American Community Survey of 2005, has an easyto-use mapping function that shows state-, county-, and zip code–level data for 30 of the most common languages
in the United States based on responses to the question of what language is spoken at home (Modern Language
Association, 2009b). These data can be sorted by age group, change from 2000 to 2005, and ability to speak English.
Additionally, an interactive list of the languages that appeared in the Census reports can help locate states in which
13
Health Care Language Assistance Act of 200, California S.B. 853 § 1367 (October 8, 2003).
DEFINING LANGUAGE NEED AND CATEGORIES FOR COLLECTION
11
any of the 377 languages are spoken at home and identify the level of English proficiency in those states (Modern
Language Association, 2009a). The U.S. English Foundation has similarly sorted Census data on 322 languages
by state, county, and selected cities (U.S. English Foundation, 2009a).
School-based data help identify emerging language populations in communities. Among LEP school-aged
children, Spanish is the most common language in all states except Alaska (most common language Yup’ik), Hawaii
(Ilocano), Maine (French), Montana (Blackfoot), North Dakota (Native American, unspecified), South Dakota
(Lakota), and Vermont (Serbo-Croatian) (Kindler, 2002). What might be surprising is that more children needing
language services in school are native rather than foreign born especially in the prekindergarten to fifth-grade age
range (77 percent) as compared with the sixth- to twelfth-grade (56 percent) age range (Fix and Capps, 2005). The
2006 American Community Survey showed that there were 3 million children who spoke English less than very
well (Kominski et al., 2008). The subcommittee concludes that there should be local flexibility in determining the
language categories that are used for analysis, as long as the collection process captures language need for each
individual so that entities can use the information for quality improvement purposes such as being able to provide
language assistance services.
Recommendation 4-2: The choice of response categories for spoken and written language questions
should be informed by analysis of relevant data on the service area (e.g., Census data) or service
population, and any response list should include an option of “Other, please specify: __” for persons
whose language is not listed.
Thresholds for Collection of Spoken or Written Languages
The subcommittee considered whether there should be a percentage or numerical threshold requirement for
establishing the minimum number of languages on which data should be collected by health care entities or states,
given the flexibility recommended for use of locally relevant categories. Such thresholds have been set both for language assistance generally and translation of documents into specific languages. NQF has endorsed as a preferred
practice to “translate all vital documents, at a minimum, into the identified threshold languages for the community
that is eligible to be served,” with the threshold set according to existing legislative requirements (NQF, 2009). It
is outside the subcommittee’s charge to make recommendations about specific interventions that may or may not
follow from the collection of language data, so it is outside its charge to recommend any thresholds linked to those
interventions (e.g., provide written language materials for every language present in a specific proportion of the
population). Nonetheless, it is useful to review existing approaches to setting thresholds to determine whether any
would serve as the basis for a recommendation on thresholds for specifying which language categories should be
collected for health care quality improvement in general.
Thresholds for establishing the languages in which services and written materials must be made available
often combine a percentage of 5 percent and a variable numerical cutoff point. For example, the California
Health and Safety Code requires that general acute care hospitals in the state provide language assistance services
24 hours a day for language groups that make up 5 percent or more of the facility’s geographic service area or
actual patient population.14 The California Department of Mental Health defines a threshold language for written
materials as “a language identified on the Medi-Cal Eligibility Data System (MEDS) as the primary language of
3,000 beneficiaries or five percent of the beneficiary population, whichever is lower, in an identified geographic
area.”15 Similarly, OCR’s settlement of a Title VI case with the Hawaii Department of Human Services identified a
threshold for translated documents of 5 percent or 1000 persons (whichever is less) who are “eligible to be served
or likely to be directly affected or encountered by the department” (HHS, 2008). More recent legislative action
(SB 853) in California requires the Department of Managed Health Care to ensure that health plans assess the
number of persons needing language services and the languages that should be offered, and set standards for staff
14
15
California Health and Safety Code § 1259 (January 12, 2009).
California Code of Regulations, Title 9 § 1810.410 (f) (3).
116
RACE, ETHNICITY, AND LANGUAGE DATA
training, compliance monitoring, and translation of vital documents (CPEHN, 2008). 16 Specific tiered thresholds,
with different combinations of plan enrollees and percentages and numerical thresholds, are established for the
translation of documents:
• “For health plans with a million or more enrollees: they must translate vital documents into the top two
non-English languages, plus any language whose number of speakers in the plan is either 15,000 enrollees
or greater, or totals 0.75% of the enrollee population.
• F
or plans with 300,000 to one million enrollees: vital documents must be translated into the top non-English
language plus languages whose speakers are 6,000 enrollees or 1% of the enrollee population.
• F
or plans with less than 300,000 enrollees: vital documents must be translated into any language whose
speakers total 3,000 enrollees or 5% of the enrollee population.” (CPEHN, 2008)
In the Voting Rights Act, specific population thresholds are established to determine what constitutes a
language-minority group and for whom documents must be translated (U.S. Census Bureau, 2002). The thresholds
are defined as more than 10,000 persons, more than 5 percent of all voting-age citizens in a district, more than
5 percent of residents of an Indian reservation, or a locale where the illiteracy rate is higher than the national rate
(U.S. Department of Justice, 2008).
Examination of the effect of using a percentage threshold to identify which languages should be included
as data collection categories at the state level reveals that significant subgroups would be omitted. For example,
815,386 people aged 5 and over speak Chinese at home in California (2.6 percent of the state population) but
this percentage is far higher than the national figure of 0.7 percent (U.S. Census Bureau, 2003j). Application of a
5 percent threshold statewide in California would identify only Spanish, even though that state, with 39 percent
of those aged 5 and over speaking a language other than English at home, is one of the most linguistically diverse
states in the nation (U.S. Census Bureau, 2003j) and has a large LEP population, estimated at 6.3 million (U.S.
Census Bureau, 2003i). Even a 1 percent population threshold in that state would make only Spanish, Chinese,
Vietnamese, and Tagalog threshold languages for data collection. A 1 percent threshold applied to other states
would for the most part yield only Spanish as a language to monitor (U.S. Census Bureau, 2003j). When applied
to smaller geographic areas with more concentrated LEP populations, however, such percentages would yield
additional language groups, and thresholds might be found useful for states or health plans in establishing the
number of languages required for reporting and/or translation of materials.
The size of the population served should influence any numerical threshold; the service populations for all of
the different entities potentially affected by a recommendation of this subcommittee are too variable for a single
threshold number of 1,000 or some other value to be applied. Therefore, and because available information on
thresholds is set in the context of a specific intervention (provision of language assistance services or translation of
documents), the subcommittee decided not to specify a threshold (e.g., number of persons or percent of population
speaking a language) for determining which spoken or written languages should be used as response options or as
categories in analysis by states or other entities for the purposes of health care quality improvement. The subcommittee believes that any numerical or percentage thresholds for purposes of requiring the delivery of services or the
translation of documents would best be determined by appropriate regulatory, licensing, or accrediting bodies.
Considerations for Modes of Data Collection
While the goal is to identify the specific language needs of each individual to enable effective health care
communications, having lists of 400 to 500 language categories is impractical for most data collection instruments,
whether in paper or electronic form, unless electronic systems have more sophisticated software to reduce staff or
patient time required to search for the correct category. Accordingly, many entities will have to construct lists of
perhaps 10 to 20 language categories that will be manageable within the space constraints of their paper or electronic data collection formats. These lists should always have an option to collect languages not listed by including
16
Health Care Language Assistance Act of 200, California S.B. 853 § 1367 (October 8, 2003).
DEFINING LANGUAGE NEED AND CATEGORIES FOR COLLECTION
11
an “Other, please specify: ____” choice so that data on any language needed by an individual can be collected.
Such an approach was employed in one study to identify the languages used among school-age children. A state
survey of LEP students included 13 prespecified languages on the collection form, with the opportunity to list other
languages; the responses ultimately yielded 460 languages (Kindler, 2002). For intake systems that do not allow
for writing in an “other” response, more detailed lists will be required, as simply reporting a large “other” category
with no specific language identifiers is not useful for understanding the language needs of individual patients.
An alternative to having a prespecified locally relevant list would be to include an open-response section on
paper forms or computer input screens. Some find this approach desirable because a single free-response box takes
up minimal space. For example, the California Healthy Family program uses an open-ended format that captures
about 30 languages including American Sign Language.17 The main drawback is that it is generally more time-consuming to enter each response manually into a database and to decipher handwriting on paper forms and spelling
variations whether paper forms or computer input screens. The Census Bureau has the ability to scan optically
or key in individually the free-response answers on language use (Shin and Bruno, 2003), but this is likely too
costly an approach for many entities. Kaiser Permanente’s computerized registration pages incorporate keystroke
recognition; as a clerk types in the first couple of letters, the computer responds with a short list of alternatives out
of the 131 options in the full set of language options (Appendix G) (Tang, 2009). Contra Costa Health Plan uses a
system in which typing the initial letter of a language brings up one of the most commonly encountered languages
(top 15 languages), such that typing an “s,” for example, would bring up Spanish; if the desired response is not in
the first grouping, a second keystroke on “s” will bring up Samoan and other selections (Appendix H).
In sum, as a practical matter, most individual providers, plans, or states may want to have a limited list of
language categories for collection based on the languages most common among their populations with LEP, taking
into account as well as the space limitations of their paper forms or the capacity of their computer systems. Any
prespecified list of response categories should also include the option of “Other, please specify: _____” to capture
an individual’s language need when it does not appear on the list. Entities using open-format questions must make
sure that responses are specific enough to be useful in planning services and in conducting analyses—for example,
a response that says Asian language will not be specific enough to identify a language.
DEVELOPMENT OF A NATIONALLY STANDARDIZED LIST OF LANGUAGE CATEGORIES
Since effective patient–provider communication is central to patient-centered care and the overall quality of
health care, knowing the language each individual needs to communicate effectively and to understand the care
process is fundamental. The subcommittee sought to determine how many languages are in use in the United
States to understand the scope of what might be encountered during a patient contact or visit. The subcommittee
notes that any national list of languages ideally should have a common vocabulary of language names and unique
codes for languages to facilitate data sharing. Every organization may not need to report language data to others,
and thus may not need to participate in a uniform coding scheme or will be able to make a crosswalk from its own
coding practices to a national standard set. Overall, however, comparability and interoperability will be enhanced
by a coding system. The subcommittee has identified two major code sets for consideration: the Census Bureau
and the International Organization for Standardization (ISO) 639 language code sets.
National Standard List of Spoken Language
As noted, the Census reports about 380 single languages, as well as several language groups (Scandinavian,
American Indian, and African languages for general responses not captured by specific language names such as
Norwegian or Navajo), with unique codes (Modern Language Association, 2009a; U.S. Census Bureau, 2007).
17
Personal communication, E. Sanchez, California Managed Risk Medical Insurance Board, July 20, 2009. Languages include English (46.1
percent of applicants), Spanish (45.3 percent), Asian (6.3 percent, including Cantonese, Chinese, Korean, Mandarin and Vietnamese), and other
languages (2.1 percent, including Russian, Farsi, Armenia, Tagalog, Arabic, Hmong, Japanese, Cambodian, Thai, Hebrew, Lao, Portuguese,
Samoan, Polish, Turkish, French, Mien, Llacano, Italian, and American Sign Language).
11
RACE, ETHNICITY, AND LANGUAGE DATA
The subcommittee prepared a draft template of spoken languages in use in the United States, based on Census
categories, and formal and informal reports from hospitals, community health centers, language assistance services,
individual hospitals, and health plans. This compilation resulted in more than 650 languages or composite groupings; however, a smaller number may be needed for effective communication in a health care context (i.e., the
subcommittee identified 300 from its limited survey of health care entities). The resulting list of spoken languages
(Appendix I) can serve as basis for finalizing a national standard list of languages.
What defines a unique language versus a dialect? Linguistic scholars and those who speak a language do
not always agree on what defines a distinctly unique language. For ISO 639, classification takes into account
“linguistic similarity, intelligibility, a common literature,” and whether speakers of one language can understand
the other. Even with this understanding, however, there may be other “well-established distinct ethnolinguistic
identities [that] can be a strong indicator that they should nevertheless be considered to be different languages.”
Thus, the ISO language lists and particularly their coding focus on distinct languages with distinct codes, whereas
the Census Bureau is more likely to give related languages the same code. The ISO codes represent both spoken
and written language names; separate script codes apply to written languages, as well, to describe their lettering
(SIL International, 2009c).
The names of numerous languages have multiple possible spellings, even between the Census Bureau and
ISO 639 language lists, and patients may provide an alternative spelling as well. Languages might even be called
slightly different names, such as Amish, Pennsylvania Dutch, or Pennsylvania German. This need not be a barrier to the list of choices developed locally as long as it is clear on a national standard list how to categorize the
alternative spellings or names.
The subcommittee did not generate a list of written languages, but illustrates these needs with the experiences
of Kaiser Permanente (Appendix G) and Contra Costa Health Plan (Appendix H). ISO 15924 has four-letter script
codes that can be appended to language names to distinguish how a language is written (e.g., use of Cyrillic [Cyrl],
or Arabic [Arab] (Unicode ISO, 2009). Braille has the script code of Brai.
Coding of Responses
This section reviews approaches to coding the languages included on the Census and ISO/Ethnologue lists.
Ethnologue studies the world’s living and ancient languages (living languages now number more than 6000) and
updates the language lists every four years. The Census set includes about 380 three-digit numeric codes (e.g.,
Spanish 625, Russian 639, Thai 720) for the languages it tracks (U.S. Census Bureau, 2007). This set actually covers
a greater number of languages, about 530, since as noted, the same code is used for multiple related languages;
by comparison, the languages in this larger set have their own unique codes under the ISO 639-3 classification
system. The Census codes underlie the extensive data available on language spoken at home and level of English
proficiency among subgroups.
The ISO codes have evolved from a first-generation two-letter coding system (ISO 639-1), to a three-letter
system to accommodate additional languages primarily for bibliographic uses (ISO 639-2), to a set that now
incorporates more three-letter codes to cover 6,000 languages (ISO 639-3). The ISO 639-3 codes are intended
“to provide a comprehensive set of identifiers for all languages for use in a wide range of applications, including linguistics, lexicography and internationalization of information systems.” (Library of Congress, 2007; SIL
International, 2009b).
In some instances, the distinction among languages in the ISO coding system may be of less practical concern,
but in other cases distinct coding may be necessary. For instance, the difference among German, Swiss German,
and Austrian German will not matter for most analyses and quality improvement initiatives; these three languages
have an identical code under the Census Bureau system (607), but are coded deu, bar, and gsw, respectively, under
ISO 639-3. On the other hand, there are even cases in which very different languages have the same name but
very different meanings; for example, the Census codes Mende as 793, 18 but one cannot know whether this is
the Mende language of Sierra Leone (men) or of Papua New Guinea (sim) as distinguished by ISO 639-3. At the
18
Personal communication, H. Shin, U.S. Census Bureau, July 13, 2009.
DEFINING LANGUAGE NEED AND CATEGORIES FOR COLLECTION
119
local level, practitioners are likely to figure out the difference, but if it is desirable to aggregate such detail across
multiple sites for various analytic purposes or to plan interventions, the more discrete codes may be better. Sorting
the Chinese languages is particularly challenging for the lay person.
Health Level 7 (HL7), a standards-setting organization for electronic health records, worked with Centers for
Disease Control and Prevention (CDC) to develop the unique codes for use in the CDC/HL7 Race and Ethnicity Code Set 1.0 for ethnicities (CDC, 2000). HL7 has not yet adopted any codes for languages. In its incidental
collection of information on languages, the subcommittee encountered more instances of use of the ISO coding
scheme. For example, the Illinois Department of Human Services and Contra Costa Health Plan use the ISO 6391 two-letter alphabet code. Others are using the three-letter coding for tracking language needs and determining
resources required to address them (e.g., the courts of New Jersey to identify persons who need interpreters and
to plan for service enhancement; Anthem Blue Cross survey of language needs). 19
In conclusion, the subcommittee believes that there are advantages to both the Census Bureau and ISO coding
schemes for languages. In the next chapter, the subcommittee indicates the need for HHS to consult with the Census
Bureau, the registration authorities for the ISO codes, and others that establish unique coding for interoperability,
such as HL7; the subcommittee itself does not endorse one coding scheme over another.
If the Census coding approach were to be adopted, the subcommittee notes that the Census list of languages
and codes would likely need some additional changes to be useful. Because of how the language question is asked
on the Census (Does this person speak a language other than English? [Figure 4-1]), yes (language other than English) and no (English only) are responses coded just 1 and 2, respectively; there is no unique three-digit code for
English. Sign language, an important communication tool, is not a language response on the Census. By contrast,
ISO-639 has unique codes for 130 types of sign languages (SIL International, 2009a), such as aed for Argentine
Sign Language and ase for American Sign Language. As the Census Bureau does not have a specific code for sign
language, it would code a response of American Sign Language as English for its purposes 20—an approach that
is less helpful in responding to a person’s language needs in the health care environment. A separate category for
noting which persons have speech loss has been useful for some entities to understand the communication needs
of all patients. Further options for “declined,” “unavailable,” or “unknown” are also useful when data are being
recorded to determine the portion of the service population from whom language data have been collected; the
Census Bureau does not generally code for these options.
Recommendation 4-3: When any health care entity collects language data, the languages used as
response options or categories for analysis should be selected from a national standard set of languages in use in the United States. The national standard set should include sign language(s) for
spoken language and Braille for written language.
SUMMARY
The subcommittee has reviewed the frequency of health provider interactions with people needing language
assistance and the impact of limited English proficiency on access to care, health outcomes, and patient safety. An
estimated 21.3 to 23.0 million people in the United States would meet the subcommittee’s definition of LEP for
health care purposes—self-assessment as speaking English less than very well. The subcommittee has established
a hierarchy of questions to ask about the language variable, with the highest emphasis on establishing language
need based on two questions—a person’s rating of their English language proficiency and the preferred language
needed for health care interactions.
The subcommittee’s task extended to exploring what a national standard list of language categories might
look like. A number of approaches to designating languages for collection were considered, including whether
there should be uniform collection nationwide of a limited number of categories or locally relevant lists chosen
19 During July 1, 2004, through June 30, 2005, interpretation was provided in Superior Court for 77 languages across 83,548 events, with
16 major languages accounting for most events (New Jersey Courts, 2009).
20 Personal communication, H. Shin, U.S. Census Bureau, July 13, 2009.
120
RACE, ETHNICITY, AND LANGUAGE DATA
by the individual data collection entity from a larger national list. A limited national list, whether of 10 languages
or 40, would not be useful for every health care provider, state, or health plan. The subcommittee therefore favors
the approach of allowing selection of locally relevant language categories from a national standard list, with a
common category and coding framework. Local lists should provide an “Other, please specify: __” option in case
an individual does not find a needed language on a collection instrument with check-off boxes or even if that language is not yet on the national standard list of names. Such a language list might need to be updated from time
to time to accommodate new immigrant groups, and health care providers might encounter new names before a
formal Census or ISO review takes place. The subcommittee provides a draft template of spoken language names
and of Census and ISO identifiers as a list that might be encountered in health care settings (Appendix I). In
Chapter 6, the subcommittee discusses a process for adoption of the language list and an associated code set for
data aggregation and exchange.
REFERENCES
Alba, R. 2005. Bilingualism still persists, but English still dominates. http://www.migrationinformation.org/Feature/display.cfm?ID=282 (accessed February 20, 2009).
Alegría, M., D. Takeuchi, G. Canino, N. Duan, P. Shrout, X. L. Meng, W. Vega, N. Zane, D. Vila, M. Woo, M. Vera, P. Guarnaccia, S. Aguilar-Gaxiola, S. Sue, J. Escobar, K. M. Lin, and F. Gong. 2004a. Considering context, place and culture: The National Latino and Asian
American Study. International Journal of Methods in Psychiatric Research 13(4):208-220.
Alegría, M., D. Vila, M. Woo, G. Canino, D. Takeuchi, M. Vera, V. Febo, P. Guaranaccia, S. Aguilar-Gaxiola, P. Shrout. 2004b. Cultural relevance and equivalence in the NLAAS instrument: Integrating etic and emic in the development of cross-cultural measures for a psychiatric
epidemiology and services study of Latinos. International Journal of Methods in Psychiatric Research 13(4):270-288.
American College of Physicians. 2007. Language services for patients with limited English proficiency: Results of a national survey of internal
medicine physicians. Philadelphia, PA: American College of Physicians.
Anderson, L. M., S. C. Scrimshaw, M. T. Fullilove, J. E. Fielding, J. Normand, and the Task Force on Community Preventive Services. 2003.
Culturally competent healthcare systems–a systematic review. American Journal of Preventive Medicine 24(3):68-79.
Andrulis, D., N. Goodman, and C. Pryor. 2002. What a difference an interpreter can make: Health care experiences of uninsured with limited
English proficiency. Boston, MA: The Access Project.
ASIST Translation Services. 2009. Interpreting−verbal communication using bilingual interpreters. http://asisttranslations.com/interpreting.
htm (accessed June 12, 2009).
Au, M., E. F. Taylor, and M. Gold. 2009. Improving access to language services in health care: A look at national and state efforts. Princeton,
NJ: Mathematica Policy Research, Inc.
Ayanian, J. Z., A. M. Zaslavsky, E. Guadagnoli, C. S. Fuchs, K. J. Yost, C. M. Creech, R. D. Cress, L. C. O’Connor, D. W. West, and W. E.
Wright. 2005. Patients’ perceptions of quality of care for colorectal cancer by race, ethnicity, and language. Journal of Clinical Oncology
23(27):6576-6586.
Bagchi, A., and B. Stevens. 2006. Seeking solutions: Enhancing health care delivery for people in Connecticut with limited English proficiency.
New Britain, CT: Connecticut Health.
Baker, D. W. 1998. Structured English immersion: Breakthrough in teaching limited-English-proficient students. Phi Delta Kappan
80(3):199-200.
Baker, D. W., R. Hayes, and J. P. Fortier. 1998. Interpreter use and satisfaction with interpersonal aspects of care for Spanish-speaking patients.
Medical Care 36(10):1461-1470.
Baker, D. W., R. M. Parker, M. V. Williams, W. C. Coates, and K. Pitkin. 1996a. Use and effectiveness of interpreters in an emergency department. Journal of the American Medical Association 275(10):783-788.
Baker, D. W., C. D. Stevens, and R. H. Brook. 1996b. Determinants of emergency department use: Are race and ethnicity important? Annals of
Emergency Medicine 28(6):677-682.
Bard, M. R., C. E. Goettler, P. J. Schenarts, B. A. Collins, E. A. Toschlog, S. G. Sagraves, and M. F. Rotondo. 2004. Language barrier leads to
the unnecessary intubation of trauma patients. American Surgeon 70(9):783-786.
Bernstein, J., E. Bernstein, A. Dave, E. Hardt, T. James, J. Linden, P. Mitchell, T. Oishi, and C. Safi. 2004. Trained medical interpreters in the
emergency department: Effects on services, subsequent charges, and follow-up. Journal of Immigrant Health 4(4):171-176.
Brach, C., and F. M. Chevarley. 2008. Demographics and health care access and utilization of limited-English-proficient and English-proficient
Hispanics. Research findings No. 2. Rockville, MD: AHRQ.
Brach, C., I. Fraser, and K. Paez. 2005. Crossing the language chasm. Health Affairs 24(2):424-434.
California Healthy Families. 2008a. Application form without instructions (English). Sacramento, CA: State of California, Managed Risk Medical Insurance Board.
———. 2008b. Written materials by language. http://www.healthyfamilies.ca.gov/Plans_Providers/Non-English_Materials.aspx (accessed
June 15, 2009).
DEFINING LANGUAGE NEED AND CATEGORIES FOR COLLECTION
121
Capps, R., M. Fix, J. S. Passel, J. Ost, and D. Perez-Lopez. 2003. A profile of the low-wage immigrant workforce. Washington, DC: Urban
Institute.
Carrasquillo, O., E. J. Orav, T. A. Brennan, and H. R. Burstin. 1999. Impact of language barriers on patient satisfaction in an emergency department. Journal of General Internal Medicine 14(2):82-87.
Carter-Pokras, O., M. J. F. O’Neill, V. Cheanvechai, M. Menis, T. Fan, and A. Solera. 2004. Providing linguistically appropriate services to
persons with limited English proficiency: A needs and resources investigation. American Journal of Managed Care 10:SP29-SP36.
CDC (Centers for Disease Control and Prevention). 2000. Race and Ethnicity Code Set version 1.0. Atlanta, GA: Centers for Disease Control
and Prevention.
_____. 2008. Most spoken languages in the United States. http://www.cdc.gov/Other/languages/ (accessed June 8, 2009).
Chan, K. S., E. Keeler, M. Schonlau, M. Rosen, and R. Mangione-Smith. 2005. How do ethnicity and primary language spoken at home affect management practices and outcomes in children and adolescents with asthma? Archives of Pediatrics and Adolescent Medicine
159(3):283-289.
Chen, A. H., M. K. Youdelman, and J. Brooks. 2007. The legal framework for language access in healthcare settings: Title VI and beyond.
Journal of General Internal Medicine 22 (Suppl 2):362-367.
Cohen, A. L., F. Rivara, E. K. Marcuse, H. McPhillips, and R. Davis. 2005. Are language barriers associated with serious medical events in
hospitalized pediatric patients? Pediatrics 116(3):575-579.
Cooper, L. A., and N. R. Powe. 2004. Disparities in patient experiences, health care processes, and outcomes: The role of patient-provider
racial, ethnic, and language condordance. New York, NY: The Commonwealth Fund.
CPEHN (California Pan-Ethnic Health Network). 2008. A blueprint for success: Bringing language access to millions of Californians. Oakland,
CA: California Pan-Ethnic Health Network.
D’Alessandro, D. M., P. Kingsley, and J. Johnson-West. 2001. The readability of pediatric patient education materials on the World Wide Web.
Archives of Pediatrics and Adolescent Medicine 155(7):807-812.
David, R. A., and M. Rhee. 1998. The impact of language as a barrier to effective health care in an underserved urban Hispanic community.
Mount Sinai Journal of Medicine 65(5-6):393-397.
De Alba, I., and J. M. Sweningson. 2006. English proficiency and physicians’ recommendation of Pap smears among Hispanics. Cancer Detection and Prevention 30(3):292-296.
Derose, K. P., and D. W. Baker. 2000. Limited English proficiency and Latinos’ use of physician services. Medical Care Research and Review
57(1):76-91.
Divi, C., R. G. Koss, S. P. Schmaltz, and J. M. Loeb. 2007. Language proficiency and adverse events in US hospitals: A pilot study. International
Journal for Quality in Health Care 19(2):60-67.
Dohan, D., and M. Levintova. 2007. Barriers beyond words: Cancer, culture, and translation in a community of Russian speakers. Journal of
General Internal Medicine 22:300-305.
Downey, L. V., and L. Zun. 2007. Testing of a verbal assessment tool of English proficiency for use in the healthcare setting. Journal of the
National Medical Association 99(7):795-798.
DuBard, C. A., and Z. Gizlice. 2008. Language spoken and differences in health status, access to care, and receipt of preventive services among
US Hispanics. American Journal of Public Health 98(11):2021-2028.
Eamranond, P., R. Davis, R. Phillips, and C. Wee. 2009. Patient-physician language concordance and lifestyle counseling among Spanishspeaking patients. Journal of Immigrant and Minority Health. http://www.springerlink.com/content/kl676371u14586v2/ (accessed September 2, 2009).
Elderkin-Thompson, V., R. C. Silver, and H. Waitzkin. 2001. When nurses double as interpreters: A study of Spanish-speaking patients in a US
primary care setting. Social Science and Medicine 52(9):1343-1358.
Enguidanos, E. R., and P. Rosen. 1997. Language as a factor affecting follow-up compliance from the emergency department. Journal of Emergency Medicine 15(1):9-12.
Estrada, A. L., F. M. Trevino, and L. A. Ray. 1990. Health care utilization barriers among Mexican Americans: Evidence from HHANES 198284. American Journal of Public Health 80 Suppl:27-31.
Executive Office of the President. 2000. Executive order 13166 – improving access to services for persons with limited English proficiency.
Federal Register 65(159):50121-50122.
EXODUS On-line. 2009. Assembly passes bill to end the use of children as interpreters in medical situations: Speaker pro tem Yee’s AB will protect kids and patients when seeking medical services. http://www.exodusnews.com/california/California084.htm (accessed June
12, 2009).
Feinberg, E., K. Swartz, A. M. Zaslavsky, J. Gardner, and D. K. Walker. 2002. Language proficiency and the enrollment of Medicaid-eligible
children in publicly funded health insurance programs. Maternal & Child Health Journal 6(1):5-18.
Fix, M., and R. Capps. 2005. Immigrant children, urban schools, and the No Child Left Behind Act. Washington, DC: Migration Policy
Institute.
Flores, G. 2005. The impact of medical interpreter services on the quality of health care: A systematic review. Medical Care Research and
Review 62(3):255-299.
———. 2006a. Language barrier: The commentary. http://www.webmm.ahrq.gov/case.aspx?caseID=123 (accessed June 15, 2009).
———. 2006b. Language barriers to health care in the United States. New England Journal of Medicine 355(3):229-231.
Flores, G., M. Abreu, and S. C. Tomany-Korman. 2005. Limited English proficiency, primary language at home, and disparities in children’s
health care: How language barriers are measured matters. Public Health Reports 120(4):418-430.
122
RACE, ETHNICITY, AND LANGUAGE DATA
Flores, G., M. B. Laws, S. J. Mayo, B. Zuckerman, M. Abreu, L. Medina, and E. J. Hardt. 2003. Errors in medical interpretation and their potential clinical consequences in pediatric encounters. Pediatrics 111(1):6-14.
Gandhi, T. K., H. R. Burstin, E. F. Cook, A. L. Puopolo, J. S. Haas, T. A. Brennan, and D. W. Bates. 2000. Drug complications in outpatients.
Journal of General Internal Medicine 15(3):149-154.
Gany, F., and Q. Ngo-Metzger. 2007. Language barriers in health care: Special supplement to the Journal of General Internal Medicine. http://
www.commonwealthfund.org/Content/Publications/In-the-Literature/2008/Jan/Language-Barriers-in-Health-Care--Special-Supplementto-the-Journal-of-General-Internal-Medicine.aspx (accessed August 3, 2009).
GCIR (Grantmakers Concerned with Immigrants and Refugees). 2008. Language acquisition. http://www.gcir.org/immigration/facts/language
(accessed February 20, 2009).
Glimpse, W. 2009. Assessing English language proficiency. http://proximityone.com/elp.htm (accessed June 8, 2009).
Gordon, R. G. J. 2005. Ethnologue: Languages of the world. Dallas, TX: SIL International. http://www.ethnologue.com/codes/default.asp (accessed February 18, 2009).
Green, A. R., Q. Ngo-Metzger, A. T. Legedza, M. P. Massagli, R. S. Phillips, and L. I. Iezzoni. 2005. Interpreter services, language concordance, and health care quality. Experiences of Asian Americans with limited English proficiency. Journal of General Internal Medicine
20(11):1050-1056.
Grieco, E. 2003. English Abilities of the US Foreign-Born Population. Washington, DC: Migration Policy Institute.
Griffin, D. H., and H. B. Shin. 2007. Accessing and using language data from the Census Bureau. Presentation at the 200 federal interagency
conference on limited English proficiency, March 1, 200. Washington, DC: U.S. Census Bureau. PowerPoint Presentation.
Grow, R. W., M. D. Sztajnkrycer, and B. R. Moore. 2008. Language barriers as a reported cause of prehospital care delay in Minnesota. Prehospital Emergency Care 12(1):76-79.
Hammersmith, K. J., and J. Y. Lee. 2008. A survey of North Carolina safety-net dental clinics’ methods for communicating with patients of
limited English proficiency (LEP). Journal of Public Health Dentistry 69(2):90-94.
Hampers, L. C., S. Cha, D. J. Gutglass, H. J. Binns, and S. E. Krug. 1999. Language barriers and resource utilization in a pediatric emergency
department. Pediatrics 103(6 Pt 1):1253-1256.
Hasnain-Wynia, R. 2007. Collecting race, ethnicity, and primary language data in small physician practices. Chicago, IL: Health Research &
Educational Trust/AHA. PowerPoint Presentation.
Hasnain-Wynia, R., D. Pierce, A. Haque, C. H. Greising, V. Prince, and J. Reiter. 2007. Health Research & Educational Trust Disparities Toolkit. www.hretdisparities.org (accessed December 18, 2008).
Hasnain-Wynia, R., J. Yonek, D. Pierce, R. Kang, and C. H. Greising. 2006. Hospital language services for patients with limited English proficiency: Results from a national survey. Chicago, IL: Health Research and Educational Trust/AHA.
Health Literacy Innovations. 2007. National survey of Medicaid guidelines for health literacy. http://www.healthliteracyinnovations.com/information/HLI_Medicaid_Survey.pdf (accessed July 14, 2009).
HHS (U.S. Department of Health and Human Services). 2008. Civil rights: Hawaii Department of Human Services Resolution Agreement.
http://www.hhs.gov/ocr/civilrights/activities/agreements/hawaiiagree.html (accessed September 3, 2009).
———. 2009a. Civil rights: Limited English proficiency (LEP). http://www.hhs.gov/ocr/civilrights/resources/specialtopics/lep/index.html (accessed April 3, 2009).
———. 2009b. Fact sheet on guidance to federal financial assistance recipients regarding Title VI prohibition against national origin discrimination affecting limited English proficient (LEP) persons. http://www.hhs.gov/ocr/civilrights/resources/specialtopics/lep/factsheet
guidanceforlep.html (accessed May 26, 2009).
———. 2009c. Summary of selected OCR LEP complaint investigations and compliance reviews. http://www.hhs.gov/ocr/civilrights/activities/
examples/LEP/complaintcompliance.html (accessed March 4, 2009).
Hu, D. J., and R. M. Covell. 1986. Health care usage by Hispanic outpatients as function of primary language. Western Journal of Medicine
144(4):490-493.
IHA (Institute for Healthcare Advancement). 2009. HELP curriculum FAQ ... http://www.iha4health.org/default.aspx/MenuItemID/232/Menu
Group/_Health+Literacy.htm (accessed June 8, 2009).
IOM (Institute of Medicine). 2004. Health literacy: A prescription to end confusion. Washington, DC: The National Academies Press.
ISMP (The Institute for Safe Medication Practices). 1997. ISMP medication safety alert! http://www.ismp.org/newsletters/acutecare/archives/
Mar97.asp (accessed June 12, 2009).
Jacobs, E. A., K. Karavolos, P. J. Rathouz, T. G. Ferris, and L. H. Powell. 2005. Limited English proficiency and breast and cervical cancer
screening in a multiethnic population. American Journal of Public Health 95(8):1410-1416.
Jacobs, E. A., D. S. Lauderdale, D. Meltzer, J. M. Shorey, W. Levinson, and R. A. Thisted. 2001. Impact of interpreter services on delivery of
health care to limited-English-proficient patients. Journal of General Internal Medicine 16(7):468-474.
Jacobs, E. A., I. Rolle, C. E. Ferrans, E. E. Whitaker, and R. B. Warnecke. 2006. Understanding African Americans’ views of the trustworthiness
of physicians. Journal of General Internal Medicine 21(6):642-647.
Kagawa-Singer, M. 2009. Measure of race, ethnicity and culture: Population science isn’t science unless you know the population. University
of California, Los Angeles. Presentation to the IOM Committee on Future Directions for the National Healthcare Quality and Disparities
Reports, March 12, 2009. Newport Beach, CA. PowerPoint Presentation.
Karliner, L. S., E. A. Jacobs, A. H. Chen, and S. Mutha. 2007. Do professional interpreters improve clinical care for patients with limited English
proficiency? A systematic review of the literature. Health Services Research 42(2):727-754.
DEFINING LANGUAGE NEED AND CATEGORIES FOR COLLECTION
12
Karliner, L. S., A. M. Napoles-Springer, D. Schillinger, K. Bibbins-Domingo, and E. J. Perez-Stable. 2008. Identification of limited English
proficient patients in clinical care. Journal of General Internal Medicine 23(10):1555-1560.
Karliner, L. S., E. J. Perez-Stable, and G. Gildengorin. 2004. The language divide. The importance of training in the use of interpreters for
outpatient practice. Journal of General Internal Medicine 19(2):175-183.
Kettrick, C. 2008. Report: September 20-21, 200 meeting. Washington, DC: National Coalition on Health Care Interpreter Certification.
Kindler, A. L. 2002. Survey of the state’s limited English proficient students and available educational programs and services 2000-2001 summary report. Washington, DC: The George Washington University National Clearinghouse for English Language Acquisition & Language
Instruction Educational Programs.
Kirkman-Liff, B., and D. Mondragon. 1991. Language of interview: Relevance for research of Southwest Hispanics. American Journal of Public
Health 81(11):1399-1404.
Kominski, R. 1985. Final report—documentation of Voting Rights Act determinations. Memo to Paul Siegel, Feb. 4, 19. Washington, DC:
U.S. Census Bureau.
———. 1989. How good is ‘how well’? An examination of the Census English-speaking ability question. Paper read at 1989 Annual Meeting
of the American Statistical Association, Washington, DC.
Kominski, R., H. Shin, and K. Marotz. April 16-18, 2008. Language needs of school-age children. Paper presented at Annual Meeting of the
Population Association of America, New Orleans, LA.
Ku, L., and G. Flores. 2005. Pay now or pay later: Providing interpreter services in health care. Health Affairs 24(2):435-444.
Language Line Services. 2009. List of languages by language line services http://www.languageline.com/page/languages/ (accessed June 12,
2009).
Larsen, L. J. 2004. The foreign-born population in the United States: 200. Washington, DC: U.S. Census Bureau.
Library of Congress. 2007. ISO 69/joint advisory committee (ISO 69/JAC). http://www.loc.gov/standards/iso639-2/iso639jac.html (accessed
May 26, 2009).
Malone, N., K. F. Baluja, J. M. Costano, and C. J. Davis. 2003. The foreign-born population: 2000. Washington, DC: U.S. Census Bureau.
Manson, A. 1988. Language concordance as a determinant of patient compliance and emergency room use in patients with asthma. Medical
Care 26(12):1119-1128.
Marcos, L. R. 1979. Effects of interpreters on the evaluation of psychopathology in non-English-speaking patients. American Journal of Psychiatry 136(2):171-174.
Marcos, L. R., M. Alpert, L. Urcuyo, and M. Kesselman. 1973. The effect of interview language on the evaluation of psychopathology in Spanish-American schizophrenic patients. American Journal of Psychiatry 130(5):549-553.
McArthur, E. K. 1991 (unpublished). Characteristics of persons in the United States by language spoken: 199 and 199. Washington, DC:
National Center for Education Statistics.
McQuillan, J., and L. Tse. 1995. Child language brokering in linguistic communities: Effects on cultural interaction, cognition, and literacy.
Language and Education 9(3):195-215.
Minnesota Department of Health, Office of Rural Health Primary Care. 2008. Language access services in critical access hospitals for patients
with limited English proficiency in rural Minnesota. St. Paul, MN: Minnesota Department of Health.
Mitchell, R. E. 2005. Can you tell me how many deaf people there are in the United States? http://gri.gallaudet.edu/Demographics/deaf-US.php
(accessed May 14, 2009).
Modern Language Association. 2009a. All languages reported to the US Census in 2000. http://www.mla.org/map_data_langlist&mode=lang_
tops (accessed May 26, 2009).
———. 2009b. The Modern Language Association Language Map: A map of languages in the United States. http://www.mla.org/map_main
(accessed May 26, 2009).
Moreno, M. R., R. Otero-Sabogal, and J. Newman. 2007. Assessing dual-role staff-interpreter linguistic competency in an integrated healthcare
system. Journal of General Internal Medicine 22 (Suppl 2):331-335.
Mutchler, J. E., G. Bacigalupe, A. Coppin, and A. Gottlieb. 2007. Language barriers surrounding medication use among older Latinos. Journal
of Cross-Cultural Gerontology 22(1):101-114.
National Association of Community Health Centers. 2008. Serving patients with limited English proficiency: Results of a community health
center survey. Bethesda, MD: National Association of Community Health Centers and National Health Law Program.
National Institute on Deafness and Other Communication Disorders. 2009. Quick statistics. http://www.nidcd.nih.gov/health/statistics/quick.
htm (accessed May 26, 2009).
NCHS (National Center for Health Statistics). 2009. Acculturation−ACQ, NHANES. Hyattsville, MD: U.S. Department of Health and Human
Services, Centers for Disease Control and Prevention, National Center for Health Statistics.
NCQA (National Committee for Quality Assurance). 2007. Innovative practices in multicultural health care. Washington, DC: NCQA.
New Jersey Courts. 2009. List of languages and language codes: Sign languages. http://www.judiciary.state.nj.us/interpreters/appendix.pdf
(accessed May 26, 2009).
Ngo-Metzger, Q., D. H. Sorkin, R. S. Phillips, S. Greenfield, M. P. Massagli, B. Clarridge, and S. H. Kaplan. 2007. Providing high-quality care
for limited English proficient patients: The importance of language concordance and interpreter use. Journal of General Internal Medicine
22 (Suppl 2):324-330.
NQF (National Quality Forum). 2009. Cultural competency: An organizational strategy for high-performing delivery systems. Washington, DC:
National Quality Forum.
124
RACE, ETHNICITY, AND LANGUAGE DATA
Office of the Attorney General. 2008. Cuomo announces agreements with major pharmacies to provide customers with prescription medication
instructions in their primary language. http://www.oag.state.ny.us/media_center/2009/apr/apr21a_09.html (accessed July 10, 2009).
Orrell, C., D. R. Bangsberg, M. Badri, and R. Wood. 2003. Adherence is not a barrier to successful antiretroviral therapy in South Africa. AIDS
17(9):1369-1375.
Pearson, W. S., I. B. Ahluwalia, E. S. Ford, and A. H. Mokdad. 2008. Language preference as a predictor of access to and use of healthcare
services among Hispanics in the United States. Ethnicity and Disease 18(1):93-97.
Perez-Stable, E. J., A. Napoles-Springer, and J. M. Miramontes. 1997. The effects of ethnicity and language on medical outcomes of patients
with hypertension or diabetes. Medical Care 35(12):1212-1219.
Perkins, J., and M. Youdelman. 2008. Summary of state law requirements addressing language needs in health care. Washington, DC: National
Health Law Program.
Phelan, M., and S. Parkman. 1995. How to do it: Work with an interpreter. British Medical Journal 311(7004):555-557.
Pippins, J. R., M. Alegría, and J. S. Haas. 2007. Association between language proficiency and the quality of primary care among a national
sample of insured Latinos. Medical Care 45(11):1020-1025.
Ponce, N. A., R. D. Hays, and W. E. Cunningham. 2006a. Linguistic disparities in health care access and health status among older adults.
Journal of General Internal Medicine 21(7):786-791.
Ponce, N. A., L. Ku, W. E. Cunningham, and E. R. Brown. 2006b. Language barriers to health care access among Medicare beneficiaries. Inquiry 43(1):66-76.
Price, C. S., and I. Cuellar. 1981. Effects of language and related variables on the expression of psychopathology in Mexican American psychiatric patients. Hispanic Journal of Behavioral Sciences 3:145-160.
Ratzan, S. C., and R. M. Parker. 2000. Introduction. In National Library of Medicine current bibliographies in medicine: Health literacy. NLM
Pub. No. CBM 2000-1, edited by Selden C. R., M. Zorn, Ratzan S. C. and P. R. M. Bethesda, MD: National Institutes of Health, U.S.
Department of Health and Human Services.
Regenstein, M. 2009. How will we know? Screening for preferred language and strategies for measurement. The George Washington University.
Presentation to the IOM Committee on Future Directions for the Healthcare Quality and Disparities Reports, February 9, 2009. Washington, DC. PowerPoint Presentation.
Regenstein, M., and D. Sickler. 2006. Race, ethnicity, and language of patients: Hospital practices regarding collection of information to address disparities in health care. Princeton, NJ: Robert Wood Johnson Foundation.
Rivadeneyra, R., V. Elderkin-Thompson, R. C. Silver, and H. Waitzkin. 2000. Patient centeredness in medical encounters requiring an interpreter. American Journal of Medicine 108(6):470-474.
Roat, C. E. 2005. Addressing language access issues in your practice: A toolkit for physicians and their staff members. San Francisco, CA:
California Academy of Family Physicians.
RTI International—University of North Carolina Evidence-based Practice Center. 2009. Evidence report/technology assessment number :
Literacy and health outcomes. Research Triangle Park, NC: RTI International.
RWJF (The Robert Wood Johnson Foundation). 2008a. Speaking Together Toolkit. http://www.rwjf.org/product.jsp?id=29653 (accessed June
12, 2009).
———. 2008b. Training and tools to ensure accurate screening and registration of patient language needs. http://www.rwjf.org/pr/product.
jsp?id=30582 (accessed July 10, 2009).
Saha, S., and A. Fernandez. 2007. Language barriers in health care. Journal of General Internal Medicine 22 (Suppl 2):281-282.
Sarver, J., and D. W. Baker. 2000. Effect of language barriers on follow-up appointments after an emergency department visit. Journal of General Internal Medicine 15(4):256-264.
Schlemmer, A., and B. Mash. 2006. The effects of a language barrier in a South African district hospital. South African Medical Journal. SuidAfrikaanse Tydskrif Vir Geneeskunde 96(10):1084-1087.
Sentell, T., M. Shumway, and L. Snowden. 2007. Access to mental health treatment by English language proficiency and race/ethnicity. Journal
of General Internal Medicine 22 Suppl 2:289-293.
Shin, H. B., and R. Bruno. 2003. Language use and English-speaking ability: 2000. Washington, DC: U.S. Census Bureau.
Siegel, P., E. Martin, and R. Bruno. 2001. Language use and linguistic isolation: Historical data and methodological issues. Paper presented at
FSCM Statistical Policy Seminar, Bethesda, MD.
SIL International. 2009a. Language family trees: Deaf sign language. http://www.ethnologue.com/show_family.asp?subid=23-16 (accessed
July 20, 2009).
———. 2009b. Relationship between ISO 69- and the other parts of ISO 69. http://www.sil.org/iso639-3/relationship.asp (accessed July
20, 2009).
———. 2009c. Scope of denotation for language identifiers. http://www.sil.org/iso639-3/scope.asp (accessed July 20, 2009).
Stone, M. A., H. Patel, K. K. Panja, D. B. Barnett, and J. F. Mayberry. 1998. Reasons for non-compliance with screening for infection with
Helicobacter pylori, in a multi-ethnic community in Leicester, UK. Public Health 112(3):153-156.
Sudore, R. L., C. S. Landefeld, E. J. Pérez-Stable, K. Bibbins-Domingo, B. A. Williams, and D. Schillinger. 2009. Unraveling the relationship
between literacy, language proficiency, and patient-physician communication. Patient Education and Counseling 75(3):398-402.
Sun, W. Y., B. Sangweni, G. Butts, and M. Merlino. 1998. Comparisons of immunisation accessibility between non-US born and US-born children in New York City. Public Health 112(6):405-408.
Tang, G. 2009. Defining race, ethnicity and language populations. Kaiser Permanente. Presentation to the IOM Committee on Future Directions
for the National Healthcare Quality and Disparities Reports, March 11, 2009. Newport Beach, CA. PowerPoint Presentation.
DEFINING LANGUAGE NEED AND CATEGORIES FOR COLLECTION
12
Thornton, J. D., K. Pham, R. A. Engelberg, J. C. Jackson, and J. R. Curtis. 2009. Families with limited English proficiency receive less information and support in interpreted intensive care unit family conferences. Critical Care Medicine 37(1):89-95.
Ting, G. 2009. Applications of indirect estimation of race/ethnicity data in health plan activities. Wellpoint. Presentation to the IOM Committee on Future Directions for the National Healthcare Quality and Disparities Reports, March 12, 2009. Newport Beach, CA. PowerPoint
Presentation.
Tocher, T. M., and E. Larson. 1998. Quality of diabetes care for non-English-speaking patients. A comparative study. Western Journal of Medicine 168(6):504-511.
Tocher, T. M., and E. B. Larson. 1999. Do physicians spend more time with non-English-speaking patients? Journal of General Internal Medicine 14(5):303-309.
Unicode ISO. 2009. Codes for the representation of names of scripts. http://unicode.org/iso15924/iso15924-codes.html (accessed July 20,
2009).
U.S. Census Bureau. 2002. Voting Rights Act amendments of 1992, determinations under section 203. Federal Register 67(144): 48871-48876.
———. 2003a. Ability to speak English by language spoken at home (PHC-T-). http://www.census.gov/population/www/cen2000/briefs/phct37/index.html (accessed August 3, 2009).
———. 2003b. PHC-T-20 table 2. In Language Use and English-Speaking Ability: 2000. Washington, DC: U.S. Census Bureau.
———. 2003c. PHC-T-20 table 3. In Language Use and English-Speaking Ability: 2000. Washington, DC: U.S. Census Bureau.
———. 2003d. PHC-T-20 table 6. In Language Use and English-Speaking Ability: 2000. Washington, DC: U.S. Census Bureau.
———. 2003e. PHC-T-37 table 1a. In Ability to Speak English by Language Spoken at Home. Washington, DC: U.S. Census Bureau.
———. 2003f. PHC-T-37 table 2a. In Ability to Speak English by Language Spoken at Home. Washington, DC: U.S. Census Bureau.
———. 2003g. PHC-T-37 table 17a. In Ability to Speak English by Language Spoken at Home. Washington, DC: U.S. Census Bureau.
———. 2003h. PHC-T-37 table 49a. In Ability to Speak English by Language Spoken at Home. Washington, DC: U.S. Census Bureau.
———. 2003i. Table 1. Language use, English ability, and linguistic isolation for the population years and over by state: 2000. http://www.
census.gov/population/www/cen2000/briefs/phc-t20/tables/tab01.pdf (accessed August 3, 2009).
———. 2003j. Table . Detailed list of languages spoken at home for the population years and over by state: 2000. http://www.census.gov/
population/www/cen2000/briefs/phc-t20/tables/tab05.pdf (accessed August 3, 2009).
———. 2007. Census 2000 Summary File : Technical Documentation. http://www.census.gov/prod/cen2000/doc/sf3.pdf (accessed August 3,
2009).
U.S. Department of Justice. 2002. Guidance to federal financial assistance recipients regarding Title VI prohibition against national origin discrimination affecting limited English proficient persons. http://www.usdoj.gov/crt/cor/lep/DOJLEPGuidApr122002.php (accessed August 3,
2009).
———. 2003. ADA business brief: Communicating with people who are deaf or hard of hearing in hospital settings. Washington, DC: U.S.
Department of Justice, Civil Rights Division, Disability Rights Section.
———. 2008. About language minority voting rights. http://www.usdoj.gov/crt/voting/sec_203/activ_203.php#coverage (accessed June 12,
2009).
U.S. English Foundation. 2009a. Languages in America. http://www.usefoundation.org/view/29 (accessed May 26, 2009).
———. 2009b. Top languages by county. http://www.usefoundation.org/userdata/file/Research/top_languages_by_county.pdf (accessed June
17, 2009).
———. 2009c. United States: Number of languages spoken by county. http://www.usefoundation.org/userdata/file/Research/Regions/united_
states.pdf (accessed May 26, 2009).
Waxman, M. A., and M. A. Levitt. 2000. Are diagnostic testing and admission rates higher in non-English-speaking versus English-speaking
patients in the emergency department? Annals of Emergency Medicine 36(5):456-461.
Weech-Maldonado, R., L. S. Morales, M. Elliott, K. Spritzer, G. Marshall, and R. D. Hays. 2003. Race/ethnicity, language, and patients’ assessments of care in Medicaid managed care. Health Services Research 38(3):789-808.
Weinick, R. M., and N. A. Krauss. 2000. Racial/ethnic differences in children’s access to care. American Journal of Public Health 90(11):
1771-1774.
Wilson, E., A. H. Chen, K. Grumbach, F. Wang, and A. Fernandez. 2005. Effects of limited English proficiency and physician language on health
care comprehension. Journal of General Internal Medicine 20(9):800-806.
Wisnivesky, J. P., M. Kattan, D. Evans, H. Leventhal, T. J. Musumeci-Szabo, T. McGinn, and E. A. Halm. 2009. Assessing the relationship
between language proficiency and asthma morbidity among inner-city asthmatics. Medical Care 47(2):243-249.
Woloshin, S., N. A. Bickell, L. M. Schwartz, F. Gany, and H. G. Welch. 1995. Language barriers in medicine in the United States. Journal of the
American Medical Association 273(9):724-728.
Woloshin, S., L. M. Schwartz, S. J. Katz, and H. G. Welch. 1997. Is language a barrier to the use of preventive services? Journal of General
Internal Medicine 12(8):472-477.
Wrigley, H. S., E. Richer, K. Martinson, H. Kubo, and J. Strawn. 2003. The language of opportunity: Expanding employment prospects for
adults with limited English skills. Washington, DC: Center for Law and Social Policy.
Wu, S. M., R. M. Nyman, M. D. Kogan, Z. J. Huang, and R. H. Schwalberg. 2004. Parent’s language of interview and access to care for children
with special health care needs. Ambulatory Pediatrics 4(2):181-187.
Youdelman, M. 2007. Medicaid and SCHIP reimbursement models for language services. Washington, DC: National Health Law Program.
Youdelman, M. K. 2008. The medical tongue: U.S. laws and policies on language access. Health Affairs 27(2):424-433.
Zun, L. S., T. Sadoun, and L. Downey. 2006. English-language competency of self-declared English-speaking Hispanic patients using written
tests of health literacy. Journal of the National Medical Association 98(6):912-917.
5
Improving Data Collection Across
the Health Care System
While a range of health and health care entities collect data, the data do not flow among these entities
in a cohesive or standardized way. Entities within the health care system face challenges when collecting
race, ethnicity, and language data from patients, enrollees, members, and respondents. Explicitly expressing the rationale for the data collection and training staff, organizational leadership, and the public to
appreciate the need to use valid collection mechanisms may improve the situation. Nevertheless, some
entities face health information technology (HIT) constraints and internal resistance. Indirect estimation
techniques, when used with an understanding of the probabilistic nature of the data, can supplement
direct data collection efforts.
Addressing health and health care disparities requires the full involvement of organizations that have an
existing infrastructure for quality measurement and improvement. Although hospitals, community health centers
(CHCs), physician practices, health plans, and local, state, and federal agencies can all play key roles by incorporating race, ethnicity, and language data into existing data collection and quality reporting efforts, each faces
opportunities and challenges in attempting to achieve this objective.
To identify the next steps toward improving data collection, it is helpful to understand these opportunities and
challenges in the context of current practices. In some instances, the opportunities and challenges are unique to
each type of organization; in others, they are common to all organizations and include:
• H
ow to ask patients and enrollees questions about race, ethnicity, and language and communication needs;
• How to train staff to elicit this information in a respectful and efficient manner;
• H
ow to address the discomfort of registration/admission staff (hospitals and clinics) or call center staff
(health plans) about requesting this information;
• How to address potential patient or enrollee pushback respectfully; and
• How to address system-level issues, such as changes in patient registration screens and data flow.
Previous chapters have provided a framework for eliciting, categorizing, and coding data on race, ethnicity,
and language need. This chapter considers strategies that can be applied by various entities to improve the collection of these data and facilitate subsequent reporting of stratified quality measures. It begins by examining current
12
12
RACE, ETHNICITY, AND LANGUAGE DATA
practices and issues related to collecting and sharing data across the health care system. Next is a discussion of
steps that can be taken to address these issues and improve data collection processes. This is followed by a review
of methods that can be used to derive race and ethnicity data through indirect estimation when obtaining data
directly from many patients or enrollees is not possible.
COLLECTING AND SHARING DATA ACROSS THE HEALTH CARE SYSTEM
Health care involves a diverse set of public and private data collection systems, including health surveys,
administrative enrollment and billing records, and medical records, used by various entities, including hospitals,
CHCs, physicians, and health plans. Data on race, ethnicity, and language are collected, to some extent, by all
these entities, suggesting the potential of each to contribute information on patients or enrollees. The flow of data
illustrated in Figure 5-1 does not even fully reflect the complexity of the relationships involved or the disparate
data requests within the health care system. Currently, fragmentation of data flow occurs because of silos of data
collection (NRC, 2009).
No one of the entities in Figure 5-1 has the capability by itself to gather data on race, ethnicity, and language
for the entire population of patients, nor does any single entity currently collect all health data on individual patients.
One way to increase the usefulness of data is to integrate them with data from other sources (NRC, 2009). Thus
there is a need for better integration and sharing of race, ethnicity, and language data within and across health care
entities and even (in the absence of suitable information technology [IT] processes) within a single entity.
It should be noted that a substantial fraction of the U.S. population does not have a regular relationship with a
provider who integrates their care (i.e., a medical home) (Beal et al., 2007). For some, a usual source of care is the
emergency department (ED), a situation that complicates the capture and use of race, ethnicity, and language data
and their integration with quality measurement. While health plans insure a large portion of the U.S. population,
their direct contact tends to be minimal, even during enrollment. Hospitals, which tend to have more developed
data collection systems, serve only a small fraction of the country’s population. As a result, no one setting within
the health care system can capture data on race, ethnicity, and language for every individual.
Health information technology (HIT) may have the potential to improve the collection and exchange of
self-reported race, ethnicity, and language data, as these data could be included, for example, in an individual’s
personal health record (PHR) and then utilized in electronic health record (EHR) and other data systems. 1 There is
little reliable evidence, though, on the adoption rates of EHRs (Jha et al., 2009). While substantial resources were
devoted to this technology in the American Recovery and Reinvestment Act of 2009,2 it will take time to develop
the infrastructure necessary to fully implement and support HIT (Blumenthal, 2009). Thus, the consideration of
other avenues of data collection and exchange is essential to the subcommittee’s task.
Until data are better integrated across entities, some redundancy will remain in the collection of race, ethnicity, and language data from patients and enrollees, and equivalently stratified data will remain unavailable for
comparison purposes unless entities adopt a nationally standardized approach. Methods should be considered
for incorporating these data into currently operational data flows, with careful attention to concerns regarding
efficiency and patient privacy.
Hospitals
Because hospitals tend to have information systems for data collection and reporting, staff who are used to
collecting registration and admissions data, and an organizational culture that is familiar with the tools of quality
improvement, they are relatively well positioned to collect patients’ demographic data. In addition, hospitals have a
history of collecting race data. With the passage of the Civil Rights Act of 19643 and Medicare legislation in 1965,4
1
A PHR is a medical or health record owned and maintained by a patient him- or herself. EHRs are further defined in Chapter 6.
American Recovery and Reinvestment Act of 2009, Public Law 111-5 § 3002(b)(2)(B)(vii), 111th Cong., 1st sess. (February 17, 2009).
3 The Civil Rights Act of 1964, Public Law 88-352, 78 Stat. 241, 88th Cong., 2d sess. (July 2, 1964).
4 The Social Security Act of 196, 89th Cong., 42 U.S.C. § 7, 1st sess. (July 30, 1965).
2
129
IMPROVING DATA COLLECTION ACROSS THE HEALTH CARE SYSTEM
National Level
Collection
Multi-State
Collection
Medicare
National Vital Statistics
Systems
Accreditation and
QI Organizations (e.g.,
NCQA, Joint Commission)
Government Agency
Administered Surveys (e.g.,
NHIS and BRFSS)
Health Plans
HCUP
Regional Quality Improvement
Organizations
MEPS
State Vital Statistics
Systems
State Surveillance
State Level
Collection
Public Insurance Programs
(e.g., Medicaid and SCHIP)
Health and health care
promotion activities
Provider Level
Collection
Individual
Data
Physician Practices
Hospitals
Local Public Health Agencies
CHCs
Other Health Delivery Entities
(e.g., nursing homes)
Patient Medical Record
Surveys of Person’s Health or
Health Care
FIGURE 5-1 A snapshot of data flow in a complex health care system.
there was a legislative mandate for equal access to and desegregation of hospitals (Reynolds, 1997). Therefore it is
not surprising that more than 89 percent of hospitals report collecting race and ethnicity data, and 79 percent report
collecting data on primary language (AHA, 2008).
This culture of data collection has limitations, however. Historically, the data were never intended for quality improvement purposes, but to allow analysis to ensure compliance with civil rights provisions. Additionally,
hospital data collection practices are less than systematic as the categories collected vary by hospital, and hospitals obtain the information in various ways (e.g., self-report and observer report) (Regenstein and Sickler, 2006;
Romano et al., 2003; Siegel et al., 2007). Furthermore, compared with the number of people who are insured or
visit an ambulatory care provider, a relatively small number of people are hospitalized in any one year (see Figure
5-2). Thus, while hospitals are an important component of the health care system and represent a major percentage
of health care expenditures, they are only one element of the system for collecting and reporting race, ethnicity,
and language data.
Hospitals also face challenges associated with collecting accurate data and using these data for quality improvement and reduction of disparities. A 2006 National Public Health and Hospitals Institute (NPHHI) survey asked
hospitals that collected race and ethnicity data whether they used the data to assess and compare quality of care,
utilization of health services, health outcomes, or patient satisfaction across their different patient populations.
Fewer than one in five hospitals that collected these data used them for any of these purposes (Regenstein and
Sickler, 2006). Additionally, only half of hospitals that collected data on primary language maintained a database
of patients’ primary languages that they could track over time (Hasnain-Wynia et al., 2006).
Many of the above challenges can be attributed largely to the many staff and departments or units that need
to be engaged in the process to ensure systematic data collection and use. Hospitals have multiple pathways (inpatient, outpatient, ED, urgent care) through which patients enter the system. For example, the ED is the source of
45 percent of all hospital admissions (Healthcare Financial Management Association, 2007).
Systems changes can involve training a large number (possibly hundreds) of hospital registration/admission
staff (many of whom may be off site) and modifying practice management and EHR systems to ensure that proper
10
Persons in the United States, age 18–64 (in millions)
(all data from 2006)
RACE, ETHNICITY, AND LANGUAGE DATA
210
186.7
173
180
149
150
120
90
60
47
30
12.9
0
Population a
Insured by
private or
government
insurancea
Hospitalizedb
Visit to doctor's Medical homec
office, ED, or
b
home visited
FIGURE 5-2 Opportunities to collect data within the health care system.
a U.S. Census Bureau, 2000.
b NCHS, 2009.
c
Beal, 2004.
and consistent data fields are in place across multiple departments and units that serve as patient entry points. Ideally, these systems would be made interoperable through the development of interfaces that would make it possible
to relay the data across different systems.
A Robert Wood Johnson Foundation initiative to reduce disparities in cardiac care required participating hospitals to systematically collect race, ethnicity, and language data and use the data to stratify quality measures. The
ten hospitals in the collaborative initially cited the data collection requirement as one of the greatest challenges of
the program, yet once they focused their efforts on these goals, they were able to bring together key stakeholders
within each institution, implement needed IT changes, and train staff. As a result, they successfully began data
collection within a relatively short time (Siegel et al., 2008). Other hospitals not part of this initiative are also
successfully collecting race, ethnicity, and language data and linking them to quality measures (Weinick et al.,
2008). Data collected at the hospital level are useful both for assessing the quality of hospital-provided services
and, if shared with other entities, for facilitating analyses of quality across multiple settings. Box 5-1 provides an
example of a statewide initiative to collect standardized race, ethnicity, and language data.
Community Health Centers
CHCs are front-line providers of care for underserved and disadvantaged groups (Taylor, 2004) and therefore
are good settings for implementing quality improvement strategies aimed at reducing racial and ethnic disparities
in care. Yet while CHCs serve diverse patient populations and, as organizations, understand the importance of
demographic data for improving the quality of care, the accuracy of the race, ethnicity, and language data they
collect may be limited (Maizlish and Herrera, 2006). More than 87 percent of surveyed CHCs reported inquiring
about a patient’s need for language services, and 73 percent reported recording this information in the patient
record (Gallegos et al., 2008); less is known, however, about the extent to which CHCs consistently collect patient
IMPROVING DATA COLLECTION ACROSS THE HEALTH CARE SYSTEM
11
BOX 5-1
Statewide Race and Ethnicity Data Collection: Massachusetts
In January 2007, all Massachusetts hospitals were required to begin collecting race and ethnicity data
from every patient with an inpatient stay, an observation unit stay, or an emergency department visit. These
data are included in the electronic discharge data each hospital submits to the state’s Division of Health
Care Finance and Policy. As part of this effort, a standardized set of reporting categories was created and
train-the-trainer sessions were held across the state. A report on this initiative notes:
“The new efforts in Massachusetts are unique in the constellation of requirements and approaches
being implemented in the state today. First, all acute care hospitals are required to collect these data, and
a recommended data collection tool has been developed jointly by the city [Boston] and Commonwealth to
standardize efforts across hospitals. Second, the tool and the required categories in which hospitals must
provide patient-level discharge data to the [state] include an exceptionally detailed list of ethnicities, with
31 reporting categories that include 144 ethnicities or countries of origin. Third, the collaboration between
the City of Boston, the Commonwealth of Massachusetts, and hospitals has been crucial to turning policy
attention to reducing disparities in the quality of health care.” Acute care hospitals are required to report
the basic OMB race categories along with 31 ethnicity categories: Asian Indian, Cambodian, Chinese, Filipino, Japanese, Korean, Laotian, Vietnamese, African American, African, Dominican, Haitian, European,
Portuguese, Eastern European, Russian, Middle Eastern (or North African), Caribbean Island, American,
Brazilian, Cape Verdean, Central American (not otherwise specified), Colombian, Cuban, Guatemalan,
Honduran, Mexican (Mexican, Mexican American, Chicano), Puerto Rican, Salvadoran, South American
(not otherwise specified), and Other Ethnicity.
SOURCES: Massachusetts Executive Office of Health and Human Services, 2009; Weinick et al., 2007, 2008.
race and ethnicity data beyond the basic OMB categories included in their national Uniform Data System (HRSA,
2009).5
Like hospitals, CHCs face challenges to collecting data, such as the need to train staff, the need to modify
existing HIT systems, and the need to ensure interoperability between the practice management systems where
demographic data are collected and recorded and the EHR systems where the demographic data can be linked to
clinical data for quality improvement purposes. In 2006, only 26 percent of surveyed CHCs reported some EHR
functionality, yet 60 percent reported plans for installing a new EHR system or replacing the current system (Shields
et al., 2007). Collection of demographic data can also increase the burden of data entry for staff, particularly for
those CHCs that still use paper forms to collect these data from patients (Chin et al., 2008).
Limited resources (both financial and human) and a high-need patient population present ongoing challenges
to CHCs in their data collection and quality improvement efforts (see Box 5-2). Because 40 percent of CHCs’
patient populations are uninsured and because CHCs generally have a poor payer mix (Manatt Health Solutions
and RSM McGladrey, 2007; National Association of Community Health Centers, 2006), they gain relatively less
revenue than private physician practices from quality improvement interventions that lead to the delivery of more
services (Chin et al., 2008). Even with increases in federal funding, CHCs struggle to meet the rising demand for
care along with demands to increase quality reporting, reduce disparities, and develop EHR systems (Hurley et
al., 2007).
5
More than 3 million of the 16 million users were recorded in 2007 under “Unreported/Refused to report.” With these two categories being
combined, it is impossible to tell if there was actually no data collection or if a large portion of people refused to respond.
12
RACE, ETHNICITY, AND LANGUAGE DATA
BOX 5-2
Collecting and Using Data: The Alliance of Chicago Community Health Services
The Alliance of Chicago Community Health Services developed a customized EHR system to provide
decision support for clinicians and link clinical performance measures with key patient characteristics to
identify disparities in performance and inform quality improvement efforts. The alliance of four CHCs across
32 clinical sites implemented the centralized EHR system in 2005–2006. The system is hosted in a secure
facility, allowing its data to be accessed by providers via the Internet. The aggregate data means CHCs
can look at trends across populations and compare outcomes by different communities, different CHCs,
or different demographic groups. The system integrates patient race and ethnicity data, which is collected
and stored in the practice management system, with clinical data stored in the EHR system.
The processes of development and implementation required reconsiderations of workflow design,
customization, and decision support. For example, implementation required analyzing and redesigning
hundreds of clinical workflow patterns in busy CHCs and developing the right strategies for training staff.
Additionally, some CHCs were collecting race and ethnicity data using paper forms and then transferring
the data first into practice management systems and then into EHR systems for linkage with quality data.
Lack of standardization for quality measures and data specifications made some of the tasks even more
difficult. The standard ultimately decided upon for collection was the OMB standard categories. Now that
the systems are in place, it is possible for clinics to move forward with collecting more granular data. The
Alliance is now serving as a model for CHC systems in New York, California, and Detroit.
SOURCES: De Milto, 2009; Kmetik, 2009; Rachman, 2007.
Physician and Group Practices
The structure and capabilities of primary and specialty care entities vary tremendously, ranging from large
groups or health centers with highly structured staff and advanced information systems to solo physician practices
with correspondingly small staff. The ability and motivation of these entities to collect and effectively use race,
ethnicity, and language data consequently also vary given the investments in HIT systems and staff training required
for these functions. At the same time, these settings have direct contact with patients, ideally as part of an ongoing
caregiving relationship. Thus, they are well suited to explaining the reasons for collecting these data, as well as
using the data to assess health care needs and patterns of disparities. Physician practices, however, are less likely
than hospitals or CHCs to collect race, ethnicity, and language data from patients (Nerenz et al., 2004).
Medical groups may believe either that it is unnecessary to collect these data or that collecting them would
offend patients (Nerenz and Darling, 2004). Physician practices may not see the utility of the data and may believe
that they should not bear the burden of collecting the data and linking them to quality measures (Mutha et al., 2008).
A number of physicians and practice managers interviewed in 2007 thought it was illegal to collect these data, and
many did not understand how the data would be used (Hasnain-Wynia, 2007). However, most of the interviewees
(physicians, nurse managers, and practice managers) indicated that they thought it would not be problematic to
collect these data from their patients if they could explain why the data were being collected and how they would be
used (see Box 5-3). Indeed, Henry Ford Medical Group has collected race and ethnicity data for more than twenty
years, and the Palo Alto Medical Foundation, a multispecialty provider group with several clinics, has recently
begun to collect race and ethnicity data for use in analyses of disparities (Palaniappan et al., 2009).
Primary care sites typically do not have structured information available about care provided at other locations, so their ability to analyze data on quality of care by race, ethnicity, and language is generally limited to
measures involving routine prevention and primary care. Physician practices with EHR systems tend to use the
system for administrative rather than quality improvement purposes (Shields et al., 2007), but EHR systems can
IMPROVING DATA COLLECTION ACROSS THE HEALTH CARE SYSTEM
1
BOX 5-3
Collecting Data in Small Physician Practices
The National Committee for Quality Assurance (NCQA) launched a quality improvement demonstration program for small physician practices serving minority populations. With funding from The California
Endowment, NCQA provided grants and technical assistance to small practices (five physicians or fewer).
The goal of the project was to learn what types of resources and tools these practices need in order
to conduct and sustain quality improvement activities, especially in serving disadvantaged populations.
After the project, participants reported a greater appreciation for the importance of collecting race and
ethnicity data, although few practices began to do so systematically. Before the project, needs assessment surveys showed that only 15 percent of physicians had a “written standard identifying and prominently displaying in the medical record the language preferred by the patient.” While few of the practices
began formal data collection, staff at most practices expressed an understanding of the value of this
information. The project also improved the participants’ understanding of the legal issues related to collecting data from patients on race, ethnicity, and language need. For example, one physician reported,
“You guys have taught me that it is not illegal to identify race. That’s such a batted about issue, but it is
not against HIPAA regulations to identify race and culture and language in the medical chart.” However,
practical barriers to data collection remained. One challenge faced by practices was the lack of standardized fields in EHR systems. Practices that sought to collect data usually created their own method for
documenting race and ethnicity.
SOURCE: NCQA, 2009.
be tailored to link quality measures and demographic data (Kmetik, 2009). Data on race, ethnicity, and language
need collected in these settings could be useful throughout the health care system if mechanisms were in place
for sharing the data with other entities (e.g., health plans) that have an ongoing obligation and infrastructure for
analysis of data on quality of care which can be stratified by race, ethnicity, and language need and can look at
episodes of care and care coordination.
Multispecialty group practices, which provide a range of primary care, specialty care, inpatient care, and
other services, may be in a strong position to collect race, ethnicity, and language data because they have regular
contact with large numbers of patients over long periods of time, can place the data collection in the context of
improvement of care rather than administration of health insurance benefits, and typically have the necessary staff
and other forms of infrastructure (e.g., a shared EHR system at all care sites). A single EHR system may facilitate
the sharing of race, ethnicity, and language data across sites and levels of care, assuming that the data are present
and available in the system.
Health Plans
Health plans, including Medicaid managed care and Medicare Advantage plans, have the capabilities necessary
to systematically compile and manage race, ethnicity, and language data, and thus have roles to play in quality
improvement (Rosenthal et al., 2009). Plans, though, may have limited opportunities for direct contact during
which the data can be collected and the need for the data explained. While there are multiple points at which the
data can be collected (e.g., disease management programs, member surveys, enrollment), a principal occasion for
contact is during enrollment, when fears about discriminatory use of the data may be greatest. California, Maryland, New Hampshire, New Jersey, New York, and Pennsylvania prohibit insurers from requesting an applicant’s
race, ethnicity, religion, ancestry, or national origin in applications, but the states do allow insurers to request such
14
RACE, ETHNICITY, AND LANGUAGE DATA
BOX 5-4
Successful Collection of Data by a Health Plan: Aetna
Aetna was the first national, commercial plan to start collecting race and ethnicity data for all of its
members. In 2002, Aetna began directly collecting these data using electronic and paper enrollment
forms. Multiple mechanisms are now used to capture race, ethnicity, and language data. The data may
be updated at any point of contact, including at enrollment, when members speak to customer service or
patient management representatives, and when members access an online member portal. Since 2002,
more than 60 million Aetna members have provided race, ethnicity, and/or primary language information.
As of 2009, Aetna had collected this information from more than 6 million members, representing approximately 30–35 percent cumulative coverage of race, ethnicity, and language data for its currently enrolled
population. Aetna’s success with direct collection has shown that no negative public reaction occurs when
plans collect this information.
SOURCES: NCQA, 2006; Personal communication, W. Rawlins, Aetna, May 3, 2009.
information from individuals once enrolled (AHIP, 2009). There are no legal impediments to collecting these data
after enrollment.
As many individuals enroll in plans through their place of employment, employers provide one avenue for the
collection of race, ethnicity, and language need data. It is possible in principle for individuals to self-identify during
open enrollment in a health plan, with the individual’s employer conveying the enrollee’s race and ethnicity data
to the plan through an electronic enrollment transaction. The plan could then use these data for quality improvement interventions and measurement. In fact, the Health Insurance Portability and Accountability Act of 1996
(HIPAA) 834 enrollment standard6,7 provides for the transmittal of race and ethnicity data. However, the HIPAA
Transactions Rule applies only to health plans, health care clearinghouses, and certain health care providers. Thus,
while race and Hispanic ethnicity may be captured in the enrollment transaction and plans are required to accept
the standard transaction if it is sent to them, employers rarely use the standard and are not required to do so. As
a result, this avenue of data collection is not currently operational, although pending legislation encouraging the
use of electronic enrollment transaction standards may make it more common in the future. 8
A study conducted by America’s Health Insurance Plans (AHIP) found that 54 percent of plans collected
race and ethnicity data, and 56 percent collected primary language data. The National Health Plan Collaborative
(NHPC), a public–private partnership to improve quality of care and reduce disparities, 9 focused on collecting
demographic data on enrollees. NPHC viewed direct data collection as the gold standard since this method supports interventions and direct outreach to individuals, but NHPC members realized that obtaining data through
direct methods can take years to achieve in a health plan setting (Lurie, 2009). Likewise, the limited success of
Aetna with data collection (see Box 5-4) after several years of concerted effort suggests that the upper limit of
data collection by health plans with presently known direct methods may be far below the level necessary for
6
Health Insurance Portability and Accountability Act of 1996, Public Law 104-191, 104th Cong., 2d sess. (August 21, 1996).
Version 4010 of the X12 standards defines the 834 enrollment transaction. Version 5010 was adopted in January 2009 and must be implemented by January 1, 2012. Under this version, the transaction will still need to come from a plan sponsor or employer, and as sponsors and
employers are not covered entities under HIPAA, they are not required to use the enrollment standard (Personal communication, L. Doo, Office
of E-Health Standards and Services, Centers for Medicare & Medicaid Services, July 14, 2009).
8 As of July 2, 2009, the “Affordable Health Choices Act” included provisions that the Secretary of HHS shall streamline and simplify
standards for electronic enrollment, including capability for individual enrollees to manage their enrollment online.
9 NHPC was established in 2004 and included 11 national plans with more than 87 million members. As of 2009, its activities are coordinated
by America’s Health Insurance Plans (AHIP).
7
IMPROVING DATA COLLECTION ACROSS THE HEALTH CARE SYSTEM
1
identifying disparities in quality of care through stratified analysis, for example, of Healthcare Effectiveness Data
and Information Set (HEDIS) data.
While the use of racial, ethnic, and language identifiers for coverage, benefit determination, and underwriting
is prohibited, the collection of these data for improving quality and reducing health care disparities is both permitted and encouraged. Low participation by plan members in reporting race, ethnicity, and language data may be
indicative of low trust of the industry (Coltin, 2009). Despite informing members of how data will be used, plans
may also face internal legal concerns about taking on unnecessary liability through threats of legal action due to
misperceptions regarding the purposes of collection.
Surveys
Federal and state health agencies administer surveys that are primary sources for estimating the health of a
population and current and future needs for health care services (Ezzati-Rice and Curtin, 2001; Mays et al., 2004).
For example, a number of studies reviewed in Chapter 2 employed surveys such as the National Health Interview
Survey (NHIS), the National Latino and Asian American Survey (NLAAS), and the California Health Interview
Survey (CHIS). Surveys can capture data not included in administrative and utilization data—notably data on the
uninsured and reports on financial and nonfinancial barriers to seeking care. Other surveys, such as the Consumer
Assessment of Healthcare Providers and Systems (CAHPS), are designed to assess plans, hospitals, and medical
groups and capture respondents’ self-reported race and ethnicity. These surveys are resources for quality measurement and improvement. While some can be linked to specific health care delivery sites, most are not, so they tend
to be a data collection system that is parallel to, rather than integrated with, care delivery.
A fundamental feature of surveys, whether self-administered by mail or interviewer-administered in person
or by phone, is that a respondent’s race, ethnicity, and language need are self-identified and not ascribed by the
interviewer. However, cues from the interviewer, a respondent’s suspicion of lack of confidentiality, or the social
and political context can influence a respondent’s answer (Craemer, 2009; Foley et al., 2005). Moreover, conducting surveys of representative population-based samples in diverse settings requires an assessment of the need for
in-language interviews (Ponce et al., 2006), balanced by the costs associated with high-quality translations and
trained bilingual interviewers. For surveys conducted in multiple languages (e.g., the CHIS is conducted in English,
Spanish, Cantonese, Mandarin, Vietnamese, and Korean), the language of the interview conveys, to some extent,
the respondent’s language preference in communicating health information.
Surveys are charged with obtaining stable estimates for population groups defined not only by race, ethnicity,
and language, but also by geography and other demographic characteristics. Cost, logistical issues, and protection
of respondents’ confidentiality constrain the granularity of reportable race and ethnicity estimates (Madans, 2009).
To ensure usable data on population groups, the NHIS oversamples Blacks, Asians, and Hispanics (Madans, 2009),
but lower coverage is provided for smaller groups, such as Native Hawaiian or Other Pacific Islanders (NHOPI),
in the NHIS (e.g., there were fewer than 10 Samoan respondents in NHIS 2007).
Oversampling is a viable strategy to increase coverage of smaller populations. Yet oversampling incurs costs
associated with the rarity of the population and the expense of the survey modality (e.g., the marginal cost of
adding one more Samoan respondent would be greater for in-person household interviews than for telephone
interviews). Other issues relate to the clustering of a population in a designated area (if area-based oversampling
is used) and the specificity and sensitivity of surname lists (if list-assisted oversampling is used). Information
on granular ethnicities may also be gleaned from surveys with an explicit focus on specific ethnic groups (e.g.,
NLAAS) and on subregions (e.g., CHIS).
Another strategy for estimating the health and health care needs of ethnic groups is to combine years of survey
data (Barnes et al., 2008; Freeman and Lethbridge-Cejku, 2006; Kagawa-Singer and Pourat, 2000). Some of the
findings on variations within and among population groups reported in Chapter 2 were generated from pooled
analyses of the NHIS sample to increase the size of the samples. Pooling, however, may not work for the smallest
population groups; for example, it would take at least 8 years of NHIS data to obtain the sample size needed for
reportable estimates on the NHOPI population. Over such a long time span, significant changes can compromise
the validity and relevance of such estimates for health care policy and planning purposes. Where pooling is useful,
16
RACE, ETHNICITY, AND LANGUAGE DATA
standardized measures of demographic variables would improve the quality of the pooled data. Given the limitations of survey sampling, administrative databases offer the potential to collect data on higher numbers of smaller
ethnic groups and make statistically reliable analytic comparisons across groups (e.g., a hospital administrative
database versus a sample of hospital patients).
IMPROVING DATA COLLECTION PROCESSES
The above discussion of challenges faced by various health and health care entities highlights how important it
is for data capture and quality to overcome HIT constraints and minimize respondent and organizational resistance.
Integration of data systems has the potential to streamline collection processes so that data can be reported easily,
and an individual will not need to self-identify race, ethnicity, and language need during every health encounter.
Until such integration is achieved, enhancing legacy HIT systems, implementing staff training, and educating
patients and communities about the reasons for and importance of collecting these data can help improve data
collection processes.
The collection of race, ethnicity, and language need data by various entities within the health care system
raises the possibility that conflicting data may, in some instances, be assigned to a single individual. An individual
may self-identify in one clinical setting according to a limited set of choices, whereas another setting may offer
more detailed, specific response options, or the individual’s race may have been observed rather than requested
and then recorded by an intake worker. There is value in developing a hierarchy of accuracy by which conflicting
data can be adjudicated. As previously discussed in this report, OMB prefers self-reported data, and researchers
view self-report as the “gold standard” (Higgins and Taylor, 2009; OMB, 1997; Wei et al., 2006). Other methods
of collecting these data (e.g., observer report) have been found to be inaccurate compared with self-reported data,
resulting in undercounts of certain population groups (Buescher et al., 2005; Hahn et al., 1996; West et al., 2005;
Williams, 1998). Thus, in this hierarchy of accuracy, self-report can be understood as being of superior validity.
The subcommittee is aware of few systems in which race and ethnicity data are collected in more than one way
and compared against self-report for validation. Therefore, the subcommittee cannot make generalizations about
which sources or systems are likely to be of superior validity, other than commenting that self-report is preferred
over observer-report.
The Health Level 7 (HL7) standards allow for data to be attributed as observer report or self-report, which
may facilitate the resolution of conflicting data. There is no solid evidence in favor of the quality of data from any
one locus of data collection (e.g., a health plan or hospital), except to the extent that location is correlated with
data collection methods. If a provider, for example, collects these data through self-report and hospital records
involve observer assignment, then favoring the self-reported data from the provider setting would make sense if
the data were linked and conflicting data were found.
Not all data systems capture the method through which the data were collected, and some systems do not
allow for data overrides. The interoperability of data systems may, for example, prohibit a provider from updating data on a patient that were provided by the patient’s health plan. Thus, while self-reported data should trump
indirectly estimated data or data from an unknown source, ways of facilitating this process logistically warrant
further investigation. Data overriding should be used with caution, as overriding high-quality data with poor-quality
data reduce the value for analytic processes.
Enhancing Legacy HIT Systems
The varied and limited capacities of legacy HIT systems challenge the collection, storage, and sharing of race,
ethnicity, and language data. A single hospital, for example, may use different patient registration systems, which
may not have the capacity to communicate with one another. Often, these systems operate unidirectionally, meaning that a system may be able to send or receive information but be unable to do both. Thus, a central system may
be able to send data on a patient’s race, ethnicity, and language to affiliated outpatient settings, but data collected
in outpatient settings may not flow back to the central system (Hasnain-Wynia et al., 2004). Additionally, some
quality data are derived from billing or other sources, requiring further linkages.
IMPROVING DATA COLLECTION ACROSS THE HEALTH CARE SYSTEM
1
In ambulatory care settings (both CHCs and physician practices), race, ethnicity, and language need data are
usually collected during the patient registration process and stored in practice management systems. However,
clinical performance data may be captured in an another system, meaning that race, ethnicity, and language data in
the practice management system need to be imported into the EHR system to produce quality measures stratified
by these variables. Practice management systems and EHR systems therefore need to be interoperable.
As technology vendors have adopted standardized communication protocols such as HL7, interoperability
has improved for exchange of data such as race and ethnicity (HL7, 2009). Such standards are not universally
accepted, however, so some HIT components can communicate without modification, while others require upgrading to ensure that race, ethnicity, and language data can be collected, stored, and shared. While transitioning from
legacy HIT systems to newer systems is challenging, especially in physician practices (Zandieh et al., 2008), the
American Recovery and Reinvestment Act of 200910 provides stimuli for moving forward with national standard
HIT systems.
Most hospitals have the capacity to make changes in their HIT systems, patient registration screens, and fields
in house, but some hospitals must go through a corporate office to make these changes. The engagement and support of a hospital’s IT department are important to the success of such efforts.
Implementing Staff Training
Staff of hospitals, physician practices, and health plans have expressed concern about asking patients, enrollees,
or members to provide information about their race, ethnicity, and language need (Hasnain-Wynia, 2007). Staff
may believe, for example, that patients might be confused or offended by such a request. Furthermore, staff may
be concerned about the time-sensitive nature of modern clinical practice and want to ensure that these questions
can be asked efficiently.
To ensure that these data are collected accurately and consistently, health care organizations need to invest in
training all levels of staff. This may include incorporating the usefulness of these data for detecting and addressing health care needs into the training of health professionals, administrative staff, and hospital and health plan
leadership. For example, those responsible for directly asking patients or enrollees for this information can receive
front-line training to learn about the importance of collecting these data; how they will be used; how they should
be collected; and how concerns of patients, enrollees, and members can be addressed (Hasnain-Wynia et al., 2004,
2006, 2007; Regenstein and Sickler, 2006). When there is direct contact between staff and patients, for instance,
if staff do not understand the greater accuracy of directly reported data, they may make their own observations of
an individual’s race and/or ethnicity.
Specific training points to be emphasized will depend on the context and on how the data are being collected
and utilized. For example, because health plan staff do not have face-to-face contact with enrollees, demographic
information is often gathered through telephone encounters. Telephone training may also be needed for staff of
hospitals, CHCs, and physician practices because preregistration by telephone may occur before hospital admission
or ambulatory care appointments. Contra Costa Health Plan monitored the frequency with which staff were asking
for these data and implemented performance metrics to ensure staff compliance. Generally, providers have faceto-face contact with patients and may find response rates are better during that time. Therefore, staff training at
clinical sites may need to emphasize elements of face-to-face communication. The Health Research & Educational
Trust (HRET) Disparities Toolkit, which has been endorsed by the National Quality Forum (NQF), offers a matrix
for addressing patient reluctance under different scenarios (Hasnain-Wynia et al., 2007; NQF, 2008). Questions
for requesting these data may introduce response bias, in the absence of adequate staff training. 11
Before embarking on formally training staff to collect data, each entity needs to assess its data collection
practices and delineate what is being done currently and what will change. The changes need to be clearly communicated during staff training sessions. Despite differences among health care settings, standardizing specific
10
11
American Recovery and Reinvestment Act of 2009, Public Law 111-5 § 3002(b)(2)(B)(vii), 111th Cong., 1st sess. (February 17, 2009).
Personal communication, O. Carter-Pokras, University of Maryland School of Public Health, April 13, 2009.
1
RACE, ETHNICITY, AND LANGUAGE DATA
BOX 5-5
Standardizing Direct Data Collection
• W
ho: information should always be asked of patients or their caretakers and should never be
gathered by observation alone
• When: information should be collected upon admission or patient registration to ensure that appropriate fields are completed when the patient begins treatment, or for plans, when the individual
enrolls (as permitted by state law)
• What:
o Questions about the OMB race and Hispanic ethnicity categories (one- or two-question format
permitted)
o A question about granular ethnicity with locally relevant response categories selected from a
national standard set
o A question to determine English-language proficiency
o A question about language preference needed for effective communication
• Where: data should be stored in a standard format for easy linking to clinical data
• How: patient concerns should be addressed when the information is being obtained, and staff
should receive ongoing training and evaluation
components of data collection within each organization will facilitate staff training processes. Suggestions to this
end are presented in Box 5-5.
Educating Patients and Communities
Baker and colleagues (2005, 2007) found that while most patients believe health care providers should collect
data on race and ethnicity, minority patients may feel uncomfortable with providing this information. Informing
patients that the data are being collected to monitor and improve the quality of care for everyone helps improve
patients’ comfort level. Thus, in health and health care settings, providing a rationale for asking the questions may
make patients and enrollees feel better about responding. The HRET Toolkit provides suggested wording for this
purpose: “We want to make sure that all our patients get the best care possible. We would like you to tell us your
racial/ethnic background so that we can review the treatment that all patients receive and make sure that everyone
gets the highest quality of care.”
When Contra Costa Health Plan began requesting these data from its members, call center staff read a script
developed from the HRET Toolkit before asking about race and ethnicity. Employees found the script timeconsuming to read in the call center environment, resulting in a reevaluation of its collection methods. The rationale
for the data collection is no longer automatically provided in advance; instead, the data are requested when other
information, such as the member’s address and phone number, are being verified.12 Contra Costa’s experience
highlights the need for adapting best practices to what will be most successful in specific circumstances.
Informing and engaging communities may facilitate data collection efforts. For example, community-based
organizations can be informed of the purposes of the data collection and be used as avenues for passing this
information on to constituencies. Within health care settings, information pamphlets, cafeteria table tent cards,
and posters in languages other than English (Hasnain-Wynia et al., 2007) may help patients and their families
understand what is being asked and why.
12
Personal communication, O. Tiutin, Contra Costa Health Plan, July 10, 2009.
IMPROVING DATA COLLECTION ACROSS THE HEALTH CARE SYSTEM
19
USING PROBABILISTIC INDIRECT ESTIMATION OF RACE AND ETHNICITY DATA
When direct collection of race and ethnicity data is incomplete or impossible, it may be useful to infer some
information about a person’s race or ethnicity from other information that is already available or can readily be
obtained for use in analyses of associations between race and ethnicity and outcomes of interest. Such inferences
can be useful when the limits of direct collection of racial and ethnic data have been reached for a given data
system or as an interim measure while data are being collected from individuals. This use of predictive variables
rather than direct collection of information from patients is termed “indirect estimation.” A number of indirect
estimation approaches can be applied to race and ethnicity data, including linking area-level population data from
the Census Bureau to quality data, using names for indirect estimation, and attributing Bayesian probabilities to
indirectly estimated data.
Linking Area-Level Data to Quality Data
One of the simplest indirect approaches is to use area-level population data derived from the Census. Such
data include the racial and ethnic composition of an area (percent in each race and ethnicity category), as well as
socioeconomic measures such as median income, percent in poverty, distribution by years of educational attainment,
percent reporting limited English proficiency, or an overall indicator of socioeconomic status combining several
such measures. Until 2000, these measures were collected from the long-form sample of the decennial Census and
released in tabulations by a range of Census geographical units from the state to the block group. More recently,
collection of these data has shifted to the American Community Survey, a continuous data collection process
from which tabulations are released for 1-, 3-, or 5-year accumulations depending on the level and population of
the geographic unit. The numerous applications of the methodology reflect the ease with which addresses can be
linked to area data, either by “geocoding” addresses to small areas or by using tabulations for zip code tabulation
areas, which approximate postal zip codes.
Analyses with area variables may proceed either by categorizing variables into ranges or by regressing on
the numerical value of the variable. For example, researchers might block groups into categories with zero to 10
percent, 10 to 20 percent, and 20 to 30 percent Hispanic residents. If the researchers then found that the block
groups with higher concentrations of Hispanic residents also had higher rates of diabetes, a higher rate of diabetes
among Hispanics than non-Hispanics might be inferred. Additionally, it is possible to regress the diabetes rate on
the percent Hispanic, finding that the diabetes rate increases (along the fitted regression line) by a certain amount
(e.g., 0.15 percentage points) for each 1 percentage point increase in the percent Hispanic. Thus, it might be possible
to conclude that 0.15 or 15 percentage points is the difference in rates for Hispanics and non-Hispanics. There is
a substantial literature on the use of area measures in health research (Krieger et al., 2003a, 2003b, 2003c, 2005),
comparing the effects of using data aggregated to various geographic levels; generally, the conclusion has been
that effects are detected more sensitively when data are linked to smaller (more detailed) geographic units.
When an outcome is regressed on an area variable defined as the percentage in a particular group (such as
the percentage African American or the percentage in poverty), the regression coefficient can be interpreted as
the effect of being a member of that group. This analysis, sometimes known as “ecological inference,” is technically correct only under the assumption that the outcome is related to individual effects (membership in the
group), but not to the degree of concentration of the group in the area. For example, diabetes rates are higher for
African Americans than for Whites; if rates for each group were uniform across the country (and assuming for
presentation that there are only these two groups), the average rate in each area would be directly related to the
percent African American. In fact, the rate would be a weighted average of the rates for the two groups, where the
weights are the percentages of each group in the area; in other words, the effects would be purely compositional.
The assumption of uniformity could be violated, however, if African Americans in highly segregated areas have
different socioeconomic and health characteristics (e.g., probability of having diabetes) than their counterparts
living in integrated areas.
Because of concerns about such possible “noncompositional” effects, the literature on the use of area effects
often regards effects of area-level race and ethnicity measures as representing a combination of compositional
140
RACE, ETHNICITY, AND LANGUAGE DATA
effects (the average of effects of individual-level characteristics across the population of the area) and contextual
effects (the effects of being in an area of a certain kind). By this logic, the area-level variables might be relevant
to include in models even when individual-level measures are available and included. When individual-level
variables are not available, the area composition variables can allow only approximate estimation of disparities at
the individual level. However, results from area-level analyses can still be very useful in revealing disparities. For
example, if residents of areas with high proportions of African American residents are shown to have higher rates
of a health or health care problem than those in areas with few African American residents, this is good evidence
for disparities even if a precise estimate of average African American–White differences cannot be obtained.
The accuracy of this method is directly dependent on the proportion of the targeted group in the particular
area. Community rates of racial and ethnic segregation will affect the method’s accuracy in catchment areas. This
method also generally works better for African Americans than for other racial and ethnic groups because their
rates of segregation, particularly in Eastern cities, are much higher than those of other groups. Also, rates may
differ considerably depending on the unit of analysis (e.g., zip code, Census tract, Census block). Smaller units
may be more useful, particularly for groups with lower numbers in the community. Zip code data are readily
available, while analysis using Census blocks or block groups requires the additional step of geocoding addresses
to the relevant unit of analysis.
Data collection efforts that include an individual’s address can be useful for indirectly estimating race and
ethnicity. EHR standards and other administrative databases (e.g., registration and billing) include demographic
data elements such as address and date of birth (Certification Commission for Healthcare Information Technology,
2007). Appropriate handling of these data is important because addresses are highly identifiable. HIPAA Privacy
Rule requirements for deidentifying data protect individuals but may, in some cases, raise barriers to exchanging
address data, as is sometimes necessary for indirect estimation processes.
Using Names for Indirect Estimation
Names have been used as indicators of racial and ethnic identity. For each name there is a corresponding racial
and ethnic composition based on self-identification of people with that name in Census data. These data have
been summarized in lists of common Spanish and Asian surnames and more specific lists of surnames associated
with different Asian-origin ethnicities (Elliott et al., 2008; Fiscella and Fremont, 2006; Sweeney et al., 2007; Wei
et al., 2006), but the exact race and ethnicity of those with each name are more informative. For example, a large
proportion of those with the surname “Rodriguez” are Hispanic, while those with the surname “Lee” might include
substantial proportions of Asian Americans, African Americans, and Whites. While surnames are not useful for
identifying groups without distinctive ethnicity-related surnames, identification of African Americans through
distinct given names has shown some success (Ting, 2009).
Attributing Bayesian Probabilities to Indirectly Estimated Data
The distributions of race and ethnicity in an area or for a particular name can be interpreted as probabilities
that a randomly chosen person from the class (of residents of the area or persons with that name) is a member of
each race or ethnicity. For example, if all one knows about an individual is that he lives in a block group in which
37 percent of the residents are African American, one might say there is a 37 percent probability that he is African
American. Similar statements can be made using names. Note that the information about race and ethnicity obtained
in this way is probabilistic rather than deterministic: even if someone’s block group is 90 percent Hispanic, one
can say only that there is a 90 percent chance he is Hispanic, not that he is definitely Hispanic.
An important benefit of this formulation is that probabilities from different pieces of information can be
combined formally to generate a summary combined probability. Technically, under the assumption that the two
pieces of information—block group composition and name—are independent given the person’s race, they can be
combined using Bayes’s theorem to produce a posterior probability for each race and ethnicity that summarizes
the two pieces of information (Elliott et al., 2008; Fiscella and Fremont, 2006; Fremont et al., 2005). In particular,
the racial and ethnic proportions in a small area can be regarded as prior probabilities that an individual from
IMPROVING DATA COLLECTION ACROSS THE HEALTH CARE SYSTEM
141
that area would be from each race and ethnicity group, while the probabilities that a person from each race and
ethnicity would have the individual’s name (e.g., the probability that a Hispanic would have the name “Gomez,”
the probability that a non-Hispanic White would have the name “Gomez”) constitute the likelihood for each race
and ethnicity. For example, a person named “Gomez” in a block group that is 50 percent Hispanic is more likely
to be Hispanic than either a person named “Smith” in a block group that is 50 percent Hispanic or a person named
“Gomez” in a block group that is 20 percent Hispanic.
The assumptions for this application of Bayes’s theorem are not likely to hold exactly; for example, a Hispanic in an area of Hispanic concentration (perhaps with many recent immigrants) might be more likely to have
the name “Gomez” and less likely to have the name “Smith” than a Hispanic in an integrated area. Nonetheless,
this probability calculation provides a principled way of combining multiple indicators of race and ethnicity. This
procedure has been implemented with health plan datasets (Elliott et al., 2008). A similar procedure, but using ad
hoc rules based on lists and cutoffs rather than formal probability calculations, was used to create a file of imputed
racial and ethnic identifications for Medicare beneficiaries (Bonito et al., 2008).
Combining evidence about individuals in this way will tend to improve the accuracy of predictions in the sense
that individuals’ probabilities of belonging to each race and ethnicity will become more differentiated and therefore
more informative. For this reason, a combined approach is preferable when possible. However, the fact that these
are still only probabilities and not certainties has several implications for the use of indirectly estimated race and
ethnicity. First, collapsing probabilities to a single imputed racial and ethnic classification for each individual loses
useful information and can be misleading. For example, suppose each person is assigned the race and ethnicity
classification with the highest probability. Then in a population of individuals for whom the probability of being
non-Hispanic White is 60 percent and the probability of being African American is 40 percent, all of those individuals would be classified as non-Hispanic White, although the proper inference would be that the split is 60/40
percent. Another classification approach would be to impute randomly from the given probabilities (in the previous example to divide the population randomly in a 60/40 ratio). While this approach would yield a more realistic
distribution of race and ethnicity for the group, the random imputations would have no relationship to any actual
differences between Whites and African Americans, and therefore an analysis using this approach would, perhaps
falsely, lead to the conclusion that there are no health differences between the two groups. For these reasons, it is
essential to record probabilities from indirect estimation rather than a single assignment.
On the other hand, probabilities can be used analytically to draw useful conclusions about disparities. As
described above, regressing on probabilities can generate estimates of racial and ethnic differences, although these
estimates are valid only under the assumption that variations in outcomes of interest within each racial and ethnic
group are uncorrelated with the calculated probabilities. In several illustrative analyses, disparities identified with
this methodology closely matched those identified using individual race and ethnicity variables (Elliott, 2009).
For example, for estimates of disparities for Black versus White, Hispanic versus White, and Asian versus White,
the sign of the coefficient based on indirectly estimated data matched that based on self-reported data 38 out of
39 times, with a significance level of 0.05 (Elliott, 2009).
Using Indirectly Collected Data
Indirect race and ethnicity identifications can be used in quality improvement efforts when direct identifications are unavailable (see Box 5-6). In addition to aggregate analyses such as those described above, they can be
used in examining characteristics of patients who suffered specific health problems or health care deficits. For
example, mapping of the residences of such patients together with indirectly derived race and ethnicity could illuminate patterns of problems that could be addressed through targeted interventions. To plan services and conduct
community-based targeted interventions, NQF recommends using proxy data from geocoding, surname analysis,
and Bayesian estimation. NQF’s recommendation also states that indirectly estimated data should not be used to
target interventions for individual patients (NQF, 2008).
Indirect methods are best applied to population-based assessments of quality of care and can be used to identify
“hotspots” where individuals who are at risk of or are receiving poor care are clustered. Knowing that a provider
group’s service area overlaps with a hotspot can be instructive, allowing the group to improve service delivery to
142
RACE, ETHNICITY, AND LANGUAGE DATA
BOX 5-6
The Use of Indirectly Collected Data by a Health Plan: Wellpoint, Inc.
Wellpoint, the largest member of the BlueCross BlueShield Association, recognizes that while it is
preferable to collect race, ethnicity, and language data via self-report, plans often encounter data collection
plateaus due to the costs of adding data collection and storage fields to HIT systems, the costs of multiple
attempts at collection, inaccurate data from external entities, and internal legality concerns. Wellpoint
partnered with the RAND Corporation to develop a low-cost, easy-to-implement alternative to collecting
primary source data. The initiative resulted in an analytic model for indirectly estimating race and ethnicity
using a combination of geocoding, surname analysis, a proprietary African American first-name list, and
logistic regression.
The indirectly estimated data can be used to examine differences among groups in various health
indicators by linking proxy race and ethnicity data with member claims data and quality process measures.
The data are also used to develop maps used for business decisions regarding the design of quality improvement programs and community collaboration projects. In 2008, Wellpoint began using the proxy data
to channel culturally and linguistically appropriate screening reminder messages to members. The indirect
methodology allows analysis of members who do not respond to requests for self-reported data, decreases
the selection bias among self-reported respondents, and makes plan, regional, and practice-level analysis
more accurate.
SOURCES: NCQA, 2008; Ting, 2009.
specific communities. While targeting entire hotspots may be relatively ineffective for plans that do not dominate
the market, community interventions in which plans pool efforts may be cost-effective (Fremont, 2009).
The use of indirectly estimated data at the individual level is limited by the probabilistic nature of the data
and the consequent possibility of error. The subcommittee has considered a number of potential uses of indirect
estimates, ranging from those that posed very little risk of harm to the patient to those that posed unacceptable
risk. At one end of this spectrum, using indirect estimation to target mail distribution of health information tailored
to the needs, language, or cultural style of a particular group would at worst lead to some misdirected and wasted
mailing. At the other end, erroneous assumptions about race and ethnicity in personal contacts with patients could
lead to offense and mistrust. In particular, the subcommittee finds that the clinical and interpersonal risks of including indirectly estimated identifications in individuals’ medical records far outweigh any potential benefits given
the danger of misreading the identification as certain, the likely interpersonal costs of such misreading, and the
possibility of clinical consequences from relying on erroneous identification. Instead, if indirect estimation of race
and ethnicity is to be used, the estimated probabilities should be stored in a system that is distinct from medical
records but can be merged with medical record data to create analytic files for identification of disparities.
Recommendation 5-1: Where directly collected race and ethnicity data are not available, entities
should use indirect estimation to aid in the analysis of racial and ethnic disparities and in the de-
IMPROVING DATA COLLECTION ACROSS THE HEALTH CARE SYSTEM
14
velopment of targeted quality improvement strategies, recognizing the probabilistic and fallible
nature of such indirectly estimated identifications.
• Race and ethnicity identifications based on indirect estimation should be distinguished from
self-reports in data systems, and if feasible, should be accompanied by probabilities.
• Interventions and communications in which race and ethnicity identifications are based on
indirect estimation may be better suited to population-level interventions and communications and less well suited to use in individual-level interactions.
• An indirectly estimated probability of an individual’s race and ethnicity should never be
placed in a medical record or used in clinical decision making.
• Analyses using indirectly estimated race and ethnicity should employ statistically valid
methods that deal with probabilistic identifications.
SUMMARY
There are both opportunities for and challenges to the collection of data on race, ethnicity, and language need
at all organizational levels in the U.S. health care system. The infrastructure of the current health care system
does not facilitate the data exchanges necessary to capture race, ethnicity, and language data for all populations.
No one locus of data collection has a clearly superior balance of opportunities and challenges and the ability to
serve as the primary data collection point for a large fraction of the U.S. population. Until such a clearly preferred
locus of data collection emerges, it will be necessary for existing entities to collect these data using standardized
categories and work to develop methods and policies for sharing the data so as to reduce the duplication of effort
that occurs when all entities attempt to collect the data at most or all encounters.
All entities should collect these data, knowing their limitations and constraints, and implement steps to address
these limitations and constraints. These steps can improve data collection processes by addressing HIT constraints
and minimizing respondent and organizational resistance. To enhance legacy HIT systems, standardized communication protocols are needed to permit interoperability, and some systems will require upgrading. Training staff
and educating communities about the importance of collecting race, ethnicity, and language data for improving
health and the quality of health care are also necessary.
Direct collection of race and ethnicity data is preferable to observation and to indirect methods. When
direct collection is impossible or has not been completed, however, indirect approaches can be employed. These
approaches include linking area-level population data from the Census to quality data, using data like names to
infer race and ethnicity, and attributing Bayesian probabilities to indirectly estimated data. At the same time, indirect estimates are always inferior to data obtained directly from individuals, and data based on indirect estimation
should never be included in an individual’s medical record.
REFERENCES
AHA (American Hospital Association). 2008. Annual survey of hospitals and health systems. Chicago, IL: American Hospital Association.
AHIP (America’s Health Insurance Plans). 2009. A legal perspective for health insurance plans: Data collection on race, ethnicity, and primary
language. Washington, DC: America’s Health Insurance Plans.
Baker, D. W., K. A. Cameron, J. Feinglass, P. Georgas, S. Foster, D. Pierce, J. A. Thompson, and R. Hasnain-Wynia. 2005. Patients’ attitudes
toward health care providers collecting information about their race and ethnicity. Journal of General Internal Medicine 20(10):895-900.
Baker, D. W., R. Hasnain-Wynia, N. R. Kandula, J. A. Thompson, and E. R. Brown. 2007. Attitudes toward health care providers, collecting
information about patients’ race, ethnicity, and language. Medical Care 45(11):1034-1042.
Barnes, P. M., P. F. Adams, and E. Powell-Griner. 2008. Health characteristics of the Asian adult population: United States, 2004-2006. Hyattsville, MD: National Center for Health Statistics.
Beal, A. C. 2004. Policies to reduce racial and ethnic disparities in child health and health care. Health Affairs 23(5):171-179.
Beal, A. C., M. M. Doty, S. E. Hernandez, K. K. Shea, and K. Davis. 2007. Closing the divide: How medical homes promote equity in health
care: Results from The Commonwealth Fund 2006 Health Quality Survey. New York: The Commonwealth Fund.
Blumenthal, D. 2009. Stimulating the adoption of health information technology. New England Journal of Medicine 360(15):1477-1479.
Bonito, A. J., C. Bann, C. Eicheldinger, and L. Carpenter. 2008. Creation of new race-ethnicity codes and socioeconomic status (SES) indicators
for Medicare beneficiaries. Final report, sub-task 2. Rockville, MD: RTI International.
144
RACE, ETHNICITY, AND LANGUAGE DATA
Buescher, P. A., Z. Gizlice, and K. A. Jones-Vessey. 2005. Discrepancies between published data on racial classification and self-reported race:
Evidence from the 2002 North Carolina live birth records. Public Health Reports 120(4):393-398.
Certification Commission for Healthcare Information Technology. 2007. Certification of ambulatory EHRs. Chicago, IL: Certification Commission for Healthcare Information Technology.
Chin, M. H., A. C. Kirchhoff, A. E. Schlotthauer, J. E. Graber, S. E. Brown, A. Rimington, M. L. Drum, C. T. Schaefer, L. J. Heuer, E. S. Huang,
M. E. Shook, H. Tang, and L. P. Casalino. 2008. Sustaining quality improvement in community health centers: Perceptions of leaders and
staff. Journal of Ambulatory Care Management 31(4):319-329.
Coltin, K. 2009. Implementation challenges for health plan collection of race, ethnicity & language data. Harvard Pilgrim Health Care. Presentation to the IOM Committee on Future Directions for the National Healthcare Quality and Disparities Reports, February 9, 2009.
Washington, DC. PowerPoint presentation.
Craemer, T. 2009 May 25. Can a survey change one’s race? An experiment on context effects and racial self-classification. Paper presented at
the Annual Meeting of the American Association for Public Opinion Association, Fontainebleau Resort, Miami Beach, FL.
De Milto, L. 2009. Bolstering electronic health records at four community health centers in Chicago with race, ethnicity and language data.
Princeton, NJ: Robert Wood Johnson Foundation.
Elliott, M. 2009. Use of indirect measures of race/ethnicity to target disparities. RAND Corporation. Presentation to the IOM Committee
on Future Directions for the National Healthcare Quality and Disparities Reports, March 12, 2009. Newport Beach, CA. PowerPoint
presentation.
Elliott, M. N., A. Fremont, P. A. Morrison, P. Pantoja, and N. Lurie. 2008. A new method for estimating race/ethnicity and associated disparities
where administrative records lack self-reported race/ethnicity. Health Services Research 43(5):1722-1736.
Ezzati-Rice, T. M., and L. R. Curtin. 2001. Population-based surveys and their role in public health. American Journal of Preventive Medicine
20(4):15-16.
Fiscella, K., and A. M. Fremont. 2006. Use of geocoding and surname analysis to estimate race and ethnicity. Health Services Research
41(4p1):1482-1500.
Foley, K. L., J. Manuel, and M. Vitolins. 2005. The utility of self-report in medical outcomes research. Evidence-Based Healthcare and Public
Health 9(3):263-264.
Freeman, G., and M. Lethbridge-Cejku. 2006. Access to health care among Hispanic or Latino women: United States, 2000-2002. Advance
Data (368):1-25.
Fremont, A. 2009. Practical applications of indirect estimates of race/ethnicity & lessons learned. RAND Corporation. Presentation to the
IOM Committee on Future Directions for the National Healthcare Quality and Disparities Reports, March 12, 2009. Newport Beach, CA.
PowerPoint presentation.
Fremont, A. M., A. Bierman, S. L. Wickstrom, C. E. Bird, M. Shah, J. J. Escarce, T. Horstman, and T. Rector. 2005. Use of geocoding in managed care settings to identify quality disparities. Health Affairs 24(2):516-526.
Gallegos, J., E. Mulamula, J. Patnosh, and C. Ulmer. 2008. Serving patients with limited English proficiency: Results of a community health
center survey. Bethesda, MD: National Association of Community Health Centers.
Hahn, R. A., B. I. Truman, and N. D. Barker. 1996. Identifying ancestry: The reliability of ancestral identification in the United States by self,
proxy, interviewer, and funeral director. Epidemiology 7(1):75-80.
Hasnain-Wynia, R. 2007. Collecting race, ethnicity, and primary language data in small physician practices. Chicago, IL: Health Research and
Educational Trust/AHA. PowerPoint presentation.
Hasnain-Wynia, R., D. Pierce, and M. A. Pittman. 2004. Who, when, and how: The current state of race, ethnicity, and primary language data
collection in hospitals. New York: The Commonwealth Fund.
Hasnain-Wynia, R., D. Pierce, A. Haque, C. H. Greising, V. Prince, and J. Reiter. 2007. Health Research and Educational Trust Disparities
Toolkit. www.hretdisparities.org (accessed December 18, 2008).
Hasnain-Wynia, R., J. Yonek, D. Pierce, R. Kang, and C. H. Greising. 2006. Hospital language services for patients with limited English proficiency: Results from a national survey. Chicago, IL: Health Research and Educational Trust/AHA.
Healthcare Financial Management Association. 2007. The emergency department as admission source. Westchester, IL: Healthcare Financial
Management Association.
Higgins, P. C., and E. F. Taylor. 2009. Measuring racial and ethnic disparities in health care: Efforts to improve data collection. Princeton, NJ:
Mathematica Policy Research.
HL7 (Health Level 7). 2009. What is HL? http://www.hl7.org/about/hl7about.htm (accessed May 22, 2009).
HRSA (Health Resources and Services Administration). 2009. The Health Center Program: Program assistance letter 2009-02, Uniform Data
System changes for calendar year 2009. Rockville, MD: U.S. Department of Health and Human Services.
Hurley, R., L. Felland, and J. Lauer. 2007. Issue Brief No. 116: Community health centers tackle rising demands and expectations. Washington,
DC: Center for Studying Health System Change.
Jha, A. K., C. M. DesRoches, E. G. Campbell, K. Donelan, S. R. Rao, T. G. Ferris, A. Shields, S. Rosenbaum, and D. Blumenthal. 2009. Use of
electronic health records in U.S. hospitals. New England Journal of Medicine 360(16):1628-1638.
Kagawa-Singer, M., and N. Pourat. 2000. Asian American and Pacific Islander breast and cervical carcinoma screening rates and Healthy People
2000 objectives. Cancer 89(3):696-705.
Kmetik, K. 2009. American Medical Association. Presentation to the IOM Committee on Future Directions for the National Healthcare Quality
and Disparities Reports, February 10, 2009. Washington, DC. PowerPoint Presentation.
IMPROVING DATA COLLECTION ACROSS THE HEALTH CARE SYSTEM
14
Krieger, N., J. T. Chen, P. D. Waterman, D. H. Rehkopf, and S. V. Subramanian. 2003a. Race/ethnicity, gender, and monitoring socioeconomic
gradients in health: A comparison of area-based socioeconomic measures—the Public Health Disparities Geocoding Project. American
Journal of Public Health 93(10):1655-1671.
———. 2005. Painting a truer picture of US socioeconomic and racial/ethnic health inequalities: The Public Health Disparities Geocoding
Project. American Journal of Public Health 95(2):312-323.
Krieger, N., J. T. Chen, P. D. Waterman, M. J. Soobader, S. V. Subramanian, and R. Carson. 2003b. Choosing area based socioeconomic measures to monitor social inequalities in low birth weight and childhood lead poisoning: The Public Health Disparities Geocoding Project.
Journal of Epidemiology and Community Health 57(3):186-199.
Krieger, N., P. D. Waterman, J. T. Chen, M. J. Soobader, and S. V. Subramanian. 2003c. Monitoring socioeconomic inequalities in sexually
transmitted infections, tuberculosis, and violence: Geocoding and choice of area-based socioeconomic measures—The Public Health
Disparities Geocoding Project (US). Public Health Reports 118(3):240-260.
Lurie, N. 2009. Needed: National standardization of race/ethnicity data to address health disparities. RAND Corporation. Presentation to the
IOM Committee on Future Directions for the National Healthcare Quality and Disparities Reports, February 9, 2009. Washington, DC.
PowerPoint presentation.
Madans, J. H. 2009. Race/ethnic data collection: Population surveys and administrative records. National Center for Health Statistics. Presentation to the IOM Committee on Future Directions for the National Healthcare Quality and Disparities Reports, February 9, 2009.
Washington, DC. PowerPoint presentation.
Maizlish, N., and L. Herrera. 2006. Race/ethnicity in medical charts and administrative databases of patients served by community health centers. Ethnicity and Disease 16:483-487.
Manatt Health Solutions and RSM McGladrey. 2007. Improving commercial reimbursement for community health centers: Case studies and
recommendations for New York. New York: RCHN Community Health Foundation.
Massachusetts Executive Office of Health and Human Services. 2009. FY200 inpatient hospital discharge database documentation manual.
Boston, MA: Division of Health Care Finance and Policy.
Mays, V. M., S. D. Cochran, and N. A. Ponce. 2004. Thinking about race and ethnicity in population-based studies of health. In Race & research,
perspectives on minority participation in health studies. Washington, DC: American Public Health Association.
Mutha, S., R. Do, and N. Solomon. 2008. Incorporating cultural competence into pay-for-performance. Paper presented at Quality Health Care
for Culturally Diverse Populations, September 22, 2008, Minneapolis, MN.
National Association of Community Health Centers. 2006. 2006 Data on Community Health Centers, summary of findings. Bethesda, MD:
National Association of Community Health Centers.
NCHS (National Center for Health Statistics). 2009. Health, United States, 200. Hyattsville, MD: Department of Health and Human Services.
NCQA (National Committee for Quality Assurance). 2006. Innovative practices in multicultural health care. Washington, DC: NCQA.
———. 2008. Innovative practices in multicultural health care. Washington, DC: NCQA.
———. 2009. Supporting small practices: Lessons for health reform. Washington, DC: NCQA.
Nerenz, D. R., and D. Darling. 2004. Addressing racial and ethnic disparities in the context of Medicaid managed care: A six-state demonstration project. Rockville, MD: HRSA.
Nerenz, D. R., C. Currier, and K. Paez, eds. 2004. Collection of data on race/ethnicity by private sector organizations, results of a medical group
survey. In Eliminating disparities: Measurement and data needs, p.249-271. Washington, DC: The National Academies Press.
NQF (National Quality Forum). 2008. National voluntary consensus standards for ambulatory care—measuring healthcare disparities. Washington, DC: National Quality Forum.
NRC (National Research Council). 2009. Principles and practices for a federal statistical agency: Fourth edition. Edited by C. F. Citro, M. E.
Martin and M. L. Straf. Washington, DC: The National Academies Press.
OMB (Office of Management and Budget). 1997. Recommendations from the Interagency Committee for the Review of the Racial and Ethnic
Standards to the Office of Management and Budget concerning changes to the standards for the classification of federal data on race and
ethnicity. Federal Register (3110-01):36873-36946.
Palaniappan, L. P., E. C. Wong, J. J. Shin, M. R. Moreno, and R. Otero-Sabogal. 2009. Collecting patient race/ethnicity and primary language
data in ambulatory care settings: A case study in methodology. Health Services Research. http://www3.interscience.wiley.com/cgi-bin/
fulltext/122465240/PDFSTART (accessed September 3, 2009).
Ponce, N. A., N. Chawla, S. H. Babey, M. S. Gatchell, D. A. Etzioni, B. A. Spencer, E. R. Brown, and N. Breen. 2006. Is there a language divide
in Pap test use? Medical Care 44(11):998-1004.
Rachman, F. 2007. Chicago Alliance of Community Health Centers pioneers EHR implementation with AHRQ support Rockville, MD:
AHRQ.
Regenstein, M., and D. Sickler. 2006. Race, ethnicity, and language of patients: Hospital practices regarding collection of information to address disparities in health care. Princeton, NJ: Robert Wood Johnson Foundation.
Reynolds, P. P. 1997. The federal government’s use of Title VI and Medicare to racially integrate hospitals in the United States, 1963 through
1967. American Journal of Public Health 87(11):1850-1858.
Romano, P. S., J. J. Geppert, S. Davies, M. R. Miller, A. Elixhauser, and K. M. McDonald. 2003. A national profile of patient safety in U.S.
Hospitals. Health Affairs 22(2):154-166.
Rosenthal, M. B., B. E. Landon, S. L. Normand, T. S. Ahmad, and A. M. Epstein. 2009. Engagement of health plans and employers in addressing
racial and ethnic disparities in health care. Medical Care Research and Review 66(2):219-231.
146
RACE, ETHNICITY, AND LANGUAGE DATA
Shields, A. E., P. Shin, M. G. Leu, D. E. Levy, R. M. Betancourt, D. Hawkins, and M. Proser. 2007. Adoption of health information technology
in community health centers: Results of a national survey. Health Affairs 26(5):1373-1383.
Siegel, B., J. Bretsch, K. Jones, V. Sears, L. Vaquerano, and M. J. Wilson. 2008. Expecting Success: Excellence in cardiac care. Results from
Robert Wood Johnson Foundation Quality Improvement Collaborative. Princeton, NJ: Robert Wood Johnson Foundation.
Siegel, B., M. Regenstein, and K. Jones. 2007. Enhancing public hospitals’ reporting of data on racial and ethnic disparities in care. New York:
The Commonwealth Fund.
Sweeney, C., S. L. Edwards, K. B. Baumgartner, J. S. Herrick, L. E. Palmer, M. A. Murtaugh, A. Stroup, and M. L. Slattery. 2007. Recruiting
Hispanic women for a population-based study: Validity of surname search and characteristics of nonparticipants. American Journal of
Epidemiology 166(10):1210-1219.
Taylor, J. 2004. The fundamentals of community health centers. Washington, DC: The George Washington University National Health Policy
Forum.
Ting, G. 2009. Applications of indirect estimation of race/ethnicity data in health plan activities. Wellpoint. Presentation to the IOM Committee on Future Directions for the National Healthcare Quality and Disparities Reports, March 12, 2009. Newport Beach, CA. PowerPoint
presentation.
U.S. Census Bureau. 2000. Census 2000 summary file 1: 100-percent data. Washington, DC: U.S. Census Bureau.
Wei, I. I., B. A. Virnig, D. A. John, and R. O. Morgan. 2006. Using a Spanish surname match to improve identification of Hispanic women in
Medicare administrative data. Health Services Research 41(4):1469-1481.
Weinick, R. M., J. M. Caglia, E. Friedman, and K. Flaherty. 2007. Measuring racial and ethnic health care disparities in Massachusetts. Health
Affairs 26(5):1293-1302.
Weinick, R. M., K. Flaherty, and S. J. Bristol. 2008. Creating equity reports: A guide for hospitals. Boston, MA: The Disparities Solution Center
at Massachusetts General Hospital.
West, C. N., A. M. Geiger, S. M. Greene, E. L. Harris, I. L. Liu, M. B. Barton, J. G. Elmore, S. Rolnick, L. Nekhlyudov, A. Altschuler, L. J.
Herrinton, S. W. Fletcher, and K. M. Emmons. 2005. Race and ethnicity: Comparing medical records to self-reports. Journal of the National Cancer Institute. Monographs.(35):72-74.
Williams, D. R. 1998. The quality of racial data. Washington, DC: U.S. Department of Health and Human Services.
Zandieh, S. O., K. Yoon-Flannery, G. J. Kuperman, D. J. Langsam, D. Hyman, and R. Kaushal. 2008. Challenges to EHR implementation in
electronic- versus paper-based office practices. Journal of General Internal Medicine 23(6):755-761.
6
Implementation
The subcommittee has proposed a standardized framework for the collection of race, ethnicity, and language data for use in efforts to improve the quality of health care. This framework combines the Office
of Management and Budget (OMB) race and Hispanic ethnicity categories with categories for granular
ethnicity and language need selected at the local level from national standard sets. Widespread adoption
of this framework would ensure consistent categories for comparative analysis and facilitate data sharing
across organizations and geographic areas. The U.S. Department of Health and Human Services (HHS) is
a prime locus of the subcommittee’s recommendations for implementation of these improvements because
of its focus on resolving disparities in health and health care and its history of promoting the collection of
race, ethnicity, and language data to ensure compliance with applicable statutes and regulations. Other
federal agencies that deliver health care, states, accreditation and standards-setting organizations, and
professional medical groups all have roles to plan in ensuring adoption and utilization.
The race and Hispanic ethnicity categories included in the Office of Management and Budget (OMB) 1977
Directive and its subsequent 1997 revisions stemmed primarily from a need to monitor civil rights, voting access, and
changing population dynamics (OMB, 1997, 1999), and not from the perspective of health care quality improvement.
The subcommittee’s task is to delineate standardized categories for the collection of race, ethnicity, and language
data to serve the latter purpose. Standardization of any demographic variable or quality indicator helps ensure more
comparable and reliable data for analytic comparisons and for sharing across organizational boundaries. Additionally, when there is communication across information systems and consistency in defined categories, once a person
has provided his/her race, ethnicity, and language data, these data would not have to be elicited repeatedly during
each health-related encounter, reducing the collection burden on both staff and individual patients. Recognizing the
need for more detailed data on race, ethnicity, and language to support improvements in health and the quality of
health care, the subcommittee recommends combining the use of granular ethnicity categories with the broad OMB
categories, as well as an assessment of a patient’s language need (whether a person’s spoken English proficiency
is less than “very well,” and what is his/her preferred spoken language for effective communication during healthrelated encounters). Quality measurement and interventions will be enhanced by having these data at the individual
patient level (Nerenz and Darling, 2004).
In this chapter, the subcommittee offers recommendations for implementing standardization of race, ethnicity,
14
14
RACE, ETHNICITY, AND LANGUAGE DATA
and language need so that these data will be available to inform health care quality improvement endeavors. In
accordance with the subcommittee’s statement of task, the recommendations offered in Chapters 3 through 5 for
gathering these data are intended “for those entities wishing to assess and report on quality of care across these
categories.” The subcommittee’s recommendations, however, will likely have greater influence if they are adopted
as HHS standards, required in federally funded programs, and incorporated into industry standards for electronic
health record (EHR) systems and other forms of health information technology (HIT). Additionally, states,
standards-setting organizations (e.g., the Joint Commission and the National Committee for Quality Assurance
[NCQA]), and professional medical bodies have a role to play in fostering the adoption and use of standardized
race, ethnicity, and language data for quality improvement purposes.
HHS ACTION
HHS is a prime locus of the subcommittee’s recommendations for standardization and implementation
because of its focus on health care quality and the elimination of disparities in health and health care in policy
and through its funded programs, as well as its history in promoting the collection of race, ethnicity, and language
data to ensure compliance with applicable statutes and regulations (AHRQ, 2008a, 2008b; HHS, 2000, 2003,
2007, 2009e). Additionally, HHS is responsible for implementation of health information technology provisions
of the American Recovery and Reinvestment Act of 2009 (ARRA) (HHS, 2009d). Although broad application of
the EHR1 will take a number of years (Blumenthal, 2009), the need for race, ethnicity, and language data is now,
so efforts to identify and address health care disparities can proceed, and thereby targeted actions can be taken to
raise the overall quality of care in the nation. The EHR is a tool with the potential to reduce repetitive collection
and to facilitate the linkage of demographics to some quality measures. The data collection issues for other current
HIT systems do not differ significantly from those involved in future EHR applications, so providers should begin
to put in place now the processes for the capture and sharing of race, ethnicity, and language data.
Framework for the Collection of Race, Ethnicity, and Language Variables
The framework for the collection of data on race, Hispanic ethnicity, granular ethnicity, and language variables proposed by the subcommittee and detailed in Chapters 3 through 5 is summarized in Figure 6-1. Templates
for national lists of granular ethnicity and language categories are provided in Appendixes E and I, respectively.
These templates can serve as building blocks upon which HHS can develop and maintain comprehensive national
standard lists of granular ethnicities and languages based on the experiences of participants in health care delivery
and quality improvement. The subcommittee does not specify a preset number of granular ethnicities or languages
that all entities must collect; instead, in the previous chapters, it affirms the importance of selecting locally relevant categories from these lists, with an opportunity for self-identification through an open-ended “Other, please
specify: __” response option.
Entities may also want to design their information system to have a way to track whether a person has
“declined” to provide an answer, or the ethnicity is “unknown” (e.g., in the case of an adopted child) or “unavailable” (e.g., no direct contact has occurred to elicit information); these are not response categories for patients, but
to be utilized for tracking. Additionally, some information systems and EHR systems have the capability to record
whether information is directly “self-reported” by patients—the preferred approach—or is “observer-reported”
(e.g., as is necessary when a person arrives unconscious in an emergency room). 2 It would be most useful if these
terms were also standardized across collection systems.
Standard lists of categories of granular ethnicity and languages will need to be formalized from the category
templates offered by the subcommittee for race and ethnicity (Appendix E) and for languages (Appendix I). As
1
In this document, EHR means a patient record owned and maintained by a provider entity; a personal health record is a medical or health
record owned and maintained by a patient him- or herself. The Office of the National Coordinator’s definition is included in the following
section on Electronic Health Records.
2 Personal communication, S. Ganesan, Centers for Disease Control and Prevention, June 3, 2009.
149
Race and Ethnicity
IMPLEMENTATION
OMB Hispanic
Ethnicitya
OMB Race
(Select one or more)
• Hispanic or Latino
• Not Hispanic or Latino
• Black or African
American
• White
• Asian
• American Indian or
Alaska Native
• Native Hawaiian or
Other Pacific Islander
• Some other raceb
Language Need
Spoken English Language
Proficiencyd
•
•
•
•
Very well
Well
Not well
Not at all
(Limited English proficiency is
defined as “less than very well”)
Granular Ethnicity
• Locally relevant
choices from a
national standard list
of approximately 540
categories with
CDC/HL7 codesc
• “Other, please
specify:___” response
option
• Rollup to the OMB
categories
Spoken Language Preferred
for Health Care
• Locally relevant choices from a
national standard list of
approximately 600 categories
with coding to be determined
• “Other, please specify:___”
response option
• Inclusion of sign language in
spoken language need list and
Braille when written language is
elicited
FIGURE 6-1 Recommended variables for standardized collection of race, ethnicity, and language need.
NOTE: Additional categories for HIT tracking might include whether respondents have not yet responded (unavailable), refuse
to answer (declined), or do not know (unknown), as well as whether responses are self-reported or observer-reported.
a The preferred order of questioning is Hispanic ethnicity first, followed by race, as OMB recommends, and then granular
ethnicity.
b The U.S. Census Bureau received OMB permission to add “Some other race” to the standard OMB categories in Census
2000 and subsequent Census collections.
c Additional codes will be needed for categories added to the CDC/HL7 list.
d Need is determined on the basis of two questions, with asking about proficiency first. Limited English proficiency is
defined for health care purposes as speaking English less than very well.
SOURCES: CDC, 2000; Office of Management and Budget, 1997b; Shin and Bruno, 2003; U.S. Census Bureau, 2002.
10
RACE, ETHNICITY, AND LANGUAGE DATA
noted in Chapter 3, within HHS, for example, there are different category sets in use: the Public Health Information Network (PHIN) uses the Centers for Disease Control and Prevention (CDC)/Health Level 7 (HL7) Race and
Ethnicity Code Set 1.0 (CDC, 2009), whereas the Surveillance, Epidemiology and End Results (SEER) Program
uses its own Coding and Staging Manual that does not always correspond with the CDC/HL7 Code Set (Johnson
and Adamo, 2008). Likewise, states such as Massachusetts and Wisconsin have developed expanded sets of ethnicity categories and different rollup schemes for aggregation and reporting (Taylor-Clark et al., 2009; Wisconsin
Cancer Reporting System, 2008). Some health plans, including Kaiser Permanente and Contra Costa Health Plan,
also have their own granular ethnicity, spoken language, and written language categories (see Appendixes G and
H, respectively). However, none of the current sets alone provides a complete set for the nation as a whole. Additionally, the subcommittee focuses its attention on a rollup scheme from granular ethnicities to the OMB race
and Hispanic ethnicity; the subcommittee chose not to define mid-level aggregations between granular ethnicity
and the OMB level, but HHS may wish to consider such mid-level aggregations of ethnicity. The Massachusetts
Superset, for example, roles granular ethnicities to larger groupings of ethnicities.
HHS should develop national standard sets of granular ethnicity and language categories with a responsive
updating process and associated coding, so that each state or entity would be relieved of having to develop its
own category sets and coding schemes. Data would then have a greater likelihood of being compatible across
entities. Although HHS may likely build on the CDC/HL7 Code Set for race and ethnicity, the national set’s use
extends to emerging requirements for EHRs and other applications beyond the CDC PHIN. Thus, the subcommittee believes that development of the granular ethnicity category set and associated codes may need to be elevated
to a more cross-cutting entity, such as the Office of the National Coordinator for Health Information Technology
(ONC) or the Office of the Assistant Secretary for Planning and Evaluation (ASPE). The subcommittee does not
specify the location of this activity, but leaves it to the discretion of the Secretary. The CDC/HL7 Code Set does
not include languages.
Coding for Interoperability
HHS will need to work with HL7, a clinical and administrative data standards-setting organization for EHRs
(HL7, 2009), to update the five-digit unique numerical codes in the existing CDC/HL7 Code Set (CDC, 2000). 3
Additionally, interoperability standards may have implications for the number of fields available in EHRs to
accommodate multiple questions on ethnicity and language variables as recommended in the subcommittee’s
framework, as well as other details analysts may wish to have, such as whether a response is self-reported by a
patient, observer-based, or based on an indirect estimation. For language coding, HHS will have to develop or
adopt a set of unique codes for languages analogous to the CDC/HL7 codes for race and ethnicity (CDC, 2000).
While the Census Bureau and the maintenance agencies and registration authorities for the International Organization for Standardization (ISO)4 each produce language lists that contain most of the same categories, they
have distinctive coding practices. Additionally, as discussed in Chapter 4, the Census Bureau list uses the same
code for multiple related languages, while the ISO list has unique codes for each language (see Appendix I). To
the extent that patients who are not English proficient need language assistance services in distinct languages in
order to facilitate understanding during patient–provider interactions, a care provider’s ability to track specific
languages would be enhanced by unique coding for distinct languages. HHS will need to consult with these entities to establish unique coding. While the subcommittee has identified approximately 600 languages in use in the
United States, fewer—perhaps 300—will be encountered in a health care context.
3
In addition to the numerical codes, the CDC/HL7 Code Set includes an alphanumeric hierarchical code that places each category in a
hierarchical position related to the OMB categories of race and Hispanic ethnicity.
4 The Library of Congress is the registration authority for the ISO-639-2 codes, while SIL is the registration authority for the ISO-639-3
codes.
11
IMPLEMENTATION
Regular Updating
A process for input on categories from the public and federally funded direct health care delivery and insurance programs (e.g., hospitals, clinics, health plans, community health centers, Medicaid programs) would help
ensure that the initial category lists for granular ethnicities and languages are as comprehensive as necessary for
use in the health care environment. Once standard national lists have been established, an ongoing process should
be in place for responding within a reasonable time to questions about how to code specific groups if they are
not on the initial lists. A designated component within HHS should update the category and code lists annually
and be available to answer any questions related to rollup of individual ethnicities to broader OMB categories to
ensure nationwide consistency in practice. It is expected that only a handful of categories will emerge yearly after
comprehensive initial lists of ethnicity and languages are developed, so that updating the list by a few categories
will not be onerous. Annual updating may be necessary in the initial years of implementation, over time it may
become apparent that annual updates are not necessary, and another timeframe could be adopted. A local entity
would not have to ask permission to use a specific category if it is not yet on updated national lists; rather, an
entity could use its own provisional code until one was available at the national level.
Currently, updating of the CDC/HL7 categories and unique codes is tied to redeployment of the Census. 5,6
Every 10 years is not frequent enough to capture new immigrant groups, their languages, or emerging findings
about disparities in health care. The Census Bureau could provide updated ancestry-based ethnicity and language
categories more frequently from the ongoing American Community Survey.7 As health care entities in communities
across the nation collect data and begin to adapt to the use of standard categories and code sets, it is likely that
they will encounter individuals, sooner even than the Census Bureau, who self-identify with a category that is not
already listed. Thus, there will be a need for routine technical guidance, especially during the first few years of
adoption of this report’s recommendations.
Recommendation 6-1a: HHS should develop and make available national standard lists of granular
ethnicity categories and spoken and written languages, with accompanying unique codes and rules
for rollup procedures.
• HHS should adopt a process for routine updating of those lists and procedures as necessary.
Sign languages should be included in national lists of spoken languages and Braille in lists
of written languages.
• HHS should ensure that any national hierarchy used to roll up granular ethnicity categories to the broad OMB race and Hispanic ethnicity categories takes into account responses
that do not correspond to one of the OMB categories.
Electronic Health Records
The American Recovery and Reinvestment Act of 2009 (ARRA) provides opportunities for the inclusion of
race, ethnicity, and language categories in standards for EHRs, thereby influencing which demographic data will
be available for use when quality improvement data are stratified. ARRA authorizes and provides resources for
the Office of the National Coordinator for Health Information Technology (ONC). The Coordinator is to guide
the “development of a nationwide health information technology infrastructure that allows for the electronic use
and exchange of information” for purposes that include quality improvement and reduction of disparities in health
and health care, public health activities, clinical and health services research on quality, guidance for medical decisions at the time and place of care, and prevention and management of chronic diseases. 8 The Coordinator is to
assess how information technology or its absence affects communities with known health disparities and/or a high
5
Personal communication, D. Pollack, Centers for Disease Control and Prevention, May 7, 2009.
Personal communication, S. Ganesan, Centers for Disease Control and Prevention, and B. Hamilton, National Center for Health Statistics,
June 3, 2009.
7 Personal communication, H. Shin, Census Bureau, July 13, 2009.
8 American Recovery and Reinvestment Act of 2009, Public Law 111-5 § 3002(b)(2)(B)(vii), 111th Cong., 1st sess. (February 17, 2009).
6
12
RACE, ETHNICITY, AND LANGUAGE DATA
proportion of individuals at risk of poor health because a lack of insurance and inadequate health care capacity,
thus limiting their access to health care.
Of particular interest to the subcommittee is the provision of ARRA to “ensure the comprehensive collection
of patient demographic data, including, at a minimum, race, ethnicity, primary language, and gender information.”
The act directs the Coordinator to consult with the National Committee on Vital and Health Statistics (NCVHS),
whose mission is to improve information on population health. In the past, NCVHS had concluded that survey
data on race, ethnicity, and language needed to be improved because broad categories such as Asian and Hispanic
mask significant differentials in health status, access to health care, and service utilization (NCVHS, 2005). The
subcommittee agrees with this assessment based on its review of studies in Chapter 2.
One goal stated within ARRA is an EHR for each person in the United States by 2014. An EHR is defined
by ONC as:
A real-time patient health record with access to evidence-based decision support tools that can be used to aid clinicians in decision-making. The EHR can automate and streamline a clinician’s workflow, ensuring that all clinical
information is communicated. It can also prevent delays in response that result in gaps in care. The EHR can also
support the collection of data for uses other than clinical care, such as billing, quality management, outcome reporting, and public health disease surveillance and reporting. (HHS, 2009b)
Proposed regulations on implementation of EHR under ARRA are due by the end of 2009 (HHS, 2009a).
The subcommittee’s recommended variables and categories for collection should be incorporated into each
individual EHR, greatly expanding the availability of such data tied to information on health and health care for
quality assessment purposes. Having the standards adopted by the other components of the health care industry,
including the makers of information technology systems, would help ensure that a sufficient set of data fields are
available to accommodate each element recommended for collection by the subcommittee. ONC is consulting
with standards-setting organizations such as the Health Information Technology Standards Panel (HITSP) and the
Certification Commission for Healthcare Information Technology (CCHIT) on harmonizing industry specifications
and certification criteria.9
Recommendation 6-1b: HHS and the Office of the National Coordinator for Health Information
Technology (ONC) should adopt as standards for including in electronic health records the variables of race, Hispanic ethnicity, granular ethnicity, and language need identified in this report.
Recommendation 6-1c: HHS and ONC should develop standards for electronic data transmission
among health care providers and plans that support data exchange and possible aggregation of
race, Hispanic ethnicity, granular ethnicity, and language need data across entities to minimize
redundancy in data collection.
Incentive Programs
The collection of data on race, ethnicity, and language and use of these data to foster elimination of disparities in quality of care can be an element of either public or private pay-for-performance systems. In general, such
systems reward providers for activities that purchasers deem desirable. A variety of such systems are in place;
some provide incentives for specific structural features (e.g., presence of EHRs), some for a set of process-of-care
activities (e.g., use of appropriate antibiotics for surgical patients), some for improved patient outcomes (e.g., inhospital mortality rates), and some simply for the collection and reporting of quality data (Chien, 2007; Chien et
al., 2007). As these systems continue to evolve over time, they can incorporate the collection and use of data on
race, ethnicity, and language for quality improvement or the achievement of specific goals for reducing disparities
as criteria for incentive payments.
9
D. Blumenthal, ONC, HHS at the IOM Meaningful Use Workshop, July 13, 2009.
1
IMPLEMENTATION
Medicare Physician Quality Reporting Initiative (PQRI)
The Medicare PQRI establishes incentive payments for physicians who report on quality measures for Medicare beneficiaries (CMS, 2009). The Medicare Improvements for Patients and Providers Act of 2008 (MIPPA)
has extended PQRI but not its funding indefinitely,10 increased the measure set to 153 individual measures, and
added a whole array of different reporting options that interface with both registries and EHRs. For 2009, quality
measurement groups include preventive care, diabetes, end stage renal disease, chronic kidney disease, back pain,
coronary artery bypass graft surgery, rheumatoid arthritis, and perioperative care (McGann, 2009).
Monitoring for Unintended Consequences
Performance incentive programs can have positive or negative effects on disparities in health and health care,
but tend not to be designed with reduction of disparities in mind (Chien et al., 2007). Data from the National
Healthcare Disparities and National Healthcare Quality Reports show that even as quality of care improves overall
on specific measures, disparities persist (AHRQ, 2008a, 2008b). Monitoring of program effects along the dimensions of race, ethnicity, and language is desirable to forestall greater widening of gaps in care and to understand
the effects of incentive programs on underresourced primary care safety net providers (Rust and Cooper, 2007;
Williams, 2009).
The subcommittee does not take a stand for or against incentive payments in HIT programs. Rather, the subcommittee is recommending that, when such programs exist, it would be appropriate to include the collection of
race, ethnicity, and language data as one activity for which positive incentives should be offered.
Recommendation 6-1d: The Centers for Medicare and Medicaid Services (CMS), as well as others
sponsoring payment incentive programs, should ensure that the awarding of such incentives takes
into account collection of the recommended data on race, Hispanic ethnicity, granular ethnicity,
and language need so these data can be used to identify and address disparities in care.
Recipients of Federal Funds
Health care entities have indicated that they have been reluctant to make changes to their systems until there
is a standardized categorization approach for race, ethnicity, and language need (Bilheimer and Sisk, 2008; Lurie
et al., 2005, 2008; NCQA, 2009; NRC, 2003; Siegel et al., 2007, 2008). This report addresses that barrier. An
earlier report by the National Research Council, Eliminating Disparities: Measurement and Data Needs, stresses
HHS’s critical role in implementing change.
The federal government’s authority to mandate the nature of data collection is limited, except in large federal
health care delivery systems, through the purchasing power of programs such as Medicare, or for recipients of other
federal funding mechanisms. HHS administers programs supporting the health care delivery system to provide
care to persons at risk of receiving suboptimal care, and these programs present opportunities to influence the
quality of care delivered to millions of Americans. For example, at least a 100 million of the 300 million people
in the country are served by just three programs administered by HHS—Medicare, Medicaid, and community
health centers.11 Ensuring the quality of care to its programmatic participants is an HHS priority, and HHS leadership can make a difference in the adoption of this report’s recommendations as it responds to recent legislation
to ensure the use of race, ethnicity, and language data in assessing quality of care and building a national health
information network (HHS, 2009c).
In earlier chapters, the legal basis for the collection of race, ethnicity, and language data has been established. HHS’s 1997 inclusion policy mandates the collection of race and Hispanic ethnicity data for most of its
10
PQRI incentive payments are only currently authorized through 2010.
44.8 million Medicare beneficiaries in 2008 and 58.7 million Medicaid and CHIP recipients in 2006 with dual enrollment at about 10
million, plus 8.9 million of the 16 million served by health centers are uninsured or have insurance other than Medicare or Medicaid. The U.S.
population, as of July 1, 2008, was 304 million (HRSA, 2008; Kaiser Family Foundation, 2005, 2008, 2009; U.S. Census Bureau, 2008).
11
14
RACE, ETHNICITY, AND LANGUAGE DATA
programmatic applications (HHS Data Council, 1999). The policy encourages the inclusion of more detailed race
and ethnicity categories than the OMB categories provide, but does not specify additional categories for uniform
national use across all HHS programs or define a national standard set from which local programs could select.
However, a need for more detailed population information has been apparent, and different entities within HHS
have developed their own sets (e.g., PHIN and SEER) to foster the collection of comparative categories for use
within their respective programs, but not necessarily across different types of programs. The subcommittee also
believes the OMB race and Hispanic ethnicity categories are necessary but insufficient for identification of health
care needs and elimination of disparities (see Chapter 2). Those categories are broad and may mask differences
in receipt of appropriate care, and their sole use can end up being inefficient when interventions need only be
targeted to a smaller portion of the broad category (for instance, only to populations of Vietnamese ancestry and
not all people of Asian ancestry).
Besides ARRA, a new legislative effort that would require collection of race, ethnicity, and language data for
use in quality reporting is section 185 of MIPPA. Medicare’s plan for implementing this requirement has not yet
been fully realized (McGann, 2009; Reilly, 2009b); in a report to Congress due in January 2010, CMS will address
approaches to fulfilling the legislative mandate. CMS already uses a variety of direct and indirect methods in its
analytic portfolio. Section 187 of MIPPA requires the Office of the Inspector General to examine implementation of
culturally and linguistically appropriate services by Medicare providers and plans. In 2000, HHS released National
Standards on Culturally and Linguistically Appropriate Services (CLAS) in an effort to influence all health care
organizations and individual providers “to make their practices more culturally and linguistically accessible” (Office
of Minority Health, 2007). The CLAS standards note the importance of using demographic data to understand and
plan for the needs of the community served (standard 11); collecting data on the individual patient’s race, ethnicity,
and spoken and written language within both individual health records and organizational management information
systems (standard 10); and using these data to monitor the cultural and linguistic responsiveness of organizations
(standard 9) (Office of Minority Health, 2007). Additionally, section 201(b) of the Children’s Health Insurance
Program Reauthorization Act of 2009 (CHIPRA)12 provides an enhanced federal match for states to be used for
language assistance services (interpretation and translation) for children in both CHIP and Medicaid programs.
Knowledge of the language needs of people with limited English proficiency within the service population, not
just knowledge of languages spoken at home, would be of significant use in understanding state program needs
for language assistance. Previously, only about a dozen states and the District of Columbia participated in the
matching program under Medicaid (Youdelman, 2007).
HHS’s adoption of the subcommittee recommendations for its own programs would promote standardization.
It is understood that changing information systems can be an expensive and time-consuming endeavor, and there
will be a need for technical assistance and the application of additional resources. But the nation is now seeing
the convergence of more nimble technology and efforts to build a stronger information infrastructure, along with
federal economic stimulus funds for HIT.13 Local programs often already collect more detailed data than the OMB
categories in order to serve their populations, but these data are lost in aggregation in response to minimal reporting requirements. For others that do not yet have the capability to collect the specified data directly, methods are
available for indirectly estimating race, ethnicity, and language need and applying these to quality metrics (see
Chapter 5). Thus, efforts to identify differential needs and disparities need not be delayed.
The subcommittee’s task was to recommend standardization of race, ethnicity, and language data for use in
health care quality improvement. Thus, the following recommendation focuses on the HHS programs that deliver
health care services, pay for health care services through insurance mechanisms, or administer surveys that increase
the knowledge base on health care needs and outcomes. The Secretary, however, may find it useful to extend the
standardized approach of this report to other HHS health-related programs, such as public health surveillance
activities or surveys solely about health rather than also including health care issues.
12
13
Children’s Health Insurance Program Reauthorization Act of 2009, Public Law 111-3, 111th Cong., 1st sess. (February 4, 2009).
ARRA authorizes $20 billion for health information technology.
1
IMPLEMENTATION
Recommendation 6-1e: HHS should issue guidance that recipients of HHS funding (e.g., Medicare,
the Children’s Health Insurance Program [CHIP], Medicaid, community health centers) include
data on race, Hispanic ethnicity, granular ethnicity, and language need in individual health records
so these data can be used to stratify quality performance metrics, organize quality improvement
and disparity reduction initiatives, and report on progress.
COORDINATION ACROSS FEDERAL HEALTH CARE DELIVERY SYSTEMS
The Department of Veterans Affairs (VA) medical system is noted for its use of EHRs, and its experience with
quality improvement illustrates the potential of using EHRs throughout the nation’s health care system. Realizing
the full potential involves being able to stratify quality data by race, ethnicity, and language need. Having qualityof-care information from large federal delivery systems such as the Department of Veterans Affairs, the Department of Defense (DOD), and other federally funded programs, such as community health centers, stratified by the
same variables and categories recommended in this report would provide rich sources for comparative analysis.
Precedents for coordinating mechanisms for quality purposes exist. For example, ARRA authorizes a Federal
Coordinating Council for Comparative Effectiveness Research to assist HHS, the VA, DOD, and other federal
agencies in promoting the use of clinical registries, clinical data networks, and other EHRs to produce and obtain
data on health outcomes (Rosenbaum et al., 2009). Such a council might serve as a mechanism for coordinating
the standard collection of race, ethnicity, and language data among these agencies as part of their promotion of
sources for quality data and development of quality metrics.
Recommendation 6-2: HHS, the Department of Veterans Affairs, and the Department of Defense
should coordinate their efforts to ensure that all federally funded health care delivery systems collect the variables of race, Hispanic ethnicity, granular ethnicity, and language need as outlined in
this report, and include these data in the health records of individuals for use in stratifying quality performance metrics, organizing quality improvement and disparity reduction initiatives, and
reporting on progress.
STANDARDS-SETTING AND PROFESSIONAL ORGANIZATIONS
Accreditation organizations and other professional and standards-setting bodies can play a key role in fostering
the collection of race, ethnicity, and language data. Hospitals, health plans, and physicians have reported that a
lack of standardization has been a barrier to collecting these data for quality improvement efforts (Bilheimer and
Sisk, 2008; Lurie et al., 2008; NCQA, 2009; Siegel et al., 2008).
Joint Commission, NCQA, and URAC
Accrediting organizations such as the Joint Commission, National Committee for Quality Assurance (NCQA),
and URAC14 either have developed or are developing CLAS-like standards for their accreditation reviews or for
voluntary self-analysis by organizations. These standards do not always cover all demographic variables (e.g., those
of the Joint Commission cover language and communication needs but not race or ethnicity), or they may not go
beyond requiring the collection of demographic data, leaving the use of those data for performance improvement
optional (The Joint Commission, 2008; NCQA, 2008a; URAC, 2007).
For many years, the Joint Commission’s accreditation standards for hospitals and other accredited entities
(including, for example, those providing ambulatory health care, behavioral health care, home care, and hospice
care) have required that patients’ culture, ethnicity, race, and religious preferences and needs be respected and
that their communication needs be met. To facilitate this patient-centered approach, in 2005 the Joint Commission
proposed a standard that would have required documentation in each patient’s health record of the patient’s race,
14
Formerly known as the Utilization Review Accreditation Commission.
16
RACE, ETHNICITY, AND LANGUAGE DATA
ethnicity, and language and other communication needs. The response from the field, while supportive of recording
this information for each patient, argued that unless race and ethnicity data were recorded in standardized categories, their use for performance improvement would be limited. In light of this feedback, in January 2006 the Joint
Commission began requiring that language and other communication needs be recorded in each patient’s record,
but it delayed requiring recording of race and ethnicity until a widely accepted standardized approach became
available. As of this writing, the Joint Commission is again proposing a requirement that race and ethnicity be
recorded and that these data be used in planning services to meet the needs of persons in the community and in
performance improvement (The Joint Commission, 2009). The Joint Commission anticipates the response the field
to be that standardized categories are needed.15
At this point, NCQA is planning to address CLAS as a voluntary accreditation module, to be available in
2010. It is expected that the module will address the use of race, ethnicity, and language data in stratifying quality
performance data to identify both disparities in health care and problems in meeting language needs, as well as the
use of those findings to drive quality improvement. Currently, NCQA has a program that rewards health plans for
demonstrating innovative practices in providing for culturally and linguistically appropriate services (NCQA, 2006,
2007, 2008b). Previously, NCQA, with funding from The California Endowment, provided grants and technical
assistance to small physician practices serving minority populations to learn about their needs for conducting and
sustaining quality improvement activities. As a result of this initiative, the need for standardized collection of race,
ethnicity, and language data in EHR systems was brought to light (NCQA, 2009).
National Quality Forum (NQF)
NQF is a membership organization whose mission is to “promote a common approach to measuring health
care quality and fostering system-wide capacity for quality improvement” through endorsement of consensus
standards (NQF, 2009). NQF recently released a framework for culturally and linguistically responsive services
and encourages the collection of race, ethnicity, and language data in accordance with the Hospital Research &
Education Trust (HRET) Toolkit (NQF, 2008). The subcommittee has suggested changes to elements of the HRET
Toolkit, in particular incorporating separate collection of a granular ethnicity variable, adding “Some other race”
to the OMB category set, and having a more expansive list of language categories. The subcommittee also favors
the collection and retention for analysis of specific multiple-race combinations (i.e., having data on each race that
an individual selects when given the option to select one or more races), rather than losing that detail by only
offering patients the more general response option of “multiracial” as delineated in the Toolkit.
Commission to End Health Care Disparities
A collaborative partnership involving the medical community, the American Medical Association (AMA), the
National Medical Association, and the National Hispanic Medical Association’s Commission to End Health Care
Disparities brings together 35 state and specialty medical societies. As a group, they have reaffirmed their collective commitment to ending disparities in health and health care by taking steps to (AMA, 2009b):
•
•
•
•
Increase awareness of disparities in their own practices within the physician community,
Promote better data collection,
Promote workforce diversity, and
Increase education and training.
The Commission is considering continuing medical education activities and exploration of core curriculum on
health disparities for medical students that might be considered a criterion for medical school accreditation. The
Commission also notes that race, ethnicity, and language proficiency data should be utilized for clinical quality
15
Personal communication, P. Schyve, The Joint Commission, May 11, 2009.
1
IMPLEMENTATION
performance measurement, with disparities an appropriate area for the Physician Consortium for Performance
Improvement to focus its efforts (AMA, 2009a).
The AMA Code of Ethics guides physicians to examine their practices to ensure that differences in care are
based on clinical necessity or patient preference and do not constitute inequitable treatment. The code also states
that physicians should take steps to minimize language barriers so as to enhance both patient and physician understanding of medical needs (AMA, 2005). Collection of race, ethnicity, and language data would allow stratification of quality measures in physician practices to create awareness of differential practice patterns or response
among patient populations and accordingly identify opportunities for quality improvement. The ARRA provision
for “meaningful use” of EHRs applies to enabling the exchange of health information and reporting on clinical
quality measures to CMS, medical boards, private plans, and others. Medicare staff observed that CMS sees “in
legislation and in operation, … a future for measuring quality in physician offices” (McGann, 2009). CMS sponsors
quality improvement research projects at the practitioner level, such as the Generating Medicare Physician Quality
Performance Measurement Results (GEMS) program which tracked 12 HEDIS (Healthcare Effectiveness Data
and Information Set) ambulatory care measures in a physician group practice fee-for-service environment using
an amalgam of Part A, B, and D claims data and race and ethnicity data from the enrollment database (McGann,
2009; Reilly, 2009a). Having race, ethnicity, and language data for their own patients would also enable providers
to review performance at the point of care (Kmetik, 2009).
Recommendation 6-3: Accreditation and standards-setting organizations should incorporate the
variables of race, Hispanic ethnicity, granular ethnicity, and language need outlined in this report
and associated categories (as updated by HHS) as part of their accreditation standards and performance measure endorsements.
• The Joint Commission, NCQA, and URAC should ensure collection in individual health
records of the variables of race, Hispanic ethnicity, granular ethnicity, and language
need as outlined in this report so these data can be used to stratify quality performance
metrics, organize quality improvement and disparity reduction initiatives, and report on
progress.
• NQF should review and amend its recommendations on the collection and use of data on
race, Hispanic ethnicity, granular ethnicity, and language need to accord with the categories and procedures outlined in this report.
• Medical societies and medical boards should review and endorse the variables, categories,
and procedures outlined in this report and educate their members on their use for quality
improvement.
STATE ACTION
States have an opportunity to shape the level of detail of race, ethnicity, and language data collected in their
programs by establishing which categories of granular ethnicity and language should be used in addition to the
basic OMB categories of race and Hispanic ethnicity. Each state organizes its own programs into different administrative units, so no attempt is made in this report to identify all state actors that have important roles in ensuring
quality improvement in health care. State health or other departments have important responsibilities related to
protecting and improving the health and health care of the population statewide, and are key players in ensuring
the adoption of standards and collection of data. However, providers and plans have reported that they receive
conflicting data requests from different agencies within the same state. Categories for race, ethnicity, and language
can be selected at the state level, with careful consideration of local as well as national stakeholder needs when
categories are defined for statewide aggregation and reporting for insurance program quality measures, disease
registries, birth and death vital statistics, hospital discharges, health care surveys, patient safety reporting, and other
activities. State-level aggregation and reporting can help illuminate the health care issues of population groups
whose disparities may not be apparent because of small sample sizes at the local level.
As large purchasers of care through Medicaid and CHIP programs, states have leverage with managed care
1
RACE, ETHNICITY, AND LANGUAGE DATA
organizations and providers. States can use this leverage to ensure that health care entities collect the recommended
race, ethnicity, and language data and use findings from analyses of these data to design quality improvement
efforts. Medicaid provides coverage for a large portion of minority groups; thus, states have an interest in ensuring
that the population covered is receiving appropriate levels of care (Angeles and Somers, 2007). Currently, some
states report their HEDIS measures by race and ethnicity, and others do not (Michigan Department of Community
Health, 2009; NC Department of Health and Human Services, 2009).
The subcommittee concludes that state entities can play a central role as aggregators and disseminators of
provider, plan, community, and state-level quality improvement data.
Recommendation 6-4: Through their certification, regulation, and monitoring of health care providers and organizations within their jurisdiction, states should require the collection of data on the
race, Hispanic ethnicity, granular ethnicity, and language need variables as outlined in this report
so these data can be used to stratify quality performance metrics, organize quality improvement
and disparity reduction initiatives, and report on progress.
Although it was beyond the scope of the subcommittee’s deliberations to determine the extent of the need,
representatives of state data agencies noted that one of the greatest barriers to state health departments, Medicaid
agencies, and regulatory agencies in fulfilling responsibilities related to certification, regulation, and monitoring
activities has been the lack of funding to expand and improve state data collection activities. The collection of race,
ethnicity, and language data across providers and plans in a community and state requires resources for rulemaking,
provider training, implementation of reporting, and assurance of data quality, yet many states are cutting back their
data reporting initiatives, including a reduction in workforce, because of state budget limitations (NRC, 2003). 16
SUMMARY
Efforts are under way to institute national standards for technology, performance measurement, and data
aggregation and exchange that complement local data collection and experiences with performance improvement
and reporting (HHS, 2009c; Roski, 2009). To date, it has been difficult to either combine or compare performance
data stratified by race, ethnicity, or language across payment and delivery systems, which has limited the utility
of such data for assessing the performance of the health care system as a whole or in specific geographic areas
with respect to disparities in care. Standardization of the categories of race, ethnicity, and language data will
promote greater comparability of data collected directly by providers or health plans or, for instance, transferred
from providers to plans. Estimates of health care disparities derived through indirect estimation techniques, such
as geocoding and surname analysis, can provide a helpful bridge until directly collected demographic data are
more universally available.
The subcommittee has proposed a framework for the collection of race, ethnicity, and language data that it
believes would facilitate the collection of data by individual entities, the comparison of quality of care received
by specific groups across entities and regions, and the combination of data for purposes of analyzing health care
needs and identifying disparities. While important disparities in quality of care can be identified among the race
and ethnicity groups captured by the OMB categories, those categories often are not sufficiently descriptive of local
and state populations because of the diversity of ethnic groups in different parts of the country, states, or specific
communities. A number of analyses have identified disparities among members of more granular ethnic categories that are masked by the aggregate OMB categories. More discrete population data could be used to identify
opportunities for quality improvement and outreach without inappropriate or inefficient targeting of interventions
to an entire broad racial or ethnic category.
The subcommittee recommends for quality improvement purposes: (1) the collection and use of data on granular ethnicity and language need, allowing local providers, communities, or states to select sets of categories from
16
Personal communication, D. Love, National Association of Health Data Organizations, and B. Rudolph, The Leapfrog Group, January
13, 2009.
19
IMPLEMENTATION
national standard lists that are most informative about the populations they serve, and (2) the continued collection
of data in the OMB race and Hispanic ethnicity categories to support consistency across as many complementary
data collection efforts as possible (e.g., poverty statistics, educational attainment). The national categories should
be consistently coded to foster exchange among systems of like data categories across providers, states, plans, or
payers for aggregation or comparison purposes. Given space constraints of paper forms or intake screens, local
category lists may be limited in the number of choices; electronic collection systems can often be designed to
collect many more categories than would be optimal on paper forms. The categories used should be descriptive of
the population served, reflect quality issues related to the health and health care of that population, and take into
account evidence or the likelihood of disparities among ethnic groups within the population. To ensure that each
individual has the opportunity to self-identify and that these identifiers will be captured, there should always be an
opportunity to add ethnicities and languages not contained on a list of check-off boxes. Therefore, an open-ended
“Other, please specify: ____” response option should be incorporated for both granular ethnicity and language
when a limited list of categories is presented for response. These responses can help identify when additional
categories may need to be added to prespecified lists on data collection instruments.
Many actors play a role in health care delivery and quality assessment, and each has a role to play in furthering the collection of meaningful race, ethnicity, and language data for quality improvement. National development
of standardized categories by HHS, along with a responsive updating process, would relieve each state and entity
of having to develop its own set of categories and coding scheme, which could be incompatible with others. The
collection of these data in accordance with the framework proposed in this report should be reflected in guidance
to recipients of HHS and state funding, incorporated into the accreditation standards and performance measurement endorsements of accreditation and standards-setting organizations, and coordinated across federal health
care delivery systems.
Collecting race, ethnicity, and language data using standard categories can help promote equity through
enhanced patient–provider communication and the provision of evidence-based quality care. Achieving the goals
of quality care requires monitoring to ensure that all populations receive patient-centered, safe, effective, timely,
efficient, and equitable care.
REFERENCES
AHRQ (Agency for Healthcare Research and Quality). 2008a. National Healthcare Disparities Report. Rockville, MD: AHRQ.
———. 2008b. The National Healthcare Quality Report. Rockville, MD: AHRQ.
AMA (American Medical Association). 2005. Opinion 9.121 - racial and ethnic health care disparities. http://www.ama-assn.org/ama/pub/
physician-resources/medical-ethics/code-medical-ethics/opinion9121.shtml (accessed May 22, 2009).
———. 2009a. Commission to End Health Care Disparities, five year summary. Chicago, IL: American Medical Association.
———. 2009b. Eliminating health disparities. http://www.ama-assn.org/ama/pub/physician-resources/public-health/eliminating-healthdisparities.shtml (accessed May 12, 2009).
Angeles, J., and S. A. Somers. 2007. From policy to action: Addressing racial and ethnic disparities at the ground-level. Hamilton, NJ: Center
for Health Care Strategies, Inc.
Bilheimer, L. T., and J. E. Sisk. 2008. Collecting adequate data on racial and ethnic disparities in health: The challenges continue. Health Affairs
27:383-391.
Blumenthal, D. 2009. Stimulating the adoption of health information technology. New England Journal of Medicine 360(15):1477-1479.
CDC (Centers for Disease Control and Prevention). 2000. Race and Ethnicity Code Set version 1.0. Atlanta, GA: Centers for Disease Control
and Prevention.
———. 2009. Guides. http://www.cdc.gov/phin/resources/guides.html (accessed May 22, 2009).
Chien, A. T. 2007. The potential impact of performance incentive programs on racial disparities in healthcare. In Eliminating healthcare disparities in America: Beyond the IOM report, edited by Williams, R. A. Totowa, NJ: Humana Press. p. 237-256.
Chien, A. T., M. H. Chin, A. M. Davis, and L. P. Casalino. 2007. Pay for performance, public reporting, and racial disparities in health care: How
are programs being designed? Medical Care Research and Review 64(5 Suppl):283S-304S.
CMS (Centers for Medicare and Medicaid Services). 2009. Physician quality reporting initiative. http://www.cms.hhs.gov/pqri (accessed May
22, 2009).
HL7 (Health Level 7). 2009. What is HL? http://www.hl7.org/about/hl7about.htm (accessed May 22, 2009).
HHS (U.S. Department of Health and Human Services). 2000. Healthy People 2010: Understanding and improving health. Washington, DC:
U.S. Department of Health and Human Services.
160
RACE, ETHNICITY, AND LANGUAGE DATA
———. 2003. Guidance to federal financial assistance recipients regarding Title VI prohibition against national origin discrimination affecting
limited English proficient persons. Washington, DC: U.S. Department of Health & Human Services.
———. 2009a. Fact sheets: Details for Medicare and Medicaid health information technology: Title IV of the American Recovery and Reinvestment Act. http://www.cms.hhs.gov/apps/media/press/factsheet.asp?Counter=3466&intNumPerPage=10&checkDate=&checkKey=&s
rchType=1&numDays=3500&srchOpt=0&srchData=&keywordType=All&chkNewsType=6&intPage=&showAll=&pYear=& (accessed
July 20, 2009).
———. 2009b. Health IT terms: Glossary of selected terms related to e-Health. Resources. http://healthit.hhs.gov/portal/server.pt (accessed
July 20, 2009).
———. 2009c. Nationwide Health Information Network (NHIN): Background & scope. http://healthit.hhs.gov/portal/server.pt (accessed July
17, 2009).
______, 2009d. HealthIT.hhs.gov Information Related to the American Recovery and Reinvestment Act of 2009. http://healthit.hhs.gov/portal/
server.pt (Accessed July 20, 2009).
———. 2009e. Civil rights: Limited English proficiency (LEP). http://www.hhs.gov/ocr/civilrights/resources/specialtopics/lep/index.html (accessed April 3, 2009).
HHS Data Council. 1999. Improving the collection and use of racial and ethnic data in health and human services. Washington, DC: HHS.
HHS Office of Minority Health (OMH). 2007. National standards on culturally and linguistically appropriate services (CLAS). http://www.
omhrc.gov/templates/browse.aspx?lvl=2&lvlID=15 (accessed May 13, 2009).
HRSA (Health Resources and Services Administration). 2008. The National Health Center Program: 200 national aggregate UDS data.
Table 4: Patients by socioeconomic characteristics. http://bphc.hrsa.gov/uds/2007data/National/NationalTable4Universal.htm (accessed
August 3, 2009).
Johnson, C. H., and M. Adamo. 2008. The SEER program coding and staging manual 200. Bethesda, MD: National Cancer Institute.
The Joint Commission. 2008. The Joint Commission 200 requirements related to the provision of culturally and linguistically appropriate
health care, version 200-1. Oakbrook Terrace, IL.
———. 2009. Proposed requirements to advance effective communication, cultural competence, and patient-centered care. http://www.
jointcommission.org/Standards/FieldReviews/
Kaiser Family Foundation. 2005. Dual eligibles as a percent of total Medicaid enrollees, 200. http://www.statehealthfacts.org/comparemap
table.jsp?ind=305&cat=6 (accessed July 17, 2009).
———. 2008. Total number of Medicare beneficiaries, 200. http://statehealthfacts.kff.org/comparemaptable.jsp?ind=290&cat=6&sub=74&y
r=63&typ=1&sort=a (accessed July 17, 2009).
———. 2009. Total Medicaid enrollment, FY2006. http://www.statehealthfacts.org/comparemaptable.jsp?ind=198&cat=4&sub=52&yr=29&t
yp=1&sort=a (accessed July 20, 2009).
Kmetik, K. 2009. American Medical Association. Presentation to the IOM Committee on Future Directions for the National Healthcare Quality
and Disparities Reports, February 10, 2009. Washington, DC. PowerPoint Presentation.
Lurie, N., A. Fremont, S. A. Somen, K. Coltin, A. Gelzer, R. Johnson, W. Rawlins, G. Ting, W. Wong, and D. Zimmerman. 2008. The National Health Plan Collaborative to reduce disparities and improve quality. Joint Commission Journal on Quality and Patient Safety
34(5):256-265.
Lurie, N., M. Jung, and R. Lavizzo-Mourey. 2005. Disparities and quality improvement: Federal policy levers. Health Affairs 24(2):354-364.
McGann, P. 2009. Linking quality measurement to interventions: The role of CMS. Centers for Medicare & Medicaid Services. Presentation to
the IOM Committee on Future Directions for the National Healthcare Quality and Disparities Reports, February 10, 2009. Washington,
DC. PowerPoint Presentation.
Michigan Department of Community Health. 2009. Michigan Medicaid HEDIS 200 results: Statewide aggregate report. Lansing, Michigan:
Health Services Advisory Group.
NCQA (National Committee for Quality Assurance). 2006. Innovative practices in multicultural health care. Washington, DC: NCQA.
———. 2007. Innovative practices in multicultural health care. Washington, DC: NCQA.
———. 2008a. Draft standards for culturally and linguistically appropriate services. Washington, DC: NCQA.
———. 2008b. Innovative practices in multicultural health care. Washington, DC: NCQA.
———. 2009. Supporting small practices: Lessons for health reform. Washington, DC: NCQA.
NCVHS (National Committee on Vital and Health Statistics). 2005. Eliminating health disparities: Strengthening data on race, ethnicity, and
primary language in the United States. Hyattsville, MD: U.S. Department of Health and Human Services.
Nerenz, D. R., and D. Darling. 2004. Addressing racial and ethnic disparities in the context of Medicaid managed care: A six-state demonstration project. Rockville, MD: HRSA.
North Carolina Department of Health and Human Services. 2009. QEHO initiatives. http://www.dhhs.state.nc.us/dma/quality/ (accessed July
17, 2009).
NQF (National Quality Forum). 2008. National voluntary consensus standards for ambulatory care—measuring healthcare disparities. Washington, DC: National Quality Forum.
———. 2009. About us. http://www.qualityforum.org/about (accessed June 10, 2009).
NRC (National Research Council). 2003. Improving racial and ethnic data on health: Report of a workshop. Washington, DC: The National
Academies Press.
OMB (Office of Management and Budget). 1977. Statistical policy directive No. 1, race and ethnic standards for federal statistics and administrative reporting. http://wonder.cdc.gov/wonder/help/populations/bridged-race/Directive15.html (accessed August 3, 2009).
IMPLEMENTATION
161
———. 1997. Revisions to the standards for the classification of federal data on race and ethnicity. Federal Register 62:58781-58790.
Reilly, T. 2009a. Data improvement efforts: Centers for Medicare & Medicaid Services. Centers for Medicare and Medicaid Services. Presentation to the IOM Committee on Future Directions for the National Healthcare Quality and Disparities Reports, February 10, 2009.
Washington, DC. PowerPoint Presentation.
———. 2009b. MIPPA section 1. Presentation at the Centers for Medicaid and Medicare Services Health Disparities Summit, May 22, 2009.
Baltimore, MD: CMS. PowerPoint Presentation
Rosenbaum, S., S. Abramson, and P. MacTaggart. 2009. Health information law in the context of minors. Pediatrics 123 (Suppl 2):S116-121.
Roski, J. 2009. Road map for better performance information through distributed data network. The Brookings Institution. Presentation to the
IOM Committee on Future Directions for the National Healthcare Quality and Disparities Reports, February 10, 2009. Washington, DC.
PowerPoint Presentation.
Rust, G., and L. A. Cooper. 2007. How can practice-based research contribute to the elimination of health disparities? Journal of the American
Board of Family Medicine 20(2):105-114.
Shin, H. B., Bruno, R. 2003. Language use and English-speaking ability: 2000. Washington, DC: U.S. Census Bureau.
Siegel, B., J. Bretsch, K. Jones, V. Sears, L. Vaquerano, and M. J. Wilson. 2008. Expecting Success: Excellence in cardiac care results from
Robert Wood Johnson Foundation Quality Improvement Collaborative. Princeton, NJ: Robert Wood Johnson Foundation.
Siegel, B., J. Bretsch, V. Sears, M. Regenstein, and M. Wilson. 2007. Assumed equity: Early observations from the first Hospital Disparities
Collaborative. Journal for Healthcare Quality 29(5):11-15.
Taylor-Clark, K., A. B. Anise, Y. Joo, and M. Chin. 2009. Massachusetts Superset. Washington, DC: The Brookings Institution.
URAC. 2007. A cultural competency standards crosswalk: A tool to examine the relationship between the OMH CLAS standards and Joint
Commission/URAC/NCQA accreditation standards. Washington, DC: URAC. PDF Presentation.
U.S. Census Bureau. 2002. Modified race data summary file: 2000 Census of population and housing, technical documentation. http://www.
census.gov/popest/archives/files/MRSF-01-US1.html#fig1 (accessed February 25, 2009).
———. 2008. GCT-T1: Population Estimates from the 200 Population Estimates Data Set. Washington, DC: U.S. Census Bureau.
Williams, T. 2009. Healthcare quality and disparities: Implications for pay for performance. Integrated Health Association. Presentation to the
IOM Committee on Future Directions for the National Healthcare Quality and Disparities Reports, March 12, 2009. Newport Beach, CA.
PowerPoint Presentation.
Wisconsin Cancer Reporting System. 2008. WCRS abstract code manual, 2nd edition. Madison, WI: Division of Public Health, Wisconsin
Department of Health Services.
Youdelman, M. 2007. Medicaid and SCHIP reimbursement models for language services. Washington, DC: National Health Law Program.
Appendix A
Acronyms and Abbreviations
ACRONYMS
ACS
ADA
AHA
AHIP
AHRQ
AIAN
AMA
AMIA
ARRA
ASPE
BRFSS
CAHPS
CCHIT
CDC
CHC
CHD
CHIP
CHIS
CLAS
CMS
CPS
DMHC
ED
EHR
ELPS
ESRD
HCUP
HHS
American Community Survey
Americans with Disabilities Act of 1990
American Hospital Association
America’s Health Insurance Plans
Agency for Healthcare Research and Quality, HHS
American Indian or Alaska Native
American Medical Association
American Medical Informatics Association
American Recovery and Reinvestment Act of 2009
Office of the Assistant Secretary for Planning and Evaluation, HHS
Behavioral Risk Factor Surveillance System
Consumer Assessment of Healthcare Providers and Systems
Certification Commission for Healthcare Information Technology
Centers for Disease Control and Prevention
Community Health Center
Coronary Heart Disease
Children’s Health Insurance Program
California Health Interview Survey
Culturally and Linguistically Appropriate Services
Centers for Medicare and Medicaid Services
Current Population Survey
California Department of Managed Health Care
Emergency Department
Electronic Health Record
English Language Proficiency Survey
End Stage Renal Disease
Healthcare Cost and Utilization Project
U.S. Department of Health and Human Services
16
164
HIPAA
HIT
HITSP
HL7
HRET
IOM
ISO
LEP
MEDS
MEPS
MIPPA
NAMCS
NCHS
NCQA
NCVHS
NHAMCS
NHANES
NHDR
NHeLP
NHIS
NHOPI
NHPC
NHQR
NIS
NLAAS
NQF
NRC
NSDUH
NVSS
OCR
OMB
OMH
ONC
PHIN
PHR
PQRI
PUMS
QI
RAETT
RWJF
SEER
SES
SSA
SSN
TDD
TTY
UMMC
URAC
WCRS
RACE, ETHNICITY, AND LANGUAGE DATA
Health Insurance Portability and Accountability Act
Health Information Technology
Health Information Technology Standards Panel
Health Level 7
Health Research & Educational Trust
Institute of Medicine
International Organization for Standardization
Limited English Proficiency
Medi-Cal Eligibility Data System
Medical Expenditure Panel Survey
Medicare Improvements for Patients and Providers Act of 2008
National Ambulatory Medical Care Survey
National Center for Health Statistics
National Committee for Quality Assurance
National Committee on Vital and Health Statistics
National Hospital Ambulatory Medical Care Survey
National Health and Nutrition Examination Survey
National Healthcare Disparities Report
National Health Law Program
National Health Interview Survey
Native Hawaiian or Other Pacific Islander
National Health Plan Collaborative
National Healthcare Quality Report
National Immunization Survey
National Latino and Asian American Study
National Quality Forum
National Research Council
National Survey on Drug Use and Health
National Vital Statistics System
Office for Civil Rights, HHS
Office of Management and Budget
Office of Minority Health, HHS
Office of the National Coordinator for Health Information Technology, HHS
Public Health Information Network
Personal Health Record
Medicare Physician Quality Reporting Initiative
Public Use Microdata Samples
Quality Improvement
U.S. Census Bureau’s 1996 Racial and Ethnic Targeted Test
Robert Wood Johnson Foundation
Surveillance, Epidemiology, and End Results
Socioeconomic Status
Social Security Administration
Social Security Number
Telecommunication Device for Deaf Persons
TeleTYwriter or Text Telephone
University of Mississippi Medical Center
Formerly known as the Utilization Review Accreditation Commission
Wisconsin Cancer Reporting System
16
APPENDIX A
ABBREVIATIONS
CI
MLBW
OR
RR
VLBW
Confidence Interval
Moderately Low Birthweight
Odds Ratio
Relative Risk
Very Low Birthweight
Appendix B
Legislation Cited in Report
Chapter
Legislation Cited
Summary
American Recovery and Reinvestment Act of 2009, Public Law 111-5 § 3002(b)(2)(B)(vii), 111th
Cong., 1st sess. (February 17, 2009).
The Civil Rights Act of 1964, Public Law 88-352, 78 Stat. 241, 88th Cong., 2d sess. (July 2, 1964).
Lau v Nichols, 414 U.S. 563 (1974).
Department of Justice. 42 USC Chapter 20 § 1973aa-1a. The Public Health and Welfare, Elective
Franchise.
Chapter 1
The Civil Rights Act of 1964, Public Law 88-352, 78 Stat. 241, 88th Cong., 2d sess. (July 2, 1964).
Health Insurance Portability and Accountability Act of 1996, Public Law 104-191, 104th Cong.,
2d sess. (August 21, 1996).
Medicare Improvements for Patients and Providers Act of 200, Public Law 110-275 § 118, 110th
Cong., 2d sess. (July 15, 2008).
American Recovery and Reinvestment Act of 2009, Public Law 111-5 § 3002(b)(2)(B)(vii), 111th
Cong., 1st sess. (February 17, 2009).
The Indian Healthcare Improvement Act, Public Law 94-437, 25 U.S.C. 1603(c)-(d).
Chapter 2
The Indian Healthcare Improvement Act, Public Law 94-437, 25 U.S.C. 1603(c)-(d).
16
16
RACE, ETHNICITY, AND LANGUAGE DATA
Chapter
Legislation Cited
Chapter 3
Medicare Improvements for Patients and Providers Act of 200, Public Law 110-275 § 118, 110th
Cong., 2d sess. (July 15, 2008).
Joint resolution relating to the publication of economic and social statistics for Americans of
Spanish-origin or descent, Public Law 94-311 (15 U.S.C. 1516a), 94th Cong. (June 16, 1976).
Espinoza v. Farah Mfg. Co., 414 U.S. 86, 88 (1973).
Children’s Health Insurance Program Reauthorization Act of 2009, Public Law 111-3, 111th
Cong., 1st sess. (February 4, 2009).
Chapter 4
Children’s Health Insurance Program Reauthorization Act of 2009, Public Law 111-3, 111th
Cong., 1st sess. (February 4, 2009).
Lau v Nichols, 414 U.S. 563 (1974).
Department of Justice. 42 U.S.C. Chapter 20 § 1973aa-1a. The Public Health and Welfare, Elective
Franchise.
Department of Justice. 28 CFR Part 36 § 36.303. ADA Standards for Accessible Design. (July 1,
1994).
American Recovery and Reinvestment Act of 2009, Public Law 111-5 § 3002(b)(2)(B)(vii), 111th
Cong., 1st sess. (February 17, 2009).
Medicare Improvements for Patients and Providers Act of 200, Public Law 110-275 § 118, 110th
Cong., 2d sess. (July 15, 2008).
Health Care Language Assistance Act of 200, California S.B. 853 § 1367 (October 8, 2003).
California Health and Safety Code § 1259, (January 12, 2009).
California Code of Regulations, Title 9 § 1810.410 (f) (3).
Chapter 5
American Recovery and Reinvestment Act of 2009, Public Law 111-5 § 3002(b)(2)(B)(vii), 111th
Cong., 1st sess. (February 17, 2009).
The Civil Rights Act of 1964, Public Law 88-352, 78 Stat. 241, 88th Cong., 2d sess. (July 2, 1964).
The Social Security Act of 196, 89th Cong., 42 U.S.C. § 7, 1st sess. (July 30, 1965).
Health Insurance Portability and Accountability Act of 1996, Public Law 104-191, 104th Cong.,
2d sess. (August 21, 1996).
Chapter 6
American Recovery and Reinvestment Act of 2009, Public Law 111-5 § 3002(b)(2)(B)(vii), 111th
Cong., 1st sess. (February 17, 2009).
169
APPENDIX B
Chapter
Legislation Cited
Children’s Health Insurance Program Reauthorization Act of 2009, Public Law 111-3, 111th
Cong., 1st sess. (February 4, 2009).
Appendix C
Workshop Agendas
Committee on Future Directions for the National Healthcare Quality and Disparities Reports and
Subcommittee on Standardized Collection of Race/Ethnicity Data for Healthcare Quality Improvement
National Academy of Sciences’ Keck Building
500 Fifth Street, NW, Room 100, Washington, DC
DAY 1—MONDAY, FEBRUARY 9, 2009
ROOM 100
CLOSED SESSION (Committee and Subcommittee Members and IOM Staff Only)
7:45–10:30 AM
END CLOSED SESSION-START OPEN SESSION
Public Workshop
11:00
Session 1:
Welcome and Introductory Remarks
Sheila Burke, Chair and Moderator
Setting Future Directions for the National Healthcare Quality Report (NHQR) and
National Healthcare Disparities Report (NHDR)
11:05
Lessons Learned in Developing NHQR and NHDR
Earnest Moy, MD, MPH, Team Lead, NHQR & NHDR, Center for Quality Improvement and Patient
Safety, Agency for Healthcare Research and Quality (AHRQ), HHS
11:45
Remarks from Study Sponsor
Carolyn Clancy, MD, Director, AHRQ, HHS
END OPEN SESSION-START CLOSED SESSION
12:25 PM Working Lunch, Committee Members Only
END CLOSED SESSION-START OPEN SESSION
11
12
RACE, ETHNICITY, AND LANGUAGE DATA
Session 2:
Race/Ethnicity/Language Data Categories: Definitions, Collection, Aggregation, and
Reporting for Quality Improvement
1:00
Welcome
David Nerenz, Subcommittee Chair and Moderator
1:05
Rationale for Expanded Race/Ethnicity Data Collection and Lessons from the National Health
Plan Collaborative
Nicole Lurie, MD, MSPH, Director, RAND Center for Population Health and Health Disparities
1:40
Standardizing Race/Ethnicity Categories Across a State and Within a Health Plan
• Kalahn Taylor-Clark, PhD, MPH, Senior Associate, Engelberg Center for Healthcare Reform, High
Value Health Care Initiative, The Brookings Institution
• Kathryn L. Coltin, MPH, Director, External Quality Data Initiatives, Harvard Pilgrim Health
Care
2:20
Break
2:30
Incorporating Language Needs into Quality Improvement
• Mara Youdelman, JD, LLM, Staff Attorney, National Health Law Program (NHeLP)
• Marsha Regenstein, PhD, Associate Research Professor and Co-Director Center for Health Care
Quality, George Washington University
3:00
Current and Future Federal Standards for Race/Ethnicity/Language Data
• Katherine K. Wallman, BA, Chief Statistician, U.S. Office of Management and Budget
• Karen Humes, MA, Assistant Division Chief for Special Population Statistics, Population Division,
U.S. Census Bureau
3:50
The HRET Toolkit and Hospital Data Collection
Romana Hasnain-Wynia, PhD (Subcommittee Member), Director, Center for Healthcare Equity and
Associate Professor, Institute for Healthcare Studies, Northwestern University, Feinberg School of
Medicine
4:15
Experiences of SEER and NHIS
• Brenda Edwards, PhD, Associate Director, Surveillance Research Program, Division of Cancer
Control & Population Sciences, National Cancer Institute
• Jennifer Madans, PhD, Associate Director for Science, National Center for Health Statistics
5:00
Gathering Data on Subpopulations Beyond OMB Categories
Deeana Jang, JD, Policy Director, Asian & Pacific Islander American Health Forum, presenting for
Out of Many, One (OMO) Health Data Taskforce
5:25
Questions from the Public
5:35
Adjourn
END OPEN SESSION-START CLOSED SESSION
1
APPENDIX C
DAY 2—TUESDAY, FEBRUARY 10, 2009
ROOM 100
CLOSED SESSION (Committee and Subcommittee Members and IOM Staff Only)
7:45 AM
Continental Breakfast
END CLOSED SESSION-START OPEN SESSION
Public Workshop
8:05
Welcome
Sheila Burke, Chair and Moderator
Session 3:
8:10
Initiatives in Data Aggregation and Quality Measurement
Roadmap for Coordinated Quality Measurement and Reporting
Joachim Roski, PhD, MPH, Managing Director, High-Value Health Care Project, Engelberg Center
for Health Care Reform, The Brookings Institution
Physician-level Quality Measurement and Reporting
Karen Kmetik, PhD, Director, Clinical Performance Evaluation, American Medical Association and
The Physician Consortium for Performance Improvement
9:15
National Priorities Partnership’s Priority Areas and Corresponding Goals
Karen Adams, PhD, MT, Vice President, National Priorities, National Quality Forum
10:00
Advancing Quality Improvement
Don Berwick, MD, MPP, President and CEO, Institute for HealthCare Improvement
10:35
Break
Session 4:
10:50
Select Federal Data Improvement Efforts
CMS’ Recommendations for NHQR and NHDR and for Data Improvement
• T
homas Reilly, PhD, Deputy Director, Office of Research, Development and Information, Centers
for Medicare and Medicaid Services (CMS)
• Paul McGann, MD, Deputy Chief Medical Officer, Office of Clinical Standards and Quality, CMS
Lessons from Healthcare Cost and Utilization Project
Irene Fraser, PhD, Director Center for Delivery, Organization, and Markets, AHRQ
END OPEN SESSION-START CLOSED SESSION
12:00–3:00 PM
14
RACE, ETHNICITY, AND LANGUAGE DATA
Committee on Future Directions for the National Healthcare Quality and Disparities Reports and
Subcommittee on Standardized Collection of Race/Ethnicity Data for Healthcare Quality Improvement
Hyatt Regency Newport Beach
1107 Jamboree Road, Terrace Room, Newport Beach, CA
DAY 1—WEDNESDAY, MARCH 11, 2009
TERRACE ROOM
CLOSED SESSION (Committee and Subcommittee Members and IOM Staff Only)
7:45 AM–12:45 PM
END CLOSED SESSION-START OPEN SESSION
Public Workshop
12:45
Welcome
Sheila Burke, Chair and Moderator
12:50
Defining Race, Ethnicity and Language Populations
• Marjorie Kagawa-Singer, PhD, MN, RN, Professor, UCLA School of Public Health and
Professor, Department of Asian American Studies
• Gayle Tang, MSN, RN, Director, National Linguistic & Cultural Programs, National Diversity,
Kaiser Permanente
1:35
Accounting for Diversity in Quality Improvement
• Michael Rodriguez, MD, MP, Associate Professor and Vice Chair of Research, George F. Kneller
Endowed Chair in Family Medicine, Department of Family Medicine, David Geffen School of
Medicine, UCLA
• Ron Hays, PhD, Professor, Division of General Internal Medicine and Health Services Research,
UCLA
2:20
Quality Measurement
• Andrew Bindman, MD, Professor of Medicine, Health Policy Epidemiology and Biostatistics, UCSF
and Director of CaMRI (CA Medicaid Research Institute)
• Patrick Romano, MD, MPH, Professor, Divisions of General Medicine and General Pediatrics,
Center for Healthcare Policy and Research, UC Davis
3:05
Public Comment
3:15
Break
END OPEN SESSION-START CLOSED SESSION
3:25–5:15
5:15
Adjourn
1
APPENDIX C
DAY 2—THURSDAY, MARCH 12, 2009
TERRACE ROOM
CLOSED SESSION (Committee and Subcommittee Members and IOM Staff Only)
7:45–8:40 AM
END CLOSED SESSION-START OPEN SESSION
Public Workshop
8:40
Welcome
Sheila Burke, Chair and Moderator
8:45
Direct Collection and Indirect Estimation of Race/Ethnicity/Language Data
• Marc Elliott, PhD, Senior Statistician, RAND
• Allen Fremont, MD, PhD, Natural Scientist and Sociologist RAND Corporation
• Grace Ting, MHA, Health Services Director, Health Equities Programs, Wellpoint, Inc.
9:50
Break
10:00
Priorities for Quality Improvement and Ways to Leverage Collected Information
• David Lansky, PhD, President and CEO, Pacific Business Group on Health
• Maribeth Shannon, MS, Director, Market and Policy Monitor Program, California Healthcare
Foundation
• Thomas Williams, MPH, MBA, Executive Director, Integrated Healthcare Association
11:15
Public Comment
END OPEN SESSION-START CLOSED SESSION
11:30 AM–3:00 PM
Appendix D
Subcommittee Member and Staff Biographies
SUBCOMMITTEE
David R. Nerenz, Ph.D. (Chair), is the Director of the Center for Health Services Research at the Henry Ford
Health System, Detroit, Michigan. He is also Director of Outcomes Research in Henry Ford’s Neuroscience
Institute. Dr. Nerenz received his doctorate in Social Psychology from the University of Wisconsin-Madison in
1979. From 1980 to 1984 he did research at the Wisconsin Clinical Cancer Center and was also Coordinator of
Health Services Research for the Wm. S. Middleton Veterans Hospital in Madison. From 1984 to 1986 he was
Director of the VA’s Great Lakes Regional HSR&D Field Program in Ann Arbor. He has been at the Henry Ford
Health System since 1987. For the past 10 years, he has led a series of demonstration projects on health plans’
collection and use of data on race and ethnicity to eliminate disparities in quality of care. His areas of expertise
include: performance measures for health care organizations; racial/ethnic disparities in quality of care; and use
of patient-reported outcomes data to assess and compare health care providers.
Margarita Alegría, Ph.D., is a professor of psychology in the Department of Psychiatry at Harvard Medical School
and currently serves as the Principal Investigator of three National Institutes of Health-funded research studies.
Her research focuses on how to improve health care service delivery for diverse racial and ethnic populations;
patient–provider interaction when treating multicultural populations; and how to bring the community’s perspective in the design and implementation of health services. Dr. Alegría also conducts research that will contribute to
understanding the factors influencing mental health and substance abuse service disparities, and testing interventions aimed at reducing these disparities. Her published work centers on the effects of immigration and integration
into the United States on mental health among Latinos, Asians, and Afro-Caribbeans. Dr. Alegría has conducted
epidemiologic research on the generalizability of the immigrant paradox (that being foreign-born is protective
against psychiatric disorders). Her recent research has examined the complex factors related to the mental health
of Latino immigrant children, such as increased risk of trauma, high school dropout and lack of access to adequate
health care. As a result of her contributions, Dr. Alegría received the 2003 Mental Health Section Award of the
American Public Health Association, the 2006 Greenwood Award for Research Excellence, and the 2007 Latino
Mental Health Scientific Leadership Award given by New York University. In 2008, she received an APA Presidential recognition for her disparities work by the American Psychological Association, the National Award for
Excellence in Research by a Senior Investigator from the National Hispanic Science Network, and the Carl Taube
Award given by the Mental Health Section of the American Public Health Association. She is a member of the
1
1
RACE, ETHNICITY, AND LANGUAGE DATA
Institute of Medicine’s Public Health Board and past Chair of Academy Health. She also serves on several other
boards, including the National Academy of State Health Policy and the Health Services Research Journal.
John Z. Ayanian, M.D., M.P.P., is a professor of medicine and health care policy at Harvard Medical School
and a professor of health policy and management at the Harvard School of Public Health. He is the director of
the Harvard Fellowship in General Medicine and Primary Care and director of the General Medicine Fellowship
at Brigham and Women’s Hospital. He is also a practicing general internist in the Division of General Medicine
at Brigham and Women’s Hospital, where he sees patients and teaches medical residents. Dr. Ayanian’s research
focuses on the effect of patients’ race, ethnicity, gender, insurance coverage, and socioeconomic characteristics on
access to care and clinical outcomes, as well as the impact of physicians’ specialty and organizational characteristics on the quality of care. He is the principal investigator of the Harvard/Northern California research team in
the Cancer Care Outcomes Research and Surveillance (CanCORS) Consortium, a multi-regional initiative funded
by the National Cancer Institute to evaluate the experiences and outcomes of patients with colorectal cancer and
lung cancer. He also leads an NCI-funded study evaluating randomized interventions to improve systems for
colorectal cancer screening. Dr. Ayanian’s recent research has studied trends in quality of care and racial disparities in Medicare managed care plans, the effect of Medicare coverage on previously uninsured adults, the impact
of ambulatory care from primary care physicians and cardiologists on the outcomes of Medicare beneficiaries
who have survived a heart attack, the relation of surgical volume to outcomes of colorectal cancer, and patients’
perceptions of the quality of cancer care by race, ethnicity, and language. His previous research includes studies
of the effects of race and gender on access to kidney transplants and cardiac procedures, and the quality of care
for common medical conditions in teaching and nonteaching hospitals.
Ignatius Bau, J.D., is a Program Director at the The California Endowment, a private statewide health policy
foundation. He focuses on issues of language access, cultural competency, health workforce diversity, and reduction of health care disparities and currently oversees grants to several national quality, health care accreditation
and health professions educational accreditation organizations, as well as to hospitals and health systems, health
plans, physician organizations, community health centers, health professions educational institutions, and community-based organizations throughout California. Bau previously worked as a program manager and policy
director at the Asian and Pacific Islander American Health Forum (APIAHF) and as a staff attorney at the Lawyers’ Committee for Civil Rights of the San Francisco Bay Area. Bau and APIAHF led community efforts that
resulted in the creation of the White House Initiative on Asian Americans and Pacific Islanders and he was the
principal author of the first report from the President’s Advisory Commission on Asian Americans and Pacific
Islanders. He has served on the board of directors of numerous organizations, including Funders for Lesbian and
Gay Issues, the National Minority AIDS Coalition, the Northern California Coalition for Immigrant and Refugee
Rights, the Asian and Pacific Islander Wellness Center, and the California Budget Project and on several government committees, including the President’s Advisory Council on HIV/AIDS, the Centers for Disease Control and
Prevention’s National HIV Prevention Planning Group, and the California Department of Health’s Task Force on
Multicultural Health. He has been a member of the Institute of Medicine’s Forum on the Science of Health Care
Quality Improvement and Implementation, the Joint Commission Public Advisory Group, the National Quality
Forum Work Group on Minority Healthcare Quality Measurement, and several Technical Advisory Committees
for the California Health Interview Survey.
Roderick J. Harrison, Ph.D., is a scholar at the Joint Center for Political and Economic Studies, Howard University. Previously, he served as chief of the U.S. Census Bureau’s Racial Statistics Branch where he helped to
expand the content and number of the Bureau’s publications and releases on racial and ethnic populations and
director of DataBank, an online clearinghouse of data on African Americans and other ethnic populations. In
1998, the American Statistical Society awarded him the Roger Herriot Award for Innovations in Federal Statistics
for his work in revising the racial and ethnic classifications used by all federal agencies and efforts in developing
new classifications on race and ethnicity for the 2000 Census. Dr. Harrison held a joint appointment in the AfroAmerican Studies and Sociology departments at Harvard University and also taught at UCLA. He currently teaches
APPENDIX D
19
in the Department of Sociology and Anthropology at Howard University. He received his Ph.D. in sociology from
Princeton and his A.B. from Harvard.
Romana Hasnain-Wynia, Ph.D., is director, Center for Healthcare Equity and Associate Professor, Research at
Northwestern University, Feinberg School of Medicine. Prior to joining Northwestern University, Dr. HasnainWynia was vice president of research for the Health Research & Educational Trust (HRET), the research and
education affiliate of the American Hospital Association, where she oversaw the overall HRET research agenda,
maintained an individual portfolio of research projects focusing on equity and quality of care, and developed the
HRET Toolkit on collecting race, ethnicity, and primary language information from patients, which has been
endorsed by the National Quality Forum. She is the principal investigator of a number of studies examining quality of care for underserved populations and of studies that examine the impact of performance incentive programs
on the health care safety net. She serves as a co-investigator on the evaluation team for the Robert Wood Johnson
Foundation’s national initiative, Aligning Forces for Quality, and is responsible for leading the evaluation of the
disparities-equity component of the program. Dr. Hasnain-Wynia serves on a number of expert advisory panels
and is Senior Associate Editor for the journal, Health Services Research. Dr. Hasnain-Wynia received her doctoral
degree in health policy from Brandeis University’s Heller School for Social Policy and Management.
Ninez Ponce, Ph.D., is an Associate Professor at UCLA’s Department of Health Services. She is also Senior
Research Scientist at the UCLA Center for Health Policy Research and member of UCLA/Jonsson Comprehensive Cancer Center, Division of Cancer Prevention and Control Research. Dr. Ponce’s research has focused
on understanding macroeconomic effects on health and health care access in low income countries, and, more
recently, in low-SES neighborhoods and ethnic minorities in the United States. She was RAND’s resident adviser
to the Ministry of Health, Republic of Macedonia, and has worked at the World Bank, Catholic Relief Services in
Thailand, the Asian and Pacific Islander American Health Forum, and the Berkeley Free Clinic. As Co-Principal
Investigator of the California Health Interview Survey 2001 and 2003, she led efforts in the measurement of race/
ethnicity, acculturation, physician-patient communication, and discrimination. In addition, she conceptualized the
rationale and implementation of CHIS 2001’s Asian ethnic oversamples and the cultural and linguistic adaptation
of the survey. Dr. Ponce received a 5-year career-development award from the National Cancer Institute (NCI) to
explore neighborhood effects and health care market factors that may explain persisting racial and ethnic disparities in cancer screening. Recently, NCI’s Special Populations Health Network recognized Dr. Ponce as a “Rising
Star” in cancer disparities research as part of her work with the Asian American Network in Cancer Awareness
Research and Training. Dr. Ponce is faculty advisor to UCLA’s student-run Samahang Pilipino Education and
Retention (SPEAR) Project and Samahang Pilipino Advancing Community Empowerment (SPACE), and serves
on several state and national committees: the Cultural and Linguistics Work Group of California’s Office of the
Patient Advocate, the Policy Board of the California Pan Ethnic Health Network, and the Executive Board of the
Asian and Pacific Islander Caucus of the American Public Health Association.
Wayne S. Rawlins, M.D., M.B.A., is a national medical director at Aetna and Head of Medical Operations for
Aetna Government Health Plans, Aetna’s business unit responsible for Department of Defense uniformed services
and VA customers. Prior to this, he was head of Aetna Condition Analysis, leading medical cost management activities. In addition, he is co-lead for Aetna’s Racial and Ethnic Disparities in Health Care Initiatives. Dr. Rawlins is
a liaison member of the National Vaccine Advisory Committee representing America’s Health Insurance Plans.
He also serves as the corporate clinical lead representing the chief medical officer in crisis and disaster preparedness, as well as the corporate clinical lead for pandemic planning at Aetna. Dr. Rawlins has been involved in crisis
management at Aetna since September 11, 2001, when he was the senior physician in charge of clinical operations
for Aetna’s New York market. While at Aetna, Dr. Rawlins has served in several senior clinical operational roles
prior to assuming his current role. These included head of business planning and reporting for National Medical
Services reporting to Aetna’s Chief Medical Officer. Prior to this he served as the regional medical director for
Aetna’s northeast region, providing access to health care services for more than two million members. He was senior
patient management medical director for the northeast region. Dr. Rawlins also led the design, development, and
10
RACE, ETHNICITY, AND LANGUAGE DATA
implementation of Aetna’s industry-leading end-of-life care program. Dr. Rawlins received his medical degree from
the University of Connecticut in 1980, then completed an internal medicine residency and chief residency at the
University of Rochester in New York. He is board certified in internal medicine. Dr. Rawlins received his M.B.A.
from Rensselaer Polytechnic Institute in 2001. Prior to joining Aetna in 1997, he was a physician manager with
the Northeast Permanente Medical Group for 13 years, treating a wide variety of patients in a busy primary care
practice. He is a member of the National Medical Association, American College of Physicians, and the American
College of Physician Executives.
Paul M. Schyve, M.D., is the Senior Vice President of The Joint Commission and is knowledgeable of requirements for language access in hospitals and disability issues. Prior to joining The Joint Commission in 1986, Dr.
Schyve was the Clinical Director of the Illinois Department of Mental Health and Developmental Disabilities. Dr.
Schyve received his undergraduate degree (Phi Beta Kappa) and his medical education and residency in psychiatry at the University of Rochester. He has held a variety of professional and academic appointments in the areas
of mental health and hospital administration, including as Director of the Illinois State Psychiatric Institute and
Clinical Associate Professor of Psychiatry at the University of Chicago. Dr. Schyve is certified in psychiatry by
the American Board of Psychiatry and Neurology and is a Distinguished Life Fellow of the American Psychiatric
Association. A former member of the Board of Directors of the National Alliance for Health Information Technology, a Founding Advisor of Consumers Advancing Patient Safety, the Chair of the Ethical Force Oversight Body
of the Institute of Ethics at the American Medical Association, and a former Trustee of the United States Pharmacopeial Convention, he has published in the areas of psychiatric treatment and research, psychopharmacology,
quality assurance, continuous quality improvement, health care accreditation, patient safety, the role of language,
cultural competence, and health literacy in communication, and health care ethics.
Alan M. Zaslavsky, Ph.D., is a professor of health care policy (statistics) in the Department of Health Care
Policy at Harvard Medical School. His methodological research interests include surveys, census methodology,
microsimulation models, missing data, hierarchical modeling, small-area estimation, and applied Bayesian methodology. His health services research focuses primarily on developing methodology for quality measurement of
health plans and other units and understanding the implications of these quality measurements. Other major areas
include: health care disparities, psychiatric epidemiology, quality of care for cancer patients, and health effects
of social networks.
STUDY STAFF
Michelle Bruno, M.P.P., is a Research Associate on the Board on Health Care Services. Michelle joined the IOM
in 2007 and has contributed to a range of significant reports, including Resident Duty Hours: Enhancing Sleep,
Supervision, and Safety, Retooling for an Aging America: Building the Health Care Workforce, and Opportunities
for Coordination and Clarity to Advance the National Health Information Agenda. She is currently part of the staff
for the Committee on the Future Directions for the National Healthcare Quality and Disparities Reports. Prior
to joining the IOM, Michelle completed her master’s degree in public policy with a dual concentration in health
policy and public and nonprofit management at the Georgetown Public Policy Institute.
Cassandra Cacace, B.S., is a Senior Program Assistant for the Board on Health Care Services, assisting on a
variety of projects, including the Committee on Continuing Education, the Committee on Resident Duty Hours and
Patient Safety, and the Forum the Science of Health Care Quality Improvement and Implementation. She provides
administrative and research support to the teams, as well as logistical support for all committee meetings. Prior to
the IOM, Cassandra worked as a research associate at Oxford Outcomes, a health care consulting firm, where she
performed outcomes research on a variety of health conditions. She is currently pursuing her master’s degree in
health policy from the George Washington University School of Public Health and Health Services.
Roger Herdman, M.D., born in Boston, MA, Phillips Exeter Academy, 1951; Yale University, Magna Cum
Laude, Phi Beta Kappa, BS, 1955; Yale University School of Medicine, MD, 1958. Interned at the University of
APPENDIX D
11
Minnesota. Medical Officer, U.S. Navy, 1959–1961. Thereafter, completed a residency in pediatrics and continued
with a medical fellowship in immunology/nephrology at Minnesota. Held positions of Assistant Professor and
Professor of Pediatrics at the University of Minnesota and the Albany Medical College between 1966–1979. In
1969, appointed Director of the New York State Kidney Disease Institute in Albany. During 1969–1977 served
as Deputy Commissioner of the New York State Department of Health responsible for research, departmental
health care facilities and the Medicaid program at various times. In 1977, named New York State’s Director of
Public Health. From 1979 until joining the U.S. Congress’s Office of Technology Assessment (OTA) was a Vice
President of the Memorial Sloan-Kettering Cancer Center in New York City. In 1983, named Assistant Director of
OTA and then Acting Director and Director from January 1993–February 1996. After the closure of OTA, joined
the National Academy of Sciences’ Institute of Medicine as a Senior Scholar, and subsequently served as Director
of the National Cancer Policy Board and the National Cancer Policy Forum. He is now the Director of the Board
on Health Care Services.
Bernadette McFadden, M.Sc., joined the Board on Health Care Services as a Research Associate in November
2008. Prior to joining the IOM, she completed a master’s degree in social research at Trinity College Dublin and
was employed by Dublin City Council’s Homeless Agency, where she edited a volume of essays on homelessness in Ireland and wrote a report on how the city’s management of public space impacts homeless persons. Her
interests in health policy developed while serving as an AmeriCorps teacher in an Atlanta Public School. She
graduated summa cum laude, Phi Beta Kappa, from Dickinson College in Carlisle, Pennsylvania. While in central
Pennsylvania, she conducted research on local effects of implementing Medicare Part D and the state’s long term
care policies, interned with the Executive Policy Office of the Pennsylvania Department of Health, and served as
a board member on the United Way of Cumberland County.
Adam Schickedanz, B.A., is a senior medical student at the University of California, San Francisco, graduate of
Washington University in St. Louis, and Boston native. At UCSF Adam has developed a clinical focus in urban
underserved patient care, while also advancing interests in professionalism and cultural competency in medical
education, novel approaches to clinician-patient communication in medical decision making (particularly at the
end of life), and the intersections of education and health. Adam was with the Board on Health Care Services as
part of the staff and as a Mirzayan Policy Fellow through April of 2009, when he returned to UCSF to complete
his MD.
Cheryl Ulmer, M.S., recently served as Co-director of the Resident Duty Hours study for the Institute of Medicine.
Before that, she worked as an independent consultant on a wide-ranging set of health care issues, but with a primary
focus on the delivery and content of health care services, disparities in health status across populations, options
for financing and insurance, and quality of clinical care. Previous consulting work for the IOM included surveying
CEOs of the state Quality Improvement Organizations and providing writing/editing services on the Pathways to
Quality and the Consequences of Uninsurance series. Other illustrative independent consulting projects include:
Serving Patients with Limited English Proficiency: Results of a Community Health Center Survey (NACHC,
The California Endowment and National Health Law Program, 2007); Giving Back and Moving Forward, Finding a Future through Service in Community Health Corps (NACHC, 2006); Changing Lives through Service to
Medically Underserved Communities (NACHC and Corporation for National Service, 2005); Assessing Primary
Care Content: Four Conditions Common in Community Health Center Practice–Hypertension, Diabetes, Otitis,
Asthma (HRSA, 2000); The Role of Behavioral Factors in Achieving National Health Outcomes (Robert Wood
Johnson Foundation, 2004); Schools as Health Access Points for Underserved Children and Adolescents: Survey
of School-based Programs (NACHC, CDC, and HRSA, 2003). She has served as a Senior Associate with MDS
Associates, a health care consulting firm with public and private sector clients and in various positions within
the U.S. Department of Health and Human Services including the Office of the Secretary, Assistant Secretary for
Planning and Evaluation/Health; the Health Services Administration; the Health Resources Administration; Medicaid Services; and NIH. She has a master’s degree from Georgetown University and a BS from Mary Washington
College of the University of Virginia.
Appendix E
Subcommittee Template:
Developing a National Standard Set of
Granular Ethnicity Categories and a Rollup Scheme
The Subcommittee on Standardized Collection of Race/Ethnicity Data for Healthcare Quality Improvement
recommends using the Office of Management and Budget (OMB) race and Hispanic ethnicity categories (Asian,
Black or African American, Native Hawaiian or Other Pacific Islander, White, American Indian or Alaska Native,
and Hispanic or Latino) and using a national standard set of granular ethnicity categories based on ancestry. Not
all entities collecting data will include the comprehensive list of granular ethnicity categories in their databases
or on their data collection instruments as the categories most important for collection by a health plan in Boston
might differ from the categories important for collection by a health system in rural Missouri. These entities can
select whatever number of locally relevant categories from the national standard set to present as pre-specified
categories for check-off of responses; local lists should also be capable of identifying other ethnicities for all who
wish to self-identify by including an open-ended choice of “Other, please specify: __.” The subcommittee believes
it is important to supplement the OMB categories by collecting granular ethnicity data and to retain these in data
systems so that more detailed analysis and reporting is possible than with the current OMB categories. The number
of categories any entity finds necessary for analysis will vary according to the composition of the population being
served or studied, whether the size of subgroups is sufficiently large to make statistically reliable comparisons, and
whether the pattern of differences experienced by subgroups identifies distinct needs that are not already revealed
by data aggregated into broader categories.
The national standard set must be comprehensive of the nation’s population to ensure the capture of even small,
geographically isolated population groups that would potentially be important in specific locales for analyses and
the provision of culturally and linguistically appropriate care. Furthermore, the set must be responsive to changing
demographic trends and thus must be regularly updated.
DEVELOPMENT OF THE TEMPLATE
The subcommittee did not identify a single existing category list believed to be comprehensive enough to serve
as a national, standard set. For example, as discussed in Chapter 3, the Centers for Disease Control and Prevention
(CDC)/Health Level 7 (HL7) Race and Ethnicity Code Set 1.0 does not include all relevant granular ethnicities.
It does not, for instance, include Somali or Russian. The Massachusetts Superset was developed partially because
of these noted absences in the CDC/HL7 Code Set and includes granular ethnicities that are locally relevant to
the Commonwealth of Massachusetts. Demographic distributions confirm that there may be ethnic groups present
1
14
RACE, ETHNICITY, AND LANGUAGE DATA
across the country that may not have a large presence in Massachusetts (e.g., Navajo, which may be of importance in Arizona). Thus, the subcommittee concluded that the Massachusetts Superset provides an ample, but not
complete, set of granular ethnicity categories. Similarly, the Kaiser Permanente Granular Ethnicity Code Set was
determined to be representative of many, but perhaps not all, granular ethnicities.
To capture all of the granular ethnicities represented in the United States, the subcommittee reviewed the
Census Bureau’s Ancestry Code List. The Census Ancestry Code List is compiled from responses to the Census’
open-ended ancestry question, which allows respondents to write in their lineage or ancestry.1 Thus, the list includes
a myriad of granular ethnicity categories, ranging from Hausa, an ethnic group in northern Nigeria, to more general
responses of European and American.
The CDC/HL7 Code Set, Massachusetts Superset, Census Ancestry Code List, and Kaiser Permanente
Granular Ethnicity Code Set interchangeably use country or place names to indicate ethnicities (i.e., Singapore to
represent Singaporean). The subcommittee revised the list to represent categories with ethnicities as opposed to
places, whenever possible; this is reflected in the subcommittee’s template (Table E-1).
The CDC/HL7 Code Set includes an extensive list of American Indian or Alaska Native categories and codes.
Thus, the CDC/HL7 Code Set may serve as the template from which entities can choose locally relevant tribal
categories and codes. The Census Ancestry Code list does not include American Indian or Alaska Native tribes.
The Massachusetts Superset and the Kaiser Permanente Granular Ethnicity Code Set both include limited lists of
locally relevant tribes.
ADAPTION OF THE TEMPLATE TO A NATIONAL STANDARD LIST
The subcommittee presents a cumulative list of granular ethnicity categories from different sources (Table E-1)
that may serve as a template from which the Department of Health and Human Services (HHS) should develop a
national standard list of granular ethnicity categories with accompanying unique codes (Recommendation 6-1a).
Some of these granular ethnicities have already been assigned permanent five-digit unique numerical codes by
CDC/HL7. The remaining granular ethnicities included in the subcommittee template also need permanent fivedigit unique numerical codes.
To indicate which categories and codes may be similar, the Public Use Microdata Sample File (PUMS) considers some Census ancestry codes to have “corresponding detailed ancestry codes” (i.e., Hausa may be said to
correspond with Nigeria).2 The subcommittee concluded that because of the large number of very specific ethnicities included on the Census Ancestry Code List, some ethnicities would be best presented as corresponding with
others. Corresponding ethnicities are indicated in Table E-1 using indents. When HHS is developing codes for the
granular ethnicity categories included in this template (per Recommendation 6-1a), corresponding ethnicities may
have the same codes (i.e., one or more granular ethnicity categories may have the same code).
ROLLUP TO THE OMB RACE AND HISPANIC ETHNICITY CATEGORIES
Locally tailored quality improvement activities may target granular ethnicity groups without needing to relate
those groups to a single OMB race category. Collecting race, Hispanic ethnicity, and granular ethnicity data separately, as the subcommittee recommends, allows reporting of the OMB categories when necessary without requiring
rollup of the granular ethnicities, provided that individuals respond to all the questions asked. Nonetheless, the
subcommittee recognizes that data collected under some circumstances (e.g., a reporting request for OMB-level
data where only granular ethnicity is collected) cannot be used or compared with data collected using the OMB
race and Hispanic ethnicity categories without the use of a rollup scheme to link granular ethnicities to the OMB
categories. To examine both the feasibility and limitations of such schemes, the subcommittee mapped in Table E-1
1
The CDC/HL7 Code Set was developed using write-in responses to the Census questions on race and Hispanic ethnicity, not responses to
the Census ancestry question. The Census ancestry list is more comprehensive than the list used to develop the CDC/HL7 Code Set.
2 U.S. Census Bureau. 2007. ACS 1-year PUMS code lists: Ancestry codes. http://www.census.gov/acs/www/Products/PUMS/C2SS/
CodeList/2007/Ancestry.htm (accessed June 23, 2009).
APPENDIX E
1
granular ethnicity responses collected from the ancestry question on Census 2000 to the OMB race and Hispanic
ethnicity categories. Table E-1 uses the existing CDC/HL7 rollup scheme as a basis; the subcommittee tested the
assumptions of those OMB category assignments with responses to the Census race and Hispanic ethnicity questions to determine if 90 percent of respondents giving a specific ancestry response identified with the category to
which the CDC/HL7 rollup scheme assigns them.
For most granular ethnicity categories, 90 percent or more of respondents to Census 2000 did self-identify with
the OMB category to which the CDC/HL7 rollup would assign them. However, Appendix F identifies a number
of granular categories that do not meet the 90 percent threshold, and thus would have “no determinate OMB race
classification” if this threshold was adopted. An analyst wanting to roll up the categories in Appendix F to an OMB
race group or Hispanic origin would have to defer to existing OMB and Census definitions based on geographic
ancestry (see Table 1-1 in Chapter 1 of the report). While many granular ethnicities can be mapped to the OMB
Hispanic ethnicity category based on the existing CDC/HL7 roll-up, none of the granular ethnicities associated with
the Hispanic ethnicity category can be assigned to an OMB race category with greater than 90 percent certainty. In
addition, high percentages of persons who report an American Indian or Alaska Native ancestry have been known
to identify as White, multiracial, or “Some Other Race” (see discussion of American Indian or Alaska Natives in
Chapter 2). Similarly, substantial portions of respondents who report a Pacific Islander ancestry identify with a race
besides with the Native Hawaiian or Other Pacific Islander race category. The tribal groups and Pacific Islander
groups have been left by the subcommittee in the American Indian or Alaska Native and Native Hawaiian or Other
Pacific Islander race categories, respectively rather than move them to a “no determinate OMB race classification.”
There was insufficient data to apply the 90 percent rule to all the individual subcategories under those headings.
Analysts should understand that making an assignment using a 90 percent (or any other percent) threshold
or an assignment based solely on geography incurs a higher probability that the rollup assignment misclassifies
individuals based upon how they would self-identify their race when asked directly about their race. The rates
of misclassification, even for granular ethnicities meeting a 90 percent threshold, underscores the fact that rollup
schemes only provide probabilistic assignments useful for analysis at the group or population level, and should
never be used to assign an actual race to an individual’s medical record.
Entities may, in some instances, want to aggregate granular ethnicity categories into broader ethnicity categories for analysis or to meet reporting requirements (e.g., aggregating all western European granular ethnicities
into a broad “Western European” category). However, the granular ethnicity data should be retained in data systems when the data are shared and for use in future analysis, reporting, and service provision. The subcommittee
notes that the Census ancestry code list groups ethnicities partially by geography (e.g., Western European [sans
Spanish], South Asian, Sub-Saharan African) and partially by Hispanic ethnicity (e.g., Spanish, Central and South
American, and West Indian).3 The Massachusetts Superset includes 31 broader ethnicity categories and 140 subethnicity categories. The sub-ethnicity categories can be aggregated to the broader ethnicity categories as needed
for reporting and analysis. The subcommittee concluded though that these mid-level groups should not necessarily
collapse into the OMB race categories.
The list of granular ethnicities presented below provides a baseline template for a national standard set of
granular ethnicity categories. An entity can decide, based on local circumstances, whether to use 10 or 100 categories from the template for collection and/or analysis. If the entity sees an increase in the use of the “Other, please
specify: __” option, it may consider adding categories to its local list. If an organization chooses not to have a
preset list of categories, it will need to compile responses according to the template to ensure comparability with
data collected by other entities.
3
U.S. Census Bureau. 2001. Ancestry code list. http://factfinder.census.gov/metadoc/ancestry.pdf (accessed June 18, 2009).
16
RACE, ETHNICITY, AND LANGUAGE DATA
TABLE E-1 Template of Granular Ethnicity Category Lists and Coding Schemes with Rollup to the OMB
Race and Hispanic Ethnicity Categories
OMB Race and Hispanic
Ethnicity Category
Granular Ethnicity
Asian
Asian Indian
Kashmir
Andaman Islander
Andhra Pradesh
Assamese
Goanese
Gujarati
Karnatakan
Keralan
Madhya Pradesh
Maharashtran
Madras
Mysore
Nagaland
Orissa
Pondicherry
Rajasthan
Sikkim
Tamil Nadu
Uttar Pradesh
Bhutanese
Baram/Burman
Chinese
Manchurian
Taiwanese
Tagalog
Japanese
Issei
Nisei
Sansei
Vonsei
Gonsei
Okinawan
Iwo Jiman
Korean
Vietnamese
Katu
Ma
Mnong
Kihn/Viet
Hmong
Malay
Maldivian
Singaporean
Punjab
Cantonese
CDC/HL7 Race
and Ethnicity
Code Set 1.0
Massachusetts
Superseta
2028-9
2029-7
X
Xa
2031-3
X
2034-7
Xa
2035-4
X
2039-6
Xa
Census
Ancestry
Codesb
X
X
X
X
X
X
X
X
X
X
X
X
X
X
X
X
X
X
X
X
X
X
X
X
X
X
X
X
X
X
X
X
2043-8
2048-7
2040-4
2047-9
Xa
Xa
X
X
X
X
X
2037-0
X
X
2049-5
2051-1
X
X
X
X
X
X
Kaiser
Permanente
Granular
Ethnicity Code
Setc
X
X
X
X
X
X
X
X
X
X
X
X
X
1
APPENDIX E
TABLE E-1 Continued
OMB Race and Hispanic
Ethnicity Category
Granular Ethnicity
Mongolian
Tibetan
Hong Kong
Macao
Ryukyu Islander
North Bornean
Formosan
Montagnard
Indo Chinese
Amerasian
Kazakh/Qazaq
Kazakhstani
Bangladeshi
Nepalese/Nepali
Bengali
Pakistani
Sri Lankan
Singhalese/Sinhalese
Veddah
Burmese
Shan
Cambodian
Khmer
Filipino
Indonesian
Bornean
Javanese/Jawa
Sumatra
Laotian/Lao
Meo
Lao Loum/Lowland Lao
Malaysian
Thai
Black Thai
Western Lao
Black or African
American
Black
African American
African
Botswanan
Djibouti
Liberian
Namibian
Nigerian
Fulani/Hausa
Ibo/Igbo
CDC/HL7 Race
and Ethnicity
Code Set 1.0
Massachusetts
Superseta
Census
Ancestry
Codesb
Kaiser
Permanente
Granular
Ethnicity Code
Setc
X
X
X
X
X
X
X
X
X
X
2030-5
2050-3
X
X
2044-6
2045-3
X
X
2032-1
X
2033-9
Xa
2036-2
2038-8
Xa
X
2041-2
Xa
2042-0
2046-1
X
X
2054-5
X
2056-0
2058-6
2060-2
2061-0
X
Xa
Xa
X
X
X
X
X
2063-6
2064-4
2065-1
X
X
X
X
X
X
X
X
X
X
X
X
X
X
X
X
X
X
X
X
X
X
X
X
X
X
X
X
X
X
X
X
X
X
X
X
X
X
X
X
X
X
X
X
X
X
X
X
X
X
X
X
X
X
continued
1
RACE, ETHNICITY, AND LANGUAGE DATA
TABLE E-1 Continued
OMB Race and Hispanic
Ethnicity Category
Granular Ethnicity
Tiv
Voruba
Zairean
Angolese
Benin
Burkina Faso
Burundi
Cameroonian
Central African Republic
Chad
Comoros
Congolese
Ivoirian/Cote d’Ivoire
Equatorial Guinea
Eritrean
Gabon
Gambian
Ghanaian/Ghanian
Guinea
Guinea-Bissau
Lesotho
Libyan
Malawi
Mali
Mauritanian
Mauritius
Mozambique
Reunion
Rwanda
Sao Tome and Principe
Senegalese/Senegal
Seychelles
Afrikaner
Natalian
Swazi
Tanzanian
Togolese
Ugandan
Western Sahara
Zambian
Zimbabwean
Congo Brazzaville
Corsico Islander
Niger
Zulu
Tanganyikan
CDC/HL7 Race
and Ethnicity
Code Set 1.0
2066-9
Massachusetts
Superseta
X
X
X
X
X
X
X
X
X
X
X
X
X
X
X
X
X
X
X
X
X
X
X
X
X
X
X
X
X
X
X
X
X
X
X
X
X
Census
Ancestry
Codesb
X
X
X
X
X
X
X
X
X
X
X
X
X
X
X
X
X
X
X
X
X
X
X
X
Kaiser
Permanente
Granular
Ethnicity Code
Setc
X
X
X
X
X
X
X
X
X
X
X
X
X
X
X
X
X
X
X
X
X
X
X
X
19
APPENDIX E
TABLE E-1 Continued
OMB Race and Hispanic
Ethnicity Category
Granular Ethnicity
Zanzibar Islander
Upper Voltan
Volta
African Islander
Central African
Eastern African
Western African
Agikuyu/Kikuyu
Akan
Amara/Amhara
Bantu
Mende
Oromo
Shona
Temne/Temme/Themne
Tigrinya/Tigray/Tigraway
Barbadian/Bajan
Dominica Islander
Bermudan
Cayman Islander
U.S. Virgin Islander
St Croix Islander
St John Islander
St Thomas Islander
French West Indies
Guadeloupe Islander
Cayenne
Caribbean Islander
Antiguan/Burbudan
Nevis Islander/
Kittitian/Nevisian
Grenadian
Vincent-Grenadine Islander
St Lucia Islander/
Saint Lucian
Afro
Bahamian
Jamaican
Haitian
Tobagoan
Ethiopian
Kenyan
Sierra Leonean
Somali
CDC/HL7 Race
and Ethnicity
Code Set 1.0
Massachusetts
Superseta
Census
Ancestry
Codesb
Kaiser
Permanente
Granular
Ethnicity Code
Setc
X
X
X
X
X
X
X
2068-5
2070-1
X
X
X
X
X
X
X
X
X
X
X
X
X
X
X
X
X
X
X
X
X
X
Xa
X
2067-7
2072-7
2071-9
2073-5
2062-8
X
Xa
X
X
X
X
X
X
X
X
X
X
X
X
X
X
X
X
X
X
X
X
X
X
X
X
X
continued
190
RACE, ETHNICITY, AND LANGUAGE DATA
TABLE E-1 Continued
OMB Race and Hispanic
Ethnicity Category
Granular Ethnicity
Native Hawaiian or
Other Pacific Islander
Polynesian
Kapingamarangan
Maori
Native Hawaiian/Hawaiian
Part Hawaiian
Samoan
Tahitian
Tongan
Tokelauan
Micronesian
Other Pacific Islander
Guamanian or Chamorro
Guamanian
Chamorro
Mariana Islander
Marshallese
Palauan
Carolinian
Kosraean
Pohnpeian/Ponapean
Saipanese
Kiribati/Kirabatese
Chuukese/Trukese
Yapese
Melanesian
Fijian
Papua New Guinean
New Guinean
Papuan
Solomon Islander
New Hebrides
Australian
Tasmanian
Australian Aborigine
New Zealander
Cook Islander
Niuean
Nauruan
Tarawa Islander
Tinian Islander
New Caledonian
Vanuatuan
Chamolinian
CDC/HL7 Race
and Ethnicity
Code Set 1.0
Massachusetts
Superseta
2076-8
X
2078-4
Census
Ancestry
Codesb
Kaiser
Permanente
Granular
Ethnicity Code
Setc
X
2079-2
X
X
X
X
2080-0
2081-8
2082-6
2083-4
2085-9
2500-7
X
X
X
X
X
X
2087-5
2088-3
2089-1
2090-9
2091-7
2092-5
2093-3
2094-1
2095-8
2096-6
2097-4
2098-2
2100-6
2101-4
2102-2
X
X
X
X
X
X
X
X
X
2103-0
2104-8
X
X
X
X
X
X
X
X
X
X
X
X
X
X
X
X
X
X
X
X
X
X
X
X
X
X
X
X
X
191
APPENDIX E
TABLE E-1 Continued
OMB Race and Hispanic
Ethnicity Category
Granular Ethnicity
CDC/HL7 Race
and Ethnicity
Code Set 1.0
Massachusetts
Superseta
White
2106-3
X
2108-9
Xa
2110-5
X
Anglo
European
Central European
Southern European
English
British/Briton
Channel Islander
Gibraltar
British Isles/
British Isles origin
Portuguese
Cornish
Appalachian
Pennsylvania German
Canadian
Newfoundland
Nova Scotia
French Canadian
Acadian/Cajun
North American
French
Lorraine
Breton
Occitan
German
Bavaria
Berlin
Hamburg
Hannover
Hessian
Lubecker
Pomeranian
Saxon
Sudetenlander
Westphalian
East German
West German
Prussian
Irish
North Irish
Italian
Trieste
Abruzzi
Apulian
Basilicata
Xa
2111-3
X
2112-1
X
2113-9
X
2114-7
X
Census
Ancestry
Codesb
X
X
X
X
X
X
X
X
X
Kaiser
Permanente
Granular
Ethnicity Code
Setc
X
X
X
X
X
X
X
X
X
X
X
X
X
X
X
X
X
X
X
X
X
X
X
X
X
X
X
X
X
X
X
X
X
X
X
X
X
X
X
X
X
X
X
X
X
X
X
X
continued
192
RACE, ETHNICITY, AND LANGUAGE DATA
TABLE E-1 Continued
OMB Race and Hispanic
Ethnicity Category
Granular Ethnicity
Calabrian
Amalfin
Friulian
Emilia Romagna
Rome
Ligurian
Lombardian
Marche
Molise
Neapolitan
Piedmontese
Puglia
Sardinian
Tuscany
Trentino
Umbrian
Valle Daost
Venetian
San Marino
Ladin
Sicilian
Herzegovinian
Polish/Pole
Kashubian
Scottish
Greek
Cretan
Cyclades
Basque
French Basque
Spanish Basque
Azores Islander
Madeira Islander
Alsatian
Andorran
Austrian
Tirol
Belgian
Walloon
Scotch Irish
Flemish/Fleming
Corsican
Cypriot
Greek Cypriot
Turkish Cypriot
Danish/Dane
Faeroe Islander
CDC/HL7 Race
and Ethnicity
Code Set 1.0
2115-4
2116-2
2146-9
Massachusetts
Superseta
X
X
X
X
Census
Ancestry
Codesb
X
X
X
X
X
X
X
X
X
X
X
X
X
X
X
X
X
X
X
X
X
X
X
X
X
X
X
X
X
X
X
X
X
X
X
X
X
X
X
X
X
X
X
X
X
X
X
Kaiser
Permanente
Granular
Ethnicity Code
Setc
X
X
X
X
X
X
X
X
X
X
X
X
19
APPENDIX E
TABLE E-1 Continued
OMB Race and Hispanic
Ethnicity Category
Granular Ethnicity
Dutch
Frisian
Norwegian
Finnish/Finn
Karelian
Icelander
Lapp
Liechtensteiner
Luxemburger
Maltese
Manx
Monegasque
Swedish/Swede
Aland Islander
Swiss
Suisse
Switzer
Romansch
Suisse Romane
Welsh
Scandinavian
Celtic
Northern European
Western European
Bukovina
Silesian
Galician
Eastern European
Carpatho Rusyn
Carpathian
Rusyn
Albanian
Azerbaijani
Azeri
Belorussian/Belarusian
Bosniak
Bulgarian
Croatian/Croat
Czech
Moravian
Czechoslovakian
Georgian
Estonian
Livonian
Hungarian
Magyar
Latvian
CDC/HL7 Race
and Ethnicity
Code Set 1.0
Massachusetts
Superseta
Xa
X
X
X
X
X
X
X
X
X
Census
Ancestry
Codesb
X
X
X
X
X
X
X
X
X
X
X
X
X
X
X
X
X
X
X
X
X
X
X
X
X
X
X
X
X
X
X
X
X
X
X
X
X
X
X
X
X
X
X
X
Kaiser
Permanente
Granular
Ethnicity Code
Setc
X
X
X
X
X
X
X
X
X
X
X
X
X
X
X
X
X
X
X
X
X
X
X
X
X
X
X
continued
194
RACE, ETHNICITY, AND LANGUAGE DATA
TABLE E-1 Continued
OMB Race and Hispanic
Ethnicity Category
Granular Ethnicity
Lithuanian
Macedonian
Montenegrin
Romanian
Moldavian
Bessarabian
Wallachian
Serbian
Slovak
Slovene
Sorbian/Wend
Ukrainian
Lemko
Bioko
Husel
Russian
Muscovite
Ruthenian
Cossack
Bohemian
Finno Ugrian
Mordovian
Voytak
Gruziia
Soviet Turkic
Volga
Kalmyk
North Caucasian
North Caucasian Turkic
Ossetian
Bashkir
Chuvash
Gagauz
Mesknetian
Tuvinian
Yakut
Soviet
Tatar
Soviet Central Asia
Turkestani
Uzbeg/Uzbek
Uzbekistani
Lebanese
Windish
Yugoslavian
Slavic
Tajik
Slavonian
CDC/HL7 Race
and Ethnicity
Code Set 1.0
Massachusetts
Superseta
X
X
X
X
X
X
X
X
X
Xa
2123-8
X
Census
Ancestry
Codesb
X
X
X
X
X
X
X
X
X
X
X
X
X
X
X
X
X
X
X
X
X
X
X
X
X
X
X
X
X
X
X
X
X
X
X
X
X
X
X
X
X
X
X
X
X
X
X
Kaiser
Permanente
Granular
Ethnicity Code
Setc
X
X
X
X
X
X
X
X
X
X
X
X
X
X
X
X
19
APPENDIX E
TABLE E-1 Continued
OMB Race and Hispanic
Ethnicity Category
Granular Ethnicity
Middle Eastern or
North African
Syrian
Baluchistan
Pathan/Pashtun
Israeli
Algerian
Transjordan
Kurdish/Kurd
Persian
North African
Alhucemas
Berber/Amazigh/
Imazighen
Rio de Oro
Bahraini
Kuwaiti
Omani
Qatar
Saudi/Saudi Arabian
Muscat
Trucial States
Bedouin
Kuria Muria Islander
South Yemen
Aden
United Arab Emirates/
Emirati
Rom
Afghanistani/Afghan/
Afghani
Dutch West Indian
Egyptian
Iranian
Iraqi
Jordanian
Armenian
Turkish/Turk
Yemeni
Palestinian
Gaza Strip
West Bank
Syriac
Assyrian
Chaldean
Mideast
Arab/Arabic
CDC/HL7 Race
and Ethnicity
Code Set 1.0
Massachusetts
Superseta
2118-8
Xa
2125-3
X
2127-9
X
X
Census
Ancestry
Codesb
X
X
X
X
X
X
X
Kaiser
Permanente
Granular
Ethnicity Code
Setc
X
X
X
X
X
X
X
X
X
X
X
X
X
X
X
X
X
X
X
X
X
X
X
X
X
X
X
X
X
X
X
X
2126-1
X
2120-4
2121-2
2122-0
2109-7
X
X
X
X
X
2124-6
X
X
2119-6
X
2129-5
X
X
X
X
X
X
X
X
X
X
X
X
X
X
X
X
X
X
X
X
X
X
X
X
X
X
X
X
X
X
X
X
continued
196
RACE, ETHNICITY, AND LANGUAGE DATA
TABLE E-1 Continued
OMB Race and Hispanic
Ethnicity Category
Granular Ethnicity
American Indian or
Alaska Native
American Indian
Alaska Native
Alaska Indian
CDC/HL7 Race
and Ethnicity
Code Set 1.0
Massachusetts
Superseta
1002-5
X
1004-1
553 additional
categories
1735-0
1737-6
271 additional
categories
X
Census
Ancestry
Codesb
Kaiser
Permanente
Granular
Ethnicity Code
Setc
52 additional
categories
X
X
7 additional
categories
No determinate OMB
race classification
Brazilian
Cape Verdean
Belizean
Guyanese
German from Russian
Creole
American
Madagascan
Tunisian
Surinam
Trinidadian
West Indian
British Virgin Islander
British West Indian
Moroccan
Dominican
South African
Sudanese
Dinka
Nuer
Fur
Baggara
East Indian
Eurasian
Hispanic or Latino
Xa
Xa
X
X
2052-9
2074-3
2075-0
2069-3
Xa
X
X
X
X
X
Xa
X
X
X
X
X
X
X
X
X
X
X
X
X
X
X
X
X
X
X
X
X
X
X
X
X
X
X
X
X
X
X
X
X
X
X
X
X
X
X
X
X
2135-2
Latin American
Latino
Hispanic
Californio
Tejano
Nuevo Mexicano
Spanish American
Spanish/Spaniard
Andalusian
Asturian
Castillian
Catalonian
2137-8
2138-6
2139-4
2140-2
2141-0
X
X
X
X
X
X
X
X
X
X
X
X
X
X
19
APPENDIX E
TABLE E-1 Continued
OMB Race and Hispanic
Ethnicity Category
Granular Ethnicity
Belearic Islander
Gallego
Valencian
Canarian
Salvadoran
Central American
Costa Rican
Nicaraguan
Panamanian
Canal Zone
Central American Indian
Guatemalan
Honduran
Mexican
La Raza
Mexican American
Mexicano
Chicano
Mexican American Indian
Mexican State
South American
Argentinean/Argentine
Bolivian
Chilean
Colombian
Ecuadorian
Paraguayan
Peruvian
Uruguayan
Venezuelan
South American Indian
Criollo
Puerto Rican
Cuban
Other ethnicity
CDC/HL7 Race
and Ethnicity
Code Set 1.0
2142-8
2143-6
2144-4
2145-1
2161-8
2155-0
2156-8
2159-2
2160-0
2163-4
2162-6
2157-6
2158-4
2148-5
2152-7
2149-3
2150-1
2151-9
2153-5
2165-9
2166-7
2167-5
2168-3
2169-1
2170-9
2171-7
2172-5
2173-3
2174-1
2175-8
2176-6
2180-8
2182-4
2131-1
Massachusetts
Superseta
Xa
Xa
X
X
X
X
Xa
Xa
Xa
X
X
X
X
X
Xa
Xa
X
Xa
Xa
Xa
Census
Ancestry
Codesb
X
X
X
X
X
X
X
X
X
X
X
X
X
X
X
X
X
X
X
X
X
X
X
X
X
X
X
X
X
X
X
X
X
X
Kaiser
Permanente
Granular
Ethnicity Code
Setc
X
X
X
X
X
X
X
X
X
X
X
X
X
X
X
X
X
X
X
X
X
a The Massachusetts Superset includes 31 ethnicity categories and additional “sub-ethnicities” that are not required for reporting but
that an organization can collect, if useful. Acute care hospitals and health plans are required to report the basic OMB race categories
along with the 31 granular ethnicity categories noted in this table with a footnote (a).
b The Census Ancestry codes do not roll up to the OMB race and Hispanic ethnicity categories. There are grouped into more broad
categories based on geography: Western Europe, Eastern Europe and Soviet Union, Europe, Hispanic (including Spain), West Indies
(except Hispanic), Central and South America (except Hispanic), sub-Saharan African, South Asia, Other Asia, Pacific, and North
America (except Hispanic).
c The Kaiser Permanente list also includes “Jew/Jewish.”
Appendix F
Granular Ethnicities with No Determinate
OMB Race Classification
The Subcommittee recommends collecting an individual’s Hispanic ethnicity, race, and granular ethnicity.
Separate questions to collect these data ensure the ability to report Office of Management and Budget (OMB)compliant data without needing to aggregate granular ethnicity categories back to one of the six OMB categories
(e.g., an individual can self-identify as Asian, non-Hispanic, and of Laotian ancestry and all of these data should be
retained in a data system). Nevertheless, in some instances, granular ethnicity data may need to be rolled up to one
of the OMB categories for purposes of analysis or reporting. For example, an individual may not have responded
to the question on race and only responded to the question on granular ethnicity. If the individual’s health plan is
required to report data to the state using only the OMB race and Hispanic ethnicity categories, the health plan may
want to aggregate the individual’s granular ethnicity to an OMB category, whenever possible.
Aggregating data to the OMB race categories through rollup schemes, though, may inevitably contradict
or misrepresent an individual’s self-identification as not all Americans of South African descent are Black, for
example. An individual’s granular ethnicity does not automatically determine his or her race; consequently, any
rollup scheme may falsely classify some individuals. Certain granular ethnicity categories are more prone to misclassification than others, primarily because several individual races as well as multiracial persons are represented
within a single ethnicity.
The subcommittee identified some of these ethnicities by cross-tabulating write-in responses to Census ancestry
data by the OMB single-race and Hispanic ethnicity categories. Since many of the ethnicity groups had large proportions of individuals who reported more than one race, the subcommittee then cross-tabulated the ancestry responses
with “alone or in combination with one or more other races” variable for each OMB group to see if 90 percent or
more in the ethnicity group reported an OMB race either alone or in combination with another race. 1 Many of the
granular ethnicities that fell short of a 90 percent threshold based on single-race reporting exceeded that threshold
when the identification was based on reporting the race group alone or in combination with other races.
Many of the granular ethnicity categories that still could not be assigned to an OMB race category using the
90 percent threshold for responses “alone or in combination” represented populations with long histories of intermarriage and multiracial identity (e.g., Native Hawaiian or Other Pacific Islander, American Indian or Alaska
1
The 90 percent rule used in this analysis is not the only method for identifying granular ethnicity categories that cannot or should not
be rolled up to one of the OMB categories. Census 2010, for example, is, when necessary, rolling up write-in responses based on the OMB
definitions of each race and Hispanic ethnicity category. Then, all sub-Saharan African ethnicities will be coded as Black, where necessary
for analysis.
199
200
RACE, ETHNICITY, AND LANGUAGE DATA
Native). These granular ethnicity categories could be assigned to the OMB race category of the same name on the
basis of the OMB definitions for the Native Hawaiian or Other Pacific Islander and American Indian or Alaska
Native categories. However, it is important to note that this assignment misclassifies many individuals based on
the OMB race with which they would self-identify given the opportunity.
Additionally, Table F-1 includes granular ethnicities that are rolled up differently by different coding schemes.
For example, the Centers for Disease Control and Prevention (CDC)/Health Level 7 (HL7) Race and Ethnicity
Code Set 1.0 considers Madagascan in its Asian category while the Massachusetts Superset considers Madagascan
under both Asian and African category. Thus, this ethnicity is included in Table F-1 and may be said to have “no
determinate OMB race classification.”
The subcommittee suggests that the Department of Health and Human Services (HHS) take into account that
some ethnicities do not correspond with one specific OMB race category and that when rollup is necessary, these
granular ethnicities be included in a category labeled “no determinate OMB race classification.”
TABLE F-1 Granular Ethnicities That Cannot Be Rolled Up to an OMB Race Category with Greater Than
90 Percent Certainty
OMB race categories (% of the population)
Write-in
Response to
Census Ancestry
Question
Brazilian
Cape Verdean
Belizean
Guyanese
German from
Russia
Creole
American
Madagascan*
Tunisian*
Surinam*
Trinidadian
West Indian
Moroccan
Dominican
South African
Sudanese
East Indian
Eurasian
Population
White
Alone or in
Combination
Black or
African
American
Alone or in
Combination
AIAN
Alone or in
Combination
Asian
Alone or in
Combination
NHOPI
Alone or in
Combination
Some Other
Race Alone or
in Combination
177,483
76,476
38,443
162,170
9,968
77.3
15.7
14.4
3.1
75.8
3.3
45.4
66.1
58.2
42.7
0.4
2.0
3.2
3.1
1.9
0.2
0.8
1.2
23.1
0.4
0.0
0.9
0.8
1.0
0.1
30.3
58.4
27.1
26.6
3.6
18,821
19.3
73.2
5.1
0.8
0.0
27.5
160,715
152,218
37,219
915,208
43,472
13,420
61,510
12,473
4.4
6.9
76.5
30.0
86.5
5.6
8.5
68.8
88.8
87.1
17.4
14.8
9.0
79.7
10.9
0.6
1.4
3.4
1.3
1.5
0.1
0.3
2.9
1.5
8.0
3.1
4.8
0.9
2.1
1.1
83.1
40.0
1.2
2.0
0.3
0.3
0.0
0.0
2.1
2.0
9.3
17.4
25.7
62.3
7.9
28.8
15.2
27.3
* The granular ethnicities marked with an asterisk do not include percents of the population because the population size was too small
for analysis in the 2000 Public Use Microdata Samples (PUMS).
Appendix G
Kaiser Permanente: Evolution of Data Collection on
Race, Ethnicity, and Language Preference Information
201
202
RACE, ETHNICITY, AND LANGUAGE DATA
Evolution of Data Collection on Race, Ethnicity, and Language Preference Information
June, 2009
Introduction
Kaiser Permanente is nationally recognized for its innovation and groundbreaking initiatives
in health care. Over the years, we have continuously assessed the needs of our membership
and public community, and proactively designed programs and solutions to meet the new
challenges. Race, Ethnicity, and Language Data Collection underscores our commitment
toward the elimination of health disparities and inequities for racial, ethnic, and linguistic
groups.
Kaiser Permanente Policy
With the advocacy and leadership of our National Diversity Council, the Member
Demographic Data Collection Initiative on Race, Ethnicity, and Language preference
information became an organizational policy in 2004.
The objectives of the policy extend beyond collecting information for compliance reasons; it
is intended to inform patient-centered care, culturally and linguistically competent care and
services, and the elimination of health and health care disparities/inequities. Timely, valid,
and representative data collection is essential to the provision of quality and equitable care.
Data Collection Improvement Process
As our commitment to continuous quality improvement, Kaiser Permanente National
Diversity recommended several updates and modifications for KP HealthConnect, our
electronic medical/health record system. These accepted recommendations are based on
research and collaborative input from various stakeholders and constituents to improve
Race, Ethnicity, and Language data collection.
During the initial phase of data collection, we utilized an approach that was common
throughout the industry, which was to ask for the Office of Management and Budget (OMB)
federal ‘Race’ and ‘Ethnicity’* categories. We addressed the need to identify diverse subpopulations by also including a limited number of detailed groups.
At that juncture, our technical systems were not designed to house granular information
separately on subpopulation groups, therefore, granular descriptions were coupled to the
OMB federal standards to accommodate compliance and reporting needs.
During initial implementation, important concerns were raised, which included the following:
*
x
The need for more granular categories for ethnicity
x
The feedback that Hispanic/Latino patients felt uncomfortable
selecting ‘Race’ categories that they may not identify with
x
The issue of coupling of federal standards to granular information did
not allow for self-identification
‘Race’ in quotes refers to the federal OMB defined race standards. ‘Ethnicity’ in quotes refers to the federally
defined OMB ethnicity standards.
© Copyright 2009, Kaiser Foundation Health Plan, Inc.
Page 1
20
APPENDIX G
Evolution of Data Collection on Race, Ethnicity, and Language Preference Information
June, 2009
To address these concerns, in 2005, our National Diversity office undertook a
comprehensive assessment, review, and analysis of industry collection standards, practices,
and lessons learned as well as integrating notable work and contributions from the fields of
public health, sociology, law, race relations, journalism, demography, and statistics.
During this assessment for quality improvement, collective discovery concluded that a new
collection framework was needed. We explored and were able to identify technological
innovations in our electronic medical/health record system that offered viable options in
how the data fields and code sets could be built to accommodate the proposed changes.
We seized the opportunity to improve data collection by 1) further understanding the
constructs of Race, Ethnicity, and Language as well as their intersections in-depth and 2)
developing organizational structure, decision making processes, and guiding principles that
would advance uniform, standardized, and systematic data collection.
Code Selection Process
The Race, Ethnicity, and Language Code Sets that were developed represent the first phase
of Kaiser Permanente’s Member Demographic Data Collection Initiative on Race, Ethnicity,
and Language. Our Code Sets are open and responsive to accommodate preferred selfidentification as well as changes in national/international developments and demographic
trends.
Granular Ethnicity
Kaiser Permanente examined the significance of ethnicity in the context of health, and
concluded that the creation of a more encompassing definition of Ethnicity was needed.
Granular Ethnicity would be able to capture patient data at a level that would inform beyond
the limited federal standards to ensure timely, valid, and representative data collection.
The Code Sets are reviewed on an on-going basis primarily to ensure alignment with
changing demographic trends in the United States as well as relevance in culturally and
linguistically competent care and patient-centered care.
Ongoing Analysis and Review for Comparability (Selected Examples Provided)
National Data Sets and Resources
x U.S. Decennial Census/American Community Survey
x Yearbook of Immigration Statistics
Health Surveys and Research (Population or Region Specific)
x California Health Interview Survey
x National Latino and Asian American Study
Transnational and International Data Sets and Resources
x United Nations Statistics Division
x World Health Organization
© Copyright 2009, Kaiser Foundation Health Plan, Inc.
Page 2
204
RACE, ETHNICITY, AND LANGUAGE DATA
Evolution of Data Collection on Race, Ethnicity, and Language Preference Information
June, 2009
Data Aggregation (Roll-Up)
Kaiser Permanente’s collection framework is asking the two part question separately
(Combined Format and Granular Ethnicity), thereby eliminating the need/use of automatic
linkage and data aggregation (commonly known as “roll-up”). Data aggregation should be
specific to the research and/or reporting needs for the population groups under
study/report.
Automatic linkage or aggregation would produce deteriorated or inaccurate data if patients
are linked/aggregated in a way that contradicts or misrepresents their personal selfidentification, especially for multiracial persons who identify with more than one federal
‘Race’/’Ethnicity’ standard.
The effects of globalization, population displacement, and social movements are
undermining the capacity of one nation to fix a person's identity. Simply, national or
geographic origin does not automatically determine one's race or ethnicity, nor does
ethnicity determine race, nor does race determine ethnicity.
Data aggregation without the consideration of the intersecting layers that construct identity
would be similar to suggesting that 'American' or being born in the United States could be
automatically linked/aggregated into 'White'.
The Combined Format and Granular Ethnicity fields were developed as two separate
questions to achieve health care, research, compliance, reporting, and resource allocation
needs. As importantly, it ensures the patient's right to self-identify as well as ensures the
highest data quality and integrity.
Language (Spoken and Written)
Kaiser Permanente focused on developing timely, valid, and representative language codes
to capture our nation’s increasing diversity. We are collecting both spoken and written
language to ensure the provision of quality and equitable health care.
The Spoken/Written Language Code Sets are reviewed on an on-going basis primarily to
ensure alignment with linguistic trends in the United States, current organizational language
utilization, as well as relevance in culturally and linguistically competent care and patientcentered care.
Ongoing Analysis and Review for Comparability (Selected Examples Provided)
National Data Sets and Resources
x U.S. Decennial Census/American Community Survey
Organizational Language Utility (Regional and National)
x Vendor Utilization Data
x Kaiser Permanente Utilization Data
Transnational and International Data Sets and Resources
x International Organization for Standardization
© Copyright 2009, Kaiser Foundation Health Plan, Inc.
Page 3
20
APPENDIX G
Evolution of Data Collection on Race, Ethnicity, and Language Preference Information
June, 2009
Race, Ethnicity, and Language Code Sets
NOTES (Applies to all Code Sets):
‘Decline to State’, ‘Other’, and ‘Unknown’ are collection codes utilized by Kaiser Permanente.
Categories that represent one code in the collection system but have multiple
names/designations are listed together and separated by a (/) slash mark.
Combined Format
Issued by the Office of Management and Budget
American Indian/Alaska Native
Asian
Black/African American
Hispanic/Latino
Native Hawaiian/Other Pacific Islander
White
Decline to State
Other
Unknown
The Combined Format is a multiple response field.
© Copyright 2009, Kaiser Foundation Health Plan, Inc.
Page 4
206
RACE, ETHNICITY, AND LANGUAGE DATA
Evolution of Data Collection on Race, Ethnicity, and Language Preference Information
June, 2009
Granular Ethnicity
Acadian/Cajun
Afghan/Afghanistani
Agikuyu/Kikuyu
Akan
Alaska Athabascan
Albanian
Aleut
Algerian
Alsatian
Amara/Amhara
Amazigh/Imazighen/Berber
American/United States
Amerindian/Indigena/Indio
Antiguan/Barbudan
Apache
Arab/Arabic
Argentine/Argentinean
Armenian
Asian Indian/Indian (Asia)
Assyrian/Chaldean/Syriac
Australian
Austrian
Azerbaijani
Azeri
Bahamian
Bajan/Barbadian
Bamar/Burman
Bangladeshi
Bantu
Basque
Belarusian/Belorussian
Belgian
Belizean
Bengali
Blackfeet
Bolivian
Bosniak
Bosnian/Herzegovinian
Brazilian
British Isles/British Isles origin
British West Indian/Indies
Briton/British
Bulgarian
Burmese
© Copyright 2009, Kaiser Foundation Health Plan, Inc.
Page 5
20
APPENDIX G
Evolution of Data Collection on Race, Ethnicity, and Language Preference Information
June, 2009
Granular Ethnicity (cont’d)
Cambodian
Cameroonian/Cameroon
Canadian
Canadian American Indian
Cape Verdean
Carpatho Rusyn
Celtic
Central American Indian
Cherokee
Cheyenne
Chickasaw
Chilean
Chinese
Chippewa
Choctaw
Colombian
Colville
Comanche
Congolese/Congo
Costa Rican
Creek
Creole
Croat/Croatian
Crow
Cuban
Cypriot
Czech
Czechoslovakian
Dane/Danish
Delaware
Dominican
Dutch
Dutch West Indian/Indies
East Indian
Eastern Cherokee
Ecuadorian
Egyptian
Emirati/United Arab Emirates
English
Eritrean
Eskimo
Estonian
Ethiopian
Fijian
Filipino/Philippine
Finn/Finnish
© Copyright 2009, Kaiser Foundation Health Plan, Inc.
Page 6
20
RACE, ETHNICITY, AND LANGUAGE DATA
Evolution of Data Collection on Race, Ethnicity, and Language Preference Information
June, 2009
Granular Ethnicity (cont’d)
Fleming/Flemish
French
French Canadian
Fulani/Hausa
Georgian
German
German Russian
Ghanaian/Ghanian
Greek
Grenadian
Guamanian/Chamorro
Guatemalan
Guyanese
Haitian
Hawaiian/Native Hawaiian
Hmong
Honduran
Hopi
Hungarian
Ibo/Igbo
Icelander
Indonesian
Inupiat Eskimo
Iranian
Iraqi
Irish
Iroquois
Israeli
Italian
Ivoirian/Ivory Coast
Jamaican
Japanese
Javanese/Java/Jawa
Jewish/Jew
Jordanian
Kazakh/Qazaq
Kazakhstani
Kenyan
Keres
Khmer
Kinh/Viet
Kiowa
Kittitian/Nevisian
Korean
Kurd/Kurdish
Kuwaiti
© Copyright 2009, Kaiser Foundation Health Plan, Inc.
Page 7
209
APPENDIX G
Evolution of Data Collection on Race, Ethnicity, and Language Preference Information
June, 2009
Granular Ethnicity (cont’d)
Lao Loum/Lowland Lao
Lao/Laotian
Latin American Indian
Latvian
Lebanese
Liberian
Libyan
Lithuanian
Lumbee
Luxemburger
Macedonian
Malay
Malaysian
Maltese
Maori
Mende
Mestizo
Mexican
Mexican American Indian
Mohawk
Moldovan/Moldavian
Montenegrin
Moroccan
Muscogee (Creek) Nation
Navajo
Nepalese/Nepali
New Zealander/New Zealand
Nicaraguan
Nigerian
Norwegian
Oglala Sioux
Okinawan
Oklahoma Choctaw
Oneida Nation of New York/Oneida
Oromo
Osage
Ottawa
Paiute
Pakistani
Palestinian
Panamanian
Paraguayan
Part Hawaiian
Pashtun/Pathan
Pennsylvania German
Persian
© Copyright 2009, Kaiser Foundation Health Plan, Inc.
Page 8
210
RACE, ETHNICITY, AND LANGUAGE DATA
Evolution of Data Collection on Race, Ethnicity, and Language Preference Information
June, 2009
Granular Ethnicity (cont’d)
Peruvian
Pima
Pole/Polish
Portuguese
Potawatomi
Pueblo
Puerto Rican
Puget Sound Salish
Quechua
Romanian
Rosebud Sioux
Russian
Saint Lucian
Salvadoran
Samoan
San Carlos Apache
Saudi/Saudi Arabian
Sault Ste. Marie Chippewa
Scandinavian
Scotch-Irish
Scottish
Seminole
Seneca
Senegalese
Serb/Serbian
Shawnee
Shona
Shoshone
Sierra Leonean
Singaporean/Singapore
Sinhalese/Singhalese
Sioux
Slavic
Slovak
Slovene/Slovenian
Somali/Somalian
South African
South American Indian
Soviet/Soviet Union
Spaniard/Spanish
Spanish American Indian
Sri Lankan
Sudanese
Swede/Swedish
Swiss
Syrian
© Copyright 2009, Kaiser Foundation Health Plan, Inc.
Page 9
211
APPENDIX G
Evolution of Data Collection on Race, Ethnicity, and Language Preference Information
June, 2009
Granular Ethnicity (cont’d)
Tagalog
Tahitian
Taiwanese
Tanzanian
Temne/Temme/Themne
Teton Sioux
Thai
Tigrinya/Tigray/Tigraway
Tlingit
Tlingit-Haida
Togolese/Togo
Tohono O'Odham
Tongan
Trinidadian/Tobagonian
Tunisian
Turk/Turkish
Turtle Mountain Band/Turtle Mountain
U.S. Virgin Islander
Ugandan
Ukrainian
Uruguayan
Ute
Uzbek/Uzbeg
Uzbekistani
Venezuelan
Vietnamese
Welsh
West Indian
White Mountain Apache
Yakama
Yaqui
Yemeni
Yoruba
Yugoslavian
Yup’ik/Yupik Eskimo
Zimbabwean
Zuni
Decline to State
Other
Unknown
Currently, Granular Ethnicity is not available as a multiple response field for multiethnic
persons. Request for IT change is underway.
© Copyright 2009, Kaiser Foundation Health Plan, Inc.
Page 10
212
RACE, ETHNICITY, AND LANGUAGE DATA
Evolution of Data Collection on Race, Ethnicity, and Language Preference Information
June, 2009
Spoken Language
Abkhaz
Afar
Afrikaans
Akan
Albanian
Algonquin
American Sign Language
Amharic
Apachean/Apache
Arabic
Aramaic
Armenian
Assyrian Neo-Aramaic/Assyrian
Aymaran/Aymara
Aztec/Nahuatl
Bantu
Bashkir
Basque
Bengali
Bhojpuri
Bislama
Bosnian
Breton
Bulgarian
Burmese
Cantonese/Chinese, Yue
Catalan-Valencian-Balear
Cebuano
Chamorro
Chaochow/Chinese, Min Nan
Chaozhou/Chinese, Min Nan
Cherokee
Chuukese/Trukese
Corsican
Croatian
Cushitic/Cushite
Czech
Dakota
Danish
Dari, Zoroastrian/Dari
Dinka
Dutch
English
Esperanto
© Copyright 2009, Kaiser Foundation Health Plan, Inc.
Page 11
21
APPENDIX G
Evolution of Data Collection on Race, Ethnicity, and Language Preference Information
June, 2009
Spoken Language (cont’d)
Farsi/Persian
Fijian
Filipino
Finnish
Formosan
French
French Creole
French, Cajun/Cajun
Fukienese/Chinese, Min Nan
Fula/Fulani
Fuzhou/Chinese, Min Dong
Gaelic, Irish/Irish Gaelic
Georgian
German
German, Pennsylvania/Pennsylvania Dutch
Greek
Gujarati/Gujarathi
Guranai
Haitian Creole French/Haitian Creole
Hakka/Chinese, Hakka
Hawaiian
Hebrew
Hindi
Hmongic/Hmong
Hmong-Mien/Miao-Yao
Huizhou/Chinese, Huizhou
Hungarian
Igbo/Ibo
Ilocano
Indonesian
Inuktitut, Greenlandic
Italian
Iu Mien/Mien
Jamaican Creole English/Jamaican Creole
Japanese
Kannada
Kashmiri
Keres
Korean
Kru
Kurdish
Kusaiean/Kosraean
Ladino
Languedocien/Occitan
Lao/Laotian
Latvian/Lettish
© Copyright 2009, Kaiser Foundation Health Plan, Inc.
Page 12
214
RACE, ETHNICITY, AND LANGUAGE DATA
Evolution of Data Collection on Race, Ethnicity, and Language Preference Information
June, 2009
Spoken Language (cont’d)
Lingala
Lithuanian
Macedonian
Malay
Malayalam
Mandarin/Chinese, Mandarin
Mande
Marathi
Marshallese
Maya, Yucatan/Yucateco
Micronesian
Mixteco
Mongolian Proper/Mongolian
Mon-Khmer/Khmer
Navajo
Nepali
Norwegian
Oriya
Oromo
Palauan/Palau
Pampangan/Pampango
Panjabi
Pashto
Patois
Pohnpeian
Polish
Portuguese
Provencal
Punjabi
Quechuan/Quechua
Romanian/Moldavian
Rundi/Kirundi
Russian
Rwanda/Kinyarwanda
Samoan
Sango/Sangho
Serbian
Shanghainese/Chinese, Wu
Shona
Sign Language (Other)
Sinhala/Sinhalese
Slovak
Somali
Songhai/Songhay
Soninke
Sorbian, Lower/Lusatian
© Copyright 2009, Kaiser Foundation Health Plan, Inc.
Page 13
21
APPENDIX G
Evolution of Data Collection on Race, Ethnicity, and Language Preference Information
June, 2009
Spoken Language (cont’d)
Sorbian, Upper
Sotho, Southern/Sesotho
Spanish
Swahili/Kiswahili
Swedish
Tagalog
Taiwanese/Chinese, Min Nan
Tamil
Tatar
Telugu
Thai
Tibetan
Tigrigna/Tigrinya
Toishanese/Chinese, Yue
Tonga/Western Nyasa
Tongan
Tsimshian
Tsonga
Tswana/Setswana
Tupi-Guarani/Guarani
Turkish
Turkmen
Twi (Akan)
Ukrainian
Urdu
Vietnamese
Vlaams/Flemish
Wolof
Xhosa
Yapese
Yi, Sichuan/Szechuan
Yiddish
Yoruba
Zulu
Do Not Speak
Decline to State
Other
Unknown
Spoken Language is a multiple response field.
© Copyright 2009, Kaiser Foundation Health Plan, Inc.
Page 14
216
RACE, ETHNICITY, AND LANGUAGE DATA
Evolution of Data Collection on Race, Ethnicity, and Language Preference Information
June, 2009
Written Language
Abkhaz
Afar
Afrikaans
Akan
Albanian
Algonquin
Amharic
Apachean/Apache
Arabic
Aramaic
Armenian
Assyrian Neo-Aramaic/Assyrian
Aymaran/Aymara
Aztec/Nahuatl
Bantu
Bashkir
Basque
Bengali
Bhojpuri
Bislama
Bosnian
Braille
Breton
Bulgarian
Burmese
Catalan-Valencian-Balear
Cebuano
Chamorro
Cherokee
Chinese, Simplified
Chinese, Traditional
Chuukese/Trukese
Corsican
Croatian
Cushitic/Cushite
Czech
Dakota
Danish
Dari, Zoroastrian/Dari
Dinka
Dutch
English
Esperanto
Farsi/Persian
© Copyright 2009, Kaiser Foundation Health Plan, Inc.
Page 15
21
APPENDIX G
Evolution of Data Collection on Race, Ethnicity, and Language Preference Information
June, 2009
Written Language (cont’d)
Fijian
Filipino
Finnish
Formosan
French
French Creole
French, Cajun/Cajun
Fula/Fulani
Gaelic, Irish/Irish Gaelic
Georgian
German
German, Pennsylvania/Pennsylvania Dutch
Greek
Gujarati/Gujarathi
Guranai
Haitian Creole French/Haitian Creole
Hawaiian
Hebrew
Hindi
Hmongic/Hmong
Hmong-Mien/Miao-Yao
Hungarian
Igbo/Ibo
Ilocano
Indonesian
Inuktitut, Greenlandic
Italian
Iu Mien/Mien
Jamaican Creole English/Jamaican Creole
Japanese
Kannada
Kashmiri
Keres
Korean
Kru
Kurdish
Kusaiean/Kosraean
Languedocien/Occitan
Lao/Laotian
Latvian/Lettish
Lingala
Lithuanian
Macedonian
Malay
Malayalam
Mande
© Copyright 2009, Kaiser Foundation Health Plan, Inc.
Page 16
21
RACE, ETHNICITY, AND LANGUAGE DATA
Evolution of Data Collection on Race, Ethnicity, and Language Preference Information
June, 2009
Written Language (cont’d)
Marathi
Marshallese
Maya, Yucatan/Yucateco
Micronesian
Mixteco
Mongolian Proper/Mongolian
Mon-Khmer/Khmer
Navajo
Nepali
Norwegian, Bokmal/Bokmal
Norwegian, Nynorsk/Nynorsk
Oriya
Oromo
Palauan/Palau
Pampangan/Pampango
Panjabi
Pashto
Patois
Pohnpeian
Polish
Portuguese
Provencal
Punjabi
Quechuan/Quechua
Romanian/Moldavian
Rundi/Kirundi
Russian
Rwanda/Kinyarwanda
Samoan
Sango/Sangho
Serbian
Shona
Sinhala/Sinhalese
Slovak
Somali
Songhai/Songhay
Soninke
Sorbian, Lower/Lusatian
Sorbian, Upper
Sotho, Southern/Sesotho
Spanish
Swahili/Kiswahili
Swedish
Tagalog
Tamil
Tatar
© Copyright 2009, Kaiser Foundation Health Plan, Inc.
Page 17
219
APPENDIX G
Evolution of Data Collection on Race, Ethnicity, and Language Preference Information
June, 2009
Written Language (cont’d)
Telugu
Thai
Tibetan
Tigrigna/Tigrinya
Tonga/Western Nyasa
Tongan
Tsimshian
Tsonga
Tswana/Setswana
Tupi-Guarani/Guarani
Turkish
Turkmen
Twi (Akan)
Ukrainian
Urdu
Vietnamese
Vlaams/Flemish
Wolof
Xhosa
Yapese
Yiddish
Yoruba
Zulu
Do Not Read/Write
Decline to State
Other
Unknown
Written Language is a multiple response field.
For more information, please contact:
Gayle Tang, RN, MSN
Director, National Linguistic & Cultural Programs
National Diversity, Kaiser Permanente
One Kaiser Plaza, 17 Lakeside
Oakland, CA 94612
Email: [email protected]
Phone: 510-271-6828
© Copyright 2009, Kaiser Foundation Health Plan, Inc.
Page 18
Appendix H
Contra Costa Health Plan Language Assistance
Database and Ethnicity Categories
Contra Costa Health Plan (CCHP), founded in 1973, is sponsored by the county of Contra Costa, California. It
is the only county run health plan in California, and it was the first federally qualified county sponsored HMO in
the United States. Today, CCHP serves approximately 85,000 people, including public and commercial members.
The plan is licensed by the California State Department of Managed Health Care and the provisions of California
SB853 apply for determining the language needs of its membership.
CCHP has developed, in collaboration with other health plans, a set of race, ethnicity, and spoken and written
language categories applicable to its service population (see following pages). After analysis of its membership needs,
CCHP determined that there were 15 detailed ethnicity and language categories that would be most frequently used
by its members at different sites. Initially, a top 10 list was compiled, but it was apparent that the top 10 list at each
service site was not the same; by developing the top 15 list, the top 10 categories at all sites were covered. To further
increase interoperability among parts of the health system, CCHP is trying to promote the top 15 categories into the
data collection systems of all county health centers and the Contra Costa Regional Medical Center. A need remains,
however, to crosswalk the CCHP codes to different codes used at the state level (e.g., for hospital discharges).
The top 15 ethnicities and languages are visible on drop down menus for selection by staff and the system
has the capacity to access the full list if an individual self-identifies with a category not included in the top 15.
For example, if a member services representative types the letter “e,” English will pop up from the top 15 list,
but if the patient speaks another language starting with “e,” a second keystroke brings up other language choices
beginning with “e” such as Estonian (see entry screen and training instructions on the next page). Additionally,
they have helpful features such as allowing population of those fields for other family members at the same time.
The CCHP phone script for member services staff has evolved over time from a lengthy explanation of the need
for these data for quality improvement to simply request for verification; collection of the data takes practice and
monitoring. Collecting these four variables (i.e., race, ethnicity, spoken language, and written language) takes, on
average, one minute and thirty seconds per call. To ensure that the race, ethnicity, and language data are being
collected, production metrics regularly report on the number of records fully completed by member services staff,
which is reviewed by the member services manager.
CCHP collects ethnicity separately from race and avoids aggregating detailed ethnicities to OMB race
categories whenever possible. To ensure compliance with HEDIS reporting requirements and minimize redundancy
in data collection, CCHP automatically populates a variable on the individual’s Hispanic ethnicity based on his or
her responses to the language, race, and detailed ethnicity questions.
221
222
RACE, ETHNICITY, AND LANGUAGE DATA
CONTRA COSTA HEALTH PLAN’S LANGUAGE ASSISTANCE DATA BASE
MEMBER SERVICES STAFF TRAINING
The collection of Spoken/Written Language, Race and Ethnicity is meant to be at the end of a call; after a member
has been helped with the issue they called about.
Add this step to your conversation at the end of the call as a verification process. This sentence has been shown
to be effective:
“We are verifying that we have the most accurate information about our members on file.”
Then proceed to ask the four questions listed below.
Notice that the top 15 (most frequent) are at the top of the list; the complete list follows at the bottom. At the end,
ask if the information applies to all family members. If it does check all family box in left corner of the screen, if
it does not enter the family members individually.
Quick tips:
Tab—will move the cursor to the next field. Example: from Spoken Language to Written Language.
Pressing a letter: Example “S” will take to the cursor to Spanish in the top 15 list, by pressing S again will take
you to Samoan, then Sangho and so on….
APPENDIX H
22
224
RACE, ETHNICITY, AND LANGUAGE DATA
TABLE H-1 Language Assistance Data Base (LADB), based on CDC Race/Ethnicity Codes and ISO Language
Codes
by Otilia Tiutin, Manager of Cultural & Linguistic Services
Race Code
Race Description
(For mixed race use boxes, can choose up to 3 categories)
R5
E1
R3
R2
R1
R4
R9
RZ
EY
White/Caucasian
Hispanic or Latino
Black or African American
Asian
American Indian or Alaska Native
Native Hawaiian or Other Pacific Islander
Other Race
Unknown/Not Provided
Decline to state
Ethnic Code
Ethnicity Description
Top 15 in Order of Frequency
21089
00017
21352
21485
21782
20560
20586
20479
20297
21212
20362
21295
20412
20347
00016
European
American
Hispanic/Latino
Mexican
Latin American
Black
African American
Vietnamese
Asian Indian
Iranian
Filipino
Arab
Laotian
Chinese
Russian
22
APPENDIX H
Ethnic Codes and Description in Alphabetical Order
21261
20602
20586
21386
00017
21295
21667
21097
20297
21196
21394
20677
20305
20685
21428
20313
20560
21675
00005
20610
00029
20321
20339
21634
21451
20925
21402
21410
21550
21626
20883
21519
21683
20347
20974
21691
21568
21766
21824
00000
20701
20693
21840
21709
21204
21105
20628
21089
21014
20362
21113
21436
21121
Afghanistani
African
African American
Andalusian
American
Arab
Argentinean
Armenian
Asian Indian
Assyrian
Asturian
Bahamian
Bangladeshi
Barbadian
Belearic Islander
Bhutanese
Black
Bolivian
Bosnian
Botswanan
Brazillian
Burmese
Cambodian
Canal Zone
Canarian
Carolinian
Castillian
Catalonian
Central American
Central American Indian
Chamorro
Chicano
Chilean
Chinese
Chuukese
Colombian
Costa Rican
Criollo
Cuban
Decline to state
Dominica Islander
Dominican
Dominican
Ecuadorian
Egyptian
English
Ethiopian
European
Fijian
Filipino
French
Gallego
German
226
20875
20867
21576
20719
20022
21352
20370
21584
20388
21212
21220
21139
21279
21147
20487
20727
20396
20966
20404
20933
00013
21527
20412
21782
21238
20636
20529
20420
20495
20891
20909
21006
21485
21493
21535
21501
20859
21188
00026
20644
20792
20503
21048
21592
20651
20438
00002
00030
20446
20917
21246
21600
21022
21717
RACE, ETHNICITY, AND LANGUAGE DATA
Guamanian
Guamanian or Chamorro
Guatemalan
Haitian
Hindi
Hispanic/Latino
Hmong
Honduran
Indonesian
Iranian
Iraqi
Irish
Israeili
Italian
Iwo Jiman
Jamaican
Japanese
Kiribati
Korean
Kosraean
Kurdish
La Raza
Laotian
Latin American
Lebanese
Liberian
Madagascar
Malaysian
Maldivian
Mariana Islander
Marshallese
Melanesian
Mexican
Mexican American
Mexican American Indian
Mexicano
Micronesian
Middle Eastern or North African
Mixtec, Mexican Indian
Namibian
Native Hawaiian
Nepalese
New Hebrides
Nicaraguan
Nigerian
Okinawan
Other Ethnicity
Other Latino
Pakistani
Palauan
Palestinian
Panamanian
Papau New Guinean
Paraguayan
22
APPENDIX H
21725
20941
21154
20784
00014
21808
00027
00016
20958
21618
20800
21162
20511
21030
21659
21758
21378
21469
20453
21253
20818
20354
20461
20735
20834
20826
20743
00001
21733
21444
21741
20479
20750
00025
20982
20669
Peruvian
Pohnpeian
Polish
Polynesian
Portuguese
Puerto Rican
Punjabi, India
Russian
Saipanese
Salvadoran
Samoan
Scottish
Singaporean
Solomon Islander
South American
South American Indian
Spaniard
Spanish Basque
Sri Lankan
Syrian
Tahitian
Taiwanese
Thai
Tobagoan
Tokelauan
Tongan
Trinidadian
Unknown
Uruguayan
Valencian
Venezuelan
Vietnamese
West Indian
Yao, Mien
Yapese
Zairean
22
RACE, ETHNICITY, AND LANGUAGE DATA
TABLE H-2 Spoken Language Codes (ISO)
Language Code
Language Description
Top 15
EN
ES
VI
FA
LO
AR
TL
12
RU
KM
KO
14
PA
BG
PL
English
Spanish
Vietnamese
Farsi
Laotian
Arabic
Tagalog
Cantonese
Russian
Cambodian
Korean
Mandarin
Punjabi
Bulgarian
Polish
Spoken Language Codes and Description in Alphabetical Order
AB
OM
AA
15
AF
SQ
01
AM
AR
HY
AS
16
AY
AZ
BA
EU
17
BN
DZ
BH
BI
BS
BR
BG
MY
BE
KM
12
CA
19
CH
ABKHAZIAN
AFAN,OROMO
AFAR
AF-MAAY
AFRIKAANS
ALBANIAN,SHQIP
AMERICAN SIGN
AMHARIC
ARABIC
ARMENIAN,HAYEREN
ASSAMESE
ASSYRIAN NEO-ARAMAIC
AYMARA
AZERBAIJANI
BASHKIR
BASQUE,EUSKERA
BEHDINI
BENGALI,BANGLA
BHUTANI,BHUTANESE
BIHARI
BISLAMA
BOSNIAN
BRETON
BULGARIAN
BURMESE,MYANMASA
BYELORUSSIAN
CAMBODIAN,KHMER
CANTONESE
CATALAN
CHALDEAN NEO-ARAMAIC
CHAMARRO
229
APPENDIX H
CO
HR
CS
DA
21
NL
EN
ET
FO
FA
FJ
FI
22
23
FR
FY
24
25
FL
GL
KA
DE
EL
KL
GN
GU
HT
26
HA
27
HE
HI
28
03
29
HU
30
IS
04
ID
IU
IK
GA
IT
JA
JV
KN
KS
KK
RW
KY
RN
KO
31
CORSICAN
CROATIAN,CROAT,HRVATSKI
CZECH
DANISH
DINKA
DUTCH,NEDERLANDS
ENGLISH
ESTONIAN
FAROESE,FAEROESE
FARSI,PARSIAN,PERSIAN
FIJI,FIJIAN
FINNISH,SUOMI
FLEMISH (DUTCH)
FORMOSAN
FRENCH
FRISIAN
FUJIAN
FUKIENESE
FULA, FULAH
GALICIAN
GEORGIAN,KARTULI
GERMAN
GREEK
GREENLANDIC,KALAALLISUT
GUARANI
GUJARATI,GUJERATI
HAITIAN CREOLE/FRENCH CREOLE
HAKKA
HAUSA
HAWRAMI
HEBREW,IWRITH
HINDI
HMONG (BLUE/GREEN)
HMONG (WHITE)
HUNANESE
HUNGARIAN,MAGYAR
IBO
ICELANDIC,ISLENZK
ILACANO (ILOKO)
INDONESIAN,BAHASA,INDONESIA
INUKTITUT
INUPIAK
IRISH,GAEILGE
ITALIAN
JAPANESE,NIHONGO
JAVANESE,BAHASA JAWA
KANNADA
KASHMIRI
KAZAKH
KINYARWANDA
KIRGHIZ,KYRGYZ
KIRUNDI
KOREAN,CHOSON-O
KPELLE
20
KU
32
LO
LV
LN
LT
MK
MG
MS
ML
MT
14
MI
MR
MH
33
06
34
35
36
MO
MN
NE
NV
NO
37
OC
OR
PS
PL
PT
PA
QU
RM
RO
RU
SM
SG
GD
SR
ST
TN
38
SN
SD
SI
SS
SK
SL
SO
ES
SU
SW
SV
RACE, ETHNICITY, AND LANGUAGE DATA
KURDISH,ZIMANY KURDY
KURMANJI
LAOTIAN,LAOTHIAN,PHA XA LOA
LATVIAN,LETTISH
LINGALA
LITHUANIAN
MACEDONIAN
MALAGASY
MALAY, BAHASA MALAYSIA
MALAYALAM
MALTESE
MANDARIN
MAORI
MARATHI
MARSHALLESE (EBON)
MENDE
MIEN
MIXE
MIXTECO-ALTA
MIXTECO-BAJA
MOLDAVIAN
MONGOLIAN
NAPALI
NAVAJO, NAVAHO
NORWEGIAN
NUER
OCCITAN
ORIYA
PASHTO,PUSHTO
POLISH
PORTUGESE
PUNJABI,PANJABI
QUECHUA
RHAETO-ROMANCE,ROMANSCH
ROMANIA,RUMANIAN
RUSSIAN
SAMOAN
SANGHO
SCOTS GAELIC
SERBIAN,SRPSKI
SESOTHO
SETSWANA
SHANGHAINESE
SHONA
SINDHI
SINGHALESE
SISWATI
SLOVAK
SLOVENIAN
SOMALI
SPANISH
SUDANESE
SWAHILI
SWEDISH,SVENSKA
21
APPENDIX H
TL
TG
TA
39
TT
TE
TH
BO
TI
40
TO
TS
TR
TK
TW
UG
UK
UR
UZ
VI
CY
WO
41
XH
YI
YO
42
ZA
ZU
8
3
98
99
TAGALOG
TAJIK
TAMIL
TARASCO
TATAR
TELUGU
THAI
TIBETIAN,BODSKAD
TIGRIGNA
TIO CHIU OR TEOCHEW
TONGAN (LANGUAGE OF TONGA)
TSONGA
TURKISH
TURKMEN
TWI
UIGUR
UKRAINIAN
URDU
UZBEK
VIETNAMESE
WELSH
WOLOF
WU
XHOSA
YIDDISH,JIDDISCH
YORUBA
ZAPTEC
ZHUANG
ZULU
Unknown
Unable to contact
DECLINED TO STATE
OTHER
22
RACE, ETHNICITY, AND LANGUAGE DATA
TABLE H-3 Written Language Codes (ISO)
Language Code
Language Description
Top 15 (most frequently used)
EN
ES
VI
FA
LO
AR
TL
12
RU
KM
KO
14
PA
BG
PL
English
Spanish
Vietnamese
Farsi
Laotian
Arabic
Tagalog
Cantonese
Russian
Cambodian
Korean
Mandarin
Punjabi
Bulgarian
Polish
Written Language Codes and Description in Alphabetical Order
AB
OM
AA
15
AF
SQ
AM
AR
HY
AS
AY
AZ
BA
EU
17
BN
BH
BI
BS
02
BR
BG
MY
BE
KM
12
CA
19
CH
ZH
ABKHAZIAN
AFAN,OROMO
AFAR
AF-MAAY
AFRIKAANS
ALBANIAN,SHQIP
AMHARIC
ARABIC
ARMENIAN,HAYEREN
ASSAMESE
AYMARA
AZERBAIJANI
BASHKIR
BASQUE,EUSKERA
BEHDINI
BENGALI,BANGLA
BIHARI
BISLAMA
BOSNIAN
BRAILLE/ALTERNATIVE FORMAT
BRETON
BULGARIAN
BURMESE,MYANMASA
BYELORUSSIAN
CAMBODIAN,KHMER
CANTONESE (SIMPLIFIED)
CATALAN
CHALDEAN NEO-ARAMAIC
CHAMORRO
Chinese- simplified characters
2
APPENDIX H
20
CO
HR
CS
DA
21
NL
DZ
EN
ET
FO
FA
FJ
FI
22
23
FR
FY
24
25
FL
GL
KA
DE
EL
KL
GN
GU
HT
26
HA
27
HE
HI
28
03
29
HU
30
IS
04
ID
IU
IK
GA
IT
JA
JV
KN
KS
KK
RW
KY
RN
Chinese- Traditional characters
CORSICAN
CROATIAN,CROAT,HRVATSKI
CZECH
DANISH
DINKA
DUTCH,NEDERLANDS
DZONGKHA (BHUTANI,BHUTANESE)
ENGLISH
ESTONIAN
FAROESE,FAEROESE
FARSI,PARSIAN,PERSIAN
FIJI,FIJIAN
FINNISH,SUOMI
FLEMISH (DUTCH)
FORMOSAN
FRENCH
FRISIAN
FUJIAN
FUKIENESE (traditional characters)
FULA, FULAH
GALICIAN
GEORGIAN,KARTULI
GERMAN
GREEK
GREENLANDIC,KALAALLISUT
GUARANI
GUJARATI,GUJERATI
HAITIAN CREOLE/FRENCH CREOLE
HAKKA (traditional)
HAUSA
HAWRAMI
HEBREW,IWRITH
HINDI
HMONG (BLUE/GREEN)
HMONG (White)
HUNANESE (traditional characters)
HUNGARIAN,MAGYAR
IBO
ICELANDIC,ISLENZK
ILACANO (ILOKO)
INDONESIAN,BAHASA,INDONESIA
INUKTITUT
INUPIAK
IRISH,GAEILGE
ITALIAN
JAPANESE,NIHONGO
JAVANESE,BAHASA JAWA
KANNADA
KASHMIRI
KAZAKH
KINYARWANDA
KIRGHIZ,KYRGYZ
KIRUNDI
24
KO
31
KU
32
LO
LV
LN
LT
MK
MG
MS
ML
MT
14
MI
MR
MH
33
06
34
MO
MN
NE
NV
NO
37
OC
OR
PS
PL
PT
PA
QU
RM
RO
RU
SM
SG
GD
SR
ST
TN
38
SN
SD
SI
SS
SK
SL
SO
ES
SU
SW
SV
RACE, ETHNICITY, AND LANGUAGE DATA
KOREAN,CHOSON-O
KPELLE
KURDISH,ZIMANY KURDY
KURMANJI
LAOTIAN,LAOTHIAN,PHA XA LOA
LATVIAN,LETTISH
LINGALA
LITHUANIAN
MACEDONIAN
MALAGASY
MALAY, BAHASA MALAYSIA
MALAYALAM
MALTESE
MANDARIN (TRADITIONAL)
MAORI
MARATHI
MARSHALLESE
MENDE
MIEN
MIXE
MOLDAVIAN
MONGOLIAN
NAPALI
Navajo, Navaho
NORWEGIAN
NUER
OCCITAN
ORIYA
PASHTO,PUSHTO
POLISH
PORTUGESE
PUNJABI,PANJABI
QUECHUA
RHAETO-ROMANCE,ROMANSCH
ROMANIA,RUMANIAN
RUSSIAN
SAMOAN
SANGHO
SCOTS GAELIC
SERBIAN,SRPSKI
SESOTHO
SETSWANA
SHANGHAINESE (traditiona charactersl)
SHONA
SINDHI
SINGHALESE
SISWATI
SLOVAK
SLOVENIAN
SOMALI
SPANISH
SUDANESE
SWAHILI
SWEDISH,SVENSKA
2
APPENDIX H
TL
TG
TA
39
TT
TE
TH
BO
TI
40
TO
TS
TR
TK
TW
UG
UK
UR
UZ
VI
CY
WO
41
XH
YI
YO
ZA
ZU
8
3
98
99
TAGALOG
TAJIK
TAMIL
TARASCO
TATAR
TELUGU
THAI
TIBETIAN,BODSKAD
TIGRIGNA
TIO CHIU OR TEOCHEW (verify character style)
TONGAN (LANGUAGE OF TONGA)
TSONGA
TURKISH
TURKMEN
TWI
UIGUR
UKRAINIAN
URDU
UZBEK
VIETNAMESE
WELSH
WOLOF
WU (traditional)
XHOSA
YIDDISH,JIDDISCH
YORUBA
ZHUANG
ZULU
Unknown
Unable to contact
DECLINED TO STATE
OTHER
NOTE: For more information on CCHP’s LADB project, call Otilia Tiutin at 925-313-6063 or email [email protected]. Information
about CCHP can be found at www.contracostahealthplan.org.
Appendix I
Subcommittee Template:
Developing a National Standard Set of
Spoken Language Categories and Coding
The Subcommittee on Standardized Collection of Race/Ethnicity Data for Healthcare Quality Improvement
recommends the collection of the variable spoken “language need” for each individual. Language need is to be
assessed through two questions: the first is an individual’s personal assessment of his/her ability to speak English
and then their preferred spoken language for a health-related encounter (Recommendation 4-1). Having this information for each individual allows its use to ensure the quality of services in subsequent encounters, in analysis
of health care disparities, and in system-level planning (e.g., determining the need for interpreters and matching
patients to language-concordant providers). The subcommittee defines limited English proficiency for health care
purposes as someone who speaks English less than very well.
When data are shared from one entity to another (e.g., providers to health plan or health plans to states), standardization helps ensure that data can be combined for like categories. Unlike race and Hispanic ethnicity, there is
no Office of Management and Budget (OMB) standard for language categories, thus the subcommittee recommends
that the Department of Health and Human Services (HHS) develop national standard lists of spoken and written
languages and codes (Recommendation 6-1a) and that entities choose their categories from the national standard
list (Recommendation 4-3) according to the needs of the population they serve or study (Recommendation 4-2).
When a health care entity designs its collection instruments, whether paper or electronic, it may, because of space
considerations, have to use a limited number of pre-selected response categories. Therefore, such a response list
should always include an “Other, please specify: __” option to ensure collection of each person’s language need
(Recommendation 4-2). Some electronic data collection systems are more sophisticated, and by using keystroke
recognition can accommodate hundreds of languages.
DEVELOPMENT OF THE TEMPLATE
The subcommittee did not identify a single existing category list that it believed was ready to serve as a national
standard set. To develop a template of spoken languages spoken in the United States, the subcommittee compiled
the attached list to serve as a draft template of language names and coding possibilities. (An online searchable
and sortable Excel version of the list is available at: www.iom.edu/datastandardization.) Census Bureau data on
languages spoken at home was a logical place to start to compile lists of languages; the Census has compiled
2
2
RACE, ETHNICITY, AND LANGUAGE DATA
approximately 530 language names corresponding to about 380 language codes. 1 Some of these languages are
nearing extinction. Another group, International Organization for Standardization (ISO) has established code sets
for thousands of languages; the ISO language lists and particularly their coding focus on distinct languages with
distinct codes, whereas the Census Bureau is more likely to give related languages the same code. The ISO codes
have evolved from a first-generation two-letter coding system (ISO 639-1), to a three-letter system to accommodate
additional languages primarily for bibliographic uses (ISO 639-2), to a set that now incorporates more three-letter
codes to cover 6,000 known languages in the world (ISO 639-3). The ISO 639-3 codes are intended “to provide
a comprehensive set of identifiers for all languages for use in a wide range of applications, including linguistics,
lexicography and internationalization of information systems.”2
The subcommittee list began with the Census Bureau’s summary file 3 (SF3) technical documentation list of
approximately 530 languages and 380 three digit numerical codes; 3 these are presented in the first two columns.
Names that are not in all caps are considered to have a relationship to an ALL CAPS language name and receive
the same code.4 The Census Bureau could not confirm whether persons speaking the ALL CAPS languages would
be understood by those with the same code; the online Excel file can be sorted by the code number to see which
languages have overlapping codes. Additional language names, not on the Census list, were added to the Census
names column based on previous surveys conducted by Hospital Research & Educational Trust (HRET) of a
representative sample of hospitals and the National Association of Community Health Centers of a representative
sample of health centers;5 requests to Language Line, an interpretation and translation service; 6 and subcommittee
collection of additional names from a handful of providers.7 The languages added to the initial Census list are indicated by an * next to the Census code number; the code number assigned was provided by Census Bureau staff to
indicate how they would have coded the response; some remain uncoded. 8 This resulted in approximately 650 total
language names, of which approximately 300 were identified as being used in a health care context. A column was
added to indicate categories for which the Modern Language Association reports there were responses in Census
2000;9 the subcommittee ran Census PUMS data but did not find any further languages since languages with
smaller numbers of persons reporting the language were aggregated together.
Each language in the first column was then matched to different generations of ISO codes which are alphabetic rather than numeric codes. ISO 639-2 codes are maintained by the Library of Congress and are coded as
two letters; the ISO 639-3 codes are three letter codes currently maintained by SIL International. ISO codes start
with the most comprehensive set (ISO-639-3); after the codes, the language name under the ISO categorization
scheme is listed.
The names of languages often have multiple possible spellings, even between the Census Bureau and ISO 639
language lists there are alternate spellings, and patients may provide an alternative spelling as well. The column,
1
U.S. Census Bureau. 2007. Census 2000 Summary File 3–Technical documentation. Appendix G language code list. Washington, DC:
U.S. Census Bureau.
2 SIL International. 2009. Relationship between ISO 69- and the other parts of ISO 69. http://www.sil.org/iso639-3/relationship.asp
(accessed July 20, 2009).
3 The Census Bureau included the notation n.e.c. next to a language name to means not elsewhere categorized. Some of the languages that
may have fallen into these categories may now be listed in column A due to the additions the subcommittee made to the list of languages.
4 U.S. Census Bureau. 2002. Census 2000 summary file : Technical documentation. http://www.census.gov/prod/cen2000/doc/sf3.pdf
(accessed August 3, 2009).
5 Hasnain-Wynia, R., J. Yonek, D. Pierce, R. Kang, and C. H. Greising. 2006. Hospital language services for patients with limited English
proficiency: Results from a national survey. Chicago, IL: Health Research and Educational Trust (HRET)/AHA; National Association of Community Health Centers. 2008. Serving patients with limited English proficiency: Results of a community health center survey. Bethesda, MD:
National Association of Community Health Centers and National Health Law Program.
6 Language Line Service. 2009. List of languages by Language Line Services. http://www.languageline.com/page/languages/ (accessed June 12,
2009).
7 Personal communications from Emilio Carrillo, New York Presbyterian Hospital, May 11, 2009; Alice Chen, San Francisco General
Hospital, July 7, 2009; Maria Moreno and Traci Van, Sutter Health, July 22, 2009; Shiva Bidar-Sielaff, University of Wisconsin Health, May
11, 2009.
8 Personal communication, H. Shin, U.S. Census Bureau, July 13, 2009.
9 Modern Language Association. 2009. All languages reported to the U.S. Census in 2000. http://www.mla.org/map_data_langlist&mode=lang_tops
(accessed May 26, 2009).
29
APPENDIX I
Other Names and Additional Information includes some of the alternate spellings and names the subcommittee
encountered, but these should not be considered all of the alternative names. Languages might even be called
slightly different names, such as Amish, Pennsylvania Dutch, or Pennsylvania German, or be quite different. This
need not be a barrier to the list of choices developed locally as long as it is clear on a national standard list how
to categorize the alternative spellings or names.
Since the Census language list included names that appeared in responses to earlier censuses, some languages
were thought to be no longer in use. The American Indian and Alaska Native languages were reviewed to determine whether they were now considered extinct or nearly extinct by Ethnologue which tracks the world’s living
languages. Ethnologue uses the term nearly extinct when “only a few elderly speakers are still living.” 10 Notations
are made of this status in the column titled, Other Names and Additional Information; approximately 80 of the
650 languages were identified as extinct or nearly extinct.
ADAPTATION OF THE TEMPLATE TO A NATIONAL STANDARD LIST
Arriving at the possible names for a national category list appears fairly straight forward; the accompanying
list is likely to identify most that will be encountered. Changes in immigration patterns over time may result in
additional names; thus, category and code lists will have to be maintained (Recommendation 6-1a). Deciding on
which coding scheme to adopt is more challenging. In its incidental collection of information on languages, the
subcommittee encountered more instances of use of the ISO coding scheme; however, the Census has data on
languages spoken at home and the degree of limited English proficiency for many languages that entities use to
learn about the populations in their service areas. The subcommittee believes that there are advantages to both the
Census Bureau and ISO coding schemes for languages, and does not endorse one over the other. The subcommittee
indicates the need for HHS to consult with the Census Bureau, the registration authorities for the ISO codes, and
others that establish unique coding for interoperability, such as HL7.
If the Census coding approach were to be adopted, the subcommittee notes that the Census list of languages
and codes would likely need some additional changes to be useful. The primary limitation of the Census Bureau
coding scheme is that it uses the same code for multiple related languages, while the ISO list has unique codes
for each language. To the extent that patients who are not English proficient need language assistance services in
distinct languages in order to facilitate understanding during patient–provider interactions, a care provider’s ability
to track specific languages would be enhanced by unique coding for distinct languages; this could happen by either
expanding the Census codes or adopting the detail of the ISO codes. Currently, there is no specific Census code
for English. Sign language, an important communication tool, is not a unique language response on the Census,
and generally would code the person as speaking English. By contrast, ISO-639 has unique codes for 130 types of
sign languages. For health care purposes, some entities have found a separate category noting which persons have
speech loss has been useful to understand the communication needs of all patients. Further options for “declined,”
“unavailable,” or “unknown” are also useful when data are being recorded to determine the portion of the service
population from whom language data have been collected.
The subcommittee did not generate a list of written languages, but illustrates these needs with the experiences
of Kaiser Permanente and Contra Costa Health Plans in appendixes G and H. (Contra Costa used ISO two-letter
codes supplemented by their own local coding). The ISO codes represent both spoken and written language names;
separate script codes apply to written languages, as well, to describe their lettering. 11
10
11
Ethnologue. Endangered languages. http://www.ethnologue.com/nearly_extinct.asp (accessed July 20, 2009).
SIL International. 2009. Scope of denotation for language identifiers. http://www.sil.org/iso639-3/scope.asp (accessed July 20, 2009).
966
780 amh
862
ALGONQUIAN
AMERICAN INDIAN
AMHARIC
APACHE
sq
amh
am
apa
(multiple
other 639-3
codes)
806 alq
ALBANIAN
ALEUT
x
Apache
languages
x
x
x
x
x
x
x
Carolina Algonquin extinct
Nearly extinct
x
Nearly extinct
x
x
x
x
Eastern Abnaki - extinct
Other Names and
Additional Information
x
x
x
x
x
x
x
x
x
x
x
x
x
x
x
x
x
x
x
x
x
x
x
x
x
x
Contra
NACHC
NY
Reported in Kaiser
Costa HRET
Sutter
the Census Permanente Health Hospital Survey of Language Presbyterian
c
d
d
f
g
h
Line Use Hospitale
SFGHe UW e Healthe
Health Plan Plan
Survey CHCs
2000
x
x
x
Algonquin
American
Indian
Amharic
Albanian
ALEUT
Akan
Aklan
language of
Phillipines
include:
Malaynon and
Akeanon
Alabama
Ainu
Afrikaans
Aguacateco
Ahtena
Afghan
Languages are
multiple (about
50% use Dari
and about
35% Pashto;
other major
languages:
Hazaragi,
Uzbek
Southern)
ISO 639-1
Individual ISO Language
languageb Nameb
ab
Abkhazian
Abnaki
(Eastern,
Western)
Achinese
Acoli
Achumawi
Western Keres
(dialectAcoma)
aa
Afar
799
afr
af
611 afr
968 agu
848 aht
aib (China), ain
ain (Japan)
723 (Japan)
aka (macro
with 2 sub: fat
(Fanti) and twi
aka
ak
796 (Twi)
aar
ace
ach
ISO 639-2
Individual
languageb
abk
743* mlz (Malaynon)
915 akz
sqi (macro with
sqi / alb
638 4 subs)
ale
800 ale
Aklan
ALABAMA
Akan
Ainu
Afghani (coded same
as Pashto)
AFRICAN, not further
specified
AFRIKAANS
Aguaceto
AHTENA
prs (Dari
Persian) pst
(Central
Pashto) pbt
(Southern
Pashto) pbu
(Northern
Pashto) haz
(Hazaragi) uzb
657 (Uzbek)
924 kjq
783* aar
Acoma (same code
as Laguna)
Afar
aaq, abe
ace
ach
acv
823
733
785
885
ABNAKI
ACHINESE
Acholi
ACHUMAWI
Census Language
Namea
Abkhazian
ISO 639-3
Census
Individual
a
Code
languageb
696* abk
TABLE I-1 Subcommittee Template: Comparison of Spoken Language Categories and Coding
240
847
808 ats
886 atw
607 bar
aym (macro
with 2
sublanguages:
Central and
aym
973 Southern)
aze (macro
with 2 subs:
North and
aze
690 South)
956 azc (639-5)
ATHAPASCAN
ATSINA
ATSUGEWI
Austrian
Bahasa (same code
as Malay)
BALINESE
AZERBAIJANI
AZTECAN
AYMARA
msa (macro)
zim (Malay
individual
739 language)
734 ban
779 aii
Assyrian
msa/may
(macro)
ban
ath
(collective)
asm
796
662
672 asm
907 asb
Ashanti (see Twi
which has same
code)
Asian Indian
ASSAMESE
Assiniboine
Arabic Yemen
Aramaic (see below
Chaldean with same
code)
ARAPAHO
ARAWAKIAN
ARIKARA
Arkansas
ARMENIAN
ara
Ms
(macro)
az
ay
as
hy
ar
Balinese
Azerbaijani
Uto-Aztecan
Aymara
Bahasa Kehangsaan
(Indonesia) Bahasa
Malaysian (Malaysia)
Azeri
Assyrian NeoAramaic
Athapascan
languages
Gros Ventre
Atsugewi
Nearly extinct
Bavarian
Assamese
Numerous
languages with
Aramaic in
name
Arapaho
Arawak
Arikara
Nearly extinct
Quapaw
Armenian
The Ashanti
language is
Twi (see
below)
Asante
Arabic Yemen
(multiple
possibilities)
Arabic
Arabic,
Moroccan
ISO 639-2 ISO 639-1
Individual Individual ISO Language Other Names and
languageb languageb Nameb
Additional Information
777* ary
ayh (Hadrami)
ayn (Sanaani)
acq (Ta'izzi777* Adeni)
aii (Assyrian
Neo-Aramaic)
jpa (Aramaic,
Jewish
Palestine) sam
(Aramaic
Samaritan) cld
(Chaldean Neo
779 Aramaic)
arp
807 arp
arw
974 arw
934 ari
914 qua
hye / arm
655 hye
Arabic Morocan
ARABIC
Census Language
Namea
ISO 639-3
Census
Individual
a
Code
languageb
ara (macro with
30
777 sublanguages)
TABLE I-1 Subcommittee Template: Comparison of Spoken Language Categories and Coding
x
x
x
x
x
x
x
x
x
x
x
x
x
x
x
x
x
x
x
x
x
x
x
x
x
x
x
x
x
x
x
x
x
x
x
x
x
x
x
x
x
x
Contra
NACHC
NY
Reported in Kaiser
Costa HRET
Sutter
the Census Permanente Health Hospital Survey of Language Presbyterian
c
d
d
f
g
h
Line Use Hospitale
SFGHe UW e Healthe
Health Plan Plan
Survey CHCs
2000
241
781
669 bhb
668* bho
640 bel
668
bik (macro with
747 5 subs)
BERBER
Bhili
Bhojpuri
BIELORUSSIAN
BIHARI
743
604*
809
649
699
634
730
647
717
707
790
935
861
949
624
BISAYAN (has
separate code from
Cebuano)
Bislama
BLACKFOOT
Bosnian
BRAHUI
BRETON
BUGINESE
BULGARIAN
BURMESE
BURUSHASKI
Bushman
CADDO
Cahto
CAHUILLA
CAJUN
BIKOL
658* kmr
792 bmb
664 ben
Behdini
Bembe
BENGALI
pao
cad
ktw
chl
frc
bsb (Brunei)
bsy (Sabah)
bis
bla
bos
brh
bre
bug
bul
mya
bsk
xuu
bfa
bak
eus
bsq
941
792
786
688*
697
796*
Bannock
BANTU
Bari
Bashkir
BASQUE
Bassa
uncoded;
code same
Banjuni (see Swahili) as Swahili)
BALOCHI
Bambara
Census Language
Namea
ISO 639-3
Census
Individual
a
Code
languageb
bal (macro with
3 subs:
Eastern,
Southern,
659 Western)
793* bam
ba
eu
bal
bm
cad
bre
bug
bul
mya / bur
bis
bla
bos
bik
bho
bel
bih
bg
my
br
bs
bi
be
bh
ben
bn
ber
(collective)
bak
eus / baq
bnt
bam
Bikol
Bisayan
(Cebuano is a
subset of
Bisayan)
Bislama
Siksika
Bosnian
Brahui
Breton
Buginese
Bulgarian
Burmese
Burushaski
Khoe
Kxoe
Kado, Caddoe; Nearly
Caddo
extinct
Kato
Extinct
Cahuilla
Nearly extinct
Cajun, French
Berber (other)
Bhili
Bhojpuri
Belarusian
Belorussian
Bihari
Northern
Paiute
Bantu (other)
Bari
Bashkir
Basque
Bassa
Behdini's code
(bdf) was
retired from
use and
suggest kmr
Northern
Kurdish
Bembe
Bengali
Baluchi
Bambara
ISO 639-2 ISO 639-1
Individual Individual ISO Language Other Names and
languageb languageb Nameb
Additional Information
TABLE I-1 Subcommittee Template: Comparison of Spoken Language Categories and Coding
x
x
x
x
x
x
x
x
x
x
x
x
x
x
x
x
x
x
x
x
x
x
x
x
x
x
x
x
x
x
x
x
x
x
x
x
x
x
x
x
x
x
x
x
x
x
x
x
x
x
x
x
x
x
x
x
x
x
x
x
x
x
x
x
x
x
x
x
x
x
x
Contra
NACHC
NY
Reported in Kaiser
Costa HRET
Sutter
the Census Permanente Health Hospital Survey of Language Presbyterian
c
d
d
f
g
h
Line Use Hospitale
SFGHe UW e Healthe
Health Plan Plan
Survey CHCs
2000
242
shu (Chadian
782 Arabic)
779 cld
cjm (Eastern),
735 cja (Western)
752 cha
708
859
943
933
921
810
975
916
CAUCASIAN
CAYUGA
Cebuano
CHADIC
Chaldean
CHAM
CHAMORRO
Chaochow; ChaoChou; Chaozhou
(code differs from Min
Nan)
CHASTA COSTA
CHEMEHUEVI
CHEROKEE
CHETEMACHA
CHEYENNE
CHIBCHAN
Chickasaw
715* wuu
883 chh
965 chn
819 ciw
Chinese Wu,
Shanghainese
Chinook
CHINOOK JARGON
Chippewa
CHINESE
chr
ctm
chy
chb
cic
zho (macro
with 13
subs:including
708 cmn Mandarin)
696
929 cay
744 ceb
Carib
CAROLINIAN
CATALONIAN
726
Census
Codea
968 knj
yue (sub of
711 Chinese)
car (Caribe)
crb (Carib
974 Island)
751 cal
626 cat
CANTONESE
Canjobal
Census Language
Namea
Cambodian (same
code as Khmer)
ISO 639-3
Individual
languageb
chn
zho / chi
chy
chb
chr
cha
ceb
cau
cat
zh
ch
ca
Many languages belong
to Chadic group and are
used beyond borders of
Chad; in Chad itself
Chadic Arabic is a
common language
Chinese, Wu,
Shanghainese
Chinook
Nearly extinct
Chinook
Jargon
Chippewa
Chippewah; Chipewyan
Chinese
Chadian
Arabic
Chaldean NeoAramaic
Chaldean dialects
Cham
(Eastern,
Western)
Chamorro
Chaochow;
Chao-Chou;
Chaozhou
(see Min Nansame ISO
code)
Chasta Costa extinct
Ute-Southern
Paiute (see
below)
Cherokee
Chitimacha
Extinct
Cheyenne
Chibcha
Chickasaw
Carolinian
Catalan
Caucasian
(other)
Cayuga
Cebuano
Cantonese
ISO 639-2 ISO 639-1
Individual Individual ISO Language Other Names and
languageb languageb Nameb
Additional Information
Cambodian
(see Khmer)
Kanjobal,
Western
TABLE I-1 Subcommittee Template: Comparison of Spoken Language Categories and Coding
x
x
x
x
x
x
x
x
x
x
x
x
x
x
x
x
x
x
x
x
x
x
x
x
x
x
x
x
x
x
x
x
x
x
x
x
x
x
x
x
x
x
x
x
x
x
x
x
Contra
NACHC
NY
Reported in Kaiser
Costa HRET
Sutter
the Census Permanente Health Hospital Survey of Language Presbyterian
c
d
d
f
g
h
Line Use Hospitale
SFGHe UW e Healthe
Health Plan Plan
Survey CHCs
2000
24
892 mrc
896 coc
836 crd
837 col
841 oka
938 com
868 mjd
kfa
cos
cos
cku
cow
cre (macro with
6
811 sublanguages) cre
mus
920 mus
COCOMARICOPA
Cocopah (see Delta
River Yuman)
COEUR D'ALENE
COLUMBIA
Colville
COMANCHE
Concow
Coorgi
Corsican
Coushatta
COWLITZ
623*
650
904
975
950
783
642
907
615
Creole
CROATIAN
CROW
Cuna
CUPENO
CUSHITE
CZECH
DAKOTA
DANISH
CREE
Creek
870 csi
COAST MIWOK
many codes to
match different
types of creole
hrv
hrv / scr
hr
cro
kvn (Border
Kuna) cuk
(San Blas
Kuna)
cup
cus
(collective)
ces
ces / cze
cs
dak
dak
dan
dan
da
cr
co
Cocopa
696
835 clm
Circassian (same
code as Caucasian)
CLALLUM
698
619*
919
838
Maricopa
901
761 chk
684 chv
CHUMASH
Chuukese
CHUVASH
Border Kuna
San Blas Kuna
Cupeno
Extinct
Cushitic
(other)
Czech
Dakota
Danish
Creole (many
choices)
Croatian
Crow
Cree
Creek
Coeur d'Alene Nearly extinct
ColumbiaWenatchi
OkanaganColville
Comanche
Northwest
Maidu
Konkau; Nearly extinct
Coorge,Kurja, Khurgi,
Kodava
Kadagi
Corsican
Koasati
Cowlitz
Extinct
Delta River Yuman
Miwok, Coast Extinct
978 apm
908
916 cho
Census
Codea
ISO 639-2 ISO 639-1
Individual Individual ISO Language Other Names and
languageb languageb Nameb
Additional Information
MescaleroChiricahua
Apache
Nearly extinct
cho
Choctaw
retired code
for Chumash Extinct
chk
Chuukese
chv
cv
Chuvash
Circassian
(see
Caucasian
languages)
Clallam
Klallam; Nearly extinct
CHIRICAHUA
CHIWERE
CHOCTAW
Census Language
Namea
ISO 639-3
Individual
languageb
TABLE I-1 Subcommittee Template: Comparison of Spoken Language Categories and Coding
x
x
x
x
x
x
x
x
x
x
x
x
x
x
x
x
x
x
x
x
x
x
x
x
x
x
x
x
x
x
x
x
x
x
x
x
x
x
x
x
x
x
x
x
Contra
NACHC
NY
Reported in Kaiser
Costa HRET
Sutter
the Census Permanente Health Hospital Survey of Language Presbyterian
c
d
d
f
g
h
Line Use Hospitale
SFGHe UW e Healthe
Health Plan Plan
Survey CHCs
2000
244
prs (same code
as Dari
Persian)
fij
fil
fin
nld (same as
Dutch)
876 yok
multiple
languages
such as dru
(Rukai) sai
(Saisiyat) tay
(Tayal) tsy
714 (Tsou)
713*
610
Flemish
Foo Chow (see
FUCHOW)
FORMOSAN (same
code as Taiwanese)
cpe
nld/dut
fij
fil
fin
est (macro with
est
680 2 subs)
780*
ewe
796 ewe
865 ewk
fat (sub of
fat
796 Akan)
fao
618 fao
802
601
uncoded uncoded
656
771
742
679
FOOTHILL NORTH
YOKUTS
(distinguished from
Tachi-Valley Yokuts)
del
nl
fi
fj
fo
ee
et
Flemish
Diula
Ipai
Farsi Persian
Nearly extinct
See Amharic, Tigrigna
Formosan
Yokuts (single
code; also
includes TachiValley Yokuts) Nearly extinct
see Min Dong
Flemish
Farsi Eastern
Persian
Fijian
Filipino
Finnish
Fanti
Faroese
Estonian
Ethiopian
Ewe
Eyak
English-based English Creoles Belize,
Creoles
Guyanese
Eosture
Numerous
possibilities
Dinka
Dravidian
(other)
Dutch
Dyula
Efik
English
Cocopa
Kumiai,
Northern
Diegueno
Delaware
Dari Persian
ISO 639-2 ISO 639-1
Individual Individual ISO Language Other Names and
languageb languageb Nameb
Additional Information
895 dih
din (macro with
din
784 5 sub)
dra
(collective)
698
nld/dut
nl
610 nld
dyu
793* dyu
efi
797 efi
eng
eng
en
896 coc
Farsi
FIJIAN
Filipino
FINNISH
Fanti
FAROESE
ESTONIAN
Ethiopian
Ewe
EYAK
ESKIMO
English Creoles
Belize, Guyanese
Eosture
DRAVIDIAN
DUTCH
Dyula
EFIK
English
Dinka
DIEGUENO
DELAWARE
DELTA RIVER
YUMAN
Dari
Census Language
Namea
ISO 639-3
Census
Individual
a
Code
languageb
prs (gbz for
Dari
656 Zoroastrian)
del (macro with
812 2 subs)
TABLE I-1 Subcommittee Template: Comparison of Spoken Language Categories and Coding
x
x
x
x
x
x
x
x
x
x
x
x
x
x
x
x
x
x
x
x
x
x
x
x
x
x
x
x
x
x
x
x
x
x
x
x
x
x
x
x
x
x
x
x
x
x
x
x
x
x
x
x
x
x
x
x
x
x
x
x
x
x
x
x
x
x
x
x
x
Contra
NACHC
NY
Reported in Kaiser
Costa HRET
Sutter
the Census Permanente Health Hospital Survey of Language Presbyterian
c
d
d
f
g
h
Line Use Hospitale
SFGHe UW e Healthe
Health Plan Plan
Survey CHCs
2000
24
Guatemalan
GUJARATHI
Guarani
GONDI
GORONTALO
GREEK
Greenlandic
Gros Ventre
Guamanian (see
Chamorro, same
code)
Ghani (multiple
languages coded the
same)
GILBERTESE
fr
French Cree
(see Michif)
French-based
Creoles and
Pidgin (other)
Fox
French
gon
gor
ell/gre
kal
gil
kat/geo
deu/ger
gaa
ful
gu
gn
ch
el
kl
ka
de
ff
Fuzhou; Foochow, Min
Dong; Foochownese
Guatemalean
Gujarati
Guarani
Chammoro
Gondi
Gorontalo
Greek
Greenlandic
Gros Ventre
Fulah (also
Fula)
Fur
Ga
Gadang
Garifuna
Georgian
German
multiple
languages
(see specific
codes: Ga,
Ibo, Igbo,
Krahn, Kru,
Twi, Ashanti,
Bassa, Akan,
Ewe, Fanti)
Gilbertese
Nearly extinct
Ghanian
Caribe
Fukienese
(see Min Nan) Fukien; Fukianese
frr (No.) frs
(East) fry fy
West
(Western) Frisian
Min Dong
Chinese
cpf
fra/fre
ISO 639-2 ISO 639-1
Individual Individual ISO Language Other Names and
languageb languageb Nameb
Additional Information
cha
752 cha
grn (macro
language with 5
grn
976 subs)
multiple
968 lanugages
guj
667 guj
796*
753 gil
gon (macro
700 with 2 subs)
749 gor
637 ell
615* kal
808 ats
794
789
796
uncoded
974
696
607
714
Fukien (see Min Nan)
FULANI
Fur
Ga
Gaddang
Garifuna
Georgian
GERMAN
714*
Fukianese (see Min
Nan)
ful (macro with
9 sub
languages)
fvr
gaa
gdk
cab
kat
deu
713 cdo
frr frs fry frr
Northern; frs
Eastern; fry
612 Western
623
multiple Cree
816 languages
620*
813 sac
620 fra
Census
Codea
FUCHOW
FRISIAN
FRENCH CREOLE
FRENCH CREE
FOX (see Meskawkie)
FRENCH
French Canadian (see
FRENCH)
Census Language
Namea
ISO 639-3
Individual
languageb
TABLE I-1 Subcommittee Template: Comparison of Spoken Language Categories and Coding
x
x
x
x
x
x
X
x
x
x
x
x
x
x
x
x
x
x
x
x
x
x
x
x
x
x
x
x
x
x
x
x
x
x
x
x
x
x
x
x
x
x
x
x
x
x
x
x
x
x
x
x
x
x
x
x
x
x
x
x
x
x
x
x
x
x
x
x
x
x
x
x
x
x
x
x
Contra
NACHC
NY
Reported in Kaiser
Costa HRET
Sutter
the Census Permanente Health Hospital Survey of Language Presbyterian
c
d
d
f
g
h
Line Use Hospitale
SFGHe UW e Healthe
Health Plan Plan
Survey CHCs
2000
246
623 hat
hak (sub of
709 Chinese)
849 haa
782 hau
898 yuf
776 haw
Haitian Creole
HAVASUPAI
HAWAIIAN
hsn
682 hun
860 hup
932
742*
797
796
617
796
Hunanese
HUNGARIAN
HUPA
Huron (see Wyandot)
Ibanag
Ibibio
Ibo (also see Igbo)
ICELANDIC
Igbo
Igorot
ILOCANO
962 tew
899
957 hch
isl
ibo
multiple
746 languages
746 ilo
ibg
ibb
714
948 hop
ilo
isl/ice
ibo
hun
hup
is
ig
hu
Fukien, Southern Min
from Fukian
Igorot
Iloko
Icelandic
Igbo
Ibanag
Ibibio
Ibo
Igorot ethnic groups in
Phillipines
Ilokano
Extinct
Xiang Chinese Xiang, Hunan, Hsiang
Hungarian
Hupa
Nearly extinct
Huichol
Tewa (USA)
Hokkien (see
Min Nan)
Hopi
Hmong
Ho-Chunk
hmn
Hidatsa
Hindi
Hindi Fiji
Hindko
hi
he
ha
ht
Northern Haida - nearly
extinct
Haitian,
Haitian Creole
Hakka
Chinese
Han
Nearly extinct
Hausa
HavasupaiWalapaiYavapai
Hawaiian
Hawaiian
Creole
Hebrew
Haida
Gwich'in
hmn (Macro
722 with 24 subs)
909 win
hin
heb
haw
hau
hat
hai
gwi
Sea Island
Creole English
Farefare
ISO 639-2 ISO 639-1
Individual Individual ISO Language Other Names and
languageb languageb Nameb
Additional Information
hno (Hindko,
Northern) hnd
(Hindko,
663* Southern)
hid
hin
hif
Hmong
Ho Chunk
Hokkien (same code
as Fukien and Min
Nan)
HOPI
Hopi-Tewa (see
Tewa)
Hualapai
Huichole
Hindko
Hawaiian Pidgin
HEBREW
HICHITA
HIDATSA
HINDI
Hindi Fijian
hwc
heb
846 hai
HAIDA
603
778
918
905
663
663/671
852 gwi
Gwichin (see Kuchin)
HAKKA
HAN
Hausa
605 gul
795 gur
Census
Codea
GULLAH
GUR
Census Language
Namea
ISO 639-3
Individual
languageb
TABLE I-1 Subcommittee Template: Comparison of Spoken Language Categories and Coding
x
x
x
x
x
x
x
x
x
x
x
x
x
x
x
x
x
x
x
x
x
(2 types) xx
x
x
x
x
x
x
x
x
x
x
x
x
x
x
x
x
x
x
x
x
x
x
x
x
x
x
x
x
x
x
x
x
x
x
x
x
x
x
x
x
x
x
x
x
x
x
x
x
x
x
x
x
x
Contra
NACHC
NY
Reported in Kaiser
Costa HRET
Sutter
the Census Permanente Health Hospital Survey of Language Presbyterian
Line Useh Hospitale
SFGHe UW e Healthe
Health Pland Pland Surveyf CHCsg
2000c
24
gle
718
887
673
643
944
686
KARACHAY
KARAKALPAK
KAREN
KAROK
KASHMIRI
KASHUBIAN
KAWAIISU
KAZAKH
kyh
kas
csb
xaw
kaz
688 krc
685 kaa
Kanjobal/Kanjoval
(see Conjobal)
KANNADA
KANSA
710 hsn
uncoded
kgb for
Kanjobal; knj
for Kanjobal
968* Western
702 kan
910 ksk
KAN, HSIANG
Kanalese
981 fla
977 apj
719 kac
JICARILLA
KACHIN
KALISPEL
601 jam
723 jpn
736 jav
ks
kk
kaz
kn
ja
jv
it
ga
ik
id
kas
csb
krc
kaa
kar (16
other
specific
Karen
language
codes)
kan
kac
jpn
jav
ita
iro
gle
ipk
ipk
iow
ind
Nearly extinct
x
x
x
x
x
x
Karen
Languages
Karok
Kashmiri
Kashubian
Kawaiisu
Kazakh
Nearly extinct
Nearly extinct
x
x
x
x
x
x
x
x
x
x
x
x
x
x
x
x
x
x
x
x
x
x
x
x
x
x
x
x
x
x
x
x
x
x
x
x
x
x
x
x
x
x
x
x
x
x
x
x
x
x
x
x
x
x
x
x
x
x
x
x
x
x
x
x
x
x
x
x
Contra
NACHC
NY
Reported in Kaiser
Costa HRET
Sutter
the Census Permanente Health Hospital Survey of Language Presbyterian
c
d
d
f
g
h
Line Use Hospitale
SFGHe UW e Healthe
Health Plan Plan
Survey CHCs
2000
Kanjobal
Kannada
Kansa
KarachayBalkar
Kara-Kalpak
Nearly extinct
Xiang Chinese Xiang, Hunan, Hsiang
Jamaican
Creole English
Japanese
Javanese
Jicarilla
Apache
Kachin
Kalispel-Pend
d' Oreille
Inupiaq
(see Inupiaq)
Iowa-Ota
Iranian, other
Irish
Iroquoian
languages
(see Tiwa)
Italian
Jakartanese
Indonesian
ISO 639-2 ISO 639-1
Individual Individual ISO Language Other Names and
languageb languageb Nameb
Additional Information
Ilongot
ind
925
960
619 ita
uncoded
625*
732
850
803
803
908
656*
635
uncoded
JAMAICAN CREOLE
JAPANESE
JAVANESE
IROQUOIS
Isleta (see Tiwa)
ITALIAN
Jakartanese
Indigenous Mexican
INDONESIAN
INGALIT
Inupiaq
INUPIK
Iowa
Iranian, other
IRISH GAELIC
Census Language
Namea
Ilongo
India languages
INDIA, nec
Indigenous Central
American
ISO 639-3
Census
Individual
a
Code
languageb
743 Ilk
662*
662
TABLE I-1 Subcommittee Template: Comparison of Spoken Language Categories and Coding
24
KURDISH
Kurmanji
KURUKH
KUSAIEAN (see
Kosraean)
KUTENAI
KRU, IBO, YORUBA
KUCHIN (see
Gwichin)
Krahn
KRIO
Kpelle
Konkani
KOREAN
Kosovan
Kosraean (see
Kusaiean)
KOYUKON
880 kla
919 cku
KLAMATH
KOASATI
kir
run
kik
kin
khm
khi
(collective
language)
kut
Kusaiean
Kutenai
Kurdish
754
828 kut
ku
Kru languages
Krahn
Krio
Kpelle
Kosraean
Koyukon
Kurukh
kro
(collective)
kpe
kos
Konkani
Korean
Nearly extinct
Kurdi
Kutchin; Athabaschan
language
Kiowa Apache Nearly extinct
Kirghiz
Rundi
KlamathModoc
Nearly extinct
Koasati
Khoisan
(Other)
Kickapoo
Kikuyu
Kinyarwanda
Kiowa
kur (macro with
3 subs) kmr
(Northern
kur
658 Kurdish)
658 kmr
kru
705 kru
852
796
754 kos
851 koy
kpe (macro
793 with 2 subs)
kqo (Eastern
Krahn) krw
(Western
796* Krahn)
602 kri
ko
ky
rn
ki
rw
km
Khmer,
Central and
Northern)
Keres
ISO 639-2 ISO 639-1
Individual Individual ISO Language Other Names and
languageb languageb Nameb
Additional Information
kok (macro with
2 subs) kmn
(Konkani as an
individual
666 language)
kor
724 kor
uncoded
980 apk
687 kir
792* run
KIOWA-APACHE
KIRGHIZ
Kirundi
kic
kik
kin
kio
790
814
792
792
863
KHOISAN
KICKAPOO
Kikuyu
Kinyarwanda
KIOWA
Khmer
KERES
Keresan
Census Language
Namea
ISO 639-3
Census
Individual
a
Code
languageb
kee (Keres
Eastern) kjq
(Keres
924 Western)
924
khm (Central
Khmer) kxm
(Northern
726 Khmer)
TABLE I-1 Subcommittee Template: Comparison of Spoken Language Categories and Coding
x
x
x
x
x
x
x
x
x
x
x
x
x
x
x
x
x
x
x
x
x
x
x
x
x
x
x
x
x
x
x
x
x
x
x
x
x
x
x
x
x
x
x
x
x
x
x
x
x
x
x
x
Contra
NACHC
NY
Reported in Kaiser
Costa HRET
Sutter
the Census Permanente Health Hospital Survey of Language Presbyterian
c
d
d
f
g
h
Line Use Hospitale
SFGHe UW e Healthe
Health Plan Plan
Survey CHCs
2000
249
867
829
738
739
703
677
777*
968
906
Maidu (see Mountain
Maidu)
MAKAH
MALAGASY
MALAY
MALAYALAM
Maldivian
Maltese
Mam
MANDAN
luo (Kenya and
Tanzania) luw
luo
785 (Cameroon)
644 xls
792* xog
Luo
LUSATIAN
Lusoga
ltz
ymm
mkd
mad
nmu
(Northeast)
vmv (Valley)
myh
mlg (macro
with 10 sub
languages)
msa (macro
with 13 subs)
mal
div
mlt
mam
mhq
839 str
Lummi
613
703*
648
737
833 cea
792 lug
951 lui
LOWER CHEHALIS
Luganda
LUISENO
LUXEMBOURGIAN
Maay
MACEDONIAN
MADURESE
654
792* lin
653 lit
mal
div
mlt
ms
ml
dv
mt
mg
mk
mkd/mac
mad
mlg
lb
lg
ln
lt
lv
la
lo
ltz
lug
lui
lin
lit
777* apc
812
Lebanese
Lenape
LETTISH (see
Latvian)
Lingala
LITHUANIAN
lav
654 lav
lat
coded as
English lat
Latin
Latvian (see Lettish)
lao
smn
983-998
725 lao
681 smn
924 kjq
907 lkt
Malay
Malayalam
Maldivian
Maltese
Mam
Mandan
Malagasy
Luxemburgish
Maay
Macedonian
Madurese
Northeast
Maidu; Valley
Maidu
Makah
Luo
Lusitanian
Soga
Lingala
Lithuanian
Lower
Chehalis
Ganda
Luiseno
See Salish,
North Straits
Latvian
Northern
Levantine
Arabic
Latin
Lao
Inari Sami
Nearly extinct
Northeast Maidu- nearly
extinct; Valley Maidu extinct
Extinct
Luxembourgeois
Extinct
extinct
ISO 639-2 ISO 639-1
Individual Individual ISO Language Other Names and
languageb languageb Nameb
Additional Information
Kwakiutl
lad
Ladino
Western Keres
(dialectLaguna)
Lakota
Laguna (same code
as Acoma)
Lakota
LANGUAGE
SPECIFIED, NOT
LISTED
LAOTIAN
LAPP
Census Language
Namea
KWAKIUTL
LADINO
ISO 639-3
Census
Individual
a
Code
languageb
830 kwk
627 lad
TABLE I-1 Subcommittee Template: Comparison of Spoken Language Categories and Coding
x
x
x
x
x
x
x
x
x
x
x
x
x
x
x
x
x
x
x
x
x
x
x
x
x
x
x
x
x
x
x
x
x
x
x
x
x
x
x
x
x
x
x
x
x
x
x
x
x
x
x
x
x
x
x
x
x
x
x
x
x
x
x
x
x
x
x
x
Contra
NACHC
NY
Reported in Kaiser
Costa HRET
Sutter
the Census Permanente Health Hospital Survey of Language Presbyterian
c
d
d
f
g
h
Line Use Hospitale
SFGHe UW e Healthe
Health Plan Plan
Survey CHCs
2000
x
x
x
20
978 apm
813 sac
625*
956
817 mia
7 different subs
of Hmong
(hmn) 20
specific Miao
named
722 languages
721
917
818
750
721
917
Mescalero Apache
Mesquakie
Mexican
Mexicano
MIAMI
MIAO-YAO, MIEN
Miccosukee
MICMAC
MICRONESIAN
Mien
MIKASUKI
ium
mik
mik
mic
793 sim
815 mez
Mende
MENOMINI
MIAO, HMONG
793 men
Mende
968
798 mdd
765
712 cmn
793
man (macro
with 7 subs:
e.g., mnk
793 Mandinka)
mri (Maori) rar
(Maori Cook
774 Islands)
970 arn
666 mar
mrq
(Marquesan
North) mqm
(Marquesan
772 South)
755 mah
786 mas
968 yua
Census
Codea
MARQUESAN
MARSHALLESE
Masai
Maya
MAYAN
LANGUAGES
MBUM AND
RELATED
MELANESIAN
MAORI
MAPUCHE
MARATHI
Mandingo
MANDARIN
MANDE
Census Language
Namea
ISO 639-3
Individual
languageb
mic
men
myn
(collective)
mah
mas
mh
mr
Mandigo; Mandinka
lu Mien
Mikasuki
Miao, Hmong
Miao-Yao,
Mien
Mikasuki
Micmic
Miami
Yiu Mien, Ban Yao
Extinct
Mende (Papua
New Guinea)
Menominee
Nearly extinct
MescaleroChiricahua
Apache
Mesquaki
Mexican
Mbum
Melanesian
Mende (Sierra
Leone)
Marquesan
Marshallese
Masai
Yucateca
Mayan
Languages
Maori
Mapuche
Marathi
mri/mao
rar
arn
mar
mi
Mandingo
man
ISO 639-2 ISO 639-1
Individual Individual ISO Language Other Names and
languageb languageb Nameb
Additional Information
Mandarin
Chinese
TABLE I-1 Subcommittee Template: Comparison of Spoken Language Categories and Coding
x
x
x
x
x
x
x
x
x
x
x
x
x
x
x
x
x
x
x
x
x
x
x
x
x
x
x
x
x
x
x
x
x
x
x
x
x
x
x
x
x
x
x
x
x
x
x
x
x
x
x
x
x
x
x
x
x
x
x
Contra
NACHC
NY
Reported in Kaiser
Costa HRET
Sutter
the Census Permanente Health Hospital Survey of Language Presbyterian
c
d
d
f
g
h
Line Use Hospitale
SFGHe UW e Healthe
Health Plan Plan
Survey CHCs
2000
21
816 crg
872
Miwok
MONGOLIAN
MOLUCCAN
631* ron
Moldovan (Romanian
dialect)
ron/rum
moh
cai (central
American
Indian
collective
code)
max (Northern
Maluku) alo
Larike731 Wakasilu
mon (macro
mon
694 with 2 subs)
kla
mov
moh
mkj
880
893
926
756
Mixtec
Miytero
Modoc (see Klamath
Modoc)
MOHAVE
MOHAWK
MOKILESE
52 separate
individual
languages with
no macro or
collective
971 category
uncoded
967
967 miq
uncoded hna
uncoded myi
740 min
665
Miskito (see
MISUMALPAN)
MISUMALPAN (see
Miskito)
Mitchif (see French
Cree)
Mina
Mina
MINANGKABAU
Mirpuri
mn
ro
Min Nan
min
nan (sub of
Chinese with
dialects without
714 codes: Hokkien
Mongolian
Maluku
x
x
x
x
KlamathModoc
Mohave
Mohawk
Mokilese
Moldovan
(Romanian
dialect)
x
x
x
x
Nearly extinct
Central Sierra Miwok,
Northern Sierra Miwok,
Lake Miwok - nearly
extinct; Bay Miwok extinct
x
x
x
x
xx
2 types
x
x
x
x
x
x
x
x
x
x
x
x
x
Contra
NACHC
NY
Reported in Kaiser
Costa HRET
Sutter
the Census Permanente Health Hospital Survey of Language Presbyterian
c
d
d
f
g
h
Line Use Hospitale
SFGHe UW e Healthe
Health Plan Plan
Survey CHCs
2000
Mixtec
(Mixteco,
Mixtex,
Mexico)
Michif
Miskito
Minnan, including
Min Nan
Taiwanese,
Mina
(Cameroon)
Mina (India)
Minangkabau
Mirpuri
Min dialects
Min (the 708 code
differenciates from
Min Nan)
Census
Codea
mnp Min Bei
Chinese cdo
Min Dong
Chinese
nan Min Nan
Chinese czo
Min Zhong
708 Chinese
Census Language
Namea
ISO 639-2 ISO 639-1
Individual Individual ISO Language Other Names and
languageb languageb Nameb
Additional Information
ISO 639-3
Individual
languageb
TABLE I-1 Subcommittee Template: Comparison of Spoken Language Categories and Coding
22
842
Muckleshoot (see
Puget Sound Salish)
Northern
Paiute
x
941 pao
NORTHERN PAIUTE
Extinct
x
x
x
x
Niuean
Wintu
Nootka
x
x
x
x
842
769 niu
873 wit
831-832 noo
840
Nilo-Saharan
(Other)
Nigerian
Nigerian
Pidgin
Nepalese
x
x
x
niu
Nauru
Navaho/Navaj
o
Navajo
nv
nv
nd (North)
nr (South) Ndebele
Neapolitan
ne
Nepali
Nez Perce
na
x
x
x
x
x
x
x
785
789
NILO-SAHARAN
ssa
(collective)
nav
nav
nde (North)
nbl (South)
nap
nep
nau
Nahuatl
Munda
Muong
Creek
(Muskogee)
(see Northeast
Maidu)
ISO Language Other Names and
Nameb
Additional Information
Mon-Khmer
Other)
Nearly extinct
South Slavic
Serbian
Erzya
Mortlockese
x
x
x
x
x
x
x
x
x
x
x
x
x
x
x
x
x
x
x
x
x
x
x
x
Contra
NACHC
NY
Reported in Kaiser
Costa HRET
Sutter
the Census Permanente Health Hospital Survey of Language Presbyterian
c
d
d
f
g
h
Line Use Hospitale
SFGHe UW e Healthe
Health Plan Plan
Survey CHCs
2000
NILOTIC (see other
languages coded 785)
Nisqualli (see Puget
Sound Salish)
NIUEAN
NOMLAKI
NOOTKA
NOOTSACK
786
796/604* pcm
mzk (Mabile)
796 fuv (Fulfulde)
864 nav
864 nav
nde (North) nbl
792 (South)
uncoded nap
674 nep
881 nez
966*
758 nau
920 mus
28 individual
languages with nah
(collective)
956 codes
NILO-HAMITIC (see
other languages
coded 786)
Nigerian
Nigerian Pidgin
English
Ndebele
Neapolitan
NEPALI
NEZ PERCE
NAVAHO
Navajo
Nahuatl
Native American
Indian
NAURUAN
MUNDA
MUONG
MUSKOGEE (see
Creek)
867
MOUNTAIN MAIDU
(see Maidu)
myv
ISO 639-2 ISO 639-1
Individual Individual
languageb languageb
mkh
(collective)
unx (Munda as
individual
mun
(collective)
706 language)
729 mtq
726
939
651* srp
683 myv
757 mrl
Census
Codea
Census Language
Namea
MON-KHMER,
CAMBODIAN
MONO
Montenegrin
Mordvin
MORTLOCKESE
ISO 639-3
Individual
languageb
TABLE I-1 Subcommittee Template: Comparison of Spoken Language Categories and Coding
2
954* stp
Otham
Other African
languages
Other Native North
American languages
Other Slavic
languages
Other specified
languages
x
x
x
composite
composite
x
composite
x
x
x
composite
Miscellaneous
Nearly extinct
Other language
possibly
Tephuan,
Southeastern
Oromo
Osage
Ossetian,
Ossetic
x
x
x
x
x
x
x
os
om
or
Ojibway
Other Indo-European
languages
861
OTHER
ATHAPASCAN-EYAK
LANGUAGES
oss
orm
osa
ori
Omaha-Ponca
Oneida
Onondaga
Oriya
Ojibwa
Okanagan
x
x
x
x
x
x
x
x
x
x
x
x
x
x
x
x
x
x
x
x
x
x
x
x
x
x
x
x
x
x
x
Contra
NACHC
NY
Reported in Kaiser
Costa HRET
Sutter
the Census Permanente Health Hospital Survey of Language Presbyterian
c
d
d
f
g
h
Line Use Hospitale
SFGHe UW e Healthe
Health Plan Plan
Survey CHCs
2000
Other Indic languages composite
999
Other and unspecified
languages
composite
661 oss
OSSETE
Oromo
OSAGE
oma
one
ono
ori
orm (macro
783 with 4 subs)
912 osa
911
927
928
670
OMAHA
ONEIDA
ONONDAGA
ORIYA
OJIBWA
OKANOGAN
nn
nb
Nubian
Languages
Nuer
Nukuoro
Occitan
see Lakota
nno
nob
nub
(collective)
787
785 nus
775 nkr
oci
oc
621* oci
907
oji (macro with
oji
oj
819 7 subs)
841 oka
616 nno
999
Norwegian Nynorsk
NOT REPORTED
NUBIAN
Nuer
NUKUORO
Occitan
Oglala
616 nob
Norwegian
Norwegian
Bokmal
Norwegian
Nynorsk
no
Nearly extinct
ISO 639-2 ISO 639-1
Individual Individual ISO Language Other Names and
languageb languageb Nameb
Additional Information
nor (macro with
nor
616 2 subs)
869
Census
Codea
Norwegian Bokmal
NORWEGIAN
NORTHWEST
MAIDU (see Concow)
Census Language
Namea
ISO 639-3
Individual
languageb
TABLE I-1 Subcommittee Template: Comparison of Spoken Language Categories and Coding
24
Census
Codea
oto
(collective)
821 pqm
gcf
(Guadeloupean
Creole French),
jam (Jamaican
Creole), gcr
(Guianese
622 Creole French)
PASSAMAQUODDY
PATOIS
PASHTO
954 ood
pap
630 pap
pst (Central)
pbt (Southern)
657 pbu (Northern)
Papago
PAPIA MENTAE
pam
pam
par
pag
pan
pan
pau
pau
pao
Pahari
940
676
759
804*
748
947
745
665
kfx (Kulla) pfz
(Mahasu) phr
665* (Potwari)
PAIUTE
PAKISTAN, nec
PALAU
Paleo-siberian
PAMPANGAN
PANAMINT
PANGASINAN
PANJABI
801 ems
pag
pa
Patois (several
options)
Pashto
MalecitePassamaquod
dy
Pangasinan
Panjabi
see Tohon
O'odham
Papiamento
Pampanga
Paluan
Pahari
Northerrn
Paiute (see
Ute-Southern
Paiute below)
Pacific Gulf
Yupik (see
Yupik for other
languages)
Otomi (9
individual
languages)
Ottawa
Oto-Manguen
Nearly extinct
ISO 639-2 ISO 639-1
Individual Individual ISO Language Other Names and
languageb languageb Nameb
Additional Information
otm (Eastern
Highland) ots
(Estado de
Mexico), otz
Ixtenco , ote
Mezquital), otq
(Queretano),
ott (Temoaya),
otx
(Texcatepec), oto
(collective)
971 otl (Tilapa)
820 otw
628
971
PACIFIC GULF
YUPIK
Otomi
OTTAWA
PACHUCO
OTO-MANGUEN
Other West Germanic
languages
composite
Census Language
Namea
ISO 639-3
Individual
languageb
TABLE I-1 Subcommittee Template: Comparison of Spoken Language Categories and Coding
x
x
x
x
x
x
x
x
x
x
x
x
x
x
x
x
x
x
x
x
x
x
x
x
x
x
x
x
x
x
x
x
x
x
x
x
Contra
NACHC
NY
Reported in Kaiser
Costa HRET
Sutter
the Census Permanente Health Hospital Survey of Language Presbyterian
Line Useh Hospitale
SFGHe UW e Healthe
Health Pland Pland Surveyf CHCsg
2000c
2
885
871 pmw
645 pol
766
pol
888 pmm (Pomo)
760 pon
913 oma
629 por
629
824 pot
POMO
PONAPEAN
PONCA (see Omaha
but different code)
PORTUGUESE
Portuguese Creole
POTAWATOMI
cpp
por
pon
pt
pl
x
x
x
Portuguesebased Creoles
and Pidgins
(other)
Potawatomi
x
x
x
x
x
multiple types
of Pidgin
Delaware Pidgin - extinct
Pima Bajo
(see
Achumawi)
Plains Miwok Nearly extinct
Polish
Polynesian
Central Pomo,
Southeasten Pomo,
Southern Pomo - nearly
extinct; Eastern Pomo,
Northeastern Pomo,
Northern - extinct
Pohnpeian
Omaha-Ponca
(both
languages
given same
code)
Portuguese
x
x
PIDGIN
PIMA
Pit River (see
Achumawi)
PLAINS MIWOK
POLISH
POLYNESIAN
x
cpi (Pidgin
English,
Chinese), wes
(Pidgin
Cameroon),
pcm (Pidgin,
Nigerian), tvy
(Pidgin Timor),
dep (Pidgin
604 Delaware)
954 pia
x
x
x
x
x
959
Persian
Phillipine
Other
Nearly extinct
Pennsylvania Dutch,
Amish, Amish-German
Extinct
742
fa
Pawnee
Pennsylvania
German
x
x
x
x
x
x
x
x
x
x
x
x
x
x
x
x
x
x
x
x
x
x
x
x
x
Contra
NACHC
NY
Reported in Kaiser
Costa HRET
Sutter
the Census Permanente Health Hospital Survey of Language Presbyterian
c
d
d
f
g
h
Line Use Hospitale
SFGHe UW e Healthe
Health Plan Plan
Survey CHCs
2000
PICURIS (see Taos
and separate code for
Tiwa)
608 pdc
822
fas (macro with
2 subs: prs
Dari Persian
and pes
Western
656 Persian)
874
936 paw
Census
Codea
ISO 639-2 ISO 639-1
Individual Individual ISO Language Other Names and
languageb languageb Nameb
Additional Information
Phillipine Other
PERSIAN
PATWIN (dialect of
Wintu but Wintu has
different code)
PAWNEE
PENNSYLVANIA
DUTCH
PENOBSCOT
Census Language
Namea
ISO 639-3
Individual
languageb
TABLE I-1 Subcommittee Template: Comparison of Spoken Language Categories and Coding
26
Central
Siberian Yupik
SALISH
Samoan
882
788
804 ess
slh (South
Puget Sound)
839 str (Straits)
767 smo
SAHAPTIAN (close to
Nez Perce and
Klamath)
SAHARAN
SAINT LAWRENCE
ISLAND YUPIK
SALISH
SAMOAN
smo
ron/rum
rus
sm
ro
ru
rm
Romany see
above too
Romanian
Russian
Romansch
ROMANY
RUMANIAN
RUSSIAN
roh
632 roh
rom (macro
with 7 subs of
Romany or
678 Romani)
631 ron
639 rus
ro
Romansch
ron/rum
631 ron
Romanian
rm
632
Rajasthani
Rarotongan
RhaetoRomanic
Romanian
(See below)
Quechua
Quiche
Quileute
Quinault
qu
SALISH; Straits Salish nearly extinct
Romanian
Romance;
Romany;Romansch
Quileute; Nearly extinct
Extinct
Pushto
(See Puget
Sound Salish,
Southern)
Quapaw
Nearly extinct
Quechan
ps
RHAETO-ROMANIC
RAJASTHANI
RAROTONGAN
QUECHUA
Quiche
Quileute
QUINAULT
pus
ISO 639-2 ISO 639-1
Individual Individual ISO Language Other Names and
languageb languageb Nameb
Additional Information
FrancoProvencal
PUGET
SOUND
SALISH,
Southern
Pular
pan
pa
Punjabi
842
914 qua
894 yum
que (macro
with 44 subs of
Quechua or
que
972 Quichua)
968 quc
830 qui
843 qun
raj (macro with
raj
669 6 subs)
rar
773 rar
656
Pushto
Puyallup (see Puget
Sound Salish)
QUAPAW
Quechan
842
794
665
slh (South
Puget Sound)
str (Straits)
fuf
pan
pus (macro
with 3 sub
Pashto
languages)
621 frp
Census
Codea
PUGET SOUND
SALISH
Pular
Punjabi
PROVENCAL
Census Language
Namea
ISO 639-3
Individual
languageb
TABLE I-1 Subcommittee Template: Comparison of Spoken Language Categories and Coding
x
x
x
x
x
x
x
x
x
x
x
x
x
x
x
x
x
x
x
x
x
x
x
x
x
x
x
x
x
x
x
x
x
x
x
x
x
x
x
x
x
x
x
x
x
x
x
x
Contra
NACHC
NY
Reported in Kaiser
Costa HRET
Sutter
the Census Permanente Health Hospital Survey of Language Presbyterian
c
d
d
f
g
h
Line Use Hospitale
SFGHe UW e Healthe
Health Plan Plan
Survey CHCs
2000
2
979 apw
979 apw
SAN CARLOS
San Carlos Apache
(different code than
Apache)
SERBOCROATIAN
Serokoli
SERRANO
SCOTTIC GAELIC
SEBUANO
Seminole
SENECA
SERBIAN
kyl
srm
sag
san
sag
san
sh
sr
gd
(Scottish
Gaelic)
sg
sa
x
x
Serokola
Nearly extinct
SerboCroatian
Serrano
x
x
Seneca
Serbian
x
Scandinavian languages
x
x
x
x
Nearly extinct
x
x
x
x
x
x
x
x
x
x
x
x
x
x
x
x
x
x
x
Contra
NACHC
NY
Reported in Kaiser
Costa HRET
Sutter
the Census Permanente Health Hospital Survey of Language Presbyterian
c
d
d
f
g
h
Line Use Hospitale
SFGHe UW e Healthe
Health Plan Plan
Survey CHCs
2000
Scots; Scottic
Gaelic;
Scotish; Scottic Gaelic;
Cebuano
Kalapuya
Saramaccan
Sango
Sanskrit
San Juan
(multiple
languages)
Apache,
Western
(differs from
other Apache
codes)
Apache,
Western
(differs from
other Apache
codes)
multiple
languages
(Uralic and
Samoyed
roots like
Enets, Forest
enf and Enets,
Tundra enh)
ISO 639-2 ISO 639-1
Individual Individual ISO Language Other Names and
languageb languageb Nameb
Additional Information
sco (Scots) gla
(Scottish
sco gla
636 Gaelic
ceb
744 ceb
920
930 see
srp/scc
651 srp
hbs (macro
with 3 subs:
bos Bosnian,
hrv Croatian,
649 srp Serbian)
uncoded
952 ser
San Juan
SANDIA (different
code than Isleta)
961
Sango
798*
Sanskrit
662
Santa Clara (dialect of
Tewa)
962
SANTIAM
878
SARAMACCA
606
Scandinavian
languages
composite
poe (S.J.
Atzingo
Popoloca), mjc
(S.J. Colorado
Mixtec), zab
(S.J. Guelavia
Zapoteca), xtz
(S. J. Teita
962 Mixtec)
683
Census
Codea
Samoyed (see other
Uralic languages)
Census Language
Namea
ISO 639-3
Individual
languageb
TABLE I-1 Subcommittee Template: Comparison of Spoken Language Categories and Coding
2
677 sin
907
879 sis
649
646
652
689*
783
789
793* snk
SINHALESE
Sioux
SIUSLAW
Slavic
SLOVAK
SLOVENE
Sogdian
Somali
Songhai
Soninke
hsb (Upper
Sorbian) dsb
644* (Lower)
Sorbian languages
869 nsz
942 ute
625 spa
982 spo
SOUTHERN MAIDU
SOUTHERN PAIUTE
(different code than
Ute)
SPANISH
SPOKANE
South American
Indian (Other)
658* ckb
Sorani
957-958
872 skd
675 snd
SIERRA MIWOK
SINDHI
SONORAN (n.e.c)
804 ess
619* scn
Siberian Yupik
Sicilian
slk
slv
sog
som
727
sd
spa
sai
(collective)
wen
(collective)
hsb
(Upper)
dsb
(Lower)
son
snk
sla
slk/slo
slv
sog
som
es
so
sk
sl
sin
si
sio
(collective)
snd
scn
sn
st
tn
Extinct
Nisenan
(coded same
as UteSouthern
Paiute)
Spanish
Spokane
South
American
Indian (Other)
Sorbian
languages
Central
Kurdish
Slavic (Other)
Slovak
Slovenian
Sogdian
Somali
Songhai
languages
Soninke
Nearly extinct
Central
Siberian Yupik
Sicilian
Southern
Sierra Miwok Nearly extinct
Sindhi
Sinhalese/Sin
hala
Siouan
Languages
Siuslaw
Extinct
Wu Chinese
Shasta
Shawnee
Shona
Shoshoni
Sotho
Tswana
ISO 639-2 ISO 639-1
Individual Individual ISO Language Other Names and
languageb languageb Nameb
Additional Information
sot (Southern)
792* nso (Northern) sot nso
tsn
792* tsn
wuu (sub of
Chinese with
715 own code)
889 sht
825 sjw
sna
792 sna
946 shh
Census
Codea
Shanghainese
SHASTAN
SHAWNEE
Shona
SHOSHONI
SIBERIAN
LANGUAGES, nec
Sesotho
Setswana
Census Language
Namea
ISO 639-3
Individual
languageb
TABLE I-1 Subcommittee Template: Comparison of Spoken Language Categories and Coding
x
x
x
x
x
x
x
x
x
x
x
x
x
x
x
xx
2 types
x
x
x
x
x
x
x
x
x
x
x
x
x
x
x
x
x
x
x
x
x
x
x
x
x
x
x
x
x
x
x
x
x
x
x
x
x
x
x
x
x
x
x
x
x
x
x
x
x
x
x
x
x
Contra
NACHC
NY
Reported in Kaiser
Costa HRET
Sutter
the Census Permanente Health Hospital Survey of Language Presbyterian
c
d
d
f
g
h
Line Use Hospitale
SFGHe UW e Healthe
Health Plan Plan
Survey CHCs
2000
29
Taos (see also
Picuris)
TANANA
Taiwanese (see Min
Nan)
Tajik
TAMIL
TANACROSS
TANAINA
959 twf
tgk
tam
tgl
tah
TACHI (different code
from Foothill North
Yokuts)
660
742 tgl
772 tah
dialect of
Hokkien then of
714 Min Nan
656* tgk
704 tam
856 tcb
854 tfn
taa (Upper) tau
855 (Lower)
877 yok
SYRIAC
TADZHIK
(distinguished from
Tajik)
TAGALOG
Tahitian
gsw
607 gsw
664* syl
syr (macro
language with
Assyrian and
Chaldean Neo
syr
779 Aramaic)
Swiss
Sylhetti
tg
ta
tl
ty
Sudanese/NuerSudanese Sudanese
Arabic
Tanana
Northern Tiwa
(Taos is
dialect of)
Taiwanese
Tajik
Tamil
Tanacross
Tanaina
Nearly extinct
Nearly extinct
Lower Tanana - nearly
extinct
Tawainese; Tiawanese
Yokuts (single
code; see also
Foothill North
Yokuts)
Valley Yokuts
Tadzhik (does
not appear to
be
distinguished
from Tajik)
Tagalog
Tahitian
Syriac
Swiss German
Sylheti
SWAHILI
Swedish
SWAHILI
SWEDISH
sw
sv
swa (macro
with 2 subs)
swh (swahili as
an individual
swa
(macro)
791 language)
swe
614 swe
Sudanese
Suquamish
su
SUNDANESE
SUNDANESE
Suquamish
Census
Codea
784
ISO 639-2 ISO 639-1
Individual Individual ISO Language Other Names and
languageb languageb Nameb
Additional Information
sun
(Sudanese)
apd (Sudanese
Arabic) pga
(Sudanese
741 Creole Arabic) sun
740
842 squ
Census Language
Namea
SUDANIC
ISO 639-3
Individual
languageb
TABLE I-1 Subcommittee Template: Comparison of Spoken Language Categories and Coding
x
x
x
x
x
x
x
x
x
x
x
x
x
x
x
x
x
x
x
x
x
x
x
x
x
x
x
x
x
x
x
x
x
x
x
x
x
x
x
x
x
x
x
x
x
x
x
x
x
Contra
NACHC
NY
Reported in Kaiser
Costa HRET
Sutter
the Census Permanente Health Hospital Survey of Language Presbyterian
c
d
d
f
g
h
Line Use Hospitale
SFGHe UW e Healthe
Health Plan Plan
Survey CHCs
2000
x
260
954 ood
711
770 tkl
792 tog
768 ton
902 tqw
963 tow
Tohono O'Odham
Toishan
TOKELAUAN
Tonga
TONGAN
TONKAWA
TOWA
tir
til
lax
tli
780
844
960
866
Tigrigna
TILLAMOOK
TIWA
TLINGIT
Twe
(Indonesia)
Tew (USA)
tha
bod
tig
962
720
716
780*
uncoded
TEWA (Hopi-Tewa)
THAI
TIBETAN
Tigre
Teochau
Tatar
Teluga
TELUGU
Temne
TARASCAN
Tarahumara
Census Language
Namea
ISO 639-3
Census
Individual
a
Code
languageb
tar (Central),
tac (Lowland),
thh (Northern),
tcu
(Sutheastern),
twr
957 (Southwestern)
tsz
(Purepecha)
pua (Western
Highland
969 Purepecha)
tat (Tatar) crh
(Crimean
688 Tartar)
701*
701 tel
794 tem
ton
tog
tkl
tli
tir
to
ti
th
bo
tig
te
tel
tha
bod/tib
tt
tat chr
Tohono Odam
Taishanese (dialect of
Cantonese, but
understood only with
great difficulty by
Cantonese speakers;
Toishanese, Toisan,
Toishan, Toisanese
Tigrinian; Tigrigna;
Tigrinya
Extinct
Telegu
Themne
Teochew (related to
Southern Min)
Tonga [Tonga
Islands]
Tonganese
Tonkawa
Extinct
Jemez
Walatowa
Tonga [African
Nyasa]
Tokelau
Tigrinya
Tillamook
Tiwa
Tlingit
Tohano
O'Odham
Tewa
Thai
Tibetan
Tigre
Telegu
Timne
Tatar
Purepecha
Tarahumara
ISO 639-2 ISO 639-1
Individual Individual ISO Language Other Names and
languageb languageb Nameb
Additional Information
TABLE I-1 Subcommittee Template: Comparison of Spoken Language Categories and Coding
x
x
x
x
x
x
x
x
x
x
x
x
x
x
x
x
x
x
x
x
x
x
x
x
x
x
x
x
x
x
x
x
x
x
x
x
x
x
x
x
x
x
x
x
x
x
x
x
x
x
x
x
x
Contra
NACHC
NY
Reported in Kaiser
Costa HRET
Sutter
the Census Permanente Health Hospital Survey of Language Presbyterian
c
d
d
f
g
h
Line Use Hospitale
SFGHe UW e Healthe
Health Plan Plan
Survey CHCs
2000
261
834 cjh
UPPER CHEHALIS
UPPER TANANA
URALIC
LANGUAGES,
OTHER
URDU
ts
Urdu
WascoWishram
Upper
Kuskokwim
Mohave
HavasupaiWalapaiYavapai
Upper
Chehalis
Twi (sub of
macro Akan)
Uighur
Ukrainian
Ulithian
Umatilla
683
671 urd
ur
tw
ug
uk
Chuukese
Luba-Lulua
Tsimshian
Tsonga
Tubatulabal
Tulu
Tungusic
languages
Tupi
Languages
(about 70
languages in
S. America;
Tupi-Guarani
is of the best
known)
Turkish
Turkmen
Tuscarora
Northern and
Southern
Tutchone
Upper Tanana
urd
twi
uig
ukr
tup
(collective)
tur
tr
tuk
tk
chk
lua
tsi
tso
Urdu-Pakistan
Nearly extinct
Upper Colorado Yuman
UPPER CHEHALIS;
extinct
Yuman (Upriver), River
Yuman
Twi
Extinct
Nearly extinct
Nearly extinct
Trukee
ISO 639-2 ISO 639-1
Individual Individual ISO Language Other Names and
languageb languageb Nameb
Additional Information
857 tau
853 kuu
883 wac
897 yuf
UPLAND YUMAN
UPPER CHINOOK
(see Wasco)
UPPER
KUSKOKWIM
891 mov
UP RIVER YUMAN
ttm (Northern)
858 tce (Southern)
845
TUTCHONE
TWANA
twi
uig
ukr
uli
uma
976
691 tur
692 tuk
931 tus
TUPI-GUARANI
TURKISH
TURKMEN
TUSCARORA
796
689
641
762
882
695
TUNGUS
Twi
UIGHUR
UKRAINIAN
ULITHEAN
Umatilla
971
761
792*
884
792*
953
698
Census
Codea
Trique
TRUKESE
Tshiluba
TSIMSHIAN
Tsonga
TUBATULABAL
Tulu
Census Language
Namea
ISO 639-3
Individual
languageb
trc (Trique of
San Juan
Copala), trs
(Trique,
Chicahuaxtla),
trq (triqui,
Itunxosa)
chk
lua
tsi
tso
tub
tul
tuw (ISO-6395)
TABLE I-1 Subcommittee Template: Comparison of Spoken Language Categories and Coding
x
x
x
x
x
x
x
x
x
x
x
x
x
x
x
x
x
x
x
x
x
x
x
x
x
x
x
x
x
x
x
x
x
x
x
x
x
x
x
x
x
x
x
x
x
x
x
x
x
x
x
x
x
x
x
x
x
x
x
x
x
x
Contra
NACHC
NY
Reported in Kaiser
Costa HRET
Sutter
the Census Permanente Health Hospital Survey of Language Presbyterian
c
d
d
f
g
h
Line Use Hospitale
SFGHe UW e Healthe
Health Plan Plan
Survey CHCs
2000
262
837 col
979 apw
937
644
909
875
826
763
794
932
792
882
693
764
955
900 yuf
Wenatchee
White Mountain
WICHITA
Windish
WINNEBAGO
WINTUN
WIYOT
WOLEAI-ULITHI
Wolof
WU
WYANDOT (see
Huron)
Xhosa
Yakama
YAKUT
YAPESE
YAQUI
YAVAPAI (different
code than Havasupai)
YIDDISH
Yoruba
YUCHI
Yugoslav
YUKI
Yenisei
883 wac
890 was
633 cym
Wasco
WASHO
WELSH
sah
yap
xho
wol
was
cym/wel
vol
uzb
vie
yi
yo
xh
wo
cy
vo
uz
vi
Nearly extinct
Extinct
Yuki
Abakan Tartar, Yennisej
Tartar, Xakas
Extinct
Nearly extinct
Extinct
White Mountain is
dialect of Western
Apache
Nearly extinct
Slovenian language
group
Nearly extinct
Extinct
Bisayan (has a separate
code), Sebuano
Volapuk
Yiddish
Yoruba
Yuchi
Khakas
Yakut
Yapese
Yaqui
HavasupaiWalapaiYavapai
Wyandot
Xhosa
Wu Chinese
Ho-Chunk
Wintu
Wiyot
Woleaian
Wolof
Cebuano
Volapuk
HavasupaiWalapaiYavapai
Wappo
Tenino
WascoWishram
Washo
Welsh
columbiaWenatchi
Apache,
Western
(differs from
other Apache
codes)
Uzbek
Vietnamese
Ute (Southern
Paiute)
ISO 639-2 ISO 639-1
Individual Individual ISO Language Other Names and
languageb languageb Nameb
Additional Information
683 kjh
yid (macro with
yid
609 2 subs)
yor
796 yor
903 yuc
649
922 yuk
sah
yap
yaq
wya
xho
win
wit
wiy
woe
wol
wuu (sub of
Chinese with
715 own code)
899 yuf
923 wao
882 tqn
743 ceb
uncoded vol
945 ute
uzb (macro
689 with 2 subs)
728 vie
Census
Codea
WALAPAI
WAPPO
Warm Springs
Visayan
Volapuk
Uzbek
VIETNAMESE
UTE
Census Language
Namea
ISO 639-3
Individual
languageb
TABLE I-1 Subcommittee Template: Comparison of Spoken Language Categories and Coding
x
x
x
x
x
x
x
x
x
x
x
x
x
x
x
x
x
x
x
x
x
x
x
x
x
x
x
x
x
x
x
x
x
x
x
x
x
x
x
x
x
x
x
x
x
x
x
x
x
x
x
x
x
x
x
x
x
Contra
NACHC
NY
Reported in Kaiser
Costa HRET
Sutter
the Census Permanente Health Hospital Survey of Language Presbyterian
c
d
d
f
g
h
Line Use Hospitale
SFGHe UW e Healthe
Health Plan Plan
Survey CHCs
2000
26
zap
Zapotec
Zia
Zulu
Zuni
Nonspeaking; speech
loss
Declined, Refused
coded as
English
uncoded
uncoded und
130 possible
uncoded choices
Multiple Sign
Language
options
Undetermined; Unable to
Determine; Unknown
Other Sign Language
American Sign
Language tactive
American Sign Deaf; Hearing Impaired;
Language
Non Hearing
Braille
Brai (4 letter
uncoded script code ISO
written 15924)
coded as
English ase
Manegra
Bravanese (name for
Swahili use in part of
Somalia
Davaweno
Southern Kurdish
language
YUROK; nearly extinct
uncoded
Gorani
zu
uncoded hac
zul
zun
Davawenyo
zap (macro
with 47 subs
zia
zul
zun
Yurok
YUPIK
736
uncoded daw
971
924
792
964
827 yur
ypk
(collective)
ISO 639-2 ISO 639-1
Individual Individual ISO Language Other Names and
languageb languageb Nameb
Additional Information
Quechan
Kechan
x
x
x
x
x
x
x
x
x
x
x
x
x
x
x
x
x
x
x
x
x
x
x
x
x
x
x
x
x
Contra
NACHC
NY
Reported in Kaiser
Costa HRET
Sutter
the Census Permanente Health Hospital Survey of Language Presbyterian
c
d
d
f
g
h
Line Use Hospitale
SFGHe UW e Healthe
Health Plan Plan
Survey CHCs
2000
U.S. Census Bureau. 2007. Census 2000 Summary File 2 - Technical documentation. Appendix G code lists. Washington, DC: U.S. Census Bureau. Additional languages were added to this column based on the responses in columns on
health plan, hospital, and community health center use. An asterisk indicates a language added to the Census 2000 list.
b
SIL International. 2009. ISO 639 Code Tables. http://sil.org/iso639-3/codes.asp?order=639_3&letter=a (accessed August 25, 2009).
c
Modern Language Association. 2009. All languages reported to the US Census in 2000. http://www.mla.org/map_data_langlist&mode=lang_tops (accessed May 26, 2009).
d
See Appendixes G and H on Kaiser Permanente and Contra Costa for information on their approaches to data collection and categorization.
e
Personal communications from Emilio Carrillo, New York Presbyterian Hospital, May 11, 2009; Alice Chen, San Francisco General Hospital, July 7, 2009; Maria Moreno and Traci Van, Sutter Health, July 22, 2009; Shiva Bidar-Sielaff, University
of Wisconsin Health, May 11, 2009.
f
Hasnain-Wynia, R., J. Yonek, D. Pierce, R. Kang, and C. H. Greising. 2006. Hospital language services for patients with limited English proficiency: Results from a national survey . Chicago, IL: Health Research and Educational Trust
(HRET)/AHA.
g
National Association of Community Health Centers. 2008. Serving patients with limited English proficiency: Results of a community health center survey . Bethesda, MD: National Association of Community Health Centers and National Health
Law Program.
h
Language Line Service. 2009. List of languages by Language Line Serivces. http://www.languageline.com/page/languages/ (accessed June 12, 2009).
a
Zapoteca
Zia
Zulu
ZUNI
YUROK
YUPIK
Census Language
Namea
YUMA
ISO 639-3
Census
Individual
a
Code
languageb
894 yum
esu (Central)
ess (Central
Siberain) ynk
(Naukan) ems
(Pacific Gulf)
805 ysr (Sirenic)
TABLE I-1 Subcommittee Template: Comparison of Spoken Language Categories and Coding
264
Page 1 of 189
Generated by CommonLook™ Section 508 for PDF. Copyright © 2006 NetCentric Technologies www.net-centric.com
Section 508 for PDF Verification Results
Date:
Z:\Clair--508\Race Ethnicity--Project 6\Race,
Ethnicity, and Language Data.pdf
Wednesday, December 16, 2009
Number of pages:
Number of checkpoints selected for report:
Total number of tests requested:
Total of Failed statuses:
Total of Passed statuses:
Total of User Verify statuses:
Total of Not Applicable statuses:
286
15
4290
0
828
0
3203
PDF File Verified:
Page Checkpoint
1
1
1
1
1
1
1
Status
Reason
Comments
Image
(a) Text Tags Passed
Passed
(b) Multimedia Not
Page does not
Presentations Applicable contain multi-media.
User manually
(c) Color
Passed
passed the page.
User confirmed
correct logical
(d) Readability Passed
structure.
(e) ServerPage does not
Not
Side Image
contain server-side
Applicable
Maps
image maps.
(f) Client-Side
Checkpoint is not
Image Maps Not
applicable to PDF
(Not
Applicable
documents.
Applicable)
(g & h) Data Not
No data tables
Table
Applicable detected.
mhtml:file://Z:\Clair--508\Race Ethnicity--Project 6\Race, Ethnicity and Language.mht
12/16/2009


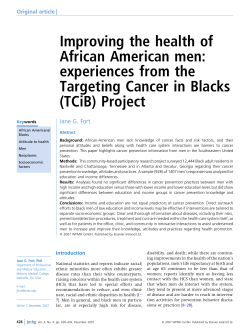


© Copyright 2026