
Document 275970
2012-13 Classroom Effectiveness Index Report for SAMPLE TEACHER (99999)
For information on Classroom Effectiveness Indices, visit the CEI Information page on MyData Portal at http://mydata.dallasisd.org/MENU/CEI.jsp. An introductory video and
FAQs are available, among other resources. The page contains guidelines and forms for submitting adjustment requests for 2012-13 CEIs. The deadline for submitting an
adjustment request for 2012-13 CEIs is October 25, 2013. Investigations are conducted in the order requests are received and can take several weeks to complete.
GLOSSARY/LEGEND
TERM
CEI
CONTINUOUSLY
ENROLLED (CE)
COURSE CEI
DIVISION CEI
ELIGIBILITY FOR
INCLUSION
(“CEI-ELIGIBLE”)
DESCRIPTION
ClassroomEffectiveness Index. See SECTION CEI, COURSE CEI, or DIVISION CEI for information about each type of CEI.
A continuously-enrolled student was enrolled at the campus and present during the ADA period for a minimum number of days in the school year (beginning of term through administration
date of course-relevant assessment). Absences, late enrollment, withdrawals, or transfers to another campus results in days counted against this minimum number of days.
The average fairness-adjusted relative gain score standardized within grade and test (e.g., grade five STAAR reading) for a course. ACP CEIs are standardized within test only (e.g., Semester 1
Pre-Calculus ACP). Scores are standardized to a mean of 50 and standard deviation of 10. A course CEI is based on relative gain scores from all students enrolled in a teacher’s course.
The average fairness-adjusted relative gain score standardized within division: language arts/reading, mathematics, social studies, science, computer science, and foreign language. A division
CEI is based on relative gain scores from all students enrolled in any of the teacher’s courses in the division.
To be eligible for inclusion in any CEI, a student must have appropriate test combinations from current and prior years and must have been continuously enrolled. (For appropriate test
combinations see http://mydata.dallasisd.org/MENU/CEI.jsp) Other criteria are assessment-specific. For STAAR 3-8, TAKS, norm-referenced, and middle school ACP CEIs, a student cannot
have more than a set number of absences (EA or UA) and cannot have been retained in either of the two previous years. For high school ACP CEIs, a student cannot have more than a set
number of absences (EA or UA). Block-scheduling at high schools is accounted for in the calculation of absences; students absent from a “double-length” class period are assigned two
absences. Students with names printed in bold italics were not eligible for inclusion in the CEI but were either in the teacher’s course for a sufficient number of days during the term or
placed on the CEI roster by the teacher during the roster verification process on MyData Portal.
FAIRNESS- ADJUSTED Also “Relative Gain Score.” A measure of the degree to which a student exceeded or fell below the average score when his performance was compared to that of similar district students. The
RELATIVE GAIN SCORE scores are relative because they are based on comparisons, not arbitrary or external score criteria; they are fairness-adjusted because the comparisons take place only among similar
NEIGHBORHOOD
VARIABLES
students (see SIMILAR STUDENTS), not the entire student population. Relative gain scores are standardized to a mean of 50 and standard deviation of 10. The bar graphs highlight gain scores
that are one and two standard deviations from average. Scores within one standard deviation are considered typical for a group.
Three neighborhood variables from U.S. Census tracts are controlled for in the SEI/CEI model. A student’s variables are based on her address in the district database in the spring. (1) Median
household income among households headed by a person of same ethnicity as student. Reported in thousands of dollars, e.g., “$26/hh” = median household income of $26,000.
(2) Percentage of adults over 25 of same ethnicity as student with a college degree. (3) Percentage of persons of same ethnicity as student living below the federal poverty level.
An ITBS or Logramos subtest, such as mathematics computation, mathematics total, reading total, language, reading words, etc. Specific subtests applicable for each grade are available at
http://mydata.dallasisd.org/MENU/CEI.jsp under “CEI-eligibility Criteria.” All K-2 scores are from norm-referenced assessments.
NORM-REFERENCED
ASSESSMENTS
PERCENTILE When a list of numbers is ordered from smallest to largest, a value’s percentile reports the percentage of other values that are lower than the one of interest. The CEI percentile reports the
PRIOR-YEAR SCORE
ABBREVIATIONS
SECTION CEI
“SIMILAR STUDENTS”
percentage of teachers whose CEI was lower than or equal to the CEI of interest. Percentiles are reported for each section, course, and division CEI. For example, a course percentile of 73%
means the teacher’s course CEI was higher than 73% of all other CEIs computed for the same course.
Complete list of test combinations is available at http://mydata.dallasisd.org/MENU/CEI.jsp. Norm-ref: RC=reading comprehension; RT=reading total; RW=reading words; L=language;
M=math; MC=math computation; MT=math total. STAAR 3-8, STAAR EOC, & TAKS: SP=Spanish; R=reading/ELA; MA=math; W=writing; SC=science; SS=social studies. ACP: ACP
all=standardized summary of all prior-year ACP scores for student; ACP [content]=standardized summary of prior-year ACP scores in the content area (most students have one prior-year ACP
score in a content area, though some have multiple scores); ACP [test]=standardized summary of prior-year ACP scores on the specified ACP test. All ACP standardization is to a mean of 50
and SD of 10.
The average fairness-adjusted relative gain score standardized within grade and test (e.g., grade five STAAR reading) for a section. ACP CEIs are standardized within test only (e.g., Semester 1
Pre-Calculus ACP). Scores are standardized to a mean of 50 and standard deviation of 10. A section CEI is based on relative gain scores from all students enrolled in a teacher’s section.
Relative gain scores are based on comparisons made within groups of similar students. Similar students share the following: they were administered the same current year test, had the same
demographic characteristics, and had the same scores on the same prior-year tests. The demographic characteristics controlled for in the SEI/CEI model are gender, LEP status,
socioeconomic status as determined by receipt of free or reduced-price lunches, TAG status, SPED status, and three neighborhood characteristics. (See NEIGHBORHOOD VARIABLES.)
Texas S.B. 1 (1995) mandates that all teacher appraisal information be confidential and not subject to the Open Records Act of the State of Texas. Treat all information in this report as highly confidential.
Dallas ISD Office of Institutional Research
TEACHER, SAMPLE (99999) SAMPLE SCHOOL (999) 09/16/2013
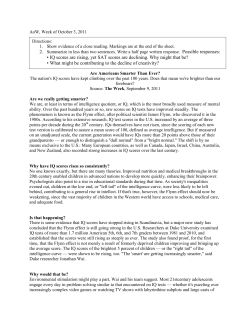
Longitudinal CEI Report for SAMPLE TEACHER (99999)
LANGUAGE ARTS/READING Division
School Year
School
Division CEI
Division CEI %ile
Number of Students
80 %ile
A division percentile of
71 indicates that the
teacher's division CEI
of 54.5 was higher than
71 percent of all other
CEIs in the language
arts/reading division.
2012-13
2011-12
2010-11
2009-10
2008-09
CURRENT SCHOOL
54.5
71 %ile
N = 98
PRIOR SCHOOL
49.4
49 %ile
N = 101
PRIOR SCHOOL
58.8
84 %ile
N = 82
PRIOR SCHOOL
42.1
19 %ile
N = 59
PRIOR SCHOOL
47.1
39 %ile
N = 121
LANGUAGE ARTS/READING PERCENTILES
60 %ile
40 %ile
20 %ile
Number of unique
students used in the
calculation of this
teacher's division CEI. A
teacher must have at
least 8 students that
meet all eligibility
requirements in order for
a CEI to be computed.
Some students may
contribute more than one
relative gain score to the
CEI (ex. secondary
students with both
STAAR EOC/TAKS and
ACP values).
Texas S.B. 1 (1995) mandates that all teacher appraisal information be confidential and not subject to the Open Records Act of the State of Texas. Treat all information in this report as highly confidential.
Dallas ISD Office of Institutional Research
TEACHER, SAMPLE (99999) SAMPLE SCHOOL (999) 09/16/2013
2
SAMPLE TEACHER (99999)
SAMPLE SCHOOL (999)
ID
1 2086263
2 2085040
3 2006989
Term: YEAR
Course: 1030 READING 7
Section: 51
Relative
gain score
Name
STUDENT NAME
44.9
Items correct on
this assessment
Grade: 7
Assessment: STAAR 3-8 READING
Characteristics of student's comparison group:
Neighborhood variables†
Group's 2011-12 scores†
GR Demographics
27 was BELOW avg for grp:
7
M, low SES, LEP
$38/hh; 3% w/deg; 19% blw PL
30 (Gr 6 STAAR R); 28 (Gr 6 STAAR MA)
STUDENT NAME
60.9
> 47 was ABOVE avg for grp:
7
F, low SES, not LEP, TAG
$27/hh; 6% w/deg; 34% blw PL
39 (Gr 6 STAAR R); 47 (Gr 6 STAAR MA)
STUDENT NAME
54.9
44 was average for grp:
7
F, low SES, not LEP, TAG
$40/hh; 2% w/deg; 22% blw PL
41 (Gr 6 STAAR R); 40 (Gr 6 STAAR MA)
4
5
6
7
8
9
10
11
12
13
14
2964257
4052717
2650955
2085343
2004667
2648306
2128625
2004154
2168849
2965962
2607318
STUDENT NAME
44.0
31 was BELOW avg for grp:
7
F, low SES, not LEP, TAG
$40/hh; 2% w/deg; 22% blw PL
32 (Gr 6 STAAR R); 26 (Gr 6 STAAR MA)
STUDENT NAME
42.5
25 was BELOW avg for grp:
7
F, low SES, not LEP
$34/hh; 4% w/deg; 27% blw PL
27 (Gr 6 STAAR R); 20 (Gr 6 STAAR MA)
15
16
17
18
2607329
2082845
2985731
2963910
STUDENT NAME
STUDENT NAME
54.9
34 was average for grp:
7
F, low SES, not LEP
$37/hh; 5% w/deg; 28% blw PL
27 (Gr 6 STAAR R); 36 (Gr 6 STAAR MA)
STUDENT NAME
53.4
24 was average for grp:
7
M, low SES, LEP
$27/hh; 6% w/deg; 34% blw PL
18 (Gr 6 STAAR R); 25 (Gr 6 STAAR MA)
47.0
25 was average for grp:
7
F, low SES, not LEP
$48/hh; 2% w/deg; 17% blw PL
23 (Gr 6 STAAR R); 19 (Gr 6 STAAR MA)
37.2
17 was BELOW avg for grp:
7
M, low SES, not LEP
$40/hh; 10% w/deg; 29% blw PL
This
reports
the
20 (Gr 6 STAAR
R); section
15 (Gr 6 STAAR
MA)
STUDENT NAME
STUDENT NAME
<
STUDENT NAME
57.6
28 was ABOVE avg for grp:
7
M, low SES, not LEP
$38/hh; 3% w/deg; 19% blw PL
characteristics
of each
20 (Gr 6 STAAR
R); 18 (Gr 6 STAAR
MA)
STUDENT NAME
57.0
35 was ABOVE avg for grp:
7
M, low SES, LEP, TAG
$30/hh; 1% w/deg; 28% blw PL
student's
31 (Gr 6 STAAR
R); 27 (Grcomparison
6 STAAR MA)
STUDENT NAME
STUDENT NAME
STUDENT NAME
STUDENT NAME
STUDENT NAME
STUDENT NAME
group ("similar students").
> 36 was ABOVE avg for grp:
7
M, low SES, LEP
$31/hh; 4% w/deg; 32% blw PL
28 (Gr 6 STAAR R); 29 (Gr 6 STAAR MA)
Detailed information about
> 33 was ABOVE avg for grp:
62.3
7
F, low SES, LEP
$37/hh; 5% w/deg; 28% blw PL
23 (Gr 6 STAAR R); 32 (Gr 6 STAAR MA)
student characteristics can
> 29 was ABOVE avg for grp:
F, low SES, LEP
60.3
7
$48/hh; 2% w/deg; 17% blw PL
21 (Gr 6 STAAR R); 20 (Gr 6 STAAR MA)
be found in the Glossary/
did not have scores from assessments in both current and previous years that were appropriate measures for this course and term.
Legend on page 1.
did not have scores from assessments in both current and previous years that were appropriate measures for this course and term.
did not have scores from assessments in both current and previous years that were appropriate measures for this course and term.
Students' raw scores on the current
on which
the course
and section
did not have scores from assessments in both current and previous years that The
were test
appropriate
measures
for this course
and term.
64.1
assessment are compared only to
"similar students."
These students did not meet all of the criteria for
receiving a relative gain score. As a result, they
were not included in the calculation of this
teacher's CEI. The criterion that was not met is
listed next to each student's name. The students
are on the roster because they were in the
teacher's class for a sufficient number of days
during the term (year or semester).
CEIs are based. (Information about
Reading and Writing CEIs are listed on
separate pages, where available.)
A section percentile of
76 indicates that the
standardized STAAR
3-8 reading gain for this
section was higher than
that of 76% of all grade
seven reading sections
in the district.
Rosters reflect teacher's modifications made during
CEI Roster Verification (May 6-June 4, 2013).
Assessment: STAAR READING CEI (and percentile) for Section 51:
CEI (and percentile) for Course 1030:
A course percentile of 93
indicates that the
standardized reading
gain score for this
teacher's course (all
sections) was higher
than 93% of all course
CEIs based on the grade
7 STAAR 3-8 reading
test.
56.8 (76%ile)
62.8 (93%ile)
NOTES: The average relative gain score in any comparison group is 50 with a standard deviation (SD) of 10. Relative gain scores from one to two SDs above or below average are highlighted with the characters > and <.
Relative gain scores more than two SDs from average (<30 or >70) are highlighted with the characters << and >>. A student who scored higher than average in his comparison group of similar district students has a relative
gain score higher than 50. Relative gain scores between 45 and 55 (shaded gray) are considered average or “typical.” All students in a comparison group have the characteristics listed in the student’s row. Students whose
names are in bold italics were not used to compute the CEI. Reasons for ineligibility include not having a suitable combination of test scores from last year and this year, not being continuously enrolled at the campus,
having excessive absences (more than 10 in a semester term, more than 17 in a year term), or being retained in either of the two previous years. For high school ACP CEIs, retention history is not an eligibility criterion. (For
more information on CEI eligibility criteria, see http://mydata.dallasisd.org/MENU/CEI.jsp) *CEIs are computed only if at least eight (8) students have relative gain scores. †See Glossary for descriptions of neighborhood
variables, a key for score abbreviations, and information about counting absences at high schools with block schedules.
Texas S.B. 1 (1995) mandates that all teacher appraisal information be confidential and not subject to the Open Records Act of the State of Texas. Treat all information in this report as highly confidential.
Dallas ISD Office of Institutional Research
TEACHER, SAMPLE (99999) SAMPLE SCHOOL (999) 09/16/2013
3
SAMPLE TEACHER (99999)
SAMPLE SCHOOL (999)
ID
1 2086263
2 2085040
3 2006989
Course: 1030 READING 7
Section: 51
Relative
gain score
Name
STUDENT NAME
Items correct on
this assessment
44.9
Term: YEAR
Grade: 7
Assessment: STAAR 3-8 READING
GR Demographics
Characteristics of student's comparison group:
Neighborhood variables†
Group's 2011-12 scores†
27 was BELOW avg for grp:
7
M, low SES, LEP
$38/hh; 3% w/deg; 19% blw PL
30 (Gr 6 STAAR R); 28 (Gr 6 STAAR MA)
STUDENT NAME
60.9
> 47 was ABOVE avg for grp:
7
F, low SES, not LEP, TAG
$27/hh; 6% w/deg; 34% blw PL
39 (Gr 6 STAAR R); 47 (Gr 6 STAAR MA)
STUDENT NAME
54.9
44 was average for grp:
7
F, low SES, not LEP, TAG
$40/hh; 2% w/deg; 22% blw PL
41 (Gr 6 STAAR R); 40 (Gr 6 STAAR MA)
4
5
6
7
8
9
10
11
12
13
14
2964257
4052717
2650955
2085343
2004667
2648306
2128625
2004154
2168849
2965962
2607318
STUDENT NAME
44.0
31 was BELOW avg for grp:
7
F, low SES, not LEP, TAG
$40/hh; 2% w/deg; 22% blw PL
32 (Gr 6 STAAR R); 26 (Gr 6 STAAR MA)
STUDENT NAME
42.5
25 was BELOW avg for grp:
7
F, low SES, not LEP
$34/hh; 4% w/deg; 27% blw PL
27 (Gr 6 STAAR R); 20 (Gr 6 STAAR MA)
15
16
17
18
2607329
2082845
2985731
2963910
STUDENT NAME
STUDENT NAME
54.9
34 was average for grp:
7
F, low SES, not LEP
$37/hh; 5% w/deg; 28% blw PL
27 (Gr 6 STAAR R); 36 (Gr 6 STAAR MA)
STUDENT NAME
53.4
24 was average for grp:
7
M, low SES, LEP
$27/hh; 6% w/deg; 34% blw PL
18 (Gr 6 STAAR R); 25 (Gr 6 STAAR MA)
47.0
25 was average for grp:
7
F, low SES, not LEP
$48/hh; 2% w/deg; 17% blw PL
23 (Gr 6 STAAR R); 19 (Gr 6 STAAR MA)
37.2
17 was BELOW avg for grp:
7
M, low SES, not LEP
$40/hh; 10% w/deg; 29% blw PL
20 (Gr 6 STAAR R); 15 (Gr 6 STAAR MA)
STUDENT NAME
STUDENT NAME
<
STUDENT NAME
57.6
28 was ABOVE avg for grp:
7
M, low SES, not LEP
$38/hh; 3% w/deg; 19% blw PL
20 (Gr 6 STAAR R); 18 (Gr 6 STAAR MA)
STUDENT NAME
57.0
35 was ABOVE avg for grp:
7
M, low SES, LEP, TAG
$30/hh; 1% w/deg; 28% blw PL
31 (Gr 6 STAAR R); 27 (Gr 6 STAAR MA)
STUDENT NAME
STUDENT NAME
STUDENT NAME
STUDENT NAME
STUDENT NAME
STUDENT NAME
> 36 was ABOVE avg for grp:
7
M, low SES, LEP
$31/hh; 4% w/deg; 32% blw PL
28 (Gr 6 STAAR R); 29 (Gr 6 STAAR MA)
> 33 was ABOVE avg for grp:
62.3
7
F, low SES, LEP
$37/hh; 5% w/deg; 28% blw PL
23 (Gr 6 STAAR R); 32 (Gr 6 STAAR MA)
> 29 was ABOVE avg for grp:
F, low SES, LEP
60.3
7
$48/hh; 2% w/deg; 17% blw PL
21 (Gr 6 STAAR R); 20 (Gr 6 STAAR MA)
did not have scores from assessments in both current and previous years that were appropriate measures for this course and term.
did not have scores from assessments in both current and previous years that were appropriate measures for this course and term.
did not have scores from assessments in both current and previous years that were appropriate measures for this course and term.
did not have scores from assessments in both current and previous years that were appropriate measures for this course and term.
64.1
Student ID 14: This student's gain score on STAAR 3-8
Student ID 6: This student's gain score on STAAR 3-8
reading was compared to other seventh-grade students
reading was compared to other seventh-grade students
who were female, low SES, and limited in their English
who were female, low SES, and English proficient.
proficiency. Members of this student's comparison
Members of this student's comparison group lived in
group lived in neighborhoods where the median
neighborhoods where the median household income
household income among households was $48,000,
was $37,000, 5% of adults over 25 had college
2% of adults over 25 had college degrees, and 17%
degrees, and 28% lived below the poverty level.
lived below the poverty level. Comparison group
Comparison group members answered 27 items correct
members answered 21 items correct on grade 6
on grade 6 STAAR 3-8 reading and 36 items correct on
STAAR 3-8 reading and 20 items correct on grade 6
grade 6 STAAR 3-8 mathematics. This student
STAAR 3-8 mathematics. This student answered 29
answered 34 items correct on grade 7 STAAR 3-8
items correct on grade 7 STAAR 3-8 reading, which
reading, which was AVERAGE for the group. As a
was ABOVE average for the group. As a result, her
result, her relative gain score (54.9) is very close to 50
relative gain score (60.3) is above 50 and is in green.
and is gray.
percentile)
for is
Section
56.8
(76%ile)
Assessment: STAAR READING CEI (and
The
gain score
more 51:
than one
standard
deviation
Rosters reflect teacher's modifications made during
above
the average,
as 1030:
shown by
the(93%ile)
green ">."
CEI
(and
percentile)
for
Course
62.8
CEI Roster Verification (May 6-June 4, 2013).
Student ID 1: This student's gain score on STAAR 3-8
reading was compared to other seventh-grade students
who were male, low SES, and limited in their English
proficiency. Members of this student's comparison group
lived in neighborhoods where the median household
income among households was $38,000, 3% of adults
over 25 had college degrees, and 19% lived below the
poverty level. Comparison group members answered 30
items correct on grade 6 STAAR 3-8 reading and 28
items correct on grade 6 STAAR 3-8 mathematics. This
student answered 27 items correct on grade 7 STAAR
3-8 reading, which was BELOW average for the group.
As a result, his relative gain score (44.9) was below 50
and is in red.
NOTES: The average relative gain score in any comparison group is 50 with a standard deviation (SD) of 10. Relative gain scores from one to two SDs above or below average are highlighted with the characters > and <.
Relative gain scores more than two SDs from average (<30 or >70) are highlighted with the characters << and >>. A student who scored higher than average in his comparison group of similar district students has a relative
gain score higher than 50. Relative gain scores between 45 and 55 (shaded gray) are considered average or “typical.” All students in a comparison group have the characteristics listed in the student’s row. Students whose
names are in bold italics were not used to compute the CEI. Reasons for ineligibility include not having a suitable combination of test scores from last year and this year, not being continuously enrolled at the campus,
having excessive absences (more than 10 in a semester term, more than 17 in a year term), or being retained in either of the two previous years. For high school ACP CEIs, retention history is not an eligibility criterion. (For
more information on CEI eligibility criteria, see http://mydata.dallasisd.org/MENU/CEI.jsp) *CEIs are computed only if at least eight (8) students have relative gain scores. †See Glossary for descriptions of neighborhood
variables, a key for score abbreviations, and information about counting absences at high schools with block schedules.
Texas S.B. 1 (1995) mandates that all teacher appraisal information be confidential and not subject to the Open Records Act of the State of Texas. Treat all information in this report as highly confidential.
Dallas ISD Office of Institutional Research
TEACHER, SAMPLE (99999) SAMPLE SCHOOL (999) 09/16/2013
4
SAMPLE TEACHER (99999)
SAMPLE SCHOOL (999)
ID
1 2597538
2 2597274
3 2034611
Relative
gain score
Name
STUDENT NAME
49.2
Items correct on
this assessment
Term: SEMESTER 1
Grades: ALL
Assessment: ECONOMICS
Demographics
Characteristics of student's comparison group:
Neighborhood variables†
Group's 2011-12 scores†
37 was average for grp:
F, not low SES, not LEP
$33/hh; 5% w/deg; 22% blw PL
57.40 (ACP all); 36 (TAKS SC)
42 was ABOVE avg for grp:
F, low SES, not LEP
$44/hh; 5% w/deg; 16% blw PL
56.37 (ACP all); 32 (TAKS SC)
38.5
34 was BELOW avg for grp:
M, low SES, not LEP
$30/hh; 25% w/deg; 37% blw PL
62.01 (ACP all); 49 (TAKS SC)
42.2
38 was BELOW avg for grp:
M, low SES, not LEP
$39/hh; 8% w/deg; 23% blw PL
63.96 (ACP all); 49 (TAKS SC)
39.1
35 was BELOW avg for grp:
M, low SES, not LEP
$32/hh; 17% w/deg; 25% blw PL
69.25 (ACP all); 42 (TAKS SC)
STUDENT NAME
46.3
39 was average for grp:
F, low SES, not LEP
$43/hh; 8% w/deg; 23% blw PL
65.25 (ACP all); 43 (TAKS SC)
STUDENT NAME
42.8
34 was BELOW avg for grp:
F, low SES, not LEP, TAG
$22/hh; 19% w/deg; 60% blw PL
55.68 (ACP all); 41 (TAKS SC)
STUDENT NAME
STUDENT NAME
2595505
4002210
2581005
2556896
2578048
2599221
3071517
2563491
2605106
2576641
2958509
3091921
2597455
STUDENT NAME
17 4075334
STUDENT NAME
4
5
6
7
8
9
10
11
12
13
14
15
16
Course: 2351 ECONOMICS
Section: 09
STUDENT NAME
58.0
<
<
STUDENT NAME
55.7
39 was ABOVE avg for grp:
M, low SES, not LEP
$29/hh; 2% w/deg; 40% blw PL
42.19 (ACP all); 42 (TAKS SC)
STUDENT NAME
55.6
42 was ABOVE avg for grp:
M, not low SES, not LEP
$99/hh; 63% w/deg; 3% blw PL
47.70 (ACP all); 45 (TAKS SC)
STUDENT NAME
69.3
> 38 was ABOVE avg for grp:
F, not low SES, LEP
$50/hh; 22% w/deg; 20% blw PL
42.60 (ACP all); 27 (TAKS SC)
34.3
30 was BELOW avg for grp:
F, low SES, not LEP
$43/hh; 8% w/deg; 23% blw PL
61.36 (ACP all); 46 (TAKS SC)
STUDENT NAME
43.5
28 was BELOW avg for grp:
M, low SES, not LEP
$32/hh; 17% w/deg; 25% blw PL
44.21 (ACP all); 32 (TAKS SC)
STUDENT NAME
46.8
34 was average for grp:
F, not low SES, not LEP
$73/hh; 16% w/deg; 5% blw PL
52.46 (ACP all); 35 (TAKS SC)
STUDENT NAME
43.8
38 was BELOW avg for grp:
M, low SES, not LEP
$33/hh; 5% w/deg; 22% blw PL
60.89 (ACP all); 48 (TAKS SC)
67.27 (ACP all); 47 (TAKS SC)
STUDENT NAME
<
STUDENT NAME
52.6
46 was average for grp:
M, low SES, not LEP
$37/hh; 4% w/deg; 23% blw PL
STUDENT NAME
54.9
39 was average for grp:
F, low SES, not LEP
$43/hh; 0% w/deg; 18%
blw PL
Previous
(ACP TAKS,
all); 33 (TAKS
year 52.67
STAAR,
and SC)
standardized
did not have scores from assessments in both current and previous years that were appropriate measures for this
course
and term.
ACP
scores
are used to determine a student's
comparison group for ACP and high school
STAAR EOC CEIs. Scores are standardized to
ensure that they are comparable across grades.
(ACP scores are standardized to a mean of 50
and SD of 10.)
Teacher did not submit modifications to CEI rosters
during CEI Roster Verification (May 6-June 4, 2013).
Assessment: ECONOMICS CEI (and percentile) for Section 09:
CEI (and percentile) for Course 2351:
48.0 (49%ile)
42.2 (14%ile)
NOTES: The average relative gain score in any comparison group is 50 with a standard deviation (SD) of 10. Relative gain scores from one to two SDs above or below average are highlighted with the characters > and <.
Relative gain scores more than two SDs from average (<30 or >70) are highlighted with the characters << and >>. A student who scored higher than average in his comparison group of similar district students has a relative
gain score higher than 50. Relative gain scores between 45 and 55 (shaded gray) are considered average or “typical.” All students in a comparison group have the characteristics listed in the student’s row. Students whose
names are in bold italics were not used to compute the CEI. Reasons for ineligibility include not having a suitable combination of test scores from last year and this year, not being continuously enrolled at the campus,
having excessive absences (more than 10 in a semester term, more than 17 in a year term), or being retained in either of the two previous years. For high school ACP CEIs, retention history is not an eligibility criterion. (For
more information on CEI eligibility criteria, see http://mydata.dallasisd.org/MENU/CEI.jsp) *CEIs are computed only if at least eight (8) students have relative gain scores. †See Glossary for descriptions of neighborhood
variables, a key for score abbreviations, and information about counting absences at high schools with block schedules.
Texas S.B. 1 (1995) mandates that all teacher appraisal information be confidential and not subject to the Open Records Act of the State of Texas. Treat all information in this report as highly confidential.
Dallas ISD Office of Institutional Research
TEACHER, SAMPLE (99999) SAMPLE SCHOOL (999) 09/18/2013
5


© Copyright 2026