
Common Stock Repurchases A First Year Swedish Sample and Comparative Reactions
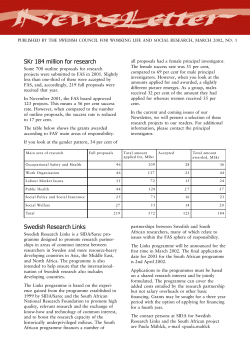
LTA 4/03 •
P.
455– 4 7 3
CHRISTER PETERSON, JOAKIM FREDRIKSSON and
ANDERS NILFJORD
Common Stock Repurchases
A First Year Swedish Sample and
Comparative Reactions
on the US and Finnish Markets1
ABSTRACT
Public companies in Sweden were finally permitted to repurchase their own shares at the beginning
of 2000 after a long and tenacious debate. This paper examines the effects on the prices of the first
year Swedish sample. And what is original in the paper is the use of a sample of firms without prior
experience in using this mechanism to remunerate shareholders. Moreover, we compare the price
reactions with those on the US and Finnish markets. We have found significant abnormal returns of at
least 1 percent in open market repurchases within one day. This result is similar to the reaction on the
neighbouring Finnish market. However, this is significantly lesser than reported returns on the US
stock exchange, probably due to severe institutional restrictions in designing a Swedish repurchase
program.
Key words: event study, stock repurchases, information signalling, institutional restrictions
1 We gratefully thank the anonymous referees, whose comments helped in no small way in shaping the work
during the review process.
CHRISTER PETERSON, Professor • Luleå University of Technology, Sweden
• e-mail: [email protected]
JOAKIM FREDRIKSSON and ANDERS NILFJORD, Umeå School of Business and Economics, Umeå University,
Sweden
455
LTA 4/03 • C. PETERSON, J. FREDRIKSSON
AND
A. NILFJORD
1. INTRODUCTION
Firms quoted on the Swedish stock exchange were not allowed to repurchase their own shares
until March 10th 2000. The reason why acquisition of a firm’s own shares was debated and
finally permitted on the Swedish stock exchange was the fact that this financial tool to restructure a company’s equity and debts side of the balance sheet had been long allowed in the US
and most European countries. Also, Sweden had recently become a member of the EU, and
sought international harmonization of financial regulation. Moreover, the possibility of firms
repurchasing their own shares was claimed to give Swedish companies a tool to make their
capital structures more flexible. The option of announcing repurchase programs was considered to be a necessity for companies having excess cash. It was claimed in the Swedish debate
that these companies were in need of a simple tool to protect them against hostile take-overs.
The opponents of introducing repurchase programs in Sweden claimed that this could be
a tool to manipulate the price of a firm’s share. This argument was based on the fact that a
number of international studies had indicated that companies that had acquired shares of their
own could show a significantly higher share price around the date of the repurchase offers
compared to those companies which not had made an announcement. This argument was a
permanent objection in the debate to prohibit the approval of repurchase programs on the
stock market.
The evidence of experience during the first year that repurchase programs were permitted
is poor and unreliable. Moreover, as far as we know, there is no academic survey on the subject, and further, only one other study, a Finnish, has investigated a European empirical sample on share repurchases. The neighbouring Helsinki and Stockholm stock exchanges are not
only small in international comparison but also its institutional contexts seem to be similar
making empirical findings interesting to compare.
Results from single programs have been commented on in Swedish financial newspapers
indicating on the one hand that a certain repurchase program had no effects at all, and on the
other hand that programs actually have positive effects. There are also articles claiming that
programs have had negative effects on companies’ value. The methods described and presented in these newspapers measuring the price behaviour around repurchase offers have been
varied and are not indisputable.
This lack of knowledge of the effects of the announcements of repurchase programs on
456
the Swedish financial market has inspired us to undertake the present investigation. A study on
a first year sample is an interesting research topic because European evidence on stock repurchases is limited. The scarcity of research is due to the fact that, as in Sweden, many countries
have only recently allowed firms to repurchase stock.
COMMON STOCK REPURCHASES…
2. LITERATURE REVIEW
The American experiences
The interest by firms in purchases of their own shares increased dramatically in the US during
the 1960s, which also encouraged academic research on the subject. Leo Guthard (1967), for
instance, found that repurchases increased by 40 percent during 1963 and 1965. During this
period the value of repurchases exceeded the value of new share issues.
The very first surveys in the US indicated that the only effects repurchase programs had
were personal tax earnings due to the fact that US taxation legislation favoured income from
capital compared to income from dividends.
Samuel Stewart (1976) reported that repurchases kept on increasing during the second
half of the 1960s; the volume was actually doubled in 1973, when this tool was used to stabilize the value of a number of firms on a shaky stock market. Moreover, Stewart observed a
new phenomenon: the price of the repurchasing firm’s share developed more positive than
shares of firms that had not been repurchasing. Ronald Masulis (1980) made the same observation when he investigated the market reaction on a tender offer and found an abnormal positive increase of some 17 percent.
These observations were confirmed by Larry Dann (1981). He reported that the value of
the firms’ common stock increased by almost 19 percent on average around the announcements of the repurchase programs. Theo Vermaelen (1981) investigated market reactions of all
repurchasing forms and reported a positive reaction by some 17 percent repurchases via tender offer, and a positive reaction of 3–4 percent for open market purchases.
Vermaelen found that the market reaction on average could be observed already on day
–1, i.e. the day before the announcement. The early reaction was observed for all tested forms
of repurchases and was statistically significant. The phenomenon is explained by the fact that
day 0 in Vermaelen’s investigation was the day when the repurchase was published in the
Wall Street Journal which in many cases was the day after the announcement to the stock
exchange. However, the author could not exclude that the observations were related to insider trading. Maulis also reported the phenomenon of early reactions, and claimed that his and
other reports on early market reactions were, at least to some extent, due to insider trading.
Table 1 below summarizes the reports that have been methodological and theoretical
points of departure for this present Swedish study. The market reactions range from 2 to 5
percent for open market programs, and 11 to 19 percent for tender offers, and all of them
report a positive reaction around the date of announcement. The following quotation represents these results quite well: “Firms which repurchase their own shares experience a permanent increase in stock price, on average” (Vermaelen, 1981, p. 179).
457
LTA 4/03 • C. PETERSON, J. FREDRIKSSON
AND
A. NILFJORD
TABLE 1. Specification of reports and their results referred to in this present study.
Publication
year
Research
period
Masulis
Vermaelen
1980
1981
1963–1978
1962–1977
Dann
Lakonishok, Vermaelen
Comment, Jarrell
1981
1990
1991
1962–1976
1962–1986
1984–1989
Ikenberry et al.
Ikenberry, Vermaelen
McNally
Karhunen
1995
1996
1999
2002
1980–1990
1989–1995
1984–1988
1998–2001
Author(s)
Sample size
0199
0243
0200
0300
0258
0165
1200
1239
0860
1197
0081
T.R
O.R.
T.R
T.R.
T.R.
D.R
T.R.
O.R.
O.R
O.R.
O.R.
Abnormal
return
16,92%
4%
17%
18,63%
9%
7,7%
11,9%
3,54%
4,57%
2,12%
1,08%
T.R = Tender offer repurchase(s)
D.R = Dutch auction repurchase(s)
O.R = Open market repurchase(s)
The observation of the early market reaction is just one interesting finding in the reports.
Lakonishok and Vermaelen (1990) observed that the relative frequency of repurchase was positively correlated to the positive change of stock price on the date of announcement. Thus, the
larger the repurchased share of the stock, the larger effect on the stock price. Also, it was observed that the premium for tender offers was positively correlated to the positive change of
stock price (repurchases via tender offers are often made at a fixed price over the current market price, i.e. with a premium). Thus, the larger premium, the larger effect on the stock price.
Similar findings were reported in other studies (e.g. Ikenberry and Vermaelen, 1996, McNally,
1999, Comment and Jarrell, 1991, and Ikenberry, Lakonishok and Vermaelen, 1995).
Share repurchases and its hypotheses
A number of different explanations for the observed positive stock price effects have been discussed in the literature, and followed by testing of hypotheses. The most common ones are:
• Dividend/personal tax hypothesis; Masulis (1980), Dann (1981), and Karhunen (2002).
• Leverage hypothesis; Masulis (1980), Vermaelen (1981), McNally (1999).
• Wealth transfer hypothesis; Masulis (1980).
458
• Free cash flow hypothesis; Jensen (1986), Howe et al. (1992), McNally (1999), and
Karhunen (2002).
• Repurchase option hypothesis; Ikenberry and Vermaelen (1996), and Karhunen (2002).
• Information signalling hypothesis; Vermaelen (1981), Dann (1981), Howe et al. (1992),
COMMON STOCK REPURCHASES…
Ikenberry and Vermaelen (1996), and McNally (1999).
• Executive and employee stock option hypothesis; Kahle (2002), and Karhunen (2002).
Other hypotheses, for instance, bondholder expropriation hypothesis, rejected by Vermaelen (1981), are not discussed in this paper.
The first accepted hypothesis testing positive reactions is the dividend/personal tax hy-
pothesis. The hypothesis proposes that shareholders can lower their personal taxes if companies choose to transfer capital via repurchase programs instead of extra large dividends because of differences in tax rates. The stock price is supposed to increase when a company,
unexpectedly, announces a repurchase program. The proposal has been accepted by Masulis
(1980) and Dann (1981), but rejected by Vermaelen (1981). Also, it should be noted that in
the US (from 1986) and in Sweden (from 1992) the differences in tax rates are recalled. However, the argument still holds from a Swedish shareholder perspective due to the fact that dividends are still suffering from the effects of double taxation.
The leverage hypothesis proposes that repurchases may be financed by a subsequent (or
previous) issue of debt. Because of tax-subsidy connected with the deductibility of interest
payments and to the extent that this subsidy is passed on to the shareholders, the price of the
stock will increase. This hypothesis is mostly accepted in the literature; however, it is rejected
by Dann (1981).
Masulis’ wealth transfer hypothesis between tendering and non-tendering stockholders
occur when there are differential constraints and/or costs across stockholders to tendering shares
and the tender offer price exceeds the stock’s market price so that a tender offer premium
(defined as the percentage by which the offer price exceeds the pre-offer announcement market price) exists. Given that the right to tender is non-transferable unless the stock is sold, it
follows that the tendering shareholders capture the entire offer premium at the expense of nontendering shareholders.
The hypothesis is not rejected in any investigation discussed in this present paper. However, this hypothesis is surrounded by a number of conditions; one is for instance that the
stock price must drop down below the price level of the days just before the announcement
date. This condition is disputed in a number of investigations. Moreover, the hypothesis is
accepted only in certain sub samples in Maulis’ study.
Jensen’s excess cash hypothesis states that executives could feel inclined to invest even
when a project’s net present value is not obviously positive. This type of agency-cost behaviour will jeopardize the company’s shareholder value. A positive reaction on repurchases is
interpreted as a market’s reply to a disciplined management. However, this hypothesis was
rejected by Howe et al. (1992), and McNally (1999).
459
LTA 4/03 • C. PETERSON, J. FREDRIKSSON
AND
A. NILFJORD
The repurchase option hypothesis proposes that a firm’s management, aiming at maximizing shareholder value, repurchases under valuated shares, but does not when the shares
are correctly valuated. The strategy is to replace the market value by a higher value, also when
there is no relevant information to announce. Thus, the management has created an option
that the market will react positively to. The hypothesis has not been tested in any investigation
as far as we know, excepting McNally (1999), who rejected it. Moreover, the authors claimed
that the hypothesis must be supplemented by other explanations.
The information signalling hypothesis is the most widely accepted in the literature. The
hypothesis proposes that a company signals financial information to its investors when a repurchase program is announced. The signal can be interpreted in different ways. One interpretation is that the market will deduce that the company is lacking investment opportunities
in the near future. Capital in excess should therefore be transferred to the shareholders and
used for other purposes. However, the most recurrent interpretation in the literature is that the
management is signalling that the company’s stock price is under valuated. The company attracts positive attention, and the market starts analysing the company’s future outlook. Thus,
the information outcomes are expected to prompt an increase in the company’s stock price
when a repurchase program is announced.
The executive and employee stock option hypothesis argues that executives could feel
inclined to use excess cash to repurchases rather than dividends if the employees have stock
options, which are not dividend protected. An additional argument for the simultaneous occurrence of stock options and repurchases is the executives’ strive to avoid diluting the companies’ EPS figures. Although not affecting the company’s market value, recent research suggests that this cosmetic exercise has been one explanation to repurchases. These two arguments give support to the hypothesis, for instance in Kahle (2002).
The information signalling hypothesis derives from the proposal that different forms of
information efficiency characterize a stock market. There is, for instance, on a market characterized by a form of semi-strong efficiency both public and private information. All people
have access to the public, but not to the private information, and thus, an information gap
arises between the investors on the market. The gap causes a situation of asymmetric information, which is regarded as an important explanation for several phenomena in financial markets.
George Akerlof (1970) showed that markets could collapse as a result of asymmetric information relationships between actors in a market. However, the collapse could be avoided if
460
the informed partner (management) could signal relevant information to the market. Michael
Spence’s (1973, 1974) model for signalling is often used as a tool when analysing how to mediate future economic information.
It goes without saying that a company’s management is more informed about its compa-
COMMON STOCK REPURCHASES…
ny’s future cash flow than actors on the stock market. That means that decisions concerning,
for instance, capital structure, dividends and repurchase of its own stock will function as information signals to investors. Moreover, investors must, from all other information, be able to
select and interpret the forwarded information correctly. If investors cannot distinguish companies from each other, Akerlof’s “Lemon model” shows that market responses cannot be positive on average, and consequently markets could cease to exist. Therefore, and in line with
Spence’s discussion, the cost of signalling is supposed to be central for the credibility of financial decisions, and the way of marking out one firm from another. The cost of signalling has
principally been connected to the method of financing the repurchase. However, a firm repurchasing its own stock also implies a change in its capital structure, and by that increased risks,
especially when the repurchase is financed by new loans.
In the models which have been sources of inspiration in this present study, the increased
risk, the repurchasing frequency and the management’s own holding of shares have been identified as considerable signals of information for open market repurchase programs. For tender
offers, besides those factors mentioned, the size of the premium has been of considerable importance as well. Thus, signalling under relationship of asymmetric information is important
when valuing companies; and, moreover, the aim of the signal mechanism is to reduce the
information gap through mediating information about the future cash flow.
3. PURPOSE, LIMITATIONS AND SAMPLES
The lack of knowledge of the effects of the announcements of repurchase programs on the
Swedish financial market has inspired us to undertake the present investigation with the following aims:
• to examine the price behaviour around the date of repurchase offers
• to compare and discuss the reactions on the Swedish market with those on the US
market
• to compare and discuss the reactions on the Swedish market with those on the neighbouring Finnish market.
A study on a first year sample is an interesting research topic because international evidence on stock repurchases is limited. The scarcity of research is due to the fact that, as in
Sweden, many countries have only recently allowed firms to repurchase stock.
Vermaelen’s study (1981) seems to be a methodological reference to most surveys in the
field. In order to achieve the best comparison, we have followed his study as far as possible
concerning research design. The following criteria have constituted the sample:
461
LTA 4/03 • C. PETERSON, J. FREDRIKSSON
AND
A. NILFJORD
• The company’s share must be traded on the Stockholm stock exchange
• The general meeting of shareholders has authorized a repurchase program in advance
• The announcement of actual repurchases has been made in the period March 10,
2000 – March 9, 2001
• No confounding news have been announced within +/– 10 days around the announcement date of actual repurchase, which is day 0.
Swedish public companies were permitted to repurchase their own shares from March
10th
2000. During the year following that date, we identified 51 companies that had announced
their intention to repurchase their own shares. Of these, three companies had repurchased
twice with different announcement dates giving 54 as the total number of repurchase programs.
Out of these 54 programs, 23 did not pass our criteria because of for instance, no trade at all
during the event period, merger rumours or acquisition negotiations, and other significant
events. After this elaboration our sample consisted of 31 programs, 29 open market repurchases and two tender offers. The companies and their programs are listed in Appendix 1.
4. EMPIRICAL DATA, RESEARCH DESIGN AND MARKET
PERFORMANCE
A specific implication related to event studies is that market reactions are measured in terms
of abnormal returns, i.e. returns exceeding those expected. To increase the likelihood that a
price reaction is related to a certain event, we decided to study the information on the repurchasing firms during a period of +/– 10 days around the announcement date. Those firms that
had announced other significant information during the period under study were excluded, as
described above, from our sample.
We used The Market Model with the period –200 to –11 days as a base to calculate the
expected return. Thus, the following formula was used to calculate the abnormal return:
(1)
ARit = rit – (αi + βirmt)
We used the Swedish Stock Exchange SX-Generalindex as a market index, and the com-
462
panies’ industry indices respectively. Using the industry indices implied problems because certain companies dominated its index; for instance Ericsson’s weight in SX-45 Information Technology is some 70 percent, and Swedish Match’s weight is some 68 percent in SX-30 Consumer Staples. When a company dominates its index so heavily it is difficult to identify price
COMMON STOCK REPURCHASES…
reactions as the whole index reacts simultaneously. This problem implied that in the first place
we used SX-Generalindex as a benchmark.
After calculating the companies’ abnormal returns we brought them together in a portfolio to determine the average divergence. The purpose of doing this was to minimize the possibility that a certain event for a single company would dominate the whole result. We determined the average abnormal return as follows:
(2)
AARt = 1/n
n
Σ ARit
i=1
To test whether a price reaction could be identified on the announcement date of a repurchase program or not, we used the following test statistics,
(3)
t-value =
AARt
s (AAR)
Our intention was also to examine the relation between on the one hand the repurchasing frequency and firm size (as weight of index), and on the other the price reaction to explain
the size of the reaction. However, it was not possible as more or less all companies announced
that they intended to buy back ten percent of the remaining shares, and most companies had
about the same weight (less than 0.5 percent) in the index.
Table 2 below describes the average abnormal return (AAR), t-values, and the cumulative
average abnormal return (CAAR) listed 10 days before until 10 days after the announcement of
29 open market purchases and two tender offer purchases.
The table distinctly shows a significant positive price reaction of 1.12 percent in average
abnormal return for open market repurchases; the figure is significant at the 2-percent level.
The result of the two tender offers indicates a positive reaction of 4.032 percent in average
abnormal return. However, no general conclusion can be drawn from this figure in spite of a
high t-value due to there being only two observations.
The peak corresponding to the significant price increase mentioned of 1.12 percent in
average abnormal return for the open market purchases on the announcement date (black curve
in Fig. 1) is quite clear in the figure. The price drop the day after (day +1) is also obvious.
However, this change is significant first at the 10-percent level, and is consequently regarded
as being random. The distinct peak corresponding to the price increase of 4.03 percent for the
two tender offer purchases (grey curve) is clear as well.
463
LTA 4/03 • C. PETERSON, J. FREDRIKSSON
AND
A. NILFJORD
TABLE 2. Characteristics of a sample of the first permitted year of repurchase programs on the
Stockholm Stock Exchange.
Tender offer repurchase
n = 2
Open market repurchase
n = 29
Day
AAR
t-value
CAAR
AAR
t-value
CAAR
–10
–9
–8
–7
–6
–5
–4
–3
–2
–1
0
1
2
3
4
5
6
7
8
9
10
0,494
0,430
0,423
–0,405–
–0,071–
0,115
–0,205–
0,342
0,512
0,022
1,120
–0,743–
0,276
–0,197–
–0,031–
0,369
–0,060–
0,617
0,028
0,444
0,274
1,113
0,969
0,953
–0,912–
–0,160–
0,259
–0,462–
0,772
1,154
0,050
*2,524*
–1,673–
0,622
–0,444–
–0,070–
0,831
–0,135–
1,390
0,062
1,001
0,616
0,494
0,924
1,347
0,942
0,872
0,986
0,781
1,124
1,636
1,658
2,779
2,036
2,312
2,115
2,084
2,453
2,392
3,009
3,037
3,481
3,755
0,056
0,088
0,132
–0,734–
1,755
1,066
–0,564–
0,173
–1,262–
–1,853–
4,032
–0,758–
–1,405–
1,155
0,409
0,729
–0,352–
2,150
–2,400–
0,345
0,167
0,039
0,062
0,092
–0,514–
1,228
0,746
–0,395–
0,121
–0,883–
–1,297–
2,821
–0,530–
–0,983–
0,808
0,286
0,510
–0,246–
1,505
–1,680–
0,241
0,117
0,056
0,145
0,276
–0,458–
1,297
2,363
1,799
1,972
0,710
–1,142–
2,889
2,132
0,727
1,882
2,291
3,020
2,668
4,818
2,417
2,762
2,929
* Significant on 2-percent level
CAAR +/-10 Days of announcement
6
CAAR (%)
5
4
3
2
1
0
-1 -10
464
-2
-9
-8
-7
-6
-5
-4
-3
-2
-1
0
1
2
3
4
5
6
7
8
9
Days relative to announcement date
CAAR Open market repurchases n=29
CAAR Tender offer repurchases n=2
FIGURE 1. Cumulative average abnormal return (CAAR) for the samples under study.
10
COMMON STOCK REPURCHASES…
5. FINDINGS AND ITS RELATIONSHIP TO OTHER EMPIRICAL
RESEARCH
Swedish market performance compared to the US market
The reactions on the Swedish market appear considerably weaker compared to those on the
US market (comparing table 1 and 2). The increase of at least 1 percent on the open market is
to be compared to 2 to 5 percent for the referred American studies. Moreover, tender offers
record a larger price increase compared to open market purchases, which in the literature is
explained by the price premium. Although not significant, our finding is in line with that opinion; the increase of some 4 percent for tender offers in this Swedish sample could cautiously
be related to the 11 to 19 percent for the referred American studies. It is obvious that the
positive reaction of some 1 percent for open market purchases in Sweden is significantly lesser
than the often-referred Vermaelen’s corresponding result of 4 percent. His result for the tender
offers was significantly higher, 17 percent.
FIGURE 2 Comparisons between price reactions to repurchase programs in Sweden and the US.
Source: Vermaelen (1981, p. 149) and results of the present study. Tender offer (TO) for the Swedish sample is not reported due to there is no enough data (2 firms). The average premium for the
TO in US in this study is around 17 percent, and the premium for the two firms of the Swedish
sample is around four percent.
465
LTA 4/03 • C. PETERSON, J. FREDRIKSSON
AND
A. NILFJORD
The figure illustrates quite well the phenomenon of the early reaction (day –1), which is
found in some studies. In Vermaelen’s study the announcement date (day 0) is the day the
repurchase was published in the Wall Street Journal, which in many cases was the day after
the announcement to the stock exchange. Other reports claim that early market reactions were,
at least to some extent, due to insider trading. In this Swedish study, the reaction is observed
on day 0. Our announcement date is the date of the press release announcing the repurchase
decision.
In Sweden, a repurchase must not jeopardise a company’s financial standing or need for
consolidation.2 Moreover, the repurchased shares must not be booked as an asset, and are
therefore recorded as a deduction from equity. These rules have made the repurchases on the
Swedish market being financed by company liquidity surpluses in the first place, and not by
increased borrowing, which is consistent with the excess cash hypothesis.
In this study the existence of employees or manager share options schemes has not been
examined explicitly. However, NCC and Nordea, which are two companies in the sample, have
confirmed that they have repurchased shares in order to secure ongoing option programs. Nordea added that the transaction also resulted in a more effective capital usage.3 In Kahle (2002) it
is shown that price reactions after share repurchases triggered by the existence of important employee option schemes are much lower than the average. This is very logical, whilst repurchasing
shares in order to secure employee option programs does not signal that the shares are under
valuated. Value-based management is a fundamental in the work for increased shareholder value,
and remuneration – often in form of option programs – in turn is a pillar in VBM. There is reason
to believe that option-based schemes for employees are widely used in this sample, which at
least to some extent could explain the lower market reaction found in this study.4
Electrolux and Swedish Match are two companies in the sample that have been actively
repurchasing their own shares also after the very first year repurchases were permitted. In fact,
“the repurchased shares” were the biggest owner (measured in capital) in Electrolux, and the
second biggest in Swedish Match, before the shares were destroyed. The companies’ CFOs
state that the reason for repurchases is “to contribute to increased shareholder value; with fewer
shares in the company, the value of the remaining ones should increase, ceteris paribus. ”Repurchases are simply looked upon as ’reversed emissions’”.5
466
2 See guidelines: http://www.stockholmsborsen.se/overvak/index.asp?lank = 8&lang = swe
3 Dagens Industri, April 12, 2003. Återköpa aktier ett dyrbart företag (Stock repurchases – an expensive undertaking).
4 Dagens Industri, August 7, 2002. It is documented that 12 companies, which have repurchased their own
shares during 2000–2001, have specified ‘securing bonus programs’ as their reasons to repurchase.
5 Svenska Dagbladet/Näringsliv, May 24, 2002. Återköp av aktier ingen given affär. (Stock repurchases – not a
foregone conclusion.)
COMMON STOCK REPURCHASES…
Judging the differences in price reactions on the Swedish and US markets, we conclude
that the principal explanation is the differences in the institutional rules. During the preparation of the Swedish law to allow repurchases, there was, as described in the introduction, a
heated debate. Opponents claimed that a repurchase program could be a tool to manipulate
the price of a firm’s share. The risks of such misuse were considered to be so great that the law
was severely restricted. Swedish public companies were permitted to repurchase only ten per-
cent of remaining shares, given a mean fraction in this study of 8,5 percent (open market programs). In the sample of Lakonishok and Vermaelen (1990), the mean fraction of shares repurchased is 16 percent (tender offers). Moreover, the decision was to be authorized in advance
by the general meeting of shareholders. Our judgement is that these severe conditions imply
low costs of signalling, and early releases of the announcements on the Swedish market.
The US public companies’ possibilities to purchase their own shares are principally regulated in Security Exchange Commission (SEC) rule 10b–18. The rule points out information
requirements concerning a firm trading in its own shares but does not regulate how many shares
a company can buy back.6
It is evident from the literature review that costs of signalling are central to the credibility
of the financial decisions. Investors must be able to correctly interpret signals from all information. The relative frequency of purchases, and the form of financing (and by that the degree
of risks exposed to the company) have been identified as considerable signals for open market
repurchases in addition to tender offers and the size of premium. The Swedish companies have
simply been exposed to smaller risks compared to the companies in the US reports: The repurchased mean fraction is smaller, and further, excess cash and securing employee stock option
schemes are not repurchase arguments, which signal under valuated shares. As a consequence
of smaller risk-taking in the Swedish repurchases, Swedish company managements have also
exposed themselves to lower risks, and consequently less credibility in information signalling.
Swedish market performance compared to the Finnish market
The institutional settings of share repurchase in Sweden and Finland are similar, and the empirical findings are therefore interesting to compare. Finland abolished the restriction on share
repurchases in September 1997, some years before Sweden. Also, deregulation motives, as
well as general attitudes towards share repurchases were about the same, which resulted in
relatively prudent guidelines on the way repurchases should be carried out, as the case has
been in Sweden. Moreover, in Finland shareholders must, by simple 50 percent majority (in
Sweden two thirds), approve a firm’s repurchase program prior to the general meeting of share6 http://www.fdic.gov/regulations/laws/rules/8000–7500.html#94004
467
LTA 4/03 • C. PETERSON, J. FREDRIKSSON
AND
A. NILFJORD
holders. Unlike the case in Sweden, firms must also specify a reason for the repurchase program. As in Sweden, the repurchase authorization is valid for up to a year and entitles to buy a
maximum of five percent (in Sweden ten) of the firm’s share. Again as in Sweden, actual share
repurchases have to be disclosed on a daily basis. Further, initially there were no formal guidelines to the daily repurchases volume (Karhunen, p. 60).7
The Swedish sample of 29 open market programs (table 2) is not directly comparable
with any of the Finnish samples, which are reproduced in table 3. The Swedish sample is
cleaned from confounding news, and refers to the announcement date when the firm disclosed
that it really intended to start repurchasing. So, the closest matching we can do, as far as we
understand from Karhunen, p. 101–103, is to compare the clean Swedish sample with the confounded Finnish sub sample panel C of 81 actual repurchase programs.
When comparing the Swedish and Finnish samples, it is obvious that the short-term reactions on the Stockholm and Helsinki markets seem to be similar. The average abnormal return
in Stockholm is 1,12 percent and in Helsinki 1,08 percent for day 0. The average cumulative
TABLE 3. Characteristics of a sample of repurchase programs on the Helsinki Stock Exchange.
Panel A: Repurchase program announcements (N = 155)
Interval
Day 0
Days (–1, +1)
Days (–2, +2)
CAR
t -value
0,67 %
1,86 %
2,78 %
2,57**
4,11**
4,76**
Panel B: Repurchase program announcements with no confounding news (N = 49)
Interval
Day 0
Days (–1, +1)
Days (–2, +2)
CAR
t -value
0,68 %
2,42 %
2,55 %
2,02**
*4,15***
*3,39***
Panel C: Announcement of actual repurchases (N = 81)
Interval
468
Day 0
Days (–1, +1)
Days (–2, +2)
*
*, **, and *** indicate significance at 10 %, 5 %,
Source: Karhunen, p. 101
CAR
t -value
1,08 %
0,65 %
0,56 %
*3,27***
1,13**
0,75**
and 1 % levels, respectively.
7 However, beginning October 1, 1999, the rules constrained repurchases to 50 percent of the average daily
trading volume over the twelve months preceding the repurchase. Since April 2, 2001, the average daily trading
volume has been calculated over the four weeks preceding the repurchase.
COMMON STOCK REPURCHASES…
abnormal return for a three-day event window is 0,40 percent to be compared to 0,65 percent,
and the five-day window is 1,19 percent and 0,56 percent respectively. So, the magnitude of
the day 0 market reaction on the two stock exchanges is about the same, and so is also the
following pattern; the effect does not carry over to wider windows around the announcement
day, and the Swedish pattern is oscillating up to day 6.
A significant difference between the two compared samples is the drift prior to the announcement. As documented in, for instance Table 2, the Swedish sample describes a slight
but positive drift prior to the announcement, while the Finnish describes a negative one; the
negative CAR of –3,1 percent over the days –17 through –6 is also highly significant (Karhunen p. 104). So, the Finnish pattern is consistent with the signalling arguments for an under
valuated share, while the Swedish pattern is signalling lack of investment opportunities, according the information signalling hypothesis. When widening the prior period to –50 through
–5, the Finnish pattern is still negative but not significant at conventional levels.
The difference between the general meeting date and announcement date of actual repurchases could certainly obstruct measurement of the information signal, and by that the price
reaction. A Stockholm Stock Exchange representative commented on this dilemma by stating
that in many cases the positive price reaction could have been effected on the general meeting
date when the repurchase authorization was announced.8 And, therefore, when the decision
to repurchase is taken and announced to the market, the impact is limited. In our sample,
about one-third of the firms have announced the decision to repurchase on the general meeting date; in these cases authorizing and announcement dates are coincident. Thus, in twothirds of cases the purpose of repurchase was not announced on the general meeting date, and
consequently in these cases the price effect could be split between two dates.9
The Finnish study adds an interesting finding to this issue. Karhunen documents that the
authorized firms earn further abnormal returns when they announce the start of actual repur-
chases. The sub sample of announcements (with no confounding news, Panel B, N = 49) expresses an abnormal return of 0,68 percent for day 0. The sub sample of actual repurchases
(not cleaned for confounding news, Panel C, N = 81) accounts for 1,08 percent for day 0.
However, the two figures cannot just be added, as the samples not are identical, but the study
reveals that the price effect is split between two dates. This finding is consistent with the prediction that the market does not fully reward repurchasing firms until they show some proof of
their real intentions.
8 Dagens Industri, June 8, 2000. Rekord i återköp men ingen kurseffekt. (Record in repurchases – but no price
reaction.)
9 It is in fact a three -step process; in Sweden a company must announce weeks in advance that a general meeting will be held. The announcement contains an agenda of the meeting from which it is clear that the question
of repurchases or not will be decided on.
469
LTA 4/03 • C. PETERSON, J. FREDRIKSSON
AND
A. NILFJORD
Moreover, Karhunen documents a strong relation between foreign ownership and announcement returns in the clean sample. This finding is supporting the dividend tax hypothesis, as dividends are unfavourable for foreigners in Finland. Also, the author finds a weak positive effect at the announcement of actual repurchases for firms that disclose capital structure
as a motive for repurchases. Foreign ownership has also been a reason to repurchase shares in
Sweden. ABB (not a company in the sample) planned to go public in the US in 2001. The
company repurchased shares in order to offer them to institutional investors in the US to encourage a rapid start in the trading.10
6. CONCLUDING REMARKS
This present study reports positive price reactions as a result of the announcement by firms of
repurchase programs of their own shares. The observed increase for the 29 open market programs is at least 1 percent, which is significant at the 2-percent level. However, the average
abnormal return on the Swedish market is considerably lower than corresponding results from
the US market.
Our judgement is that the relatively severe restrictions in Sweden generate moderating
effects on the market reactions. A permitted repurchasing frequency of (just) ten percent might
explain evidence at least to some extent. Moreover, a payment via liquidity surplus in principal, and booking restrictions result in weak information signals to the market; the costs of signalling might simply be low. Furthermore, the general meeting of shareholders must first authorize the repurchase decision. The authorization must be anchored by a two-thirds majority,
and is valid only up to the next general meeting. After that, a new authorization must be given
to allow the management to make a repurchase decision.
It is obvious that the short-term reactions on the Stockholm and Helsinki markets are very
similar. The average abnormal return in Stockholm is 1,12 percent and in Helsinki 1,08 percent for day 0. The average cumulative abnormal return for a three-day event window is 0,40
percent to be compared to 0,65 percent. A significant difference between the two compared
samples is the drift prior to the announcement. The Swedish sample describes a slight but positive drift, while the Finnish describes a negative one. Consequently, the Finnish pattern seems
to be consistent with the arguments for an under valuated share, while the Swedish pattern is
signalling lack of investment opportunities.
470
As described earlier, the institutional setting of share repurchase in Finland is, at least in
certain aspects, even more restricted than the one in Sweden. The lower price reactions on the
10 Svenska Dagbladet/Näringsliv March 18, 2003. Återköp dyrt för ABB (Stock repurchases expensive for ABB.)
COMMON STOCK REPURCHASES…
Finnish market, as the case in Sweden, support our judgement that severe restrictions generate
moderating effects on the market reactions.
The Finnish study documents that the authorizing restrictions split positive reactions between two days, namely the general meeting and the announcement dates. This makes the
measurement of signalling more difficult.
The results identified in this study must be regarded as being successful for Swedish (and
Finnish) legislators. On the one hand, it is reasonable that the countries’ public companies
have the repurchase tool at their disposal. On the other hand, one should not make a law that
increases the possibilities of manipulating share prices. With a marginally positive reaction of
some one percent, legislators have apparently succeeded in combining these two ambitions.
There are also arguments claiming that announcements of repurchase programs are mediating negative signals to the Swedish market. A Shareholders’ Confederation representative
states, that the signal could be interpreted as coming from a gorged and inert firm. And why
should anybody own shares in such a company?11 Each negative interpretation of the signal
results in a lesser average abnormal return compared to a situation of no negative interpretations.
In conclusion, the sample in this study is composed of Swedish firms with no prior experience in using this mechanism, which is also the case in Finland. But, the US firms of the
studies referred have typically used a lot of times this mechanism in the past. And the frequency this mechanism is used is probably a relevant factor that effects the price reaction. Thus,
the quality of the repurchasing signal for US firms is better than that of Swedish and Finnish
firms by the simple fact that US firms have, on average, used this mechanism much more times
in the past. So, the importance of the institutional restrictions, and its duration, must be analysed again when the Swedish and Finnish markets are more experienced to the repurchase
mechanism. To that extent, this empirical study from the first year of permitted repurchase
programs will be an interesting benchmark. "
471
11 Dagens Industri, August 19, 2000. Köpa egna aktier ger ofta en negativ signal. (Stock repurchases – often a
negative signal.)
LTA 4/03 • C. PETERSON, J. FREDRIKSSON
AND
A. NILFJORD
Appendix 1
Company/share
Industry
Atle
Autoliv
AxFood
Bergman & Beving B
Capona
Castellum
Drott B
Electrolux B
Ericsson B
FastPartner
Handelsbanken A
Holmen B
Höganäs B
Latour B
LindAB B
Lundbergs B I
Lundbergs B II
Malmbergs B*
Mandamus
Munksjö
NCC B
NORDEA
OEM B
Skanska B
SSAB A
StoraEnso R
Swedish Match
Trelleborg B II
Wallenstam B
Volvo B I*
Volvo B II
SX-40
SX-25
SX-30
SX-20
SX-40
SX-40
SX-40
SX-25
SX-45
SX-40
SX-40
SX-15
SX-15
SX-40
SX-20
SX-40
SX-40
SX-20
SX-40
SX-15
SX-20
SX-40
SX-45
SX-20
SX-15
SX-15
SX-30
SX-20
SX-40
SX-20
SX-20
Financials
Consumer Discretionary
Consumer Staples
Industrials
Financials
Financials
Financials
Consumer Discretionary
Information Technology
Financials
Financials
Materials
Materials
Financials
Industrials
Financials
Financials
Industrials
Financials
Materials
Industrials
Financials
Information Technology
Industrials
Materials
Materials
Consumer Staples
Industrials
Financials
Industrials
Industrials
Day 0
2000-05-03
2000-05-09
2000-11-22
2000-08-24
2000-05-10
2000-05-25
2000-06-22
2000-05-24
2000-05-12
2000-05-29
2000-04-14
2000-08-15
2000-05-11
2000-05-10
2000-04-27
2000-03-29
2000-08-09
2000-02-19
2000-06-06
2000-05-10
2000-09-28
2000-04-28
2000-05-02
2000-05-03
2000-04-27
2000-08-18
2000-06-14
2000-06-27
2000-08-29
2000-05-18
2001-02-02
Number, % Weight in GX, %
10
9,8
03
10
5
10
10
10
0,023
10
07
10
10
10
10
10
10
03
10
10
10
03
10
10
10
05
05
10
10
10
10
0,27
0,39
0,10
0,10
0,03
0,15
0,38
1,72
15,950
0,01
3,63
0,80
0,20
0,27
0,08
0,32
0,32
0,01
0,04
0,09
0,26
6,21
0,04
1,37
0,32
1,02
0,55
0,24
0,04
2,44
2,44
Two programs* were tender offers; the remaining 29 programs were open market programs. Number,
% means the announced relative repurchase frequency of the program. Weight in GX, % means the
share’s weight in the Stockholm stock exchange General Index (SX – GX).
The mean fraction of the 29 open market programs is 8,55 percent, and the weighted mean fraction
is 5,21 percent.
472
COMMON STOCK REPURCHASES…
REFERENCES
AKERLOF, G.A., 1970, The market for “Lemons”: quality, uncertainty and the market mechanism, Quarterly
Journal of Economics, August, 488–500.
COMMENT, R. and G.A. JARRELL, 1991, The relative signaling power of Dutch auction and fixed selftender offers and open market share repurchases, The Journal of Finance, 1243–1271.
DANN, L., 1981, Common stock repurchases: an analysis of returns on bondholders and stockholders,
The Journal of Financial Economics, 113–138.
GUTHARD, L., 1967, Why companies are buying back their own shares, Financial Analysts Journal, 105–
110.
HOWE, K.M., HE J. and KAO, G.W., 1992, One-time cash flow announcements and free cash-flow theory:
share repurchases and special dividends, The Journal of Finance, 1963–1974.
IKENBERRY, D.L., LAKONISHOK J. and VERMAELEN, TH.J., 1995, Market under reaction to open market
share repurchases, The journal of Financial Economics, 181–208.
IKENBERRY, D.L. and VERMAELEN, TH.J., 1996, The option to repurchase stock, Financial Management,
9–24.
JENSEN M. 1986, Agency costs of free cash flow, corporate finance, and takeover. American Economic
Review 76, 323–329.
KAHLE, KATHLEEN, M., 2002, When a buyback isn’t a buyback: Open market repurchases and employee
options. The Journal of Financial Economics, Feb., vol. 63, issue 2, 235–261.
KARHUNEN, J., 2002, Essays on tender offers and share purchases, Helsinki School of Economics, Acta
Universitatis Oeconomicae Helsingiensis, A-202.
LAKONISHOK, J. and VERMAELEN, TH.J., 1990, Anomalous price behavior around repurchase tender
offers, The Journal of Finance, 455–477.
MASULIS, R.W., 1980, Stock repurchase by tender offer: an analysis of the causes of common stock price
changes, The Journal of Finance, 305–319.
MCNALLY, W.J., 1999, Open market stock repurchases signaling, Financial Management, June-July, vol.
28, issue 2, 55–68.
SPENCE, M., 1973, Job Market Signaling, Quarterly Journal of Economics, 355–374.
SPENCE, M., 1974, Competitive and Optimal Responses to Signals: An Analysis of Efficiency and
Distribution, The Journal of Economic Theory, 7, 296–332.
STEWART, S.S., 1976, Should a company repurchase its own stock?, The Journal of Finance, June, 911–
921.
VERMAELEN, TH.J., 1981, Common stock repurchases and market signaling, The Journal of Financial
Economics, 139–183.
473


© Copyright 2026