
Sample & Assay Technologies ANNUAL REPORT 2006
ANNUAL REPORT 2006
Sample & Assay Technologies
Consolidated Statement of Income Data
Year ended December 31
2006
2005
2004
2003
2002
465,778
398,395
380,629
351,404
298,607
139,122
122,755
125,658
118,786
96,508
2,046
439
1,454
3,618
–
324,610
275,201
253,517
229,000
202,099
41,560
35,780
34,351
31,068
27,438
115,942
94,312
87,506
83,005
75,086
48,574
40,123
41,715
41,894
41,716
Purchased in-process research and development
2,200
3,239
–
–
–
Acquisition, integration and related costs
6,061
3,213
572
–
2,848
Acquisition - related intangible amortization
8,220
3,697
1,416
1,096
1,053
Relocation and restructuring costs
1,452
–
3,817
3,048
10,773
Total operating expenses
224,009
180,364
169,377
160,111
158,914
Income from operations
100,601
94,837
84,140
68,889
43,185
5,467
2,427
(11,453)
(1,634)
(4,325)
106,068
97,264
72,687
67,255
38,860
35,529
35,039
23,982
24,405
15,723
1,000 US$
Net sales
Cost of sales
Cost of sales – acquisition - and restructuring - related
Gross profit
Operating Expenses:
Research and development
Sales and marketing
General and administrative
Other income (expense), net
Income before provision for income taxes
Provision for income taxes
Minority (income) expense
Net income
–
–
–
–
(5)
70,539
62,225
48,705
42,850
23,142
0.46
0.41
0.33
0.29
0.16
153,517
150,172
148,519
147,173
145,787
2006
2005
2004
2003
2002
430,357
191,700
196,375
98,993
44,893
566,660
278,586
299,029
163,583
111,554
1,212,012
765,298
714,599
551,930
454,511
US$ per share
Diluted net income per common share
NUMBER OF SHARES
Weighted average number of common shares used to
compute diluted net income per common share
Consolidated Balance Sheet Data
As of December 31
1,000 US$
Cash and cash equivalents
Working capital
Total assets
Total long-term liabilities, including current portion
536,738
230,086
234,138
131,095
112,331
Total shareholders’ equity
566,165
450,457
400,376
334,786
263,031
1,535
1,513
1,495
1,485
1,478
150,168
148,456
147,020
146,218
145,534
Common shares
NUMBER OF SHARES
Shares outstanding
Net sales
Net income
Diluted earnings per share
1,000 US$
1,000 US$
US$ per share
2002
2003
2004
2005
2002
2006
2003
2004
2005
2002
2006
500,000
90,000
0.50
400,000
70,000
0.40
300,000
50,000
0.30
200,000
30,000
0.20
100,000
10,000
0.10
5-year CAGR
+12 %
5-year CAGR
2003
2004
5-year CAGR
+32 %
2005
2006
+30 %
CAGR = compound annual growth rate
Net sales including the synthetic
DNA business unit, sold in Q2 2004
Consolidated Statement of Cash Flows Data
Year ended December 31
2006
2005
2004
2003
2002
70,539
62,225
48,705
42,850
23,142
Net cash provided by operations activities
Net income
101,479
91,237
53,798
64,060
36,686
Net cash used in investing activities
165,472
98,501
51,149
14,057
64,792
Net cash provided by (used in) financing activities
303,160
2,955
95,623
(1,884)
6,123
Cash and cash equivalents beginning of the year
191,700
196,375
98,993
44,893
56,460
Cash and cash equivalents end of year
430,357
191,700
196,375
98,993
44,893
Depreciation and amortization
30,038
24,955
22,961
25,788
24,709
Purchases of property, plant and equipment
28,995
13,728
12,621
19,558
59,136
0.66
0.61
0.36
0.44
0.25
72,484
77,509
41,177
44,502
(22,450)
US$ per share
Cash EPS (operating CF/diluted shares)
1,000 US$
Free Cash flow
(Net Cash provided by operations less capital expenditures)
FINANCIAL HIGHLIGHTS
1,000 US$
Sample & Assay Technologies
QIAGEN is the world’s leading provider of sample and assay technologies –
tools that enable the handling, processing and preparation as well as the
molecular analysis and testing of any biological sample. The Company is
uniquely focused on what is one of the most exciting segments in the industrial
revolution created by molecular biology.
The increasing demand for molecular testing procedures is fueling a growing
need for sample and assay technologies in laboratories around the world in
molecular diagnostics, applied testing and life science research.
QIAGEN ’s contributions and products are expanding the frontiers of science
and healthcare every day and at the same time represent and are expanding
their positions as strong standards. By extending our market and technology
leadership and our expertise in providing technologies that can be leveraged
across and adopted in all markets we serve, we are consequently building
for future growth.
Contents
02
Letter from the Managing Board
06
QIAGEN – The Executive Committee
08
QIAGEN’s Common Share
12
Markets and Strategy
20
Research and Development
30
Financial Statements
56
Report of the Supervisory Board
58
Corporate Governance
68
Financial Calendar / Investor Relations Contacts
Cover
Financial Highlights 2006
QIAGEN Global Contacts
Disclaimer and Trademarks
Glossary
Form 20-F (Supplement)
02
Let t er f rom the M ana ging B o ard
Q IAG EN – The E xe cutive Commit t e e
Q IAGEN’s Common Share
M arkets and Strate gy
Research and Development
Financial Statements
Rep or t of the Sup er visor y B o ard
Corporate Governance
Dear Shareholder,
For QIAGEN, 2006 was another very successful year. It was one more year in which we achieved and
exceeded the targets we had set for ourselves and QIAGEN : to expand our leadership position in sample
and assay technologies and to expand their use in existing and extend their use into new markets. We
are proud to report that the execution of our strategy has also resulted in industry-leading financial performance. We achieved consolidated net sales of US$466 million for the year ending December 31, 2006 –
a 17 % increase in net sales compared to the previous period. Our innovation engine continues to deliver
impressive performance and contributed 4 % to our organic growth of 11 %. Net income increased 13 %
to US$70.5 million from US$62.2 million and diluted earnings per share increased 12 % to US$0.46 per
share from US$0.41 per share in 2005. Excluding certain charges ¹ adjusted net income increased 23 % to
US$85.3 million and adjusted diluted earnings per share increased 22 % to US$0.56 per share in 2006.
03
Once again, we outperformed our industry and demonstrated that our commitment to focusing on an
innovation strategy around sample and assay technologies is clearly delivering results. We executed wellprepared plans and roadmaps to address multiple markets with what we do best – providing solutions
which allow processing and isolation of target analytes from biological samples and making them visible.
Our formula with which we execute our strategy is a blend of innovation-driven organic growth, catalytic
acquisitions and active partnering.
To catalyze our organic initiatives, among our 2006 acquisitions were two companies through which we
gained access to new opportunities in highly attractive markets. The acquisition of Gentra Systems, Inc.
expanded our sample technology portfolio into the field of processing large-scale blood samples in the
emerging biobanking and DNA archiving markets. By acquiring Genaco Biomedical Products, Inc., we
now hold one of the most innovative assay technologies which provides a solution to the much sought after
goal of multiplexing, a diagnostic approach which allows for screening multiple targets in one single test.
Both companies’ product lines are very much in our focus as they represent sample and assay technologies.
They are also highly synergistic with our product portfolio and allow us to further leverage our capabilities
in sample and assay technologies in our target markets, including research in life sciences, applied testing
and molecular diagnostics.
The integration of acquisitions is always a challenge for any organization. We are very pleased to report
that our significant attention to integrations yielded positive results. Since 2005, ten companies were added
to QIAGEN which provided significant catalytic impacts and led to a 6 % contribution to our overall growth.
We expect to continue this focused, strategy-driven acquisition strategy.
In 2006, we continued to establish and expand numerous partnerships, collaborations and license agreements. Our value to the molecular diagnostics and applied testing industries is growing tremendously.
In the areas of pharmaceutical, biotechnology and biomedical research, QIAGEN today is a premium
partner for solutions for discovery as well as the development of new drugs. This area has been a central
point of our partnering and marketing efforts in 2006. Our products are used in over 100 clinical trials
¹ Charges in fiscal 2006 included amortization on acquisition-related intangibles of US$8.2 million (US$5.3 million net of tax), acquisition, integration and related costs of
US$10.3 million ( US$8.3 million net of tax), relocation and restructuring costs of US$1.5 million ( US$1.0 million net of tax), as well as equity-based compensation cost
according to SFAS 123R of US$325,000 (US$213,000 net of tax). Charges in fiscal 2005 had included amortization on acquisition-related intangibles of US$3.7 million
(US$2.4 million net of tax) and acquisition, integration and related costs of US$6.9 million (US$ 4.6 million net of tax).
04
Let t er f rom the M ana ging B o ard
Q IAG EN – The E xe cutive Commit t e e
Q IAGEN’s Common Share
M arkets and Strate gy
Research and Development
Financial Statements
Rep or t of the Sup er visor y B o ard
Corporate Governance
and our ability to provide to our customers a continuum from research tools to routine molecular diagnostics is a very significant value proposition in this new era of molecular testing-driven drug development,
monitoring and personalized medicine.
Developing for and together with our customers gives us a competitive edge and fuels our powerful innovation engine. In 2006, we launched 67 exciting new products, which accounted for 4 % of our Company’s
net sales. We also finalized the development of QIA cube, a revolutionary platform which created a completely new dimension of utility and opportunities for our customers in laboratories worldwide. Introduced
in early 2007, the QIA cube allows our customers to fully automate the processing of QIAGEN products
which they use manually today. And there is so much more in our product pipeline yet to come: consumables, reagents, assays, instruments.
The innovative, standardized solutions which we provide enable our customers to achieve significant scientific breakthroughs and increase dissemination of molecular biology by facilitating its application. For example, in 2006, Craig C. Mello, Ph.D., and Andrew Z. Fire, Ph.D., earned the Nobel Prize in Medicine for
their discoveries in RNA interference – a mechanism in molecular biology to “silence” genes. QIAGEN is
a leading innovator supplier of RNA i assay technologies and it gives us great pride to have participated
in their discoveries as a supplier to their laboratories.
A major step for QIAGEN is to leverage our well-established expertise and proven capabilities gained
in life sciences research into the rapidly developing, but very specialized diagnostics and applied testing
markets. Clinical laboratories are increasingly offering molecular diagnostic tests, allowing new diagnostic
possibilities or replacing older technologies with state-of-the-art molecular methods which allow for faster,
more reliable disease detection and treatments. QIAGEN is driving this trend by offering a portfolio of
comprehensive sample and assay technologies for molecular diagnostics which is the broadest in the world.
In 2007, we expect to further widen our panel and scope by seeking FDA approval in the United States
for a range of products including two of our novel multiplexing assays and begin to add CE markings
in Europe for all our panels. These regulatory clearances will allow us to offer more solutions for use in
clinical applications.
A strategic goal for QIAGEN is to reinforce our global reach by addressing and further penetrating emerging and fast-growing markets including markets in Asia. In 2006, we significantly strengthened our presence
in Asia. We developed our extensive network of distributors, established a new subsidiary in Korea, and
05
set up our Asian headquarters in Shenzen, China. We invested heavily and doubled our headcount in this
region to 340. Our strategy in Asia, which was recognized by Frost & Sullivan’s renowned Competitive
Strategy Leadership Award, is clearly delivering results. This year, the region is set to contribute 10 % of
QIAGEN ’s net sales which will add to the substantial growth delivered by our other regions – North America,
Europe and the rest of the world.
We believe that our growth strategy offers considerable value to our shareholders and employees. We also
understand that all areas of our business require adequate investments if we want to achieve our goals. In
2006, we invested significantly into the development of dedicated sales channels, with a strong focus on
the molecular diagnostics and applied testing segments – a step which we are convinced will yield reasonable results in the very near future. We will further invest in technological expertise, in research and development capabilities as well as in QIAGEN ’s greatest source of its success: its employees. Responses from
internal and external surveys and awards which we received in the United States and in Germany for being
an employer of choice prove that these investments are well acknowledged and promise high returns.
I would like to thank you, our shareholder, for the trust and support you continue to give us. In 2006,
we celebrated the tenth anniversary of our listing on NASDAQ . In this decade, the share price increased
ten-fold; in 2006 alone, our share price on NASDAQ grew by 27 % and we outperformed the leading
and relevant stock indices. We are committed to further creating sustainable value for you and our great
Company.
I would also like to thank our more than 1,950 employees for their enthusiasm and dedication which makes
our success possible. At QIAGEN, we are very proud of what we are doing, because our work helps to improve people’s health and lives. And we believe that the best is yet to come.
We have built a great platform with which we can proudly step forward into 2007. It is up to us to take
on our many opportunities.
Yours Sincerely,
Peer M. Schatz, Chief Executive Officer
06
Let t er f rom the M ana ging B o ard
Q IAG EN – The E xe cutive Commit t e e
Q IAGEN’s Common Share
M arkets and Strate gy
Research and Development
Financial Statements
Rep or t of the Sup er visor y B o ard
Corporate Governance
QIAGEN – The Executive Committee
The Executive Committee,
led by Peer M. Schatz as
Chief Executive Officer,
forms the most senior
global management
team responsible for decisions that have a material or global impact
on QIAGEN’s business,
future, and employees.
It merges over 70 years of
QIAGEN experience with
unique expert knowledge
from the diagnostic and
pharmaceutical industries.
Roland Sackers
Peer M. Schatz
Chief Financial Officer
Chief Executive Officer
Roland Sackers joined the
Company in 1999 as Vice
President Finance. Between
1995 and 1999, Mr. Sackers
worked as an auditor with
Arthur Andersen Wirtschaftsprüfungsgesellschaft Steuerberatungsgesellschaft. Since
July 2004, Mr. Sackers is a
member of the Supervisory
Board of Operon Biotechnologies Inc.
Peer M. Schatz joined QIAGEN
in 1993. Mr. Schatz was previously a partner in a private
management buyout group
in Switzerland and worked in
finance and systems positions
at Sandoz, Ltd., and Computerland AG as well as in finance,
operations, management and
sales positions in various startup companies in the computer
and software trading industry
in Europe and the United States.
Mr. Schatz is a member of the
German Corporate Governance Commission.
Dr. Thomas Schweins
Vice President
Marketing & Strategy
Bernd Uder
Senior Vice President
Global Sales
Dr. Thomas Schweins joined
the Company in 2004 as Vice
President Corporate Strategy.
Prior to joining QIAGEN, he
Bernd Uder joined QIAGEN
in 2001 as Vice President
Sales & Marketing. Before
joining QIAGEN, Mr. Uder
gained wide experience in
building up and coordinating
worldwide distribution networks as Vice President European Biolab Sales & Marketing with Pharmacia and Vice
President global e.business
with Amersham Pharmacia
Biotech.
worked at the Boston Consulting Group, Düsseldorf, where
he was a core team member
of the Pharma / Health Care as
well as the Corporate Development Practice Area. Prior to
his latest position with BCG,
Dr. Schweins worked three
years as Technology Manager
and later as Assistant to the
Board with Hoechst / Aventis.
07
Gerhard Sohn
Vice President
Global Human Resources
Gerhard Sohn joined QIAGEN
in 2005 as Vice President
Global Human Resources.
He brings to QIAGEN twenty
five years of experience in
leading roles in human resources in global organizations. Gerhard Sohn joined
QIAGEN from TNT Logistics,
where he worked as Director
Human Resources and was
responsible for 4,200 employees.
Dr. Ulrich Schriek
Vice President Corporate
Business Development
Dr. Joachim Schorr
Senior Vice President Global
Research & Development
Douglas Liu
Vice President
Global Operations
Dr. Ulrich Schriek joined
Dr. Joachim Schorr joined the
Company in 1992 as Project
Manager and later had responsibilities as Group and Business
Development Manager. In 1999,
Dr. Schorr became Vice President Research & Development
with the responsibility for the
worldwide QIAGEN R & D activities. Before joining QIAGEN,
Dr. Schorr worked for the pharmaceutical company Hoechst on
the development of oral malaria
vaccines and was awarded
with the IHK research award
in 1991.
Douglas Liu joined the
Company in 2005 as Vice
President Global Operations.
Mr. Liu has a twenty year
track record of success in
operations, strategic planning
and R & D in molecular diagnostics, immunodiagnostics
and other healthcare market
segments. Before joining
QIAGEN , Mr. Liu worked at
Bayer Healthcare as Head
of Operations for Nucleic
Acid Diagnostics in the USA
and in Strategic Planning
and Consulting at Bayer AG,
Leverkusen. Prior to these
positions, Mr. Liu worked
at Abbott Diagnostics and
Chiron Diagnostics.
QIAGEN in 1997 and has
been Vice President Corporate
Business Development since
2000. Prior to joining QIAGEN,
Dr. Schriek held several sales
and marketing positions at
Pharmacia Biotech, where
he left as Global Marketing
Director.
Dr. Michael Collasius
Vice President
Automated Systems
Dr. Michael Collasius joined
QIAGEN in 1992 and was
responsible for the integration and the development of
QIAGEN’s instrumentation
business as General Manager of QIAGEN Instruments
since its acquisition in 1998.
During his time at QIAGEN,
Dr. Collasius developed a
series of automated systems
for nucleic acid purification
and handling.
08
Let t er f rom the M ana ging B o ard
Q IAG EN – The E xe cutive Commit t e e
Q IAGEN’s Common Share
M arkets and Strate gy
Research and Development
Financial Statements
Rep or t of the Sup er visor y B o ard
Corporate Governance
QIAGEN’s Common Share
QIAGEN ’s common shares, traded as global shares, are registered and traded in the United States on the
NASDAQ Global Select Market – emanated from the NASDAQ National Market in July 2006 – since June
1996 and on the Frankfurt stock exchange in Germany since 1997, where its shares are traded in the Prime
Standard segment, a premium segment created by the Frankfurt Stock Exchange in January 2003.
L I S T I N G I N F O R M AT I O N
NASDAQ
Market
NASDAQ
Segment
NASDAQ Global
Select Market
Ticker
QGEN
ISIN
NL0000240000
We believe that the dual listing on NASDAQ and the Frankfurt Stock Exchange provides significant advantages for QIAGEN, our shareholders and our employees. Such advantages include
increased visibility of QIAGEN in both Europe and the USA , which can positively impact sales
and other aspects of our business. We also believe that our dual listing enlarges the trading
market for our securities and thereby increases liquidity. This liquidity is also facilitated by the fact
that the equity security traded on both exchanges is QIAGEN ’s common shares (Global Share
Program).
German Stock Exchange
T R A D I N G I N F O R M AT I O N
Market
With a daily average trading volume of nearly 1.2 million shares during 2006 (more than
300,000 shares being traded on the NASDAQ, nearly 850,000 shares in the Prime Standard
segment of the Frankfurt Stock Exchange and 50,000 shares on other German markets) QIAGEN
common shares offered high liquidity. As of December 31, 2006, the free float, affecting the
weighting of QIAGEN ’s common shares in various indexes, was approximately 87.4 %. Members
of the Managing Board and the Supervisory Board hold approximately 7.3 % of the outstanding
shares. We believe that the majority of QIAGEN ’s common shares are held by institutional investors in Europe and in the United States, and are nearly equally split between both markets.
Frankfurt Stock
Exchange
Segment
Prime Standard
Ticker
QIA
WKN
901626
Capitalization (Dec. 31, 2006)
Market
US$2,323 million
10 T H A N N I V E R S A RY O N N A S DAQ
capitali-
QIAGEN completed its Initial Public Offering on the NASDAQ National Market in New York
zation
on June 28, 1996. In the following decade, we experienced tremendous growth expanding from
a supplier of tools for the isolation and preparation of nucleic acids into the world’s leading
provider of sample and assay technologies for biological sample processing and testing in life
sciences, applied testing and molecular diagnostics. Our IPO on NASDAQ, the most important
Shares
153,517,000
outstanding
Free float
approx. 87 %
09
Q I AG E N S H A R E P R I C E D E V E L O PM E N T
N A S DAQ 2 0 0 4 – 2 0 0 6
140 %
100 %
60 %
Over a period of three years,
QIAGEN shares clearly outQIAGEN
performed the NASDAQ
NBI
Biotechnology Index (NBI).
2004
2005
2006
2005
2006
FR ANKFURT STOCK
E XC H A N G E 2 0 0 4 – 2 0 0 6
140 %
100 %
60 %
Over a period of three years,
QIAGEN shares were in line
with the German TecDAX
QIAGEN
TecDAX Index
Index (TecDAX in Euro).
2004
10
Let t er f rom the M ana ging B o ard
Q IAG EN – The E xe cutive Commit t e e
Q IAGEN’s Common Share
M arkets and Strate gy
Research and Development
Financial Statements
Rep or t of the Sup er visor y B o ard
Corporate Governance
Q I AG E N S H A R E H O L D E R S T R U C T U R E
others
QIAGEN
Stock Option Plan, diluting effect
QIAGEN
Directors & Officers
USA / Europe
individual
8%
32 %
USA
institutional
2%
7%
29 %
22 %
Europe
institutional
Source: QIAGEN estimates
stock market for our industry, marked the beginning of an era of sustained shareholder value
creation. During these last ten years, our share price increased more than tenfold and our
market capitalization rose from US$185 million in 1996 to more than US$2 billion in 2006.
I N V E S T O R R E L AT I O N S I N F O R M AT I O N
QIAGEN is committed to ensuring that individual and institutional shareholders, analysts and
journalists are provided with a regular flow of transparent, comprehensive and readily accessible
information on our strategy, business and results. During 2006, QIAGEN ’s management presented
at 23 national and international institutional conferences. More than 40 roadshows and in-house
visits in Europe and the United States provided the opportunity for numerous direct discussions
with investors and analysts. In 2006, QIAGEN shares were followed by more than 25 analysts
from most major institutions and were recommended with a predominantly positive rating on the
shares during the year.
Molecular Diagnostics
QIAGEN’s portfolio of integrated diagnostic solutions, encompassing
standardized preanalytical solutions, optimized assays and dedicated
automated platforms, addresses the essential needs in speed, reliability
and highest sensitivity of nucleic acid testing in molecular diagnostics.
QIAGEN’s portfolio spans over 30 CE-marked and 10 SFDA -approved
(State Food and Drug Administration of China) assays for the detection
of a variety of viral and bacterial pathogens, select assays for genotyping and a strong pipeline of complete biomarker panels for certain
disease profiles.
12
Let t er f rom the M ana ging B o ard
Q IAG EN – The E xe cutive Commit t e e
Q IAGEN’s Common Share
M arkets and Strate gy
Research and Development
Financial Statements
Rep or t of the Sup er visor y B o ard
Corporate Governance
Markets and Strategy –
Leveraging Core Competencies into Multiple Markets
Discoveries in molecular biology over the last 50 years have changed our lives and resulted in significant
advances in modern medicine. Our every-day vocabularies have been expanded with terms such as
‘DNA’, ‘molecular diagnostics’ and ‘personalized medicine’. Powerful, new tools of molecular biology give
researchers new and vast opportunities to understand life’s processes. One outcome of this research is vital
information that helps to cure and prevent diseases.
Molecular biology plays key roles in the high-resolution diagnosis of diseases, the availability
of new treatments and the efforts to increase the effectiveness and efficiency of drugs. Modern
biology is also addressing other important environmental and applied issues. Among these are:
animal health and disease surveillance, agriculture, biodefense, food and quality control.
Each year about
US$100 billion are
spent to understand
Society is responding to the potential offered by these scientific advances by investing heavily to
push the boundaries of discovery even further. Each year, private and public institutions worldwide
spend approximately US$100 billion to advance our understanding of the molecular basis of life.
the molecular basis
of life
In conducting their molecular analysis of life, researchers from around the globe have specific requirements. To maintain scientific integrity, data needs to be of high quality, reproducible, and
comparable. This can only be achieved by standardizing the techniques and procedures being
used from sample preparation through to assays. Here, QIAGEN comes into play.
QIAGEN is considered the world’s key leader in standards in Sample and Assay Technologies.
We manufacture and sell more than 500 proprietary products globally, each designed with one
goal in mind – making molecular biology easier.
W H AT A R E S A M P L E A N D A S S AY T E C H N O L O G I E S?
Biolo gical samples cont ain millions of dif f ere nt mole cules, such as D NA, RNA or prot eins. H oweve r, only a small pro p or tion of t his mat e rial is t y pically of int e rest t o rese arc he rs. Sample technologies are used to collect samples and stabilize, extract and purif y the molecule of interest. Assay
technologies are then use d to amplif y and enrich this small amount of isolate d material to make
it visible, re adable, and re ady for interpretation. Sample and Assay Technologies operate in a
highly synchronize d manner.
13
One of the key factors for QIAGEN ’s success over the past two decades has been the recognition
of our customers’ needs early on and expediently acting on them. Customers consider our products industry standards to enable them to access and analyze content from any biological sample.
We leverage our expertise and capabilities in providing technologies that can be easily adapted
and used in all life science markets, as well as in molecular diagnostics and applied testing. This
allows our investment in innovation to be returned as a multiple.
During 2006, we again expanded our activities to further increase our penetration in our core
markets, through continuous innovation coupled with catalytic acquisitions of technology and
product portfolios. The two most significant acquisitions we made last year, Gentra Systems, Inc.,
and Genaco Biomedical Products, Inc., provided innovative sample and assay technologies to
our portfolio and future growth potential to our Company.
Minneapolis, Minnesota-based Gentra Systems, Inc. has developed and manufactured non-solid
phase nucleic acid purification products for high volume blood samples (up to 10ml) used in bioand blood banking as well as DNA archiving. The acquisition is highly synergistic with QIAGEN ’s
sample technology product portfolio and broadens our value proposition for customers in areas
such as molecular diagnostics, biobanking and translational medicine; areas expected to grow
rapidly in the future.
Multiplexing assay
technologies, a rapidly
expanding segment in
molecular diagnostics
Huntsville, Alabama-based Genaco Biomedical Products, Inc. provided QIAGEN with access
to innovative multiplexing assay technologies, a rapidly expanding segment in molecular diagnostics. These technologies allow screening for multiple targets in one single PCR-based test and
can be used, for example, when a patient presents symptoms that could be caused by one or
more pathogens from a potential pool of dozens of causes. It complements perfectly our assay
technologies portfolio, which confirms and quantifies the number of copies of the target analyte.
A further aspect of our strategy efforts in 2006 included a significant project around one of our
strongest assets – our brand. The QIAGEN brand is considered one of the most powerful and
positive brands in molecular biology. Our leadership in sample technologies including sample
preparation and assay technologies such as PCR-based molecular biology tests is widely recognized. Our new company slogan, Sample and Assay Technologies reflects our focus and
leadership.
The message behind this company slogan is simple – QIAGEN is highly focused and with its
more than 20 years of experience in sample and assay technologies very committed to providing
the best technologies for the most critical steps in the workflow of sample processing and analysis. QIAGEN ’s leadership in sample and assay technologies is widely recognized and represents
the standard in life sciences, applied testing, and molecular diagnostics. Whether it’s DNA ,
RNA or proteins – QIAGEN is committed to leadership in sample and assay technologies for their
analysis.
We significantly upgraded our brand-based communication standards and started implementing
the results from this effort in early 2007.
14
Let t er f rom the M ana ging B o ard
Q IAG EN – The E xe cutive Commit t e e
Q IAGEN’s Common Share
M arkets and Strate gy
Research and Development
Financial Statements
Rep or t of the Sup er visor y B o ard
Corporate Governance
We also optimized our sales and distribution channels throughout the world by creating distinct
sales and marketing channels for each of our markets. Although these markets are very different
in terms of requested segment specific sales and marketing support, they often rely on similar
sample and assay technologies and most of our products find their ways into multiple target
markets. QIAGEN addresses the differentiated customer markets by offering unique and highly
specific sales channels and infrastructures.
T H E M O L E C U L A R D I AG N O S T I C S M A R K E T S
Today, the molecular
diagnostics markets are
estimated to be about
US$2.6 billion
The molecular diagnostics market is still relatively small with a market volume of approximately
US$2.6 billion. This compares to the overall market for in vitro diagnostics, which was estimated
at approximately US$23 billion in 2006. However, the molecular diagnostics market segments are
growing with an estimated growth rate of approximately 20 % per year. Molecular diagnostics is
clearly one of the emerging markets in diagnostics with significant opportunities for future growth.
With almost 30 % of our sales generated in molecular diagnostics markets, QIAGEN has grown to
be one of the world’s leading players in this sector, leveraging our core technologies and knowhow. We operate throughout the value chain: from sample collection from the patient to diagnostic
result. Our customers seek from QIAGEN products that allow:
Rapid result delivery …
speed is crucial in molecular diagnostics as often therapy
is needed as quickly as possible.
Specificity …
elimination of any false negative or false positive results
to avoid uncertainties in decisions on therapy.
Sensitivity …
tests need to ensure they can detect down to low levels
of pathogens.
In these terms, molecular testing – which is based on the detection and/or amplification of DNA or
RNA – is often far superior to conventional methods, such as immunoassays. Although immunoas-
says are generally cost-effective, they suffer from a lack of sensitivity. For example, immunoassays
cannot detect the presence of a pathogen before an appropriate amount of antibodies have been
generated. Given that it takes the human body a certain amount of time to generate antibodies to
a pathogen, these tests can only be performed weeks or even months after infection.
In the case of a human immunodeficiency virus (HIV), the initial detection limit using the classic
method has traditionally ranged between six and twelve weeks post infection, depending on the
degree of accuracy. However, with the advent of testing for the RNA of HIV, the time was shortened to a few days post infection. Another distinct advantage offered by molecular diagnostics
over immunoassays is sensitivity. PCR allows for the billion-fold amplification of available genetic
material, thereby allowing the detection of minute amounts and greatly increasing the sensitivity
of the assay.
15
I M M U N O - A N D M O L E C U L A R A S S AY
I M M U N OA S S AY
M O L E C U L A R A S S AY
Detection of antibodies
PCR-based detection of
against pathogens in an
DNA / RNA of pathogens
Assay technology
antibody antigen reaction
Detection
Indirect
Sensitivity
Medium to low
DNA / RNA copies needed)
Specificity
Low (> 75 %)
High (> 95 %)
Phatogen detectable after
Weeks – months
Days – Weeks
Direct
High (only a couple of virus
M O L E C U L A R D I AG N O S T I C S S A M P L E T E C H N O L O G I E S
Before an assay can be performed, the sample being tested needs to be prepared appropriately.
The quality of the sample preparation is extremely important for the quality of results in the following downstream analysis. QIAGEN ’s unparalleled range of integrated sample technologies
are used as standards in the molecular diagnostics industry to ensure that a sample is processed
and the target analyte isolated to the highest quality before entering the analysis phase. Our
products are used, for instance, to prepare bacterial or viral DNA from a wide range of clinical
samples or to stabilize RNA in freshly drawn blood or fresh tissue samples to stop rare analytes
from degrading before they can be tested. Sometimes, QIAGEN products sail under a foreign flag.
As an OEM (Original Equipment Manufacturer) partner, we develop integrated solutions for and
together with more than 15 manufacturers from the pharmaceutical and diagnostics industries who
integrate our products into products they market.
M O L E C U L A R D I AG N O S T I C S A S S AY T E C H N O L O G I E S
Today, QIAGEN provides
over 100 molecular biology tests with predefined
targets
Today, QIAGEN has the broadest portfolio of assays in the molecular diagnostics industry. In
addition to a leading portfolio of PCR reagent kits, QIAGEN provides a comprehensive portfolio
of over 100 molecular biology tests with predefined targets. This portfolio includes, besides
molecular biology tests for research use, 30 CE-IVD-marked tests for the European markets and
10 SFDA- (China’s State Food and Drug Administration) approved tests for the Chinese markets.
QIAGEN ’s assay product offering covers an unmatched spectrum of real-time PCR tests for major
bacteria and viral detection, including assays for the quantitative detection of Hepatitis A (HepA)
and Hepatitis B Virus (HepB), Herpes Simplex Virus (HSV), and Human Immunodeficiency Virus
(HIV). It also comprises molecular tests for niche pathogens such as the Epstein-Barr-Virus (EBV),
the Parvovirus, the SARS -coronavirus and the Varicella Zoster Virus (VZV). Many of these assays
are offered by no or only by very few other companies.
16
Let t er f rom the M ana ging B o ard
Q IAG EN – The E xe cutive Commit t e e
Q IAGEN’s Common Share
M arkets and Strate gy
Research and Development
Financial Statements
Rep or t of the Sup er visor y B o ard
Corporate Governance
QIAGEN also provides molecular diagnostic tests based on multiplexing, a technology obtained
through our Genaco acquisition and which is a highly synergistic addition to QIAGEN ’s offering
for molecular diagnostics. There is a growing need for rapid, cost-effective solutions in this market.
With the multiplexing approach, a patient sample can now be tested against a panel of multiple
(up to 20) different pathogens or other targets to rapidly screen and determine the identity of
an infection. In a second step, a highly sensitive and quantitative q PCR test can then be used to
confirm the identity and quantify the amount of pathogens present in the sample.
Multiplexed molecular tests are widely adopted in genetic and HLA (Human Leukocyte Antigen)
testing, which assesses donor/recipient compatibility in transplantations. Newer applications
include testing for viral and bacterial panels, hospital-acquired infections and bacterial drug resistance mutations.
QIAGEN intends to seek regulatory approval for a number of multiplexing products. We believe
that regulatory approval is essential to maximize the value of our novel multiplexing products for
our customers.
THE APPLIED TESTING MARKETS
Applied testing is a highly segmented market. In our definition it includes every testing sector apart
from human diagnostic testing, such as biodefense, forensics, veterinary, quality control, environmental and food testing. Around the globe, there is great interest in how molecular biology techniques affect everyday life, from knowing that food is safe to eat to being able to solve a crime.
For many applications in applied testing, a solution is needed that can be used in practice by individuals of various scientific backgrounds and training levels.
Technologies and
products in these
markets need to be
able to produce rapid
results, be reliable
and sensitive
The applied testing markets share many of the same characteristics observed in molecular diagnostics. Technologies and products in these markets need to be able to produce rapid results,
be reliable and sensitive. At the same time, they need to be universal due to the diverse starting
points of sample material. For example, monitoring the development of a specific infectious disease like an epizootic in livestock including cattle, pigs, sheep or poultry, requires the handling of
different sample materials including blood, mucus, saliva, dung, and others. QIAGEN has by far
the deepest know-how and experience and industry-proven sample and assay technologies for
use in all applied testing markets.
APPLIED TESTING SA MPLE TECHNOLOGIES
High quality sample preparation is essential to the applied testing markets to ensure precise results can be achieved. Sample collection and processing are critical steps in analysis in applied
testing. QIAGEN has extensive experience in processing complex samples which is a requirement
in meeting the needs of the varied sectors within the applied testing markets.
A P P L I E D T E S T I N G A S S AY T E C H N O L O G I E S
During 2006, QIAGEN made significant strides to broaden its test kit offering for veterinary applications, a market with a market size of approximately US$100 million and, as more applications
17
are introduced, a growth rate of more than 20 % per year. We acquired a license to commercialize
(outside the UK) a portfolio of selected PCR -based, veterinary molecular assays developed by
the Veterinary Laboratories Agency (VLA). This initial portfolio consists of seven PCR -based assays
for infectious veterinary diseases affecting livestock, such as cows and horses. VLA also helped to
validate one QIAGEN assay for the detection of Mycobacterium paratuberculosis, the causative
agent of Johne’s Disease, a chronic infection of the small and large intestines usually in cattle, but
also in sheep, goats and deer.
QIAGEN is also working with the University of Bern in Switzerland to help eradicate Bovine Viral
Diarrhea (BVD) disease, the most common cattle disease worldwide. Infected animals must be detected with the highest possible sensitivity and specificity. The collaboration with the University of
Bern has resulted in a real-time PCR -based test with significant improvement in all test parameters
over existing detection methods.
We continue to work closely with governmental institutions to provide reagents needed for the
test against biological warfare agents such as smallpox and anthrax. For example, with a partner,
we have become part of a major US governmental defense program, which could further enhance
the security of armed forces by enabling soldiers to analyze biological substances in the field.
T H E L I F E S C I E N C E S R E S E A R C H A N D D R U G D E V E L O PM E N T M A R K E T
Life sciences research represents about 62 % of QIAGEN’s 2006 revenues. This segment has a
number of subsegments: about 38 % of QIAGEN’s total revenues were generated in academia,
thereof about 14 % in biomedical research and about 24 % in pharmaceutical and biotechnology
research and development.
The life sciences research
market = 45,000 academic
and industrial research
laboratories, with more
than 390,000 researchers
worldwide
The life sciences research market for nucleic acid and protein separation and purification products
is comprised of an estimated 45,000 academic and industrial research laboratories, with more
than 390,000 researchers from leading academic institutions, diagnostic laboratories as well
as biotechnology and pharmaceutical companies. Based on estimates of the number of sample
preparations being performed every year, we believe that the potential worldwide market for our
nucleic acid purification products exceeds US$1 billion as the majority of the market currently still
uses home-brew methodology. We also believe that an additional US$800 million is spent annually in this market on PCR enzymes and reagents.
QIAGEN is the world leader in developing and commercializing standard-setting sample and
assay technologies for the research market. During 2007, we anticipate that the number of samples
which have been “QIAGEN ized” will exceed one billion. This is a phenomenal achievement; one
we are truly proud to have achieved. By creating standards early, the benefits to QIAGEN are
multiplied downstream when these core technologies are translated into the high-growth molecular
diagnostics and applied testing markets.
Academic research continues to be an important segment for QIAGEN and is key to our technology leadership. Another subsegment of life sciences research is focused on biomedical research
18
Let t er f rom the M ana ging B o ard
Q IAG EN – The E xe cutive Commit t e e
Q IAGEN’s Common Share
M arkets and Strate gy
Research and Development
Financial Statements
Rep or t of the Sup er visor y B o ard
Corporate Governance
Q I AG E N – L E V E R AG I N G C O R E C O M P E T E N C I E S
Molecular
Diagnostics
Applied
Te s t i n g
Life Sciences
Research
• Academy
• Industr y
Q IAGEN
S A M P L E A N D A S S AY T E C H N O L O G I E S
C o m m o n C o r e A d d r e s s i n g T h r e e M a r ke t s
which is associated with hospitals and clinical trials for the development of drugs. QIAGEN is
currently partnered on more than 100 clinical trial protocols. The third subsegment in life sciences
research is pharmaceutical and biotechnology research. Here, we offer a highly attractive advantage of being the only independent supplier that can truly bridge pharmaceutical customers into
diagnostics. We are actively partnering with key pharmaceutical companies around the world for
the use of molecular techniques to advance drug development by improving patient selection into
clinical trials and monitoring response rates.
The collection of
pharmacogenomic data
on patients in clinical trials
reduces costs and time to
market
The collection of pharmacogenomic and other molecular data on patients in clinical trials significantly reduces both overall costs and time to market, allowing pharmaceutical companies to
increase the number of new pharmaceutical products and their approvals. It also helps to increase
patients’ safety in clinical trials by avoiding the experience of adverse reactions or severe side
effects during medication. And finally: the pool of genetic information on patients collected in
these trials can serve as a valuable tool to improve already existing therapies. Today, more than
two million patients in hospitals in the United States alone are experiencing serious adverse drug
reactions and generally only a fraction of prescribed therapies are effective in patients. Being
able to preselect patients before starting a therapy could help to avoid side effects and increase
the efficiency of medical treatment and lower the costs to our healthcare systems.
19
QIAGEN paves the
way for more efficient
drug development
Today, most drugs are being developed using QIAGEN products. For example, QIAGEN has been
a partner to Merck & Co. for the past ten years during the research and clinical development of
Merck & Co.’s recently launched Gardasil ®, a vaccine against the Human Papilloma Virus (HPV).
Approximately 20 million people in the United States are infected with HPV, a major cause of
cervical cancer in women. Each year, around 3,700 women in the United States die from cervical
cancer caused by HPV infections. Subtypes HPV-16 and HPV-18 account for approximately 70 % of
all cases of cervical cancers. QIAGEN assays were used to identify and classify the strains of HPV
in women entered into the clinical trials of the vaccine and formed an integral part of the regulatory submission for Merck & Co. With our capabilities to develop products for molecular profiling
of patients, our diagnostics-proven quality commitment, and our strong, long-lasting relationship
to the pharmaceutical industry, QIAGEN paves the way for more efficient drug development. We
enable translational research, which improves drug effectiveness and patient safety.
THE FUTURE
As we look at 2007 and beyond, QIAGEN expects a number of exciting new market introductions and launches. These include a further expansion of our sample and assay technology portfolio for research, applied testing and molecular diagnostics as well as a significant investment
in clinical trials for a number of molecular diagnostic products. The pipeline of automated solutions
for sample and assay technologies will continue to yield exciting products that build on such recent
introductions as the QIA cube.
The pace of change is very rapid. In some cases, the future has already begun, based on transformative changes brought on by molecular diagnostics, and affected by overall healthcare
trends.
Industry analysts predict that one day all laboratory tests, including molecular tests, will be completely automated, with all of the work performed by instruments and robots. The laboratory will
come ever closer to consumers. Today, consumers are far more actively involved in healthcare
decision-making processes than ever before. Their options will increase as consumer versions of
molecular tests are developed. It will become as easy to perform a home diagnostic test as it is
to take a temperature with a thermometer.
We believe, QIAGEN is well positioned to take advantage of these exciting growth opportunities
in our target markets: Life sciences research, applied testing and molecular diagnostics.
20
Let t er f rom the M ana ging B o ard
Q IAG EN – The E xe cutive Commit t e e
Q IAGEN’s Common Share
M arkets and Strate gy
Research and Development
Financial Statements
Rep or t of the Sup er visor y B o ard
Corporate Governance
Research and Development – Innovation for Growth
Continuous product innovation is a key driver of revenue growth for QIAGEN. This is why we spend
between 8 and 10 % of our revenues each year on R & D, and currently employ over 320 scientists around
the world. These are premium investment rates and compared to other companies in our industry reflect our
commitment to excellence in research and development. In 2006, these investments resulted in the launch
of 67 new products, of which 42 were sample-technology-related products and 25 were assay-technologyrelated products. Together they contributed approximately 4 % to QIAGEN’s revenue growth in 2006.
QIAGEN ’s scientific and operational excellence in research and development draws on the
combination of deep expertise of our highly trained scientists and our expanding collaborative
networks. In bringing together chemistry, biology, and engineering capabilities with marketing,
business development, and sales teams as well as certain customers, QIAGEN creates a working
environment that encourages openness and the rapid exchange of new ideas while at the same
time ensures high-performance discipline in development.
QIAGEN ’s R & D is highly focused on sample and assay technologies optimized as integrated
solutions to provide highest reliability and convenience for our customers in molecular diagnostics, applied testing, and life sciences research markets. By leveraging expertise and market
leadership in our core technologies we are able to quickly address emerging and rapidly growing markets.
Our scientists are pushing the frontiers of next generation science and thereby expanding our
broad product and technology platform which spans all aspects of sample and assay technologies.
Our development efforts have identified target needs in research in life sciences, applied testing,
and molecular diagnostics markets. In 2006, we also took numerous steps to expand our development efforts by targeting regulated products and markets.
QIAGEN is a key
participant in most
areas of modern
scientific advances
Researchers working at the cutting edge of science every day rely on QIAGEN sample preparation solutions to help push boundaries further. Through its in-house developments, partnering
and its catalytic acquisitions, QIAGEN is a key participant in most areas of modern scientific
advances.
Looking into the future, we believe that QIAGEN is well positioned to expand its leadership in
sample and assay technologies – areas in which we are the unrivalled leader in terms of both
investments and capabilities.
Klapp-Trennseite 2
Applied Testing
The applied testing markets share many of the same characteristics with the molecular
diagnostics markets. Technologies and products in these markets need to be able to
produce rapid results, be reliable and sensitive. Many of the applications heavily rely
on complex sample technologies, due to the diverse sample materials used. QIAGEN
has by far the deepest know-how and experience and the broadest portfolio of industryproven sample and assay technologies that easily can be leveraged into the rapidly
growing market segments in applied testing.
22
Let t er f rom the M ana ging B o ard
Q IAG EN – The E xe cutive Commit t e e
Q IAGEN’s Common Share
M arkets and Strate gy
Research and Development
Financial Statements
Rep or t of the Sup er visor y B o ard
Corporate Governance
DEVELOPING SA MPLE TECHNOLOGIES
The development of tools which enable laboratories to collect, store, extract, and process scarce
target biological molecules such as DNA and proteins from samples and prepare such for subsequent analysis faces severe challenges. A cigarette butt found at a crime scene years after it
was thrown away, for example, contains thousands of different substances and molecules but
only very few genetic traces, which may be partly degraded and very difficult to read. In another
example, one milliliter of blood might only contain three copies of virus DNA which need to be
captured, extracted and purified – this can be compared to isolating three fish from the waters of
the Atlantic Ocean.
QIAGEN has a long tradition at the forefront of developing sample-technology-related tools that
enable the sample preparation and processing of nucleic acids and proteins from any biological
sample. Our R & D efforts include continuous interactions with our customers to understand their
requirements and ensure that effective and efficient solutions are provided.
EX A MPLE: SA MPLE TECHNOLOGIES IN EPIGENETICS
Epigenetics is one
of the fastest growing
areas of molecular
biology research
Epigenetics, where scientists identify and interpret controlling influences on genes, is one of the
fastest growing areas of molecular biology research holding great promise for disease research
and the development of a wide variety of next generation molecular diagnostic tests. The key
epigenetic variable is DNA methylation, a natural phenomenon where one of the DNA’s bases,
cytosine, exists in a normal and a chemically modified, methylated state, acting like an “on” and
“off ” switch for genes.
DNA methylation analysis is a complex and time consuming process where the sample processing
steps presented extreme challenges. In 2006, QIAGEN launched the first complete solution for
sample processing in epigenetics and opened the door to rapid dissemination of this key science.
The EpiTect ® Bisulfite Kit, developed in collaboration with Epigenomics AG, significantly simplifies
the processing of methylated DNA , allowing researchers much faster and more reliable sample
processing for subsequent analysis.
E X A M P L E : S A M P L E T E C H N O L O G I E S I N B I O M E D I C A L T I S S U E M A N AG E M E N T
As medical research is utilizing increasing amounts of biomedical tissue samples, new challenges
emerge that need to be resolved, particularly the standardization of their processing. Data comparability and compatibility of processes within research networks worldwide are needs of increasing importance.
In the fall of 2006, QIAGEN introduced its new Biomedical Tissue Management System which
addresses these needs for standardization and streamlines the integration of the individual steps
in clinical sample processing and analysis. This new portfolio of products is tailored to the sample
processing needs in tissue banks which are proving to be invaluable resources for cutting edge
strategies in academic and pharmaceutical / biotechnology research.
23
E X A M P L E : S A M P L E P R E PA R AT I O N I N B I O B A N K I N G
The acquisition of Gentra Systems, Inc. significantly increased QIAGEN’s sample technology
capabilities in the biobanking-related markets. The transaction added four consumable product
lines in nucleic acid purification and two automation platforms which primarily address large
sample volume processing such as used for blood samples in clinical research biobanks and
molecular diagnostics. Traditionally, biobanking was a confined market niche, mostly targeting
population genetics studies. QIAGEN believes that the growing trends towards increased translational medicine and biomedical research are creating a renewed focus on blood- and tissuebased biobanking, thereby creating new opportunities and potential future growth.
E X A M P L E : S A M P L E P R E PA R AT I O N F O R P R O T E I N S
QIAGEN has one of the broadest and arguably the most advanced portfolio of sample technoQIAGEN products are
used to identify proteins
and to evaluate their role
in biological processes
logies for proteins. We invested significantly in internal research and acquired technologies
to develop a leading suite of sample technologies for protein fractionation, crystallography and
mass spectrometry. Our products are used to identify proteins and to evaluate their role in biological processes in the areas of proteomics, drug discovery, and biomarker identification.
Our customers for these products are primarily in life sciences research in academia and the
pharmaceutical and biotechnology industries and some products, such as the sample technologies for mass spectrometry, are also showing promise in protein-based diagnostics.
E X A M P L E : S A M P L E P R E PA R AT I O N I N S YS T E M S B I O L O GY
Systems Biology –
to understand the complexity of a biological
system as a whole
The move by researchers to understand the complexity of a system as a whole rather than the
individual components continues to gain momentum. For each analysis, the combination of data
on various molecules in a sample is vitally important to begin to understand the interactions of
biology. This discipline, known as Systems Biology, is an extremely important field of development
in the industry. To address the needs of researchers in Systems Biology, QIAGEN ’s automated
and integrated solutions help to simplify this complicated process by allowing the preparation of
several analytes simultaneously from the same biological sample.
In comparative studies, for example, where DNA , RNA , and proteins need to be obtained from
a limited amount of tissue, the use of separate procedures to purify each of these biomolecules
makes sample preparation very complex and time-consuming.
QIAGEN ’s AllPrep product line overcomes this bottleneck by allowing the purification of DNA ,
RNA and protein from the same tissue sample in one procedure. In addition, as a sample such
as tissue does not have to be split for separate purification procedures, maximum yields of DNA ,
RNA , and protein can now be achieved from the same sample for more comprehensive analyses –
thereby saving precious samples.
24
Let t er f rom the M ana ging B o ard
Q IAG EN – The E xe cutive Commit t e e
Q IAGEN’s Common Share
M arkets and Strate gy
Research and Development
Financial Statements
Rep or t of the Sup er visor y B o ard
Corporate Governance
AU T O M AT I O N O F S A M P L E T E C H N O L O G I E S
QIAGEN maintains a significant investment in research and development in the area of automation technologies for sample and assay technologies. Our engineers work very closely with our
other scientists. The result of this very active collaboration which is leveraged by a significant network of external partners is QIAGEN ’s cutting-edge portfolio of instruments for life sciences research, clinical research, applied testing and in vitro diagnostic laboratories. Our automated
solutions target the automation of our proprietary sample and assay technologies and are available to suit our customers’ application requirements and daily throughput needs.
QIA cube – our most
recent innovation in
automation of sample
technologies
Our most recent innovation in automation of sample technologies, QIA cube, is currently being
rolled out to laboratories around the globe. QIA cube already received several prestigious industry
awards and accolades such as the red dot design award or the New Product Award (NPA) Designation of the Association for Laboratory Automation (ALA). QIAcube is a novel, comprehensive
solution which brings a new level of convenience, ease of use and safety to our customers at a
fraction of the price of instruments previously available. It is a fully automated, small footprint
bench-top system that makes DNA , RNA , and protein processing routine and automates the same
QIAGEN consumable products used in manual formats throughout the world and which today
represent absolute standards.
A further example, the BioRobot EZ1 workstation, is a simple to use, affordable system for purifying DNA and RNA (1-6 samples). Since its introduction, we have experienced rapid uptake into
laboratories that conduct purification on a daily basis or for long-term research projects. During
2006, QIAGEN introduced several new applications for the EZ1 workstation, including the EZ1
Virus Mini Kit v2.0 for highly sensitive viral nucleic acid isolation.
D E V E L O P I N G A S S AY T E C H N O L O G I E S
Assay technologies in molecular biology are testing procedures which make molecular targets,
such as protein or nucleic acid information, visible. The solutions provided by QIAGEN can be
separated into two categories. In the first category, we develop and offer advanced PCR, RT-PCR,
and real-time consumable kits in open formats. These reagent kits can be used by customers in all
our key markets. Our customers use these open platforms of PCR reagents to amplify target sequences of DNA or RNA of their choice. Our open kits are perceived to have strong, technologyleading positions and are targeted for use in a lot of different applications, including the detection of a specific gene expression or genotyping information in life sciences and clinical research
as well as the development of home-brew tests in applied testing and molecular diagnostics.
QIAGEN’s Fast Cycling
PCR kits enable ultra-
rapid DNA amplification
in as little as 20 minutes
A number of such open assay technology solutions were introduced by QIAGEN in 2006. One
of the most exciting innovations in this area is QIAGEN ’s Fast Cycling PCR line. Across all markets,
customers ask for products not only guaranteeing the highest levels of reliability, but also a maximum of speed. QIAGEN ’s Fast Cycling PCR kits were introduced by QIAGEN in 2006 and enable
ultra-rapid DNA amplification in as little as 20 minutes, cutting the time compared to conventional
PCR kits by up to 60%. These standardized kits can be used on any thermal cycler, while still
demonstrating specific and sensitive detection of low-copy targets. This is vital for many research
25
Q I AG E N R E S E A R C H & D E V E L O PM E N T
INNOVATION
RESULTS
1
Requirements
12
Analysis
Conceptual
Design
3
Development
4
Quality
Assurance
5
Deployment
BRINGING TOGETHER
CREATING
ALLOWING
ENSURING
Chemistry, Biology
and Engineering with
Marketing, Business
Development and Sales
Working Environment
of Openness
Rapid Exchange
of New Ideas
between Hierarchies
High Performance
Discipline in
Development
applications, for instance in drug development, but also in fields like biodefense, where rapid
pathogen detection allows earlier response.
In the second category, QIAGEN develops specific (“preprogrammed”) and highly sensitive molecular assays with predefined targets such as the RNA or the DNA of a specific virus, i.e. influenza,
HIV or HBV. These assays allow customers to reliably determine and in most cases to quantify
specific targets such as pathogens.
QIAGEN today provides the broadest portfolio of such molecular assays. These assays are often
offered in regulated formats and subject to clearance in the countries offered.
Our expertise in the design of molecular diagnostics assays is widely recognized and our assay
solutions are incorporated and marketed by many companies. Our primary bases for assay development are in Hamburg and Hilden, both Germany, and Shenzhen, China.
QIAGEN is pushing the frontiers of molecular diagnostics on many fronts and in 2006 created an
exciting new capability and leadership in multiplexing assay technologies. In an ideal world, molecular analysis would be performed on one sample by one assay performed on one instrument.
The result, obtained very quickly, would then provide all relevant information. For example, in
molecular diagnostics, the result would allow a physician to initiate the correct treatment for a
particular disease in a time frame that allows treatment to be successful. QIAGEN is moving ever
closer to that goal by providing complete, integrated sample and multiplexed assay technology
solutions that are standardized and enable the whole process to be robust and less prone to
operator’s error.
26
Let t er f rom the M ana ging B o ard
Q IAG EN – The E xe cutive Commit t e e
Q IAGEN’s Common Share
M arkets and Strate gy
Research and Development
Financial Statements
Rep or t of the Sup er visor y B o ard
Corporate Governance
M U LT I P L E X I N G – Identifying Infections with Unspecific Symptoms by Testing against a Panel of Potential Pathogens
Patient with Unspecific
Respiratory Symptoms
Pa n e l o f Po t e n t i a l Pa t h o g e ns
SARS
coronavirus
RSVA
RSVB
PIVI
PIVI / PIVII
Parainfluenza Virus Type I / II
Multiplexing tests simultaneously probe a panel
of up to 20 different
pathogens
Influenza
A
Influenza
B
Enterobacter
Rhinovirus
Coxsackie
virus
Influenza
B
Enterobacter
Rhinovirus
Coxsackie
virus
QIAGEN ResPlex™
SARS
Severe Acute Respiratory
Syndrome
RSVA / RSVB
Respiratory Syncytial Virus
Type A / B
PIVII
Multiplex PCR Assay
SARS
coronavirus
RSVA
RSVB
PIVI
PIVII
Influenza
A
Key to achieving this goal is the concept of using a single assay to identify the underlying cause
of a disease, which may in fact be due to not only one but several different pathogens or disease
indicators. This concept is known as multiplexing. Traditional assays normally detect one to three
molecular targets, one of which is a control. Through the acquisition of Genaco Biomedical Products,
Inc. in 2006, QIAGEN gained access to an innovative multiplexing technology, now called QIAplex,
and a number of tests targeting viral and bacterial infections. These tests work by simultaneously
probing a panel of up to 20 different pathogen types and subtypes that together represent molecular targets of likely causes of a particular disease.
The panels allow the identification of molecular targets or pathogens following “themes”, not individual molecular targets and therefore significantly simplify the diagnostic strategy for a doctor
or clinician. In a second step, a highly sensitive and quantitative qPCR test from our artus assay
portfolio, the broadest selection of molecular assays in the industry, can then be used to confirm
the identity and quantify the amount of targets present in the sample.
E X A M P L E : A S S AY T E C H N O L O G I E S F O R B I O M A R K E R S
The role of biomarkers to indicate the presence of a disease is rapidly gaining traction. More and
more specific proteins are found which reveal relevant disruptions in a flow of information within
a biological system that account for diseases. Customers from the academic research and the
pharmaceutical industry are increasingly focusing on the co-development and co-validation of
biomarker assays with therapeutics. Biomarker assays help to improve drug development efficiency
27
by improving patient selection and clinical trial outcomes and therewith accelerate time-to-market
cycles for new drugs, and reduce clinical trial costs. In some cases, biomarker development may
lead to companion diagnostic products that will be utilized as a prerequisite for therapeutic intervention. QIAGEN actively promotes both, its closed and its open assay-technology-based consumable kits in this area.
E X A M P L E : A S S AY T E C H N O L O G I E S F O R R N A I N T E R F E R E N C E
One of the most exciting areas in scientific research which emerged in recent years is RNA interference (RNA i). Also known as gene silencing, the technique prevents the normal action of genes.
In recognition of the significance of this breakthrough, the Nobel Assembly awarded Andrew Z.
Fire, Ph. D., and Craig C. Mello, Ph. D., the Nobel Prize in Physiology or Medicine for 2006.
This breakthrough paved the way for further discoveries showing that the mechanism can also
be found throughout nature, in plants, animals, and humans. RNA i is now widely used in research
to determine the function of genes and identify potential drug targets. Encouraging results from
early clinical studies indicate that, in the future, RNA i might be used as therapeutics.
QIAGEN provides
highquality RNAi
solutions to enable
biomedical research
and drug discovery
QIAGEN is a leading RNA i technology supplier, providing high-quality RNA i solutions to enable
biomedical research and drug discovery. In 2006, we introduced FlexiPlate siRNA , the world’s
first product line for fully customized sets of small interfering RNA s (siRNA s). These siRNA s are
short RNA molecules that act to silence specific genes. Previously, biologists had to rely on predefined sets of siRNA s, which often were not flexible enough to meet researchers’ needs. QIAGEN ’s
FlexiPlate siRNA provides a new dimension of flexibility by allowing users to determine not only
the exact RNA i assay, but also precisely the amount of siRNA s needed for their individual requirements. This product introduction builds on QIAGEN ’s existing capabilities in the field. Since 2002,
with the launch of the worldwide first RNA i set for cancer, we have led the RNA i technology field
with pioneering product launches, including the world’s first siRNA sets covering the whole human
and mouse genome.
R E G U L AT O RY A F FA I R S
Throughout the R & D process we ensure that the assays are developed to the highest international
regulatory standards. Our customers expect the uppermost quality products and look for the validation that comes with the seal of regulatory approval. Complementing an initiative started in
2004, in 2006, QIAGEN once again placed significant resources into regulatory affairs. We now
have regulatory and clinical affairs departments based in the United States, Europe and China.
In the near term, the Genaco acquisition provided QIAGEN with several multiplex products that
are nearing a submission for regulatory approval. We are in the process of completing clinical
studies so that 510(k) applications to the US Food and Drug Administration (FDA) can be submitted for the H5N1 avian flu assay and StaphPlex™, a test for bacterial infections. Submission of
additional ResPlex™ products and a panel focused on hospital-acquired infection (HAI ) to the FDA
for regulatory approvals are planned in 2008. Throughout 2007 and 2008, we will be seeking CE
marking for a number of infectious disease panels.
28
Let t er f rom the M ana ging B o ard
Q IAG EN – The E xe cutive Commit t e e
Q IAGEN’s Common Share
M arkets and Strate gy
Research and Development
Financial Statements
Rep or t of the Sup er visor y B o ard
Corporate Governance
Q I AG E N – T E C H N O L O GY A N D I N N OVAT I O N L E A D E R
Scientific
Seminars
COM BI N I N G
Chemistry, Biology and
Engineering with Innovation
Management makes QIAGEN
Innovation
Process
Journal
Clubs
the Technology and Innovation
SUPERIOR
Leader
Idea
Management
Measurements
Innovation
Award
P R O D U C T & D E V E L O PM E N T I N N OVAT I O N
QIAGEN has a well-established, cross-functional innovation culture that fosters an open working
climate both within the Company and with customers, producing exceptional results.
In recognition of this creative environment, QIAGEN in 2006 introduced the Innovation Award,
a reward scheme for employees to address the most promising product, application, technology
idea or concept. Any individual or team employed at QIAGEN can apply. Entries are judged by
an internal and external panel on a number of criteria, including customer value, potential, economic impact, and the chance of implementation, strategic fit, and IP potential.
We have always believed
that the interaction
with our customers and
responding to their needs
result in high levels of
creativity
Innovation doesn’t occur in isolation. We have always believed that the interaction with our customers and responding to their needs result in high levels of creativity. Many and very important
collaborations with academia and leading companies in the pharmaceutical and diagnostics industries support our internal resources. Each collaboration provides vital resources and expertise
that we are able to leverage during the innovation process, often resulting in first-of-a-kind product
solutions. As a company with a flexible R& D organizational structure, the ability to quickly retool
and refocus our development efforts allows us to address new technologies and emerging markets
rapidly and efficiently.
Klapp-Trennseite 3
Life Science Research
QIAGEN is the world leader in developing and commercializing standard-setting
sample and assay technologies for the life science research markets. During 2007,
we anticipate that the number of samples which have been “QIAGEN ized” will
exceed the barrier of one billion. Academic, biomedical, pharmaceutical and
biotechnology research are expanding the frontiers of science every day. QIAGEN
has a unique position as a partner to the pharmaceutical industry and is actively
cooperating with key pharmaceutical companies around the globe to advance drug
development by improving patient selection into clinical trials and monitoring response
rates and subsequently to push towards personalized medicine.
30
Let t er f rom the M ana ging B o ard
Q IAG EN – The E xe cutive Commit t e e
Q IAG EN’s Common Share
M arkets and Strate gy
Research and Development
Financial Statements
Rep or t of the Sup er visor y B o ard
Corporate Governance
Business Overview
• CONSUM ABLES: We offer most of our sample and assay consum-
able products, which account for about 90 % of our business, in
kit form to maximize customer convenience and reduce user error.
These kits contain our proprietary disposable sample processing devices and/or other proprietary technologies, all necessary reagents
DESCRIPTION OF OUR BUSINESS
and buffers, and a technical handbook that includes a detailed
We believe that we are the world’s leading provider of innovative
protocol and background information. Each kit includes devices and
technologies and products for preanalytical sample preparation and
reagents for a specified number of preparations ranging from one
linked molecular assay solutions. This belief is based on the nature of
to thousands. Each kit is covered by our quality guarantee. Major
our products and technologies and on our United States and European
applications for our consumable products are plasmid deoxyribo-
market shares as supported by independent market studies. We oper-
nucleic acid, or DNA purification; ribonucleic acid, or RNA stabili-
ate exclusively in life-sciences-related industries, and develop, manu-
zation and purification; genomic and viral nucleic acid purification;
facture and market a broad portfolio of proprietary technologies and
nucleic acid transfection; PCR amplification; reverse transcription;
products, which meet the needs of markets including academic and
DNA cleanup after PCR and sequencing; DNA cloning and protein
industrial research, applied testing and molecular diagnostics.
purification. In 2005, we began offering validated PCR assays
which allow PCR -based detection of viral, bacterial and parasite,
Our products standardize workflows and enable customers to reliably
human and animal pathogens as well as pharmacogenomic geno-
and rapidly process samples from collection through to purification of
typing. The majority of assays are validated with either manual
the target molecule, such as nucleic acids or proteins, without using
QIA amp sample preparation or automated MagAttract sample
hazardous reagents or expensive equipment.
preparation from QIAGEN and CE-labeled according to the IvDDirective in the EU. During 2006, we developed and launched 67
We have developed or acquired a core set of technologies to provide
new products including innovative sample and assay technologies
a comprehensive approach to preanalytical sample processing. These
for research in the areas of epigenetics, gene expression, micro
technologies can be used alone or in combination to achieve the best
RNA , proteomics, RNA i and molecular diagnostics.
solution for a given application. In particular, our proprietary technologies for magnetic-particle-based purification, solid-phase anion-
• INSTRUMENTATION: Our BioRobot systems offer walk-away auto-
exchange purification and selective adsorption to silica particles or
mation of sample and assay technologies in low, medium or high-
membranes significantly enhance nucleic acid purification, the most
throughput scale, as well as reaction set-up and other laboratory
difficult, critical, and labor intensive step in nucleic acid isolation. We
tasks. We also sell instruments to our OEM partners. In early 2007,
believe that our technologies represent substantial advances in the
we launched the Q IA cube, a novel sample processing platform
speed, reliability, and ease of use of nucleic acid separation and pu-
incorporating novel and proprietary technologies which allow users
rification procedures and the purity and yield of the resulting nucleic
in research in life sciences, applied testing and molecular diagnos-
acids. We believe that we are the world’s leading provider in the busi-
tics to fully automate the processing of almost all our consumable
ness of sample preparation with a market share of approximately 70 %.
products. The Q IA cube received the distinguished New Product
Award or NPA Designation of the Association for Laboratory Auto-
OUR PRODUCTS
mation or AL A in February, 2007.
We offer over 500 products for a variety of applications in the handling, separation, purification, and subsequent use of nucleic acids
• OTHER: A very small part of our business revenues comes from
and proteins. These sample and assay technologies enable our cus-
custom services, siRNA synthesis, whole genome amplification
tomers to efficiently pursue their research and commercial goals.
services, DNA sequencing, and non-c GMP DNA production on
The main categories of our products include:
a contract basis. We also sell and/or license technology.
31
R E S E A R C H A N D D E V E L O PM E N T
procedures with Ph.D. and M.Sc. scientists in our technical service group,
Our product development efforts are focused on expanding our exist-
who provide this advice and training. Frequent communication with
ing products and developing innovative new products in selected areas
customers enables us to identify market needs, to gain early insight into
where we have expertise and have identified substantial unmet market
new developments and business opportunities, and to respond with new
needs. We intend to maintain our technology leadership position
products. We also distribute several publications, including our annu-
through investments in product improvements, product extensions, and
al catalog, to existing and potential customers worldwide, providing
innovative new approaches. We believe that improvements in instru-
new product information, product updates, and articles contributed
mentation will strengthen our leadership position in the automation
by customers and by our scientists about existing and new applications
of preanalytical processing applications and generate an increased
for our products. In addition, we advertise in leading scientific jour-
demand for our consumable products.
nals such as Science, and hold numerous scientific seminars, in which
our scientists present technical information at leading academic and
Our research and development organization is matrix-structured and
industrial research institutes worldwide. We conduct direct mail cam-
is overseen by our Senior Vice President Research & Development.
paigns to announce new products or offer special sales promotions,
We conduct most of our research and development activities in Ger-
and also offer a personalized bi-monthly electronic newsletter for
many, Switzerland, and the United States. Our organization structure
our worldwide customers that provides helpful hints and information
allows us flexibility to refocus our product development efforts as
for molecular biology applications. Our web site (www.qiagen.com)
new technologies or markets emerge. Our total number of research
contains a full online product catalog and online ordering system, var-
and development employees at December 31, 2006, was 332. Our
ious support tools and resources. Some information is available on our
total research and development expenses in 2006, 2005 and 2004
website in French and German to support these local markets. We also
were approximately US$41.6 million, US$35.8 million, and US$34.4
have a Japanese language site (www.qiagen.co.jp).
million, respectively.
In addition to keeping our customers informed of new product offerSALES AND M ARKETING
ings, we also offer an inventory consignment program. The QIA cabinet
We market our products in more than 40 countries worldwide. We
is a storage cabinet owned by us and placed in customer laboratories
have subsidiaries throughout the world in the markets that we believe
at their request. The QIA cabinet is stocked with our products, offering
have the greatest sales potential. We have established a network of
customers the convenience of immediate access, thereby reducing
highly experienced marketing personnel and employ a dedicated field
product reorder procedures and shipping costs. We monitor cabinet
sales force of over 700 people, who sell our products and provide
inventory and bill the customers at regular intervals as the products
direct support to customers. A significant number of our marketing and
are used. We believe that our QIAcabinet helps us maintain our com-
sales staff are experienced scientists with academic degrees in molec-
petitive position, while also reducing distribution costs and increasing
ular biology or related areas. We also have specialized independent
our visibility in the laboratory.
distributors and importers serving more than 40 countries.
P R I N C I PA L M A R K E T S
Our marketing strategy is focused on providing high-quality products
From our inception, we have believed that nucleic acids and proteins
that offer customers unique advantages, coupled with a commitment
would play an increasingly important role in molecular biology and
to technical excellence and customer service. We have developed a
that major new commercial uses of nucleic acids would be developed.
range of marketing tools designed to provide customers with direct
We have been supplying customers with proprietary products for the
access to technical support and inform them of new product offerings.
processing of nucleic acids since 1986. Customers include major aca-
One such tool is our technical service hotline, which allows existing or
demic institutions and governmental laboratories such as the United
potential customers to discuss, via phone and e-mail, a wide range of tech-
States National Institutes of Health, or NIH , as well as leading pharma-
nical questions regarding our products and related molecular biology
ceutical and biotechnology companies. In addition, fundamental de-
32
Let t er f rom the M ana ging B o ard
Q IAG EN – The E xe cutive Commit t e e
Q IAG EN’s Common Share
M arkets and Strate gy
Research and Development
Financial Statements
Rep or t of the Sup er visor y B o ard
Corporate Governance
velopments in recent years have created significant new opportunities
critical component for ready-to-use real-time PCR assays which we
for us in the emerging markets of nucleic-acid-based molecular diag-
offer and which are linked to our innovative RNA i assay offering.
nostics, and applied testing such as forensics, veterinary diagnostics,
genetically modified organisms, or GMO, and other food testing. In
N U C L E I C - AC I D - B A S E D M O L E C U L A R D I AG N O S T I C S M A R K E T
response to these opportunities, we are currently targeting our products
We believe that the molecular diagnostics market represents a signifi-
and marketing activities to each of these markets.
cant market for nucleic acid separation and purification products. We
believe that the advent of PCR and other amplification technologies
RESEARCH M ARKET
has made the prospect of nucleic-acid-based molecular diagnostics
The worldwide research market for nucleic acid and protein separa-
feasible. Nucleic-acid-based molecular diagnostics have fundamental
tion and purification products is comprised of an estimated 45,000
advantages over traditional diagnostic technologies such as immuno-
academic and industrial research laboratories with more than
assays in terms of specificity and sensitivity. This new generation of
400,000 researchers from leading academic institutions, diagnostics
molecular diagnostics can be used, for example, to detect or identify
companies and laboratories, biotechnology companies, and pharma-
micro-organisms, cancer cells, bacteria, and viruses (including HIV )
ceutical companies. A substantial portion of this market continues to
by searching for their nucleic acid sequences. In order to prove that
utilize traditional, labor-intensive methods for nucleic acid separation
a disease is present in a patient, the unique sequence of the target
and purification, and we estimate that 15 % of all molecular biology
nucleic acid causing the disease must be known, and the sequence in
research time is spent on such processes. We recognized early on
the sample must be amplified to facilitate detection. Potential commer-
the opportunity to replace the traditional methods with reliable, fast,
cial applications for nucleic-acid-based molecular diagnostics include
and high-quality nucleic acid separation and purification technolo-
infectious disease diagnostics in bio banks, HL A typing for bone marrow
gies and products. We concentrated our product development and
and organ transplantation, genetic testing for predisposition to cancers
marketing efforts on this market and now offer over 500 nucleic acid
and other common diseases, and genetic “fingerprinting” of humans,
sample processing products to customers. We also offer a broad and
animals and plants.
innovative portfolio for the expression, purification and fractionation
of proteins. We believe that we are the technology leader in this grow-
The success of nucleic-acid-based molecular diagnostics will depend
ing research market and that we are well positioned to increase sales
on the ability to analyze purified nucleic acid samples from a variety
and expand our share of the research market as laboratories continue
of specimens, including blood, tissue, body fluids and stool, and on
to convert from traditional methods to new technologies such as ours.
automation so that hundreds of samples can be handled concurrently.
Based on estimates of the number of sample preparations being per-
Other key factors will be the convenience, versatility, and reliability of
formed each year, we believe that the potential worldwide research
the nucleic acid separation and purification procedures. Our BioRobot
market for our nucleic acid purification products exceeds US$1 billion,
series has been developed to handle low-, medium-, and high-through-
as the majority of the market currently uses home-brew methodology. In
put nucleic acid sample preparation and handling tasks in molecular
addition, we believe that an additional US$800 million is spent annu-
biology laboratories, clinical laboratories, blood banks, forensic and
ally in this market on PCR enzymes and reagents. We have expanded
genomics projects. Nucleic acid samples purified on our instruments
our product base for PCR amplification and reverse transcription and
are ready for use in the demanding and sensitive downstream assays
continue to develop products for the PCR -related market segment. In
performed in molecular diagnostic applications. We offer closed and
2005, we were one of the first companies to enter into a broad licens-
open assay technologies. The open platforms, such as RT-PCR or
ing agreement with Applied Biosystems Group regarding real-time PCR
Endpoint PCR , contain PCR reagents. Closed platforms, diagnostics
technology. This agreement enhances our value as a leading supplier
with predefined targets, include multiplexing and other pathogen de-
of a broad range of real-time PCR technologies. These real-time PCR
tection assays. In order to broadly address the molecular diagnostics
technologies are optimized for use with our market- and technology-
market, in May 2005, we acquired artus, subsequently renamed
leading preanalytical solutions. Our PCR reagent portfolio is also a
QIAGEN Hamburg GmbH, which offers a broad range of real-time
33
PCR assays for viral and bacterial pathogen detection that are comple-
a range of assays to end users in applied testing markets such as vet-
mentary to our sample preparation kits. The majority of these assays
erinary diagnostics and biodefense laboratories.
are validated with either manual QIAamp sample preparation or automated MagAttract sample preparation and CE-labeled according to
SEASONALITY
the EU-IvD-D. Assays are marketed directly to end customers by our
Our business does not experience predictable seasonality. Historically,
sales channels and selected assays are marketed by major diagnostic
a significant portion of our sales have been to researchers, universities,
partners with access to customers complementary to our customers.
governmental laboratories and private foundations whose funding is
All assays are PCR-licensed for human diagnostic and veterinary diag-
dependent upon grants from government agencies such as the US
nostic purposes and provide all features such as controls, ready-to-use
NIH and similar domestic and international agencies. To the extent
reagents and comprehensive technical documentation needed in a
that our academic customers experience increases, decreases or de-
routine diagnostic testing environment. In addition, we intend to enter
lays in funding arrangements, and to the extent that any of our cus-
into partnerships or other agreements with established companies in
tomers’ activities are slowed, such as during vacation periods or due
the molecular diagnostics market in order to broaden the distribution
to delays in the approval of governmental budgets, including the US
of our products.
federal government’s budget, we may experience fluctuations in sales
volumes during the year or delays from one period to the next in the
APPLIED TESTING MARKET
recognition of sales.
We believe that emerging applied testing markets such as forensics,
veterinary and food offer great opportunities for standardized sample
R E V E N U E BY G E O G R A P H I C R E G I O N
preparation and assay solutions. Successes in crime cases due to DNA
The table below sets forth total revenue during each of the past three
analyses, public debates about GMO and food safety as well as bio-
fiscal years by geographical market, which includes revenue from all
terrorism risks have increased the value of the use of molecular-based
our product and service offerings. It is not practicable to provide a
methods. These methods are performed by well-trained researchers in
detail of revenues by category of activity. Net sales are attributed to
fully equipped laboratories as well as by less-trained personnel calling
countries based on the location of the subsidiary making the sale as
for easy-to-use, reproducible and standardized methods. Our manual
certain subsidiaries have international distribution. Additional informa-
DNA and RNA purification methods and the automated solutions on
tion with respect to operations by geographic region can be found in
BioRobot EZ1, BioSprint 15 and 96 as well as our amplification enzymes
Note 21 to our consolidated financial statements included in our Form
and quantitative assays address the needs in these markets. We market
20-F enclosed with this Annual Report.
R E V E N U E BY G E O G R A P H I C R E G I O N
Net Sales
2006
2005
2004
North America ¹
318,865,000
285,242,000
284,393,000
Germany ¹
220,325,000
187,381,000
163,841,000
Switzerland ¹
40,044,000
36,957,000
37,936,000
Asia ¹
49,875,000
35,266,000
41,563,000
109,025,000
88,924,000
74,117,000
525,000
985,000
65,000
738,659,000
634,755,000
601,915,000
(272,881,000)
(236,360,000)
(221,286,000)
465,778,000
398,395,000
380,629,000
US$
Rest of World ¹
Corporate ¹
Subtotal
Intersegment elimination ²
Total
¹ Includes net sales to affiliates.
² Represents intercompany sales between affiliates, which are accounted for by a formula based on local list prices and are eliminated in consolidation.
34
Let t er f rom the M ana ging B o ard
Q IAG EN – The E xe cutive Commit t e e
Q IAG EN’s Common Share
M arkets and Strate gy
Research and Development
Financial Statements
Rep or t of the Sup er visor y B o ard
Corporate Governance
I N T E L L E C T UA L P R O P E R T Y, P R O P R I E TA RY R I G H T S A N D L I C E N S E S
COMPETITION
We do not depend on any individual patent or technologies owned or
We believe that our primary competition involves traditional separa-
licensed by us. We are however significantly dependent in the aggre-
tion and purification methods, such as phenol extraction, cesium chlo-
gate on technology that we own or license. Therefore, we consider the
ride density gradient centrifugation, and precipitation. These methods
protection of our proprietary technologies and products for the sepa-
utilize widely available reagents and other chemicals supplied by
ration and purification of nucleic acids as the key to the success of our
companies such as Sigma-Aldrich Corp. and Roche Diagnostics GmbH
business. We rely on a combination of patents, licenses and trade-
(Applied Sciences Division). We compete with such methods through
marks to establish and protect our proprietary rights in our technolo-
our innovative technologies and products, which offer a comprehen-
gies and products. We currently own 89 issued patents in the United
sive solution for nucleic acid collection, pretreatment, separation and
States, 56 issued patents in Germany and 327 issued patents in other
purification needs and provide significant advantages over traditional
major industrialized countries, and have 452 pending patent applica-
methods with respect to speed, reliability, convenience, and ease of use.
tions. Worldwide, we own 472 granted patents. Our policy is to file
patent applications in Western Europe, the United States and Japan.
We also experience, and expect to continue to experience, competi-
US patents have a term of 17 years from the date of issue for patents
tion in different segments of our business from other companies pro-
issued from applications submitted prior to June 8, 1995, and 20
viding sample preparation products in kit form and assay solutions.
years from the date of filing of the application in the case of patents
These competitors include: Promega Corp., Invitrogen Corp., Millipore
issued from applications submitted on or after June 8, 1995. Patents
Corp., Roche Diagnostics, and Macherey-Nagel GmbH for nucleic
in most other countries have a term of 20 years from the date of filing
acid separation and purification; Applied Biosystems, Invitrogen Corp.
the patent application. We intend to aggressively prosecute and en-
and Promega Corp. for assay solutions; Invitrogen Corp. and Pro-
force our patents and otherwise protect our proprietary technologies.
mega Corp. for transfection reagents, Sigma-Aldrich Corp. and Fisher
We also rely on trade secrets, know-how, continuing technological
Scientific for protein fractionation products. We believe that our pro-
innovation and licensing opportunities to develop and maintain our
prietary technologies and products offer significant advantages over
competitive position.
competitors’ products with regard to purity, speed, reliability, and
ease of use.
Our practice is to require employees, consultants, outside scientific
collaborators, sponsored researchers and other advisors to execute
We believe that our competitors do not have the same comprehensive
confidentiality agreements upon the commencement of their relation-
approach to preanalytical solutions, including nucleic acid sample pro-
ships with us. These agreements provide that all confidential informa-
cessing, and therefore cannot provide the broad range of technologies
tion developed by or made known to the individual during the course
and depth of products and services that we offer. With our complete
of the individual’s relationship with us is to be kept confidential and
range of manual and fully automated solutions, we believe we offer the
not disclosed to third parties, subject to a right to publish certain in-
value of standardization of procedures and therefore more reliable re-
formation in scientific literature in certain circumstances and to other
sults. We also believe that our integrated strategic approach of sample
specific exceptions. In the case of our employees, the agreements
and assay technologies gives us a competitive advantage. The quality
provide that all inventions conceived by the individual in the course
of sample preparation – a field in which we have a unique market and
of their employment will be our exclusive property.
leadership position – is a key prerequisite for reliable molecular assay
solutions which increasingly are being applied in emerging markets
Additional information with respect to risks related to our reliance on
such as applied testing and molecular diagnostics.
patents and proprietary rights can be found in “Risk Factors” included
in Item 3 of our Form 20-F enclosed with this Annual Report.
Our continued future success will rely in large part on our ability to
maintain our technological advantage over competing products, expand our market presence and preserve customer loyalty. There can
35
be no assurance that we will be able to compete effectively against
ended December 31, 2006, using identical foreign exchange rates
our past, present or future competitors or that developments by others
for both years, net sales would have increased approximately 17 %
will not render our technologies or products noncompetitive.
as compared to the reported increase of 17 % for the year ended
December 31, 2006. Additional information regarding currency
SUPPLIERS
impacts can be found under Item 11 “Quantitative and Qualitative
We buy materials for our products from many suppliers and are not
Disclosures About Market Risk” which is included in our Form 20-F
dependent on any one supplier or group of suppliers for our business
enclosed with this Annual Report.
as a whole. Raw materials generally include chemicals, raw separation
media, biologics, plastics and packaging. Raw materials are generally
GROSS PROFIT
readily available at competitive, stable prices from a number of sup-
Gross profit was US$324.6 million or 70 % of net sales in the year
pliers. Certain raw materials are produced under our specifications,
ended December 31, 2006 as compared to US$275.2 million or 69 %
so we closely monitor stock levels to maintain adequate supplies. We
of net sales in 2005. The absolute dollar increase in 2006 compared
believe we maintain inventories of raw materials at a sufficient level
to 2005 is attributable to the increase in net sales. The gross margin
to ensure reasonable customer service levels and to guard against
of 70 % in 2006 as compared to the gross margin of 69 % in 2005
normal volatility in availability.
primarily reflects the impact of our consumable sales. Our consumable
products have a higher gross margin than our instrumentation products
FISCAL YEAR ENDED
and fluctuations in the sales levels of these products can result in fluc-
D E C E M B E R 31, 2 0 0 6, C O M PA R E D T O 2 0 0 5
tuation in our gross margin during a quarter when compared to the
gross margin of another quarter. During 2006 and 2005, instrumen-
NET SALES
tation sales represented approximately 10 % of our total sales. In con-
In 2006, net sales increased 17 % to US$465.8 million from US$398.4
nection with our acquisitions in 2006 and 2005, we expensed US$2.0
million in 2005. In 2006, net sales in North America increased 12 %,
million and US$439,000, respectively, of inventory to cost of sales which
net sales in Europe increased 17 % and net sales in Asia increased
will be replaced with products integrating newly acquired technologies.
41 %, primarily driven by China. The increase in sales was primarily
the result of an increase in our consumables products sales which ex-
RESEARCH AND DEVELOPMENT
perienced a growth rate of 17 % in 2006 as compared to 2005. The
Research and development expenses increased 16 % to US$41.6 million
increase in consumable sales includes organic growth and sales from
(9 % of net sales) in 2006 compared with US$35.8 million (9 % of net
our recently acquired businesses. During 2006, sales from our instru-
sales) in 2005. Using identical foreign exchange rates for both years,
mentation products increased 19 % compared to 2005. Sales of our
research and development expenses would have increased approxi-
other offerings, primarily services, which represented 1 % of our 2006
mately 15 %. Our recent acquisitions of new technologies, notably
net sales, decreased 16 % in 2006 as compared to 2005.
those acquired via the acquisitions of artus and 5-Prime, have resulted
in an increase in our research and development costs. As we continue
We regularly introduce new products in order to extend the life of our
to expand our research activities and product development capabili-
existing product lines as well as to address new market opportunities.
ties, additional expense will be incurred related to research and de-
During 2006, we introduced more than 67 new products including
velopment facility costs and the employees engaged in our research
innovative sample and assay technologies for research in the areas
and development efforts. Additionally, our research and development
of epigenetics, gene expression, micro RNA , proteomics, RNA i, and
costs are expected to increase as we incur costs in connection with
molecular diagnostics.
obtaining 510(k) and CE approval of our artus and Genaco assays.
We have a strong commitment to research and development and an-
A significant portion of our revenues is denominated in euros. Changes
ticipate that research and development expenses will increase, per-
in exchange rates can affect the growth rate of net sales. For the year
haps significantly.
36
Let t er f rom the M ana ging B o ard
Q IAG EN – The E xe cutive Commit t e e
Q IAG EN’s Common Share
M arkets and Strate gy
Research and Development
Financial Statements
Rep or t of the Sup er visor y B o ard
Corporate Governance
SALES AND M ARKETING
ACQUISITION, INTEGR ATION AND REL ATED COSTS
Sales and marketing expenses increased 23 % to US$115.9 million (25 %
In connection with our acquisitions, we recorded charges in 2006
of net sales) in 2006 from US$94.3 million (24 % of net sales) in 2005.
of US$2.2 million for purchased in-process research and development
Using identical foreign exchange rates for each year, sales and mar-
and US$2.0 million related to inventory which needed to be replaced
keting expenses would have increased approximately 22 %. Sales and
with products suitable to the newly acquired technologies. Costs
marketing expenses are primarily associated with personnel, commis-
related to acquisition and integration activities during 2006 totaled
sions, advertising, trade shows, publications, freight and logistics ex-
US$6.1 million and included US$1.0 million in severance and employee-
penses and other promotional expenses. The increase in sales and
related costs, US$2.5 million of costs related to acquisition integrations
marketing expenses in 2006 includes expenses related to creating
and US$2.6 million for the impairment of assets.
separate sales organizations addressing customers in industrial and
academic research, applied testing, and molecular diagnostics as well
In connection with our acquisitions, we recorded charges in 2005 of
as to sales organizations in our newly acquired or established subsid-
US$3.2 million for purchased in-process research and development
iaries. We anticipate that sales and marketing costs will increase along
and US$439,000 related to inventory which needed to be replaced
with new product introductions and continued growth in sales of our
with products suitable to the newly acquired technologies. Costs
products.
related to acquisition and integration activities during 2005 totaled
GENER AL AND ADMINISTR ATIVE
of fixed and other assets as a result of the acquisition.
US$3.2 million, including US$2.1 million related to the impairment
General and administrative expenses increased 21 % to US$48.6 million
(10 % of net sales) in 2006 from US$40.1 million (10 % of net sales) in
RELOCATION AND RESTRUCTURING COSTS
2005. Using identical foreign exchange rates for both years, general
Relocation and restructuring costs recorded in 2006 are related to
and administrative expenses would have increased approximately 21 %.
the restructuring of acquired businesses located in Norway and North
General and administrative expenses primarily represent the costs re-
America for which a restructuring was not contemplated at the time of
quired to support our administrative infrastructure which, except for the
acquisition. We expect that restructuring charges related to the 2006
period following our restructuring, have continued to expand along
closures and relocations will total approximately US$2.0 million, of
with our growth. The increase in general and administrative expenses
which US$1.5 million have been recorded as of December 31,
in 2006 includes expenses related to our newly acquired subsidiaries.
2006. These costs consisted primarily of relocation and severance
costs of US$669,000, lease and facility costs of US$181,000 and oth-
ACQUISITION-REL ATED INTANGIBLE A MORTIZ ATION
er costs of US$601,000.
Acquisition-related intangible amortization relates to intangible assets
acquired in our business acquisitions. During 2006, the amortization
OTHER INCOME (EXPENSE)
expense on acquisition-related intangibles increased to US$8.2 million
Other income was US$5.5 million in 2006 compared to other expense
from US$3.7 million in 2005. The increase in expense is the result of an
of US$2.4 million in 2005. This increase in income was mainly due to
increase in the amount of intangibles acquired in our recent business
higher interest income and gain from equity method investees, partial-
acquisitions. During 2006, we completed seven acquisitions which
ly offset by higher interest expense, lower research and development
have increased our intangible assets subject to amortization. We
grant income and a lower loss on foreign currency transactions.
therefore expect that our acquisition-related intangible amortization
will increase as a result of the recent acquisitions as well as by any
In 2006, research and development grant income from European as
future acquisitions.
well as German state and federal government grants decreased to
US$795,000 from US$1.4 million in 2005. We conduct significant
research and development activities in Germany and expect to continue
to apply for such research and development grants in the future.
37
We recorded a loss from foreign currency transactions of US$660,000
PROVISION FOR INCOME TA XES
in 2006 as compared to a loss of US$157,000 in 2005. The loss from
Our effective tax rate decreased to 34 % in 2006 from 36 % in 2005.
foreign currency transactions reflects the net effect of conducting busi-
Our operating subsidiaries are exposed to effective tax rates ranging
ness in currencies other than the US dollar. QIAGEN N.V.’s functional
from approximately 0 % to approximately 62 %. Fluctuations in the
currency is the US dollar and its subsidiaries’ functional currencies
distribution of pretax income among these entities can lead to fluctua-
are the euro, the British pound, the Swedish krone, the Swiss franc,
tions of the effective tax rate in our consolidated financial statements.
the US dollar, the Australian dollar, the Canadian dollar, the Japanese
yen, the Malaysian ringgit, the Chinese yuan, the Korean won, the
FOREIGN CURRENCY
Turkish lira and the Norwegian krone. Additional information regard-
QIAGEN N.V.’s functional currency is the US dollar and our subsid-
ing currency impacts can be found under Item 11 “Quantitative and
iaries’ functional currencies are the local currency of the respective
Qualitative Disclosures About Market Risk” which is included in our
countries in which they are headquartered, in accordance with State-
Form 20-F enclosed with this Annual Report.
ment of Financial Accounting Standard No. 52, “Foreign Currency
Translation”. All amounts in the financial statements of entities whose
For the year ended December 31, 2006, interest income increased to
functional currency is not the US dollar are translated into US dollar
US$16.4 million from US$7.6 million in 2005. Interest income is de-
equivalents at exchange rates as follows: (1) assets and liabilities at
rived mainly from interest-bearing cash accounts and investments. The
period-end rates, (2) income statement accounts at average exchange
increase in interest income in 2006 over 2005 was primarily the re-
rates for the period, and (3) components of shareholders’ equity at
sult of an increase in amounts invested during the year along with an
historical rates. Translation gains or losses are recorded in shareholders’
increase in interest rates. At December 31, 2006, we had US$430.4
equity and transaction gains and losses are reflected in net income.
million in cash and cash equivalents compared to US$191.7 million
The net loss on foreign currency transactions in 2006, 2005 and
at December 31, 2005. As of December 31, 2006, we had US$52.8
2004 was US$660,000, US$157,000, and US$67,000, respectively,
million invested in marketable securities, compared to US$15.0 million
and is included in other income.
in auction rate at December 31, 2005.
L I Q U I D I T Y A N D C A P I TA L R E S O U R C E S
Interest expense increased to US$11.9 million in 2006 compared to
To date, we have funded our business primarily through internally
US$5.9 million in 2005. Interest costs relate primarily to our long-term
generated funds, debt and the private and public sales of equity. Our
borrowings from QIAGEN Finance and the new borrowings from Euro
primary use of cash has been to support continuing operations and
Finance along with the long-term debt related to our facility construction.
our capital expenditure requirements including acquisitions. As of
December 31, 2006 and 2005, we had cash and cash equivalents
In 2006, we recorded a net gain from equity method investees of
of US$430.4 million and US$191.7 million, respectively, and in-
US$1.3 million compared to a loss of US$1.1 million in 2005. The
vestments in current marketable securities of US$52.8 million and
gain / loss primarily represents our share of profits/losses from our
US$15.0 million, respectively. Cash and cash equivalents are prima-
equity investment in PreAnalytiX. As previously disclosed, we intend
rily held in euros and US dollars, other than those cash balances
to continue to make strategic investments in complementary businesses
maintained in the local currency of subsidiaries to meet local working
as the opportunities arise. Accordingly, we may record losses on eq-
capital needs. At December 31, 2006, cash and cash equivalents had
uity investments based on our ownership interest in such companies.
increased by US$238.7 million over December 31, 2005, primarily
due to cash provided by operating activities of US$101.5 million and
Other miscellaneous expense was US$360,000 in 2006 compared
financing activities of US$303.2 million, offset by cash used in invest-
to other miscellaneous income of US$741,000 in 2005. This increase
ing activities of US$165.5 million. Marketable securities consist of
in miscellaneous expense was primarily due to 2006 losses on the
fixed and floating rate debt instruments. As of December 31, 2006
disposition of property and equipment.
and 2005, we had working capital of US$566.7 million and US$278.6
million, respectively.
38
Let t er f rom the M ana ging B o ard
Q IAG EN – The E xe cutive Commit t e e
Q IAG EN’s Common Share
M arkets and Strate gy
Research and Development
Financial Statements
Rep or t of the Sup er visor y B o ard
Corporate Governance
O P E R AT I N G AC T I V I T I E S
convertible notes, with a 1.5 % coupon due in 2024 through QIAGEN
For the years ended December 31, 2006 and 2005, we generated
Finance, which was established for this purpose. The net proceeds of
net cash from operating activities of US$101.5 million and US$91.2
the convertible debt were loaned by QIAGEN Finance to our consoli-
million, respectively. Cash provided by operating activities increased
dated US and Swiss subsidiaries. The long-term notes payable to
in 2006 compared to 2005 primarily due to increases in net income
Q IAGEN Finance have an effective interest rate of 1.95 % and are
and accounts payable, partially offset by an increase in inventories
due in August 2011. The convertible notes issued by QIAGEN Finance
and a decrease in accrued liabilities. Since we rely heavily on cash
are convertible into shares of our common stock at a conversion price
generated from operating activities to fund our business, a decrease
of US$12.6449 subject to adjustment. We also have a note payable
in demand for our products or significant technological advances of
of EUR 30.0 million, (approximately US$39.6 million at December 31,
competitors would have a negative impact on our liquidity.
2006) which bears interest at a variable interest rate of EURIBOR plus
0.75 % and is due in annual payments of EUR 5.0 million through June
I N V E S T I N G AC T I V I T I E S
2011 and a note payable of EUR 5.0 million (approximately US$6.6
Approximately US$165.5 million of cash was used in investing activities
million at December 31, 2006) which is due in June 2008.
during 2006, compared to US$98.5 million during 2005. Investing
activities during 2006 consisted principally of purchases of property
In May 2006, we completed the offering of US$300.0 million of
and equipment and cash paid for acquisitions and the purchase of in-
3.25 % senior convertible notes (2006 Notes) due in 2026 through the
tangible assets. In the third quarter of 2006, we began construction of
new unconsolidated subsidiary QIAGEN Euro Finance (Luxembourg)
a new logistics center located in Germany. The new facility will occupy
S.A. (Euro Finance). The net proceeds of the 2006 Notes were loaned
approximately 48,000 square feet and will cost an estimated EUR 9.0
by Euro Finance to consolidated subsidiaries. At September 30, 2006,
million, of which EUR 6.4 million (approximately US$8.2 million) had
US$300.0 million is included in long-term debt for the amount of 2006
been incurred through December 31, 2006. The new logistics facility
Notes proceeds payable to Euro Finance. These long-term notes pay-
along with future expansions and acquisitions may result in increased
able to EUR Finance have an effective interest rate of 4.2 % and are
investing activities compared to prior periods.
due in May 2013. Interest on the 2006 Notes is payable semi-annually
in May and November. The 2006 Notes were issued at 100 % of prin-
F I N A N C I N G AC T I V I T I E S
cipal value, and are convertible into 15.0 million shares of common
Financing activities provided US$303.2 million in cash for the year
stock at the option of the holder upon the occurrence of certain events
ended December 31, 2006, compared to US$3.0 million for the same
at a price of US$20.00 per share, subject to adjustment. QIAGEN N.V.
period in 2005. Cash provided during the period was primarily due to
has an agreement with Euro Finance to issue shares to the investors in
the proceeds received from a long-term loan payable to Euro Finance,
the event of conversion. This subscription right, along with the related
the issuance of common shares as a result of stock option exercises,
receivable, is recorded at fair value in the equity of QIAGEN N.V.
tax benefits from stock-based compensation and proceeds received in
as paid-in capital. The 2006 Notes cannot be called for the first seven
connection with an agreement to issue shares to QIAGEN Finance,
years and are callable thereafter subject to a provisional call trigger
partially offset by capital lease payments and the repayment of debt.
of 130 % of the conversion price. In addition, the holders of the 2006
We have credit lines totaling US$12.4 million at variable interest
standing Notes for 100 % of the principal amount, plus accrued interest,
rates, none of which was utilized as of December 31, 2006. We also
on May 16, 2013, 2017 and 2022.
Notes may require QIAGEN to repurchase all or a portion of the out-
have capital lease obligations, including interest, in the amount of
US$12.8 million, and carry US$496.1 million of long-term debt.
In connection with the first quarter 2006 acquisition of PG Biotech, we
acquired approximately US$3.1 million in short-term debt. The debt
We have two notes payable that are the long-term borrowings of the
proceeds from the issuance of US$150.0 million senior unsubordinated
was due and paid in April 2006.
39
We believe that funds from operations, existing cash and cash equiva-
US$2.8 million and US$663,000 million, respectively, which are in-
lents, together with the proceeds from our public and private sales of
cluded in other long-term liabilities in the accompanying consolidated
equity and convertible notes, and availability of financing facilities as
balance sheets. During 2006, we also entered into two additional
needed, will be sufficient to fund our planned operations and expan-
forward arrangements which qualify as cash flow hedges of foreign-
sion during the coming year.
currency-denominated liabilities. At December 31, 2006, we held a
contract for Canadian dollars 8.0 million which matured in February
2007 and had a fair market value of US$126,000 at December 31,
CURRENCY HEDGING
In the ordinary course of business, we purchase financial instruments
2006. Additionally we held a contract for Japanese yen 200.0 million
with which we intend to hedge foreign currency fluctuations with the
which matures in April 2007 and had a fair market value of US$190,000
principal objective of minimizing the risks and /or costs associated
at December 31, 2006. The fair values of these forwards are included
with global financial and operating activities. Generally, we hedge a
in prepaid and other assets at December 31, 2006. During 2005,
majority of the anticipated cash flow that we expect to exchange into
we also entered into a forward arrangement which qualified as a cash
other currencies, subject to our short-term financing needs. We do not
flow hedge of 9.0 million Canadian dollars. This contract matured in
utilize financial instruments for trading or other speculative purposes.
February 2006 and had a fair market value of US$377,000 at December 31, 2005, which was included in accrued and other liabilities
At December 31, 2006, these foreign currency instruments consisted
at December 31, 2005.
of options, which give us the right, but not the obligation, to purchase
foreign currencies in exchange for US dollars at predetermined ex-
The gain or loss on the change in the fair values of the derivatives are
change rates. These options are marked to market through our state-
included in earnings to the extent they offset the earnings impact of
ments of income and are not designated as effective hedges accord-
changes in the fair values of the hedged obligations. Any difference
ing to the provisions of SFAS 133. At December 31, 2006, we did
is deferred in accumulated comprehensive income, a component of
not have any significant foreign currency exchange option holdings.
shareholders’ equity. These contracts effectively fix the exchange rate
at which the intercompany loans will be settled in, so that gains or
During 2005, our German and Swiss subsidiaries entered into forward
losses on the forward contracts offset the losses or gains from changes
arrangements which qualify for hedge accounting as cash flow hedges
in the value of the underlying intercompany loans.
of foreign-currency-denominated liabilities. At December 31, 2006,
these forward contracts totaled US$44.0 million as a hedge to currency
C O N T R AC T UA L O B L I GAT I O N S
risk on intercompany loans. The contracts mature in July 2011 and at
As of December 31, 2006, our future contractual cash obligations are
December 31, 2006 and 2005 had fair market values of approximately
as follows:
C O N T R AC T UA L O B L I GAT I O N S
Total
2007
2008
2009
2010
2011
Thereafter
1,000 US$
Long-term debt
496,190
6,599
13,197
6,599
6,599
163,196
300,000
Capital lease obligations
17,992
1,488
1,563
1,534
1,550
1,491
10,366
Operating leases
23,422
8,396
6,426
3,833
2,975
1,652
140
Purchase obligations
25,119
13,810
9,355
172
172
172
1,438
License and royalty payments
Total contractual cash obligations
3,175
635
413
413
413
413
888
565,898
30,928
30,954
12,551
11,709
166,924
312,832
40
Let t er f rom the M ana ging B o ard
Q IAG EN – The E xe cutive Commit t e e
Q IAG EN’s Common Share
M arkets and Strate gy
Research and Development
Financial Statements
Rep or t of the Sup er visor y B o ard
Corporate Governance
In addition to the above and pursuant to the purchase agreements
that these criteria are not met for certain future transactions, revenue
acquisitions, we could be required to make additional contingent cash
recognized for any reporting period could be adversely affected.
payments totaling up to US$44.6 million based on revenue and other
milestones in 2007 and beyond.
AC C O U N T S R E C E I VA B L E
Our accounts receivable are unsecured, and we are at risk to the extent
C R I T I C A L AC C O U N T I N G P O L I C I E S, J U D G M E N T S A N D E S T I M AT E S
such amounts become uncollectible. We continually monitor accounts
The preparation of our financial statements in accordance with ac-
receivable balances, and provide for an allowance for doubtful ac-
counting principles generally accepted in the United States requires
counts at the time collection becomes questionable based on payment
management to make assumptions that affect the reported amounts of
history or age of the receivable. Since a significant portion of our cus-
assets, liabilities and disclosure of contingencies as of the date of the
tomers are funded through academic or government funding arrange-
financial statements, as well as the reported amounts of revenues and
ments, past history may not be representative of the future. As a result,
expenses during the reporting period. Critical accounting policies are
we may have write-offs of accounts receivable in excess of previously
those that require the most complex or subjective judgments often as
estimated amounts or may in certain periods increase or decrease
a result of the need to make estimates about the effects of matters
the allowance based on management’s current estimates.
that are inherently uncertain. Thus, to the extent that actual events
differ from management’s estimates and assumptions, there could be
I N V E S TM E N T S
a material impact to the financial statements. In applying our critical
We have equity investments accounted for under the cost method.
accounting policies, at times we used accounting estimates that either
We periodically review the carrying value of these investments for
required us to make assumptions about matters that were highly un-
permanent impairment, considering factors such as the most recent
certain at the time the estimate was made or it is reasonably likely
stock transactions, book values from the most recent financial state-
that changes in the accounting estimate may occur from period to
ments, and forecasts and expectations of the investee. Estimating the
period that would have a material impact on the presentation of our
fair value of these nonmarketable equity investments in life science
results of operations, financial position or cash flows. Our critical ac-
companies is inherently subjective, and if actual events differ from
counting policies are those related to revenue recognition, accounts
management’s assumptions, it could require a write-down of the in-
receivable, investments, goodwill and other intangibles, and income
vestment that could materially impact our financial position and results
taxes. We reviewed the development, selection, and disclosure of our
of operations.
critical accounting policies and estimates with the Audit Committee
of our Supervisory Board.
In addition, generally accepted accounting principles require different
methods of accounting for an investment depending on the level of
REVENUE RECOGNITION
control that we exert. Assessing the level of control involves subjective
We recognize revenue in accordance with SEC Staff Accounting
judgments. If management’s assumptions with respect to control differ
Bulletin No. 104, “Revenue Recognition in Financial Statements” (SAB
in future periods and we therefore have to account for these invest-
104). SAB 104 requires that four basic criteria must be met before
ments under a method other than the cost method, it could have a
revenue can be recognized: (1) persuasive evidence of an arrangement
material impact to our financial statements.
exists; (2) delivery has occurred or services have been rendered; (3)
the fee is fixed and determinable; and (4) collectibility is reasonably
G O O D W I L L A N D O T H E R I N TA N G I B L E A S S E T S
assured. Determination of criteria (3) and (4) could require manage-
We account for acquisitions under the purchase method of account-
ment’s judgments regarding the fixed nature of the fee charged for
ing, typically resulting in goodwill. Statement of Financial Accounting
services rendered and products delivered and the collectibility of those
Standards (SFAS) No. 142, “Goodwill and Other Intangible Assets,”
fees. Should changes in conditions cause management to determine
requires us to assess goodwill for impairment at least annually in the
absence of an indicator of possible impairment and immediately upon
41
an indicator of possible impairment. The statement requires estimates
no impairment existed. Even if our estimates of projected future cash
of the fair value of our reporting units. If we determine that the fair
flows were too high by 10 %, there would be no impact on the reported
values are less than the carrying amount of goodwill recorded, we
value of goodwill at December 31, 2006.
must recognize an impairment in our financial statements. Due to the
numerous variables associated with our judgments and assumptions re-
Due to the numerous variables associated with our judgments and
lating to the valuation of the reporting units and the effects of changes
assumptions relating to the valuation of the reporting units and the
in circumstances affecting these valuations, both the precision and re-
effects of changes in circumstances affecting these valuations, both
liability of the resulting estimates are subject to uncertainty, and as
the precision and reliability of the resulting estimates are subject to
additional information becomes known, we may change our estimate.
uncertainty, and as additional information becomes known, we may
change our estimates.
At December 31, 2006, goodwill and intangible assets totaled
US$160.1 million and US$118.5 million, respectively, and were in-
S H A R E - B A S E D C O M P E N S AT I O N
cluded in the following segments as shown in the table below.
Our stock plan, the QIAGEN N.V. Amended and Restated 2005
Stock Plan (the Plan), allows for the granting of stock rights, incentive
In the fourth quarter of 2006, we performed our annual impairment as-
stock options, as well as for nonqualified options, stock grants and
sessment of goodwill (using data as of October 1, 2005) in accordance
stock-based awards. Effective January 1, 2006, we adopted the pro-
with the provisions of SFAS No. 142. In testing for potential impairment,
visions of FASB Statement No. 123 (revised 2004), “Share-Based
we measured the estimated fair value of our reporting units based upon
Payment,” (SFAS 123(R)) and SEC Staff Accounting Bulletin No. 107,
discounted future operating cash flows using a discount rate reflecting
“Share-Based Payment,” (SAB 107), using the modified prospective
our estimated average cost of funds. Differences in assumptions used in
transition method. Under the modified prospective transition method,
projecting future operating cash flows and cost of funds could have a
compensation cost recognized in 2006 includes compensation cost
significant impact on the determination of impairment amounts. In esti-
for all equity-based payments granted prior to but not yet vested as
mating future cash flows, we used our internal budgets. Our budgets
of January 1, 2006, based on the grant date fair value estimated in
were based on recent sales data for existing products, planned timing
accordance with the original provisions of SFAS No. 123 and com-
of new product launches or capital projects, and customer commitments
pensation cost for all equity-based payments granted subsequent
related to new and existing products. These budgets also included as-
to January 1, 2006, based on the grant date fair value estimated in
sumptions of future production volumes and pricing. We concluded that
accordance with the provisions of SFAS No. 123(R).
G O O D W I L L A N D O T H E R I N TA N G I B L E A S S E T S
Goodwill
Intangibles
61,959,000
45,632,000
55,504,000
51,296,000
US$
North America
Germany
Switzerland
–
71,000
Asia
13,689,000
12,345,000
Rest of World
28,989,000
6,124,000
–
3,024,000
160,141,000
118,492,000
Corporate
Total
42
Let t er f rom the M ana ging B o ard
Q IAG EN – The E xe cutive Commit t e e
Q IAG EN’s Common Share
M arkets and Strate gy
Research and Development
Financial Statements
Rep or t of the Sup er visor y B o ard
Corporate Governance
We use the Black-Scholes-Merton valuation model for estimating the
The above listing is not intended to be a comprehensive list of all
fair value of our stock option grants. Option valuation models, includ-
our accounting policies. In many cases, the accounting treatment of
ing Black-Scholes-Merton, require the input of highly subjective as-
a particular transaction is specifically dictated by generally accepted
sumptions, including the risk-free rate of interest, expected dividend
accounting principles in the United States, with limited or no need for
yield, expected volatility, and the expected life of the award. While
management’s judgment. There are also areas in which management’s
there were no significant stock options or other share awards granted
judgment in selecting available alternatives may or may not produce
during the year ended December 31, 2006, we anticipate that the
a materially different result. See our audited consolidated financial
adoption will have a greater impact in future periods and changes in
statements and notes thereto in Item 18 of our Form 20-F (enclosed
the assumptions used can materially affect the grant date fair value
with this Annual Report), which contain a description of accounting
of an award.
policies and other disclosures required by generally accepted accounting principles in the United States.
I N C O M E TA X E S
The calculation of our tax provision is complex due to the international
Further detailed financial information on the Company can be found
operations and multiple taxing jurisdictions in which we operate. We
in our Form 20-F, which is an integrated part of this Annual Report.
have significant deferred tax assets due to net operating losses (NOL).
The utilization of NOL s is not assured and is dependent on generating
If the Form 20-F insert is missing from this Annual Report, it can be
sufficient taxable income in the future. Although management believes
requested from the Company or can be downloaded from the investor
it is more likely than not that we will generate sufficient taxable income
relations section of QIAGEN’s homepage under www.qiagen.com.
to utilize all NOL carryforwards, evaluating the NOL s related to our
newer subsidiaries requires us to make estimates that we believe are
reasonable, but may also be highly uncertain given that we do not
have direct experience with such subsidiaries or their products and
thus the estimates also may be subject to significant changes from
period to period as we gain that experience. To the extent that our
estimates of future taxable income are insufficient to utilize all available NOL s, a valuation allowance will be recorded in the provision
for income taxes in the period the determination is made, and the
deferred tax assets will be reduced by this amount, which could be
material. In the event that actual circumstances differ from management’s estimates, or to the extent that these estimates are adjusted in
the future, any changes to the valuation allowance could materially
impact our financial position and results of operations.
43
C O N S O L I DAT E D S TAT E M E N T S O F I N C O M E
Years ended December 31
2006
2005
2004
465,778,000
398,395,000
380,629,000
139,122,000
122,755,000
125,658,000
2,046,000
439,000
1,454,000
324,610,000
275,201,000
253,517,000
US$
Net sales
Cost of sales
Cost of sales – acquisition and restructuring
Gross profit
Operating expenses
Research and development
41,560,000
35,780,000
34,351,000
115,942,000
94,312,000
87,506,000
48,574,000
40,123,000
41,715,000
Purchased in-process research and development
2,200,000
3,239,000
–
Acquisition, integration and related costs
6,061,000
3,213,000
572,000
Acquisition-related intangible amortization
8,220,000
3,697,000
1,416,000
Relocation, restructuring and related costs
1,452,000
–
3,817,000
Total operating expenses
224,009,000
180,364,000
169,377,000
Income from operations
100,601,000
94,837,000
84,140,000
Sales and marketing
General and administrative
Other income (expense)
Interest income
16,359,000
7,552,000
2,887,000
Interest expense
(11,918,000)
(5,940,000)
(5,101,000)
1,608,000
Research and development grants
795,000
1,380,000
Loss on foreign currency transactions, net
(660,000)
(157,000)
(67,000)
Gain (loss) from equity method investees
1,251,000
(1,149,000)
(2,243,000)
Other miscellaneous (expense) income, net
Total other income (expense)
Income before provision for income taxes
(360,000)
741,000
(8,537,000)
5,467,000
2,427,000
(11,453,000)
106,068,000
97,264,000
72,687,000
Provision for income taxes
35,529,000
35,039,000
23,982,000
Net income
70,539,000
62,225,000
48,705,000
Basic net income per common share
0.47
0.42
0.33
Diluted net income per common share
0.46
0.41
0.33
Shares used in computing basic net income per common share
149,504,000
147,837,000
146,658,000
Shares used in computing diluted net income per common share
153,517,000
150,172,000
148,519,000
The accompanying notes to these financial statements along with the unqualified Report of Independent Registered Public Accounting Firm, and the unqualified Report
of Independent Registered Public Accounting Firm on Internal Control Over Financial Reporting can be found in the Company’s Form 20-F enclosed with this Annual Report.
44
Let t er f rom the M ana ging B o ard
Q IAG EN – The E xe cutive Commit t e e
Q IAG EN’s Common Share
M arkets and Strate gy
Research and Development
Financial Statements
Rep or t of the Sup er visor y B o ard
Corporate Governance
C O N S O L I DAT E D B A L A N C E S H E E T S – A S S E T S
As of December 31
2006
2005
430,357,000
191,700,000
52,782,000
15,000,000
4,247,000
4,283,000
80,429,000
63,538,000
US$
Current assets
Cash and cash equivalents
Marketable securities
Notes receivable
Accounts receivable, net of allowance for
doubtful accounts of US$4,167,000 and US$2,388,000 in 2006 and 2005, respectively
Income taxes receivable
Inventories, net
2,901,000
4,161,000
64,085,000
53,653,000
Deferred income taxes
18,627,000
11,617,000
Prepaid expenses and other
29,763,000
26,305,000
683,191,000
370,257,000
Property, plant and equipment, net
221,277,000
195,199,000
Goodwill
160,141,000
93,914,000
118,492,000
74,566,000
Total current assets
Long-term assets
Intangible assets, net of accumulated
amortization of US$25,904,000 and US$13,813,000 in 2006 and 2005, respectively
Deferred income taxes
Other assets
Total long-term assets
Total assets
2,409,000
6,346,000
26,502,000
25,016,000
528,821,000
395,041,000
1,212,012,000
765,298,000
45
C O N S O L I DAT E D B A L A N C E S H E E T S – L I A B I L I T I E S A N D S H A R E H O L D E R S’ E Q U I T Y
As of December 31
2006
2005
6,599,000
5,921,000
US$
Current liabilities
Current portion of long-term debt
Current portion of capital lease obligations
Accounts payable
823,000
995,000
23,806,000
15,934,000
Accrued and other liabilities (of which US$8,1 million due to related parties in 2006 and 2005)
66,197,000
52,707,000
Income taxes payable
13,746,000
14,935,000
Deferred income taxes
Total current liabilities
5,360,000
1,179,000
116,531,000
91,671,000
489,592,000
191,447,000
Long-term liabilities
Long-term debt, net of current portion
(of which US$450.0 million in 2006 and US$150.0 million in 2005 due to related parties)
Capital lease obligations, net of current portion
12,009,000
11,101,000
Deferred income taxes
21,705,000
17,570,000
Other
Total long-term liabilities
6,010,000
3,052,000
529,316,000
223,170,000
1,535,000
1,513,000
Commitments and contingencies
Shareholders’ equity
Common shares, .01 EUR par value:
Authorized – 260,000,000 shares
Issued and outstanding – 150,167,540 shares in 2006 and 148,455,864 shares in 2005
Additional paid-in capital
178,656,000
157,796,000
Retained earnings
344,739,000
274,200,000
Accumulated other comprehensive income
Total shareholders’ equity
Total liabilities and shareholders’ equity
41,235,000
16,948,000
566,165,000
450,457,000
1,212,012,000
765,298,000
The accompanying notes to these financial statements along with the unqualified Report of Independent Registered Public Accounting Firm, and the unqualified Report
of Independent Registered Public Accounting Firm on Internal Control Over Financial Reporting can be found in the Company’s Form 20-F enclosed with this Annual Report.
46
Let t er f rom the M ana ging B o ard
Q IAG EN – The E xe cutive Commit t e e
Q IAG EN’s Common Share
M arkets and Strate gy
Research and Development
Financial Statements
Rep or t of the Sup er visor y B o ard
Corporate Governance
C O N S O L I DAT E D S TAT E M E N T S O F C A S H F L O W S
Years ended December 31
2006
2005
2004
70,539,000
62,225,000
48,705,000
30,038,000
24,955,000
22,961,000
4,745,000
2,114,000
—
2,200,000
3,239,000
—
(7,385,000)
3,169,000
775,000
US$
Cash Flows From Operating Activities
Net income
Adjustments to reconcile net income to net cash provided by
operating activities, net of effects of businesses acquired:
Depreciation and amortization
Noncash acquisition and restructure costs
Purchased in-process research and development
Tax effect from nonqualified stock options, net
Provision for losses on accounts receivable
Deferred income taxes
Loss on disposition of synthetic DNA business unit
(Gain) loss on disposition of property and equipment
(Gain) loss on sale of marketable securities
(Gain) loss on equity method investees
378,000
54,000
128,000
5,210,000
(2,202,000)
(10,474,000)
—
—
9,796,000
1,262,000
(97,000)
159,000
—
507,000
(481,000)
2,243,000
(1,251,000)
1,149,000
Share-based compensation
326,000
—
—
Other
500,000
(123,000)
—
Net changes in operating assets and liabilities:
(Increase) decrease in:
Notes receivable
Accounts receivable
346,000
(33,000)
1,109,000
(3,621,000)
(131,000)
(4,193,000)
Income taxes receivable
(5,385,000)
1,897,000
(368,000)
Inventories
(4,202,000)
3,764,000
2,019,000
Prepaid expenses and other
1,238,000
(9,778,000)
(5,282,000)
(1,662,000)
934,000
(5,213,000)
Accounts payable
2,720,000
(4,711,000)
599,000
Accrued and other liabilities
1,523,000
422,000
2,450,000
(13,009,000)
Other assets
Increase (decrease) in:
Income taxes payable
Other
Net cash provided by operating activities
525,000
5,592,000
3,435,000
(1,709,000)
1,874,000
101,479,000
91,237,000
53,798,000
47
C O N S O L I DAT E D S TAT E M E N T S O F C A S H F L O W S (C O N T I N U E D)
Years ended December 31
2006
2005
2004
(28,995,000)
(13,728,000)
(12,621,000)
1,256,000
1,738,000
1,584,000
(6,358,000)
(15,276,000)
(3,493,000)
—
(4,981,000)
—
652,000
757,000
—
US$
Cash Flows From Investing Activities
Purchases of property, plant and equipment
Proceeds from sale of equipment
Purchases of intangible assets
Purchases of investments
Collection of note receivable in connection with disposed synthetic DNA business unit
Net proceeds from disposition of synthetic DNA business unit
Purchases of marketable securities
Sales of marketable securities
Investment in unconsolidated subsidiary
Cash paid for acquisitions, net of cash acquired
Net cash used in investing activities
—
—
16,087,000
(56,606,000)
(40,445,000)
(37,963,000)
20,000,000
55,430,000
14,860,000
(42,000)
—
(125,000)
(95,379,000)
(81,996,000)
(29,478,000)
(165,472,000)
(98,501,000)
(51,149,000)
Cash Flows From Financing Activities
—
(67,000)
—
Proceeds from debt
Repayment of lines of credit
295,022,000
6,299,000
150,077,000
Repayments of debt
(9,825,000)
(10,638,000)
(58,471,000)
(745,000)
(1,053,000)
(1,115,000)
317,000
455,000
—
7,385,000
—
—
11,006,000
7,959,000
5,132,000
303,160,000
2,955,000
95,623,000
Principal payments on capital leases
Proceeds from subscription receivable
Excess tax benefits from stock-based compensation
Issuance of common shares
Net cash provided by financing activities
Effect of exchange rate changes on cash and cash equivalents
Net increase (decrease) in cash and cash equivalents
(510,000)
(366,000)
(890,000)
238,657,000
(4,675,000)
97,382,000
Cash and cash equivalents, beginning of year
191,700,000
196,375,000
98,993,000
Cash and cash equivalents, end of year
430,357,000
191,700,000
196,375,000
Supplemental Cash Flow Disclosures:
Cash paid for interest
24,289,000
5,238,000
3,664,000
Cash paid for taxes
36,384,000
21,582,000
27,755,000
—
—
6,189,000
175,000
—
—
1,848,000
—
—
Noncash Investing and Financing Activities
Note receivable in connection with disposition of assets
Equipment acquired through capital leases
Acquisition:
Issuance of common stock
The accompanying notes to these financial statements along with the unqualified Report of Independent Registered Public Accounting Firm, and the unqualified Report
of Independent Registered Public Accounting Firm on Internal Control Over Financial Reporting can be found in the Company’s Form 20-F enclosed with this Annual Report.
48
Let t er f rom the M ana ging B o ard
Q IAG EN – The E xe cutive Commit t e e
Q IAG EN’s Common Share
M arkets and Strate gy
Research and Development
Financial Statements
Rep or t of the Sup er visor y B o ard
Corporate Governance
C O N S O L I DAT E D S TAT E M E N T S O F S H A R E H O L D E R S’ E Q U I T Y A N D C O M P R E H E N S I V E I N C O M E
Common Shares
Shares
Amount
Additional
Retained
Accumulated
Total
Paid-in
Earnings
Other Com-
Shareholders’
prehensive
Equity
Capital
US$
Balance at December 31, 2003
Income (Loss)
146,217,518
1,485,000
140,039,000
163,270,000
29,992,000
334,786,000
Net income
—
—
—
48,705,000
—
48,705,000
Unrealized loss, net on hedging contracts
—
—
—
—
(500,000)
(500,000)
Unrealized gain, net on marketable securities
—
—
—
—
47,000
47,000
Realized gain, net on marketable securities
—
—
—
—
(481,000)
(481,000)
Translation adjustment
—
—
—
—
11,617,000
11,617,000
Comprehensive income
—
—
—
—
—
59,388,000
802,689
10,000
5,122,000
—
—
5,132,00
—
—
775,000
—
—
775,000
—
—
295,000
—
—
295,000
Exercise of stock options
Tax benefit in connection with nonqualified stock options,
net of reclass related to vested stock options
Option vesting accelerated in connection
with sale of synthetic DNA business unit
Balance at December 31, 2004
147,020,207
1,495,000
146,231,000
211,975,000
40,675,000
400,376,000
Net income
—
—
—
62,225,000
—
62,225,000
Unrealized loss, net on hedging contracts
—
—
—
—
(1,372,000)
(1,372,000)
Unrealized gain, net on marketable securities
—
—
—
—
2,800,000
2,800,000
Realized loss, net on marketable securities
—
—
—
—
507,000
507,000
Translation adjustment
—
—
—
—
(25,662,000)
(25,662,000)
38,498,000
Comprehensive income
Exercise of stock options
Tax benefit in connection with nonqualified stock options
Proceeds from subscription receivable
Balance at December 31, 2005
—
—
—
—
—
1,435,657
18,000
7,941,000
—
—
7,959,000
—
—
3,169,000
—
—
3,169,000
—
—
455,000
—
—
455,000
148,455,864
1,513,000
157,796,000
274,200,000
16,948,000
450,457,000
70,539,000
Net income
—
—
—
70,539,000
—
Unrealized loss, net on hedging contracts
—
—
—
—
(539,000)
(539,000)
Realized loss, net on hedging contracts
—
—
—
—
2,122,000
2,122,000
Unrealized loss, net on marketable securities
—
—
—
—
(1,565,000)
(1,565,000)
Transition adjustment
—
—
—
—
24,473,000
24,473,000
Comprehensive income
—
—
—
—
—
95,030,000
—
—
—
—
(204,000)
(204,000)
Transition adjustment to pension liability upon
adoption of new accounting standard, net of deferred tax
Stock issued for acquisition
Exercise of stock options
125,000
2,000
1,846,000
—
—
1,848,000
1,586,676
20,000
10,986,000
—
—
11,006,000
Tax benefit on stock options
—
—
7,385,000
—
—
7,385,000
Share-based compensation
—
—
326,000
—
—
326,000
Proceeds from subscription receivable
—
—
317,000
—
—
317,000
150,167,540
1,535,000
178,656,000
344,739,000
41,235,000
566,165,000
BALANCE AT DECEMBER 31, 2006
The accompanying notes to these financial statements along with the unqualified Report of Independent Registered Public Accounting Firm, and the unqualified Report
of Independent Registered Public Accounting Firm on Internal Control Over Financial Reporting can be found in the Company’s Form 20-F enclosed with this Annual Report.
49
Directors and Senior Management
Supervisory Directors and Managing Directors are appointed annually for the period beginning on the day following the Annual General
Meeting up to and including the date of the Annual General Meeting held in the following fiscal year.
Our Supervisory Directors and Managing Directors, and their ages as of February 1, 2007, are as follows:
M A N AG I N G D I R E C T O R S
NAME
AG E
POSITION
Peer M. Schatz
41
Roland Sackers
38
Managing Director, Chief Executive Officer
Managing Director, Chief Financial Officer
Dr. Joachim Schorr
46
Managing Director, Senior Vice President Research and Development
Bernd Uder
49
Managing Director, Senior Vice President Sales and Marketing
S U P E RV I S O RY B OA R D M E M B E R S
NAME
AG E
POSITION
Prof. Dr. Detlev H. Riesner
65
Chairman of the Supervisory Board, Supervisory Director and
Chairman of the Selection and Appointment Committee
Dr. Heinrich Hornef
75
Deputy Chairman of the Supervisory Board, Supervisory Director,
Chairman of the Audit Committee and Member of the Selection
and Appointment Committee
Dr. Metin Colpan
52
Supervisory Director
Jochen Walter
59
Supervisory Director and Member of the Audit Committee
until the last Annual General Meeting in June 2006
Dr. Franz A. Wirtz
74
Supervisory Director, Chairman of the Compensation Committee
and Member of the Audit Committee
Erik Hornnaess
69
Supervisory Director, Member of the Audit Committee
and Member of the Compensation Committee
Prof. Dr. Manfred Karobath
66
Supervisory Director and Member of the Compensation Committee
Prof. Dr. jur Carsten P. Claussen was appointed as nonvoting Special Advisor to the Supervisory Board and Honorary Chairman in 1999.
The following is a brief summary of the background of each of the Supervisory Directors, Managing Directors and the Honorary Chairman.
50
Let t er f rom the M ana ging B o ard
Q IAG EN – The E xe cutive Commit t e e
Q IAG EN’s Common Share
M arkets and Strate gy
Research and Development
Financial Statements
Rep or t of the Sup er visor y B o ard
Corporate Governance
PEER M. SCHATZ
DR. JOACHIM SCHORR
joined QIAGEN in 1993 and has been Chief Executive Officer since
joined QIAGEN in 1992 and has been Senior Vice President Research &
January 1, 2004. Between 1993 and 2003 he was Chief Financial
Development since January 1, 2004. He became a Managing Director
Officer and became a Managing Director in 1998. Mr. Schatz was
in 2004. Initially, Dr. Schorr served QIAGEN as Project Manager and
previously a partner in a private management buyout group in Swit-
later had responsibilities as Business Unit Manager. In 1999, Dr. Schorr
zerland and worked in finance and systems positions in Sandoz, Ltd.
became Vice President Research & Development with the responsibility
and Computerland AG, as well as in finance, operations, manage-
for the world-wide QIAGEN R & D activities. Before joining QIAGEN,
ment and sales positions in various start-up companies in the com-
Dr. Schorr worked for the pharmaceutical company Hoechst AG on
puter and software trading industry in Europe and the United States.
the development of oral malaria vaccines and was awarded with
Mr. Schatz graduated from the University of St. Gallen, Switzerland,
the IHK research award in 1991. Dr. Schorr holds a Ph.D. in Mole-
with a Master‘s degree in Finance in 1989 and obtained an M.B.A. in
cular Biology and Virology from the University of Cologne, Germany.
Finance from the University of Chicago Graduate School of Business
Dr. Schorr is a co-founder of Coley Pharmaceuticals, EnPharma Phar-
in 1991. Mr. Schatz also serves in the capacities of Vice Chairman
maceuticals and QBM Cell Sciences and is currently a member of
and Audit Committee Chairman of Evotec AG and as director to
the supervisory board of Q BM Cell Sciences.
Mulligan BioCapital AG, acted as a member of the Advisory Board
(Börsenrat) of the Frankfurt Stock Exchange through 2004, and
also serves as a member of the German Corporate Governance
BERND UDER
Commission.
joined QIAGEN in 2001 as Vice President Sales & Marketing and
became a Managing Director and Senior Vice President Sales &
Marketing in 2004. With completion of the restructuring of QIAGEN’s
ROL AND SACKERS
sales and marketing organization, Bernd Uder became Senior Vice
joined Q IAGEN in 1999 as Vice President Finance and has been
President Global Sales in 2005. Before joining QIAGEN, Mr. Uder
Chief Financial Officer and Deputy Managing Director since 2004.
gained wide experience in building up and coordinating world-
In 2006, Mr. Sackers became a Managing Director. Between 1995
wide distribution networks as Vice President European Biolab Sales &
and 1999, he acted as an auditor with Arthur Andersen Wirtschaft-
Marketing with Pharmacia and Vice President global e.business
sprüfungsgesellschaft Steuerberatungsgesellschaft. Mr. Sackers gra-
with Amersham Pharmacia Biotech. Today, Mr. Uder is responsible
duated from the Westfälische Wilhelms-Universität Münster, Germany,
for the extension and the improvement of efficiencies of QIAGEN ’s
with a M.B.A . Until 2006, he was a member of the supervisory board
global distribution network.
and audit committee of IBS AG. Since July 2004, Mr. Sackers has been
a member of the board of directors of Operon Biotechnologies, Inc.
51
PROFESSOR DR. DETLEV H. RIESNER
DR. METIN COLPAN
is a co-founder of QIAGEN. He has been on our Supervisory Board
is a co-founder of QIAGEN and was Chief Executive Officer and a
since 1984 and was appointed Chairman of the Supervisory Board
Managing Director from 1985 through 2003. Dr. Colpan obtained
in 1999. Professor Riesner has held the Chair of Biophysics at the
his Ph.D. and M.Sc. in Organic Chemistry and Chemical Engineering
Heinrich-Heine-University in Düsseldorf, Germany, since 1980. In
from the Darmstadt Institute of Technology in 1983. Prior to founding
1996, he was also appointed to the position of Vice President of
QIAGEN , Dr. Colpan was an Assistant Investigator at the Institute for
Research, and in 1999, he was nominated Director of Technology
Biophysics at the University of Düsseldorf. Dr. Colpan has had wide ex-
at the University of Düsseldorf. Prior to that, he was Professor of
perience in separation techniques, and in the separation and purifica-
Biophysical Chemistry at the Darmstadt Institute of Technology and,
tion of nucleic acids in particular, and has filed many patents in the field.
from 1975 to 1977, Lecturer of Biophysical Chemistry at Hannover
Dr. Colpan currently serves as a supervisory board member of GenPat77
Medical School. He has held guest professorships at the Institute of
Pharmacogenetics AG, GPC Biotech AG and Morphosys AG, each
Microbiology, Academia Sinica, Beijing, China, and the Department
in Munich, Germany. Until 2006, he was a member of the supervisory
of Neurology at the University of California, San Francisco, USA.
board of Ingenium Pharmaceuticals AG in Munich, Germany.
He received his M.S. in Physics from Hannover Institute of Technology
and his Ph.D. from the University of Braunschweig, with post-graduate
work at Princeton University. Professor Riesner is either a member of the
DR. FR ANZ A. WIRTZ
supervisory board or a director of New Lab Bioquality AG, Erkrath,
has been a member of our Supervisory Board since 1989. Dr. Wirtz
Germany, AC Immune S.A., Lausanne, Switzerland, and Neuraxo
was managing director of Grünenthal GmbH, Aachen, Germany,
GmbH, Düsseldorf, Germany. Professor Riesner is also a member of
a large, private pharmaceutical company from 1962-1997 and a
the scientific advisory boards of the RiNA network, Berlin, Germany,
member of its advisory board from 1998-2001. He is Vice Chairman
the Friedrich-Loeffler-Institut, Isle of Riems, Germany, and PrioNet,
of Paion AG, Aachen, and Vice Chairman of Dasgip AG, Jülich, two
Canada.
young German biotech companies. For ten years Dr. Wirtz was treasurer of the German pharmaceutical industry association. Dr. Wirtz
holds a doctorate degree in chemistry from the Rheinisch-Westfälische
DR. HEINRICH HORNEF
Technische Hochschule in Aachen where he became an honorary
has been on our Supervisory Board since 2000 and was appointed
citizen in 2001.
Deputy Chairman of the Supervisory Board and Audit Committee
Chairman in 2001. He also serves as a chairman on the supervisory
board of Heidelberg Innovation GmbH, a biotechnology and lifescience venture capital company in Heidelberg, Germany. He was
chairman of the supervisory board of the pharmaceutical company
Merck KGaA in Darmstadt, Germany, until December 2003 and a
member of the supervisory board until March 2004, as well as a
member of the partners’ counsel of E. Merck in Darmstadt, Germany,
until June 2004. Prior to his retirement in December 1996, Dr. Hornef
served as CFO of Boehringer Mannheim GmbH (1973 -1991), as CFO
of the Berlin-based Treuhandanstalt, the privatization agency in EastGermany (1992-1994), and as president of its successor organization,
BvS (1995 -1996).
52
Let t er f rom the M ana ging B o ard
Q IAG EN – The E xe cutive Commit t e e
Q IAG EN’s Common Share
M arkets and Strate gy
Research and Development
Financial Statements
Rep or t of the Sup er visor y B o ard
Corporate Governance
ERIK HORNNAESS
PROFESSOR DR. JUR. CARSTEN P. CL AUSSEN
has been a member of our Supervisory Board since 1998 and joined
was Chairman of our Supervisory Board from 1988 to June 1999 and
the Audit Committee in 2002 and the Compensation Committee in
was appointed as a Special Advisor and Honorary Chairman in 1999.
2005. Mr. Hornnaess worked for Astra Pharmaceuticals, Sweden,
This position is not required by Dutch law, and Professor Claussen is
from 1965 until 1979 in various management positions in Sweden,
no longer a voting member of the Supervisory Board. For many years
Australia, and Canada and, for the last three years of this period, as
he has pursued a career in private banking. Between 1976 and 1987,
the General Manager for the Benelux region (Belgium, The Nether-
Professor Claussen was a member of the executive board of Nord-
lands and Luxembourg). In 1979, he joined Abbott Laboratories Euro-
deutsche Landesbank, Hanover, and Chairman of the Hannover Stock
pean Headquarters in Paris, France, and from 1982, he was the Area
Exchange. Since 1987, he has been a lawyer in Düsseldorf and senior
Vice President of Abbott Diagnostic Division in Europe, Middle-East
advisor to IKB Deutsche Industriekreditbank, Düsseldorf. At present, he
and Africa, with headquarters in Wiesbaden, Germany. Mr. Hornnaess
is a partner in the law firm of Hoffmann Liebs and Partner and special-
retired from Abbott Laboratories on March 1, 1997, and currently serves
izes in corporate law and capital market transactions. He is chairman
as non-executive director of A XIS-SHIELDS Group, Scotland. Addi-
of the board of TO N ART AG , Düsseldorf; Flossbach & v. Storch
tionally, Mr. Hornnaess served as the Vice President of European
Vermögensmanagement AG, Cologne; and WAS Worldwide Analy-
Diagnostic Manufacturers Association (EDM A ), Brussels, in the period
tical Systems AG, Kleve, Germany, and is a member of other boards.
1995 through 1997. Mr. Hornnaess graduated from Aarhus Handels-
Professor Claussen received his Ph.D. in law from the University of
hojskole, Denmark, with an M.B.A . and obtained a P.M.D . from the
Cologne, Germany.
Harvard Business School.
PROFESSOR DR. M ANFRED K AROBATH
has been a member of our Supervisory Board since 2000. Dr. Karobath
studied medicine, and from 1967 to 1980 he worked first in the Dept.
of Biochemistry of the University of Vienna and, after a stage as postdoctoral fellow, he joined the Dept. of Psychiatry where he became
professor of biological Psychiatry. In 1980, he joined Sandoz Pharma
in Basel, first, in drug discovery, and later, he became Senior Vice
President and head of R & D. In 1992, Prof. Dr. Karobath joined Rhone
Poulenc Rorer (“RPR ”) as President of R & D and Executive Vice President,
and later, he became a member of the boards of directors of RPR ,
Pasteur Mérieux Connought, Centeon and Rhone Poulenc Pharma.
He has received several scientific awards and has published 92 scientific papers. Dr. Karobath also serves as a member of the board of
directors of Coley Pharmaceutical Group.
53
C O M P E N S AT I O N O F D I R E C T O R S A N D O F F I C E R S
The compensation granted to the members of the Managing Board
The tables below state the amounts earned on an accrual basis
in 2006 consisted of a fixed salary and other variable components.
by Directors and Officers in 2006. The variable component is based
Variable compensation includes one-time and annual payments linked
on performance relative to personal goals and corporate goals
to business performance (bonuses) as well as long-term incentives
agreed to by the Supervisory Board.
containing risk elements, including, but not limited to, stock options or
other equity-based compensation and pension plans. The variable
part of the compensation is designed to strengthen the Board members’
commitment to QIAGEN and its objectives.
C O M P E N S AT I O N O F D I R E C T O R S A N D O F F I C E R S
Year ended December 31, 2006
Annual Compensation
Fixed Salary
Variable Cash Bonus
Other ¹
Total
Peer M. Schatz
942,000
373,000
1,000
1,316,000
Roland Sackers
377,000
128,000
157,000
662,000
US$
Dr. Joachim Schorr
259,000
104,000
38,000
401,000
Bernd Uder
276,000
104,000
10,000
390,000
¹ Amounts include, among others, inventor bonus and expatriate fringe pay. Does not include the reimbursement of certain expenses relating to travel incurred at the request
of QIAGEN or other reimbursements or payments that in total did not exceed the lesser of US$50,000 or 10 % or the total salary and bonus reported for the officer.
The Supervisory Board compensation for 2006 consists of fixed com-
of adjusted Earnings per Share provided that such remuneration
pensation for Board members, an additional amount for Chairman
will not exceed EUR 5,000 per year. We did not pay any agency
and Deputy Chairman, and committee membership fees. Supervisory
or advisory service fees to members of the Supervisory Board
Directors receive variable compensation, which is determined annually
other than US$524,000 to Dr. Colpan for his scientific consulting
by the Compensation Committee pursuant to a formula based on growth
services.
S U P E RV I S O RY B OA R D
Chairman/
Deputy-Chairman
Meeting
Committee
Variable Cash
Fixed Salary
Committee
Attendance
Membership
Bonus
Total
Prof. Dr. Detlev H. Riesner
15,000
15,000
6,000
2,500
7,000
45,500
Dr. Heinrich Hornef
15,000
10,000
11,000
5,000
7,000
48,000
US$
Dr. Metin Colpan
15,000
—
5,000
—
7,000
27,000
Jochen Walter ¹
15,000
—
5,000
2,500
7,000
29,500
Dr. Franz A. Wirtz
15,000
5,000
8,000
3,750
7,000
38,750
Erik Hornnaess
15,000
—
10,000
5,000
7,000
37,000
Prof. Dr. Manfred Karobath
15,000
—
4,500
2,500
7,000
29,000
¹ Mr. Jochen Walter was a member of our Supervisory Board from 1988 until 2006 during which time he served on the Audit Committee from 1996 until 2006.
54
Let t er f rom the M ana ging B o ard
Q IAG EN – The E xe cutive Commit t e e
Q IAG EN’s Common Share
M arkets and Strate gy
Research and Development
Financial Statements
Rep or t of the Sup er visor y B o ard
Corporate Governance
Board members also receive a variable component, in the form of
than the market price at the time of grant. During 2006, no options or
share-based compensation. Stock options granted to the Managing
other share-based compensation were granted to the members of the
and Supervisory Boards must have an exercise price that is higher
Managing and Supervisory Board.
Year ended December 31, 2006
Long-Term Compensation
Defined Contribution Benefit Plan
US$
Stock Options
Peer M. Schatz
73,000
—
Roland Sackers
63,000
—
Dr. Joachim Schorr
23,000
—
Bernd Uder
23,000
—
The following table sets forth the vested and unvested options of our officers and directors as of February 1, 2007:
Total
Total
Vested Options
Unvested Options
Expiration Dates
Exercise Prices
Peer M. Schatz
2,399,876
—
1/2008 to 12/2015
4.590 to 20.563
Roland Sackers
375,925
—
9/2009 to 12/2015
8.940 to 20.563
Dr. Joachim Schorr
241,444
—
10/2011 to 12/2015
8.940 to 17.900
Bernd Uder
192,607
—
3/2011 to 12/2015
8.940 to 20.563
90,667
—
1/2010 to 12/2015
6.018 to 20.563
11.985 to 20.563
US$
Prof. Dr. Detlev H. Riesner
Dr. Heinrich Hornef
76,000
—
1/2010 to 12/2015
Dr. Metin Colpan
1,128,150
—
2/2007 to 12/2015
3.219 to 20.563
Dr. Franz A. Wirtz
128,000
—
1/2008 to 12/2015
5.625 to 20.563
Erik Hornnaess
122,300
—
1/2008 to 12/2015
5.625 to 20.563
90,000
—
1/2010 to 12/2015
6.018 to 20.563
Prof. Dr. Manfred Karobath
During 2005 and 2004, certain stock options were accelerated as discussed under “Stock Plan” included in our Form 20-F
enclosed with this Annual Report.
The Supervisory Board has established an Audit Committee, a Compensation Committee and a Selection and Appointment Committee,
which are comprised of the following members:
Name of
Supervisory Director
Prof. Dr. Detlev H. Riesner
Dr. Heinrich Hornef
Prof. Dr. Manfred Karobath
Dr. Franz A. Wirtz
Erik Hornnaess
• Member
Chairman
Independent
•
•
•
•
•
Member of
Member of
Member of Selection and
Audit Committee
Compensation Committee
Appointment Committee
•
•
•
•
•
55
AU D I T C O M M I T T E E
C O M P E N S AT I O N C O M M I T T E E
The Audit Committee operates pursuant to a charter approved by the
The Compensation Committee operates pursuant to a charter approved
Supervisory Board and available online at www.qiagen.com. The
by the Supervisory Board and available online at www.qiagen.com.
Audit Committee consists of three members, Dr. Hornef (Chairman),
The Compensation Committee consists of three members, Dr. Wirtz
Mr. Hornnaess and Dr. Wirtz, and meets at least quarterly. The Audit
(Chairman), Professor Karobath and Mr. Hornnaess. Members are
Committee members are appointed by the Supervisory Board and
appointed by the Supervisory Board and serve for a term of one year.
serve for a term of one year. We believe that all members of our Audit
We believe that all of the members of the Compensation Committee
Committee meet the independence requirements as set forth in the Sar-
meet the independence requirements set forth in the Marketplace
banes Oxley Act of 2002 and the Marketplace Rules of the NASDAQ.
Rules of the NASDAQ . The Compensation Committee reviews and
The Audit Committee is responsible together with the Managing Board
approves all equity-based compensation, reviews and approves the
for proposal of the independent registered public accounting firm to
annual salaries, bonuses and other benefits of executive officers,
the Supervisory Board, which proposes the appointment of the in-
and reviews general policies relating to employee compensation and
dependent registered public accounting firm to the Annual General
benefits.
Meeting. The independent registered public accounting firm audits
the consolidated financial statements and local books and records of
S E L E C T I O N A N D A P P O I N TM E N T C O M M I T T E E
QIAGEN and its subsidiaries, and the Audit Committee is further re-
The Selection and Appointment Committee operates pursuant to a
sponsible for preapproving the fees for such services. Additionally,
charter approved by the Supervisory Board and available online at
the Audit Committee reviews the performance of the independent
www.qiagen.com. The current members of the Selection and Appoint-
registered public accounting firm with management, discussing on a
ment Committee are Prof. Dr. Detlev H. Riesner (Chairman) and Dr.
quarterly basis the scope and results of the reviews and audits with
Heinrich Hornef. The Selection and Appointment Committee prepares
the independent registered public accounting firm; discusses our finan-
the selection criteria and appointment procedures for members of our
cial accounting and reporting principles and policies and the adequa-
Supervisory Board and the Managing Board; periodically evaluates
cy of our internal accounting, financial and operating controls and
the scope and composition of the Managing Board and Supervisory
procedures with the independent registered public accounting firm
Board and proposes the profile of the Supervisory Board in relation
and management; considers and approves any recommendations re-
thereto. Additionally, the Committee periodically evaluates the func-
garding changes to our accounting policies and processes; reviews
tioning of individual members of the Managing Board and Supervi-
with management and the independent registered public accounting
sory Board and reports the results thereof to the Supervisory Board
firm our quarterly earnings reports prior to their release to the press;
and proposes the (re-)appointments of members of our Managing
and reviews the quarterly and annual reports (reported on Forms 6-K
Board and Supervisory Board. The Committee prepares and submits
and 20-F) to be furnished to or filed with the Securities and Exchange
to the Supervisory Board on an annual basis a report of its delibera-
Commission and the Deutsche Boerse.
tions and findings.
56
Let t er f rom the M ana ging B o ard
Q IAG EN – The E xe cutive Commit t e e
Q IAGEN’s Common Share
M arkets and Strate gy
Research and Development
Financial Statements
Rep or t of the Sup er visor y B o ard
Corporate Governance
To our Shareholders
The Supervisory Board thanks QIAGEN ‘s Managing Board and employees for their contributions to
QIAGEN ‘s success in 2006.
The Supervisory Board exercised supervision over the Managing Board’s policies and business conduct
throughout the financial year. Acting in the best interests of the Company and its business and consistent
with past practice, the Supervisory Board monitored the Company’s activities, including its strategic, economic, and market developments, R & D investments, acquisitions and alliances, and the human resources
management. In particular and as requested by the Dutch Corporate Governance Code, the Supervisory
Board discussed the corporate strategy, the risks of the business and the result of the assessment by the
Managing Board of the structure and operation of the internal risk management and control systems as
well as any significant changes thereto. Further, the Supervisory Board discussed its own functioning and
that of its individual members as well as the functioning of the Managing Board and the performance of
its individual members in the absence of the members of the Managing Board. Through its Compensation
Committee, the Supervisory Board executed and monitored compliance with the Company’s Remuneration
Policy approved by the Annual General Meeting held on June 14, 2005. The Remuneration Policy and the
various aspects of the compensation of the Managing Board are summarized in the Remuneration Report
and published on the Company’s website. Information on the Company’s activities was communicated by
the Managing Board to the Supervisory Board through regular meetings and business reports. Further
detailed information on the composition of the Supervisory Board, the independence of its members and
their remuneration as well as other information on the Supervisory Board can be found in QIAGEN ’s
Form 20-F, which is integral to this Annual Report.
QIAGEN N.V. is a company under the laws of the Netherlands and has an international network of subsid-
iaries. The Supervisory Board follows the principle of increasing shareholder value to further represent the
interests of all shareholders and has always placed the highest standards on its Corporate Governance
principles. Since 1997, QIAGEN has endorsed the 40 recommendations made in the report of the Netherlands‘ Committee on Corporate Governance, which was replaced by the Dutch Corporate Governance
Code effective January 1, 2004. It is the Company’s policy to follow the guidelines of Good Practice of
57
Corporate Governance as described in the Code although some minor deviations may result from effects
such as legal requirements imposed on QIAGEN or industry standards. QIAGEN is also subject to the rules
regarding Corporate Governance set by NASDAQ, where the Company’s common shares have been listed
since 1996. In addition, QIAGEN has adopted the standards set by the Corporate Governance Code of
Germany, where the Company’s common shares have been listed since 1997. QIAGEN provides detailed
updates regarding compliance with the German and the Dutch Corporate Governance Code in the chapter
on “Corporate Governance” in this Annual Report.
QIAGEN N.V. is a limited liability company incorporated under the laws of the Netherlands. All Company
operations are carried out in accordance with Dutch Corporate Law, US Federal Securities Law and
Regulations, and the laws of the German capital market, in particular the Wertpapierhandelsgesetz. The
common shares of the Company are registered and traded in the United States of America on the NASDAQ
Global Select Market emanated from the NASDAQ National Market in July 2006 and in Germany on the
Frankfurt Stock Exchange. Since January 1, 2003, QIAGEN ’s common shares are accepted for trading in
the Prime Standard segment, a premium segment created by Deutsche Börse AG in late 2002. Shareholders
in the United States and in Europe hold the majority of the Company’s shares. The Company has used
its funds to fuel internal growth and to finance acquisitions. The Supervisory Board proposes to retain
2006 earnings to address these goals. We strongly believe that this policy of increasing shareholder value
benefits our shareholders.
In this Annual Report, the financial statements for the year 2006 are presented as prepared by the
Managing Board, audited by Ernst & Young LLP (Independent Registered Public Accounting Firm), and
examined and approved by the Supervisory Board. We recommend that the Annual General Meeting
adopts these financial statements, including allocation of profits to retained earnings.
Venlo, The Netherlands, April 2007
Prof. Dr. Detlev H. Riesner
Chairman of the Supervisory Board
58
Let t er f rom the M ana ging B o ard
Q IAG EN – The E xe cutive Commit t e e
Q IAGEN’s Common Share
M arkets and Strate gy
Research and Development
Financial Statements
Rep or t of the Sup er visor y B o ard
Corporate Governance
The Dutch Corporate Governance Code
In the Netherlands, the Dutch Corporate Governance Code (the “Code”)
became effective on January 1, 2004. The Code is applicable to QIAGEN
N.V. (in the following also referred to as the “Company”), as it is a publicly
listed company under the laws of the Netherlands with a registered seat in
Venlo, The Netherlands. The Code contains a set of principles and a number
of best practice provisions, creating a set of standards governing the conduct
of the members of the Managing Board and the Supervisory Board and
shareholders.
QIAGEN recognizes the importance of clear and straightforward rules
on corporate governance and, where appropriate, has adapted its internal
organization to these new rules.
59
C O R P O R AT E S T R U C T U R E
Annual General Meeting may at all times overrule the binding nature
QIAGEN is a ‘Naamloze Vennootschap’ (“N.V.”), a Dutch limited li-
of such a nomination by a resolution adopted by at least a two-thirds
ability company similar to a ‘Corporation’ (Inc.) in the United States.
majority of the votes cast, if such majority represents more than half
QIAGEN has a two-tier board structure. QIAGEN is managed by a
the issued share capital. Managing Directors are appointed annually
Managing Board under the supervision of a Supervisory Board. It is in
for the period beginning on the date following the Annual General
the interest of QIAGEN and all its stakeholders that each Board per-
Meeting up to and including the date of the Annual General Meeting
forms its functions appropriately and that there is a clear division of
held in the following fiscal year.
responsibilities between the Managing Board, the Supervisory Board,
the Annual General Meeting and the external auditor in a well-func-
Members of the Managing Board may be suspended and dismissed
tioning system of checks and balances.
by the Annual General Meeting by a resolution adopted by a twothirds majority of the votes cast, if such majority represents more than
M A N AG I N G B OA R D
half the issued share capital, unless the proposal was made by the
The Managing Board manages QIAGEN and is responsible for
Joint Meeting in which case a simple majority of votes cast is sufficient.
achieving QIAGEN ’s aims, strategy, policies and results. The Manag-
Furthermore, members of the Managing Board may be suspended
ing Board is also responsible for complying with all relevant legisla-
(but not dismissed) by the Supervisory Board.
tion and regulations as well as for managing the risks associated with
the business activities and the financing of QIAGEN . It reports related
The remuneration of the members of the Managing Board will, with
developments to and discusses the internal risk management and con-
due observance of the Remuneration Policy, be determined by the
trol systems with the Supervisory Board and its Audit Committee. The
Supervisory Board, on a proposal by its Compensation Committee.
Managing Board is accountable for the performance of its duties to
The current Remuneration Policy was adopted by the Annual General
the Supervisory Board and the Annual General Meeting. The Manag-
Meeting on June 14, 2005. Details on this Policy, which has been
ing Board provides the Supervisory Board with timely information nec-
drafted taking into account the principles and best practice provi-
essary for the exercise of the duties of the Supervisory Board. In dis-
sions of the Code, are published on the Company’s website at
charging its duties, the Managing Board takes into account the
www.qiagen.com.
interests of QIAGEN , its enterprises and all parties involved in
QIAGEN , including shareholders and other stakeholders.
S U P E RV I S O RY B OA R D
The Supervisory Board supervises the policies of the Managing Board,
QIAGEN has also established an Executive Committee, of which
the general course of QIAGEN ’s affairs and the business enterprises
four members currently serve as Managing Directors of QIAGEN .
which it operates. The Supervisory Board assists the Managing Board
Resolutions to enter into transactions under which members of the
In discharging its duties, the Supervisory Board takes into account
by providing advice relating to the business activities of Q IAGEN .
Managing Board could have a conflict of interest with QIAGEN that
the interests of Q IAGEN , its enterprise and all parties involved in
are of material significance to QIAGEN and / or the relevant member
QIAGEN , including shareholders and other stakeholders. The Super-
of the Managing Board require the approval of the Supervisory Board.
visory Board is responsible for the quality of its own performance. In
QIAGEN has not entered into any such transactions in 2006.
this respect, the Supervisory Board conducts a self-evaluation on an
annual basis.
The Managing Board consists of one or more members as determined
by the Supervisory Board. The members of the Managing Board are
Resolutions to enter into transactions under which members of the
appointed by the Annual General Meeting upon the joint meeting of
Supervisory Board could have a conflict of interest with QIAGEN that
the Supervisory Board and the Managing Board (the “Joint Meeting”)
are of material significance to QIAGEN and /or the relevant member
having made a binding nomination for each vacancy. However, the
of the Supervisory Board require the approval of the Supervisory Board
60
Let t er f rom the M ana ging B o ard
Q IAG EN – The E xe cutive Commit t e e
Q IAGEN’s Common Share
M arkets and Strate gy
Research and Development
Financial Statements
Rep or t of the Sup er visor y B o ard
Corporate Governance
plenum. In 2006, neither QIAGEN nor its Supervisory Board members
have entered into any such transactions.
Among other things, the Audit Committee‘s primary duties and responsibilities are to serve as an independent and objective party to monitor
QIAGEN ‘s accounting and financial reporting process and internal
The Supervisory Board consists of at least three members or such high-
control system, be directly responsible for the proposal of the external
er number as to be determined by the Joint Meeting. The members of
auditor to the Supervisory Board which proposes the appointment
the Supervisory Board are appointed by the Annual General Meeting
of the external auditor to the Annual General Meeting. Further, the
upon the Joint Meeting having made a binding nomination for each
Audit Committee is responsible for the compensation and oversight of
vacancy. However, the Annual General Meeting may at all times over-
QIAGEN ’s external auditor and to provide an open avenue of commu-
rule the binding nature of such a nomination by a resolution adopted
nication among the external auditor as well as the Management Board
by at least a two-thirds majority of the votes cast, if such majority rep-
and the Supervisory Board. Q IAGEN ’s internal audit department
resents more than half the issued share capital.
operates under the direct responsibility of the Audit Committee. The
Audit Committee consists of three members: Dr. Hornef (Chairman),
The Supervisory Board shall be composed in a way that enables it to
Dr. Wirtz, and Mr. Hornnaess. The Audit Committee members are
carry out its duties properly and that its members are enabled to act
appointed by the Supervisory Board and serve for a term of one year.
critically and independently of one another and of the Managing
The Supervisory Board has designated Dr. Hornef as “financial
Board and any particular interests. To that effect, the Supervisory
expert” as that term is defined in the provision III.3.2 and III 5.7 of the
Board has adopted a profile of its size and composition which takes
Code. The Audit Committee met seven times in fiscal year 2006, whereof
into account the nature of our business, our activities and the desired
one meeting took place together with the external auditor and without
expertise and background of the members of the Supervisory Board.
the members of the Managing Board. Further, the Audit Committee had
The current profile of the Supervisory Board can be found on our web-
several telephone conferences with and without the external auditor.
site. The Supervisory Board has appointed a chairman from among
Among other things, the Audit Committee discussed the selection of
its members who has the duties assigned to him by the Articles of
the external auditor to audit the consolidated financial statements and
Association and the Code.
accounting and records of Q IAGEN and its subsidiaries, along with
Members of the Supervisory Board are appointed annually for the pe-
Q IAGEN ’s compliance with policies such as the Code of Conduct;
riod beginning on the date following the Annual General Meeting up
discussed the performance of the external auditor with management;
to and including the date of the Annual General Meeting held in the
discussed on a quarterly basis the scope and results of the reviews and
following fiscal year. Members of the Supervisory Board may be sus-
audits with the external auditor; and discussed QIAGEN ’s financial
pended and dismissed by the Annual General Meeting by a resolution
accounting and reporting principles and policies and the adequacy
adopted by a two-thirds majority of the votes cast, if such majority
of QIAGEN ’s internal accounting, financial and operating controls
represents more than half the issued share capital, unless the proposal
and procedures with the external auditor and management. The Audit
was made by the Joint Meeting in which case a simple majority of
Committee considered and approved any recommendations regarding
votes cast is sufficient.
changes to QIAGEN ’s accounting policies and processes, reviewed
the preapproval of the fees for such services. Further, it reviewed
with management and the external auditor QIAGEN ’s quarterly reports
The Supervisory Board has appointed an Audit Committee, a Compen-
prior to their release to the press; and reviewed the quarterly and
sation Committee and a Selection and Appointment Committee from
annual reports (reported on Forms 6-K and 20-F) to be filed with or
among its members and can appoint other committees as deemed
furnished to the Securities and Exchange Commission in the United
beneficial. The Supervisory Board has approved charters pursuant
States and the Deutsche Börse in Germany. The Audit Committee per-
to which each of the committees operate. The charters are published
forms a self-evaluation of its activities on an annual basis.
on QIAGEN ’s website.
61
The Compensation Committee’s primary duties and responsibilities
SHAREHOLDERS
include, among other things, the preparation of a proposal for the
Our shareholders exercise their voting rights through the Annual
Supervisory Board concerning the Remuneration Policy for the Man-
General Meeting. Resolutions are adopted by the Annual General
aging Board to be adopted by the Annual General Meeting, the pre-
Meeting by an absolute majority of votes cast, unless a different ma-
paration of a proposal concerning the individual compensation of
jority of votes or quorum is required by Dutch law or our Articles of
members of the Managing Board to be adopted by the Supervisory
Association. At the Annual General Meeting, each share confers the
Board and the preparation of the Remuneration Report on the compen-
right to cast one vote, unless the law or the Articles of Association
sation policies for the Managing Board to be adopted by the Super-
provide otherwise.
visory Board. The Remuneration Report comprises a report on the way
in which the Remuneration Policy was implemented in the most recent
Furthermore, the Managing Board, or where appropriate, the Super-
financial year and comprises an outline of the Remuneration Policy
visory Board, shall provide all shareholders and other parties in the
going forward.
financial markets with equal and simultaneous information about matters that may influence QIAGEN ’s share price.
The Compensation Committee consists of three members: Dr. Wirtz
(Chairman), Professor Karobath, and Mr. Hornnaess. Members are ap-
The notice convening an Annual General Meeting accompanied by
pointed by the Supervisory Board and serve for a term of one year.
the agenda for that meeting shall be sent no later than on the fifteenth
The Compensation Committee met fourteen times in fiscal year 2006.
day prior to the meeting. QIAGEN informs the Annual General Meeting
It reviewed, approved and made recommendations on QIAGEN’s com-
by means of explanatory notes to the agenda of all facts and circum-
pensation and benefits policies, practices and procedures to ensure
stances relevant to the proposed resolutions.
that legal and fiduciary responsibilities of the Supervisory Board and
the Managing Board are carried out. Further, the Compensation Com-
T H E AU D I T O F F I N A N C I A L R E P O R T I N G
mittee approved stock right or stock option grants on a monthly basis.
The external auditor is appointed at the Annual General Meeting,
based on a nomination drawn up by the Supervisory Board. The ex-
Inter alia, the Selection and Appointment Committee is primarily re-
ternal auditor is invited to attend the meeting of the Supervisory Board
sponsible for the preparation of selection criteria and appointment
at which the financial statements shall be approved and is furthermore
procedures for members of QIAGEN ‘s Supervisory Board and Man-
invited to attend the Annual General Meeting at which the financial
aging Board as well as the periodic evaluation of the scope and com-
statements are adopted and may be questioned by the Annual Gen-
position of the Managing Board and the Supervisory Board and the
eral Meeting on its statement on the fairness of our annual accounts.
functioning of their individual members. The Selection and Appointment Committee is chaired by Professor Riesner with Mr. Hornef act-
R I S K M A N AG E M E N T
ing as Deputy Chairman. The other members are individually involved
The Company has identified various risk factors for its business which
on a case-by-case basis. The Selection and Appointment Committee
are set forth in detail in the 2006 Form 20-F. There may be current
met four times in fiscal year 2006. Qualifications and profiles of candi-
risks that the Company has not yet fully assessed or which are currently
dates for potential members of the Supervisory Board positions were
qualified as minor but which could have a material impact on the
discussed and proposed to the Supervisory Board and candidates for
performance of the Company at a later stage. The Managing Board
key functions within QIAGEN were evaluated.
has developed and implemented strategies, controls and mitigation
measures to identify current and developing risks as part of the Company’s risk management system. The Company has a variety of func-
62
Let t er f rom the M ana ging B o ard
Q IAG EN – The E xe cutive Commit t e e
Q IAGEN’s Common Share
M arkets and Strate gy
Research and Development
Financial Statements
Rep or t of the Sup er visor y B o ard
Corporate Governance
tional experts to evaluate and attempt to mitigate and manage its
At least once a year, the Supervisory Board will discuss the corporate
business risks. These groups and their respective main areas of focus
strategy and the risks of the business as well as the result of the assess-
are shown in the table below.
ment by the Managing Board and the Audit Committee of the structure
and operation of the internal risk management and control systems
The senior level individuals that manage the aforementioned func-
and any significant changes thereto.
tional groups report either to the Chief Executive Officer or to another
Executive Committee member, who, in connection with the Chief
WHISTLEBLOWER POLICY AND CODE OF CONDUCT
Financial Officer, make strategic determinations as to the proper risk
QIAGEN adopted a Whistleblower Policy concerning the reporting
management procedures to be employed by the Company based on
of alleged irregularities within QIAGEN of a general, operational or
their assessment of the level of these risks.
financial nature. Furthermore, a Code of Conduct, including business
principles for our employees and rules of conduct, was adopted. The
As a publicly listed company in the United States, QIAGEN is subject
Code of Conduct can be found on our website.
to Section 404 of the Sarbanes Oxley Act. The Company has enacted
internal controls and procedures over its financial reporting in 2006
A N T I -TA K E OV E R M E A S U R E S
as described in more detail in item 15 of QIAGEN ’s 2006 Annual
In 2004, the Company granted an option to a Foundation (Stichting)
Report on Form 20-F. In its report on its audit of the Company’s internal
which allows the Foundation to acquire preference shares from the
controls over financial reporting the external auditor Ernst & Young
Company if (i) a person has (directly or indirectly) acquired or has ex-
expressed the opinion that QIAGEN has maintained effective internal
pressed the intention to acquire more than 20 % of our issued share
control over financial reporting as of December 31, 2006, under the
capital, or (ii) a person holding at least a 10 % interest in the share
applied criteria issued by the Committee of Sponsoring Organizations
capital has been designated as a hostile person by our Supervisory
of the Treadway Commission.
R I S K M A N AG E M E N T – G R O U P S A N D F U N C T I O N S
FUNCTIONAL GROUP
R I S K M A N AG E M E N T F O C U S
Corporate Strategy
Monitoring of competitive threats to the business
Intellectual Property and Licensing
Monitoring of intellectual property infringements and recommendations
to enhance the Company’s IP protection through new patents
Operations, Engineering and QA/QC
Monitoring of production risks (i.e. - contamination prevention, high-quality product assurance and existence of appropriate redundancy of operations)
Health, Safety and Environment
Monitor safety in operations and environmental hazard risks
Sales and Business Development
Monitor demand risks
Legal
Monitor legal exposures
63
Board. The option enables the Foundation to acquire such number of
and their term was not renegotiated as this was not considered to
preference shares as equals the number of our outstanding common
be in the interest of the Company. All members of the Managing
shares at the time of the relevant exercise of the right less one share.
Board have additional employment agreements with other QIAGEN
When exercising the option and exercising its voting rights on such
affiliates which have a term deviating from the term set forth in the
shares, the Foundation must act in the interest of the Company and the
employment agreements with the Company.
interests of the Company’s stakeholders.
2. Best practice provision II.2.1 recommends that options to acquire
C O M P LY O R E X P L A I N
shares are a conditional remuneration component and become un-
The Company’s corporate governance structure and compliance with the
conditional only when the management board members have ful-
Code is the joint responsibility of the Managing Board and the Supervisory
filled predetermined performance criteria after a period of at least
Board. They are accountable for this to the Annual General Meeting.
three years from the grant date. Further, best practice provision
II.2.2 provides that if a company grants unconditional options to
Nonapplication of a specific best practice provision is not in itself con-
management board members, it shall apply performance criteria.
sidered objectionable by the Code and may well be justified because
of particular circumstances relevant to a company. Pursuant to the De-
From time to time, the members of our Managing Board are grant-
cree of December 23, 2004, on the adoption of further regulations re-
ed options to acquire QIAGEN common shares with an exercise
garding the contents of the Annual Report, however, we disclose in our
price that is higher than the market price as of the grant date (as
Annual Report the application of the principles and best practice provi-
determined by reference to an organized trading market or asso-
sions of the Code. To the extent we do not apply certain principles and
ciation). Since the holder cannot realize any value from these op-
best practice provisions or do not intend to apply these in the current
tions unless the value of QIAGEN ’s common shares is increased
or the subsequent financial year, we state the reasons therefore.
above the exercise price, increasing shareholder value in that
quantifiable manner is the “performance criteria” that must be
In this chapter, we will therefore indicate which specific provisions
fulfilled for these options.
of the Code we do not apply and why. QIAGEN is positively disposed
towards the Code and applies nearly all best practice provisions. How-
3. Best practice provision II.2.6 recommends that the supervisory
ever, a few best practice provisions we prefer not to apply due to the
board shall draw up regulations concerning ownership of and
international character of our Company and to the fact – acknowl-
transactions in securities in Dutch listed companies by management
edged by the Commission that drafted the Code – that existing con-
board members, other than securities issued by their ‘own’ company.
tractual agreements between Q IAGEN and individual members of
The regulations shall be posted on the company‘s website. A man-
the Managing Board cannot be set aside at will.
agement board member shall give periodic notice, but in any event
at least once a quarter, of any changes in his holding of securities
1. Best practise provision II.1.1 recommends that a management board
in Dutch listed companies to the compliance officer or, if the com-
member is appointed for a maximum period of four years. A member
pany has not appointed a compliance officer, to the chairman of
may be reappointed for a term of not more than four years at a time.
the supervisory board. A management board member who invests
exclusively in listed investment funds or who has transferred the dis-
The members of the Managing Board are appointed annually for
cretionary management of his securities portfolio to an independent
the period beginning on the date following the Annual General
third party by means of a written mandate agreement is exempted
Meeting up to and including the date of the Annual General Meeting
from compliance with this last provision.
held in the following year. The employment agreements of Peer
M. Schatz and Roland Sackers with the Company have an indefinite
Since QIAGEN is a company which is not listed in the Netherlands
term, but can be terminated with three months’ notice by the Manag-
we do not see a conflict with potential trades by Managing Board
ing Director and with six months’ notice by the Company. These
members in securities in Dutch listed companies. Further, QIAGEN
agreements were entered into before the Code became applicable
is subject to several rules in Germany and the United States regard-
64
Let t er f rom the M ana ging B o ard
Q IAG EN – The E xe cutive Commit t e e
Q IAGEN’s Common Share
M arkets and Strate gy
Research and Development
Financial Statements
Rep or t of the Sup er visor y B o ard
Corporate Governance
ing the ownership and transactions by Managing Board members
have force. If such quorum is not represented, but a majority of
in QIAGEN shares the compliance of which we consider sufficient.
those in attendance votes in favor of the proposal, a second meeting may be convened and its vote will be binding, even without a
4. Best practice provision III.7.1 recommends that a supervisory board
one-third quorum.
member should not be granted any shares and /or rights to shares
by way of remuneration.
Our Articles of Association currently state that the Annual General
Meeting may at all times overrule a binding nomination by a reso-
QIAGEN has granted stock options to the members of its Super-
lution adopted by at least a two-thirds majority of the votes cast, if
visory Board as a remuneration component since its establishment.
such majority represents more than half of the issued share capital.
This practise is in compliance with international business practise
Although a deviation from provision IV.1.1 of the Code, the Super-
in our industry and we consider the grant of stock options or stock
visory Board and the Managing Board hold the view that these
rights as an important incentive to attract individuals with the re-
provisions will enhance the continuity of QIAGEN ’s management
quired skills and expertise to serve on our Supervisory Board.
and policies.
5. Best practice provision III.7.3 recommends that the supervisory
7. Best practice provision IV.1.7 recommends that the company shall
board shall adopt a set of regulations containing rules governing
determine a registration date for the exercise of the voting rights
ownership of and transactions in securities by supervisory board
relating to meetings.
members, other than securities issued by their ‘own’ company. The
regulations shall be posted on the company‘s website. A super-
Q IAGEN does not make use of a registration date. All of
visory board member shall give periodic notice, but in any event at
QIAGEN ´s shares are registered shares and all shareholders are
least once a quarter, of any changes in his holding of securities in
welcome to a shareholders’ meeting, provided that a shareholder
Dutch listed companies to the compliance officer or, if the company
needs to inform the Company of his intention to do so per the date
has not appointed a compliance officer, to the chairman of the super-
mentioned in the notice of the meeting. As shareholders are not
visory board. A supervisory board member who invests exclusively
obliged to block their shares to participate in a meeting, this has
in listed investment funds or who has transferred the discretionary
the same effect as a registration date, be it that a shareholder can
management of his securities portfolio to an independent third
only vote a number of shares held by him at the date of the meet-
party by means of a written mandate agreement is exempted from
ing. QIAGEN does make use of a notional record date, only to
compliance with this last provision.
enable QIAGEN to distribute documentation regarding the meeting
to shareholders.
See our statement to best practice provision II.2.6 above.
6. Pursuant to best practice provision IV.1.1, a general meeting of
shareholders is empowered to cancel binding nominations of candidates for the management board and supervisory board, and to
dismiss members of either board by a simple majority of votes of
those in attendance, although the company may require a quorum
of at least one third of the voting rights outstanding for such vote to
65
Declaration of Compliance of QIAGEN N.V.
regarding the German Corporate Governance Code
In QIAGEN’s 2001 Annual Report, the Managing Board and the Supervisory Board of QIAGEN N.V.
declared their intention to disclose in QIAGEN’s future Annual Reports the Company’s compliance with
the German Corporate Governance Code pursuant to § 161 of the German Stock Corporation Law (AktG)
or state the deviations recorded in the period. QIAGEN N.V. is a company organized under the laws of
the Netherlands and subject to laws, rules and regulations in the Netherlands and in addition is listed at
the NASDAQ. As such, QIAGEN’s compliance with the German Corporate Governance Code is dependent
on such Code’s compatibility with these foreign laws, rules, regulations and customs, which QIAGEN is
subject to. QIAGEN hereby declares compliance with the German Corporate Governance Code with the
following exceptions:
1. I T E M 2 .2 .1 PA R AG R A P H 1
2 . I T E M 2 . 2 .1 PA R AG R A P H 2
The Management Board submits to the General Meeting the Annual
Furthermore, the General Meeting resolves on the Articles of Asso-
Financial Statements and the Consolidated Financial Statements. The
ciation, the purpose of the company, amendments to the Articles of
General Meeting resolves on the appropriation of net income and
Association and essential corporate measures such as, in particular,
the discharge of the acts of the Management Board and of the Super-
intercompany agreements and transformations, the issuing of new
visory Board. It elects the shareholders‘ representatives to the Super-
shares and, in particular, of convertible bonds and bonds with war-
visory Board and, as a rule, the auditors.
rants, and the authorization to purchase own shares.
Under Dutch law, there are no specific requirements with respect to
Pursuant to QIAGEN ’s Articles of Association and as customary for
shareholders‘ representatives in the Supervisory Board. According
a Dutch company, the Supervisory Board shall have the power to re-
to the Dutch Corporate Governance Code (the “Dutch Code”), the
solve upon the issue of shares and to determine the price and further
composition of the Supervisory Board shall be such that the members
terms and conditions of such share issue, if and in so far as the Super-
are able to act critically and independently of one another and
visory Board has been designated by the General Meeting of Share-
the Management Board and any particular interests. A member
holders, hereinafter referred to as the Annual General Meeting, as the
of the Supervisory Board shall be deemed not to be independent if
authorized „orgaan“ (Dutch for ‘corporate body’) for this purpose.
he or she, among other things, holds at least 10 % of the shares in
At the Annual General Meeting in 2004, the Supervisory Board was
the company.
authorized to do so for a period of five years.
66
Let t er f rom the M ana ging B o ard
Q IAG EN – The E xe cutive Commit t e e
Q IAGEN’s Common Share
M arkets and Strate gy
Research and Development
Financial Statements
Rep or t of the Sup er visor y B o ard
Corporate Governance
3 . I T E M 2 .2 .2
The presentation of the concrete form of a stock option plan or compa-
When new shares are issued, shareholders, in principle, have pre-
rable schemes for components with long-term incentive effect and risk
emptive rights corresponding to their share of the equity capital.
character shall include the value thereof. In the case of pension plans,
the allocation to accrued pension liabilities or pension funds shall be
Pursuant to QIAGEN ’s Articles of Association and as customary for a
stated each year.
Dutch company, the Supervisory Board shall have the power to limit
or exclude any pre-emptive rights to which shareholders shall be en-
In accordance with Dutch law, the compensation of the Managing
titled, but only if and in so far as it has been granted such authority
Board members is determined by the Supervisory Board in accordance
by the Annual General Meeting, and provided further that the Super-
with the Company’s Remuneration Policy as adopted by the Annual
visory Board can only exercise such authority if at that time it also has
General Meeting on June 14, 2005. The Compensation Committee of
authority to resolve upon the issue of shares. At the Annual General
the Supervisory Board issues a Remuneration Report on an annual basis
Meeting of shareholders in 2004, the Supervisory Board was granted
which describes in detail the various compensation components, how
such authority for a period of five years.
the Remuneration Policy was implemented in the most recent year and
comprises an outline of the Remuneration Policy going forward. The
4 . I T E M 4 .2 . 3 PA R AG R A P H 3
Remuneration Report is published on the Company’s website.
In particular, company stocks with a multi-year blocking period, stock
options or comparable instruments (e.g. phantom stocks) serve as vari-
Further, as a company which is listed in the United States, QIAGEN fol-
able compensation components with long-term incentive effect and
lows the obligations stated by the SEC to give a detailed discussion and
risk elements. Stock options and comparable instruments shall be re-
analysis on Directors’ and Officers’ compensation in its 2006 Form 20-F
lated to demanding, relevant comparison parameters. Changing such
report and its 2006 proxy statements. The value of granted stock options
performance targets or comparison parameters retroactively shall be
is set forth in the 2006 Form 20-F report and in the Remuneration Report.
excluded. For extraordinary, unforeseen developments a possibility of
limitation (Cap) shall be agreed for by the Supervisory Board.
6 . I T E M 5 .1. 2 PA R AG R A P H 1
The Supervisory Board appoints and dismisses the members of the
From time to time, the members of our Managing Board are granted
Management Board. Together with the Management Board, it shall
options to acquire QIAGEN common shares with an exercise price
ensure that there is a long-term succession planning. The Supervisory
that is 2 % higher than the market price as of the grant date (as deter-
Board can delegate preparations for the appointment of members of
mined by reference to an organized trading market or association).
the Management Board to a committee, which also determines the
Such option rights are subject to multi-year vesting periods and sales
conditions of the employment contracts including compensation.
restrictions. Members of the Managing Board cannot realize any profit
from these instruments unless they succeed to increase shareholder
Pursuant to QIAGEN ’s Articles of Association and as customary for
value on a long-term basis. For those reasons, as well as to ensure com-
a Dutch corporation, the Managing Directors shall be appointed by
parability to equity-based incentives granted by peer companies in our
the Annual General Meeting after the joint meeting of the Supervisory
industry, we consider these terms as the most appropriate parameters
Board and the Managing Board – hereinafter referred to as the
for the stock options granted to the members of the Managing Board.
„Joint Meeting“ – has made a binding nomination for each vacancy.
According to the Dutch Corporate Governance Code, the Selection
5 . I T E M 4 .2 . 5
and Appointment Committee of the Supervisory Board is responsible
Disclosure shall be made in a Compensation Report which as part of
for the preparation and selection criteria and appointment procedures
the Corporate Governance Report describes the compensation system
for the members of the Managing Board.
for Management Board members in a generally understandable way.
67
7. I T E M 5 . 4 . 3 PA R AG R A P H 1
United States shareholders holding over 5 % of QIAGEN‘s shares are
Elections to the Supervisory Board shall be made on an individual basis.
required to submit filings under Schedules 13D or 13G. In addition,
United States institutional investment managers having equity assets
Pursuant to Q IAGEN ’s Articles of Association, the members of its
under management of US$100 million or more are required to file a
Supervisory Board stand for election every year. This is different to
Form 13-F on a quarterly basis with the SEC listing the shares over
German Stock Corporations, where members of the Supervisory
which they have control. QIAGEN discloses any relevant information
Board are appointed for a period of up to five years. Due to this dif-
from these sources in its Annual Report on Form 20-F.
ference between German and Dutch corporate law, we consider
the election of Supervisory Board members on an individual basis
as not appropriate for QIAGEN .
9. I T E M 6 . 5
Any information which the company discloses abroad in line with
corresponding capital market law provisions shall also be disclosed
8 . I T E M 6 .2
domestically without delay.
As soon as the company becomes aware of the fact that an individual
acquires, exceeds or falls short of 5, 10, 25, 50 or 75 % of the voting
QIAGEN , from time to time, makes filings with the Netherlands Author-
rights in the company by means of a purchase, sale or any other man-
ity for the Financial Markets (AFM ), the Securities and Exchange Com-
ner, the Management Board will disclose this fact without delay.
mission in the United States of America (SEC ) and regulatory bodies in
Germany. These links are also available on QIAGEN ’s website:
QIAGEN is organized under the laws of the Netherlands and as such,
http://www.qiagen .com
its shareholders and the Company itself are not subject to § 21 and
http://www.autoriteit-fm.nl
§ 22 of the German Wertpapierhandelsgesetz (“WpHG”) which regu-
http://www.SEC .gov
late such reporting requirements. However, pursuant to § 26 WpHG,
QIAGEN is obliged to report any voting right changes of which it is in-
10 . I T E M 7.1.1 L A S T S E N T E N C E
formed pursuant to laws of other European Union countries. Holders
For corporate law purposes (calculation of dividend, shareholder pro-
of common shares may be subject to reporting obligations under
tection), Annual Financial Statements will be prepared according to
the Dutch Financial Markets Supervision Act (Wet op het financieel
national regulations (German Commercial Code), which also form the
toezicht) (“FMSA”) which entered into force as of January 1, 2007.
basis for taxation.
Under the FMSA , any person who, directly or indirectly, acquires
or disposes of an interest in the capital and/or the voting rights of
As QIAGEN is a limited liability company organized under the laws
QIAGEN must give written notice of such acquisition or disposal if,
of the Netherlands, for corporate law purposes (calculation of dividend,
as a result of such acquisition or disposal, the percentage of capital
shareholder protection), the Annual Financial Statements will be pre-
interest and/or voting rights held by such person meets, exceeds or
pared according to IFRS .
falls below one of the following thresholds: 5 %, 10 %, 15 %, 20 %,
25 %, 30 %, 40 %, 50 %, 60 %, 75 % and 95 % of QIAGEN ´s issued
and outstanding share capital. Notification must be given to the
Netherlands Authority for the Financial Markets (Autoriteit Financiële
Markten – AFM ) without delay. The AFM will publish all disclosures
made public by means of an advertisement in a newspaper distributed throughout the Netherlands as well as on its public website
(www.afm.nl).
68
Financial Calendar / Investor Relations Contacts
F I N A N C I A L C A L E N DA R
FEB
12, 2007
Publication of quarterly results 4/06 and year-end results 2006
M AY
7, 2007
JUN
20, 2007
AUG
6, 2007
Publication of quarterly results 2/07
NOV
5, 2007
Publication of quarterly results 3/07
Publication of quarterly results 1/07
Annual General Meeting
I N V E S T O R R E L AT I O N S
IMPRINT
Dr. Solveigh Mähler
Director Investor Relations
Email ir @ QIAGEN .com
Concept and design:
3st kommunikation, Mainz
C O N TAC T E U R O P E
Phone +49 (0) 2103 - 29 - 11710
Fax
+49 (0) 2103 - 29 - 21710
C O N TAC T U S A
Phone +1 (240) 686 - 2222
QIAGEN GmbH
QIAGEN Strasse 1
40724 Hilden
Germany
Photography:
Michael Dannenmann, Düsseldorf,
Getty Images, Corbis
FINANCIAL REPORT 20 06
Form 20-F
UNITED STATES
SECURITIES AND EXCHANGE COMMISSION
Washington, D.C. 20549
FORM 20-F
‘
REGISTRATION STATEMENT PURSUANT TO SECTION 12(b) OR (g) OF THE SECURITIES EXCHANGE ACT
OF 1934
È
ANNUAL REPORT PURSUANT TO SECTION 13 OR 15(d) OF THE SECURITIES EXCHANGE ACT OF 1934
or
For the fiscal year ended December 31, 2006
or
‘
TRANSITION REPORT PURSUANT TO SECTION 13 OR 15(d) OF THE SECURITIES EXCHANGE ACT OF 1934
For the transition period from
to
or
‘
SHELL COMPANY REPORT PURSUANT TO SECTION 13 OR 15(d) OF THE SECURITIES EXCHANGE ACT OF
1934
Date of event requiring this shell company report
Commission File Number 0-28564
QIAGEN N.V.
(Exact name of Registrant as specified in its charter)
n/a
(Translation of Registrant’s name in English)
The Netherlands
(Jurisdiction of incorporation or organization)
Spoorstraat 50
5911 KJ Venlo
The Netherlands
011-31-77-320-8400
(Address of principal executive offices)
Securities registered or to be registered pursuant to Section 12(b) of the Act:
Title of class:
Name of each exchange on which registered:
Common Shares, par value EUR .01 per share
NASDAQ Stock Market LLC
Securities registered or to be registered pursuant to Section 12(g) of the Act:
None
Securities for which there is a reporting obligation pursuant to Section 15(d) of the Act:
None
The number of outstanding common shares as of December 31, 2006 was 150,167,540.
Act.
Indicate by check mark if the registrant is a well-known seasoned issuer, as defined in Rule 405 of the Securities
È Yes ‘ No
If this report is an annual or transition report, indicate by check mark if the registrant is not required to file reports
pursuant to Section 13 or 15(d) of the Securities Exchange Act of 1934. ‘ Yes È No
Note—Checking the box above will not relieve any registrant required to file reports pursuant to Section 13 or 15(d) of
the Securities Exchange Act of 1934 from their obligations under those Sections. Indicate by check mark whether the
registrant (1) has filed all reports required to be filed by Section 13 or 15(d) of the Securities Exchange Act of 1934 during the
preceding 12 months (or for such shorter period that the registrant was required to file such reports), and (2) has been subject
to such filing requirements for the past 90 days. È Yes ‘ No
Indicate by check mark whether the registrant is a large accelerated filer, an accelerated filer, or a non-accelerated filer.
See definition of “accelerated filer and large accelerated filer” in Rule 12b-2 of the Exchange Act. (Check one):
Large accelerated filer È
Accelerated filer ‘
Non-accelerated filer ‘
Indicate by check mark which financial statement item the registrant has elected to follow. ‘ Item 17 È Item 18
If this is an annual report, indicate by check mark whether the registrant is a shell company (as defined in Rule 12b-2 of
the Exchange Act). ‘ Yes È No
Unless the context otherwise requires, references herein to “we,” “us,” “our,” the “Company” or to “QIAGEN”
are to QIAGEN N.V. and its consolidated subsidiaries.
Our name together with our logo is registered as a trademark in the United States and a number of other
countries: QIAGEN®. Other trademarks registered in the United States and in other countries include, alias
among others: QIAexpress®, QIAwell®, QIAEX®, QIAprep®, QIAamp®, QIAquick®, Oligotex®, RNeasy®,
BIOROBOT®, ENDOFREE®, R.E.A.L.®, PolyFect®, SuperFect®, DNeasy®, UltraFect®, TurboFilter®,
HotStarTaq®, EFFECTENE®, QIA®, DyeEx®, Omniscript®, Sensiscript®, HiSpeed®, Targetene®,
TransMessenger®, MagAttract®, DirectPrep®, InhibitEX®, DoubleTag®, QuantiScript®, UltraSens®, pAlliance®,
MinElute®, EverGene®, ProofStart®, FlexiGene®, QuantiTect®, DNAprotect®, RNAprotect® and LiquiChip®,
CryoCell®, LabelStar®, EasyXpress® RNAiFect® BioSprint® Registered trademarks in countries outside of the
United States include: QIABRANE™, ProofTaq™, Easylabel™, BioSprint™, AllPrep™, Qproteome™, FastLane™,
GeneGlobe™, LyseBlue™, CompactPrep™, TurboCapture™, CoralLoad™, EpiTect™, NEXTAL™ and
EASYXTAL™.
This Annual Report on Form 20-F may also contain trade names or trademarks of companies other than
QIAGEN.
EXCHANGE RATES
QIAGEN publishes its financial statements in U.S. dollars. In this Annual Report on Form 20-F, references to
“dollars” or “$” are to U.S. dollars, and references to “EUR” or the “euro” are to the European Monetary Union
euro. Except as otherwise stated herein, all monetary amounts in this Annual Report on Form 20-F have been
presented in U.S. dollars.
The exchange rate used for the euro was the noon buying rate of the euro in New York City for cable transfers in
foreign currencies as certified for customs purposes by the Federal Reserve Board of New York. This rate at
March 15, 2007, was $1.3249 per EUR 1.
For information regarding the effects of currency fluctuations on our results, see Item 5 “Operating and Financial
Review and Prospects.”
TABLE OF CONTENTS
PART I
Page
Item 1.
Item 2.
Item 3.
Item 4.
Item 4A.
Item 5.
Item 6.
Item 7.
Item 8.
Item 9.
Item 10.
Item 11.
Item 12.
Identity of Directors, Senior Management and Advisors . . . . . . . . . . . . . . . . . . . . . . . . . . . . . . .
Offer Statistics and Expected Timetable . . . . . . . . . . . . . . . . . . . . . . . . . . . . . . . . . . . . . . . . . . .
Key Information . . . . . . . . . . . . . . . . . . . . . . . . . . . . . . . . . . . . . . . . . . . . . . . . . . . . . . . . . . . . . .
Information on the Company . . . . . . . . . . . . . . . . . . . . . . . . . . . . . . . . . . . . . . . . . . . . . . . . . . . .
Unresolved Staff Comments . . . . . . . . . . . . . . . . . . . . . . . . . . . . . . . . . . . . . . . . . . . . . . . . . . . .
Operating and Financial Review and Prospects . . . . . . . . . . . . . . . . . . . . . . . . . . . . . . . . . . . . . .
Directors, Senior Management and Employees . . . . . . . . . . . . . . . . . . . . . . . . . . . . . . . . . . . . . .
Major Shareholders and Related Party Transactions . . . . . . . . . . . . . . . . . . . . . . . . . . . . . . . . . .
Financial Information . . . . . . . . . . . . . . . . . . . . . . . . . . . . . . . . . . . . . . . . . . . . . . . . . . . . . . . . . .
The Listing of QIAGEN’s Common Shares . . . . . . . . . . . . . . . . . . . . . . . . . . . . . . . . . . . . . . . .
Additional Information . . . . . . . . . . . . . . . . . . . . . . . . . . . . . . . . . . . . . . . . . . . . . . . . . . . . . . . . .
Quantitative and Qualitative Disclosures about Market Risk . . . . . . . . . . . . . . . . . . . . . . . . . . .
Description of Securities other than Equity Securities . . . . . . . . . . . . . . . . . . . . . . . . . . . . . . . . .
4
4
4
16
25
25
40
50
51
52
53
70
71
PART II
Item 13.
Item 14.
Item 15.
Item 16A.
Item 16B.
Item 16C.
Item 16D.
Item 16E.
Defaults, Dividend Arrearages and Delinquencies . . . . . . . . . . . . . . . . . . . . . . . . . . . . . . . . . . .
Material Modifications to the Rights of Security Holders and Use of Proceeds . . . . . . . . . . . . .
Controls and Procedures . . . . . . . . . . . . . . . . . . . . . . . . . . . . . . . . . . . . . . . . . . . . . . . . . . . . . . . .
Audit Committee Financial Expert . . . . . . . . . . . . . . . . . . . . . . . . . . . . . . . . . . . . . . . . . . . . . . . .
Code of Ethics . . . . . . . . . . . . . . . . . . . . . . . . . . . . . . . . . . . . . . . . . . . . . . . . . . . . . . . . . . . . . . .
Principal Accountant Fees and Services . . . . . . . . . . . . . . . . . . . . . . . . . . . . . . . . . . . . . . . . . . .
Exemptions from the Listing Standards for Audit Committees . . . . . . . . . . . . . . . . . . . . . . . . . .
Purchases of Equity Securities by the Issuer and Affiliated Purchasers . . . . . . . . . . . . . . . . . . .
72
72
72
73
73
73
74
74
PART III
Item 17.
Item 18.
Item 19.
Financial Statements . . . . . . . . . . . . . . . . . . . . . . . . . . . . . . . . . . . . . . . . . . . . . . . . . . . . . . . . . . .
Financial Statements . . . . . . . . . . . . . . . . . . . . . . . . . . . . . . . . . . . . . . . . . . . . . . . . . . . . . . . . . . .
Exhibits . . . . . . . . . . . . . . . . . . . . . . . . . . . . . . . . . . . . . . . . . . . . . . . . . . . . . . . . . . . . . . . . . . . . .
Signatures . . . . . . . . . . . . . . . . . . . . . . . . . . . . . . . . . . . . . . . . . . . . . . . . . . . . . . . . . . . . . . . . . . .
75
75
75
77
PART I
Item 1. Identity of Directors, Senior Management and Advisors
Not applicable.
Item 2. Offer Statistics and Expected Timetables
Not applicable.
Item 3. Key Information
The selected consolidated financial data below should be read in conjunction with “Operating and Financial
Review and Prospects” and the Consolidated Financial Statements, notes thereto and other financial information
included elsewhere in this Annual Report on Form 20-F. The selected consolidated statements of income data for
the years ended December 31, 2006, 2005 and 2004 and the consolidated balance sheet data at December 31,
2006 and 2005 are derived from the Consolidated Financial Statements of QIAGEN which have been audited by
Ernst & Young LLP, an independent registered public accounting firm, and are included herein. The selected
consolidated statements of income data presented for the years ended December 31, 2003 and 2002, and the
consolidated balance sheet data as of December 31, 2004, 2003 and 2002, is derived from audited consolidated
financial statements not included herein.
Selected Financial Data
The information below should be read in conjunction with the consolidated financial statements (and notes
thereto) and “Operating and Financial Review and Prospects.”
Years ended December 31,
2005
2004
2003
2006
2002
Consolidated Statement of Income Data:
(amounts in thousands, except per share data)
Net sales . . . . . . . . . . . . . . . . . . . . . . . . . . . . . . . . . . . . . . . . . . . . . $465,778 $398,395 $380,629 $351,404 $298,607
Cost of sales . . . . . . . . . . . . . . . . . . . . . . . . . . . . . . . . . . . . . . . . . . 139,122 122,755 125,658 118,786
96,508
Cost of sales—acquisition and restructuring related . . . . . . . . . . . .
2,046
439
1,454
3,618
—
Gross profit . . . . . . . . . . . . . . . . . . . . . . . . . . . . . . . . . . . . . . . . . . .
324,610
275,201
253,517
229,000
202,099
Operating Expenses:
Research and development . . . . . . . . . . . . . . . . . . . . . . . . . . .
Sales and marketing . . . . . . . . . . . . . . . . . . . . . . . . . . . . . . . .
General and administrative . . . . . . . . . . . . . . . . . . . . . . . . . . .
Purchased in-process research and development . . . . . . . . . .
Acquisition, integration and related costs . . . . . . . . . . . . . . . .
Acquisition related intangible amortization . . . . . . . . . . . . . .
Relocation and restructuring costs . . . . . . . . . . . . . . . . . . . . .
41,560
115,942
48,574
2,200
6,061
8,220
1,452
35,780
94,312
40,123
3,239
3,213
3,697
—
34,351
87,506
41,715
—
572
1,416
3,817
31,068
83,005
41,894
—
—
1,096
3,048
27,438
75,086
41,716
—
2,848
1,053
10,773
Total operating expenses . . . . . . . . . . . . . . . . . . . . . . . . .
224,009
180,364
169,377
160,111
158,914
Income from operations . . . . . . . . . . . . . . . . . . . . . . . . . . . . . . . . . .
100,601
94,837
84,140
68,889
43,185
Other income (expense), net . . . . . . . . . . . . . . . . . . . . . . . . . . . . . .
5,467
2,427
(11,453)
(1,634)
(4,325)
Income before provision for income taxes and minority interest . .
Provision for income taxes . . . . . . . . . . . . . . . . . . . . . . . . . . . . . . .
Minority (income) expense . . . . . . . . . . . . . . . . . . . . . . . . . . . . . . .
106,068
35,529
—
97,264
35,039
—
72,687
23,982
—
67,255
24,405
—
38,860
15,723
(5)
Net income . . . . . . . . . . . . . . . . . . . . . . . . . . . . . . . . . . . . . . . . . . . $ 70,539 $ 62,225 $ 48,705 $ 42,850 $ 23,142
Basic net income per common share(1) . . . . . . . . . . . . . . . . . . . . . $
0.47 $
0.42 $
0.33 $
0.29 $
0.16
Diluted net income per common share(1) . . . . . . . . . . . . . . . . . . . . $
0.46 $
0.41 $
0.33 $
0.29 $
0.16
Weighted average number of common shares used to compute
basic net income per common share . . . . . . . . . . . . . . . . . . . . . .
Weighted average number of common shares used to compute
diluted net income per common share . . . . . . . . . . . . . . . . . . . . .
149,504
147,837
146,658
145,832
144,795
153,517
150,172
148,519
147,173
145,787
(1) Computed on the basis described for net income per common share in Note 3 of the “Notes to Consolidated
Financial Statements.”
4
Consolidated Balance Sheet Data:
(amounts in thousands)
Cash and cash equivalents . . . . . . . . . . . . . . . . . . . . . . .
Working capital . . . . . . . . . . . . . . . . . . . . . . . . . . . . . . .
Total assets . . . . . . . . . . . . . . . . . . . . . . . . . . . . . . . . . .
Total long-term liabilities, including current portion . .
Total shareholders’ equity . . . . . . . . . . . . . . . . . . . . . . .
Common shares . . . . . . . . . . . . . . . . . . . . . . . . . . . . . . .
Shares outstanding . . . . . . . . . . . . . . . . . . . . . . . . . . . . .
As of December 31,
2004
2006
2005
$ 430,357
$ 566,660
$1,212,012
$ 536,738
$ 566,165
$
1,535
150,168
$191,700
$278,586
$765,298
$230,086
$450,457
$ 1,513
148,456
$196,375
$299,029
$714,599
$234,138
$400,376
$ 1,495
147,020
2003
2002
$ 98,993
$163,583
$551,930
$131,095
$334,786
$ 1,485
146,218
$ 44,893
$111,554
$454,511
$112,331
$263,031
$ 1,478
145,534
Risk Factors
Note regarding Forward-Looking Statements and Risk Factors
Our future operating results may be affected by various risk factors, many of which are beyond our control.
Certain of the statements included in this Annual Report and the documents incorporated herein by reference
may be forward-looking statements within the meaning of Section 27A of the U.S. Securities Act of 1933, as
amended, and Section 21E of the U.S. Securities Exchange Act of 1934, as amended, including statements
regarding potential future net sales, gross profit, net income and liquidity. These statements can be identified by
the use of forward-looking terminology such as “believe,” “hope,” “plan,” “intend,” “seek,” “may,” “will,”
“could,” “should,” “would,” “expect,” “anticipate,” “estimate,” “continue” or other similar words. Reference is
made in particular to the description of our plans and objectives for future operations, assumptions underlying
such plans and objectives, and other forward-looking statements. Such statements are based on management’s
current expectations and are subject to a number of factors and uncertainties that could cause actual results to
differ materially from those described in the forward-looking statements. We caution investors that there can be
no assurance that actual results or business conditions will not differ materially from those projected or suggested
in such forward-looking statements as a result of various factors. Factors which could cause such results to differ
materially from those described in the forward-looking statements include those set forth in the risk factors
below. As a result, our future development efforts involve a high degree of risk. When considering forwardlooking statements, you should keep in mind that the risk factors could cause our actual results to differ
significantly from those contained in any forward-looking statement.
Risks Related to Our Business
An inability to manage our growth, manage the expansion of our operations, or successfully integrate
acquired businesses could adversely affect our business.
Our business has grown rapidly, with total net revenues increasing from $216.8 million in 2000 to
$465.8 million in 2006. In 2002, we opened a research and manufacturing facility in Germantown, Maryland and
manufacturing and administration facilities in Germany. Additionally, we have made several acquisitions and are
likely to make more. The successful integration of acquired businesses requires a significant effort and expense
across all operational areas, including sales and marketing, research and development, manufacturing, finance
and administration and information technologies.
In 2003 and 2004 as part of a restructuring of our U.S operations, we relocated certain administrative, sales
and marketing functions to our Maryland facility. Our earlier expansion of facilities in Maryland and Germany
added production capacity and increased fixed costs. These higher fixed costs will continue to be a cost of
production in the future, and until we more fully utilize the additional capacity of the facilities, our gross profit
will be negatively impacted. We have also upgraded our operating and financial systems and expanded the
geographic area of our operations, resulting in the hiring of new employees, as well as increased responsibility
for both existing and new management personnel. The rapid expansion of our business and addition of new
personnel may place a strain on our management and operational systems.
5
Our future operating results will depend on the ability of our management to continue to implement and
improve our research, product development, manufacturing, sales and marketing and customer support programs,
enhance our operational and financial control systems, expand, train and manage our employee base, integrate
acquired businesses, and effectively address new issues related to our growth as they arise. There can be no
assurance that we will be able to manage our recent or any future expansion or acquisition successfully, and any
inability to do so could have a material adverse effect on our results of operations.
We may not achieve the anticipated benefits of acquisitions of technologies and businesses.
During the past several years we have acquired a number of companies, through which we have gained access
to technologies and products that complement our internally developed product lines. In the future, we may acquire
additional technologies, products or businesses to expand our existing and planned business. Acquisitions would
expose us to the addition of new operating and other risks including the risks associated with the:
•
assimilation of new technologies, operations, sites and personnel;
•
application for and obtaining of regulatory approvals or other clearances;
•
diversion of resources from our existing business and technologies;
•
inability to generate revenues to offset associated acquisition costs;
•
inability to maintain uniform standards, controls, and procedures;
•
inability to maintain relationships with employees and customers as a result of any integration of new
management personnel;
•
issuance of dilutive equity securities;
•
incurrence or assumption of debt;
•
additional expenses associated with future amortization or impairment of acquired intangible assets or
potential businesses; or
•
assumption of liabilities or exposure to claims against acquired entities.
Our failure to address the above risks successfully in the future may prevent us from achieving the anticipated
benefits from any acquisition in a reasonable time frame, or at all.
Our continued growth is dependent on the development and success of new products.
The market for certain of our products and services is only about fifteen years old. Rapid technological
change and frequent new product introductions are typical in this market. Our future success will depend in part
on continuous, timely development and introduction of new products that address evolving market requirements.
We believe successful new product introductions provide a significant competitive advantage because customers
make an investment of time in selecting and learning to use a new product, and are reluctant to switch thereafter.
To the extent that we fail to introduce new and innovative products, we may lose market share to our
competitors, which will be difficult or impossible to regain. An inability, for technological or other reasons, to
successfully develop and introduce new products could reduce our growth rate or otherwise damage our business.
In the past, we have experienced, and are likely to experience in the future, delays in the development and
introduction of products. We cannot assure you that we will keep pace with the rapid rate of change in life
sciences research, or that our new products will adequately meet the requirements of the marketplace or achieve
market acceptance. Some of the factors affecting market acceptance of new products include:
•
availability, quality and price relative to competitive products;
•
the timing of introduction of the product relative to competitive products;
•
scientists’ opinions of the products’ utility;
6
•
citation of the product in published research;
•
regulatory trends; and
•
general trends in life sciences research, applied markets and molecular diagnostics.
The expenses or losses associated with unsuccessful product development activities or lack of market
acceptance of our new products could materially adversely affect our business, financial condition and results of
operations.
Our operating results may vary significantly from period to period.
Our operating results may vary significantly from quarter to quarter and from year to year, depending on
factors such as the level and timing of our customers’ research and commercialization efforts, timing of our
customers’ funding, the timing of our research and development and sales and marketing expenses, the
introduction of new products by us or our competitors, competitive conditions, exchange rate fluctuations and
general economic conditions. Our expense levels are based in part on our expectations as to future revenues.
Consequently, revenues or profits may vary significantly from quarter to quarter or from year to year, and
revenues and profits in any interim period will not necessarily be indicative of results in subsequent periods.
We depend on patents and proprietary rights that may fail to protect our business.
Our success will depend to a large extent on our ability to develop proprietary products and technologies
and to establish and protect our patent and trademark rights in these products and technologies. As of
December 31, 2006, we owned 89 issued patents in the United States, 56 issued patents in Germany and 327
issued patents in other major industrialized countries. In addition, at December 31, 2006, we had 452 pending
patent applications and we intend to file applications for additional patents as our products and technologies are
developed. However, the patent positions of technology-based companies, including QIAGEN, involve complex
legal and factual questions and may be uncertain, and the laws governing the scope of patent coverage and the
periods of enforceability of patent protection are subject to change. In addition, patent applications in the United
States are maintained in secrecy until patents issue, and publication of discoveries in the scientific or patent
literature tend to lag behind actual discoveries by several months. Therefore, no assurance can be given that
patents will issue from any patent applications that we own or license or, if patents do issue, that the claims
allowed will be sufficiently broad to protect our technology. In addition, no assurance can be given that any
issued patents that we own or license will not be challenged, invalidated or circumvented, or that the rights
granted thereunder will provide us competitive advantages.
Certain of our products incorporate patents and technologies that are licensed from third parties. These
licenses impose various commercialization, sublicensing and other obligations on us. Our failure to comply with
these requirements could result in the conversion of the applicable license from being exclusive to non-exclusive
in nature or, in some cases, termination of the license.
We also rely on trade secrets and proprietary know-how, which we seek to protect through confidentiality
agreements with our employees and consultants. There can be no assurance that any confidentiality agreements
that we have with our employees, consultants, outside scientific collaborators and sponsored researchers and
other advisors will provide meaningful protection for our trade secrets or adequate remedies in the event of
unauthorized use or disclosure of such information. There also can be no assurance that our trade secrets will not
otherwise become known or be independently developed by competitors.
We currently engage in, and may continue to engage in, collaborations with academic researchers and
institutions. There can be no assurance that under the terms of such collaborations, third parties will not acquire
rights in certain inventions developed during the course of the performance of such collaborations.
7
We are subject to risks associated with patent litigation.
The biotechnology industry has been characterized by extensive litigation regarding patents and other
intellectual property rights. We are aware that patents have been applied for and/or issued to third parties
claiming technologies for the separation and purification of nucleic acids that are closely related to those we use.
From time to time we receive inquiries requesting confirmation that we do not infringe patents of third parties.
We endeavor to follow developments in this field, and we do not believe that our technologies or products
infringe any proprietary rights of third parties. However, there can be no assurance that third parties will not
challenge our activities and, if so challenged, that we will prevail. In addition, the patent and proprietary rights of
others could require that we alter our products or processes, pay licensing fees or cease certain activities, and
there can be no assurance that we will be able to license any technologies that we may require on acceptable
terms. In addition, litigation, including proceedings that may be declared by the U.S. Patent and Trademark
Office or the International Trade Commission, may be necessary to respond to any assertions of infringement,
enforce our patent rights and/or determine the scope and validity of our proprietary rights or those of third
parties. Litigation could involve substantial cost, and there can be no assurance that we would prevail in any such
proceedings.
Exchange rate fluctuations may adversely affect our business.
Since we currently market our products in over 40 countries throughout the world, a significant portion of
our business is conducted in currencies other than the U.S. dollar, our reporting currency. As a result, fluctuations
in value relative to the U.S. dollar of the currencies in which we conduct our business have caused and will
continue to cause foreign currency transaction gains and losses. Foreign currency transaction gains and losses
arising from normal business operations are charged against earnings in the period when incurred. We hedge a
portion of the anticipated cash flow that we expect to exchange into other currencies, subject to our short-term
financing needs. Due to the number of currencies involved, the variability of currency exposures and the
potential volatility of currency exchange rates, we cannot predict the effects of exchange rate fluctuations upon
future operating results. While we engage in foreign exchange hedging transactions to manage our foreign
currency exposure, there can be no assurance that our hedging strategy will adequately protect our operating
results from the effects of future exchange rate fluctuations.
Our ability to accurately forecast our results during each quarter may be negatively impacted by the fact
that a substantial percentage of our sales may be recorded in the final weeks or days of the quarter.
The markets we serve are characterized by a high percentage of purchase orders being received in the final
few weeks or even days of each quarter. Although this varies from quarter to quarter, many customers make a
large portion of their purchase decisions late in each fiscal quarter, as both their budgets and requirements for the
coming quarter become clearer. As a result, even late in each fiscal quarter, we cannot predict with certainty
whether our revenue forecasts for the quarter will be achieved. Historically, we have been able to rely on the
overall pattern of customer purchase orders during prior periods to project with reasonable accuracy our
anticipated sales for the current or coming quarters. However, if our customers’ purchases during a quarter vary
from historical patterns, our final quarterly results could deviate significantly from our projections.
Consequently, our revenue forecasts for any given quarter may prove not to have been accurate. We may not
have enough information as a result of such patterns to confirm or revise our sales projections during a quarter. If
we fail to achieve our forecasted revenues for a particular quarter, our stock price could be adversely affected.
Competition in the Life Sciences market could reduce sales.
Our primary competition stems from traditional separation, purification and handling methods (“traditional”
or “home-brew” methods) that utilize widely available reagents and other chemicals. The success of our business
depends in part on the continued conversion of current users of such traditional methods to our nucleic acid
separation and purification technologies and products. There can be no assurance, however, as to how quickly
such conversion will occur.
8
We also have experienced, and expect to continue to experience, increasing competition in various segments
of our business from companies providing pre-analytical products and other products we offer. The markets for
certain of our products are very competitive and price sensitive. Other life science research product suppliers
have significant financial, operational, sales and marketing resources, and experience in research and
development. These and other companies may have developed or could in the future develop new technologies
that compete with our products or even render our products obsolete. If a competitor develops superior
technology or cost-effective alternatives to our kits and other products, our business, operating results and
financial condition could be materially adversely affected.
We believe that customers in the market for preanalytical solutions and assay technologies display a
significant amount of loyalty to their initial supplier of a particular product. Therefore, it may be difficult to
generate sales to customers who have purchased products from competitors. To the extent we are unable to be the
first to develop and supply new products, our competitive position will suffer.
Reduction in research and development budgets and government funding may result in reduced sales.
Our customers include researchers at pharmaceutical and biotechnology companies, academic institutions
and government and private laboratories. Fluctuations in the research and development budgets of these
researchers and their organizations for applications in which our products are used could have a significant effect
on the demand for our products. Research and development budgets fluctuate due to changes in available
resources, mergers of pharmaceutical and biotechnology companies, spending priorities and institutional
budgetary policies. Our business could be seriously damaged by any significant decrease in life sciences research
and development expenditures by pharmaceutical and biotechnology companies, academic institutions or
government and private laboratories. In addition, short term changes in administrative, regulatory or purchasingrelated procedures can create uncertainties or other impediments which can contribute to lower sales.
In recent years, the pharmaceutical biotech industries have undergone substantial restructuring and
consolidation. Additional mergers or corporate consolidations in the pharmaceutical industry could cause us to
lose existing customers and potential future customers, which could have a material adverse effect on our
business, financial condition and results of operations.
A significant portion of our sales have been to researchers, universities, government laboratories and private
foundations whose funding is dependent upon grants from government agencies such as the U.S. National
Institutes of Health (NIH) and similar domestic and international agencies. Although the level of research
funding has increased during the past several years, we cannot assure you that this trend will continue.
Government funding of research and development is subject to the political process, which is inherently fluid and
unpredictable. The predictability of our revenues may be adversely affected if our customers delay purchases as a
result of uncertainties surrounding the approval of government or industrial budget proposals. Also, government
proposals to reduce or eliminate budgetary deficits have sometimes included reduced allocations to the NIH and
other government agencies that fund research and development activities. A reduction in government funding for
the NIH or other government research agencies could seriously and negatively impact our business.
We heavily rely on air cargo carriers and other overnight logistics services.
Our customers within the scientific research markets typically do not keep a significant inventory of
QIAGEN products and consequently require overnight delivery of purchases. As such, we heavily rely on air
cargo carriers such as DHL, FedEx and Panalpina. If overnight services are suspended or delayed and other
delivery carriers cannot provide satisfactory services, customers may suspend a significant amount of work
requiring nucleic acid purification. If there are no adequate delivery alternatives available, sales levels could be
negatively affected.
9
We depend on suppliers and if shipments from these suppliers are delayed or interrupted, we will be
unable to manufacture our products.
We buy materials for our products from many suppliers, and are not dependent on any one supplier or group
of suppliers for our business as a whole. However, key components of certain products, including certain
instrumentation components and chemicals, are available only from a single source. If supplies from these
vendors were delayed or interrupted for any reason, we may not be able to obtain these materials timely or in
sufficient quantities or qualities in order to produce certain products and our sales levels could be negatively
affected.
We rely on collaborative commercial relationships to develop some of our products.
Our long-term business strategy has included entering into strategic alliances and marketing and distribution
arrangements with academic, corporate and other partners relating to the development, commercialization,
marketing and distribution of certain of our existing and potential products. There can be no assurance that we
will continue to be able to negotiate such collaborative arrangements on acceptable terms, or that any such
relationships will be scientifically or commercially successful. In addition, there can be no assurance that we will
be able to maintain such relationships or that our collaborative partners will not pursue or develop competing
products or technologies, either on their own or in collaboration with others.
Doing business internationally creates certain risks for our business.
Our business involves operations in several countries outside of the United States. Our consumable
manufacturing facilities are located in Germany, China, Canada and the United States, and our instrumentation
facility is located in Switzerland. We also have established sales subsidiaries in the United States, Germany,
Japan, the United Kingdom, France, Switzerland, Australia, Canada, Austria, The Netherlands, Sweden, and
Italy. In addition, our products are sold through independent distributors serving more than 40 other countries.
We operate U.S. facilities in West Chester, Pennsylvania (sales and research and development), Valencia,
California (customer service and technical service), Germantown, Maryland and San Francisco, California
(manufacturing and research and development). Conducting and launching operations on an international scale
requires close coordination of activities across multiple jurisdictions and time zones and consumes significant
management resources. We have invested heavily in computerized information systems in order to manage more
efficiently the widely dispersed components of our operations. We use SAP as our business information system
to integrate most of our North American, European, and Japanese subsidiaries.
Our operations are also subject to other risks inherent in international business activities, such as general
economic conditions in the countries in which we operate, overlap of different tax structures, unexpected changes
in regulatory requirements, compliance with a variety of foreign laws and regulations, and longer accounts
receivable payment cycles in certain countries. Other risks associated with international operations include
import and export licensing requirements, trade restrictions, exchange controls and changes in tariff and freight
rates. As a result of these conditions, an inability to successfully manage our international operations could have
a material adverse impact on our operations.
We have made investments in and are expanding our business into emerging markets and regions, which
exposes us to new risks.
During 2006 and 2005 we began expanding our business in emerging markets in Asia and we expect to
continue to focus on growing our business in these regions. In addition to the currency and international
operation risks described above, our international operations are subject to a variety of risks including risks
arising out of the economy, the political outlook and the language and cultural barriers in countries where we
have operations or do business. In many of these emerging markets, we may be faced with several risks that are
more significant than in the other countries in which we have a history of doing business. These risks include
economies that may be dependent on only a few products and are therefore subject to significant fluctuations,
10
weak legal systems which may affect our ability to enforce contractual rights, possible exchange controls,
unstable governments, privatization actions or other government actions affecting the flow of goods and
currency. In conducting our business we move products from one country to another and may provide services in
one country from a subsidiary located in another country. Accordingly, we are vulnerable to abrupt changes in
customs and tax regimes that may have significant negative impacts on our financial condition and operating
results.
Our business in countries with a history of corruption and transactions with foreign governments
increases the risks associated with our international activities.
As we operate and sell internationally, we are subject to the U.S. Foreign Corrupt Practices Act, or the
FCPA, and other laws that prohibit improper payments or offers of payments to foreign governments and their
officials and political parties by U.S. and other business entities for the purpose of obtaining or retaining
business. We have operations, agreements with third parties and make sales in countries known to experience
corruption. Further international expansion may involve more exposure to such practices. Our activities in these
countries create the risk of unauthorized payments or offers of payments by one of our employees, consultants,
sales agents or distributors that could be in violation of various laws including the FCPA, even though these
parties are not always subject to our control. It is our policy to implement safeguards to discourage these
practices by our employees. However, our existing safeguards and any future improvements may prove to be less
than effective, and our employees, consultants, sales agents or distributors may engage in conduct for which we
might be held responsible. Violations of the FCPA may result in severe criminal or civil sanctions, and we may
be subject to other liabilities, which could negatively affect our business, operating results and financial
condition.
Our success depends on the continued employment of our key personnel, any of whom we may lose at any
time.
Our senior management consists of an Executive Committee comprised of our most senior executives
responsible for core functions, the Chairman of which is Mr. Peer Schatz, our Chief Executive Officer. The loss
of Mr. Schatz or any of our Managing Directors could have a material adverse effect on us. Further, although we
have not experienced any difficulties attracting or retaining key management and scientific staff, our ability to
recruit and retain qualified skilled personnel will also be critical to our success. Due to the intense competition
for experienced scientists from numerous pharmaceutical and biotechnology companies and academic and other
research institutions, there can be no assurance that we will be able to attract and retain such personnel on
acceptable terms. Our planned activities will also require additional personnel, including management, with
expertise in areas such as manufacturing and marketing, and the development of such expertise by existing
management personnel. The inability to recruit such personnel or develop such expertise could have a material
adverse impact on our operations.
Our business may require substantial additional capital, which we may not be able to obtain on terms
acceptable to us, if at all.
Our future capital requirements and level of expenses will depend upon numerous factors, including the
costs associated with:
•
our marketing, sales and customer support efforts;
•
our research and development activities;
•
the expansion of our facilities;
•
the consummation of possible future acquisitions of technologies, products or businesses;
•
the demand for our products and services; and
•
the refinancing of debt.
11
We currently anticipate that our short-term capital requirements will be satisfied by the results of operations.
However, we have outstanding loan facilities at December 31, 2006 of approximately $496 million, of which
$6.6 million is due in June 2008, $39.6 million is due in annual installments from June 2006 through June 2011,
$150.0 million which will become due in August 2011, and $300.0 million which will become due in May 2013.
To the extent that our existing resources are insufficient to fund our activities, we may need to raise funds
through public or private debt or equity financings. No assurance can be given that such additional funds will be
available or, if available, can be obtained on terms acceptable to us. If adequate funds are not available, we may
have to reduce expenditures for research and development, production or marketing, which could have a material
adverse effect on our business. To the extent that additional capital is raised through the sale of equity or
convertible securities, the issuance of such securities could result in dilution to our shareholders.
Our strategic equity investments may result in losses.
We have made and may continue to make strategic investments in complementary businesses as the
opportunities arise. We periodically review the carrying value of these investments for impairment, considering
factors such as the most recent stock transactions, book values from the most recent financial statements, and
forecasts and expectations of the investee. The results of these valuations may fluctuate due to market conditions
and other conditions over which we have no control. Estimating the fair value of non-marketable equity
investments in life science companies is inherently subjective. If actual events differ from our assumptions and
other than temporary unfavorable fluctuations in the valuations of the investments are indicated, it could require
a write-down of the investment. This could result in future charges on our earnings that could materially impact
our results of operations. It is uncertain whether or not we will realize any long term benefits from these strategic
investments.
We have a significant amount of long-term debt which may adversely affect our financial condition.
We have a significant amount of debt which carries with it significant debt service obligations. A high level
of indebtedness increases the risk that we may default on our debt obligations. We cannot assure you that we will
be able to generate sufficient cash flow to pay the interest on our debt or that future working capital, borrowings
or equity financing will be available to repay or refinance such debt. If we are unable to generate sufficient cash
flow to pay the interest on our debt, we may have to delay or curtail our research and development programs. The
level of our indebtedness among other things could:
•
make it difficult for us to make required payments on our debt;
•
make it difficult for us to obtain any necessary financing in the future for working capital, capital
expenditures, debt service requirements or other purposes;
•
limit our flexibility in planning for, or reacting to, changes in our business and the industry in which we
compete; and
•
make us more vulnerable in the event of a downturn in our business.
Changing government regulations may adversely impact our business.
We and our customers operate in a highly regulated environment characterized by continuous changes in the
governing regulatory framework. Genetic research activities as well as products commonly referred to as
“genetically engineered,” such as certain food and therapeutic products, are subject to governmental regulation in
most developed countries, especially in the major markets for pharmaceutical and diagnostic products (i.e., the
European Union, the United States, and Japan). In the recent past, several highly publicized scientific successes
(most notably in the areas of genomic research and “cloning”) have stirred a public debate in which ethical,
philosophical and religious arguments have been raised against an unlimited expansion of genetic research and
the use of products developed thereby. As a result of this debate, some key countries might increase the existing
regulatory barriers; this, in turn, could adversely affect the demand for our products and prevent us from
12
fulfilling our growth expectations. Furthermore, there can be no assurance that any future changes of applicable
regulations will not require further expenditures or an alteration, suspension or liquidation of our operations in
certain areas, or even in their entirety.
Changes in the existing regulations or adoption of new requirements or policies could adversely affect our
ability to sell our approved products or to seek to introduce new products in other countries in the world. Sales
volumes of certain of our products in development may be dependent on commercial sales by us or by our
customers of diagnostic and pharmaceutical products, which will require pre-clinical studies and clinical trials
and other regulatory clearance. Such trials will be subject to extensive regulation by governmental authorities in
the United States, including the Food and Drug Administration (FDA), international agencies and agencies in
other countries with comparable responsibilities. These trials involve substantial uncertainties and could impact
customer demand for our products. In addition, certain of our products, especially products intended for use in
in-vitro diagnostics applications, are dependent on regulatory or other clearance. For example, since the
European Union Directive 98/79/EC on in vitro diagnostic medical devices, or EU-IvD-D, went into effect on
December 7, 2003, all products and kits which are used for in vitro diagnostic applications and which are sold
after this date have to be compliant with this European directive. In addition to high risk products such as HIV
testing systems (list A of Annex II of the directive) or blood glucose testing systems (list B of Annex II of the
directive), nucleic acid purification products which are used in diagnostic workflows are affected by this new
regulatory framework. The major goals of this directive are to standardize the diagnostic procedures within the
European Union, to increase reliability of diagnostic analysis and to enhance patients’ safety through the highest
level of product safety. These goals are expected to be achieved by the enactment of a large number of
mandatory regulations for product development, production, quality control and life cycle surveillance. Our
failing to obtain any required clearance or approvals may significantly damage our business in such segments.
Additionally, we may be required to incur significant costs to comply with laws and regulations in the future, and
changes or additions to existing laws or regulations may have a material adverse effect upon our business,
financial condition and results of operations.
We are subject to various laws and regulations generally applicable to businesses in the different
jurisdictions in which we operate, including laws and regulations applicable to the handling and disposal of
hazardous substances. We do not expect compliance with such laws to have a material effect on our capital
expenditures, earnings or competitive position. Although we believe that our procedures for handling and
disposing of hazardous materials comply with the standards prescribed by applicable regulations, the risk of
accidental contamination or injury from these materials cannot be completely eliminated. In the event of such an
accident, we could be held liable for any damages that result, and any such liability could have a material adverse
effect on us.
Risk of price controls is a threat to our profitability.
The ability of many of our customers to successfully market their products depends in part on the extent to
which reimbursement for the costs of these products is available from governmental health administrations,
private health insurers and other organizations. Governmental and other third party payers are increasingly
seeking to contain health care costs and to reduce the price of medical products and services. Therefore, the
biotechnology, diagnostics and pharmaceutical industries are exposed to the potential risk of price controls by
these entities. If there are not adequate reimbursement levels, the commercial success of our customers and,
hence, of QIAGEN itself, could be adversely affected.
Our business exposes us to potential liability.
The marketing and sale of our products and services for certain applications entail a potential risk of product
liability, and, although we are not currently subject to any material product liability claims, there can be no
assurance that product liability claims will not be brought against us. Further, there can be no assurance that our
products will not be included in unethical, illegal or inappropriate research or applications, which may in turn put
13
us at risk of litigation. We currently carry product liability insurance coverage, which is limited in scope and
amount, but which we believe is currently appropriate for our purposes. There can be no assurance, however, that
we will be able to maintain such insurance at reasonable cost and on reasonable terms, or that such insurance will
be adequate to protect us against any or all potential claims or losses.
Our holding company structure makes us dependent on the operations of our subsidiaries.
We were incorporated under Dutch law as a public limited liability company (naamloze venootschap) and
we are organized as a holding company. Currently, our material assets are the outstanding shares of our
subsidiaries. We, therefore, are dependent upon payments, dividends and distributions from our subsidiaries for
funds to pay our operating and other expenses and to pay future cash dividends or distributions, if any, to holders
of our common shares. The lending arrangements entered into by QIAGEN GmbH limits the amount of
distributions that can be made by QIAGEN GmbH to QIAGEN N.V. during the period the borrowings are
outstanding. This facility will expire in June 2011. Dividends or distributions by subsidiaries to us in a currency
other than the U.S. dollar may result in a loss upon a subsequent conversion or disposition of such foreign
currency, including a subsequent conversion into U.S. dollars.
Risks Related to Our Common Shares
Our common shares may have a volatile public trading price.
The market price of the common shares since our initial public offering in September 1996 has increased
significantly and been highly volatile. In the past two fiscal years, the closing price of our common shares has
ranged from a high of $16.15 to a low of $10.56 on the NASDAQ National Market System, and a high of EUR
13.09 to a low of EUR 8.20 on the Frankfurt Stock Exchange. In addition to overall stock market fluctuations,
factors which may have a significant impact on the market price of the common shares include:
•
announcements of technological innovations or the introduction of new products by us or our
competitors;
•
developments in our relationships with collaborative partners;
•
quarterly variations in our operating results or those of companies related to us;
•
changes in government regulations or patent laws;
•
developments in patent or other proprietary rights;
•
developments in government spending for life sciences related research; and
•
general market conditions relating to the diagnostics, applied testing, pharmaceutical and biotechnology
industries.
The stock market has from time to time experienced extreme price and trading volume fluctuations that have
particularly affected the market for technology-based companies and that have not necessarily been related to the
operating performance of such companies. These broad market fluctuations may adversely affect the market
price of our common shares.
Holders of our common shares will not receive dividend income.
We have not paid cash dividends since our inception and do not anticipate paying any cash dividends on our
common shares for the foreseeable future. Although we do not anticipate paying any cash dividends, any cash
dividends paid in a currency other than the U.S. dollar will be subject to the risk of foreign currency transaction
losses. Investors should not invest in our common shares if they are seeking dividend income; the only return that
may be realized through investing in our common shares is through the appreciation in value of such shares.
14
Shareholders who are United States residents could be subject to unfavorable tax treatment.
We may be classified as a “passive foreign investment company,” or PFIC, for U.S. federal income tax
purposes if certain tests are met. Our treatment as a PFIC could result in a reduction in the after-tax return to the
holders of common shares and would likely cause a reduction in the value of such shares. If we were determined
to be a PFIC for U.S. federal income tax purposes, highly complex rules would apply to our U.S. shareholders.
We would be considered a PFIC with respect to a U.S. shareholder if for any taxable year in which the U.S.
shareholder held the common shares, either (i) 75% or more of our gross income for the taxable year is passive
income; or (ii) the average value of our assets (during the taxable year) which produce or are held for the
production of passive income is at least 50% of the average value of all assets for such year. Based on our current
income, assets and activities, we do not believe that we are currently a PFIC. No assurances can be made,
however, that the IRS will not challenge this position or that we will not subsequently become a PFIC.
Future sales of our common shares could adversely affect our stock price.
Future sales of substantial amounts of our common shares in the public market, or the perception that such
sales may occur, could adversely affect the market price of the common shares. As of December 31, 2006, we
had outstanding 150,167,540 common shares plus 11.7 million additional shares subject to outstanding stock
options, of which 11.5 million were then exercisable. A total of approximately 17.7 million common shares are
reserved and available for issuances under our stock plan, including those shares subject to outstanding stock
options. The resale of common shares issued in connection with the exercise of certain stock options are subject
to some restrictions. All of our outstanding common shares are freely saleable except shares held by our
affiliates, which are subject to certain limitations on resale. Additionally, holders of notes issued by QIAGEN
Finance (Luxembourg) S.A. and QIAGEN Euro Finance (Luxembourg) S.A. are entitled to convert their notes
into approximately 26.9 million common shares, subject to adjustments in certain cases.
Provisions of our Articles of Association and Dutch law and an option we have granted may make it
difficult to replace or remove management and may inhibit or delay a takeover.
Our Articles of Association, or Articles, provide that our shareholders may only suspend or dismiss our
managing and supervisory directors against their wishes with a vote of two-thirds of the votes cast representing
more than 50% of the outstanding shares unless the proposal was made by the joint meeting of the Supervisory
Board and the Managing Board in which case a simple majority is sufficient. They also provide that if the
members of our Supervisory Board and our Managing Board have been nominated by the joint meeting of the
Supervisory Board and Managing Board, shareholders may only overrule this nomination with a vote of
two-thirds of the votes cast representing more than 50% of the outstanding shares. Certain other provisions of our
Articles allow us, under certain circumstances, to prevent a third party from obtaining a majority of the voting
control of our shares by issuing preference shares. Pursuant to these provisions and pursuant to the resolution
adopted by our general meeting on June 16, 2004, our Supervisory Board is authorized to issue preference shares
or grant rights to subscribe for preference shares if (i) a person has (directly or indirectly) acquired or has
expressed a desire to acquire, more than 20% of our issued share capital, or (ii) a person holding at least a 10%
interest in our share capital has been designated as a hostile person by our Supervisory Board. If the Supervisory
Board opposes an intended take-over and authorizes the issuance of preference shares, the bidder may withdraw
its bid or enter into negotiations with the Managing Board and /or Supervisory Board and agree on a higher bid
price for our shares.
In 2004 we also granted an option to a Foundation (Stichting), subject to the conditions described in the
paragraph above, which allows the Foundation to acquire preference shares from us. The option enables the
Foundation to acquire such number of preference shares as equals the number of our outstanding common shares
at the time of the relevant exercise of the right less one share. When exercising the option and exercising its
voting rights on such shares, the Foundation must act in our interest and the interests of our stakeholders. The
purpose of the Foundation option is to prevent or delay a change of control that would not be in the best interests
of us and our stakeholders. See “Description of Share Capital—Preference Shares.”
15
United States civil liabilities may not be enforceable against us.
We are incorporated under the laws of The Netherlands and substantial portions of our assets are located
outside of the United States. In addition, certain members of our Managing and Supervisory Boards, our officers
and certain experts named herein reside outside the United States. As a result, it may be difficult for investors to
effect service of process within the United States upon us or such other persons, or to enforce outside the U.S.
judgments obtained against such persons in U.S. courts, in any action, including actions predicated upon the civil
liability provisions of U.S. securities laws. In addition, it may be difficult for investors to enforce, in original
actions brought in courts in jurisdictions located outside the United States, rights predicated upon the U.S.
securities laws. There is no treaty between the United States and The Netherlands for the mutual recognition and
enforcement of judgments (other than arbitration awards) in civil and commercial matters. Therefore, a final
judgment for the payment of money rendered by any federal or state court in the United States based on civil
liability, whether or not predicated solely upon the federal securities laws, would not be directly enforceable in
The Netherlands. However, if the party in whose favor such final judgment is rendered brings a new suit in a
competent court in The Netherlands, such party may submit to the Dutch court the final judgment which has been
rendered in the United States. If the Dutch court finds that the jurisdiction of the federal or state court in the
United States has been based on grounds which are internationally acceptable and that proper legal procedures
have been observed, the Dutch court will, in principle, give binding effect to the final judgment which has been
rendered in the United States unless such judgment contravenes Dutch principles of public policy. Based on the
foregoing, there can be no assurance that U.S. investors will be able to enforce against us, members of our
Managing or Supervisory Boards, officers or certain experts named herein who are residents of The Netherlands
or countries other than the United States any judgments obtained in U.S. courts in civil and commercial matters,
including judgments under the federal securities laws. In addition, there is doubt as to whether a Dutch court
would impose civil liability on us, the members of our Managing or Supervisory Boards, our officers or certain
experts named herein in an original action predicated solely upon the federal securities laws of the United States
brought in a court of competent jurisdiction in The Netherlands against us or such members, officers or experts,
respectively.
Item 4.
Information on the Company
History and Development of the Company
We began operations as a German company in 1986. On April 29, 1996, we were incorporated as QIAGEN
N.V., a public limited liability company (naamloze vennnootschap) under Dutch law as a holding company for
our wholly owned subsidiaries. Our legal seat is in Venlo, The Netherlands. As a holding company, we conduct
our business through our subsidiaries located throughout Europe, Japan, Australia, North America and East Asia.
Our principal executive office is located at Spoorstraat 50, 5911 KJ Venlo, The Netherlands, and our telephone
number is +31-77-320-8400. Our website is www.qiagen.com.
Since 1986, we have developed and marketed a broad range of proprietary products for the academic and
industrial research markets as well as for the applied testing market, which includes forensics, veterinary
diagnostics, genetically modified organisms, or GMO, and other food testing, and molecular diagnostics markets.
We have experienced significant growth in the past, with a five year compound annual growth through
December 31, 2006 of approximately 12% in net sales and 16% in net income, as reported under U.S. GAAP. In
the last five years we have made a number of strategic acquisitions and have also restructured some of our key
operations. Significant events in the development of our business in 2006 include:
•
In the fourth quarter of 2006, we completed the acquisition of Genaco Biomedical Products, Inc.,
located in Huntsville, Alabama. Genaco is an early-stage company applying a proprietary assay
technology called multiplexing, a diagnostic approach which allows for screening multiple targets in
one single test. Multiplexing is a rapidly emerging segment in molecular diagnostics and which we
believe is highly synergistic with our portfolio of qPCR-based molecular diagnostic assays considered
by some to be the broadest in the world in the segment of infectious disease diagnostics. The Genaco
solutions together with our sample and assay technologies support PCR-based, multiplexed testing in
16
clinical research, applied testing and molecular diagnostics. In the fourth quarter of 2006, we also
acquired former distributors PhileKoreaTechnology Inc., located in Daejeon, Korea and ATC Health
Products Ltd., located in Ankara, Turkey.
•
In the second quarter of 2006, we completed the acquisitions of Gentra Systems, Inc., located in
Minneapolis, Minnesota, Singapore-based Research Biolabs Pte. Ltd. and Research Biolabs Sdn Bhd,
located in Malaysia. Gentra is a leading developer, manufacturer and supplier of non-solid phase nucleic
acid purification products, providing both consumables and automated platforms. The acquisition
expands our position as a leading provider of sample and assay solutions to research customers from life
sciences, molecular diagnostics and applied testing. The acquisition of Research Biolabs, previously our
distributor, expands our direct presence in one of the most dynamic regions of our global business.
Research Biolabs currently has sales and marketing teams in Singapore, Malaysia and Indonesia, and
will also support market development in Thailand and Vietnam.
•
During the first quarter of 2006, we completed two acquisitions. We acquired PG Biotech Co. Ltd. (PG
Biotech) a leading developer, manufacturer and supplier of polymerase chain reaction, or PCR,-based
molecular diagnostic kits in China. The acquisition is intended to support our position as a leading
provider of molecular diagnostics solutions to OEM partners and customers in the rapidly growing
Asian markets. We also acquired certain assets and operations from Diatech s.r.l., Jesi, Italy, which
distributes in Italy products produced by artus, which we acquired in 2005.
Business Overview
Description of Our Business
We believe that we are the world’s leading provider of innovative technologies and products for
preanalytical sample preparation and linked molecular assay solutions. This belief is based on the nature of our
products and technologies and on our United States and European market shares as supported by independent
market studies. We operate exclusively in life sciences-related industries, and develop, manufacture and market a
broad portfolio of proprietary technologies and products, which meet the needs of markets including academic
and industrial research, applied testing and molecular diagnostics.
Our products standardize workflows and enable customers to reliably and rapidly process samples from
collection through to purification of the target molecule, such as nucleic acids or proteins, without using
hazardous reagents or expensive equipment.
We have developed or acquired a core set of technologies to provide a comprehensive approach to
pre-analytical sample processing. These technologies can be used alone or in combination to achieve the best
solution for a given application. In particular, our proprietary technologies for magnetic particle-based
purification, solid-phase anion-exchange purification and selective adsorption to silica particles or membranes
significantly enhance nucleic acid purification, the most difficult, critical, and labor intensive step in nucleic acid
isolation. We believe that our technologies represent substantial advances in the speed, reliability, and ease of use
of nucleic acid separation and purification procedures and the purity and yield of the resulting nucleic acids. We
believe that we are the world’s leading provider in the business of sample preparation with a market share of
approximately 70%.
Our Products
We offer over 500 products for a variety of applications in the handling, separation, purification, and
subsequent use of nucleic acids and proteins. These sample and assay technologies enable our customers to
efficiently pursue their research and commercial goals. The main categories of our products include:
•
Consumables: We offer most of our sample and assay consumable products, which account for about
90% of our business, in kit form to maximize customer convenience and reduce user error. These kits
17
contain our proprietary disposable sample processing devices and/or other proprietary technologies, all
necessary reagents and buffers, and a technical handbook that includes a detailed protocol and
background information. Each kit includes devices and reagents for a specified number of preparations
ranging from one to thousands. Each kit is covered by our quality guarantee. Major applications for our
consumable products are plasmid deoxyribonucleic acid, or DNA, purification; ribonucleic acid, or
RNA, stabilization and purification; genomic and viral nucleic acid purification; nucleic acid
transfection; PCR amplification; reverse transcription; DNA cleanup after PCR and sequencing; DNA
cloning and protein purification. In 2005, we began offering validated PCR assays which allow
PCR-based detection of viral, bacterial and parasite, human and animal pathogens as well as
pharmacogenomic genotyping. The majority of assays are validated with either manual QIAamp sample
preparation or automated MagAttract sample preparation from QIAGEN and CE-labeled according to
the IvD-Directive in EU. During 2006, we developed and launched 67 new products including
innovative sample and assay technologies for research in the areas of epigenetics, gene expression,
micro RNA, proteomics, RNAi and molecular diagnostics.
•
Instrumentation: Our BioRobot systems offer walk-away automation of sample and assay
technologies in low, medium or high throughput scale, as well as reaction set-up and other laboratory
tasks. We also sell instruments to our OEM partners. In early 2007, we launched the QIAcube, a novel
sample processing platform incorporating novel and proprietary technologies which allow users in
research in life sciences, applied testing and molecular diagnostics to fully automate the processing of
almost all our consumable products. The QIAcube received the distinguished New Product Award, or
NPA, Designation of the Association for Laboratory Automation, or ALA, in February, 2007.
•
Other: A very small part of our business revenues comes from custom services, siRNA synthesis,
whole genome amplification services, DNA sequencing, and non-cGMP DNA production on a contract
basis. We also sell and/or license technology.
Research and Development
Our product development efforts are focused on expanding our existing products and developing innovative
new products in selected areas where we have expertise and have identified substantial unmet market needs. We
intend to maintain our technology leadership position through investments in product improvements, product
extensions, and innovative new approaches. We believe that improvements in instrumentation will strengthen our
leadership position in the automation of pre-analytical processing applications and generate an increased demand
for our consumable products.
Our research and development organization is matrix structured and is overseen by our Senior Vice
President of Research & Development. We conduct most of our research and development activities in Germany,
Switzerland and the United States. Our organization structure allows us flexibility to refocus our product
development efforts as new technologies or markets emerge. Our total number of research and development
employees at December 31, 2006 was 332. Our total research and development expenses in 2006, 2005 and 2004
were approximately $41.6 million, $35.8 million, and $34.4 million, respectively.
Sales and Marketing
We market our products in more than 40 countries throughout the world. We have subsidiaries throughout
the world in the markets that we believe have the greatest sales potential. We have established a network of
highly experienced marketing personnel and employ a dedicated field sales force of over 700 people, who sell
our products and provide direct support to customers. A significant number of our marketing and sales staff are
experienced scientists with academic degrees in molecular biology or related areas. We also have specialized
independent distributors and importers serving more than 40 countries.
Our marketing strategy is focused on providing high-quality products that offer customers unique
advantages, coupled with a commitment to technical excellence and customer service. We have developed a
18
range of marketing tools designed to provide customers with direct access to technical support and inform them
of new product offerings. One such tool is our technical service hotline, which allows existing or potential
customers to discuss, via phone and e-mail, a wide range of technical questions regarding our products and
related molecular biology procedures with Ph.D. and M.Sc. scientists in our technical service group, who provide
this advice and training. Frequent communication with customers enables us to identify market needs, to gain
early insight into new developments and business opportunities, and to respond with new products. We also
distribute several publications, including our annual catalog, to existing and potential customers worldwide,
providing new product information, product updates, and articles contributed by customers and by our scientists
about existing and new applications for our products. In addition, we advertise in leading scientific journals such
as Science, and hold numerous scientific seminars, in which our scientists present technical information at
leading academic and industrial research institutes worldwide. We conduct direct mail campaigns to announce
new products or offer special sales promotions, and also offer a personalized bi-monthly electronic newsletter for
our worldwide customers that provides helpful hints and information for molecular biology applications. Our
web site (www.qiagen.com) contains a full on-line product catalog and online ordering system, various support
tools and resources. Some information is available on our website in French and German to support these local
markets. We also have a Japanese language site (www.qiagen.co.jp). The information contained in, or that can be
accessed through, our website is not part of this Annual Report.
In addition to keeping our customers informed of new product offerings, we also offer an inventory
consignment program. The QIAcabinet is a storage cabinet owned by us and placed in customer laboratories at
their request. The QIAcabinet is stocked with our products, offering customers the convenience of immediate
access, thereby reducing product reorder procedures and shipping costs. We monitor cabinet inventory and bill
the customers at regular intervals as the products are used. We believe that our QIAcabinet helps us maintain our
competitive position, while also reducing distribution costs and increasing our visibility in the laboratory.
Principal Markets
From our inception, we have believed that nucleic acids and proteins would play an increasingly important
role in molecular biology and that major new commercial uses of nucleic acids would be developed. We have
been supplying customers with proprietary products for the processing of nucleic acids since 1986. Customers
include major academic institutions and governmental laboratories such as the United States National Institutes
of Health, or NIH, as well as leading pharmaceutical and biotechnology companies. In addition, fundamental
developments in recent years have created significant new opportunities for us in the emerging markets of
nucleic acid-based molecular diagnostics, and applied testing such as forensics, veterinary diagnostics, testing of
GMO and other food testing. In response to these opportunities, we are currently targeting our products and
marketing activities to each of these markets.
Research Market
The worldwide research market for nucleic acid and protein separation and purification products is
comprised of an estimated 45,000 academic and industrial research laboratories with more than 400,000
researchers from leading academic institutions, diagnostics companies and laboratories, biotechnology
companies and pharmaceutical companies. A substantial portion of this market continues to utilize traditional,
labor intensive methods for nucleic acid separation and purification, and we estimate that 15 percent of all
molecular biology research time is spent on such processes. We recognized early on the opportunity to replace
the traditional methods with reliable, fast, and high-quality nucleic acid separation and purification technologies
and products. We concentrated our product development and marketing efforts on this market and now offer over
500 nucleic acid sample processing products to customers. We also offer a broad and innovative portfolio for the
expression, purification and fractionation of proteins. We believe that we are the technology leader in this
growing research market and that we are well positioned to increase sales and expand our share of the research
market as laboratories continue to convert from traditional methods to newer technologies such as ours. Based on
estimates of the number of sample preparations being performed each year, we believe that the potential
19
worldwide research market for our nucleic acid purification products exceeds $1 billion, as the majority of the
market currently uses home-brew methodology. In addition, we believe that an additional $800 million is spent
annually in this market on PCR enzymes and reagents. We have expanded our product base for PCR
amplification and reverse transcription and continue to develop products for the PCR-related market segment. In
2005 we were one of the first companies to enter into a broad licensing agreement with Applied Biosystems
Group regarding real-time PCR technology. This agreement enhances our value as a leading supplier of a broad
range of real-time PCR technologies. These real-time PCR technologies are optimized for use with our marketand technology-leading preanalytical solutions. Our PCR reagent portfolio is also a critical component for
ready-to-use real-time PCR assays which we offer and which are linked to our innovative RNAi assay offering.
Nucleic Acid-Based Molecular Diagnostics Market
We believe that the molecular diagnostics market represents a significant market for nucleic acid separation
and purification products. We believe that the advent of PCR and other amplification technologies has made the
prospect of nucleic acid-based molecular diagnostics feasible. Nucleic acid-based molecular diagnostics have
fundamental advantages over traditional diagnostic technologies such as immunoassays in time specificity and
sensitivity. This new generation of molecular diagnostics can be used, for example, to detect or identify microorganisms, cancer cells, bacteria and viruses (including HIV) by searching for their nucleic acid sequences. In
order to prove that a disease is present in a patient, the unique sequence of the target nucleic acid causing the
disease must be known, and the sequence in the sample must be amplified to facilitate detection. Potential
commercial applications for nucleic acid-based molecular diagnostics include infectious disease diagnostics in
bio banks, HLA typing for bone marrow and organ transplantation, genetic testing for predisposition to cancers
and other common diseases, and genetic “fingerprinting” of humans, animals and plants.
The success of nucleic acid-based molecular diagnostics will depend on the ability to analyze purified
nucleic acid samples from a variety of specimens, including blood, tissue, body fluids and stool, and on
automation so that hundreds of samples can be handled concurrently. Other key factors will be the convenience,
versatility, and reliability of the nucleic acid separation and purification procedures. Our BioRobot series has
been developed to handle low-, medium-, and high-throughput nucleic acid sample preparation and handling
tasks in molecular biology laboratories, clinical laboratories, blood banks, forensic projects, and genomics
projects. Nucleic acid samples purified on our instruments are ready for use in the demanding and sensitive
downstream assays performed in molecular diagnostic applications. We offer closed and open assay
technologies. The open platforms, such as RT-PCR or Endpoint PCR, contain PCR reagents. Closed platforms,
diagnostics with predefined targets, include Multiplexing and other pathogen detection assays. In order to
broadly address the molecular diagnostics market, in May 2005 we acquired artus, subsequently renamed
QIAGEN Hamburg GmbH, which offers a broad range of real-time PCR assays for viral and bacterial pathogen
detection that are complementary to our sample preparation kits. The majority of these assays are validated with
either manual QIAamp sample preparation or automated MagAttract sample preparation and CE-labeled
according to the EU-IvD-D. Assays are marketed directly to end customers by our sales channels and selected
assays are marketed by major diagnostic partners with access to customers complementary to our customers. All
assays are PCR-licensed for human diagnostic and veterinary diagnostic purposes and provide all features such
controls, ready-to-use reagents and comprehensive technical documentation needed in a routine diagnostic
testing environment. In addition, we intend to enter into partnerships or other agreements with established
companies in the molecular diagnostics market in order to broaden the distribution of our products.
Applied Testing Market
We believe that emerging applied testing markets such as forensics, veterinary and food, offer great
opportunities for standardized sample preparation and assay solutions. Successes in crime cases due to DNA
analyses, public debates about GMO and food safety as well as bioterrorism risks, have increased the value of the
use of molecular based methods. These methods are performed by well trained researchers in fully equipped
laboratories as well as by less trained personnel calling for easy-to-use, reproducible and standardized methods.
20
Our manual DNA and RNA purification methods and the automated solutions on BioRobot EZ1, BioSprint 15
and 96, as well as our amplification enzymes and quantitative assays address the needs in these markets. We
market a range of assays to end users in applied testing markets such as veterinary diagnostics and biodefense
laboratories.
Seasonality
Our business does not experience predictable seasonality. Historically, a significant portion of our sales
have been to researchers, universities, government laboratories and private foundations whose funding is
dependent upon grants from government agencies such as the U.S. NIH and similar domestic and international
agencies. To the extent that our academic customers experience increases, decreases or delays in funding
arrangements, and to the extent that any of our customers’ activities are slowed, such as during vacation periods
or due to delays in the approval of governmental budgets, including the U.S. federal government’s budget, we
may experience fluctuations in sales volumes during the year or delays from one period to the next in the
recognition of sales.
Revenue by Geographic Region
The table below sets forth total revenue during each of the past three fiscal years by geographical market,
which includes revenue from all our product and service offerings. It is not practicable to provide a detail of
revenues by category of activity. Net sales are attributed to countries based on the location of the subsidiary
making the sale as certain subsidiaries have international distribution. See Note 21 to our consolidated financial
statements included in “Item 18. Financial Statements” for additional information with respect to operations by
geographic region.
Net Sales
North America* . . . . . . . . . . . . . . . . . . . . . . . . . .
Germany* . . . . . . . . . . . . . . . . . . . . . . . . . . . . . .
Switzerland* . . . . . . . . . . . . . . . . . . . . . . . . . . . .
Asia* . . . . . . . . . . . . . . . . . . . . . . . . . . . . . . . . . .
Rest of World* . . . . . . . . . . . . . . . . . . . . . . . . . .
Corporate* . . . . . . . . . . . . . . . . . . . . . . . . . . . . . .
2006
2005
2004
$ 318,865,000
220,325,000
40,044,000
49,875,000
109,025,000
525,000
$ 285,242,000
187,381,000
36,957,000
35,266,000
88,924,000
985,000
$ 284,393,000
163,841,000
37,936,000
41,563,000
74,117,000
65,000
738,659,000
(272,881,000)
Subtotal . . . . . . . . . . . . . . . . . . . . . . . . . . . . . . . .
Intersegment Elimination+ . . . . . . . . . . . . . . . . .
$ 465,778,000
Total . . . . . . . . . . . . . . . . . . . . . . . . . . . . . .
634,755,000
(236,360,000)
$ 398,395,000
601,915,000
(221,286,000)
$ 380,629,000
* Includes net sales to affiliates.
+ Represents intercompany sales between affiliates, which are accounted for by a formula based on local
list prices and eliminated in consolidation.
Intellectual Property, Proprietary Rights and Licenses
We do not depend on any individual patent or technologies owned or licensed by us. We are however
significantly dependent in the aggregate on technology that we own or license. Therefore, we consider the
protection of our proprietary technologies and products for the separation and purification of nucleic acids as the
key to the success of our business. We rely on a combination of patents, licenses and trademarks to establish and
protect our proprietary rights in our technologies and products. We currently own 89 issued patents in the United
States, 56 issued patents in Germany and 327 issued patents in other major industrialized countries, and have 452
pending patent applications. Worldwide, we own 472 granted patents. Our policy is to file patent applications in
Western Europe, the United States and Japan. U.S. patents have a term of 17 years from the date of issue for
patents issued from applications submitted prior to June 8, 1995, and 20 years from the date of filing of the
application in the case of patents issued from applications submitted on or after June 8, 1995. Patents in most
21
other countries have a term of 20 years from the date of filing the patent application. We intend to aggressively
prosecute and enforce our patents and otherwise protect our proprietary technologies. We also rely on trade
secrets, know-how, continuing technological innovation and licensing opportunities to develop and maintain our
competitive position.
Our practice is to require employees, consultants, outside scientific collaborators, sponsored researchers and
other advisors to execute confidentiality agreements upon the commencement of their relationships with us.
These agreements provide that all confidential information developed by or made known to the individual during
the course of the individual’s relationship with us is to be kept confidential and not disclosed to third parties,
subject to a right to publish certain information in scientific literature in certain circumstances and to other
specific exceptions. In the case of our employees, the agreements provide that all inventions conceived by the
individual in the course of their employment will be our exclusive property.
See “Risk Factors” included in Item 3 above for details regarding risks related to our reliance on patents and
proprietary rights.
Partnerships, Alliances and Acquisitions
Our strategy includes the use of strategic alliances to augment our product development efforts with
complementary technologies and to leverage our marketing and distribution capabilities with respect to select
market opportunities. In order to expand our business, we also intend to continue to pursue strategic investments
in or acquisitions of complementary businesses and technologies as the opportunities arise. We currently develop
integrated solutions for and together with 15 manufacturers from pharma and diagnostics, including Roche
Diagnostics, Abbott Laboratories and Bayer.
Competition
We believe that our primary competition involves traditional separation and purification methods, such as
phenol extraction, cesium chloride density gradient centrifugation, and precipitation. These methods utilize
widely available reagents and other chemicals supplied by companies such as Sigma-Aldrich Corp. and Roche
Diagnostics GmbH (Applied Sciences Division). We compete with such methods through our innovative
technologies and products, which offer a comprehensive solution for nucleic acid collection, pre-treatment,
separation and purification needs and provide significant advantages over traditional methods with respect to
speed, reliability, convenience, and ease of use.
We also experience, and expect to continue to experience, competition in different segments of our business
from other companies providing sample preparation products in kit form and assay solutions. These competitors
include: Promega Corp., Invitrogen Corp., Millipore Corp., Roche Diagnostics, and Macherey-Nagel GmbH for
nucleic acid separation and purification; Applied Biosystems, Invitrogen Corp. and Promega Corp for assay
solutions; Invitrogen Corp. and Promega Corp. for transfection reagents, Sigma-Aldrich Corp. and Fisher
Scientific for protein fractionation products. We believe that our proprietary technologies and products offer
significant advantages over competitors’ products with regard to purity, speed, reliability, and ease-of-use.
We believe that our competitors do not have the same comprehensive approach to pre-analytical solutions,
including nucleic acid sample processing and therefore cannot provide the broad range of technologies and depth
of products and services that we offer. With our complete range of manual and fully automated solutions, we
believe we offer the value of standardization of procedures and therefore more reliable results. We also believe
that our integrated strategic approach of sample and assay technologies gives us a competitive advantage. The
quality of sample preparation—a field in which we have a unique market and leadership position—is a key
prerequisite for reliable molecular assay solutions which increasingly are being applied in emerging markets such
as applied testing and molecular diagnostics.
22
Our continued future success will rely in large part on our ability to maintain our technological advantage
over competing products, expand our market presence and preserve customer loyalty. There can be no assurance
that we will be able to compete effectively against our past, present or future competitors or that developments
by others will not render our technologies or products non-competitive.
Suppliers
We buy materials for our products from many suppliers, and are not dependent on any one supplier or group
of suppliers for our business as a whole. Raw materials generally include chemicals, raw separation media,
biologics, plastics and packaging. Raw materials are generally readily available at competitive, stable prices from
a number of suppliers. Certain raw materials are produced under our specifications, so we closely monitor stock
levels to maintain adequate supplies. We believe we maintain inventories of raw materials at a sufficient level to
ensure reasonable customer service levels, and to guard against normal volatility in availability.
Government Regulations
We are not subject to direct regulation other than regulation generally applicable to businesses pursuant to
various laws and regulations in effect in the different jurisdictions in which we operate, including laws and
regulations applicable to environmental matters, such as the handling and disposal of hazardous wastes. Our
research and development activities involve the controlled use of small amounts of hazardous materials,
chemicals and radioactive compounds. Although we believe that our safety procedures for handling and
disposing of such materials comply with the standards prescribed by applicable regulations, such as the United
States Occupational Safety and Health Administration’s, or OSHA, Hazard Communication and Occupational
Exposure to Hazardous Chemicals in Laboratories standards, the risk of accidental contamination or injury from
these materials cannot be completely eliminated. In the event of such an accident, we could be held liable for any
damages that result and any such liability could have a material adverse effect on us.
We also comply with the OSHA Bloodborne Pathogens standard and the Center for Disease Control/
National Institutes of Health Biosafety in Microbiological and Biomedical Laboratories standards for the
handling of biological materials as well as comply with the United States Department of Transportation and
International Air Transport Association regulations for the shipping of our kits which contain materials classified
as hazardous. There are other federal, state and local laws and regulations applicable to our business, including
those of the United States Environmental Protection Agency and the Maryland Department of the Environment.
However, we do not expect that compliance with governmental regulations to which we are subject will have a
material effect on our capital expenditures, earnings or competitive positions.
Sales volumes of certain of our products in development may be dependent on commercial sales by our
customers of diagnostic and pharmaceutical products, which will require preclinical studies and clinical trials and
other regulatory requirements. Trials will be subject to extensive regulation by governmental authorities in the
United States, including the Food and Drug Administration, or FDA, and equivalent agencies in other countries,
and involve substantial uncertainties. In addition, certain of our products, especially products intended for use in
in-vitro diagnostics applications, are dependent on regulatory or other clearance. For example, as of December 7,
2003, all in vitro diagnostic products sold in the European Union had to bear the CE mark, which indicates
compliance with the requirements of the EU-IvD-D. We also expect to seek FDA approvals in 2007. Our failing
to obtain such clearance or approvals can significantly damage our business in such segments.
Organizational Structure
QIAGEN N.V. is the holding company for 37 consolidated subsidiaries, the majority of which have the
primary function of the distribution of our products and services on a regional basis. Certain subsidiaries also
have research and development or production activities. A listing of our significant subsidiaries, all of which are
wholly owned, and their jurisdiction of incorporation, is included in Exhibit 8.1 to this Annual Report.
23
Description of Property
Our production and manufacturing facilities for consumables products are located in Germany, the United
States and China. Our instrument production facility is located in Switzerland. Over the last several years, we
have made investments in automated and interchangeable production equipment to increase our production
capacity and improve efficiency. For Good Manufacturing Practice, or GMP, production, special areas were built
in our facilities in Germany at Hilden and Erkrath. Our production and manufacturing operations are highly
integrated and benefit from sophisticated inventory control. We have also installed and continue to expand
production-planning systems that are included in our integrated information and control system based on the
business software package SAP R/3 from SAP AG. Worldwide, we use SAP software to integrate our material
operating subsidiaries. Our production management personnel are highly qualified and many have engineering
degrees.
The consumable products manufactured at QIAGEN GmbH and QIAGEN Hamburg GmbH, both in
Germany, and QIAGEN Sciences, Inc. in Maryland are produced under ISO 9001: 2000, ISO 13485:2003 for
Medical Devices, and ISO 13485:2003 CMDCAS. QIAGEN Hamburg GmbH also has been certified under the
EC Directive 98/79/EC for medical devices. QIAGEN Instruments AG in Switzerland, which produces the
majority of our instrumentation product line, is also ISO 9001 : 2000 and 13485:2003 certified. Our certifications
form part of our ongoing commitment to provide our customers high quality, state-of-the-art sample and
assay technologies and to the development of our Total Quality Management system.
Our facilities in Hilden, Germany currently occupy a total of approximately 530,000 square feet, some of
which is leased pursuant to separate contracts expiring between the years 2006 and 2018. In two separate
transactions between July 1997 and February 1998, we purchased a parcel of land directly adjacent to our
existing German facilities, measuring approximately 549,000 square feet. During 2003, we completed a 115,000
square foot production facility and a 149,000 square foot administration building on this land at a cost of EUR
55.4 million (approximately $69.8 million). During 2005, we purchased our leased cGMP production facilities in
Germany and began the planning for a new logistics center in Hilden. Construction on the new facility began in
August 2006 and be completed by the second quarter of 2007. The new logistics center will occupy
approximately 61,000 square feet and will cost an estimated EUR 9.0 million, of which EUR 6.4 million
(approximately $8.2 million) had been incurred at December 31, 2006.
We increased our production capacity with the establishment of a manufacturing and research facility in the
United States. In 1999, QIAGEN Sciences, Inc. purchased an 18-acre site for approximately $3.2 million in
Germantown, Maryland. Construction began in March 2000, and in November 2000 QIAGEN Sciences
exercised the option to purchase an additional adjacent lot of approximately 6 acres for $1.2 million. The
purchase of this additional lot allows for future expansion of up to 400,000 square feet of additional facility
space. Construction was financed primarily by intercompany loans and long-term bank debt. Early in 2002,
construction on the manufacturing portion of the facility was completed at a cost of approximately $57.5 million.
The 200,000 square foot Maryland facility consists of several buildings in a campus-like arrangement and is
intended to accommodate over 300 employees. Construction of siRNA/RNA research and development lab and
production space, as well as additional office space, was completed in the first quarter of 2003 at a cost of
approximately $3.9 million. QIAGEN Sciences is integrated with our other North American and European
subsidiaries through our SAP business information systems and utilizes production-planning, quality
management and inventory management modules from SAP in order to increase efficiency.
Our corporate headquarters are located in leased office space in Venlo, The Netherlands. Other subsidiaries
throughout the world lease small amounts of space. Capital expenditures for property, plant and equipment
totaled $29.0 million, $13.7 million, and $12.6 million for the years ended December 31, 2006, 2005 and 2004.
We believe that our existing and planned production and distribution facilities can support our anticipated
production needs for the next 36 months. Our production and manufacturing operations are subject to various
federal, state, and local laws and regulations including environmental regulations. We believe we do not have any
material issues relating to these laws and regulations.
24
Item 4A. Unresolved Staff Comments
Not applicable.
Item 5.
Operating and Financial Review and Prospects
This section contains a number of forward-looking statements. These statements are based on current
management expectations, and actual results may differ materially. Among the factors that could cause actual
results to differ from management’s expectations are those described in “Risk Factors” above, and “Business
Factors” below.
Business Factors
This report contains forward-looking statements that are subject to certain risks and uncertainties. These
statements can be identified by the use of forward-looking terminology such as “believe,” “hope,” “plan,”
“intend,” “seek,” “may,’ “will,” “could,” “should,” “would,” “expect,” “anticipate,” “estimate,” “continue” or
other similar words. Such statements are based on management’s current expectations and are subject to a
number of factors and uncertainties that could cause actual results to differ materially from those described in the
forward-looking statements. We caution investors that there can be no assurance that actual results or business
conditions will not differ materially from those projected or suggested in such forward-looking statements as a
result of various factors, including, but not limited to, the following: risks associated with our expansion of
operations, including the acquisition of new companies; variability in our operating results from quarter to
quarter; management of growth, international operations, and dependence on key personnel; intense competition;
technological change; our ability to develop and protect proprietary products and technologies and to enter into
collaborative commercial relationships; our future capital requirements; general economic conditions and capital
market fluctuations; and uncertainties as to the extent of future government regulation of our business. As a
result, our future development efforts involve a high degree of risk. For further information, refer to the more
specific risks and uncertainties discussed under the caption “Risk Factors” in Item 3 and throughout this
Form 20-F.
Results of Operations
Overview
We believe that we are the leading provider of innovative technologies and products for preanalytical
sample preparation and linked molecular assay solutions, based on the nature of our products and technologies
and on our United States and European market shares as supported by independent market studies. We have
developed a comprehensive portfolio of more than 500 proprietary consumable products and automated solutions
for sample collection, and nucleic acid and protein handling, separation, and purification. We also supply
diagnostic kits, tests, and assays for human and veterinary molecular diagnostics. Our products are sold to
academic research markets, and to leading pharmaceutical and biotechnology companies as well as to diagnostics
laboratories. We also provide purification and testing solutions to applied testing markets such as forensics,
animal and food testing, and pharmaceutical process control. We employ more than 1,900 people worldwide. We
sell our products through a dedicated sales force and a global network of distributors in more than 40 countries.
Since 2001, we have had compound annual growth rate of approximately 13% in net sales and 24% in net
income based on reported U.S. GAAP results. We have funded our growth through internally generated funds,
debt, and private and public sales of equity securities. In recent years, we have made a number of strategic
acquisitions and disposals expanding and focusing our technology and product offerings.
These transactions include:
•
In the fourth quarter of 2006, we completed the acquisition of Genaco Biomedical Products, Inc.,
located in Huntsville, Alabama. Genaco is an early-stage company applying a proprietary PCR-based
25
multiplexing technology, Tem-PCR, to develop Templex™ molecular diagnostic tests. Multiplexing is a
rapidly emerging segment in molecular diagnostics and is also highly synergistic with our portfolio of
qPCR-based molecular diagnostic assays which in the segment of infectious disease diagnostics is
considered to be the broadest in the world. In the fourth quarter of 2006, we also acquired former
distributors PhileKorea Technology Inc., located in Daejeon, Korea, and ATC Health Products Ltd.,
located in Ankara, Turkey.
•
In the second quarter of 2006, we completed the acquisitions of Gentra Systems, Inc., located in
Minneapolis, Minnesota, Singapore-based Research Biolabs Pte. Ltd., and Research Biolabs Sdn Bhd,
located in Malaysia. Gentra is a leading developer, manufacturer, and supplier of non-solid phase
nucleic acid purification products, providing both consumables and automated platforms. The
acquisition expands our position as a leading provider of preanalytical and molecular diagnostics
solutions to research and diagnostic customers. The acquisition of Research Biolabs, previously our
distributor, expands our direct presence in one of the most dynamic regions of our global business.
Research Biolabs currently has sales and marketing teams in Singapore, Malaysia and Indonesia, and
will also support market development in Thailand and Vietnam.
•
During the first quarter of 2006, we completed two acquisitions. PG Biotech Co. Ltd. (PG Biotech) is a
leading developer, manufacturer, and supplier of polymerase chain reaction (PCR)-based molecular
diagnostic kits in China. The acquisition will support QIAGEN’s position as a leading provider of
molecular diagnostics solutions to OEM partners and customers in the rapidly growing Asian markets.
We also acquired certain assets and operations from Diatech s.r.l., Jesi, Italy, which distributes products
produced by artus, which we acquired in 2005, in Italy.
•
At the end of the fourth quarter of 2005, we completed the acquisition of Eppendorf AG’s reagent
business which includes the Eppendorf “5-Prime” nucleic acid sample preparation and PCR reagent
product lines and related intellectual property. The acquisition adds to our core strategic focus,
represents an attractive addition to our portfolio of preanalytical and nucleic acid amplification
consumables and adds a very promising pipeline of proprietary technologies for nucleic acid handling,
separation, purification, and amplification.
•
During the third quarter of 2005, we completed three acquisitions. We acquired Tianwei Times, located
in Beijing, China, which is a leading developer, manufacturer and supplier of nucleic acid sample
preparation consumables in China. We acquired substantially all assets of Tianwei Times through our
new wholly owned subsidiary Tiangen Biotech Beijing Co. Ltd. (Tiangen). The Tiangen acquisition
expands QIAGEN’s position as the leading supplier for products and technologies for preanalytical
sample preparation in the rapidly growing market in China. In August, we acquired the business of
LumiCyte, Inc., which has developed and recently initiated marketing of the first products based on its
proprietary STS- (Surface Tension Segmented) Biochip sample preparation solution for MALDI
(Matrix-Assisted Laser Desorption/Ionization)-Mass Spectrometry (MS), and SuNyx GmbH which has
developed and recently initiated marketing of its proprietary platforms for sample preparation of peptide
and protein samples for analysis on Liquid Chromatography (LC)-MALDI Mass Spectrometry.
•
During the second quarter of 2005, we completed the acquisition of two companies. We acquired artus
Gesellschaft für molekularbiologische Diagnostik und Entwicklung mbH (artus), subsequently renamed
QIAGEN Hamburg GmbH, which is located in Hamburg, Germany, and is an established leader in
PCR-based molecular diagnostic tests for pathogenenic, genotyping and pharmacogenomic testing. We
also acquired Nextal Biotechnology, Inc. (Nextal), subsequently renamed QIAGEN Canada, Inc., which
is located in Canada and is a fast-growing provider of proprietary sample preparation tools which make
protein crystallization more accessible.
•
Also during the second quarter of 2005, we acquired the world-wide, exclusive rights and licenses to
manufacture and market the complete portfolio of RNAture’s nucleic acid isolation products from
Hitachi Chemical Research Center, Inc. In combination with our consumable and automation
technologies, the RNAture solutions have the potential to provide a new dimension of value to our
customers in high-throughput gene expression analysis and siRNA in research and drug development.
26
•
In September 2004, we completed the acquisition of key assets of Molecular Staging, Inc. (MSI) of New
Haven, Connecticut. MSI was a privately held company which had developed a range of proprietary
products and services based on its Multiple Displacement Amplification (MDA) and Rolling Circle
Amplification (RCA) technology. The key application of MDA is whole genome amplification (WGA)
which is designed to eliminate limitations created by the scarce quantities of DNA samples available for
customers to perform an increasing number of analyses. The technology portfolio acquired from MSI
adds a new dimension of customer benefit and is in our core focus on pre-analytical solutions. The
primary reason for the acquisition was to enable us to provide customers a solution for overcoming the
limitations of scarce DNA samples.
•
In June 2004, we sold a significant portion of our synthetic DNA business unit to a group of investors
since the market dynamics and strategic directions this business were becoming different in nature
compared to our core focus. We retained all rights and activities in our leading siRNA business
including ownership of our proprietary TOM-amidite chemistry.
During 2005, we purchased the previously leased cGMP production facilities in Germany and began the
planning for a new logistics center in Hilden, Germany. Construction on the new facility began in August 2006
and will be completed by the second quarter of 2007.
In December 2003, we committed to a relocation and restructure plan to more fully utilize our North
American Headquarters in Germantown, Maryland, and to discontinue certain products. This plan was completed
in 2004. In 2006, we closed our facilities in Oslo, Norway and Fremont, California, and commenced the
relocation and closure of a facility in Canada.
In 2006, on a consolidated basis, operating income increased to $100.6 million, compared to $94.8 million
in 2005. Our financial results include the contributions of our recent acquisitions, as well as the costs related to
the acquisitions and integrations, including charges for purchased in-process research and development, and costs
related to the relocation and closure of our facilities in Norway, Canada and Fremont, California. Our results also
reflect the benefits of our previous restructuring efforts, which have contributed to improved profitability as we
continue to manage our operating costs.
In 2005, on a consolidated basis, operating income increased to $94.8 million, compared to $84.1 million in
2004. The increase in operating income is primarily the result of increased sales and lower operating costs as a
result of our restructuring efforts, partially offset by acquisition related costs and costs related to our restructuring
and relocation efforts. In June 2004, we sold a significant portion of our synthetic DNA business unit.
Accordingly, the first six months in 2005 do not include any sales of synthetic DNA and related products or
operating costs related to the former business unit. Our overall performance in 2005 also reflects a delay in the
purchases of certain of our OEM partners whose anticipated product launches included our instrument and
consumable products. These unforeseen delays in our partners’ product launches resulted in a decrease in the
sales of our instrument products in 2005. However, since our instrument products carry a lower gross margin
than our consumable products, the lower instrumentation sales resulted in a higher gross margin in 2005.
Therefore, we still achieved a strong operating margin.
In 2004, on a comparative basis, sales increased primarily as the result of an increase in our consumables
products sales, which experienced very solid growth in 2004 compared to 2003. During 2004, we continued our
plans to realign certain operating functions in line with our focus on streamlining and strengthening our
operations. Further, on a comparative basis, operating income during 2004 was negatively impacted by the
currency impact of the stronger euro, since a significant portion of our production and operations is based in
Germany, along with lower gross margins from instrumentation sales. After the sale of a significant portion of
our synthetic DNA business unit, our gross margin is no longer negatively impacted by such products and as a
result, our reported gross margin in 2004 increased to 67% compared to 65% for the same period in 2003.
27
We manage our business based on the locations of our subsidiaries. Therefore, reportable segments are
based on the geographic locations of our subsidiaries. Our reportable segments include our production,
manufacturing and sales facilities located throughout the world. In addition, the Corporate segment includes our
holding company located in The Netherlands and two subsidiaries located in Germany which operate only in a
corporate support function. The reportable segments derive revenues from our entire product and service
offerings. Our Luxembourg subsidiaries, QIAGEN Finance (Luxembourg) S.A., or QIAGEN Finance, and
QIAGEN Euro Finance (Luxembourg) S.A., or Euro Finance, which were established as the financing vehicles
for the issuance of convertible debt, are not consolidated.
The following tables set forth operating income by segment for the years ended December 31. Further
segment information can be found in Note 21 in the accompanying financial statements.
Operating Income (Loss)
2006
2005
2004
North America . . . . . . . . . . . . . . . . . . . . . . . . . . . . . . .
Germany . . . . . . . . . . . . . . . . . . . . . . . . . . . . . . . . . . .
Switzerland . . . . . . . . . . . . . . . . . . . . . . . . . . . . . . . . .
Asia . . . . . . . . . . . . . . . . . . . . . . . . . . . . . . . . . . . . . . .
Rest of World . . . . . . . . . . . . . . . . . . . . . . . . . . . . . . .
Corporate . . . . . . . . . . . . . . . . . . . . . . . . . . . . . . . . . . .
$ 31,414,000
53,956,000
(1,558,000)
8,302,000
15,594,000
(6,550,000)
$36,095,000
43,279,000
(305,000)
7,182,000
14,136,000
(3,959,000)
$39,381,000
28,668,000
1,492,000
8,206,000
10,485,000
(3,455,000)
Subtotal . . . . . . . . . . . . . . . . . . . . . . . . . . . . . . . . . . . .
Intersegment Elimination . . . . . . . . . . . . . . . . . . . . . .
101,158,000
(557,000)
96,428,000
(1,591,000)
84,777,000
(637,000)
Total . . . . . . . . . . . . . . . . . . . . . . . . . . . . . . . . . .
$100,601,000
$94,837,000
$84,140,000
In 2006, operating income in North American decreased compared to 2005. North America experienced an
increase in consumable sales. However, operating expenses in North America were higher as a result of the
operating costs of 5-Prime, acquired in December 2005, and Gentra and Genaco, both acquired in 2006.
Additionally, operating costs were higher in 2006 than in 2005 due to the acquisitions and integrations costs of
recent acquisitions.
In Germany, operating income was higher in 2006 primarily due to increased consumable sales which carry
a higher gross margin, and sales of our newer acquired German company QIAGEN Hamburg GmbH, formerly
artus, partially offset by increased operating costs from the new subsidiary and acquisition related operating
costs. QIAGEN Hamburg was acquired in the second quarter of 2005 and is now fully integrated into the
QIAGEN group.
The operating loss in Switzerland was higher primarily due to an increase in research and development costs
in 2006 as compared to 2005.
Fiscal Year Ended December 31, 2006 compared to 2005
Net Sales
In 2006, net sales increased 17% to $465.8 million from $398.4 million in 2005. In 2006, net sales in North
America increased 12%, net sales in Europe increased 17% and net sales in Asia increased 41%, primarily driven
by China. The increase in sales was primarily the result of an increase in our consumables products sales which
experienced a growth rate of 17% in 2006 as compared to 2005. The increase in consumable sales includes
organic growth and sales from our recently acquired businesses. During 2006, sales from our instrumentation
products increased 19% compared to 2005. Sales of our other offerings, primarily services, which represented
1% of our 2006 net sales, decreased 16% in 2006 as compared to 2005.
We regularly introduce new products in order to extend the life of our existing product lines as well as to
address new market opportunities. During 2006, we introduced more than 67 new products including innovative
28
sample and assay technologies for research in the areas of epigenetics, gene expression, micro RNA, proteomics,
RNAi, and molecular diagnostics.
A significant portion of our revenues is denominated in euros. Changes in exchange rates can affect the
growth rate of net sales. For the year ended December 31, 2006, using identical foreign exchange rates for both
years, net sales would have increased approximately 17% as compared to the reported increase of 17% for the
year ended December 31, 2006.
Gross Profit
Gross profit was $324.6 million or 70% of net sales in the year ended December 31, 2006 as compared to
$275.2 million or 69% of net sales in 2005. The absolute dollar increase in 2006 compared to 2005 is attributable
to the increase in net sales. The gross margin of 70% in 2006 as compared to the gross margin of 69% in 2005
primarily reflects the impact of our consumable sales. Our consumable products have a higher gross margin than
our instrumentation products and fluctuations in the sales levels of these products can result in fluctuation in our
gross margin during a quarter when compared to the gross margin of another quarter. During 2006 and 2005,
instrumentation sales represented approximately 10% of our total sales. In connection with our acquisitions in
2006 and 2005, we expensed $2.0 million and $439,000, respectively, of inventory to cost of sales which will be
replaced with products integrating newly acquired technologies.
Research and Development
Research and development expenses increased 16% to $41.6 million (9% of net sales) in 2006 compared
with $35.8 million (9% of net sales) in 2005. Using identical foreign exchange rates for both years, research and
development expenses would have increased approximately 15%. Our recent acquisitions of new technologies,
notably those acquired via the acquisitions of artus and 5-Prime, have resulted in an increase in our research and
development costs. As we continue to expand our research activities and product development capabilities,
additional expense will be incurred related to research and development facility costs and the employees engaged
in our research and development efforts. Additionally, our research and development costs are expected to
increase as we incur costs in connection with obtaining 510(k) and CE approval of our artus and Genaco assays.
We have a strong commitment to research and development and anticipate that research and development
expenses will increase, perhaps significantly.
Sales and Marketing
Sales and marketing expenses increased 23% to $115.9 million (25% of net sales) in 2006 from $94.3
million (24% of net sales) in 2005. Using identical foreign exchange rates for each year, sales and marketing
expenses would have increased approximately 22%. Sales and marketing expenses are primarily associated with
personnel, commissions, advertising, trade shows, publications, freight and logistics expenses and other
promotional expenses. The increase in sales and marketing expenses in 2006 includes expenses related to
creating separate sales organizations addressing customers in industrial and academic research, applied testing
and molecular diagnostics, as well as to sales organizations in our newly acquired or established subsidiaries. We
anticipate that sales and marketing costs will increase along with new product introductions and continued
growth in sales of our products.
General and Administrative
General and administrative expenses increased 21% to $48.6 million (10% of net sales) in 2006 from $40.1
million (10% of net sales) in 2005. Using identical foreign exchange rates for both years, general and
administrative expenses would have increased approximately 21%. General and administrative expenses
primarily represent the costs required to support our administrative infrastructure which, except for the period
following our restructuring, have continued to expand along with our growth. The increase in general and
administrative expenses in 2006 includes expenses related to our newly acquired subsidiaries.
29
Acquisition Related Intangible Amortization
Acquisition related intangible amortization relates to intangible assets acquired in our business acquisitions.
During 2006, the amortization expense on acquisition related intangibles increased to $8.2 million from $3.7
million in 2005. The increase in expense is the result of an increase in the amount of intangibles acquired in our
recent business acquisitions. During 2006, we completed seven acquisitions which have increased our intangible
assets subject to amortization. We therefore expect that our acquisition related intangible amortization will
increase as a result of the recent acquisitions, as well as by any future acquisitions.
Acquisition, Integration and Related Costs
In connection with our acquisitions, we recorded charges in 2006 of $2.2 million for purchased in-process
research and development and $2.0 million related to inventory which needed to be replaced with products
suitable to the newly acquired technologies. Costs related to acquisition and integration activities during 2006
totaled $6.1 million and included $1.0 million in severance and employee related costs, $2.5 million of costs
related to acquisition integrations and $2.6 million for the impairment of assets.
In connection with our acquisitions, we recorded charges in 2005 of $3.2 million for purchased in-process
research and development and $439,000 related to inventory which needed to be replaced with products suitable
to the newly acquired technologies. Costs related to acquisition and integration activities during 2005 totaled
$3.2 million, including $2.1 million related to the impairment of fixed and other assets as a result of the
acquisition.
Relocation and Restructure Costs
Relocation and restructuring costs recorded in 2006 are related to the restructuring of acquired businesses
located in Norway and North America for which a restructuring was not contemplated at the time of acquisition.
We expect that restructuring charges related to the 2006 closures and relocations will total approximately $2.0
million, of which $1.5 million has been recorded as of December 31, 2006. These costs consisted primarily of
relocation and severance costs of $669,000, lease and facility costs of $181,000 and other costs of $601,000.
Other Income (Expense)
Other income was $5.5 million in 2006 compared to other expense of $2.4 million in 2005. This increase in
income was mainly due to higher interest income and gain from equity method investees, partially offset by
higher interest expense, lower research and development grant income and a lower loss on foreign currency
transactions.
In 2006, research and development grant income from European Union as well as German state and federal
government grants decreased to $795,000 from $1.4 million in 2005. We conduct significant research and
development activities in Germany, and expect to continue to apply for such research and development grants in
the future.
We recorded a loss from foreign currency transactions of $660,000 in 2006 as compared to a loss of
$157,000 in 2005. The loss from foreign currency transactions reflects the net effect of conducting business in
currencies other than the U.S. dollar. QIAGEN N.V.’s functional currency is the U.S. dollar and its subsidiaries’
functional currencies are the euro, the British pound, the Swedish krone, the Swiss franc, the U.S. dollar, the
Australian dollar, the Canadian dollar, the Japanese yen, the Malaysian ringgit, the Chinese yuan, the Korean
won, the Turkish lira and the Norwegian krone. See Currency Fluctuations under Item 11 “Quantitative and
Qualitative Disclosures About Market Risk.”
For the year ended December 31, 2006, interest income increased to $16.4 million from $7.6 million in
2005. Interest income is derived mainly from interest bearing cash accounts and investments. The increase in
30
interest income in 2006 over 2005 was primarily the result of an increase in amounts invested during the year
along with an increase in interest rates. At December 31, 2006, we had $430.4 million in cash and cash
equivalents compared to $191.7 million at December 31, 2005. As of December 31, 2006, we had $52.8 million
invested in marketable securities, compared to $15.0 million in auction rate at December 31, 2005.
Interest expense increased to $11.9 million in 2006 compared to $5.9 million in 2005. Interest costs relate
primarily to our long-term borrowings from QIAGEN Finance and the new borrowings from Euro Finance along
with the long-term debt related to our facility construction.
In 2006, we recorded a net gain from equity method investees of $1.3 million compared to a loss of $1.1
million in 2005. The gain/loss primarily represents our share of profits/losses from our equity investment in
PreAnalytiX. As previously disclosed, we intend to continue to make strategic investments in complementary
businesses as the opportunities arise. Accordingly, we may record losses on equity investments based on our
ownership interest in such companies.
Other miscellaneous expense was $360,000 in 2006 compared to other miscellaneous income of $741,000 in
2005. This increase in miscellaneous expense was primarily due to 2006 losses on the disposition of property and
equipment.
Provision for Income Taxes
Our effective tax rate decreased to 34% in 2006 from 36% in 2005. Our operating subsidiaries are exposed
to effective tax rates ranging from approximately 0% to approximately 62%. Fluctuations in the distribution of
pre-tax income among these entities can lead to fluctuations of the effective tax rate in our consolidated financial
statements.
Fiscal Year Ended December 31, 2005 compared to 2004
Net Sales
In 2005, net sales increased 5% to $398.4 million from $380.6 million in 2004. Net sales in the United
States decreased to $165.2 million in 2005 from $167.4 million in 2004, and net sales outside the United States
increased to $233.2 million in 2005 from $213.2 million in 2004.
The increase in sales was primarily the result of an increase in our consumables products sales, which
experienced a growth rate of 13%, partially offset by a decrease in our instrument product sales of 2% in 2005 as
compared to 2004. During 2005, we experienced slower performance under some of our OEM contracts where
our OEM partners delayed product launches, that include our instruments and consumable products, resulting in
lower sales, primarily of instruments, in 2005. Additionally, as we continued to focus on our core business, sales
of our other offerings, primarily services, which represented 2% of our 2005 net sales, decreased 21% in 2005 as
compared to 2004.
In the second quarter of 2004, we sold a significant portion of our synthetic DNA business unit.
Accordingly, net sales in 2005 in the United States, Germany and Japan did not include any sales of the synthetic
DNA products, which were included in net sales of the first six months of 2004. Outside of the United States, net
sales continued to be favorably affected by growth at our newer subsidiaries located in Sweden and The
Netherlands, which reported an increase in sales of $9.2 million in 2005. Our recent acquired subsidiaries
contributed approximately $9.6 million to the increase in 2005 net sales. Prior to the establishment and
acquisitions of these newer subsidiaries, other subsidiaries reported sales to these regions. These increases were
partially offset by the lower sales of QIAGEN Instruments AG, located in Switzerland, which reported a decrease
in sales in 2005 of 6% ($1.7 million). In 2004, Switzerland had recorded a $1.0 million license of software to
Operon Biotechnologies, Inc.
31
A significant portion of our revenues is denominated in euros. Changes in exchange rates can affect the
growth rate of net sales. For the year ended December 31, 2005, using identical foreign exchange rates for both
years, net sales would have increased approximately 5% as compared to the reported increase of 5% for the year
ended December 31, 2005.
Gross Profit
Gross profit was $275.2 million or 69% of net sales in the year ended December 31, 2005 as compared to
$253.5 million or 67% of net sales in 2004. The absolute dollar increase is attributable to the increase in net sales
partially offset by the currency impact of the stronger euro. The 2004 gross profit includes sales of our synthetic
DNA business unit, a significant portion of which was sold at the end of the second quarter in 2004. Accordingly,
the second half of 2004 does not include any sales of synthetic DNA and related products, which carried a lower
gross profit than our consumables products, thus the reported gross profit in 2005 is higher than 2004. Further,
the increase in gross profit as a percentage of net sales is also attributable to the increase in net sales of
consumable products, partially offset by the currency impact of the stronger euro. In connection with
acquisitions, we expensed $439,000 and $1.5 million in 2005 and 2004, respectively, of inventory to cost of sales
which will be replaced with products integrating newly acquired technologies.
Research and Development
Research and development expenses increased 9% to $35.8 million (10% of net sales) in 2005 compared
with $34.4 million (9% of net sales) in 2004. Using identical foreign exchange rates for both years, research and
development expenses would have increased approximately 9%. Our recent acquisitions of new technologies,
notably those acquired via the acquisitions of artus and Nextal during the second quarter of 2005, have resulted in
an increase in our research and development costs. The increase in research and development expenses is also
attributable to the currency impact of the stronger euro, and was partially offset by the sale of our former
synthetic DNA business unit in the second quarter of 2004.
Sales and Marketing
Sales and marketing expenses increased 8% to $94.3 million (24% of net sales) in 2005 from $87.5 million
(23% of net sales) in 2004. Using identical foreign exchange rates for each year, sales and marketing expenses
would have increased approximately 8%. Sales and marketing costs are primarily associated with personnel,
commissions, advertising, trade shows, publications, freight, and logistics expenses and other promotional
expenses. The increase in sales and marketing expenses in 2005 includes expenses related to our recently
acquired subsidiaries, QIAGEN Hamburg and Nextal, along with our new sales subsidiaries established in
Sweden and The Netherlands.
General and Administrative
General and administrative expenses decreased 4% to $40.1 million (10% of net sales) in 2005 from $41.7
million (11% of net sales) in 2004. Using identical foreign exchange rates for both years, general and
administrative expenses would have decreased approximately 4%. General and administrative expenses primarily
represent the costs required to support our administrative infrastructure which, until our recent restructuring,
continued to expand along with our growth. General and administrative expenses were lower in 2005 as a result
of our relocation and restructuring efforts, including the sale of our synthetic DNA business unit, which we sold
at the end of June 2004.
Acquisition, Integration and Related Costs
In connection with acquisitions, we recorded a charge of $3.2 million in 2005 for purchased in-process
research and development. Costs related to the acquisitions of 2005 included $439,000 related to inventory which
needed to be replaced with products suitable to the newly acquired technologies. In connection with the
32
acquisition of artus and 5-Prime, we expensed costs of approximately $3.2 million, which included $2.1 million
related to the impairment of fixed and other assets as a result of the acquisition and included costs related to the
integration of $273,000.
Costs related to the acquisition of MSI in the third quarter of 2004 included a $1.5 million write-down of
inventories, which were replaced with products integrating newly acquired technologies, and $572,000 related to
the impairment of other assets as a result of the acquisition.
Relocation and Restructure Costs
In 2004, we completed the relocation of certain functions from our subsidiary in Valencia, California to
Germantown, Maryland where our North American Headquarters is located. We recognized approximately $3.8
million in operating expenses in 2004 related to employee relocation and severance costs in connection with the
relocation plan. In 2003 we expensed approximately $3.6 million to cost of sales for the write-down of
inventories and approximately $1.5 million to operating expenses related to relocating employees, severance for
employees not relocating and the write-off of investments. These restructuring and relocation activities were
completed in 2004 at a total cost of approximately $8.9 million. Additionally, in 2003 approximately $1.6 million
of mainly lease related costs were incurred to complete the closure of the QIAGEN Genomics site in Bothell,
Washington. At December 31, 2005, the remaining accrued liability was $119,000 which was paid during the
first part of 2006.
Other Income (Expense)
Other income was $2.4 million in 2005 compared to other expense of $11.5 million in 2004. This decrease
in expense was primarily due to the sale of the majority of our synthetic DNA business unit in 2004. As a result
we recorded a net loss related to the sale of $9.8 million in the second quarter of 2004.
In 2005, research and development grant income from European Union as well as German state and federal
government grants decreased to $1.4 million from $1.6 million in 2004. We conduct significant research and
development activities in Germany, and expect to continue to apply for such research and development grants in
the future.
We recorded a loss from foreign currency transactions of $157,000 in 2005 as compared to a loss of $67,000
in 2004. The loss from foreign currency transactions reflects net effects from conducting business in currencies
other than the U.S. dollar. See Currency Fluctuations under Item 11 “Quantitative and Qualitative Disclosures
About Market Risk.”
In 2005, interest income increased to $7.6 million from $2.9 million in 2004. Interest income is derived
mainly from interest bearing cash accounts and investments, primarily auction rate securities. The increase in
interest income in 2005 over 2004 was the result of an increase in amounts invested during the year and an
increase in interest rates. As of December 31, 2005, we had $15.0 million invested in such securities. The
weighted average interest rate on the marketable securities portfolio was 3.42% in 2005, compared to 1.27% to
1.45% in 2004.
Interest expense increased to $5.9 million in 2005 compared to $5.1 million in 2004. Interest costs relate
primarily to our long-term borrowings of the proceeds from the convertible debt offering along with the longterm debt related to our facility construction.
In 2005, we recorded net losses from equity method investees of $1.1 million compared to $2.2 million in
2004. The loss primarily represents our share of losses from our equity investment in PreAnalytiX and the lower
loss in 2005 as compared to 2004 is a result of PreAnalytiX’s lower net loss due to new product sales.
Other miscellaneous income was $741,000 in 2005 compared to other miscellaneous expense of $8.5
million in 2004. This decrease in miscellaneous expense was primarily due to the sale of the majority of our
33
synthetic DNA business unit in 2004. As a result we recorded a net loss related to the sale of $9.8 million in the
second quarter of 2004.
Provision for Income Taxes
Our effective tax rate increased to 36% in 2005 from 33% in 2004. Our operating subsidiaries are exposed
to effective tax rates ranging from zero to approximately 43%. Fluctuation in the distribution of pre-tax income
among these entities can lead to fluctuations of the effective tax rate in our consolidated financial statements.
Further, we received tax benefits in 2004 related to the revaluation of deferred taxes in The Netherlands, the
United States, and Norway.
Foreign Currency
QIAGEN N.V.’s functional currency is the U.S. dollar and our subsidiaries’ functional currencies are the
local currency of the respective countries in which they are headquartered, in accordance with Statement of
Financial Accounting Standard No. 52, “Foreign Currency Translation.” All amounts in the financial statements
of entities whose functional currency is not the U.S. dollar are translated into U.S. dollar equivalents at exchange
rates as follows: (1) assets and liabilities at period-end rates, (2) income statement accounts at average exchange
rates for the period, and (3) components of shareholders’ equity at historical rates. Translation gains or losses are
recorded in shareholders’ equity, and transaction gains and losses are reflected in net income. The net loss on
foreign currency transactions in 2006, 2005 and 2004 was $660,000, $157,000, and $67,000, respectively, and is
included in other income.
Liquidity and Capital Resources
To date, we have funded our business primarily through internally generated funds, debt and the private and
public sales of equity. Our primary use of cash has been to support continuing operations and our capital
expenditure requirements including acquisitions. As of December 31, 2006 and 2005, we had cash and cash
equivalents of $430.4 million and $191.7 million, respectively, and investments in current marketable securities
of $52.8 million and $15.0 million, respectively. Cash and cash equivalents are primarily held in euros and U.S.
dollars, other than those cash balances maintained in the local currency of subsidiaries to meet local working
capital needs. At December 31, 2006, cash and cash equivalents had increased by $238.7 million over
December 31, 2005 primarily due to cash provided by operating activities of $101.5 million and financing
activities of $303.2 million, offset by cash used in investing activities of $165.5 million. Marketable securities
consist of fixed and floating rate debt instruments. As of December 31, 2006 and 2005, we had working capital
of $566.7 million and $278.6 million, respectively.
Operating Activities. For the years ended December 31, 2006 and 2005, we generated net cash from
operating activities of $101.5 million and $91.2 million, respectively. Cash provided by operating activities
increased in 2006 compared to 2005 primarily due to increases in net income and accounts payable, partially
offset by an increase in inventories and a decrease in accrued liabilities. Since we rely heavily on cash generated
from operating activities to fund our business, a decrease in demand for our products or significant technological
advances of competitors would have a negative impact on our liquidity.
Investing Activities. Approximately $165.5 million of cash was used in investing activities during 2006,
compared to $98.5 million during 2005. Investing activities during 2006 consisted principally of purchases of
property and equipment and cash paid for acquisitions and the purchase of intangible assets. In the third quarter
of 2006, we began construction of a new logistics center located in Germany. The new facility will occupy
approximately 48,000 square feet and will cost an estimated EUR 9.0 million, of which EUR 6.4 million
(approximately $8.2 million) had been incurred through December 31, 2006. The new logistics facility along
with future expansions and acquisitions may result in increased investing activities compared to prior periods.
34
Financing Activities. Financing activities provided $303.1 million in cash for the year ended
December 31, 2006, compared to $3.0 million for the same period in 2005. Cash provided during the period was
primarily due to the proceeds received from a long-term loan payable to Euro Finance, the issuance of common
shares as a result of stock option exercises, tax benefits from stock based compensation and proceeds received in
connection with an agreement to issue shares to QIAGEN Finance, partially offset by capital lease payments and
the repayment of debt.
We have credit lines totaling $12.4 million at variable interest rates, none of which was utilized as of
December 31, 2006. We also have capital lease obligations, including interest, in the amount of $12.8 million,
and carry $496.1 million of long-term debt.
We have two notes payable are the long-term borrowings of the proceeds from the issuance of $150.0
million senior unsubordinated convertible notes, with a 1.5% coupon due in 2024 through QIAGEN Finance,
which was established for this purpose. The net proceeds of the convertible debt were loaned by QIAGEN
Finance to our consolidated U.S. and Swiss subsidiaries. The long-term notes payable to QIAGEN Finance have
an effective rate of 1.95% and are due in August 2011. The convertible notes issued by QIAGEN Finance are
convertible into shares of our common stock at a conversion price of $12.6449 subject to adjustment. We also
have a note payable of EUR 30.0 million, (approximately $39.6 million at December 31, 2006) which bears
interest at a variable interest rate of EURIBOR plus 0.75% is due in annual payments of EUR 5.0 million through
June 2011 and a note payable of EUR 5.0 million (approximately $6.6 million at December 31, 2006) which is
due in June 2008.
In May 2006, we completed the offering of $300.0 million of 3.25% senior convertible notes (2006 Notes)
due in 2026 through a new unconsolidated subsidiary QIAGEN Euro Finance (Luxembourg) S.A. (Euro
Finance). The net proceeds of the 2006 Notes were loaned by Euro Finance to consolidated subsidiaries. At
September 30, 2006, $300.0 million is included in long-term debt for the amount of 2006 Notes proceeds payable
to Euro Finance. These long-term notes payable to EUR Finance have an effective interest rate of 4.2% and are
due in May 2013. Interest on the 2006 Notes is payable semi-annually in May and November. The 2006 Notes
were issued at 100% of principal value, and are convertible into 15.0 million shares of common stock at the
option of the holder upon the occurrence of certain events at a price of $20.00 per share, subject to adjustment.
QIAGEN N.V. has an agreement with Euro Finance to issue shares to the investors in the event of conversion.
This subscription right, along with the related receivable, is recorded at fair value in the equity of QIAGEN N.V.
as paid-in capital. The 2006 Notes cannot be called for the first 7 years and are callable thereafter subject to a
provisional call trigger of 130% of the conversion price. In addition, the holders of the 2006 Notes may require
QIAGEN to repurchase all or a portion of the outstanding Notes for 100% of the principal amount, plus accrued
interest, on May 16, 2013, 2017 and 2022.
In connection with the first quarter 2006 acquisition of PG Biotech, we acquired approximately $3.1 million
in short-term debt. The debt was due and paid in April 2006.
We believe that funds from operations, existing cash and cash equivalents, together with the proceeds from
our public and private sales of equity and convertible notes, and availability of financing facilities as needed, will
be sufficient to fund our planned operations and expansion during the coming year.
Currency Hedging
In the ordinary course of business, we purchase financial instruments with which we intend to hedge foreign
currency fluctuations with the principal objective of minimizing the risks and/or costs associated with global
financial and operating activities. Generally, we hedge a majority of the anticipated cash flow that we expect to
exchange into other currencies, subject to our short-term financing needs. We do not utilize financial instruments
for trading or other speculative purposes.
35
At December 31, 2006, these foreign currency instruments consisted of options, which give us the right, but
not the obligation, to purchase foreign currencies in exchange for U.S. dollars at predetermined exchange rates.
These options are marked to market through our statements of income and are not designated as effective hedges
according to the provisions of SFAS 133. At December 31, 2006, we did not have any significant foreign
currency exchange option holdings.
During 2005, our German and Swiss subsidiaries entered into forward arrangements which qualify for hedge
accounting as cash flow hedges of foreign currency denominated liabilities. At December 31, 2006, these
forward contracts totaled $44.0 million as a hedge to currency risk on intercompany loans. The contracts mature
in July 2011 and at December 31, 2006 and 2005 had fair market values of approximately $2.8 million and
$663,000 million, respectively, which is included in other long-term liabilities in the accompanying consolidated
balance sheets. During 2006, we also entered into two additional forward arrangements which qualify as cash
flow hedges of foreign currency denominated liabilities. At December 31, 2006, we held a contract for Canadian
dollars 8.0 million which matures in February 2007 and had a fair market value of $126,000 at December 31,
2006. Additionally we held a contract for Japanese yen 200.0 million which matures in April 2007 and had a fair
market value of $190,000 at December 31, 2006. The fair values of these forwards are included in prepaid and
other assets at December 31, 2006. During 2005, we also entered into a forward arrangement which qualifies as a
cash flow hedge of $9.0 million Canadian dollars. This contract matured in February 2006 and had a fair market
value of $377,000 at December 31, 2005, which is included in accrued and other liabilities at December 31,
2005.
The gain or loss on the change in the fair values of the derivatives are included in earnings to the extent they
offset the earnings impact of changes in the fair values of the hedged obligations. Any difference is deferred in
accumulated comprehensive income, a component of shareholders’ equity. These contracts effectively fix the
exchange rate at which the intercompany loans will be settled in, so that gains or losses on the forward contracts
offset the losses or gains from changes in the value of the underlying intercompany loans.
Contractual Obligations
As of December 31, 2006, our future contractual cash obligations are as follows:
Contractual obligations
(in thousands)
Total
2007
2008
2009
2010
2011
Thereafter
Long-term debt . . . . . . . . . . . . . . . . . . . . $496,190 $ 6,599 $13,197 $ 6,599 $ 6,599 $163,196 $300,000
Capital lease obligations . . . . . . . . . . . . .
17,992
1,488
1,563
1,534
1,550
1,491
10,366
Operating leases . . . . . . . . . . . . . . . . . . .
23,422
8,396
6,426
3,833
2,975
1,652
140
Purchase obligations . . . . . . . . . . . . . . . .
25,119 13,810
9,355
172
172
172
1,438
License and royalty payments . . . . . . . .
3,175
635
413
413
413
413
888
Total contractual cash obligations . . . . . $565,898 $30,928 $30,954 $12,551 $11,709 $166,924 $312,832
In addition to the above and pursuant to purchase agreements for several of our recent acquisitions, we
could be required to make additional contingent cash payments totaling up to $44.6 million based on revenue and
other milestones in 2007 and beyond.
Critical Accounting Policies, Judgments and Estimates
The preparation of our financial statements in accordance with accounting principles generally accepted in
the United States requires management to make assumptions that affect the reported amounts of assets, liabilities
and disclosure of contingencies as of the date of the financial statements, as well as the reported amounts of
revenues and expenses during the reporting period. Critical accounting policies are those that require the most
complex or subjective judgments often as a result of the need to make estimates about the effects of matters that
36
are inherently uncertain. Thus, to the extent that actual events differ from management’s estimates and
assumptions, there could be a material impact to the financial statements. In applying our critical accounting
policies, at times we used accounting estimates that either required us to make assumptions about matters that
were highly uncertain at the time the estimate was made or it is reasonably likely that changes in the accounting
estimate may occur from period to period that would have a material impact on the presentation of our results of
operations, financial position or cash flows. Our critical accounting policies are those related to revenue
recognition, accounts receivable, investments, goodwill and other intangibles, and income taxes. We reviewed
the development, selection, and disclosure of our critical accounting policies and estimates with the Audit
Committee of our Supervisory Board.
Revenue Recognition. We recognize revenue in accordance with SEC Staff Accounting Bulletin No. 104,
“Revenue Recognition in Financial Statements” (SAB 104). SAB 104 requires that four basic criteria must be
met before revenue can be recognized: (1) persuasive evidence of an arrangement exists; (2) delivery has
occurred or services have been rendered; (3) the fee is fixed and determinable; and (4) collectibility is reasonably
assured. Determination of criteria (3) and (4) could require management’s judgments regarding the fixed nature
of the fee charged for services rendered and products delivered and the collectibility of those fees. Should
changes in conditions cause management to determine that these criteria are not met for certain future
transactions, revenue recognized for any reporting period could be adversely affected.
Accounts Receivable. Our accounts receivable are unsecured, and we are at risk to the extent such
amounts become uncollectible. We continually monitor accounts receivable balances, and provide for an
allowance for doubtful accounts at the time collection becomes questionable based on payment history or age of
the receivable. Since a significant portion of our customers are funded through academic or government funding
arrangements, past history may not be representative of the future. As a result, we may have write-offs of
accounts receivable in excess of previously estimated amounts or may in certain periods increase or decrease the
allowance based on management’s current estimates.
Investments. We have equity investments accounted for under the cost method. We periodically review
the carrying value of these investments for permanent impairment, considering factors such as the most recent
stock transactions, book values from the most recent financial statements, and forecasts and expectations of the
investee. Estimating the fair value of these non-marketable equity investments in life science companies is
inherently subjective, and if actual events differ from management’s assumptions, it could require a write-down
of the investment that could materially impact our financial position and results of operations.
In addition, generally accepted accounting principles require different methods of accounting for an
investment depending on the level of control that we exert. Assessing the level of control involves subjective
judgments. If management’s assumptions with respect to control differ in future periods and we therefore have to
account for these investments under a method other than the cost method, it could have a material impact to our
financial statements.
Goodwill and Other Intangible Assets. We account for acquisitions under the purchase method of
accounting, typically resulting in goodwill. Statement of Financial Accounting Standards (SFAS) No. 142,
“Goodwill and Other Intangible Assets,” requires us to assess goodwill for impairment at least annually in the
absence of an indicator of possible impairment and immediately upon an indicator of possible impairment. The
statement requires estimates of the fair value of our reporting units. If we determine that the fair values are less
than the carrying amount of goodwill recorded, we must recognize an impairment in our financial statements.
Due to the numerous variables associated with our judgments and assumptions relating to the valuation of the
reporting units and the effects of changes in circumstances affecting these valuations, both the precision and
reliability of the resulting estimates are subject to uncertainty, and as additional information becomes known, we
may change our estimate.
37
At December 31, 2006, goodwill and intangible assets totaled $160.1 million and $118.5 million,
respectively, and were included in the following segments:
Goodwill
Intangibles
North America . . . . . . . . . . . . . . . . . . . . . . . . . . . . . . . . . . .
Germany . . . . . . . . . . . . . . . . . . . . . . . . . . . . . . . . . . . . . . .
Switzerland . . . . . . . . . . . . . . . . . . . . . . . . . . . . . . . . . . . . .
Asia . . . . . . . . . . . . . . . . . . . . . . . . . . . . . . . . . . . . . . . . . . .
Rest of World . . . . . . . . . . . . . . . . . . . . . . . . . . . . . . . . . . .
Corporate . . . . . . . . . . . . . . . . . . . . . . . . . . . . . . . . . . . . . . .
$ 61,959,000
55,504,000
—
13,689,000
28,989,000
—
$ 45,632,000
51,296,000
71,000
12,345,000
6,124,000
3,024,000
Total . . . . . . . . . . . . . . . . . . . . . . . . . . . . . . . . . . . . . . . . . .
$160,141,000
$118,492,000
In the fourth quarter of 2006, we performed our annual impairment assessment of goodwill (using data as of
October 1, 2005) in accordance with the provisions of SFAS No. 142. In testing for potential impairment, we
measured the estimated fair value of our reporting units based upon discounted future operating cash flows using
a discount rate reflecting our estimated average cost of funds. Differences in assumptions used in projecting
future operating cash flows and cost of funds could have a significant impact on the determination of impairment
amounts. In estimating future cash flows, we used our internal budgets. Our budgets were based on recent sales
data for existing products, planned timing of new product launches or capital projects, and customer
commitments related to new and existing products. These budgets also included assumptions of future production
volumes and pricing. We concluded that no impairment existed. Even if our estimates of projected future cash
flows were too high by 10%, there would be no impact on the reported value of goodwill at December 31, 2006.
Due to the numerous variables associated with our judgments and assumptions relating to the valuation of
the reporting units and the effects of changes in circumstances affecting these valuations, both the precision and
reliability of the resulting estimates are subject to uncertainty, and as additional information becomes known, we
may change our estimates.
Share-Based Compensation. Our stock plan, the QIAGEN N.V. Amended and Restated 2005 Stock Plan
(the Plan), allows for the granting of stock rights, incentive stock options, as well as for non-qualified options,
stock grants and stock based awards. Effective January 1, 2006, we adopted the provisions of FASB Statement
No. 123 (revised 2004), “Share-Based Payment,” (SFAS 123(R)) and SEC Staff Accounting Bulletin No. 107,
“Share-Based Payment,” (SAB 107), using the modified prospective transition method. Under the modified
prospective transition method, compensation cost recognized in 2006 includes compensation cost for all equitybased payments granted prior to but not yet vested as of January 1, 2006, based on the grant date fair value
estimated in accordance with the original provisions of SFAS No. 123 and compensation cost for all equity-based
payments granted subsequent to January 1, 2006, based on the grant date fair value estimated in accordance with
the provisions of SFAS No. 123(R).
We use the Black-Scholes-Merton valuation model for estimating the fair value of our stock option grants.
Option valuation models, including Black-Scholes-Merton, require the input of highly subjective assumptions,
including the risk-free rate of interest, expected dividend yield, expected volatility, and the expected life of the
award. While there were no significant stock options or other share awards granted during the year ended
December 31, 2006, we anticipate that the adoption will have a greater impact in future periods and changes in
the assumptions used can materially affect the grant date fair value of an award.
Income Taxes. The calculation of our tax provision is complex due to the international operations and
multiple taxing jurisdictions in which we operate. We have significant deferred tax assets due to net operating
losses (NOL). The utilization of NOL’s is not assured and is dependent on generating sufficient taxable income
in the future. Although management believes it is more likely than not that we will generate sufficient taxable
income to utilize all NOL carryforwards, evaluating the NOL’s related to our newer subsidiaries requires us to
38
make estimates that we believe are reasonable, but may also be highly uncertain given that we do not have direct
experience with such subsidiaries or their products and thus the estimates also may be subject to significant
changes from period to period as we gain that experience. To the extent that our estimates of future taxable
income are insufficient to utilize all available NOL’s, a valuation allowance will be recorded in the provision for
income taxes in the period the determination is made, and the deferred tax assets will be reduced by this amount,
which could be material. In the event that actual circumstances differ from management’s estimates, or to the
extent that these estimates are adjusted in the future, any changes to the valuation allowance could materially
impact our financial position and results of operations.
The above listing is not intended to be a comprehensive list of all our accounting policies. In many cases,
the accounting treatment of a particular transaction is specifically dictated by generally accepted accounting
principles in the United States, with limited or no need for management’s judgment. There are also areas in
which management’s judgment in selecting available alternatives may or may not produce a materially different
result. See our audited consolidated financial statements and notes thereto in Item 18 of this Form 20-F which
contain a description of accounting policies and other disclosures required by generally accepted accounting
principles in the United States.
Authoritative Pronouncements
In September of 2006, the Financial Accounting Standards Board (FASB) issued SFAS No. 158,
“Employers’ Accounting for Defined Benefit Pension and Other Post-retirement Plans,” an amendment of SFAS
No. 87, 88, 106, and 132(R). SFAS No. 158 makes numerous changes related to the accounting for pension and
postretirement benefit plans. The most significant change is that the funded status of all post-retirement plans
will be recorded on the balance sheet. The difference between a plan’s funded status and its current balance sheet
position will be recognized, net of taxes, as a component of shareholders’ equity. SFAS No. 158 is effective for
fiscal years ending after December 15, 2006. The adoption of SFAS No. 158 resulted in an increase to the
pension liability of $333,000, deferred taxes of $129,000, and a net increase in the loss of accumulated other
comprehensive income of $204,000 in the consolidated balance sheet for the year ending December 31, 2006.
In September 2006, the FASB issued SFAS No. 157, “Fair Value Measurements.” SFAS No. 157 provides
guidance for using fair value to measure assets and liabilities and only applies when other standards require or
permit the fair value measurement of assets and liabilities. It does not expand the use of fair value
measurement. SFAS No. 157 is effective for fiscal years beginning after November 15, 2007. We will adopt
this standard as required on January 1, 2008 and management are currently assessing the effect SFAS No. 157
will have on our results of operations, financial condition and liquidity.
In September 2006, the SEC staff issued Staff Accounting Bulletin No. 108, “Considering the Effects of Prior
Year Misstatements when Quantifying Misstatements in Current Year Financial Statements” (SAB 108). The intent
of SAB 108 is to reduce diversity in practice on the method companies use to quantify financial statements
misstatements, including the effect of prior year uncorrected errors. SAB 108 establishes an approach that requires
quantification of financial statement errors using both an income statement and cumulative balance sheet approach.
SAB 108 is effective for fiscal years ending after November 15, 2006. The adoption of SAB 108 did not have a
significant impact on our results of operations, financial condition or liquidity as of and for the year ended
December 31, 2006.
In June 2006, the FASB issued Interpretation No. 48, “Accounting for Uncertainty in Income Taxes—An
Interpretation of FASB Statement No. 109” (FIN 48), to create a single model to address accounting for
uncertainty in tax positions. FIN 48 clarifies the accounting for income taxes by prescribing a minimum
recognition threshold a tax position is required to meet before being recognized in financial statements. FIN 48
also provides guidance on derecognition, measurement, classification, interest and penalties, accounting in
interim period, disclosure and transition. FIN 48 is effective for fiscal years beginning after December 15, 2006.
We adopted FIN 48 as of January 1, 2007. The cumulative effect of adopting FIN 48 will be recorded in retained
earnings. We estimate that the cumulative effect adjustment to retained earnings will be in the range of
39
approximately $2 million to $7 million to increase reserves for uncertain tax positions. The amount is subject to
revision as management completes its analysis. In addition, we expect that the adoption of FIN 48 may result in
greater volatility in our effective tax rate.
In June 2006, the FASB ratified the Emerging Issues Task Force (EITF) consensus on EITF Issue No. 06-3,
“How Taxes Collected from Customers and Remitted to Governmental Authorities Should Be Presented in the
Income Statement (That Is, Gross versus Net Presentation).” EITF Issue No. 06-3 states that the classification of
taxes as gross or net is an accounting policy decision that is dependent on type of tax and that similar taxes are to be
presented in a similar manner. EITF Issue No. 06-3 is effective for reporting periods beginning after December 15,
2006. We adopted this consensus as required on January 1, 2007 without a material impact on our results of
operations, financial condition or liquidity.
In February 2006, the FASB issued Statement of Financial Accounting Standards No. 155, “Accounting for
Certain Hybrid Financial Instruments,” (SFAS 155) which amends Statement of Financial Accounting Standards
No. 133, “Accounting for Derivative Instruments and Hedging Activities,” (SFAS 133) and Statement of Financial
Accounting Standards No. 140, “Accounting for Transfers and Servicing of Financial Assets and Extinguishments
of Liabilities,” (SFAS 140). SFAS 155 simplifies the accounting for certain derivatives embedded in other financial
instruments by allowing them to be accounted for as a whole (eliminating the need to bifurcate the derivative from
its host) if the holder elects to account for the whole instrument on a fair value basis. SFAS 155 also clarifies and
amends certain other provisions of SFAS 133 and SFAS 140. SFAS 155 is effective for all financial instruments
acquired, issued or subject to a remeasurement event occurring in fiscal year beginning after September 15, 2006.
We adopted this consensus as required on January 1, 2007 without a material impact on our results of operations,
financial condition or liquidity.
In May 2005, the FASB issued SFAS No. 154, “Accounting Changes and Error Corrections.” This new
standard replaces APB Opinion No. 20, “Accounting Changes,” and FASB SFAS No. 3, “Reporting Accounting
Changes in Interim Financial Statements.” Among other changes, SFAS No. 154 requires that a voluntary change in
accounting principle be applied retrospectively with all prior period financial statements presented on the new
accounting principle, unless it is impracticable to do so. SFAS No. 154 also provides that (1) a change in method of
depreciating or amortizing a long-lived nonfinancial asset be accounted for as a change in estimate (prospectively)
that was effected by a change in accounting principle, and (2) correction of errors in previously issued financial
statements should be termed a “restatement.” The new standard is effective for accounting changes and correction
of errors made in fiscal years beginning after December 15, 2005. We adopted this statement on January 1, 2006
without a material effect.
Item 6.
Directors, Senior Management and Employees
Supervisory Directors and Managing Directors are appointed annually for the period beginning on the date
following the Annual General Meeting up to and including the date of the Annual General Meeting held in the
following fiscal year.
Our Supervisory Directors and Managing Directors, and their ages as of February 1, 2007, are as follows:
Managing Directors:
Name
Age
Peer M. Schatz . . . . . . . . . . . . . . . . . . . . . . . . . . . . . . .
Roland Sackers . . . . . . . . . . . . . . . . . . . . . . . . . . . . . .
Dr. Joachim Schorr . . . . . . . . . . . . . . . . . . . . . . . . . . .
41
38
46
Bernd Uder . . . . . . . . . . . . . . . . . . . . . . . . . . . . . . . . .
49
40
Position
Managing Director, Chief Executive Officer
Managing Director, Chief Financial Officer
Managing Director, Senior Vice President,
Research and Development
Managing Director, Senior Vice President, Sales
and Marketing
Supervisory Board Members:
Name
Age
Prof. Dr. Detlev H. Riesner . . . . . . . . . . . . . . . . . . . . .
65
Dr. Heinrich Hornef . . . . . . . . . . . . . . . . . . . . . . . . . .
75
Dr. Metin Colpan . . . . . . . . . . . . . . . . . . . . . . . . . . . . .
Jochen Walter . . . . . . . . . . . . . . . . . . . . . . . . . . . . . . .
52
59
Dr. Franz A. Wirtz . . . . . . . . . . . . . . . . . . . . . . . . . . . .
74
Erik Hornnaess . . . . . . . . . . . . . . . . . . . . . . . . . . . . . .
69
Prof. Dr. Manfred Karobath . . . . . . . . . . . . . . . . . . . .
66
Position
Chairman of the Supervisory Board, Supervisory
Director and Chairman of the Selection and
Appointment Committee
Deputy Chairman of the Supervisory Board,
Supervisory Director, Chairman of the Audit
Committee and Member of the Selection and
Appointment Committee
Supervisory Director
Supervisory Director and Member of the Audit
Committee until the last Annual General
Meeting of Shareholders in June 2006
Supervisory Director, Chairman of the
Compensation Committee and member of the
Audit Committee
Supervisory Director, Member of the Audit
Committee and Member of the Compensation
Committee
Supervisory Director and Member of the
Compensation Committee
Prof. Dr. jur Carsten P. Claussen was appointed as non-voting Special Advisor to the Supervisory Board and
Honorary Chairman in 1999.
The following is a brief summary of the background of each of the Supervisory Directors, Managing
Directors and the Honorary Chairman. Supervisory Directors and Managing Directors are appointed annually for
the period beginning on the day following the Annual General Meeting up to and including the date of the
Annual General Meeting held in the following fiscal year.
Peer M. Schatz joined QIAGEN in 1993 and has been Chief Executive Officer since January 1, 2004.
Between 1993 and 2003 he was Chief Financial Officer and became a Managing Director in 1998. Mr. Schatz
was previously a partner in a private management buyout group in Switzerland and worked in finance and
systems positions in Sandoz, Ltd. and Computerland AG, as well as in finance, operations, management and sales
positions in various start-up companies in the computer and software trading industry in Europe and the United
States. Mr. Schatz graduated from the University of St. Gall, Switzerland, with a Master’s degree in Finance in
1989 and obtained an M.B.A. in Finance from the University of Chicago Graduate School of Business in 1991.
Mr. Schatz also serves in the capacities of Vice Chairman and Audit Committee Chairman of Evotec AG and as
director to Mulligan BioCapital AG, acted as a member of the Advisory Board (Börsenrat) of the Frankfurt Stock
Exchange through 2004, and also serves as a member of the German Corporate Governance Commission.
Roland Sackers joined QIAGEN in 1999 as Vice President Finance and has been Chief Financial Officer
and Deputy Managing Director since 2004. In 2006, Mr. Sackers became a Managing Director. Between 1995
and 1999, he acted as an auditor with Arthur Andersen Wirtschaftsprüfungsgesellschaft
Steuerberatungsgesellschaft. Mr. Sackers graduated from the Westfälische Wilhelms-Universität Münster,
Germany with an M.B.A. Until 2006, he was a member of the supervisory board and Audit Committee of IBS
AG. Since July 2004, Mr. Sackers has been a member of the board of directors of Operon Biotechnologies, Inc.
Dr. Joachim Schorr joined QIAGEN in 1992 and has been Senior Vice President Research & Development
since January 1, 2004. He became a Managing Director in 2004. Initially, Dr. Schorr served QIAGEN as Project
Manager and later had responsibilities as Business Unit Manager. In 1999, Dr. Schorr became Vice President
Research & Development with the responsibility for the world-wide QIAGEN R&D activities. Before joining
41
QIAGEN, Dr. Schorr worked for the pharmaceutical company Hoechst AG on the development of oral malaria
vaccines and was awarded with the IHK research award in 1991. Dr. Schorr holds a Ph.D. in Molecular Biology
and Virology from the University of Cologne. Dr. Schorr is a co-founder of Coley Pharmaceuticals, EnPharma
Pharmaceuticals and QBM Cell Sciences and is currently a member of the supervisory board of QBM Cell
Sciences.
Bernd Uder joined QIAGEN in 2001 as Vice President Sales & Marketing and became a Managing Director
and Senior Vice President Sales & Marketing in 2004. With completion of the restructuring of QIAGEN’s
Sales & Marketing organization, Bernd Uder became Senior Vice President Global Sales in 2005. Before joining
QIAGEN, Mr. Uder gained wide experience in building up and coordinating world-wide distribution networks as
Vice President European Biolab Sales & Marketing with Pharmacia and Vice President global e.business with
Amersham Pharmacia Biotech. Today, Mr. Uder is responsible for the extension and the improvement of
efficiencies of QIAGEN’s global distribution network.
Professor Dr. Detlev H. Riesner is a co-founder of QIAGEN. He has been on our Supervisory Board since
1984 and was appointed Chairman of the Supervisory Board in 1999. Professor Riesner has held the Chair of
Biophysics at the Heinrich-Heine-University in Düsseldorf since 1980. In 1996, he was also appointed to the
position of Vice President of Research, and in 1999, he was nominated Director of Technology at the University
of Düsseldorf. Prior to that, he was Professor of Biophysical Chemistry at the Darmstadt Institute of Technology
and, from 1975 to 1977, Lecturer of Biophysical Chemistry at Hannover Medical School. He has held guest
professorships at the Institute of Microbiology, Academia Sinica, Beijing, and the Department of Neurology at
the University of California, San Francisco. He received his M.S. in Physics from Hannover Institute of
Technology and his Ph.D. from the University of Braunschweig, with post-graduate work at Princeton
University. Professor Riesner is either a member of the supervisory board or a director of New Lab Bioquality
AG, Erkrath, AC Immune S.A., Lausanne and Neuraxo GmbH, Düsseldorf. Professor Riesner is also a member
of the scientific advisory boards of the RiNA network, Berlin, the Friedrich-Loeffler-Institut, Isle of Riems, and
PrioNet, Canada.
Dr. Heinrich Hornef has been on our Supervisory Board since 2000 and was appointed Deputy Chairman
of the Supervisory Board and Audit Committee Chairman in 2001. He also serves as a chairman on the
supervisory board of Heidelberg Innovation GmbH, a biotechnology and life-science venture capital company in
Heidelberg, Germany. He was chairman of the supervisory board of the pharmaceutical company Merck KGaA,
in Darmstadt, Germany until December 2003 and a member of the supervisory board until March 2004, as well
as a member of the partners’ counsel of E. Merck, in Darmstadt, Germany until June 2004. Prior to his retirement
in December 1996, Dr. Hornef served as CFO of Boehringer Mannheim GmbH (1973-1991), as CFO of the
Berlin-based Treuhandanstalt, the privatization agency in East-Germany (1992-1994), and as president of its
successor organization, BvS (1995-1996).
Dr. Metin Colpan is a co-founder of QIAGEN and was Chief Executive Officer and a Managing Director
from 1985 through 2003. Dr. Colpan obtained his Ph.D. and M.Sc. in Organic Chemistry and Chemical
Engineering from the Darmstadt Institute of Technology in 1983. Prior to founding QIAGEN, Dr. Colpan was an
Assistant Investigator at the Institute for Biophysics at the University of Düsseldorf. Dr. Colpan has had wide
experience in separation techniques, and in the separation and purification of nucleic acids in particular, and has
filed many patents in the field. Dr. Colpan currently serves as a supervisory board member of GenPat77
Pharmacogenetics AG, GPC Biotech AG and Morphosys AG, each in Munich, Germany. Until 2006, he was a
member of the supervisory board of Ingenium Pharmaceuticals AG in Munich, Germany.
Dr. Franz A. Wirtz has been a member of our Supervisory Board since 1989. Dr. Wirtz was managing
director of Grünenthal GmbH, Aachen, Germany, a large, private pharmaceutical company from 1962-1997 and
a member of its advisory board from 1998-2001. He is Vice Chairman of Paion AG, Aachen and Vice Chairman
of Dasgip AG, Jülich, two young German biotech companies. For ten years Dr. Wirtz was treasurer of the
German pharmaceutical industry association. Dr. Wirtz holds a doctorate degree in chemistry from the
Rheinisch-Westfälische Technische Hochschule in Aachen where he became an honorary citizen in 2001.
42
Erik Hornnaess has been a member of our Supervisory Board since 1998 and joined the Audit Committee
in 2002 and the Compensation Committee in 2005. Mr. Hornnaess worked for Astra Pharmaceuticals, Sweden
from 1965 until 1979 in various management positions in Sweden, Australia, and Canada and, for the last three
years of this period, as the General Manager for the Benelux region (Belgium, The Netherlands and
Luxembourg). In 1979, he joined Abbott Laboratories European Headquarters in Paris, France, and from 1982,
he was the Area Vice-President of Abbott Diagnostic Division in Europe, Middle-East and Africa, with
headquarters in Wiesbaden, Germany. Mr. Hornnaess retired from Abbott Laboratories on March 1, 1997 and
currently serves as non-executive director of AXIS-SHIELDS Group, Scotland. Additionally, Mr. Hornnaess
served as the Vice-President of European Diagnostic Manufacturers Association (EDMA), Brussels in the period
1995 through 1997. Mr. Hornnaess graduated from Aarhus Handelshojskole, Denmark with an M.B.A. and
obtained a P.M.D. from the Harvard Business School.
Professor Dr. Manfred Karobath has been a member of our Supervisory Board since 2000. Dr. Karobath
studied medicine, and from 1967 to 1980 he worked first in the Dept. of Biochemistry of the University of
Vienna and, after a stage as postdoctoral fellow, he joined the Dept. of Psychiatry where he became professor of
biological Psychiatry. In 1980, he joined Sandoz Pharma in Basel, first, in drug discovery, and later, he became
Senior Vice President and head of R&D. In 1992, Prof. Dr. Karobath joined Rhone Poulenc Rorer (“RPR”) as
President of R&D and Executive Vice President, and later, he became a member of the boards of directors of
RPR, Pasteur Mérieux Connought, Centeon and Rhone Poulenc Pharma. He has received several scientific
awards and has published 92 scientific papers. Dr. Karobath also serves as a member of the board of directors of
Coley Pharmaceutical Group.
Professor Dr. jur. Carsten P. Claussen was Chairman of our Supervisory Board from 1988 to June 1999
and was appointed as a Special Advisor and Honorary Chairman in 1999. This position is not required by Dutch
law, and Professor Claussen is no longer a voting member of the Supervisory Board. For many years he has
pursued a career in private banking. Between 1976 and 1987, Professor Claussen was a member of the executive
board of Norddeutsche Landesbank, Hannover, and Chairman of the Hannover Stock Exchange. Since 1987, he
has been a lawyer in Düsseldorf and senior advisor to IKB Deutsche Industriekreditbank, Düsseldorf. At present,
he is a partner in the law firm of Hoffmann Liebs and Partner and specializes in corporate law and capital market
transactions. He is Chairman of the Board of TON ART AG, Düsseldorf; Flossbach & v. Storch
Vermögensmanagement AG, Cologne; and WAS Worldwide Analytical Systems AG, Cleve and is a member of
other boards. Professor Claussen received his Ph.D. in law from the University of Cologne.
Compensation of Directors and Officers
The tables below state the amounts earned on an accrual basis by Directors and Officers in 2006. The
variable component is based on performance relative to personal goals and corporate goals agreed to by the
Supervisory Board.
The compensation granted to the members of the Managing Board in 2006 consisted of a fixed salary and
other variable components. Variable compensation includes one-time and annual payments linked to business
performance (bonuses), as well as long-term incentives containing risk elements, including, but not limited to,
stock options or other equity-based compensation and pension plans. The variable part of the compensation is
designed to strengthen the Board members’ commitment to QIAGEN and its objectives.
Year ended December 31, 2006
Name
Fixed Salary
Peer M. Schatz . . . . . . . . . . . . . . . . . . . . . . . . . . . . . . . . . . . .
Roland Sackers . . . . . . . . . . . . . . . . . . . . . . . . . . . . . . . . . . .
Dr. Joachim Schorr . . . . . . . . . . . . . . . . . . . . . . . . . . . . . . . .
Bernd Uder . . . . . . . . . . . . . . . . . . . . . . . . . . . . . . . . . . . . . .
43
$942,000
$377,000
$259,000
$276,000
Annual Compensation
Variable Cash
Bonus
Other (1)
$373,000
$128,000
$104,000
$104,000
$ 1,000
$157,000
$ 38,000
$ 10,000
Total
$1,316,000
$ 662,000
$ 401,000
$ 390,000
(1) Amounts include, among others, inventor bonus and expatriate fringe pay. Does not include the
reimbursement of certain expenses relating to travel incurred at the request of QIAGEN or other
reimbursements or payments that in total did not exceed the lesser of $50,000 or 10% or the total salary and
bonus reported for the officer.
The Supervisory Board compensation for 2006 consists of fixed compensation for Board members, an
additional amount for Chairman and Vice Chairman, and committee membership fees. Supervisory Directors
receive variable compensation, which is determined annually by the Compensation Committee pursuant to a
formula based on growth of adjusted Earnings per Share provided that such remuneration will not exceed EUR
5,000 per year. We did not pay any agency or advisory service fees to members of the Supervisory Board other
than $524,000 to Dr. Colpan for his scientific consulting services.
Name
Supervisory Board:
Prof. Dr. Detlev H. Riesner . . . . .
Dr. Heinrich Hornef . . . . . . . . . .
Dr. Metin Colpan . . . . . . . . . . . .
Jochen Walter (1) . . . . . . . . . . . .
Dr. Franz A. Wirtz . . . . . . . . . . .
Erik Hornnaess . . . . . . . . . . . . . .
Prof. Dr. Manfred Karobath . . . .
Fixed Salary
Chairman/
Vice-Chairman
Committee
Meeting
Attendance
Committee
Membership
Variable Cash
Bonus
Total
$15,000
$15,000
$15,000
$15,000
$15,000
$15,000
$15,000
$15,000
$10,000
—
—
$ 5,000
—
—
$ 6,000
$11,000
$ 5,000
$ 5,000
$ 8,000
$10,000
$ 4,500
$2,500
$5,000
—
$2,500
$3,750
$5,000
$2,500
$7,000
$7,000
$7,000
$7,000
$7,000
$7,000
$7,000
$45,500
$48,000
$27,000
$29,500
$38,750
$37,000
$29,000
(1) Mr. Jochen Walter was a member of our Supervisory Board from 1988 until 2006 during which time he
served on the Audit Committee from 1996 until 2006.
Board members also receive a variable component, in the form of share-based compensation. Stock options
granted to the Managing and Supervisory Boards must have an exercise price that is higher than the market price
at the time of grant. During 2006, no options or other share-based compensation were granted to the members of
the Managing and Supervisory Board.
Year ended December 31, 2006
Long-Term Compensation
Defined
Contribution
Benefit Plan
Stock Options
Name
Peer M. Schatz . . . . . . . . . . . . . . . . . . . . . . . . . . . . . . . . . . . . . . . . . . . . . .
Roland Sackers . . . . . . . . . . . . . . . . . . . . . . . . . . . . . . . . . . . . . . . . . . . . . .
Dr. Joachim Schorr . . . . . . . . . . . . . . . . . . . . . . . . . . . . . . . . . . . . . . . . . .
Bernd Uder . . . . . . . . . . . . . . . . . . . . . . . . . . . . . . . . . . . . . . . . . . . . . . . . .
44
$73,000
$63,000
$23,000
$23,000
—
—
—
—
The following table sets forth the vested and unvested options of our officers and directors as of February 1,
2007:
Name
Total Vested
Options
Total Unvested
Options
Expiration Dates
Exercise Prices
Peer M. Schatz . . . . . . . . . . . . . . . . . . . .
Roland Sackers . . . . . . . . . . . . . . . . . . . .
Dr. Joachim Schorr . . . . . . . . . . . . . . . . .
Bernd Uder . . . . . . . . . . . . . . . . . . . . . . .
Prof. Dr. Detlev H. Riesner . . . . . . . . . .
Dr. Heinrich Hornef . . . . . . . . . . . . . . . .
Dr. Metin Colpan . . . . . . . . . . . . . . . . . .
Dr. Franz A. Wirtz . . . . . . . . . . . . . . . . .
Erik Hornnaess . . . . . . . . . . . . . . . . . . . .
Prof. Dr. Manfred Karobath . . . . . . . . . .
2,399,876
375,925
241,444
192,607
90,667
76,000
1,128,150
128,000
122,300
90,000
—
—
—
—
—
—
—
—
—
—
1/2008 to 12/2015
9/2009 to 12/2015
10/2011 to 12/2015
3/2011 to 12/2015
1/2010 to 12/2015
1/2010 to 12/2015
2/2007 to 12/2015
1/2008 to 12/2015
1/2008 to 12/2015
1/2010 to 12/2015
$ 4.590 to $20.563
$ 8.940 to $20.563
$ 8.940 to $17.900
$ 8.940 to $20.563
$ 6.018 to $20.563
$11.985 to $20.563
$ 3.219 to $20.563
$ 5.625 to $20.563
$ 5.625 to $20.563
$ 6.018 to $20.563
During 2005 and 2004, certain stock options were accelerated as discussed further below under “Stock
Plan.”
The Supervisory Board has established an Audit Committee, a Compensation Committee and a Selection
and Appointment Committee, which are comprised of the following members:
Name of Supervisory Director
Independent
Member of Audit
Committee
Member of
Compensation
Committee
Prof. Dr. Detlev Riesner
✓
Dr. Heinrich Hornef
✓
Prof. Dr. Manfred Karobath
✓
Dr. Franz Wirtz
✓
✓
✓
(Chairman)
Erik Hornnaess
✓
✓
✓
Member of Selection and
Appointment Committee
✓
(Chairman)
✓
(Chairman)
✓
✓
Audit Committee
The Audit Committee operates pursuant to a charter approved by the Supervisory Board and available
online at www.qiagen.com. The Audit Committee consists of three members, Dr. Hornef (Chairman),
Mr. Hornnaess and Dr. Wirtz, and meets at least quarterly. The Audit Committee members are appointed by the
Supervisory Board and serve for a term of one year. We believe that all members of our Audit Committee meet
the independence requirements as set forth in the Sarbanes-Oxley Act of 2002 and the Marketplace Rules of the
NASDAQ. The Audit Committee is responsible together with the Managing Board for the proposal of the
independent registered public accounting firm to the Supervisory Board, which proposes the appointment of the
independent registered public accounting firm to the General Meeting of Shareholders. The independent
registered public accounting firm audits the consolidated financial statements and local books and records of
QIAGEN and its subsidiaries, and the Audit Committee is further responsible for pre-approving the fees for such
services. Additionally, the Audit Committee reviews the performance of the independent registered public
accounting firm with management, discussing on a quarterly basis the scope and results of the reviews and audits
with the independent registered public accounting firm; discusses our financial accounting and reporting
principles and policies and the adequacy of our internal accounting, financial and operating controls and
procedures with the independent registered public accounting firm and management; considers and approves any
45
recommendations regarding changes to our accounting policies and processes; reviews with management and the
independent registered public accounting firm our quarterly earnings reports prior to their release to the press;
and reviews the quarterly and annual reports (reported on Forms 6-K and 20-F) to be furnished to or filed with
the Securities and Exchange Commission and the Deutsche Boerse.
Compensation Committee
The Compensation Committee operates pursuant to a charter approved by the Supervisory Board and
available online at www.qiagen.com. The Compensation Committee consists of three members, Dr. Wirtz
(Chairman), Professor Karobath and Mr. Hornnaess. Members are appointed by the Supervisory Board and serve
for a term of one year. We believe that all of the members of the Compensation Committee meet the
independence requirements set forth in the Marketplace Rules of the NASDAQ. The Compensation Committee
reviews and approves all equity based compensation, reviews and approves the annual salaries, bonuses and other
benefits of executive officers, and reviews general policies relating to employee compensation and benefits.
Selection and Appointment Committee
The Selection and Appointment Committee operates pursuant to a charter approved by the Supervisory
Board and available online at www.qiagen.com. The current members of the Selection and Appointment
Committee are Prof. Dr. Detlev H. Riesner (Chairman) and Dr. Heinrich Hornef. The Selection and Appointment
Committee prepares the selection criteria and appointment procedures for members of our Supervisory Board and
the Managing Board; periodically evaluates the scope and composition of the Managing Board and Supervisory
Board and proposes the profile of the Supervisory Board in relation thereto. Additionally, the Committee
periodically evaluates the functioning of individual members of the Managing Board and Supervisory Board and
reports the results thereof to the Supervisory Board and proposes the (re-)appointments of members of our
Managing Board and Supervisory Board. The Committee prepares and submits to the Supervisory Board on an
annual basis a report of its deliberations and findings.
Employment Contracts
We have entered into employment contracts with our Managing Directors. These contracts are listed as
Exhibits under Item 19.
We have not entered into contracts with any member of the Supervisory Board that provide for benefits
upon a termination of the service of the member. We entered into a consulting agreement with Dr. Colpan
pursuant to which Dr. Colpan is paid a fee of EUR 2,750 per day (approximately $3,600 at the December 31,
2006 exchange rate) for consulting services.
Employees
As of December 31, 2006, we employed 1,954 individuals, 17% of whom worked in research and
development, 38% in sales, 25% in production/logistics, 7% in marketing and 14% in administration.
Country
United States and Canada . . . . . . . . . . . . . . . .
Europe . . . . . . . . . . . . . . . . . . . . . . . . . . . . . . .
Asia . . . . . . . . . . . . . . . . . . . . . . . . . . . . . . . . .
Rest of World . . . . . . . . . . . . . . . . . . . . . . . . .
12/31/2006 . . . . . . . . . . . . . . . . . . . . . . .
Research
and
Development
Sales
Production
Marketing
Administration
Total
23
295
14
0
332
239
290
199
14
742
125
288
69
0
482
20
94
18
1
133
54
167
40
4
265
461
1,134
340
19
1,954
At December 31, 2005 and 2004, we employed 1,589 and 1,322 individuals, respectively. None of our
employees is represented by a labor union or subject to a collective bargaining agreement. Management believes
that its relations with its employees are good.
46
Our success depends, to a significant extent, on key members of our management and our scientific staff.
The loss of such employees could have a material adverse effect on QIAGEN. Our ability to recruit and retain
qualified skilled personnel to perform future research and development work will also be critical to our success.
Due to the intense competition for experienced scientists from numerous pharmaceutical and biotechnology
companies and academic and other research institutions, there can be no assurance that we will be able to attract
and retain such personnel on acceptable terms. Our planned activities will also require additional personnel,
including management, with expertise in areas such as manufacturing and marketing, and the development of
such expertise by existing management personnel. The inability to acquire such personnel or develop such
expertise could have a material adverse impact on our operations.
Share Ownership
The following table sets forth certain information as of February 1, 2007 concerning the ownership of
Common Shares by our Directors and Officers. In preparing the following table, we have relied on information
furnished by such persons.
Shares Beneficially
Owned (1) Number
Name and Country of Residence
Peer M. Schatz, Germany . . . . . . . . . . . . . . . . . . . . . . . . . . . . . . . . . . . . . . . . . . .
Roland Sackers, Germany . . . . . . . . . . . . . . . . . . . . . . . . . . . . . . . . . . . . . . . . . . .
Dr. Joachim Schorr, Germany . . . . . . . . . . . . . . . . . . . . . . . . . . . . . . . . . . . . . . . .
Bernd Uder, Germany . . . . . . . . . . . . . . . . . . . . . . . . . . . . . . . . . . . . . . . . . . . . . .
Prof. Dr. Detlev H. Riesner, Germany . . . . . . . . . . . . . . . . . . . . . . . . . . . . . . . . .
Dr. Heinrich Hornef, Germany . . . . . . . . . . . . . . . . . . . . . . . . . . . . . . . . . . . . . . .
Dr. Metin Colpan, Germany . . . . . . . . . . . . . . . . . . . . . . . . . . . . . . . . . . . . . . . . .
Dr. Franz A. Wirtz, Germany . . . . . . . . . . . . . . . . . . . . . . . . . . . . . . . . . . . . . . . .
Erik Hornnaess, Spain . . . . . . . . . . . . . . . . . . . . . . . . . . . . . . . . . . . . . . . . . . . . . .
Professor Dr. Manfred Karobath, UK . . . . . . . . . . . . . . . . . . . . . . . . . . . . . . . . . .
*
(1)
(2)
(3)
(4)
(5)
(6)
(7)
1,482,064(3)
0(4)
0(5)
0(6)
2,104,136(7)
0(8)
6,442,025(9)
950,000(10)
10,000(11)
0(12)
Percent
Ownership (2)
1.0%
*
*
*
1.4%
*
4.3%
0.6%
*
*
Indicates that the person beneficially owns less than 1% of the Common Shares issued and outstanding as of
February 1, 2007.
The number of Common Shares issued and outstanding as of February 1, 2007 was 150,194,991. The
persons and entities named in the table have sole voting and investment power with respect to all shares
shown as beneficially owned by them and have the same voting rights with respect to Common Shares.
Does not include Common Shares subject to options held by such persons at February 1, 2007 and
exercisable within 60-days thereafter. See footnotes below for such information on options exercisable at
February 1, 2007 and within 60-days thereafter.
Does not include 2,399,876 shares issuable upon the exercise of options to purchase Common Shares at an
exercise price from $4.590 to $20.563 per share. Options expire in increments during the period between
January 2008 and December 2015.
Does not include 375,925 shares issuable upon the exercise of options to purchase Common Shares at an
exercise price from $8.940 to $20.563 per share. Options expire in increments during the period between
September 2009 and December 2015.
Does not include 241,444 shares issuable upon the exercise of options to purchase Common Shares at an
exercise price from $8.940 to $17.900 per share. Options expire in increments during the period between
October 2011 and December 2015.
Does not include 192,607 shares issuable upon the exercise of options to purchase Common Shares at an
exercise price from $8.940 to $20.563 per share. Options expire in increments during the period between
March 2011 and December 2015.
Does not include 90,667 shares issuable upon the exercise of options to purchase Common Shares at an
exercise price ranging from $6.018 to $20.563 per share. Options expire in increments during the period
between January 2010 and December 2015. Prof. Riesner also has the option to purchase 82,302 common
shares through Thomé Asset Management & Controlling. Includes 2,104,136 shares held by Riesner
Verwaltungs GmbH, of which Professor Riesner is the sole stockholder.
47
(8) Does not include 76,000 shares issuable upon the exercise of options to purchase Common Shares at an
exercise price from $11.985 to $20.563 per share. Options expire in increments during the period between
January 2010 and December 2015.
(9) Does not include 1,128,150 shares issuable upon the exercise of options to purchase Common Shares at an
exercise price ranging from $3.219 to $20.563 per share. Options expire in increments during the period
between February 2007 and December 2015. Includes 5,188,000 shares held by CC Verwaltungs GmbH, of
which Dr. Colpan is the sole stockholder and 800,000 shares held by Colpan GbR. Dr. Colpan also has the
option to purchase 612,397 common shares through Thomé Asset Management & Controlling.
(10) Does not include 128,000 shares issuable upon the exercise of options to purchase Common Shares at an
exercise price ranging from $5.625 to $20.563 per share. Options expire in increments during the period
between January 2008 and December 2015.
(11) Does not include 122,300 shares issuable upon the exercise of options to purchase Common Shares at an
exercise price ranging from $5.625 to $20.563 per share. Options expire in increments during the period
between January 2008 and December 2015.
(12) Does not include 90,000 shares issuable upon the exercise of options to purchase Common Shares at an
exercise price ranging from $6.018 to $20.563 per share. Options expire in increments during the period
between January 2010 and December 2015.
Stock Plan
During 2005, we adopted the QIAGEN N.V. Amended and Restated 2005 Stock Plan (the Plan) which was
approved by our shareholders on June 14, 2005. Pursuant to the Plan, stock rights, which include options to
purchase our Common Shares, stock grants and stock based awards, may be granted to employees and
consultants of QIAGEN and its subsidiaries and to Supervisory Directors. An aggregate of 20,000,000 Common
Shares have been reserved for issuance pursuant to the Plan, subject to certain antidilution adjustments. Options
granted pursuant to the Plan may either be incentive stock options within the meaning of Section 422 of the
United States Internal Revenue Code of 1986, as amended (the Code), or non-qualified stock options. The Plan is
administered by the Compensation Committee of the Supervisory Board, which selects participants from among
eligible employees, consultants and directors and determines the number of shares subject to the option, the
length of time the option will remain outstanding, the manner and time of the option’s exercise, the exercise price
per share subject to the option and other terms and conditions of the option consistent with the Plan. The
Compensation Committee’s decisions are subject to the approval of the Supervisory Board. The vesting and
exercisability of certain stock rights will be accelerated in the event of a Change of Control. A “Change of
Control” means the occurrence of a merger or consolidation of QIAGEN, whether or not approved by the Board
of Directors, other than a merger or consolidation which would result in the voting securities of QIAGEN
outstanding immediately prior thereto continuing to represent (either by remaining outstanding or by being
converted into voting securities of the surviving entity or the parent of such corporation) at least 50% of the total
voting power represented by the voting securities of QIAGEN or such surviving entity or parent of such
corporation, as the case may be, outstanding immediately after such merger or consolidation, or the stockholders
of QIAGEN approve an agreement for the sale or disposition by QIAGEN of all or substantially all of
QIAGEN’s assets.
The Compensation Committee has the power, subject to Supervisory Board approval, to interpret the Plan
and to adopt such rules and regulations (including the adoption of “sub plans” applicable to participants in
specified jurisdictions) as it may deem necessary or appropriate. The Compensation Committee or the
Supervisory Board may at any time amend the Plan in any respect, subject to Supervisory Board approval, and
except that (i) no amendment that would adversely affect the rights of any participant under any option
previously granted may be made without such participant’s consent and (ii) no amendment shall be effective
prior to shareholder approval to the extent such approval is required to ensure favorable tax treatment for
incentive stock options or to ensure compliance with Rule 16b-3 under the United States Securities Exchange Act
of 1934, as amended (the Exchange Act) at such times as any participants are subject to Section 16 of the
Exchange Act.
48
The following table sets forth the total amount of options to purchase Common Shares outstanding under the
Plan, the range of expiration dates of such options and the prices (in U.S. dollars) at which such options may be
exercised, as of February 1, 2007. The exercise price of each of these options is the fair market value of the
Common Shares as of the date of grant or a premium above fair market value.
2005 Plan . . . . . . . . . . . . . . . . . . . . . . . . . . . .
Outstanding
Options
Expiration Dates
Exercise Price of
Shares
11,673,811
2/2007 to 12/2016
$1.060 to $49.75
During the fourth quarters of 2005 and 2004 and considering the new accounting implications of SFAS
No. 123(R), our Supervisory Board approved the acceleration of the vesting of 1.2 million and 829,000 stock
options, respectively. The 2005 acceleration applied to certain in-the-money options and to options held by
Supervisory and Managing Board members. Under the accounting guidance of APB 25 and FASB Interpretation
No. 44 “Accounting for Certain Transactions Involving Stock Compensation—An Interpretation of APB Opinion
No. 25,” the 2005 acceleration of vesting did not result in compensation expense as these options, after applying
an estimate of the termination of services, had a de minimis intrinsic value. The 2004 acceleration applied to
stock options that had a price greater than or equal to the fair market value of our common shares
(out-of-the-money) as of the close of day that the plan was approved by the Supervisory Board, or $10.62. The
accelerated options were given a sales restriction, such that any shares held through the exercise of an accelerated
option could not be sold, prior to the original vesting date. Under the accounting guidance of APB 25, the 2004
acceleration of vesting did not result in any compensation expense as these options had no intrinsic value. The
accelerations, however, allowed us to avoid recording approximately $2.8 million, after tax, of future
compensation expense that would have been required to be recognized under SFAS No. 123(R). Upon adoption
of SFAS No. 123(R) on January 1, 2006, we did not have any stock-based compensation expense from these
accelerated options. The Supervisory Board took the action based on its belief that it is in the best interest of our
shareholders and QIAGEN as it will reduce reported compensation expense in future periods. We have worked
with equity based compensation plan experts to evaluate its stock-based compensation plans and incentive
strategies in light of the provisions of SFAS No. 123(R). Our aim is to implement an equity based compensation
plan structure that will give employees a long-term incentive arrangement while minimizing compensation
expense.
Options granted to members of the Supervisory Board and the Managing Board must have an exercise price
that is higher than the market price at the time of grant. Generally, each of the options has a term of ten years,
subject to earlier termination in the event of death, disability or other termination of employment. The vesting
and exercisability of certain of these options will be accelerated in the event of a Change of Control, as discussed
above. As of February 1, 2007, options to purchase 4.8 million Common Shares were held by the officers and
directors of QIAGEN, as a group.
Exemptions from Certain NASDAQ Corporate Governance Rules
Exemptions from the NASDAQ corporate governance standards are available to foreign private issuers such
as QIAGEN when those standards are contrary to a law, rule or regulation of any public authority exercising
jurisdiction over such issuer or contrary to generally accepted business practices in the issuer’s country of
domicile. In connection with QIAGEN’s initial public offering, NASDAQ granted QIAGEN exemptions from
certain corporate governance standards that are contrary to the laws, rules, regulations or generally accepted
business practices of The Netherlands. These exemptions and the practices followed by QIAGEN are described
below:
•
QIAGEN is exempt from NASDAQ’s quorum requirements applicable to meetings of ordinary
shareholders. In keeping with the law of The Netherlands and generally accepted business practices in
The Netherlands, QIAGEN’s Articles of Association provide that there are no quorum requirements
generally applicable to meetings of shareholders.
49
•
QIAGEN is exempt from NASDAQ’s requirements regarding the solicitation of proxies and provision
of proxy statements for meetings of shareholders. QIAGEN does furnish proxy statements and solicit
proxies for meetings of shareholders. However, the laws of The Netherlands do not provide for a
“record date” to be fixed in advance of a meeting of shareholders. As a result, the holder of the shares
on the day of the meeting may vote the shares at the meeting. QIAGEN’s transfer agent has
implemented procedures to check votes by proxy for validity on the day of the meeting.
•
QIAGEN is exempt from NASDAQ’s requirements that shareholder approval be obtained prior to the
establishment of, or material amendments to, stock option or purchase plans and other equity
compensation arrangements pursuant to which options or stock may be acquired by directors, officers,
employees or consultants. QIAGEN is also exempt from NASDAQ’s requirements that shareholder
approval be obtained prior to certain issuances of stock resulting in a change of control, occurring in
connection with acquisitions of stock or assets of another company or issued at a price less than the
greater of book or market value other than in a public offering. QIAGEN’s Articles of Association do
not require stockholder approval prior to the establishment of a stock plan. The Articles of Association
also permit shareholders to grant the Supervisory Board general authority to issue shares without further
shareholder approval. QIAGEN’s stockholders have granted the Supervisory Board general authority to
issue up to a maximum of our authorized capital without further shareholder approval. QIAGEN plans
to seek shareholder approval of stock plans and stock issuances only where required under the law of
The Netherlands or under QIAGEN’s Articles of Association.
Item 7.
Major Shareholders and Related Party Transactions
The following table sets forth certain information as of December 31, 2006, concerning the ownership of
Common Shares of each holder of greater than five percent ownership. None of these holders have any different
voting rights than other holders of our Common Shares.
Shares Beneficially
Owned
Number
Name and Country of Residence
FMR Corp. United States . . . . . . . . . . . . . . . . . . . . . . . . . .
18,425,233(2)
Percent Ownership (1)
12.27%
(1) The percentage ownership was calculated based on 150,167,540 Common Shares issued and outstanding as
of December 31, 2006.
(2) Of the 18,425,233 shares attributed to FMR Corp., it has sole voting power over 9,863,533 shares and sole
dispositive power of all 18,425,233 shares. Such voting and dispositive power is also attributable to Edward
C. Johnson III by virtue of his position, Chairman, and ownership interests in FMR Corp, and to members of
Mr. Johnson’s family by virtue of their ownership interests in FMR Corp. This information is based solely
on the Schedule 13G filed jointly by FMR Corp., Edward C. Johnson III, and Fidelity Management and
Research Company with the Securities and Exchange Commission on February 15, 2007, which reported
ownership as of December 31, 2006. At December 31, 2005, FMR Corp. beneficially owned 19,391,037
shares representing 13.06% if the total Common Shares issued and outstanding at that time.
Our common stock is traded on the NASDAQ National Market in the United States, and on the Prime
Standard Segment of the Frankfurt Stock Exchange in Germany. A significant portion of our shares are held in
street name, therefore we generally have no way of determining who our shareholders are, their geographical
location or how many shares a particular shareholder owns.
Control of Registrant
To our knowledge, we are not directly or indirectly owned or controlled by another corporation, by any
foreign government, or by any other natural or legal person. As of February 1, 2007, the officers and directors of
QIAGEN as a group beneficially owned 10,988,225 Common Shares or 7.3% of the then outstanding Common
Shares.
50
Related Party Transactions
From time to time, we have transactions with companies in which we hold an interest all of which are
individually and in sum immaterial except for certain transactions as discussed below.
We have a 50% interest in a joint venture company, PreAnalytiX GmbH, which is accounted for under the
equity method. During 2005, the loans of both joint venture partners were converted to additional capital and
each joint venture partner made an additional investment of approximately $2.9 million. As of December 31,
2006 and 2005, we had accounts receivable from PreAnalytix of $20,000 and $359,000, and accounts payable to
PreAnalytix of $219,000 and $960,000, respectively.
In 2004, we sold a significant portion of our synthetic DNA business unit to Operon Biotechnologies, Inc.
(OBI) and agreed to provide certain transition services for a period of six months. We currently have a 16%
ownership interest in OBI and hold one board seat. We also have a Manufacturing and Supply Agreement with
OBI, wherein we granted to OBI an exclusive license to manufacture and supply certain RNA products to us. At
December 31, 2005, we had prepaid amounts of $2.0 million related to orders we placed under this agreement.
During the years ended December 31, 2006 and 2005, we sold to OBI certain, products technology and licenses
for $1.1 million and $645,000, respectively. As of December 31, 2006 and 2005, we had a loan receivable from
OBI of $5.2 million and $6.3 million, accounts receivable from OBI of $236,000 and $35,000, and accounts
payable to OBI of $898,000 and $265,000, respectively.
We have a 100% interest in QIAGEN Finance (Luxembourg) S.A. (QIAGEN Finance) and QIAGEN Euro
Finance (Luxembourg) S.A. (Euro Finance), which were established for the purpose of issuing convertible debt.
As discussed in Note 6, QIAGEN Finance and Euro Finance are variable interest entities with no primary
beneficiary, thus they are not consolidated. Accordingly, the convertible debt is not included in the consolidated
statements of QIAGEN N.V., though we do report the full obligation of the debt through its liabilities to
QIAGEN Finance and Euro Finance. As of December 31, 2006 and 2005, we had loans payable to QIAGEN
Finance of $150.0 million, amounts due to QIAGEN Finance of $3.4 million and amounts receivable from
QIAGEN Finance of $2.9 million and $2.4 million, respectively. As of December 31, 2006, we had a loan
payable to Euro Finance of $300.0 million, amounts due to Euro Finance of $4.7 million and amounts receivable
from Euro Finance of $1.9 million.
In 2004 we entered into a consulting agreement with Dr. Metin Colpan, our former Chief Executive Officer
and current Supervisory Board member, pursuant to which Dr. Colpan is paid a fee of EUR 2,750 per day for
consulting services subject to adjustment. During 2006 and 2005 we paid approximately $524,000 and $447,000,
respectively, to Dr. Colpan for scientific consulting services under this agreement.
Item 8.
Financial Information
See Item 18.
Legal Proceedings
We are not a party to any material litigation in any court, and management is not aware of any contemplated
proceeding by any individual, company or government authority against us.
Statement of Dividend Policy
We have not paid any dividends on our Common Shares since our inception and do not intend to pay any
dividends on our Common Shares in the foreseeable future. We intend to retain our earnings, if any, for the
development of our business.
51
Item 9.
The Listing of QIAGEN’s Common Shares
Effective July 3, 2006, our common shares began trading on the NASDAQ Global Select Market under the
symbol QGEN. Previously, since February 15, 2005, our common shares had been quoted on the NASDAQ
National Market under the symbol QGEN. Prior to that, since June 27, 1996, our common shares had been
quoted on the NASDAQ National Market under the symbol QGENF. The following table sets forth the annual
high and low closing sale prices for the last five years, the quarterly high and low closing sale prices for the last
two fiscal years, and the monthly high and low closing sale prices for the last six months of our common shares
on the NASDAQ National Market.
High ($)
Low ($)
20.81
12.85
15.61
13.77
16.15
4.51
5.20
8.74
10.56
11.72
High ($)
Low ($)
12.70
13.36
13.77
13.60
10.56
11.41
11.43
10.76
High ($)
Low ($)
Quarterly 2006:
First Quarter . . . . . . . . . . . . . . . . . . . . . . . . . . . . . . . . . . . . . . . . . . . . . . . . . . . . . . .
Second Quarter . . . . . . . . . . . . . . . . . . . . . . . . . . . . . . . . . . . . . . . . . . . . . . . . . . . . .
Third Quarter . . . . . . . . . . . . . . . . . . . . . . . . . . . . . . . . . . . . . . . . . . . . . . . . . . . . . . .
Fourth Quarter . . . . . . . . . . . . . . . . . . . . . . . . . . . . . . . . . . . . . . . . . . . . . . . . . . . . . .
15.42
15.35
15.85
16.15
11.72
12.83
13.42
14.24
Quarterly 2007:
First Quarter (through March 15, 2007) . . . . . . . . . . . . . . . . . . . . . . . . . . . . . . . . . .
17.91
15.32
High ($)
Low ($)
15.85
16.15
16.00
15.38
17.27
17.91
14.06
15.19
14.24
14.32
15.32
16.39
Annual
2002 . . . . . . . . . . . . . . . . . . . . . . . . . . . . . . . . . . . . . . . . . . . . . . . . . . . . . . . . . . . . . .
2003 . . . . . . . . . . . . . . . . . . . . . . . . . . . . . . . . . . . . . . . . . . . . . . . . . . . . . . . . . . . . . .
2004 . . . . . . . . . . . . . . . . . . . . . . . . . . . . . . . . . . . . . . . . . . . . . . . . . . . . . . . . . . . . . .
2005 . . . . . . . . . . . . . . . . . . . . . . . . . . . . . . . . . . . . . . . . . . . . . . . . . . . . . . . . . . . . . .
2006 . . . . . . . . . . . . . . . . . . . . . . . . . . . . . . . . . . . . . . . . . . . . . . . . . . . . . . . . . . . . . .
Quarterly 2005:
First Quarter . . . . . . . . . . . . . . . . . . . . . . . . . . . . . . . . . . . . . . . . . . . . . . . . . . . . . . .
Second Quarter . . . . . . . . . . . . . . . . . . . . . . . . . . . . . . . . . . . . . . . . . . . . . . . . . . . . .
Third Quarter . . . . . . . . . . . . . . . . . . . . . . . . . . . . . . . . . . . . . . . . . . . . . . . . . . . . . . .
Fourth Quarter . . . . . . . . . . . . . . . . . . . . . . . . . . . . . . . . . . . . . . . . . . . . . . . . . . . . . .
Monthly:
September 2006 . . . . . . . . . . . . . . . . . . . . . . . . . . . . . . . . . . . . . . . . . . . . . . . . . . . . .
October 2006 . . . . . . . . . . . . . . . . . . . . . . . . . . . . . . . . . . . . . . . . . . . . . . . . . . . . . . .
November 2006 . . . . . . . . . . . . . . . . . . . . . . . . . . . . . . . . . . . . . . . . . . . . . . . . . . . . .
December 2006 . . . . . . . . . . . . . . . . . . . . . . . . . . . . . . . . . . . . . . . . . . . . . . . . . . . . .
January 2007 . . . . . . . . . . . . . . . . . . . . . . . . . . . . . . . . . . . . . . . . . . . . . . . . . . . . . . .
February 2007 . . . . . . . . . . . . . . . . . . . . . . . . . . . . . . . . . . . . . . . . . . . . . . . . . . . . . .
52
Since September 25, 1997, our common shares were traded officially on the Frankfurt Stock Exchange,
Neuer Markt under the symbol QIA and with the security code number 901626. As of January 1, 2003, the
trading of our common shares was transferred from the Neuer Markt segment of the Frankfurt Stock Exchange to
the Prime Standard Segment of the Frankfurt Stock Exchange. The Neuer Markt segment was discontinued in
2004. The following table sets forth the annual high and low closing sale prices for the last five years, the
quarterly high and low closing sale prices for the last two fiscal years, and the monthly high and low closing sale
prices for the last six months of our common shares on the Neuer Markt or the Prime Standard, as applicable.
High (EUR)
Annual
2002 . . . . . . . . . . . . . . . . . . . . . . . . . . . . . . . . . . . . . . . . . . . . . . . . . . . . . . . . .
2003 . . . . . . . . . . . . . . . . . . . . . . . . . . . . . . . . . . . . . . . . . . . . . . . . . . . . . . . . .
2004 . . . . . . . . . . . . . . . . . . . . . . . . . . . . . . . . . . . . . . . . . . . . . . . . . . . . . . . . .
2005 . . . . . . . . . . . . . . . . . . . . . . . . . . . . . . . . . . . . . . . . . . . . . . . . . . . . . . . . .
2006 . . . . . . . . . . . . . . . . . . . . . . . . . . . . . . . . . . . . . . . . . . . . . . . . . . . . . . . . .
23.45
12.23
12.40
11.43
13.09
High (EUR)
Quarterly 2005:
First Quarter . . . . . . . . . . . . . . . . . . . . . . . . . . . . . . . . . . . . . . . . . . . . . . . . . .
Second Quarter . . . . . . . . . . . . . . . . . . . . . . . . . . . . . . . . . . . . . . . . . . . . . . . .
Third Quarter . . . . . . . . . . . . . . . . . . . . . . . . . . . . . . . . . . . . . . . . . . . . . . . . . .
Fourth Quarter . . . . . . . . . . . . . . . . . . . . . . . . . . . . . . . . . . . . . . . . . . . . . . . . .
9.62
10.35
11.21
11.43
Low (EUR)
4.46
4.93
7.15
8.20
9.55
Low (EUR)
8.20
9.35
9.56
9.19
High (EUR)
Low (EUR)
Quarterly 2006:
First Quarter . . . . . . . . . . . . . . . . . . . . . . . . . . . . . . . . . . . . . . . . . . . . . . . . . .
Second Quarter . . . . . . . . . . . . . . . . . . . . . . . . . . . . . . . . . . . . . . . . . . . . . . . .
Third Quarter . . . . . . . . . . . . . . . . . . . . . . . . . . . . . . . . . . . . . . . . . . . . . . . . . .
Fourth Quarter . . . . . . . . . . . . . . . . . . . . . . . . . . . . . . . . . . . . . . . . . . . . . . . . .
13.09
12.13
12.35
12.80
9.55
10.28
10.58
10.81
Quarterly 2007:
First Quarter (through March 15, 2007) . . . . . . . . . . . . . . . . . . . . . . . . . . . . .
13.95
11.67
High (EUR)
Low (EUR)
12.35
12.80
12.55
11.69
11.67
13.95
11.06
12.01
10.90
10.81
13.37
12.32
Monthly:
September 2006 . . . . . . . . . . . . . . . . . . . . . . . . . . . . . . . . . . . . . . . . . . . . . . . .
October 2006 . . . . . . . . . . . . . . . . . . . . . . . . . . . . . . . . . . . . . . . . . . . . . . . . . .
November 2006 . . . . . . . . . . . . . . . . . . . . . . . . . . . . . . . . . . . . . . . . . . . . . . . .
December 2006 . . . . . . . . . . . . . . . . . . . . . . . . . . . . . . . . . . . . . . . . . . . . . . . .
January 2007 . . . . . . . . . . . . . . . . . . . . . . . . . . . . . . . . . . . . . . . . . . . . . . . . . .
February 2007 . . . . . . . . . . . . . . . . . . . . . . . . . . . . . . . . . . . . . . . . . . . . . . . . .
Item 10.
Additional Information
Memorandum and Articles of Association
We are registered in the commercial register of the Chamber of Commerce and Industries (Kamer van
Koophandel), Limburg-Noord, under the entry number “12036979.” Set forth is a summary of certain provisions
of our Articles of Association, as amended on June 14, 2005, or the Articles, and Dutch law, where applicable.
Furthermore a Dutch Corporate Governance Code, or Code, has been published on December 9, 2003 including
principles of good corporate governance and best practice provisions. The Code contains the principles and
concrete provisions which the persons involved in a listed company (including management board members and
53
supervisory board members) and stakeholders should observe in relation to one another. A listed company should
explain in its annual report whether, and if so why and to what extent, it does not comply with the best practice
provisions of the Code. The Code has been taken into account in the summary below.
Such summary does not purport to be complete and is qualified in its entirety by reference to the Articles,
Dutch Law and the Code.
Our Objects
Our objects are found in Article 2 of the Articles. Our objects include, without limitation, the performance
of activities in the biotechnology industry, as well as incorporating, acquiring, participating in, financing,
managing and having any other interest in companies or enterprises of any nature, raising and lending funds and
such other acts as may be conducive to our business.
Managing Directors
QIAGEN shall be managed by a Managing Board consisting of one or more Managing Directors under the
supervision of the Supervisory Board. The majority view in Dutch law is that in managing QIAGEN, the
Managing Directors must take into account our interests and our business and the interests of all stakeholders
(which includes but is not limited to our shareholders). Managing Directors shall be appointed by the general
meeting upon the joint meeting of the Supervisory board and the Managing Board, or Joint Meeting, having
made a binding nomination for each vacancy. However, the General Meeting may at all times overrule the
binding nature of such a nomination by a resolution adopted by at least a two-thirds majority of the votes cast, if
such majority represents more than half the issued share capital. This is different from the provisions of many
American corporate statutes, including the Delaware General Corporation Law, which give the directors of a
corporation greater authority in choosing the executive officers of a corporation. Under our Articles, the general
meeting may suspend or dismiss a managing director at any time. The Supervisory Board shall also at all times
be entitled to suspend (but not to dismiss) a Managing Director. The Articles provide that the Supervisory Board
may adopt management rules governing the internal organization of the Managing Board.
Furthermore, the Supervisory Board shall determine the salary, the bonus, if any, and the other
compensation terms and conditions of employment of the Managing Directors within the scope of the
remuneration policy. The remuneration policy of the Managing Board has been adopted in our annual general
meeting on June 14, 2005.
Under Dutch law, in the event that there is a conflict of interest between a Managing Director and us, we are
represented by the Supervisory Board. However, the general meeting should at all times in an event of a conflict
of interest be given the opportunity to appoint a person who is authorized to represent QIAGEN in such event.
According to the Code any conflict of interest or apparent conflict of interest between the company and
Managing Directors should be avoided. Decisions to enter into transactions under which Managing Directors
would have conflicts of interest that are material significance to the company and/or to the relevant Managing
Director require the approval of the Supervisory Board.
Supervisory Directors
The Supervisory Board shall be responsible for supervising the policy pursued by the Managing Board and
our general course of affairs. Under our Articles, the Supervisory Directors are required to serve our interests and
our business and the interest of all stakeholders (which includes but is not limited to our shareholders) in
fulfilling their duties. The Supervisory Board shall consist of such number of members as the Joint Meeting may
from time to time determine, with a minimum of three members. The Supervisory Directors shall be appointed
by the General Meeting upon the Joint Meeting having made a binding nomination for each vacancy. If during a
financial year a vacancy occurs in the Supervisory Board, the Supervisory Board may appoint a Supervisory
54
Director who will cease to hold office at the next Annual General Meeting. Under Dutch law and the Code, a
Supervisory Director must excuse him or herself in the case of any conflict of interest. Decisions to enter into
transactions under which a Supervisory Director would have a conflict of interest that are of material significance
to QIAGEN and/or to the Supervisory Director concerned, require the approval of the Supervisory Board.
Under Dutch law and the Code the General Meeting determines the compensation of the members of the
Supervisory Board upon the proposal of the compensation committee. Any shares held by a Supervisory Director
in the company on whose board he sits should be long term investments.
Under our Articles, the General Meeting may suspend or dismiss a Supervisory Director at any time. This is
different from the provisions of many American corporate statutes, including the Delaware General Corporation
Law, which provides that directors may vote to fill vacancies in the board of directors of a corporation.
Liability of Managing Directors and Supervisory Directors
Under Dutch law, as a general rule, Managing Directors are not liable for obligations we incur. Under
certain circumstances, however, they may become liable, either towards QIAGEN (internal liability) or to others
(external liability), although some exceptions are described below.
Liability Towards QIAGEN
Failure of a Managing or Supervisory Director to perform his or her duties does not automatically lead to
liability. Liability is only incurred in the case of a clear, indisputable shortcoming about which no reasonably
judging business-person would have any doubt. In addition, the Managing or Supervisory Director must be
deemed to have been grossly negligent. Managing Directors and Supervising Directors are jointly and severally
liable for failure of the Managing Board and Supervisory Board as a whole, respectively, but an individual
Managing or Supervisory Director will not be held liable if he or she is determined not to have been responsible
for the mismanagement and has not been negligent in preventing its consequences.
Liability for Misrepresentation in Annual Accounts
Managing and Supervisory Directors are also jointly and severally liable to any third party for damage
suffered as a result of misrepresentation in the annual accounts, annual report or interim statements of QIAGEN,
although a Managing or Supervisory Director will not be held liable if found not to be personally responsible for
the misrepresentation. Moreover, a Managing or Supervisory Director may be found to be criminally liable if he
deliberately publishes false annual accounts or deliberately allows the publication of such false annual accounts.
Tort Liability
Under Dutch law, there can be liability if one has committed a tort (onrechtmatige daad) against another
person. Although there is no clear definition of “tort” under Dutch law, breach of a duty of care towards a third
party is generally considered to be a tort. Therefore, a Dutch corporation may be held liable by any third party
under the general rule of Dutch laws regarding tort claims. In exceptional cases, Managing Directors and
Supervisory Directors have been found liable on the basis of tort under Dutch common law, but it is generally
difficult to hold a Managing or Supervisory Director personally liable for a tort claim. Shareholders cannot base a
tort claim on any losses which derive from and coincide with losses we suffered. In such cases, only we can sue
the Managing or Supervisory Directors.
Criminal Liability
Under Dutch law, if a legal entity has committed a criminal offence, criminal proceedings may be instituted
against the legal entity itself as well as against those who gave order to or were in charge of the forbidden act. As
a general rule, it is held that a Managing Director is only criminally liable if he played a reasonably active role in
the criminal act.
55
Indemnification
Article 27 of our Articles provide that we shall indemnify every person who is or was a Managing Director
or Supervisory Directors against all expenses (including attorneys’ fees) judgments, fines and amounts paid in
settlement with respect to any threatened pending or completed action, suit or proceeding as well as against
expenses (including attorneys’ fees) actually and reasonably incurred in connection with the defense or
settlement of an action or proceeding, if such person acted in good faith and in a manner he reasonably could
believe to be in or not opposed to our best interests. An exception is made in respect of any claim, issue or matter
as to which such person shall have been adjudged to be liable for gross negligence or willful misconduct in the
performance of his duty to us.
Classes of Shares
The authorized classes of our shares consist of Common Shares, Financing Preference Shares and
Preference Shares. No Financing Preference Shares or Preference Shares have been issued.
Common Shares
Common Shares are issued in registered form only. Common Shares are available either without issue of a
share certificate, or Type I shares, or with issue of a share certificate, or Type II shares, in either case in the form
of an entry in the share register. At the discretion of the Supervisory Board, Type I shares may be issued and the
holders of such Type I shares will be registered in the shareholders register of QIAGEN with TMF Management
B.V. in Amsterdam, The Netherlands. The Type II shares are registered with American Stock Transfer & Trust
Company, or New York Transfer Agent, our transfer agent and registrar in New York.
The transfer of registered shares requires that we issue a written instrument of transfer and the written
acknowledgment of such transfer (or, in the case of Type II shares, the New York Transfer Agent (in our name)),
and surrender of the share certificates, if any, to us or (in our name) to the New York Transfer Agent. Upon
surrender of a share certificate for the purpose of transfer of the relevant shares, we (or the New York Transfer
Agent in our name) acknowledge the transfer by endorsement on the share certificate or by issuance of a new
share certificate to the transferee, at the discretion of the Managing Board.
Financing Preference Shares
No Financing Preference Shares are outstanding. If issued, Financing Preference Shares will be issued in
registered form only. No share certificates are issued for Financing Preference Shares. Financing Preference
Shares must be fully paid up upon issue. The preferred dividend rights attached to Financing Preference Shares
are described under “Dividends” below. We have no present plans to issue any such Financing Preference
Shares.
Preference Shares
No Preference Shares are outstanding. If issued, Preference Shares will be issued in registered form only.
No share certificates are issued for Preference Shares. Only 25% of the par value thereof is required to be paid
upon subscription for Preference Shares. The obligatory payable part of the nominal amount (call) must be equal
for each Preference Share. The Managing Board may, subject to the approval of the Supervisory Board, resolve
on which day and up to which amount a further call must be paid on Preference Shares which have not yet been
paid up in full. The preferred dividend rights attached to Preference Shares are described under “Dividends”
below.
Pursuant to our Articles and the resolution adopted by our General Meeting on June 16, 2004, QIAGEN’s
Supervisory Board is entitled to resolve to issue Preference Shares. If our Supervisory Board opposes an intended
take-over of our Company and Preference Shares are issued, the nature of the Preference Shares is such that the
56
bidder may as a result withdraw its bid. Alternatively, the bidder could enter into negotiations with our Managing
Board and/or Supervisory Board and agree on a higher offer price for our shares. There are currently no
Preference Shares outstanding. Preference Shares may only be issued in the event that (i) in the opinion of the
Supervisory Board, any person who did not acquire shares at our incorporation, shall, alone or pursuant to a
mutual arrangement for co-operation jointly with one or more other persons, directly or indirectly, have acquired
or given notice of an intent to acquire (beneficial) ownership of an amount of Common Shares or Financing
Preference Shares, which in aggregate equals 20% or more of our share capital then outstanding in the form of
Common Shares and Financing Preference Shares; (ii) the Supervisory Board shall declare any person to be an
“adverse person” upon a determination that such person, alone or together with its affiliates or associates, has
become the (beneficial) owner of an amount of Common Shares or Financing Preference Shares which the
Supervisory Board determines to be substantial (which amount shall in no event be less than 10% of the shares
then outstanding), and a determination that (a) such ownership is intended to cause or pressure us to enter into
transactions intended to provide such person with short-term financial gain under circumstances that would not
be in the interest of QIAGEN and our shareholders or (b) such ownership is reasonably likely to cause a material
adverse impact on our business prospects.
On August 2, 2004 we entered into an agreement, or Option Agreement, with Stichting Preferente Aandelen
QIAGEN (“SPAQ”). Pursuant to the Option Agreement SPAQ was granted an option to acquire such a number
of Preference Shares as are equal to the total number of all outstanding ordinary shares minus one in our share
capital at the time of the relevant exercise of the right. The right to acquire Preference Shares is granted subject
to the conditions referred to in the previous paragraph.
SPAQ was incorporated on August 2, 2004. Its principal office is located at Spoorstraat 50, 5911 KJ Venlo,
The Netherlands. Its statutory objectives are to protect the interest of QIAGEN and its enterprise and the
enterprises of companies which are linked to QIAGEN. SPAQ shall attempt to accomplish its objectives by way
of acquiring Preference Shares in the share capital of QIAGEN and to exercise the voting rights in the interest of
QIAGEN and its stakeholders.
The board of SPAQ shall consist of at least two directors. Upon incorporation of SPAQ two members have
been appointed. A board member shall be appointed by the board SPAQ. Board resolutions will be adopted by
unanimity of the votes cast. SPAQ will be represented either by the board or by the chairman of the board.
Pre-emptive Rights
Under the Articles, existing holders of Common Shares will have pre-emptive rights in respect of future
issuances of Common Shares in proportion to the number of Common Shares held by them, unless limited or
excluded as described below. Holders of Common Shares shall not have pre-emptive rights in respect of future
issuances of Financing Preference Shares or Preference Shares. Holders of Financing Preference Shares and
Preference Shares shall not have pre-emptive rights in respect of any future issuances of share capital.
Pre-emptive rights do not apply with respect to shares issued against contributions other than in cash or shares
issued to our employees or one of our group companies. Under the Articles, the Supervisory Board has the power
to limit or exclude any pre-emptive rights to which shareholders may be entitled provided that it has been
authorized by the General Meeting to do so. The authority of the Supervisory Board to limit or exclude
pre-emptive rights can only be exercised if at that time the authority to issue shares is in full force and effect. The
authority to limit or exclude pre-emptive rights may be extended in the same manner as the authority to issue
shares. If there is no designation of the Supervisory Board to limit or exclude pre-emptive rights in force, the
General Meeting shall have authority to limit or exclude such pre-emptive rights, but only upon the proposal of
the Supervisory Board.
Resolutions of the General Meeting (i) to limit or exclude pre-emptive rights or (ii) to designate the
Supervisory Board as the corporate body that has authority to limit or exclude pre-emptive rights, require a
majority of at least two-thirds of the votes cast in a meeting of shareholders if less than 50% of the issued share
57
capital is present or represented. For these purposes, issuances of shares include the granting of rights to
subscribe for shares, such as options and warrants, but not the issue of shares upon exercise of such rights.
Acquisition of our Own Shares
We may acquire our own shares, subject to certain provisions of Dutch law and the Articles, if
(i) shareholders’ equity less the payment required to make the acquisition does not fall below the sum of paid-up
and called up capital and any reserves required by Dutch law or the Articles and (ii) we and our subsidiaries
would not thereafter hold shares with an aggregate par value exceeding one-tenth of our issued share capital.
Shares that we hold in our own capital or shares held by one of our subsidiaries may not be voted. The Managing
Board, subject to the approval of the Supervisory Board, may effect our acquisition of shares in our own capital.
Our acquisitions of shares in our own capital may only take place if the General Meeting has granted to the
Managing Board the authority to effect such acquisitions. Such authority may apply for a maximum period of 18
months and must specify the number of shares that may be acquired, the manner in which shares may be acquired
and the price limits within which shares may be acquired. On June 22, 2006 the General Meeting resolved to
extend the authorization of the Managing Board in such manner that the Managing Board may cause us to
acquire shares in our own share capital for an 18-month period from the date until December 22, 2007, without
limitation against a price between one Euro cent (Euro 0.01) and one hundred ten percent (110%) of the price for
such shares on a stock market, or, with respect to preference and finance preference shares, against a price
between one Euro cent (Euro 0.01) and three times the issuance price and in accordance with applicable
provisions of Dutch law and our Articles.
Capital Reduction
Subject to the provisions of Dutch law and the Articles, the General Meeting may, upon the proposal of the
Supervisory Board, resolve to reduce the issued share capital by (i) canceling shares or (ii) reducing the par value
of shares through an amendment of the Articles. Cancellation with repayment of shares or partial repayment on
shares or release from the obligation to pay up may also be made or given exclusively with respect to Common
Shares, Financing Preference Shares or Preference Shares.
Annual Accounts
We have a calendar fiscal year. Dutch law requires that within five months after the end of our fiscal year,
unless the General Meeting has extended this period by a maximum period of six months on account of special
circumstances, the Managing Board must submit to the shareholders a report with respect to such fiscal year,
including our financial statements for such year prepared under International Financial Reporting Standards and
accompanied by a report of an independent accountant. The annual report is submitted to the annual General
Meeting for adoption.
Dividends
Subject to certain exceptions, dividends may only be paid out of profits as shown in our annual financial
statements as adopted by the General Meeting. Distributions may not be made if the distribution would reduce
shareholders’ equity below the sum of the paid-up capital and any reserves required by Dutch law or the Articles.
Out of profits, dividends must first be paid on any outstanding Preference Shares (the “Preference Share
Dividend”) in a percentage (the “Preference Share Dividend Percentage”) of the obligatory amount (call) paid up
on such shares as at the beginning of the fiscal year in respect of which the distribution is made. The Preference
Share Dividend Percentage is equal to the Average Main Refinancing Rates during the financial year for which
the distribution is made. Average Main Refinancing Rate shall be understood to mean the average value on each
individual day during the financial year for which the distribution is made of the Main Refinancing Rates
prevailing on such day. Main Refinancing Rate shall be understood to mean the rate of the Main Refinancing
58
Operation as determined and published from time to time by the European Central Bank. If and to the extent that
profits are not sufficient to pay the Preference Share Dividend in full, the deficit shall be paid out of the reserves,
with the exception of any reserve, which was formed as share premium reserve upon the issue of Financing
Preference Shares. If in any fiscal year the profit is not sufficient to make the distributions referred to above and
if no distribution or only a partial distribution is made from the reserves referred to above, such that the deficit is
not fully made good no further distributions will be made as described below until the deficit has been made
good.
Out of profits remaining after payment of any dividends on Preference Shares, such amounts shall be kept in
reserve as determined by the Supervisory Board. Out of any remaining profits not allocated to reserve, a dividend
(the “Financing Preference Share Dividend”) shall be paid on the Financing Preference Shares in a percentage
(the “Financing Preference Share Dividend Percentage”) over the par value, increased by the amount of share
premium that was paid upon the first issue of Financing Preference Shares, which percentage is related to the
average effective yield on the prime interest rate on corporate loans in the United States as quoted in the Wall
Street Journal. If and to the extent that the profits are not sufficient to pay the Financing Preference Share
Dividend in full, the deficit may be paid out of the reserves if the Managing Board so decides with the approval
of the Supervisory Board, with the exception of the reserve which was formed as share premium upon the issue
of Financing Preference Shares.
Insofar as the profits have not been distributed or allocated to reserves as specified above, they are at the
free disposal of the General Meeting provided that no further dividends will be distributed on the Preference
Shares or the Financing Preference Shares.
The General Meeting may resolve, on the proposal of the Supervisory Board, to distribute dividends or
reserves, wholly or partially, in the form of QIAGEN shares.
Distributions as described above are payable as from a date to be determined by the Supervisory Board. The
date of payment on Type I shares may differ from the date of payment on Type II shares. Distributions will be
made payable at an address or addresses in The Netherlands to be determined by the Supervisory Board, as well
as at least one address in each country where the shares are listed or quoted for trading. The Supervisory Board
may determine the method of payment of cash distributions, provided that cash distributions in respect of Type II
shares will, subject to certain exceptions, be paid in the currency of a country where our shares are listed or
quoted for trading, converted at the close of business on a day to be determined for that purpose by the
Supervisory Board.
Dutch law, making the declaration of dividends out of the profits that are at the free disposal of the General
Meeting the exclusive right of the General Meeting, is different from the corporate law of most jurisdictions in
the United States, which permit a corporation’s board of directors to declare dividends.
Shareholder Meetings, Voting Rights and Other Shareholder Rights
The annual General Meeting is held within six months after the end of each fiscal year for the purpose of,
among other things, adopting the annual accounts and filling of any vacancies on the Managing and Supervisory
Boards.
Extraordinary General Meetings are held as often as deemed necessary by the Managing Board or
Supervisory Board, or upon the request of one or more shareholders and other persons entitled to attend meetings
jointly representing at least 40% of our issued share capital or by one or more shareholders jointly representing at
least 10% of our issued share capital as provided for under the laws of The Netherlands.
General Meetings are held in Amsterdam, Haarlemmermeer (Schiphol Airport), Arnhem, Maastricht,
Rotterdam, Venlo or The Hague. The notice convening a General Meeting must be given to the shareholders by
59
advertisement in at least one national daily newspaper published in The Netherlands no later than the fifteenth
day prior to the meeting. The notice will contain the agenda for the meeting or state that the agenda can be
obtained at the offices of the Company.
The agenda shall contain such subjects to be considered at the General Meeting, as the persons convening or
requesting the meeting shall decide. One or more shareholders representing at least 10% of the issued share
capital may request the Managing Board or Supervisory Board in writing, at least sixty days but not more than
ninety days before the anniversary of the date on which the prior year’s meeting was convened, to include certain
subjects in the agenda. No valid resolutions can be adopted at a General Meeting in respect of subjects which are
not mentioned in the agenda. Under Dutch law holders of shares representing solely or jointly at least one
hundredth part of the issued share capital, or represents a value of at least EUR 50,000,000 may request the
company not later than on the sixtieth day prior to the day of the general meeting to include certain subjects on
the notice convening a meeting, provided that it is not detrimental to the vital interest of the company.
General Meetings are presided over by the chairman of the Supervisory Board or, in his absence, by any
person nominated by the Supervisory Board.
At the General Meeting, each share shall confer the right to cast one vote, unless otherwise provided by law
or the Articles. No votes may be cast in respect of shares that we or our subsidiaries hold, or by usufructuaries
and pledges of shares. All shareholders and other persons entitled to vote at General Meetings are entitled to
attend General Meetings, to address the meeting and to vote. They must notify the Managing Board in writing of
their intention to be present or represented not later than on the third day prior to the day of the meeting, unless
the Managing Board permits notification within a shorter period of time prior to any such meeting. Subject to
certain exceptions, resolutions may be passed by a simple majority of the votes cast.
Except for resolutions to be adopted by the meeting of holders of Preference Shares, our Articles do not
allow the adoption of shareholders resolutions by written consent (or otherwise without holding a meeting).
A resolution of the General Meeting to amend the Articles, dissolve QIAGEN, issue shares or grant rights to
subscribe for shares or limit or exclude any pre-emptive rights to which shareholders shall be entitled is valid
only if proposed to the General Meeting by the Supervisory Board.
A resolution of the General Meeting to amend the Articles is further only valid if the complete proposal has
been made available for inspection by the shareholders and the other persons entitled to attend General Meetings
at our offices as from the day of notice convening such meeting until the end of the meeting. A resolution to
amend the Articles to change the rights attached to the shares of a specific class requires the approval of the
relevant class meeting.
Resolutions of the General Meeting in a meeting that has not been convened by the Managing Board and/or
the Supervisory Board, or resolutions included on the agenda for the meeting at the request of shareholders, will
be valid only if adopted with a majority of two-thirds of votes cast representing more than half the issued share
capital, unless the Articles require a greater majority or quorum. Our Articles do not provide for shareholders to
act by written consent outside of a General Meeting.
A resolution of the General Meeting to approve a legal merger or the sale of all or substantially all of our
assets is valid only if adopted by a vote of at least two-thirds of the issued share capital, unless proposed by the
Supervisory Board, in which case a simple majority of the votes cast shall be sufficient.
A shareholder shall upon request be provided, free of charge, with written evidence of the contents of the
share register with regard to the shares registered in its name. Furthermore any shareholder shall, upon written
request, have the right, during normal business hours, to inspect our share register and a list of our shareholders
and their addresses and shareholdings, and to make copies or extracts therefrom. Such request must be directed to
60
our Managing Directors at our registered office in the Netherlands or at our principal place of business. Financial
records and other company documents (other than made public) are not available in this manner for shareholder
review but an extract of the minutes of the general meeting shall be made available.
According to Dutch law certain resolutions of the Managing Board regarding a significant change in the
identity or nature of the company are subject to the approval of the general meeting. The following resolutions of
the Managing Board acquire the approval of the general meeting in any event:
(i)
The transfer of the enterprise or practically the entire enterprise to a third party;
(ii) To conclude or cancel any long lasting cooperation by the company or an affiliate
(dochtermaatschappij) with any other legal person or company or as a fully liable general partner of a
limited partnership or a general partnership, provided that such cooperation or the cancellation thereof
is of essential importance to the company; and
(iii) To acquire or dispose of a participation interest in the capital of a company with a value of at least
one-third of the sum of the assets according to the consolidated balance sheet with explanatory notes
thereto according to the last adopted annual accounts of the company, by the company or an affiliate
(dochtermaatschappij).
No Derivative Actions; Right to Request Independent Inquiry
Dutch law does not afford shareholders the right to institute actions on behalf of or in our interest.
Shareholders holding at least one-tenth of our issued capital or EUR 225,000 in nominal amount of our shares
may inform the Managing Board and the Supervisory Board of their objections as to the policy or the course of
our affairs and, within a reasonable time thereafter, may request the Enterprises Division of the Court of Appeal
in Amsterdam to order an inquiry into the policy and the course of our affairs by independent investigators. If
such an inquiry is ordered and the investigators conclude that there has been mismanagement, the shareholders
can request the Division to order certain measures such as a suspension or annulment of resolutions.
Liquidation Rights
In the event of our dissolution and liquidation, the assets remaining after payment of all debts and
liquidation expenses will be distributed among registered holders of Common Shares in proportion to the par
value of their Common Shares, subject to liquidation preference rights of holders of Preference Shares and
Financing Preference Shares, if any.
Restrictions on Transfer of Preference Shares
The Supervisory board upon application in writing must approve each transfer of Preference Shares. If
approval is refused, the Supervisory Board will designate prospective purchasers willing and able to purchase the
shares, otherwise the transfer will be deemed approved.
Limitations on Rights to Own Securities
Other than with respect to usufructuaries and pledges who have no voting rights, our Articles do not impose
limitations on rights to own securities.
Provisions which may Defer or Prevent a Change in Control
The Option Agreement and our Articles could, under certain circumstances, prevent a third party from
obtaining a majority of the voting control of our shares by issuing Preference Shares. Pursuant to the Articles
(and pursuant to the resolution adopted by our General Meeting on June 16, 2004), the Supervisory Board is
authorized to issue Preference Shares if (i) a person has (directly or indirectly) acquired or has expressed a desire
61
to acquire, more than 20% of our issued capital or (ii) a person holding at least a 10% interest in us has been
designated as a hostile person by the Supervisory Board. Under the Option Agreement, SPAQ could acquire
preference shares subject to the provisions mentioned in this paragraph.
If the Supervisory Board opposes an intended take-over and authorizes the issuance of Preference Shares,
the bidder may withdraw its bid or enter into negotiations with the Managing Board and/or Supervisory Board
and agree on a higher bid price for our shares.
On 21 April 2004, the Takeover Directive, or 13th Directive, was adopted by the EU. Upon implementation
of the Directive in Dutch legislation, shareholders who obtain control of a company are obliged to make a
mandatory offer to all other shareholders. It is expected that the Dutch legislator will set the threshold for a
mandatory offer at the ability to exercise 30% of the voting rights in a Dutch public limited company (naamloze
vennootschap) with a listing in Europe.
Ownership Threshold Requiring Disclosure
Our Articles do not provide an ownership threshold above which ownership must be disclosed.
Exchange Controls
There are currently no limitations either under the laws of The Netherlands or in our Articles, to the rights of
shareholders from outside The Netherlands to hold or vote Common Shares. Under current foreign exchange
regulations in The Netherlands, there are no material limitations on the amount of cash payments that we may
remit to residents of foreign countries.
Obligation of Shareholders to Disclose Major Holdings
Holders of our ordinary shares or rights to acquire ordinary shares (which includes options and convertible
bonds) may be subject to notification obligations under Chapter 5.3 of the Dutch Financial Markets Supervision
Act, or the FMSA.
Under Chapter 5.3 FMSA any person whose direct or indirect interest (including potential interest, such as
options and convertible bonds) in our capital or voting rights reaches or crosses a threshold percentage must
notify the Netherlands Authority for the Financial Markets, or AFM: (a) immediately, if this is the result of an
acquisition or disposal by it; (b) within 4 trading days after such reporting, if this is the result of a change in our
share capital or votes reported in the AFM’s public register. The threshold percentages are 5, 10, 15, 20, 25, 30,
40, 50, 60, 75 and 95 percent.
Furthermore persons holding 5 percent or more in our voting rights or capital interest must within 4 weeks
after 31 December notify the AFM of any changes in the composition of their interest since their last notification.
The following instruments qualify as “shares”: (i) shares, (ii) depositary receipts for shares (or negotiable
instruments similar to such receipts), (iii) negotiable instruments for acquiring the instruments under (i) or
(ii) (such as convertible bonds), and (iv) options for acquiring the instruments under (i) or (ii). Among others the
following shares and votes qualify as shares and votes “held” by a person: (i) those directly held by him;
(ii) those held by his subsidiaries; (iii) shares held by a third party for such person’s account and the votes such
third party may exercise; (iv) the votes held by a third party if such person has concluded an oral or written
agreement with such party which provides for a lasting common policy on voting; (v) the votes held by a third
party if such person has concluded an oral or written agreement with such party which provides for a temporary
and paid transfer of the shares; (vi) the votes which a person may exercise as a proxy but in his own discretion.
Special rules apply to the attribution of the ordinary shares which are part of the property of a partnership or
other community of property. A holder of a pledge or right of usufruct in respect of ordinary shares can also be
62
subject to a notification obligation if such person has, or can acquire, the right to vote on ordinary shares. If a
pledgor or usufructuary acquires such voting rights, this may trigger a notification obligation for the holder of the
ordinary shares.
Under section 5:48 of the FMSA, each of our managing and supervisory directors must without delay notify
the AFM of any changes in his interest or potential interest in our capital or voting rights.
The AFM will publish all notifications on its public website (www.afm.nl).
Non-compliance with the notification obligations of Chapter 5.3 FMSA can lead to imprisonment or
criminal fines, or administrative fines or other administrative sanctions. In addition, non-compliance with these
notification obligations may lead to civil sanctions, including, without limitation, suspension of the voting rights
attaching to our shares held by the offender for a maximum of three years, (suspension and) nullification of a
resolution adopted by our general meeting of shareholders (if it is likely that such resolution would not have been
adopted if the offender had not voted) and a prohibition for the offender to acquire our ordinary shares or votes
for a period of not more than five years.
Taxation
The following is a general summary of certain material United States federal income and The Netherlands
tax consequences to holders of our Common Shares (collectively, “U.S. Holders”) who are (i) citizens or
residents of the United States, (ii) entities subject to U.S. corporate tax, (iii) certain pension trusts and other
retirement or employee benefits organizations established in the United States but generally exempt from U.S.
tax, (iv) certain not-for-profit organizations established in the United States but generally exempt from U.S. tax,
(v) United States regulated investment companies, United States real estate investment trusts, and United States
real estate mortgage conduits, and (vi) partnerships or similar pass-through entities, estates, and trusts to the
extent the income of such partnerships, similar entities, estates, or trusts is subject to tax in the United States as
income of a resident in its hands or the hands of its partners, beneficiaries, or grantors. This summary does not
discuss every aspect of such taxation that may be relevant to U.S. Holders. Therefore, all prospective purchasers
of our Common Shares who would be U.S. Holders are advised to consult their own tax advisor with respect to
the United States federal, state and local tax consequences, as well as the Netherlands tax consequences, of the
ownership of our Common Shares. This summary is based upon the advice of Mintz, Levin, Cohn, Ferris,
Glovsky and Popeo, P.C. with respect to tax consequences for U.S. Holders and Baker & McKenzie with respect
to tax consequences under Netherlands law.
The statements of The Netherlands and United States tax laws set out below are based on the laws in force
as of the date of this Annual Report on Form 20-F, and as a consequence are subject to any changes in United
States or The Netherlands law, or in the double taxation conventions between the United States and The
Netherlands, occurring after such date.
Netherlands Tax Considerations
The following describes the material tax consequences under Netherlands law of an investment in our
Common Shares. Such description is based on current Netherlands law as interpreted under officially published
case law, and is limited to the tax implications for an owner of our Common Shares who is not, or is not deemed
to be, a resident of The Netherlands for purposes of the relevant tax codes (a “non-resident Shareholder” or
“Shareholder”).
Dividend Withholding Tax
General. Upon distribution of dividends, we would be obligated to withhold 25% dividend tax at source
and to pay the amount withheld to The Netherlands tax authorities. The term “dividends” means income from
63
shares or other rights participating in profits, as well as income from other corporate rights that is subjected to the
same taxation treatment as income from shares by the laws of The Netherlands. Dividends include dividends in
cash or in kind, constructive dividends, certain repayments of capital qualified as dividends, interest on loans that
are treated as equity for Netherlands corporate income tax purposes and liquidation proceeds in excess of, for
Netherlands tax purposes, recognized paid-in capital. Stock dividends are also subject to withholding tax derived
from our paid-in share premium which is recognized for Netherlands tax purposes.
No withholding tax applies on the proceeds resulting from the sale or disposition of our Common Shares to
persons other than QIAGEN and our affiliates.
A Shareholder can be eligible for a reduction or a refund of Netherlands dividend withholding tax under a
tax convention which is in effect between the country of residence of the Shareholder and The Netherlands. The
Netherlands has concluded such conventions with, among others, the United States, Canada, Switzerland, Japan
and all EU Member States. Under most of those conventions, Netherlands dividend withholding tax is reduced to
15% or a lower rate.
U.S. Shareholders. Under the Tax Convention between The Netherlands and the United States, or
Convention, the withholding tax on dividends we pay to a resident of the United States (as defined in the
Convention) who is entitled to the benefits of the Convention, may be reduced to 5% (in the case of a corporate
U.S. Shareholder that holds 10% or more of the voting power of a Netherlands company) or 15% (in the case of
other U.S. Shareholders), unless such U.S. shareholders have a permanent establishment in The Netherlands with
which the shares are effectively connected.
On December 28, 2004, the protocol amending the Convention entered into force. The protocol provides,
amongst other things, for a full exemption of Netherlands withholding tax for certain U.S. corporate shareholders
owning at least 80% of QIAGEN voting power for a period of at least twelve months prior to the distribution,
again provided such U.S. shareholders do not have a permanent establishment in The Netherlands with which the
shares are effectively connected. The protocol generally will be effective for taxable periods beginning on or
after January 1, 2005. The provisions of the protocol relating to withholding taxes will be effective for amounts
paid or credited on or after February 1, 2005.
Dividends we pay to U.S. pension funds and U.S. tax exempt organizations may be eligible for an
exemption from dividend withholding tax. The Netherlands and the United States have entered into a mutual
agreement to clarify the entitlement of exempt pension funds to the benefits under the Convention.
Dividend Stripping. A refund, reduction, exemption, or credit of Netherlands dividend withholding tax on
the basis of Netherlands tax law or on the basis of a tax treaty between The Netherlands and another state, will
only be granted if the dividends are paid to the beneficial owner (“uiteindelijk gerechtigde”) of the dividends. A
recipient of a dividend is not considered to be the beneficial owner of a dividend in an event of “dividend
stripping,” in which he has paid a consideration related to the receipt of such dividend. In general terms,
“dividend stripping” can be described as the situation in which a foreign or domestic person (usually, but not
necessarily, the original shareholder) has transferred his shares or his entitlement to the dividend distributions to
a party that has a more favorable right to a refund or reduction of Netherlands dividend withholding tax than the
foreign or domestic person. In these situations, the foreign or domestic person (usually the original shareholder)
avoids Netherlands dividend withholding tax while retaining his “beneficial” interest in the shares and the
dividend distributions, by transferring his shares or his entitlement to the dividend distributions.
64
Income Tax and Corporate Income Tax
General. A non-resident Shareholder will not be subject to Netherlands income tax with respect to
dividends we distribute on our Common Shares or with respect to capital gains derived from the sale or
disposition of our Common Shares, provided that:
(a) the non-resident Shareholder has not made an election for the application of the rules of The
Netherlands 2001 Income Tax Act as they apply to residents of The Netherlands;
(b) the non-resident Shareholder does not carry on or have an interest in a business in The Netherlands
through a permanent establishment or a permanent representative to which or to whom the Common Shares
are attributable or deemed to be attributable;
(c) the non-resident Shareholder does not have a direct or indirect substantial or deemed substantial
interest (“aanmerkelijk belang,” as defined in the Netherlands tax code) in our share capital or, in the event
the Shareholder does have such a substantial interest, such interest is a “business asset”; and
(d) the non-resident Shareholder is not entitled to a share in the profits of an enterprise, to which our
Common Shares are attributable and that is effectively managed in The Netherlands, other than by way of
securities or through an employment contract.
In general terms, a substantial interest (“aanmerkelijk belang”) in our share capital does not exist if the
Shareholder (individuals as well as corporations), alone or together with his partner, does not own, directly or
indirectly, 5% or more of the nominal paid-in capital of, or any class of our shares, does not have the right to
acquire 5% or more of the nominal paid-in capital of, or any class of our shares (including a call option) and does
not have the right to share in our profit or liquidation revenue amounting to 5% or more of the annual profits or
liquidation revenue.
There is no all-encompassing definition of the term “business asset”; whether this determination can be
made in general depends on the facts presented and in particular on the activities performed by the Shareholder.
If the Shareholder materially conducts a business activity, while the key interest of his investment in our Shares
will not be his earnings out of the investment in our Shares but our economic activity, an investment in our
Shares will generally be deemed to constitute a business asset, in particular if the Shareholder’s involvement in
our business will exceed regular monitoring of his investment in our Shares.
U.S. Shareholders. Pursuant to the Convention, the gain derived by a U.S. Shareholder from an alienation
of our Common Shares constituting a substantial interest of the Shareholder in QIAGEN, not effectively
connected or deemed connected with a permanent establishment or permanent representative of the Shareholder
in The Netherlands, is not subject to Netherlands income tax or corporate income tax, provided that the gain from
the alienation of our Common Shares is not derived by an individual Shareholder who has, at any time during the
five-year period preceding such alienation, been a resident of The Netherlands according to Netherlands tax law
and who owns, at the time of the alienation, either alone or together with close relatives, at least 25% of any class
of our shares.
Gift and Inheritance Tax
A gift or inheritance of our Common Shares from a non-resident Shareholder will generally not be subject to
a Netherlands gift and inheritance tax, provided that the Shareholder does not own a business which is, in whole
or in part, carried on through a permanent establishment or a permanent representative in The Netherlands to
which or to whom our Common Shares are attributable. The Netherlands has concluded a tax convention with the
United States based on which double taxation on inheritances may be avoided if the inheritance is subject to
Netherlands and/or U.S. inheritance tax and the deceased was a resident of either The Netherlands or the United
States.
65
United States Federal Income Tax Considerations
The following summarizes the material U.S. federal income tax consequences of the ownership of our
Common Shares by an investor that purchases such Common Shares and that will hold the Common Shares as
capital assets. This summary does not purport to be a complete analysis or listing of all potential tax
considerations and does not address holders subject to special treatment under U.S. federal income tax laws
(including insurance companies, tax-exempt organizations, regulated investment companies, financial
institutions, broker dealers or holders that own, actually or constructively, 10% or more of our voting shares).
As used herein, references to a “U.S. Holder” are to a holder of our Common Shares that is (i) a citizen or
resident of the United States, (ii) a corporation organized under the laws of the United States or any political
subdivision thereof, or (iii) a person or entity otherwise subject to United States federal income taxation on a net
income basis with respect to our Common Shares (including a non-resident alien or foreign corporation that
holds, or is deemed to hold, our Common Shares in connection with the conduct of a U.S. trade or business); and
references to a “non-U.S. Holder” are to a holder that is not a U.S. person for U.S. federal income tax purposes.
Taxation of Dividends
To the extent paid out of our current or accumulated earnings and profits, as determined under U.S. federal
income tax principles, distributions, if any, made with respect to our Common Shares will be includable for U.S.
federal income tax purposes in the income of a U.S. Holder as ordinary dividend income in an amount equal to
the sum of any cash and the fair market value of any property that we distribute, before reduction for Netherlands
withholding tax. During the years 2004-2010 such dividends will be eligible to be treated by U.S. Holder
individuals as “qualified dividend income” subject to a maximum tax rate of 15 percent, if the shareholder
receiving the dividend satisfies the holding period requirements, and if we are not treated for our taxable year in
which the dividend is paid, or our preceding taxable year, as a passive foreign investment company (see
“Taxation—United States Federal Income Tax Considerations—Passive Foreign Investment Company Status”).
To the extent that such distribution exceeds our current or accumulated earnings and profits, it will be treated as a
non-taxable return of capital to the extent of the U.S. Holder’s adjusted tax basis in our Common Shares and
thereafter as taxable capital gain. Dividends generally will be treated as income from sources outside the United
States and generally will be passive income (or, in the case of certain holders, “financial services income”) for
purposes of the foreign tax credit limitation. Dividends we pay will not be eligible for the dividends received
deduction allowed to corporations in certain circumstances under the United States Internal Revenue Code of
1986, as amended (the Code). A U.S. Holder may elect annually to either deduct The Netherlands withholding
tax (see “Taxation—Netherlands Tax Considerations—Dividend Withholding Tax”) against their income or take
the withholding taxes as a credit against their U.S. tax liability, subject to U.S. foreign tax credit limitation rules.
If the dividends are qualified for the lower applicable capital gains rate (as discussed in the above paragraph), the
amount of the dividend income taken into account for calculating the foreign tax credit limitation will be in
general be limited to the gross amount of the dividend, multiplied by the reduced, divided by the highest rate of
tax normally applicable to dividends, For the purposes of computing the foreign tax credit, dividends paid on our
Common Shares will be treated as income from sources outside the United States, but generally will be grouped
separately, together with other items of “passive” or financial services income. Recently enacted legislation (the
American Jobs Creation Act of 2004, or the “Act”) will modify the foreign tax credit limitation by reducing the
number of classes of foreign source income to two for taxable years beginning after December 31, 2006. Under
the Act, dividends paid on our Common Shares will generally constitute passive category income but could, in
the case of certain US holders, constitute “general category income.” The rules governing the foreign tax credit
are complex. We urge you to consult with your own tax advisors regarding the availability of the foreign tax
credit in your particular circumstances.
Dividends we pay in a currency other than the U.S. dollar will be included in the income of a U.S. Holder in
a U.S. dollar amount based upon the exchange rate in effect on the date of receipt. A U.S. Holder will have a tax
basis in such foreign currency for U.S. federal income tax purposes equal to its U.S. dollar value on the date of
receipt. Any gain or loss on a subsequent disposition of such foreign currency (including a subsequent conversion
66
into U.S. dollars) will be ordinary income or loss. Such gain or loss will generally be income from sources within
the U.S. for foreign tax credit limitation purposes.
A non-U.S. Holder generally will not be subject to U.S. federal income tax or withholding tax on
distributions with respect to our Common Shares that are treated as dividend income for U.S. federal income tax
purposes unless such dividends are effectively connected with the conduct of a trade or business within the
United States by such non-U.S. Holder, (and are attributable to a permanent establishment maintained in the
United States by such non-U.S. Holder, if an applicable income tax treaty so requires as a condition for such
non-U.S. Holder to be subject to U.S. taxation on a net income basis in respect of income from our Common
Shares), in which case the non-U.S. Holder generally will be subject to tax in respect of such dividends in the
same manner as a U.S. Holder. Any such effectively connected dividends received by a non-United States
corporation may also, under certain circumstances, be subject to an additional “branch profits tax” at a 30% rate
or such lower rate as may be specified by an applicable income tax treaty. A non-U.S. Holder generally will not
be subject to U.S. federal income tax or withholding tax on distributions with respect to our Common Shares that
are treated as capital gain for U.S. federal income tax purposes unless such holder would be subject to U.S.
federal income tax on gain realized on the sale or other disposition of our Common Shares, as discussed below.
Taxation of Capital Gains
Subject to the PFIC rules discussed below, upon the sale or other disposition of our Common Shares, a U.S.
Holder will recognize gain or loss for U.S. federal income tax purposes in an amount equal to the difference
between the amount realized on the disposition of our Common Shares and the U.S. Holder’s adjusted tax basis
in our Common Shares. Such gain or loss generally will be subject to U.S. federal income tax. An individual U.S.
Holder is generally subject to a maximum capital gains rate of 15% for our Common Shares held for more than a
year. For U.S. federal income tax purposes, capital losses are subject to limitations on deductibility. Gain realized
by a U.S. Holder on the sale or other disposition of our Common Shares generally will be treated as income from
sources within the United States for purposes of the foreign tax credit limitation.
A non-U.S. Holder will not be subject to U.S. federal income tax or withholding tax on gain realized on the
sale or other disposition of our Common Shares unless (i) the gain is effectively connected with a trade or
business of the non-U.S. Holder in the United States (and is attributable to a permanent establishment maintained
in the United States by such non-U.S. Holder, if an applicable income tax treaty so requires as a condition for
such non-U.S. Holder to be subject to U.S. taxation on a net income basis in respect of gain from the sale or other
disposition of our Common Shares) or (ii) such holder is an individual who is present in the United States for 183
days or more in the taxable year of the sale, and certain other conditions are met. Effectively connected gains
realized by a corporate Non-U.S. Holder may also, under certain circumstances, be subject to an additional
“branch profits tax” at a 30% rate or such lower rate as may be specified by an applicable income tax treaty.
Passive Foreign Investment Company Status
We may be classified as a “passive foreign investment company” (“PFIC”) for U.S. federal income tax
purposes if certain tests are met. We will be a PFIC with respect to a U.S. Holder if for any taxable year in which
the U.S. Holder held our Common Shares, either (i) 75% or more of our gross income for the taxable year is
passive income; or (ii) the average value of our assets (during the taxable year) which produce or are held for the
production of passive income is at least 50% of the average value of all assets for such year. Passive income
means, in general, dividends, interest, royalties, rents (other than rents and royalties derived in the active conduct
of a trade or business and not derived from a related person), annuities, and gains from assets which would
produce such income other than sales of inventory. For the purpose of the PFIC tests, if a foreign corporation
owns at least 25% by value of the stock of another corporation, the foreign corporation is treated as owning its
proportionate share of the assets of the other corporation, and as if it had received directly its proportionate share
of the income of such other corporation. The effect of this special provision with respect to QIAGEN and our
ownership of our subsidiaries is that we, for purposes of the income and assets tests described above, will be
67
treated as owning directly our proportionate share of the assets of our subsidiaries and of receiving directly our
proportionate share of each of those companies’ income, if any, so long as we own, directly or indirectly, at least
25% by value of the particular company’s stock. Active business income of our subsidiaries will be treated as our
active business income, rather than as passive income. Based on our current income, assets and activities, we do
not believe that we are currently a PFIC. No assurances can be made, however, that the IRS will not challenge
this position or that we will not subsequently become a PFIC.
A determination as to PFIC status is made annually (although an initial determination that we are a PFIC
will generally be binding on a shareholder who does not make the qualified election discussed below with respect
to the first year such shareholder holds or is deemed to hold our Common Shares). Whether we are a PFIC in any
year and the tax consequences relating to PFIC status will depend on the composition of our income and assets.
For example, we retain in our business a substantial amount of cash and cash equivalents, and such cash balances
are considered by the IRS to be passive assets, even if held as working capital for an active business. Accurate
predictions of the composition of our income are particularly difficult in light of the volatile nature of earnings
patterns in technological industries. In addition, U.S. tax law is not entirely clear as to the proper classification of
all types of income that we may realize or all types of assets that we may hold. We will, however, monitor our
income and assets closely in order to make an annual determination as to whether we are a PFIC. Following the
close of any tax year, we intend to promptly send a notice to all shareholders of record at any time during such
year, if we determine that we are a PFIC.
If we are a PFIC, each of our direct and certain indirect shareholders that is a U.S. person (“U.S.
Shareholders”) either (i) may make an election to report currently its pro rata share of our ordinary earnings and
net capital gain even if no distributions are actually received from us (the “qualified election”), or (ii) upon a
disposition of our Common Shares, including a disposition pursuant to an otherwise tax-free reorganization, or
receipt of an “excess distribution” (as defined in the Code), will be subject to tax (including an interest charge)
generally as if the gain or distribution were earned ratably over the period in which our Common Shares were
held and face other adverse tax consequences. Alternatively, under the “Taxpayer Relief Act of 1997,” effective
for taxable years of U.S. persons beginning after December 31, 1997, U.S. Shareholders may make a
mark-to-market election with respect to our Common Shares under which the U.S. Shareholder would include in
income each year an amount equal to the excess, if any, of the market value of our Common Shares as of the
close of the taxable year over the U.S. Shareholder’s adjusted basis in such stock. Under this election, the U.S.
Shareholder would be allowed a deduction for the excess, if any, of the adjusted basis of our Common Shares
over the market value of the shares as of the close of the taxable year but only to the extent of any net
mark-to-market gains with respect to our Common Shares included by the shareholder for prior taxable years.
The U.S. Shareholder’s adjusted basis in our Common Shares would be adjusted to reflect the amounts included
or deducted under this election. Amounts included in income pursuant to a mark-to-market election, as well as
gain on the actual sale or other disposition of our Common Shares would be treated as ordinary income. Ordinary
loss treatment would also apply to the deductible portion of any mark-to-market loss on our Common Shares, as
well as to any loss realized on the actual sale or other disposition of our Common Shares to the extent that the
amount of such loss did not exceed the net mark-to-market gains previously included with respect to such stock.
An election to mark to market will apply to the taxable year for which made and all subsequent taxable years,
unless our Common Shares cease to be treated as marketable stock or the Secretary of the Treasury consents to
the revocation of such election.
A shareholder who makes a qualified election may recognize ordinary income or loss as a result of currency
fluctuations between the dates of our deemed and actual distributions.
If we become a PFIC, each U.S. Shareholder would be required annually to file IRS Form 8621 (Return by a
Shareholder of a Passive Foreign Investment Company or Qualified Electing Fund) with such shareholder’s
timely filed income tax return and with the Internal Revenue Service, whether or not the qualified election (or,
for tax years after 1997, the mark-to-market election) is made. A U.S. Shareholder choosing to make a qualified
election must also include a shareholder election statement and the PFIC annual information statement that we
68
will provide (as described below) when filing IRS Form 8621 and its income tax return, and should send a copy
of the shareholder election statement to the Internal Revenue Service. If we determine that we have become a
PFIC, within two months after the end of each year we intend to supply the PFIC annual information statement
necessary to make the qualified election for such year to each U.S. Shareholder of record at the end of such year.
In such case, we also intend to supply the PFIC annual information statement to any shareholder or former
shareholder who requests it.
Prospective purchasers of our Common Shares are urged to consult their tax advisors regarding the PFIC
rules and their effect on an investment in our Common Shares, with particular regard to (i) the advisability of
making the qualified election in the event that we notify the shareholders that we have become a PFIC in any
taxable year, or (ii) the advisability of making the mark-to-market election provided in the tax law.
Backup Withholding and Information Reporting
In general, dividend payments, or other taxable distributions, paid within the United States or through
certain U.S.-related financial intermediaries on our Common Shares will be subject to information reporting
requirements and backup withholding tax at the rate of 28% for a non-corporate United States person and, who
also:
•
fails to provide an accurate taxpayer identification number;
•
is notified by the Internal Revenue Service that the individual has failed to report all interest or
dividends required to be shown on the Federal income tax returns; or
•
in certain circumstances, fails to comply with applicable certification requirements.
Certain corporations and persons that are not United States persons may be required to establish their
exemption from information reporting and backup withholding by certifying their status on Internal Revenue
Service Form W-8 or W-9.
If a United States person sells our Common Shares to or through a United States office of a broker, the
payment of the proceeds is subject to both United States backup withholding and information reporting unless the
individual can certify that they are a non-U.S. person, under penalties of perjury, or they otherwise establish an
exemption. If a United States person sells our Common Shares through a non-U.S. office of a non-U.S. broker
and the sale proceeds are paid to the person outside the United States then information reporting and backup
withholding generally will not apply to that payment. However, United States information reporting
requirements, but not backup withholding, will apply to a payment of sales proceeds, even if that payment is
made to the United States person outside the United States, if the person sells our Common Shares through a
non-U.S. office of a broker that is a U.S. person or has certain other contacts with the United States.
An individual generally may obtain a refund of any amounts withheld under the backup withholding rules
that exceed the individual’s income tax liability by filing a refund claim with the United States Internal Revenue
Service.
Foreign Currency Issues
If dividends are paid in euros, the amount of the dividend distribution included in the income of a U.S.
Holder will be the U.S. dollar value of the payments made in euros, determined at a spot, euro/U.S. dollar rate
applicable to the date such dividend is includible in the income of the U.S. Holder, regardless of whether the
payment is in fact converted into U.S. dollars. Generally, gain or loss (if any) resulting from currency exchange
fluctuations during the period from the date the dividend is paid to the date such payment is converted into U.S.
dollars will be treated as ordinary income or loss. We have never paid cash dividends on our share capital and do
not intend to do so for the foreseeable future.
69
Documents on Display
Documents referred to in this Annual Report may be inspected at our principal executive office located at
Spoorstraat 50, 5911 KJ Venlo, The Netherlands.
Item 11.
Quantitative and Qualitative Disclosures About Market Risk
Our market risk relates primarily to interest rate exposures on cash, marketable securities and borrowings
and foreign currency exposures on intercompany transactions. The overall objective of our risk management is to
reduce the potential negative earnings effects from changes in interest and foreign exchange rates. Exposures are
managed through operational methods and financial instruments. We do not use financial instruments for trading
or other speculative purposes.
Interest Rate Risk
At December 31, 2006, we had $430.4 million in cash and cash equivalents and $52.8 million in marketable
securities, of which $17.4 million was invested in fixed rate debt securities. Interest income earned on our cash
investments and our floating rate note marketable securities is affected by changes in the relative levels of market
interest rates. We only invest in high-grade investment securities. A hypothetical adverse 10% movement in
market interest rates would decrease 2006 earnings by approximately $800,000.
Borrowings against lines of credit are at variable interest rates. We had no outstanding lines of credit at
December 31, 2006. A hypothetical adverse 10 percent movement in market interest rates would not have
materially impacted our financial statements.
At December 31, 2006, we had $496.1 million in long-term debt, of which $46.1 million was at a variable
rate. A hypothetical adverse 10% movement in market interest rates would decrease 2006 earnings by
approximately $124,000, based on the quarter-end interest rate, a loan balance consistent with that at quarter-end
and a constant foreign exchange rate.
Currency Fluctuations
We operate on an international basis. A significant portion of our revenues and expenses are earned and
incurred in currencies other than the U.S. dollar. The euro is the most significant such currency, with others
including the British pound, Japanese yen, Swiss franc, Norwegian krone and Canadian and Australian dollars.
Fluctuations in the value of the currencies in which we conduct our business relative to the U.S. dollar have
caused and will continue to cause U.S. dollar translations of such currencies to vary from one period to another.
Due to the number of currencies involved, the constantly changing currency exposures, and the potential
substantial volatility of currency exchange rates, we cannot predict the effect of exchange rate fluctuations upon
future operating results. However, because we have substantial expenses as well as revenues in each of our
principal functional currencies, the exposure of our financial results to currency fluctuations is reduced. In
general terms, depreciation of the U.S. dollar against our other foreign currencies, such as occurred in 2006 with
respect to the euro, will increase reported net sales. However, this impact normally will be at least partially offset
in the results of operations by gains or losses from foreign currency transactions.
Currency Hedging
In the ordinary course of business, we purchase instruments with which we intend to hedge foreign currency
fluctuations with the principal objective of minimizing the risks and/or costs associated with global financial and
operating activities. Generally, we hedge a majority of the anticipated cash flow that we expect to exchange into
other currencies, subject to our short-term financing needs. We do not utilize financial instruments for trading or
other speculative purposes.
70
At December 31, 2006, these foreign currency instruments consisted of options, which give us the right, but
not the obligation, to purchase foreign currencies in exchange for U.S. dollars at predetermined exchange rates.
These options are marked to market through our statements of income and are not designated as effective hedges
according to the provisions of SFAS 133. At December 31, 2006 and 2005, we did not have any significant
foreign currency exchange option holdings.
During 2005, our German and Swiss subsidiaries entered into forward arrangements which qualify for hedge
accounting as cash flow hedges of foreign currency denominated liabilities. At December 31, 2006, these
forward contracts totaled $44.0 million as a hedge to currency risk on intercompany loans. The contracts mature
in July 2011. The gain or loss on the change in the fair values of the derivatives are included in earnings to the
extent they offset the earnings impact of changes in the fair values of the hedged obligations. Any difference is
deferred in accumulated comprehensive income, a component of shareholders’ equity. These contracts
effectively fix the exchange rate at which the intercompany loans will be settled in, so that gains or losses on the
forward contracts offset the losses or gains from changes in the value of the underlying intercompany loans.
During 2006, we also entered into two additional forward arrangements which qualify as cash flow hedges
of foreign currency denominated liabilities. At December 31, 2006, we held a contract for CND 8.0 million
which matures in February 2007. Additionally we held a contract for JPY 200.0 million which matures in April
2007.
At December 31, 2005, we held a contract for CND 9.0 million which matured in February 2006 and had a
fair market value of $377,000 which is included in accrued and other liabilities at December 31, 2005.
Foreign Currency Exchange Rate Risk
We have significant production and manufacturing facilities located in Germany and Switzerland, and
intercompany sales of inventory expose us to foreign currency exchange rate risk. Intercompany sales of
inventory are generally denominated in the local currency of the subsidiary purchasing the inventory in order to
centralize foreign currency risk with the manufacturing subsidiary. Payment for intercompany purchases of
inventory is required within 30 days from invoice date. The delay between the date the manufacturing
subsidiaries record revenue and the date when the payment is received from the purchasing subsidiaries exposes
us to foreign exchange risk. The exposure results primarily from those transactions between the manufacturing
subsidiaries and the U.S.
The foreign currency exchange rate risk is partially offset by transactions of the manufacturing subsidiary
denominated in U.S. dollars. Hedging instruments include foreign currency put options that are purchased to
protect the majority of the existing and/or anticipated receivables resulting from intercompany sales from the
manufacturing subsidiary to the U.S. These options give us the right, but not the obligation, to purchase foreign
currencies in exchange for U.S. dollars at predetermined exchange rates. Management does not believe that our
exposure to foreign currency exchange rate risk is material.
Item 12.
Description of Securities other than Equity Securities
Not Applicable.
71
PART II
Item 13.
Defaults, Dividend Arrearages and Delinquencies
Not applicable.
Item 14.
Material Modifications to the Rights of Security Holders and Use of Proceeds
Not applicable.
Item 15.
Controls and Procedures
Disclosure Controls and Procedures
Our Managing Directors, with the assistance of other members of management, performed an evaluation of
the effectiveness of the design and operation of our disclosure controls and procedures, as that term is defined in
Rule 13a-15(e) of the Securities Exchange Act of 1934, as amended, within 90 days of the date of this report.
Based on that evaluation, they concluded that our disclosure controls and procedures are effective to provide
reasonable assurance that information required to be disclosed in this report is recorded, processed, summarized
and reported on a timely basis.
There are inherent limitations to the effectiveness of any system of disclosure controls and procedures, no
matter how well designed, such as the possibility of human error and the circumvention or overriding of the
controls and procedures. Therefore, even those systems determined to be effective may not prevent or detect
misstatements and can provide only reasonable assurance of achieving their control objectives. In addition, any
determination of effectiveness of controls is not a projection of any effectiveness of those controls to future
periods, as those controls may become inadequate because of changes in conditions or the degree of compliance
with the policies or procedures may deteriorate.
Report of Management on Internal Control over Financial Reporting
Our management is responsible for establishing and maintaining adequate internal control over financial
reporting as defined in Rules 13a-15(f) and 15d-15(f) under the Securities Exchange Act of 1934, as amended.
The Company’s system of internal controls over financial reporting is designed to provide reasonable assurance
regarding the reliability of financial reporting and the preparation of the consolidated financial statements in
accordance with generally accepted accounting principles.
Because of its inherent limitations, internal control over financial reporting may not prevent or detect
misstatements and even when determined to be effective can provide only reasonable assurance with respect to
financial statement preparation and presentation. Projections of any evaluation of effectiveness to future periods
are subject to the risk that controls may become inadequate because of changes in conditions, or that the degree
of compliance with the policies or procedures may deteriorate.
Our management assessed the effectiveness of the Company’s internal control over financial reporting as of
December 31, 2006. In making this assessment, management used the criteria set forth by the Committee of
Sponsoring Organizations of the Treadway Commission (COSO) in Internal Control-Integrated Framework.
Based on our assessment under the COSO Internal Control-Integrated Framework, management believes
that, as of December 31, 2006, our internal control over financial reporting is effective.
Ernst & Young LLP, the independent registered public accounting firm that audited the Company’s
consolidated financial statements for the year ended December 31, 2006, has issued an attestation report on
management’s assessment of our internal control over financial reporting which is included in this Annual Report
on Form 20-F. This report appears on page F-3.
72
Changes in Internal Control over Financial Reporting
There has been no change in our internal control over financial reporting during 2006 that has materially
affected, or is reasonably likely to materially affect, our internal control over financial reporting.
Item 16A. Audit Committee Financial Expert
The Board has designated Dr. Heinrich Hornef as an “audit committee financial expert” as that term is
defined in the SEC rules adopted pursuant to the Sarbanes-Oxley Act. Dr. Hornef is “independent” as defined in
the Marketplace Rules of the NASDAQ as applicable to Audit Committees.
Item 16B. Code of Ethics
QIAGEN has in place a Code of Conduct that applies to all Directors, officers and employees which
qualifies as a code of ethics, as required by SEC and NASDAQ Marketplace Rules. The Code of Conduct applies
to all of QIAGEN’s employees, including our principal executive officer, principal financial officer, principal
accounting officer or controller and other persons performing similar functions. The full text of the Code of
Conduct is available on our website at www.qiagen.com.
Item 16C. Principal Accountant Fees and Services
Audit Committee Pre-Approval Policies and Procedures
The Audit Committee has adopted a pre-approval policy that requires the pre-approval of all services
performed for us by Ernst & Young LLP. Additionally, the Audit Committee has delegated to the Committee
Chairman full authority to approve any management request for pre-approval provided the Chairman presents
any approval given at its next scheduled meeting. All audit related services, tax services and other services
rendered by Ernst & Young LLP were pre-approved by the Audit Committee and are compatible with
maintaining the auditor’s independence.
At our 2006 Annual General Meeting of Shareholders held on June 22, 2006, our shareholders reappointed
Ernst & Young LLP to serve as our auditors for the fiscal year ended December 31, 2006. Set forth below are the
total fees billed (or expected to be billed), on a consolidated basis, by Ernst & Young LLP for providing audit
and other professional services in each of the last two fiscal years:
2006
2005
Audit fees . . . . . . . . . . . . . . . . . . . . . . . . . . . . . . . . . . . . . . . . . .
Audit related fees . . . . . . . . . . . . . . . . . . . . . . . . . . . . . . . . . . . .
Tax fees . . . . . . . . . . . . . . . . . . . . . . . . . . . . . . . . . . . . . . . . . . . .
All other fees . . . . . . . . . . . . . . . . . . . . . . . . . . . . . . . . . . . . . . . .
$1,219,000
438,000
196,000
732,000
$ 536,000
155,000
145,000
239,000
Total . . . . . . . . . . . . . . . . . . . . . . . . . . . . . . . . . . . . . . . . . . . . . .
$2,585,000
$1,075,000
Audit fees consist of fees and expenses billed for the annual audit and quarterly review of QIAGEN’s
consolidated financial statements. They also include fees billed for other audit services, which are those services
that only the statutory auditor can provide, and include the review of documents filed with the Securities
Exchange Commission. For the years ended December 31, 2006 and 2005, audit fees include $600,000 and
$6,000, respectively, for the auditors’ attestation on internal controls over financial reporting.
Audit-related fees consist of fees and expenses billed for assurance and related services that are related to
the performance of the audit or review of QIAGEN’s financial statements and include consultations concerning
financial accounting and reporting standards; review of the opening balance sheets of newly acquired companies;
and statutory audit of subsidiaries’ financial statements.
73
Tax fees include fees and expenses billed for tax compliance services, including assistance on the
preparation of tax returns and claims for refund; tax consultations, such as assistance and representation in
connection with tax audits and appeals, tax advice related to mergers and acquisitions, transfer pricing, and
requests for rulings or technical advice from taxing authorities; tax planning services; and expatriate tax
compliance, consultation and planning services.
All other fees include fees and expenses billed for services such as information technology projects,
transaction due diligence and cost segregation studies as allowed by the Sarbanes Oxley Act of 2002. For the
year ended December 31, 2006, other fees includes approximately $364,000 related to transaction due diligence.
Item 16D. Exemptions From the Listing Standards for Audit Committees
Not applicable.
Item 16E. Purchases of Equity Securities by the Issuer and Affiliated Purchasers
Not applicable.
74
PART III
Item 17.
Financial Statements
See Item 18.
Item 18.
Financial Statements
See pages F-1 through F-42 included herein.
(A) The following financial statements, together with the report of Ernst & Young LLP thereon, are
filed as part of this annual report:
Report of Independent Registered Public Accounting Firm . . . . . . . . . . . . . . . . . . . . . . . . . . . . .
F-2
Report of Independent Registered Public Accounting Firm on Internal Control Over Financial
Reporting . . . . . . . . . . . . . . . . . . . . . . . . . . . . . . . . . . . . . . . . . . . . . . . . . . . . . . . . . . . . . . . . . .
F-3
Consolidated Balance Sheets . . . . . . . . . . . . . . . . . . . . . . . . . . . . . . . . . . . . . . . . . . . . . . . . . . . . .
F-4
Consolidated Statements of Income . . . . . . . . . . . . . . . . . . . . . . . . . . . . . . . . . . . . . . . . . . . . . . . .
F-6
Consolidated Statements of Shareholders’ Equity and Comprehensive Income . . . . . . . . . . . . . .
F-7
Consolidated Statements of Cash Flows . . . . . . . . . . . . . . . . . . . . . . . . . . . . . . . . . . . . . . . . . . . .
F-8
Notes to Consolidated Financial Statements . . . . . . . . . . . . . . . . . . . . . . . . . . . . . . . . . . . . . . . . . F-10
Schedule II—Valuation and Qualifying Accounts . . . . . . . . . . . . . . . . . . . . . . . . . . . . . . . . . . . . .
S-1
Item 19.
Exhibits
1.1
Articles of Association as confirmed by notorial deed as of July 14, 2005 (English translation)
(filed as Exhibit 4.1) (5)
2.1
Credit Contract for a Club Deal between QIAGEN GmbH, Deutsche Bank AG, Stadtsparkasse
Dusseldorf, and IKB Deutsche Industriebank AG, dated July 12, 2004 (English Translation) (6)
2.2
Declaration by QIAGEN N.V. to Deutsche Bank Aktiengesellschaft dated July 12, 2004 (6)
2.3
Indenture between QIAGEN Finance (Luxembourg) S.A., QIAGEN N.V., Deutsche Trustee
Company Limited, Deutsche Bank AG and Deutsche Bank Luxembourg S.A. dated August 18,
2004 (6)
2.4
Agreement In Connection With The Delivery Of Ordinary Shares In The Share Capital Of
QIAGEN N.V. Pursuant To Convertible Notes Due 2024 Issued By QIAGEN Finance
(Luxembourg) S.A. dated August 18, 2004 (6)
*2.5
Amendment to Agreement In Connection With The Delivery Of Ordinary Shares In The Share
Capital Of QIAGEN N.V. Pursuant To Convertible Notes Due 2024 Issued By QIAGEN Finance
(Luxembourg) S.A. dated July 1, 2006
*2.6
Indenture between QIAGEN Euro Finance (Luxembourg) S.A., QIAGEN N.V., Deutsche Trustee
Company Limited, Deutsche Bank AG and Deutsche Bank Luxembourg S.A. dated May 16, 2006
*2.7
Agreement In Connection With The Delivery Of Ordinary Shares In The Share Capital Of
QIAGEN N.V. Pursuant To Convertible Notes Due 2026 Issued By QIAGEN Euro Finance
(Luxembourg) S.A. dated May 8, 2006
*2.8
Amendment to Agreement In Connection With The Delivery Of Ordinary Shares In The Share
Capital Of QIAGEN N.V. Pursuant To Convertible Notes Due 2026 Issued By QIAGEN Euro
Finance (Luxembourg) S.A. dated July 1, 2006
4.1
Lease between QIAGEN GmbH and Brixton Estate Deutschland GmbH dated March 14, 1997 (the
“Albert-Einstein-Str. Lease” (Filed as Exhibit 10.1(a)) (1)
75
4.2
The “Albert-Einstein-Str. Lease” Contract Summary (Filed as Exhibit 10.1(b)) (1)
4.3
Master Agreement among Becton, Dickinson and Company, Becton Dickinson Sample
Collection GmbH, QIAGEN AG, and QIAGEN N.V., dated August 5, 1999 (Filed as Exhibit
10.1) (2)
4.4
Lease Between QIAGEN GmbH and Gisantus Grundstucksverwaltungsgesellscharft mbH, dated
January 13, 1997 (the “Max-Volmer-Strasse 4 Lease”) (Filed as Exhibit 10.3) (2)
4.5
The “Max-Volmer-Strasse 4 Lease” Summary (Filed as Exhibit 10.3(a)) (2)
4.6
Consultancy Agreement between QIAGEN GmbH and Dr. Metin Colpan dated December 4,
2003 (6)
4.7
QIAGEN N.V. Amended and Restated Stock Plan (5)
4.8
Amendment No. 1 to the Consultancy Agreement between QIAGEN GmbH and Dr. Metin
Colpan dated February 11, 2004 (7)
*8.1
List of Subsidiaries
*12.1
Certifications under Section 302; Peer M. Schatz, Managing Director and Chief Executive Officer
*12.2
Certifications under Section 302; Roland Sackers, Managing Director and Chief Financial Officer
*13.1
Certifications under Section 906; Peer M. Schatz, Managing Director and Chief Executive Officer
and Roland Sackers, Managing Director and Chief Financial Officer
*15.1
Consent of Ernst & Young LLP
*
Filed herewith.
(1) Incorporated by reference to Form 20-F Annual Report of QIAGEN N.V. filed with the Securities and
Exchange Commission on May 21, 1998.
(2) Incorporated by reference to Form 20-F Annual Report of QIAGEN N.V. filed with the Securities and
Exchange Commission on March 31, 2000.
(3) Incorporated by reference to Form 20-F Annual Report of QIAGEN N.V. filed with the Securities and
Exchange Commission on March 31, 2003.
(4) Incorporated by reference to Form 20-F Annual Report of QIAGEN N.V. filed with the Securities and
Exchange Commission on March 26, 2004.
(5) Incorporated by reference to Registration Statement of QIAGEN N.V. on Form S-8 filed with the Securities
and Exchange Commission on August 10, 2005.
(6) Incorporated by reference to Form 20-F Annual Report of QIAGEN N.V. filed with the Securities and
Exchange Commission on April 19, 2005.
(7) Incorporated by reference to Form 20-F Annual Report of QIAGEN N.V. filed with the Securities and
Exchange Commission on April 19, 2005.
76
SIGNATURES
The registrant hereby certifies that it meets all of the requirements for filing on Form 20-F and that it has
duly caused and authorized the undersigned to sign this annual report on its behalf.
QIAGEN N.V.
Dated: March 30, 2007
By: /s/ Peer M. Schatz
Peer M. Schatz, Chief Executive Officer
77
QIAGEN N.V. AND SUBSIDIARIES
INDEX TO CONSOLIDATED FINANCIAL STATEMENTS
Page
Report of Independent Registered Public Accounting Firm . . . . . . . . . . . . . . . . . . . . . . . . . . . . . . . . . . . . . .
Report of Independent Registered Public Accounting Firm on Internal Control Over Financial
Reporting . . . . . . . . . . . . . . . . . . . . . . . . . . . . . . . . . . . . . . . . . . . . . . . . . . . . . . . . . . . . . . . . . . . . . . . . . . .
Consolidated Balance Sheets . . . . . . . . . . . . . . . . . . . . . . . . . . . . . . . . . . . . . . . . . . . . . . . . . . . . . . . . . . . . . .
Consolidated Statements of Income . . . . . . . . . . . . . . . . . . . . . . . . . . . . . . . . . . . . . . . . . . . . . . . . . . . . . . . .
Consolidated Statements of Shareholders’ Equity and Comprehensive Income . . . . . . . . . . . . . . . . . . . . . .
Consolidated Statements of Cash Flows . . . . . . . . . . . . . . . . . . . . . . . . . . . . . . . . . . . . . . . . . . . . . . . . . . . . .
Notes to Consolidated Financial Statements . . . . . . . . . . . . . . . . . . . . . . . . . . . . . . . . . . . . . . . . . . . . . . . . . .
F-1
F-2
F-3
F-4
F-6
F-7
F-8
F-10
REPORT OF INDEPENDENT REGISTERED PUBLIC ACCOUNTING FIRM
The Supervisory Board and Shareholders of QIAGEN N.V. and Subsidiaries
We have audited the accompanying consolidated balance sheets of QIAGEN N.V. and Subsidiaries as of
December 31, 2006 and 2005, and the related consolidated statements of income, shareholders’ equity and
comprehensive income and cash flows for each of the three years in the period ended December 31, 2006. Our
audits also included the financial statement schedule listed in the Index at Item 19(A). These financial statements
and schedule are the responsibility of the Company’s management. Our responsibility is to express an opinion on
these financial statements and schedule based on our audits.
We conducted our audits in accordance with the standards of the Public Company Accounting Oversight
Board (United States). Those standards require that we plan and perform the audit to obtain reasonable assurance
about whether the financial statements are free of material misstatement. An audit includes examining, on a test
basis, evidence supporting the amounts and disclosures in the financial statements. An audit also includes
assessing the accounting principles used and significant estimates made by management, as well as evaluating
the overall financial statement presentation. We believe that our audits provide a reasonable basis for our
opinion.
In our opinion, the financial statements referred to above present fairly, in all material respects, the
consolidated financial position of QIAGEN N.V. and Subsidiaries at December 31, 2006 and 2005, and the
consolidated results of their operations and their cash flows for each of the three years in the period ended
December 31, 2006, in conformity with U.S. generally accepted accounting principles. Also, in our opinion, the
related financial statement schedule, when considered in relation to the basic financial statements taken as a
whole, present fairly in all material respects the information set forth therein.
As discussed in Note 17 to the consolidated financial statements, QIAGEN N.V. changed its method of
accounting for share-based compensation in 2006 upon adoption of Statement of Financial accounting Standards
No. 123 (R), “Share-Based Payment.”
We also have audited, in accordance with the standards of the Public Company Accounting Oversight Board
(United States), the effectiveness of QIAGEN N.V.’s internal control over financial reporting as of December 31,
2006, based on criteria established in Internal Control—Integrated Framework issued by the Committee of
Sponsoring Organizations of the Treadway Commission and our report dated March 30, 2007 expressed an
unqualified opinion thereon.
/s/ ERNST & YOUNG LLP
McLean, Virginia
March 30, 2007
F-2
REPORT OF INDEPENDENT REGISTERED PUBLIC ACCOUNTING FIRM ON
INTERNAL CONTROL OVER FINANCIAL REPORTING
The Supervisory Board and Shareholders of QIAGEN N.V. and Subsidiaries
We have audited management’s assessment, included in the accompanying Management’s Report on
Internal Control Over Financial Reporting, that QIAGEN N.V. maintained effective internal control over
financial reporting as of December 31, 2006, based on criteria established in Internal Control—Integrated
Framework issued by the Committee of Sponsoring Organizations of the Treadway Commission (the COSO
criteria). QIAGEN N.V.’s management is responsible for maintaining effective internal control over financial
reporting and for its assessment of the effectiveness of internal control over financial reporting. Our
responsibility is to express an opinion on management’s assessment and an opinion on the effectiveness of the
company’s internal control over financial reporting based on our audit.
We conducted our audit in accordance with the standards of the Public Company Accounting Oversight
Board (United States). Those standards require that we plan and perform the audit to obtain reasonable assurance
about whether effective internal control over financial reporting was maintained in all material respects. Our
audit included obtaining an understanding of internal control over financial reporting, evaluating management’s
assessment, testing and evaluating the design and operating effectiveness of internal control, and performing such
other procedures as we considered necessary in the circumstances. We believe that our audit provides a
reasonable basis for our opinion.
A company’s internal control over financial reporting is a process designed to provide reasonable assurance
regarding the reliability of financial reporting and the preparation of financial statements for external purposes in
accordance with generally accepted accounting principles. A company’s internal control over financial reporting
includes those policies and procedures that (1) pertain to the maintenance of records that, in reasonable detail,
accurately and fairly reflect the transactions and dispositions of the assets of the company; (2) provide reasonable
assurance that transactions are recorded as necessary to permit preparation of financial statements in accordance
with generally accepted accounting principles, and that receipts and expenditures of the company are being made
only in accordance with authorizations of management and directors of the company; and (3) provide reasonable
assurance regarding prevention or timely detection of unauthorized acquisition, use, or disposition of the
company’s assets that could have a material effect on the financial statements.
Because of its inherent limitations, internal control over financial reporting may not prevent or detect
misstatements. Also, projections of any evaluation of effectiveness to future periods are subject to the risk that
controls may become inadequate because of changes in conditions, or that the degree of compliance with the
policies or procedures may deteriorate.
In our opinion, management’s assessment that QIAGEN N.V. maintained effective internal control over
financial reporting as of December 31, 2006, is fairly stated, in all material respects, based on the COSO criteria.
Also, in our opinion, QIAGEN N.V. maintained, in all material respects, effective internal control over financial
reporting as of December 31, 2006, based on the COSO criteria.
We also have audited, in accordance with the standards of the Public Company Accounting Oversight Board
(United States), the 2006 consolidated financial statements of QIAGEN N.V. and our report dated March 30,
2007 expressed an unqualified opinion thereon.
/s/ ERNST & YOUNG LLP
McLean, Virginia
March 30, 2007
F-3
QIAGEN N.V. AND SUBSIDIARIES
CONSOLIDATED BALANCE SHEETS
ASSETS
As of December 31,
2006
2005
Assets
Current Assets:
Cash and cash equivalents . . . . . . . . . . . . . . . . . . . . . . . . . . . . . . . . . . . . . .
Marketable securities . . . . . . . . . . . . . . . . . . . . . . . . . . . . . . . . . . . . . . . . . .
Notes receivable . . . . . . . . . . . . . . . . . . . . . . . . . . . . . . . . . . . . . . . . . . . . . .
Accounts receivable, net of allowance for doubtful accounts of
$4,167,000 and $2,388,000 in 2006 and 2005, respectively . . . . . . . . . .
Income taxes receivable . . . . . . . . . . . . . . . . . . . . . . . . . . . . . . . . . . . . . . . .
Inventories, net . . . . . . . . . . . . . . . . . . . . . . . . . . . . . . . . . . . . . . . . . . . . . . .
Deferred income taxes . . . . . . . . . . . . . . . . . . . . . . . . . . . . . . . . . . . . . . . . .
Prepaid expenses and other . . . . . . . . . . . . . . . . . . . . . . . . . . . . . . . . . . . . .
$ 430,357,000
52,782,000
4,247,000
$191,700,000
15,000,000
4,283,000
80,429,000
2,901,000
64,085,000
18,627,000
29,763,000
63,538,000
4,161,000
53,653,000
11,617,000
26,305,000
683,191,000
370,257,000
221,277,000
160,141,000
195,199,000
93,914,000
118,492,000
2,409,000
26,502,000
74,566,000
6,346,000
25,016,000
Total long-term assets . . . . . . . . . . . . . . . . . . . . . . . . . . . . . . . . . . . . . . . . . . . . .
528,821,000
395,041,000
Total assets . . . . . . . . . . . . . . . . . . . . . . . . . . . . . . . . . . . . . . . . . . . . . . . . . . . . . .
$1,212,012,000
$765,298,000
Total current assets . . . . . . . . . . . . . . . . . . . . . . . . . . . . . . . . . . . . . . . . . . . . . . . .
Long-Term Assets:
Property, plant and equipment, net . . . . . . . . . . . . . . . . . . . . . . . . . . . . . . .
Goodwill . . . . . . . . . . . . . . . . . . . . . . . . . . . . . . . . . . . . . . . . . . . . . . . . . . . .
Intangible assets, net of accumulated amortization of $25,904,000 and
$13,813,000 in 2006 and 2005, respectively . . . . . . . . . . . . . . . . . . . . . .
Deferred income taxes . . . . . . . . . . . . . . . . . . . . . . . . . . . . . . . . . . . . . . . . .
Other assets . . . . . . . . . . . . . . . . . . . . . . . . . . . . . . . . . . . . . . . . . . . . . . . . .
The accompanying notes are an integral part of these consolidated financial statements.
F-4
QIAGEN N.V. AND SUBSIDIARIES
CONSOLIDATED BALANCE SHEETS
LIABILITIES AND SHAREHOLDERS’ EQUITY
As of December 31,
2006
2005
Liabilities and Shareholders’ Equity
Current Liabilities:
Current portion of long-term debt . . . . . . . . . . . . . . . . . . . . . . . . . . . . . . . . $
Current portion of capital lease obligations . . . . . . . . . . . . . . . . . . . . . . . . .
Accounts payable . . . . . . . . . . . . . . . . . . . . . . . . . . . . . . . . . . . . . . . . . . . . .
Accrued and other liabilities (of which $8.1 million due to related parties
in 2006 and 2005, see Note 20) . . . . . . . . . . . . . . . . . . . . . . . . . . . . . . . .
Income taxes payable . . . . . . . . . . . . . . . . . . . . . . . . . . . . . . . . . . . . . . . . . .
Deferred income taxes . . . . . . . . . . . . . . . . . . . . . . . . . . . . . . . . . . . . . . . . .
6,599,000 $ 5,921,000
823,000
995,000
23,806,000
15,934,000
66,197,000
13,746,000
5,360,000
52,707,000
14,935,000
1,179,000
Total current liabilities . . . . . . . . . . . . . . . . . . . . . . . . . . . . . . . . . . . . . . . . . . . . .
116,531,000
91,671,000
Long-Term Liabilities:
Long-term debt, net of current portion (of which $450.0 million in 2006
and $150.0 million in 2005 due to related parties, see Note 20) . . . . . . .
Capital lease obligations, net of current portion . . . . . . . . . . . . . . . . . . . . .
Deferred income taxes . . . . . . . . . . . . . . . . . . . . . . . . . . . . . . . . . . . . . . . . .
Other . . . . . . . . . . . . . . . . . . . . . . . . . . . . . . . . . . . . . . . . . . . . . . . . . . . . . . .
489,592,000
12,009,000
21,705,000
6,010,000
191,447,000
11,101,000
17,570,000
3,052,000
Total long-term liabilities . . . . . . . . . . . . . . . . . . . . . . . . . . . . . . . . . . . . . . . . . . .
529,316,000
223,170,000
Shareholders’ Equity:
Common shares, .01 EUR par value:
Authorized—260,000,000 shares
Issued and outstanding—150,167,540 shares in 2006 and 148,455,864
shares in 2005 . . . . . . . . . . . . . . . . . . . . . . . . . . . . . . . . . . . . . . . . . . . . . .
Additional paid-in capital . . . . . . . . . . . . . . . . . . . . . . . . . . . . . . . . . . . . . . .
Retained earnings . . . . . . . . . . . . . . . . . . . . . . . . . . . . . . . . . . . . . . . . . . . . .
Accumulated other comprehensive income . . . . . . . . . . . . . . . . . . . . . . . . .
1,535,000
178,656,000
344,739,000
41,235,000
1,513,000
157,796,000
274,200,000
16,948,000
Total shareholders’ equity . . . . . . . . . . . . . . . . . . . . . . . . . . . . . . . . . . . . . . . . . .
566,165,000
450,457,000
Total liabilities and shareholders’ equity . . . . . . . . . . . . . . . . . . . . . . . . . . . . . . .
$1,212,012,000
$765,298,000
Commitments and Contingencies (Note 18)
The accompanying notes are an integral part of these consolidated financial statements.
F-5
QIAGEN N.V. AND SUBSIDIARIES
CONSOLIDATED STATEMENTS OF INCOME
2006
Years ended December 31,
2005
2004
Net sales . . . . . . . . . . . . . . . . . . . . . . . . . . . . . . . . . . . . . . . . . . . .
Cost of sales . . . . . . . . . . . . . . . . . . . . . . . . . . . . . . . . . . . . . . . . .
Cost of sales—acquisition and restructuring . . . . . . . . . . . . . . . . .
$465,778,000
139,122,000
2,046,000
$398,395,000
122,755,000
439,000
$380,629,000
125,658,000
1,454,000
Gross profit . . . . . . . . . . . . . . . . . . . . . . . . . . . . . . . . . . . . . . . . . .
324,610,000
275,201,000
253,517,000
Operating Expenses:
Research and development . . . . . . . . . . . . . . . . . . . . . . . . . .
Sales and marketing . . . . . . . . . . . . . . . . . . . . . . . . . . . . . . .
General and administrative . . . . . . . . . . . . . . . . . . . . . . . . . .
Purchased in-process research and development . . . . . . . . .
Acquisition, integration and related costs . . . . . . . . . . . . . . .
Acquisition related intangible amortization . . . . . . . . . . . . .
Relocation, restructuring and related costs . . . . . . . . . . . . . .
41,560,000
115,942,000
48,574,000
2,200,000
6,061,000
8,220,000
1,452,000
35,780,000
94,312,000
40,123,000
3,239,000
3,213,000
3,697,000
—
34,351,000
87,506,000
41,715,000
—
572,000
1,416,000
3,817,000
Total operating expenses . . . . . . . . . . . . . . . . . . . . . . . . . . . . . . . .
224,009,000
180,364,000
169,377,000
Income from operations . . . . . . . . . . . . . . . . . . . . . . . . . . . . . . . .
100,601,000
94,837,000
84,140,000
Other Income (Expense):
Interest income . . . . . . . . . . . . . . . . . . . . . . . . . . . . . . . . . . .
Interest expense . . . . . . . . . . . . . . . . . . . . . . . . . . . . . . . . . . .
Research and development grants . . . . . . . . . . . . . . . . . . . . .
Loss on foreign currency transactions, net . . . . . . . . . . . . . .
Gain (loss) from equity method investees . . . . . . . . . . . . . . .
Other miscellaneous (expense) income, net . . . . . . . . . . . . .
16,359,000
(11,918,000)
795,000
(660,000)
1,251,000
(360,000)
7,552,000
(5,940,000)
1,380,000
(157,000)
(1,149,000)
741,000
2,887,000
(5,101,000)
1,608,000
(67,000)
(2,243,000)
(8,537,000)
Total other income (expense) . . . . . . . . . . . . . . . . . . . . . . . . . . . .
5,467,000
2,427,000
(11,453,000)
Income before provision for income taxes . . . . . . . . . . . . . . . . . .
Provision for income taxes . . . . . . . . . . . . . . . . . . . . . . . . . . . . . .
106,068,000
35,529,000
97,264,000
35,039,000
72,687,000
23,982,000
Net income . . . . . . . . . . . . . . . . . . . . . . . . . . . . . . . . . . . . . . . . . .
$ 70,539,000
$ 62,225,000
$ 48,705,000
Basic net income per common share . . . . . . . . . . . . . . . . . . . . . . .
$
0.47
$
0.42
$
0.33
Diluted net income per common share . . . . . . . . . . . . . . . . . . . . .
$
0.46
$
0.41
$
0.33
Shares used in computing basic net income per common
share . . . . . . . . . . . . . . . . . . . . . . . . . . . . . . . . . . . . . . . . . . . . .
149,504,000
147,837,000
146,658,000
Shares used in computing diluted net income per common
share . . . . . . . . . . . . . . . . . . . . . . . . . . . . . . . . . . . . . . . . . . . . .
153,517,000
150,172,000
148,519,000
The accompanying notes are an integral part of these consolidated financial statements.
F-6
QIAGEN N.V. AND SUBSIDIARIES
CONSOLIDATED STATEMENTS OF SHAREHOLDERS’ EQUITY AND COMPREHENSIVE INCOME
Common Shares
Shares
Amount
Additional
Paid-In
Capital
Retained
Earnings
Accumulated
Other
Total
Comprehensive Shareholders’
Income (Loss)
Equity
BALANCE AT
DECEMBER 31, 2003 . . . . . . . . . . . . . . . . 146,217,518 $1,485,000 $140,039,000 $163,270,000 $ 29,992,000
Net income . . . . . . . . . . . . . . . . . . . . . . . . . . .
Unrealized loss, net on hedging contracts . . .
Unrealized gain, net on marketable
securities . . . . . . . . . . . . . . . . . . . . . . . . . . .
Realized gain, net on marketable securities . .
Translation adjustment . . . . . . . . . . . . . . . . . .
Comprehensive income . . . . . . . . . . . . . . . . .
Exercise of stock options . . . . . . . . . . . . . . . .
Tax benefit in connection with nonqualified
stock options, net of reclass related to
vested stock options . . . . . . . . . . . . . . . . . .
Option vesting accelerated in connection with
sale of synthetic DNA business unit . . . . . .
—
—
—
—
—
—
—
—
—
—
—
—
—
—
—
—
802,689
—
10,000
48,705,000
—
—
—
—
Comprehensive income . . . . . . . . . . . . . . . . .
Exercise of stock options . . . . . . . . . . . . . . . .
Tax benefit in connection with nonqualified
stock options . . . . . . . . . . . . . . . . . . . . . . . .
Proceeds from subscription receivable . . . . . .
Comprehensive income . . . . . . . . . . . . . . . . .
Transition adjustment to pension liability
upon adoption of new accounting standard,
net of deferred taxes . . . . . . . . . . . . . . . . . .
Stock issued for acquisition . . . . . . . . . . . . . .
Exercise of stock options . . . . . . . . . . . . . . . .
Tax benefit on stock options . . . . . . . . . . . . . .
Share-based compensation . . . . . . . . . . . . . . .
Proceeds from subscription receivable . . . . . .
47,000
(481,000)
11,617,000
47,000
(481,000)
11,617,000
—
—
—
—
59,388,000
5,132,000
—
—
775,000
—
—
775,000
—
—
295,000
—
—
295,000
—
—
—
—
—
—
—
—
—
—
—
—
—
—
—
—
1,435,657
—
—
—
18,000
—
—
62,225,000
—
—
—
—
—
(1,372,000)
62,225,000
(1,372,000)
2,800,000
507,000
(25,662,000)
2,800,000
507,000
(25,662,000)
—
38,498,000
7,959,000
3,169,000
455,000
—
—
—
—
3,169,000
455,000
—
—
—
—
—
—
—
—
—
—
—
—
—
—
—
—
—
—
—
2,000
20,000
—
—
—
—
1,846,000
10,986,000
7,385,000
326,000
317,000
70,539,000
—
—
—
—
—
—
—
16,948,000
450,457,000
—
(539,000)
2,122,000
70,539,000
(539,000)
2,122,000
(1,565,000)
24,473,000
(1,565,000)
24,473,000
95,030,000
(204,000)
—
—
—
—
BALANCE AT
DECEMBER 31, 2006 . . . . . . . . . . . . . . . 150,167,540 $1,535,000 $178,656,000 $344,739,000 $ 41,235,000
The accompanying notes are an integral part of these consolidated financial statements.
F-7
400,376,000
—
—
—
—
—
—
125,000
1,586,676
—
—
—
40,675,000
—
7,941,000
BALANCE AT
DECEMBER 31, 2005 . . . . . . . . . . . . . . . . 148,455,864 1,513,000 157,796,000 274,200,000
Net income . . . . . . . . . . . . . . . . . . . . . . . . . . .
Unrealized loss, net on hedging contracts . . .
Realized loss, net on hedging contracts . . . . .
Unrealized loss, net on marketable
securities . . . . . . . . . . . . . . . . . . . . . . . . . . .
Translation adjustment . . . . . . . . . . . . . . . . . .
48,705,000
(500,000)
—
5,122,000
BALANCE AT
DECEMBER 31, 2004 . . . . . . . . . . . . . . . . 147,020,207 1,495,000 146,231,000 211,975,000
Net income . . . . . . . . . . . . . . . . . . . . . . . . . . .
Unrealized loss, net on hedging contracts . . .
Unrealized gain, net on marketable
securities . . . . . . . . . . . . . . . . . . . . . . . . . . .
Realized loss, net on marketable securities . .
Translation adjustment . . . . . . . . . . . . . . . . . .
$334,786,000
—
(500,000)
(204,000)
1,848,000
11,006,000
7,385,000
326,000
317,000
$566,165,000
QIAGEN N.V. AND SUBSIDIARIES
CONSOLIDATED STATEMENTS OF CASH FLOWS
2006
Years ended December 31,
2005
Cash Flows From Operating Activities:
Net income . . . . . . . . . . . . . . . . . . . . . . . . . . . . . . . . . . . . . . . . $ 70,539,000
Adjustments to reconcile net income to net cash provided by
operating activities, net of effects of businesses acquired:
Depreciation and amortization . . . . . . . . . . . . . . . . . . . . .
30,038,000
Non-cash acquisition and restructure costs . . . . . . . . . . . .
4,745,000
Purchased in-process research and development . . . . . . .
2,200,000
Tax effect from non-qualified stock options, net . . . . . . .
(7,385,000)
Provision for losses on accounts receivable . . . . . . . . . . .
378,000
Deferred income taxes . . . . . . . . . . . . . . . . . . . . . . . . . . .
5,210,000
Loss on disposition of synthetic DNA business unit . . . .
—
(Gain) loss on disposition of property and equipment . . .
1,262,000
(Gain) loss on sale of marketable securities . . . . . . . . . . .
—
(Gain) loss on equity method investees . . . . . . . . . . . . . .
(1,251,000)
Share-based compensation . . . . . . . . . . . . . . . . . . . . . . . .
326,000
Other . . . . . . . . . . . . . . . . . . . . . . . . . . . . . . . . . . . . . . . . .
500,000
Net changes in operating assets and liabilities:
(Increase) decrease in:
Notes receivable . . . . . . . . . . . . . . . . . . . . . . . . . . . . . .
346,000
Accounts receivable . . . . . . . . . . . . . . . . . . . . . . . . . . .
(3,621,000)
Income taxes receivable . . . . . . . . . . . . . . . . . . . . . . . .
(5,385,000)
Inventories . . . . . . . . . . . . . . . . . . . . . . . . . . . . . . . . . .
(4,202,000)
Prepaid expenses and other . . . . . . . . . . . . . . . . . . . . . .
1,238,000
Other assets . . . . . . . . . . . . . . . . . . . . . . . . . . . . . . . . . .
(1,662,000)
Increase (decrease) in:
Accounts payable . . . . . . . . . . . . . . . . . . . . . . . . . . . . .
2,720,000
Accrued and other liabilities . . . . . . . . . . . . . . . . . . . . .
1,523,000
Income taxes payable . . . . . . . . . . . . . . . . . . . . . . . . . .
525,000
Other . . . . . . . . . . . . . . . . . . . . . . . . . . . . . . . . . . . . . . .
3,435,000
Net cash provided by operating activities . . . . . . . . . . . . . . . . . . . . .
101,479,000
Cash Flows From Investing Activities:
Purchases of property, plant and equipment . . . . . . . . . . . . . . .
(28,995,000)
Proceeds from sale of equipment . . . . . . . . . . . . . . . . . . . . . . .
1,256,000
Purchases of intangible assets . . . . . . . . . . . . . . . . . . . . . . . . . .
(6,358,000)
Purchases of investments . . . . . . . . . . . . . . . . . . . . . . . . . . . . .
—
Collections of note receivable in connection with disposed
synthetic DNA business unit . . . . . . . . . . . . . . . . . . . . . . . . .
652,000
Net proceeds from disposition of synthetic DNA business
unit . . . . . . . . . . . . . . . . . . . . . . . . . . . . . . . . . . . . . . . . . . . .
—
Purchases of marketable securities . . . . . . . . . . . . . . . . . . . . . .
(56,606,000)
Sales of marketable securities . . . . . . . . . . . . . . . . . . . . . . . . . .
20,000,000
Investment in unconsolidated subsidiary . . . . . . . . . . . . . . . . .
(42,000)
Cash paid for acquisitions, net of cash acquired . . . . . . . . . . . .
(95,379,000)
Net cash used in investing activities . . . . . . . . . . . . . . . . . . . . . . . . . (165,472,000)
$ 62,225,000 $ 48,705,000
24,955,000
22,961,000
2,114,000
—
3,239,000
—
3,169,000
775,000
54,000
128,000
(2,202,000) (10,474,000)
—
9,796,000
(97,000)
159,000
507,000
(481,000)
1,149,000
2,243,000
—
—
(123,000)
—
(33,000)
(131,000)
1,897,000
3,764,000
(9,778,000)
934,000
1,109,000
(4,193,000)
(368,000)
2,019,000
(5,282,000)
(5,213,000)
(4,711,000)
599,000
422,000
2,450,000
5,592,000 (13,009,000)
(1,709,000)
1,874,000
91,237,000
53,798,000
(13,728,000) (12,621,000)
1,738,000
1,584,000
(15,276,000) (3,493,000)
(4,981,000)
—
757,000
—
—
16,087,000
(40,445,000) (37,963,000)
55,430,000
14,860,000
—
(125,000)
(81,996,000) (29,478,000)
(98,501,000) (51,149,000)
The accompanying notes are an integral part of these consolidated financial statements.
F-8
2004
QIAGEN N.V. AND SUBSIDIARIES
CONSOLIDATED STATEMENTS OF CASH FLOWS
(CONTINUED)
2006
Years ended December 31,
2005
2004
Cash Flows From Financing Activities:
Repayment of lines of credit . . . . . . . . . . . . . . . . . . . . . . . . .
Proceeds from debt . . . . . . . . . . . . . . . . . . . . . . . . . . . . . . . .
Repayments of debt . . . . . . . . . . . . . . . . . . . . . . . . . . . . . . . .
Principal payments on capital leases . . . . . . . . . . . . . . . . . . .
Proceeds from subscription receivable . . . . . . . . . . . . . . . . .
Excess tax benefits from stock based compensation . . . . . . .
Issuance of common shares . . . . . . . . . . . . . . . . . . . . . . . . . .
—
295,022,000
(9,825,000)
(745,000)
317,000
7,385,000
11,006,000
(67,000)
6,299,000
(10,638,000)
(1,053,000)
455,000
—
7,959,000
—
150,077,000
(58,471,000)
(1,115,000)
—
—
5,132,000
Net cash provided by financing activities . . . . . . . . . . . . . . . . . . .
303,160,000
2,955,000
95,623,000
Effect of exchange rate changes on cash and cash equivalents . .
Net increase (decrease) in cash and cash equivalents . . . . . .
Cash and cash equivalents, beginning of year . . . . . . . . . . . . . . .
(510,000)
238,657,000
191,700,000
Cash and cash equivalents, end of year . . . . . . . . . . . . . . . . . . . . .
$430,357,000
Supplemental Cash Flow Disclosures:
Cash paid for interest . . . . . . . . . . . . . . . . . . . . . . . . . . . . . . . $ 24,289,000
Cash paid for taxes . . . . . . . . . . . . . . . . . . . . . . . . . . . . . . . . $ 36,384,000
(366,000)
(4,675,000)
196,375,000
(890,000)
97,382,000
98,993,000
$191,700,000
$196,375,000
$
$
5,238,000
3,664,000
$ 21,582,000
$ 27,755,000
$
—
$
Noncash Investing and Financing Activities:
Note receivable in connection with disposition of assets . . .
$
Equipment acquired through capital leases . . . . . . . . . . . . . .
$
175,000
$
—
$
—
Acquisition:
Issuance of common stock . . . . . . . . . . . . . . . . . . . . . . . . . . $
1,848,000
$
—
$
—
—
The accompanying notes are an integral part of these consolidated financial statements.
F-9
6,189,000
QIAGEN N.V. AND SUBSIDIARIES
NOTES TO CONSOLIDATED FINANCIAL STATEMENTS
DECEMBER 31, 2006
1.
Description of Business
QIAGEN N.V., a Netherlands holding company, and subsidiaries (the Company) is a leading provider of
innovative technologies and products for preanalytical sample preparation and linked molecular assay solutions.
The Company has developed a comprehensive portfolio of more than 500 proprietary, consumable products and
automated solutions for sample collection, and nucleic acid and protein handling, separation, and purification as
well as open and target specific assays. The Company also supplies diagnostic kits, tests, and assays for human
and veterinary molecular diagnostics. Products are sold to academic research markets, to leading pharmaceutical
and biotechnology companies, to applied testing customers (such as in forensics, veterinary, biodefense and
industrial applications) as well as to molecular diagnostics laboratories. In addition, the Company sells and/or
licenses technologies to others. Similar to most companies in similar lines of business, the Company’s products
are subject to rapid technological change. Because of these technological changes, the Company needs to
continuously expend resources toward research and development. Products are sold through a dedicated sales
force and a global network of distributors in more than 40 countries.
2.
Summary of Significant Accounting Policies
Principles of Consolidation
The accompanying consolidated financial statements were prepared in conformity with accounting
principles generally accepted in the United States (GAAP) and include the accounts of the Company and its
wholly owned subsidiaries other than those that are considered variable interest entities for which the Company
is not the primary beneficiary. All significant intercompany accounts and transactions have been eliminated. All
amounts are presented in U.S. dollars, unless otherwise indicated. Investments in companies where the Company
exercises significant influence over the operations, and which the Company has determined that it is not the
primary beneficiary, are accounted for using the equity method. All other investments are accounted for under
the cost method.
Use of Estimates
The preparation of financial statements in conformity with accounting principles generally accepted in the
United States requires management to make estimates and assumptions that affect the reported amounts of assets,
liabilities and disclosure of contingencies at the date of the financial statements as well as the reported amounts
of revenues and expenses during the reporting period. Actual results could differ from those estimates.
Concentrations of Risk
The Company buys materials for products from many suppliers, and is not dependent on any one supplier or
group of suppliers for the business as a whole. However, key components of certain products, including certain
instrumentation components and chemicals, are available only from a single source. If supplies from these
vendors were delayed or interrupted for any reason, the Company may not be able to obtain these materials
timely or in sufficient quantities in order to produce certain products and sales levels could be negatively
affected. Additionally, the Company’s customers include researchers at pharmaceutical and biotechnology
companies, academic institutions and government and private laboratories. Fluctuations in the research and
development budgets of these researchers and their organizations for applications in which the Company’s
products are used could have a significant effect on the demand for our products.
F-10
QIAGEN N.V. AND SUBSIDIARIES
NOTES TO CONSOLIDATED FINANCIAL STATEMENTS—(Continued)
Fair Value of Financial Instruments
The carrying value of the Company’s cash and cash equivalents, notes receivable, accounts receivable,
accounts payable and accrued liabilities approximate their fair values because of the short maturities of those
instruments. The carrying value of the Company’s variable rate debt and capital leases approximate their fair
values because of the short maturities and/or interest rates which are comparable to those available to the
Company on similar terms. The fair values of the notes payable to QIAGEN Finance and Euro Finance, further
discussed in Note 16, were estimated by using available over-the-counter market information on the convertible
bonds which were issued by QIAGEN Finance and Euro Finance, the values of which correlate to the fair value
of the loan arrangements the Company has with QIAGEN Finance and Euro Finance which includes the notes
payable, the guarantee and the warrant agreement (further discussed in Note 6).
Cash and Cash Equivalents, Marketable Securities and Investments
Cash and Cash Equivalents: Cash and cash equivalents consist of cash on deposit in banks and other cash
invested temporarily in various instruments that are short-term and highly liquid, and having an original maturity
of less than 90 days at the date of purchase.
Marketable Securities and Investments: The Company accounts for marketable securities in accordance
with Statement of Financial Accounting Standard (SFAS) No. 115, “Accounting for Certain Investments in Debt
and Equity Securities.” All such investments are classified “available for sale” and stated at fair value, interest
income is accrued when earned, and changes in market values are reflected as unrealized gains and losses,
calculated on the specific identification method, as a component of accumulated other comprehensive income.
The Company also has investments in non-marketable securities issued by privately held companies. These
investments are included in other long-term assets in the accompanying consolidated balance sheets and are
accounted for using the equity or cost method of accounting.
Marketable securities and investments are evaluated at least quarterly, or sooner if impairment indicators are
noted, to determine if declines in value are other-than-temporary. In making that determination, the Company
considers all available evidence relating to the realizable value of a security. This evidence includes, but is not
limited to, the following:
•
adverse financial conditions of a specific issuer, segment, industry, region or other variables;
•
the length of time and the extent to which the fair value has been less than cost; and
•
the financial condition and near-term prospects of the issuer.
Temporary declines in value of investments classified as available-for-sale are netted with unrealized gains
and reported as a separate component of shareholders’ equity. A decline in fair value below amortized cost that is
judged to be other-than-temporary is accounted for as a realized loss and the write down is included in the
consolidated statements of income. Realized gains and losses on the sale of investments are determined on a
specific identification basis.
Accounts Receivable
The Company’s accounts receivable are unsecured and the Company is at risk to the extent such amounts
become uncollectible. The Company continually monitors accounts receivable balances, and provides for an
allowance for doubtful accounts at the time collection becomes questionable based on payment history or age of
the receivable. Write-offs of accounts receivable totaled $333,000, $620,000 and $383,000 while provisions for
F-11
QIAGEN N.V. AND SUBSIDIARIES
NOTES TO CONSOLIDATED FINANCIAL STATEMENTS—(Continued)
doubtful accounts which were charged to expense totaled $378,000, $54,000 and $128,000 for the years ended
December 31, 2006, 2005 and 2004, respectively. For all years presented, no single customer represented more
than ten percent of accounts receivable or consolidated net sales.
Inventories
Inventories are stated at the lower of cost, determined on a first-in, first-out basis, or market and include
material, capitalized labor and overhead costs. Inventories consist of the following as of December 31, 2006 and
2005:
2006
2005
Raw materials . . . . . . . . . . . . . . . . . . . . . . . . . . . . . . . . . . . . . . . . . . . . .
Work in process . . . . . . . . . . . . . . . . . . . . . . . . . . . . . . . . . . . . . . . . . . . .
Finished goods . . . . . . . . . . . . . . . . . . . . . . . . . . . . . . . . . . . . . . . . . . . . .
$22,376,000
23,229,000
18,480,000
$18,200,000
18,064,000
17,389,000
Total inventories . . . . . . . . . . . . . . . . . . . . . . . . . . . . . . . . . . . . . . .
$64,085,000
$53,653,000
Property, Plant and Equipment
Property, plant and equipment, including equipment acquired under capital lease obligations, are stated at
cost. Depreciation is computed using straight-line and declining balance methods over the estimated useful lives
of the assets (one to 40 years). Amortization of leasehold improvements is computed on a straight-line basis over
the lesser of the remaining life of the lease or the estimated useful life. The Company has a policy of capitalizing
expenditures that materially increase assets’ useful lives and charging ordinary maintenance and repairs to
operations as incurred. When property or equipment is disposed of, the cost and related accumulated depreciation
and amortization are removed from the accounts and any gain or loss is included in other miscellaneous income
(expense).
Acquired Intangibles and Goodwill
Acquired intangibles are carried at cost less accumulated amortization and consist of licenses to technology
held by third parties and other intangibles assets acquired by the Company. Amortization is computed over the
estimated useful life of the underlying patents, which has historically ranged from one to twenty years. SFAS No.
142 “Goodwill and Other Intangible Assets” (SFAS No. 142) requires purchased intangible assets other than
goodwill to be amortized over their estimated useful lives unless these lives are determined to be indefinite. In
accordance with SFAS No. 142, intangibles are assessed for recoverability considering the contract life and the
period of time over which the intangible will contribute to future cash flow. The unamortized cost of intangible
assets is evaluated periodically and adjusted, if necessary, if events and circumstances indicate that a permanent
decline in value below the carrying amount has occurred.
Goodwill represents the difference between the purchase price and the estimated fair value of the net assets
acquired arising from business combinations. In accordance with SFAS No. 142, goodwill is subject to
impairment tests annually, or earlier if indicators of potential impairment exist, using a fair-value-based
approach. For the years ended December 31, 2006, 2005 and 2004, no goodwill impairment charges have been
required.
Long-Lived Assets
The Company reviews its long-lived assets for impairment whenever events or changes in circumstances
indicate that the carrying amount of an asset or a group of assets may not be recoverable. The Company
F-12
QIAGEN N.V. AND SUBSIDIARIES
NOTES TO CONSOLIDATED FINANCIAL STATEMENTS—(Continued)
considers a history of operating losses or a change in expected sales levels to be indicators of potential
impairment. Assets are grouped and evaluated for impairment at the lowest level for which there are identified
cash flows that are largely independent of the cash flows of other groups of assets. The Company deems an asset
to be impaired if a forecast of undiscounted projected future operating cash flows directly related to the asset,
including disposal value, if any, is less than its carrying amount. If an asset is determined to be impaired, the loss
is measured as the amount by which the carrying amount of the asset exceeds fair value. The Company generally
measures fair value by discounting projected future cash flows. Considerable judgment is necessary to estimate
discounted future cash flows. Accordingly, actual results could differ from such estimates.
Revenue Recognition
The Company’s revenues are reported net of sales and value added taxes, discounts and sales allowances,
and are derived primarily from the sale of consumable and instrumentation products, and to a much lesser extent,
from the sale of services and technology. The Company recognizes revenue in accordance with the Securities and
Exchange Commission’s Staff Accounting Bulletin No. 104, “Revenue Recognition in Financial Statements”
(SAB 104). SAB 104 requires that four basic criteria must be met before revenue can be recognized:
(1) persuasive evidence of an arrangement exists; (2) delivery has occurred or services have been rendered;
(3) the fee is fixed and determinable; and (4) collectibility is reasonably assured.
Consumable Products: Approximately 90% of total revenues represent sales of consumable products.
Revenue from consumable product sales is generally recognized upon transfer of title consistent with the
shipping terms, and when all of the criteria of SAB 104 are achieved. Per the Company’s usual shipping terms,
title and risk of loss pass to the customer upon delivery of product to the shipping location. The Company
maintains a small amount of consignment inventory at certain customer locations. Revenues for the consumable
products which are consigned in this manner are recognized upon consumption. The Company generally allows
returns of consumable products if the product is returned in a timely manner and in good condition. Allowances
for returns are provided for based upon the historical pattern of returns and Management’s evaluation of specific
factors that impact the risk of returns.
Instrumentation: Revenue from instrumentation equipment is generally recognized when title passes to the
customer, upon either shipment, in the case of sales to distributors, or written customer acceptance in the case of
sales to end users, after satisfying any installation and training requirements. For instrumentation equipment sales
that contain other obligations, such as providing consumables, advanced training, extended warranty services or
preventative maintenance contracts, revenue is allocated based on the relative fair values of the individual
components. The price charged when the element is sold separately generally determines its fair value.
Warranty and Product Maintenance: Revenues for extended warranty services or product maintenance
contracts are deferred and recognized on a straight-line basis over the contract period. The Company generally
recognizes service revenues on a completed contract basis. For each of the years ended December 31, 2006, 2005
and 2004, revenues from the sale of all services constitute less than 10 percent of total net sales.
License Fees: License fees from research collaborations include payments for technology transfer and
access rights. Non-refundable, up-front payments received in connection with collaborative research and
development agreements are generally deferred and recognized on a straight-line basis over the contract period
during which there is any continuing obligation.
Milestones: Payments for milestones are generally based on the achievement of substantive and at-risk
performance criteria are recognized in full at such time as the specified milestone has been achieved according to
the terms of the agreement.
F-13
QIAGEN N.V. AND SUBSIDIARIES
NOTES TO CONSOLIDATED FINANCIAL STATEMENTS—(Continued)
Royalty Income: Royalties from licensees are based on reported sales of licensed products and revenues
are calculated based on contract terms when reported sales are reliably measurable and collectibility is
reasonably assured.
Research and Development
Research and product development costs are expensed as incurred. Research and development expenses
consist primarily of salaries and related expenses, facility costs and amounts paid to contract research
organizations, and laboratories for the provision of services and materials. Acquired in-process research and
development is expensed if technological feasibility has not been demonstrated and there is no alternative use for
the in-process technology.
Shipping and Handling Income and Costs
Shipping and handling costs charged to customers are recorded as revenue in the period that the related
product sale revenue is recorded. Associated costs of shipping and handling are included in sales and marketing
expenses. For the years ended December 31, 2006, 2005 and 2004, shipping and handling costs totaled $8.8
million, $8.5 million and $7.8 million, respectively.
Advertising Costs
The costs of advertising are expensed as incurred according to Statement of Position 93-7, “Reporting on
Advertising Costs.” Promotional materials, such as brochures and catalogues, are accounted for as prepaid
supplies and expensed when they are no longer owned or expected to be used in the selling effort. Advertising
costs expensed for the years ended December 31, 2006, 2005 and 2004 were $2.6 million, $1.9 million and $1.8
million, respectively.
Warranty
The Company warrants its products against defects in materials and workmanship generally for a period of
one year. A provision for estimated future warranty costs is recorded at the time product revenue is recognized.
The Company’s product warranty obligations are included in accrued and other liabilities in the accompanying
consolidated balance sheets. The changes in the carrying amount of warranty obligations are as follows:
BALANCE AT DECEMBER 31, 2004 . . . . . . . . . . . . . . . . . . . . . . . . . . . . . . . . . . . . . . .
Provision charged to income . . . . . . . . . . . . . . . . . . . . . . . . . . . . . . . . . . . . . . . . . . . . . . . .
Usage . . . . . . . . . . . . . . . . . . . . . . . . . . . . . . . . . . . . . . . . . . . . . . . . . . . . . . . . . . . . . . . . . .
Adjustments to previously provided warranties, net . . . . . . . . . . . . . . . . . . . . . . . . . . . . . .
Currency translation . . . . . . . . . . . . . . . . . . . . . . . . . . . . . . . . . . . . . . . . . . . . . . . . . . . . . .
$1,229,000
514,000
(280,000)
(51,000)
(80,000)
BALANCE AT DECEMBER 31, 2005 . . . . . . . . . . . . . . . . . . . . . . . . . . . . . . . . . . . . . . .
Provision charged to income . . . . . . . . . . . . . . . . . . . . . . . . . . . . . . . . . . . . . . . . . . . . . . . .
Usage . . . . . . . . . . . . . . . . . . . . . . . . . . . . . . . . . . . . . . . . . . . . . . . . . . . . . . . . . . . . . . . . . .
Adjustments to previously provided warranties, net . . . . . . . . . . . . . . . . . . . . . . . . . . . . . .
Currency translation . . . . . . . . . . . . . . . . . . . . . . . . . . . . . . . . . . . . . . . . . . . . . . . . . . . . . .
1,332,000
1,071,000
(823,000)
(223,000)
56,000
BALANCE AT DECEMBER 31, 2006 . . . . . . . . . . . . . . . . . . . . . . . . . . . . . . . . . . . . . . .
F-14
$1,413,000
QIAGEN N.V. AND SUBSIDIARIES
NOTES TO CONSOLIDATED FINANCIAL STATEMENTS—(Continued)
Income Taxes
The Company accounts for income taxes in accordance with SFAS No. 109 “Accounting for Income
Taxes.” The deferred tax assets and/or liabilities are determined by multiplying the differences between the
financial reporting and tax reporting bases for assets and liabilities by the enacted tax rates expected to be in
effect when such differences are recovered or settled. The effect on deferred taxes of a change in tax rates is
recognized in income in the period that includes the enactment date.
For the years ended December 31, 2006, 2005 and 2004, the Company has recorded tax contingencies based
on when the exposure item becomes probable and reasonably estimable in accordance with SFAS No. 5,
“Accounting for Contingencies.” The Company establishes reserves for tax contingencies that reflect its best
estimate of the deductions and credits that it may be unable to sustain, or that it could be willing to concede as
part of a broader tax settlement. The tax contingency liability is based on the Company’s estimate of whether
additional taxes will be due in the future. Any additional taxes will be determined only upon the completion of
current and future tax audits. The timing of such payments cannot be determined with any certainty, but the
Company expects that they will not be made within one year.
Foreign Currency Translation
The Company’s reporting currency is the U.S. dollar. The subsidiaries’ functional currencies are the local
currency of the respective country. Local subsidiary balance sheets which are prepared in their functional
currencies are translated to the reporting currency at exchange rates in effect at the end of the accounting period
except for shareholders’ equity accounts, which are translated at rates in effect when these balances were
originally recorded. Revenue and expense accounts are translated at a weighted average of exchange rates during
the period. The cumulative effect of translation is included in accumulated other comprehensive income in the
accompanying consolidated balance sheets.
Derivative Instruments
The Company enters into derivative financial instrument contracts only for hedging purposes and accounts
for them in accordance with SFAS No. 133 “Accounting for Derivative Instruments and Hedging Activities,” and
its amendments. The purpose of the derivative instruments is to minimize the variability of cash flows associated
with the anticipated transactions being hedged. As changes in foreign currency rates impact the value of
anticipated transactions, the fair value of the forward contracts also changes, offsetting foreign currency rate
fluctuations. Derivative instruments are recorded on the balance sheet at fair value. Changes in fair value of
derivatives are recorded in current earnings or other comprehensive income, depending on whether a derivative is
designated as part of a hedge transaction and, if so, depending on the type of hedge transaction.
Stock-Based Compensation
Prior to January 1, 2006, the Company accounted for its equity-based compensation plans under the
recognition and measurement provisions of Accounting Principles Board Opinion No. 25, “Accounting for Stock
Issued to Employees” (Opinion 25), and related interpretations, as permitted by FASB Statement No. 123,
“Accounting for Stock-Based Compensation” (SFAS No. 123). Effective January 1, 2006, the Company adopted
the provisions of FASB Statement No. 123 (revised 2004), “Share-Based Payment,” (SFAS No. 123(R)) and
SEC Staff Accounting Bulletin No. 107, “Share-Based Payment,” (SAB 107), using the modified prospective
transition method. Under the modified prospective transition method, compensation cost recognized in 2006
includes compensation cost for all share-based payments granted prior to but were not vested as of January 1,
2006, based on the grant date fair value estimated. Compensation cost for all share-based payments granted
F-15
QIAGEN N.V. AND SUBSIDIARIES
NOTES TO CONSOLIDATED FINANCIAL STATEMENTS—(Continued)
subsequent to January 1, 2006 were recorded based on the grant date fair value estimated in accordance with the
provisions of SFAS No. 123(R). Results for prior periods have not been restated.
The Company utilizes the Black-Scholes-Merton valuation model for estimating the fair value of its stock
options granted. Option valuation models, including Black-Scholes-Merton, require the input of highly subjective
assumptions, and changes in the assumptions used can materially affect the grant date fair value of an award.
These assumptions include the risk-free rate of interest, expected dividend yield, expected volatility, and the
expected life of the award.
Risk-Free Interest Rate—This is the average U.S. Treasury rate (having a term that most closely resembles
the expected life of the option) at the date the option was granted.
Dividend Yield—The Company has never declared or paid dividends on its common stock and does not
anticipate declaring or paying any dividends in the foreseeable future.
Expected Volatility—Volatility is a measure of the amount by which a financial variable such as a share
price has fluctuated (historical volatility) or is expected to fluctuate (expected volatility) during a period.
The Company uses a combination of the historical volatility of its stock price and the implied volatility of
market-traded options of the Company’s stock to estimate the expected volatility assumption input to the
Black-Scholes model in accordance with SFAS No. 123(R) and SAB 107. In prior periods, the Company
relied solely on the historical volatility of its stock price for its volatility assumption input to the BlackScholes model. The Company’s decision to use a combination of historical and implied volatility is based
upon the availability of actively traded options of its stock and its assessment that such a combination is
more representative of future expected stock price trends. Since 2001, the Company’s annual volatility has
ranged from 75 percent in 2001 to 26 percent in 2005 with an average of 57 percent during the five year
period.
Expected Life of the Option—This is the period of time that the options granted are expected to remain
outstanding. The Company used SAB 107’s simplified method for estimating the expected term of sharebased awards granted in 2006.
Forfeiture Rate—This is the estimated percentage of options granted that are expected to be forfeited or
cancelled on an annual basis before becoming fully vested. The Company estimated the forfeiture rate based
on historical forfeiture experience. For the year ended December 31, 2006, the estimated forfeiture rate was
nine percent.
Reclassifications
Certain reclassifications of prior year amounts in Note 14 regarding Income Taxes and Note 21 regarding
Segments have been made to conform with the current year presentation.
Authoritative Pronouncements
In September of 2006, the Financial Accounting Standards Board (FASB) issued SFAS No. 158,
“Employers’ Accounting for Defined Benefit Pension and Other Post-retirement Plans,” an amendment of SFAS
No. 87, 88, 106, and 132(R). SFAS No. 158 makes numerous changes related to the accounting for pension and
postretirement benefit plans. The most significant change is that the funded status of all post-retirement plans
will be recorded on the balance sheet. The difference between a plan’s funded status and its current balance sheet
position will be recognized, net of taxes, as a component of shareholders’ equity. SFAS No. 158 is effective for
fiscal years ending after December 15, 2006. The adoption of SFAS No. 158 resulted in an increase to the
pension liability of $333,000, deferred taxes of $129,000, and a net increase in the loss of accumulated other
comprehensive income of $204,000 in the consolidated balance sheet for the year ending December 31, 2006.
F-16
QIAGEN N.V. AND SUBSIDIARIES
NOTES TO CONSOLIDATED FINANCIAL STATEMENTS—(Continued)
In September 2006, the FASB issued SFAS No. 157, “Fair Value Measurements.” SFAS No. 157 provides
guidance for using fair value to measure assets and liabilities and only applies when other standards require or
permit the fair value measurement of assets and liabilities. It does not expand the use of fair value
measurement. SFAS No. 157 is effective for fiscal years beginning after November 15, 2007. The Company will
adopt this standard as required on January 1, 2008 and management is currently assessing the effect SFAS
No. 157 will have on the Company’s results of operations, financial condition and liquidity.
In September 2006, the SEC staff issued Staff Accounting Bulletin No. 108, “Considering the Effects of
Prior Year Misstatements when Quantifying Misstatements in Current Year Financial Statements” (SAB 108).
The intent of SAB 108 is to reduce diversity in practice on the method companies use to quantify financial
statements misstatements, including the effect of prior year uncorrected errors. SAB 108 establishes an approach
that requires quantification of financial statement errors using both an income statement and cumulative balance
sheet approach. SAB 108 is effective for fiscal years ending after November 15, 2006. The adoption of SAB 108
did not have a significant impact on the Company’s results of operations, financial condition and liquidity as of
and for the year ended December 31, 2006.
In June 2006, the FASB issued Interpretation No. 48, “Accounting for Uncertainty in Income Taxes—An
Interpretation of FASB Statement No. 109” (FIN 48), to create a single model to address accounting for
uncertainty in tax positions. FIN 48 clarifies the accounting for income taxes by prescribing a minimum
recognition threshold a tax position is required to meet before being recognized in financial statements. FIN 48
also provides guidance on derecognition, measurement, classification, interest and penalties, accounting in
interim period, disclosure and transition. FIN 48 is effective for fiscal years beginning after December 15, 2006.
The Company adopted FIN 48 as of January 1, 2007. The cumulative effect of adopting FIN 48 will be recorded
in retained earnings. The Company estimates that the cumulative effect adjustment to retained earnings will be in
the range of approximately $2 million to $7 million to increase reserves for uncertain tax positions. The amount
is subject to revision as management completes its analysis. In addition, the Company expects that the adoption
of FIN 48 may result in greater volatility in the effective tax rate.
In June 2006, the FASB ratified the Emerging Issues Task Force (EITF) consensus on EITF Issue No. 06-3,
“How Taxes Collected from Customers and Remitted to Governmental Authorities Should Be Presented in the
Income Statement (That Is, Gross versus Net Presentation).” EITF Issue No. 06-3 states that the classification of
taxes as gross or net is an accounting policy decision that is dependent on type of tax and that similar taxes are to
be presented in a similar manner. EITF Issue No. 06-3 is effective for reporting periods beginning after
December 15, 2006. The Company adopted this consensus as required on January 1, 2007 without a material
impact on the Company’s results of operations, financial condition or liquidity.
In February 2006, the FASB issued Statement of Financial Accounting Standards No. 155, “Accounting for
Certain Hybrid Financial Instruments,” (SFAS 155) which amends Statement of Financial Accounting Standards
No. 133, “Accounting for Derivative Instruments and Hedging Activities,” (SFAS 133) and Statement of
Financial Accounting Standards No. 140, “Accounting for Transfers and Servicing of Financial Assets and
Extinguishments of Liabilities,” (SFAS 140). SFAS 155 simplifies the accounting for certain derivatives
embedded in other financial instruments by allowing them to be accounted for as a whole (eliminating the need
to bifurcate the derivative from its host) if the holder elects to account for the whole instrument on a fair value
basis. SFAS 155 also clarifies and amends certain other provisions of SFAS 133 and SFAS 140. SFAS 155 is
effective for all financial instruments acquired, issued or subject to a remeasurement event occurring in fiscal
year beginning after September 15, 2006. The Company adopted this consensus as required on January 1, 2007
without a material impact on the Company’s results of operations, financial condition or liquidity.
F-17
QIAGEN N.V. AND SUBSIDIARIES
NOTES TO CONSOLIDATED FINANCIAL STATEMENTS—(Continued)
In May 2005, the FASB issued SFAS No. 154, “Accounting Changes and Error Corrections.” This new
standard replaces APB Opinion No. 20, “Accounting Changes,” and FASB SFAS No. 3, “Reporting Accounting
Changes in Interim Financial Statements.” Among other changes, SFAS No. 154 requires that a voluntary change
in accounting principle be applied retrospectively with all prior period financial statements presented on the new
accounting principle, unless it is impracticable to do so. SFAS No. 154 also provides that (1) a change in method
of depreciating or amortizing a long-lived nonfinancial asset be accounted for as a change in estimate
(prospectively) that was effected by a change in accounting principle, and (2) correction of errors in previously
issued financial statements should be termed a “restatement.” The new standard is effective for accounting
changes and correction of errors made in fiscal years beginning after December 15, 2005. The Company adopted
this statement on January 1, 2006 without a material effect.
3.
Net Income per Common Share
The following schedule summarizes the information used to compute earnings per common share:
2006
Weighted average number of common shares used to
compute basic net income per common share . . . . . .
Dilutive effect of stock options . . . . . . . . . . . . . . . . . . .
Dilutive effect of outstanding warrant shares used to
compute diluted net income per common share . . . .
4.
Years ended December 31,
2005
2004
149,504,000
2,635,000
147,837,000
2,269,000
1,378,000
66,000
153,517,000
150,172,000
148,519,000
Outstanding stock options having no dilutive effect,
not included in above calculation . . . . . . . . . . . . . . .
3,309,000
5,235,000
5,430,000
Outstanding warrants having no dilutive effect, not
included in above calculation . . . . . . . . . . . . . . . . . .
22,071,000
11,796,000
11,862,000
146,658,000
1,861,000
—
Acquisitions and Dispositions
During 2006, the Company completed seven acquisitions which individually were not significant to the
overall consolidated financial statements. The aggregate purchase price of these 2006 acquisitions, net of cash
acquired was $88.3 million, including the issuance of 125,000 shares of QIAGEN common stock valued at $1.8
million.
Under the purchase agreements, the Company could be required to make additional contingent cash
payments totaling $47.5 million through 2010, of which $2.9 million was earned and accrued at December 31,
2006, through an increase to goodwill.
The Company’s acquisitions have historically been made at prices above the fair value of the acquired
assets, resulting in goodwill, due to expectations of synergies of combining the businesses. These synergies
include use of the Company’s existing infrastructure such as sales force, distribution channels and customer
relations to expand sales of the acquired businesses’ products; use of the infrastructure of the acquired businesses
to cost effectively expand sales of Company products; and elimination of duplicative facilities, functions and
staffing.
F-18
QIAGEN N.V. AND SUBSIDIARIES
NOTES TO CONSOLIDATED FINANCIAL STATEMENTS—(Continued)
These acquisitions have been accounted for using the purchase method of accounting, and the acquired
companies’ results have been included in the accompanying financial statements from their respective dates of
acquisition. Allocation of the purchase price for acquisitions was based on estimates of the fair value of the net
assets acquired and, for acquisitions completed in 2006, is subject to adjustment upon finalization of the purchase
price allocation. The Company has gathered no information that indicates the final purchase price allocations will
differ materially from the preliminary estimates other than for the final determination of deferred tax assets
acquired with the acquisitions of Gentra Systems, Inc and Genaco Biomedical Products, Inc. and the resolution of
the final amount for the early termination of a lease obligation acquired with the acquisition of Gentra.
2006 Acquisitions
•
In the fourth quarter of 2006, the Company completed the acquisition of Genaco Biomedical Products,
Inc., located in Huntsville, Alabama. Genaco is an early-stage company applying a proprietary
PCR-based multiplexing technology, Tem-PCR, to develop Templex™ molecular diagnostic tests.
Multiplexing is a rapidly emerging segment in molecular diagnostics and is also highly synergistic with
the Company’s portfolio of qPCR-based molecular diagnostic assays which in the segment of infectious
disease diagnostics is considered to be the broadest in the world. The Company also acquired former
distributors PhileKorea Technology Inc., located in Daejeon, Korea and ATC Health Products Ltd.,
located in Ankara, Turkey.
•
In the second quarter of 2006, the Company completed the acquisitions of Gentra Systems, Inc., located
in Minneapolis, Minnesota, Singapore-based Research Biolabs Pte. Ltd. and Research Biolabs Sdn Bhd,
located in Malaysia. Gentra is a leading developer, manufacturer and supplier of non-solid phase nucleic
acid purification products, providing both consumables and automated platforms. The acquisition
expands the Company’s position as a leading provider of preanalytical and molecular diagnostics
solutions to research and diagnostic customers. The acquisition of Research Biolabs, previously our
distributor, expands the Company’s direct presence in one of the most dynamic regions of the
Company’s global business. Research Biolabs currently has sales and marketing teams in Singapore,
Malaysia and Indonesia, and will also support market development in Thailand and Vietnam.
•
During the first quarter of 2006, the Company completed two acquisitions. PG Biotech Co. Ltd. (PG
Biotech) is a leading developer, manufacturer and supplier of polymerase chain reaction (PCR)-based
molecular diagnostic kits in China. The acquisition will support the Company’s position as a leading
provider of molecular diagnostics solutions to OEM partners and customers in the rapidly growing
Asian markets. The Company also acquired certain assets and operations from Diatech s.r.l., Jesi, Italy,
which distributes products produced by artus, which we acquired in 2005, in Italy.
F-19
QIAGEN N.V. AND SUBSIDIARIES
NOTES TO CONSOLIDATED FINANCIAL STATEMENTS—(Continued)
The following table summarizes the estimated fair values of the assets acquired and liabilities assumed at
the date of acquisition. Using the results of independent and internally prepared appraisals, the purchase prices
for the 2006 acquisitions have been allocated as follows:
2006
Acquisitions
Purchase Price:
Cash, including direct costs . . . . . . . . . . . . . . . . . . . . . . . . . . . . . . . . . . .
Stock issued . . . . . . . . . . . . . . . . . . . . . . . . . . . . . . . . . . . . . . . . . . . . . . .
Cash acquired . . . . . . . . . . . . . . . . . . . . . . . . . . . . . . . . . . . . . . . . . . . . . .
$ 90,454,000
1,847,000
(4,017,000)
$ 88,284,000
Allocation:
Working Capital . . . . . . . . . . . . . . . . . . . . . . . . . . . . . . . . . . . . . . . . . . . .
Fixed and other long-term assets . . . . . . . . . . . . . . . . . . . . . . . . . . . . . . .
Acquired intangible assets . . . . . . . . . . . . . . . . . . . . . . . . . . . . . . . . . . . .
Goodwill . . . . . . . . . . . . . . . . . . . . . . . . . . . . . . . . . . . . . . . . . . . . . . . . .
Purchased in-process research and development expense . . . . . . . . . . . .
Deferred tax liability on fair value of identifiable intangible assets
acquired . . . . . . . . . . . . . . . . . . . . . . . . . . . . . . . . . . . . . . . . . . . . . . . .
Liabilities assumed . . . . . . . . . . . . . . . . . . . . . . . . . . . . . . . . . . . . . . . . .
$ 6,256,000
5,580,000
41,012,000
48,324,000
2,200,000
(11,855,000)
(3,233,000)
$ 88,284,000
Acquired intangible assets for 2006 acquisitions are as follows:
2006
Acquisitions
Customer relationships . . . . . . . . . . . . . . . . . . . . . . . . . . . . . . . . . . . . . . . . . . .
Product technology . . . . . . . . . . . . . . . . . . . . . . . . . . . . . . . . . . . . . . . . . . . . . .
Trade name/license . . . . . . . . . . . . . . . . . . . . . . . . . . . . . . . . . . . . . . . . . . . . . .
Non-compete . . . . . . . . . . . . . . . . . . . . . . . . . . . . . . . . . . . . . . . . . . . . . . . . . . .
$10,887,000
26,600,000
2,000,000
1,525,000
$41,012,000
Of the 2006 transaction costs, approximately $300,000 was accrued at December 31, 2006. Of the goodwill
acquired in 2006, approximately $818,000 is expected to be tax deductible. The weighted average amortization
periods for intangible assets acquired in 2006 are: 12 years for customer relationships; 11 years for product
technology; nine years for trade name and license; and four years for non-compete agreements.
2005 Acquisitions
In May 2005, the Company acquired all of the outstanding capital stock of artus Gesellschaft für
molekularbiologische Diagnostik und Entwicklung mbH (artus), an established leader in PCR-based molecular
diagnostic tests for pathogenenic, genotyping and pharmacogenomic testing. The Company believes that this
acquisition is an excellent fit in its strategy to increase the Company’s value as a partner to the molecular
diagnostics industry. In addition to its leading position in preanalytical sample preparation in molecular
diagnostics, the Company is now able to offer optimized and synchronized combinations of preanalytical sample
preparation and diagnostic assay solutions to its partners in molecular diagnostics. By providing the opportunity
for partners in molecular diagnostics to expand their portfolio by adding artus’ validated assays, the Company
intends to further contribute to accelerating the growth of molecular diagnostics by broadening the menu of tests
available on today’s diagnostic platforms. The purchase price, including direct acquisition costs and adjusted as
F-20
QIAGEN N.V. AND SUBSIDIARIES
NOTES TO CONSOLIDATED FINANCIAL STATEMENTS—(Continued)
per the terms of the share purchase agreement, paid by the Company was approximately EUR 26.4 million
(approximately $32.6 million at May 31, 2005) in cash. A total of EUR 9.3 million (approximately $11.5 million
at May 31, 2005), of which EUR 2.7 million was considered as purchase price, was paid into escrow and will be
released subject to certain milestones being met. During 2006, EUR 7.65 million of the escrow amount was
released with EUR 6.3 million (approximately $7.6 million) recorded as additional purchase price resulting in an
increase to goodwill.
During 2005, the Company completed five other acquisitions which were not individually significant to the
overall consolidated financial statements. The aggregate purchase price of the 2005 acquisitions, net of cash
acquired was $42.8 million. In 2006, pursuant to the acquisition agreements, an additional $1.6 million was paid
and recorded as additional purchase price resulting in an increase to goodwill.
•
At the end of the fourth quarter of 2005, we completed the acquisition of Eppendorf AG’s reagent
business which includes the Eppendorf “5-Prime” nucleic acid sample preparation and PCR reagent
product lines and related intellectual property. The acquisition adds to our core strategic focus,
represents an attractive addition to our portfolio of preanalytical and nucleic acid amplification
consumables and adds a very promising pipeline of proprietary technologies for nucleic acid handling,
separation, purification and amplification.
•
During the third quarter of 2005, we completed three acquisitions. We acquired Tianwei Times, located
in Beijing, China, which is a leading developer, manufacturer and supplier of nucleic acid sample
preparation consumables in China. We acquired substantially all assets of Tianwei Times through our
new wholly owned subsidiary Tiangen Biotech Beijing Co. Ltd. (Tiangen). The Tiangen acquisition
expands QIAGEN’s position as the leading supplier for products and technologies for preanalytical
sample preparation in the rapidly growing market in China. In August we acquired the business of
LumiCyte, Inc., which has developed and recently initiated marketing of the first products based on its
proprietary STS- (Surface Tension Segmented) Biochip sample preparation solution for MALDI
(Matrix-Assisted Laser Desorption/Ionization)-Mass Spectrometry (MS), and SuNyx GmbH which has
developed and recently initiated marketing of its proprietary platforms for sample preparation of peptide
and protein samples for analysis on Liquid Chromatography (LC)-MALDI Mass Spectrometry.
•
During the second quarter of 2005, we acquired Nextal Biotechnology, Inc. (Nextal), subsequently
renamed QIAGEN Canada, Inc., which is located in Canada and is a fast-growing provider of
proprietary sample preparation tools which make protein crystallization more accessible.
F-21
QIAGEN N.V. AND SUBSIDIARIES
NOTES TO CONSOLIDATED FINANCIAL STATEMENTS—(Continued)
The components of the purchase price allocation for 2005 acquisitions, as revised in 2006 for finalization of
the purchase price allocation, are as follows:
Purchase Price:
Cash, including direct costs . . . . . . . . . . . . . . . . . . . . . . . . . . . . . .
Cash acquired . . . . . . . . . . . . . . . . . . . . . . . . . . . . . . . . . . . . . . . .
Allocation:
Working Capital . . . . . . . . . . . . . . . . . . . . . . . . . . . . . . . . . . . . . .
Fixed and other long-term assets . . . . . . . . . . . . . . . . . . . . . . . . . .
Acquired intangible assets . . . . . . . . . . . . . . . . . . . . . . . . . . . . . . .
Goodwill . . . . . . . . . . . . . . . . . . . . . . . . . . . . . . . . . . . . . . . . . . . .
Purchased in-process research and development expense . . . . . .
Deferred tax liability on fair value of identifiable intangible
assets acquired . . . . . . . . . . . . . . . . . . . . . . . . . . . . . . . . . . . . . .
Liabilities assumed . . . . . . . . . . . . . . . . . . . . . . . . . . . . . . . . . . . .
2005
Artus
Acquisition
2005
Other
Acquisitions
$ 32,625,000
(1,334,000)
$43,038,000
(514,000)
$ 31,291,000
$42,524,000
$
$ (987,000)
4,239,000
21,197,000
18,989,000
2,525,000
4,097,000
322,000
24,500,000
23,801,000
700,000
(5,800,000)
(16,329,000)
$31,291,0000
(3,403,000)
(36,000)
$42,524,000
Acquired intangible assets for 2005 acquisitions are as follows:
Customer relationships . . . . . . . . . . . . . . . . . . . . . . . . . . . . . . . . . . . . . .
Product technology . . . . . . . . . . . . . . . . . . . . . . . . . . . . . . . . . . . . . . . . .
Trade name/license . . . . . . . . . . . . . . . . . . . . . . . . . . . . . . . . . . . . . . . . .
2005
Artus
Acquisition
2005
Other
Acquisitions
$ 3,400,000
11,100,000
10,000,000
$ 4,899,000
16,173,000
125,000
$24,500,000
$21,197,000
Of the goodwill acquired in 2005, approximately $12.6 million is expected to be tax deductible. The
weighted average amortization periods for intangible assets acquired in 2005 are: 14 years for customer
relationships; 10 years for product technology; and 10 years for trade name and license.
Pro forma results
The following unaudited pro forma information assumes that the above acquisitions occurred at the
beginning of the periods presented. For the years ended December 31, 2006 and 2005, pro forma net sales would
have been $478.8 million and $447.5 million, pro forma net income would have been $82.2 million and
$62.6 million, pro forma basic net income per common share would have been $0.55 and $0.42, and pro forma
diluted net income per common share would have been $0.54 and $0.42, respectively. The 2006 pro forma data
excludes a $2.0 million charge to cost of sales related to inventory, $6.1 million of acquisition and related costs
and a $2.2 million charge for purchased in-process research and development. The 2005 pro forma data excludes
the acquisition related costs including a $439,000 charge to cost of sales related to inventory, $3.2 million of
acquisition and related costs and a $3.2 million charge for purchased in-process research and development. These
unaudited pro forma results are intended for informational purposes only and are not necessarily indicative of the
results of operations that would have occurred had the acquisitions been in effect at the beginning of the periods
presented, or of future results of the combined operations.
F-22
QIAGEN N.V. AND SUBSIDIARIES
NOTES TO CONSOLIDATED FINANCIAL STATEMENTS—(Continued)
Restructuring of Acquired Businesses
The Company has undertaken restructuring activities at acquired businesses. These activities, which were
accounted for in accordance with EITF Issue No. 95-3, “Recognition of Liabilities in Connection with a Purchase
Business Combination,” (EITF Issue No. 95-3) have primarily included reductions in staffing levels and the
abandonment of excess facilities. In connection with these restructuring activities, as part of the cost of
acquisitions, the Company established reserves as detailed below, primarily for severance and excess facilities. In
accordance with EITF Issue No. 95-3, the Company finalizes its restructuring plans no later than one year from
the respective dates of the acquisitions. Upon finalization of restructuring plans or settlement of obligations for
less than the expected amount, any excess reserves are reversed with a corresponding decrease in goodwill.
Accrued acquisition expenses are included in accrued and other liabilities in the accompanying balance sheet.
The changes in accrued acquisition expenses for the 2005 and 2006 acquisitions are as follows:
Accrual
Balance
12/31/2005
Severance and employee related . . . . . . . .
Lease and related costs . . . . . . . . . . . . . . . .
Other . . . . . . . . . . . . . . . . . . . . . . . . . . . . . .
Unused
Amounts
Reversed to
Goodwill
Additional
Amounts
Accrued
Amounts
Paid in Cash
or Settled
Accrual
Balance
12/31/2006
$1,011,000
2,480,000
—
$ (385,000) $1,634,000
(1,068,000)
562,000
—
543,000
$(1,487,000) $ 773,000
(7,000) 1,967,000
(5,000)
538,000
$3,491,000
$(1,453,000) $2,739,000
$(1,499,000) $3,278,000
Dispositions
In June 2004, the Company sold a significant portion of its synthetic DNA business unit to a group of
investors, including a former member of management for $24.3 million, of which $17.8 million was paid in cash
and the remainder is to be paid over a five year period ending in June 2009. The synthetic DNA business unit had
operations located in the United States, Germany and Japan. The Company incurred a net loss related to the sale
of such business of approximately $9.8 million, which was included in other miscellaneous expense in 2004. The
net loss included net costs of $4.1 million on the transaction, severance costs of $2.7 million and lease
termination and facility exit costs of $3.0 million.
5.
Relocation and Restructure
In line with the Company’s focus of streamlining and strengthening its operations, during 2004 the
Company completed the realignment of certain operating functions, primarily in the United States, including the
relocation of some of these functions to the Company’s North American Headquarters in Germantown,
Maryland, which opened in 2002. As discussed more fully in Note 4, in 2004 and 2005 restructuring costs were
incurred in connection with the sale of the majority of the Company’s synthetic DNA business unit and
subsequent closure of the formerly used facility. Relocation and restructuring costs recorded in 2006 are
primarily related to the restructuring of acquired businesses located in Norway and North America for which a
restructuring was not contemplated at the time of acquisition. The Company expects that restructuring charges
related to the 2006 closures and relocations will total approximately $2.0 million, of which $1.5 million has been
expensed as of December 31, 2006.
F-23
QIAGEN N.V. AND SUBSIDIARIES
NOTES TO CONSOLIDATED FINANCIAL STATEMENTS—(Continued)
Changes in the relocation and restructure accrual for the years ended December 31, 2006 and 2005 are as
follows:
Relocation,
severance
and employee
related
ACCRUAL BALANCE AT DECEMBER 31,
2004 . . . . . . . . . . . . . . . . . . . . . . . . . . . . . . .
Unused amounts reversed . . . . . . . . . . . . . . . .
Amounts paid in cash or settled . . . . . . . . . . . .
$ 983,000
(88,000)
(840,000)
Lease and
facility
Inventory
55,000
64,000
—
Unused amounts reversed . . . . . . . . . . . . . . . .
Amounts accrued . . . . . . . . . . . . . . . . . . . . . . .
Amounts paid in cash or settled . . . . . . . . . . . .
(55,000)
665,000
(386,000)
(64,000)
172,000
(172,000)
—
—
—
6.
$ 279,000
Total
$ 1,785,000 $ 76,000 $ 70,000 $ 2,914,000
(100,000)
—
—
(188,000)
(1,621,000) (76,000) (70,000) (2,607,000)
ACCRUAL BALANCE AT DECEMBER 31,
2005 . . . . . . . . . . . . . . . . . . . . . . . . . . . . . . .
ACCRUAL BALANCE AT DECEMBER 31,
2006 . . . . . . . . . . . . . . . . . . . . . . . . . . . . . . .
Other
$
—
$
—
—
119,000
—
120,000
(73,000)
$ 47,000
(119,000)
957,000
(631,000)
$
326,000
Variable Interest Entities
In December 2003, the Financial Accounting Standards Board (FASB) issued a revised Interpretation
No. 46 (FIN 46R), “Consolidation of Variable Interest Entities,” replacing the original interpretation issued in
January 2003. This interpretation requires a company to consolidate a variable interest entity if it is designated as
the primary beneficiary of that entity even if the company does not have a majority voting interest. A variable
interest entity is generally defined as an entity with insufficient equity to finance its activities or where the
owners of the entity lack the risk and rewards of ownership.
The Company has a 50% interest in a joint venture company, PreAnalytiX GmbH, for which neither joint
venture partner is the primary beneficiary within the provisions of FIN 46R. Thus, the investment is accounted
for under the equity method. QIAGEN AG has been a 50% joint venture partner in PreAnalytiX since November
1999, when the joint venture was formed. PreAnalytiX was formed to develop, manufacture and market
integrated systems for the collection, stabilization and purification of nucleic acids for molecular diagnostic
testing. At present, the Company’s maximum exposure to loss as a result of its involvement with PreAnalytiX is
limited to the Company’s share of losses from the equity method investment itself. The joint venture entity
reported net profit for the year ended December 31, 2006.
The Company has a 100% interest in QIAGEN Finance (Luxembourg) S.A. (QIAGEN Finance), a company
established for the purpose of issuing convertible debt in 2004. During the first quarter of 2006, the Company
established QIAGEN Euro Finance (Luxembourg) S.A. (Euro Finance) for the purpose of issuing additional
convertible debt. In August 2004, the Company issued $150.0 million of 1.5% Senior Convertible Notes (2004
Notes) due in 2024 through QIAGEN Finance. In May 2006, the Company completed the offering of $300.0
million 3.25% Senior Convertible Notes (2006 Notes) due in 2026 through Euro Finance. The proceeds of the
2004 and 2006 Notes were loaned to subsidiaries within the consolidated QIAGEN N.V. group. QIAGEN N.V.
has guaranteed all of these Notes, and has agreements with each of QIAGEN Finance and Euro Finance to issue
common shares to the investors in the event of conversion of any of the Notes. According to the provisions of
FIN 46R, QIAGEN Finance and Euro Finance are variable interest entities. The Company is not the primary
beneficiary, therefore neither is consolidated. Accordingly, the 2004 and 2006 convertible debt is not included in
the consolidated statements of QIAGEN N.V., though QIAGEN N.V. does report the full obligation of the debt
F-24
QIAGEN N.V. AND SUBSIDIARIES
NOTES TO CONSOLIDATED FINANCIAL STATEMENTS—(Continued)
through its liabilities to QIAGEN Finance and Euro Finance. QIAGEN N.V. accounts for its investments in
QIAGEN Finance and Euro Finance as equity investments pursuant to APB No. 18, and accordingly records
100% of the profit or loss of QIAGEN Finance and Euro Finance in the gain or loss from equity method
investees. At present, the Company’s maximum exposure to loss as a result of its involvement with QIAGEN
Finance and Euro Finance is limited to the Company’s share of losses from the equity method investments.
7.
Comprehensive Income
SFAS No. 130, “Reporting Comprehensive Income” requires that comprehensive income, which is the total
of net income and all other non-owner changes in equity, be displayed in the financial statements. The
components of the Company’s comprehensive income or loss as presented in the Consolidated Statements of
Shareholders’ Equity include net income, unrealized gains and losses from foreign currency translation, forward
contracts, pension liabilities and available-for-sale marketable securities. The following table is a summary of the
components of accumulated other comprehensive income:
Net unrealized gain on marketable securities, net of tax of $11,000 in
2006 . . . . . . . . . . . . . . . . . . . . . . . . . . . . . . . . . . . . . . . . . . . . . . . . . . .
Net unrealized (loss) on forward contracts, net of tax of $175,000 and
$902,000 in 2006 and 2005, respectively . . . . . . . . . . . . . . . . . . . . . .
Transition adjustment upon adoption of FAS 158, net of tax of
$129,000 in 2006 . . . . . . . . . . . . . . . . . . . . . . . . . . . . . . . . . . . . . . . . .
Foreign currency translation adjustments . . . . . . . . . . . . . . . . . . . . . . . .
Accumulated other comprehensive income . . . . . . . . . . . . . . . . . . . . . .
2006
2005
$ 1,404,000
$ 2,969,000
(289,000)
(204,000)
40,324,000
$41,235,000
(1,872,000)
—
15,851,000
$16,948,000
In September of 2006, the Financial Accounting Standards Board (FASB) issued SFAS No. 158,
“Employers’ Accounting for Defined Benefit Pension and Other Post-retirement Plans,” an amendment of SFAS
No. 87, 88, 106, and 132(R). SFAS No. 158 makes numerous changes related to the accounting for pension and
postretirement benefit plans. The most significant change is that the funded status of all post-retirement plans
will be recorded on the balance sheet. The difference between a plan’s funded status and its current balance sheet
position will be recognized, net of taxes, as a component of shareholders’ equity. The adoption of SFAS No. 158
resulted in an increase to the pension liability of $333,000, deferred taxes of $129,000, and a net increase in the
loss of accumulated other comprehensive income of $204,000 in the consolidated balance sheet for the year
ending December 31, 2006.
8.
Derivatives and Hedging
The Company accounts for its derivative instruments in accordance with SFAS No. 133 and related
guidance which require that an entity recognize all derivatives as either assets or liabilities in the balance sheet,
measure those instruments at fair value and recognize the change in fair value in earnings in the period of change
unless the derivative qualifies as an effective hedge that offsets certain exposures. The gain or loss on the change
in the fair values of the derivatives are included in earnings to the extent they offset the earnings impact of
changes in the fair values of the hedged obligations. Any difference is deferred in accumulated comprehensive
income, a component of shareholders’ equity. At December 31, 2006 and 2005, the Company held contracts
which effectively fix the exchange rate at which intercompany loans will be settled, so that gains or losses on the
forward contracts offset the losses or gains from changes in the value of the underlying intercompany loans. The
Company has determined that no ineffectiveness exists related to these derivatives.
F-25
QIAGEN N.V. AND SUBSIDIARIES
NOTES TO CONSOLIDATED FINANCIAL STATEMENTS—(Continued)
During 2004, the Company entered into forward arrangements which qualify for hedge accounting as cash
flow hedges of foreign currency denominated liabilities. At December 31, 2006 and 2005, these forward
contracts totaled $44.0 million as a hedge to currency risk on intercompany loans. The contracts mature in July
2011 and had fair market values at December 31, 2006 and 2005 of approximately $2.8 million and $663,000,
which is included in other long-term liabilities in the accompanying consolidated balance sheets.
During 2006, the Company also entered into two additional forward arrangements which qualify as cash
flow hedges of foreign currency denominated liabilities. At December 31, 2006, the Company held a contract for
Canadian dollars 8.0 million which matures in February 2007 and had a fair market value of $126,000 at
December 31, 2006. Additionally the Company held a contract for Japanese yen 200.0 million which matures in
April 2007 and had a fair market value of $190,000 at December 31, 2006. The fair values of these forwards are
included in prepaid and other assets at December 31, 2006.
At December 31, 2005, the Company held a contract for Canadian dollars 9.0 million which matured in
February 2006 and had a fair market value of $377,000 which is included in accrued and other liabilities at
December 31, 2005.
In the ordinary course of business, the Company purchases foreign currency exchange options to manage
potential losses from foreign currency exposures. These options give the Company the right, but not the
obligation, to purchase foreign currencies in exchange for U.S. dollars at predetermined exchange rates. The
principal objective of such options is to minimize the risks and/or costs associated with global financial and
operating activities. The Company does not utilize financial instruments for trading or other speculative
purposes. The fair market values of these options were not significant at December 31, 2006 and 2005. Gains or
losses from changes in the fair market values are included in other miscellaneous income (expense), net.
9.
Marketable Securities
At December 31, 2006, the Company had investments in marketable securities consisting of floating rate
and fixed rate debt instruments which had a fair market value and cost of approximately EUR 40.0 million ($52.8
million at December 31, 2006).
At December 31, 2005, current marketable securities consisted of auction rate debt securities, issued by state
and local government sponsored agencies. While these securities have long term maturities, their interest rates
are reset approximately every 7-28 days through an auction process. As a result, the interest income from these
securities is subject to market risk since the rate is adjusted to accommodate market conditions on each reset
date. However, since the interest rates are reflective of current market conditions, the fair value of these securities
typically does not fluctuate from par or cost. These securities are classified as current assets in the accompanying
consolidated balance sheets since the Company may sell the securities at its discretion on the auction day without
penalty or loss of principal.
2006 Maturities due:
Within one year . . . . . . . . . . . . . . . . . . . . . . . . . . . . . . . . . . .
One to three years . . . . . . . . . . . . . . . . . . . . . . . . . . . . . . . . .
2005 Maturities due:
Auction-rate Securities . . . . . . . . . . . . . . . . . . . . . . . . . . . . .
F-26
Cost
Gross
Unrealized
Gains
Gross
Unrealized
Losses
$14,998,000
37,756,000
$38,000
54,000
$ (5,000) $15,031,000
(59,000) 37,751,000
$52,754,000
$92,000
$(64,000) $52,782,000
$15,000,000
$
$
—
—
Fair Market
Value
$15,000,000
QIAGEN N.V. AND SUBSIDIARIES
NOTES TO CONSOLIDATED FINANCIAL STATEMENTS—(Continued)
The Company believes that the gross unrealized losses are temporary and related to the change in market
interest rates since purchase. The decline is not related to any specific event. The Company anticipates full
recovery of cost with respect to these investments at maturity or sooner in the event of a change in the market
interest rate environment.
During 2005, the Company’s former cost-method investment in Coley Pharmaceutical Group, Inc. (CPG)
was reclassified as a long-term marketable security upon CPG’s completed IPO. At December 31, 2006 and
2005, the Company held 289,096 shares in CPG with a fair market value of $2.8 million and $4.4 million,
respectively and a cost of $1.4 million. The Company was restricted from selling the shares until February 2006.
Long-term marketable securities are included in other long-term assets in the accompanying consolidated balance
sheets.
For the years ended December 31, 2006, 2005 and 2004, proceeds from sales of available-for-sale securities
totaled $20.0 million, $55.4 million and $14.9 million, respectively, and, calculated on the specific identification
method, in 2005 there were realized losses of $507,000 and in 2004 a realized gain of $481,000. There were no
realized gains or losses during 2006.
10. Prepaid Expenses and Other
Prepaid expenses and other current assets are summarized as follows as of December 31, 2006 and 2005:
Prepaid expenses and prepayments . . . . . . . . . . . . . . . . . . . . . . . . . . . . .
Escrow funds . . . . . . . . . . . . . . . . . . . . . . . . . . . . . . . . . . . . . . . . . . . . . .
VAT . . . . . . . . . . . . . . . . . . . . . . . . . . . . . . . . . . . . . . . . . . . . . . . . . . . . .
Other . . . . . . . . . . . . . . . . . . . . . . . . . . . . . . . . . . . . . . . . . . . . . . . . . . . .
2006
2005
$16,360,000
1,500,000
1,073,000
10,830,000
$14,991,000
3,908,000
958,000
6,448,000
$29,763,000
$26,305,000
11. Property, Plant and Equipment
Property, plant and equipment, including equipment acquired under capital lease obligations, are
summarized as follows as of December 31, 2006 and 2005:
Land . . . . . . . . . . . . . . . . . . . . . . . . . . . . . . . . . . . . . . .
Buildings and improvements . . . . . . . . . . . . . . . . . . . .
Machinery and equipment . . . . . . . . . . . . . . . . . . . . . .
Computer software . . . . . . . . . . . . . . . . . . . . . . . . . . . .
Furniture and office equipment . . . . . . . . . . . . . . . . . .
Construction in progress . . . . . . . . . . . . . . . . . . . . . . . .
Less: Accumulated depreciation and amortization . . . .
Property, plant and equipment, net . . . . . . . . . . . . . . . .
F-27
Estimated
useful life
(in years)
2006
2005
—
1-40
5-10
1-5
2-10
—
$ 12,896,000
173,169,000
83,146,000
28,685,000
40,969,000
14,062,000
$ 12,013,000
157,893,000
67,528,000
23,650,000
33,914,000
5,389,000
352,927,000
(131,650,000)
$ 221,277,000
300,387,000
(105,188,000)
$ 195,199,000
QIAGEN N.V. AND SUBSIDIARIES
NOTES TO CONSOLIDATED FINANCIAL STATEMENTS—(Continued)
Amortization of assets acquired under capital lease obligations is included within accumulated depreciation
and amortization above for the years ended December 31, 2006 and 2005, respectively. For the years ended
December 31, 2006, 2005 and 2004 depreciation and amortization expense totaled $19.7 million, $19.0 million
and $20.2 million, respectively. Repairs and maintenance expense was $4.5 million, $4.0 million and $4.5
million in fiscal years 2006, 2005 and 2004, respectively.
Construction on a new logistics facility in Germany began in August 2006 and will be completed by the
second quarter in 2007. The new facility is estimated to cost approximately EUR 9.0 million, of which EUR
6.4 million (approximately $8.2 million) has been incurred and is included in construction in progress at
December 31, 2006. Of the amount incurred, approximately $89,000 represents capitalized interest.
12. Investments
The Company has made strategic investments in certain companies that are accounted for using the equity
or cost method of accounting. A summary of these investments as of December 31, 2006 and 2005 is as follows:
Company
PreAnalytiX GmbH . . . . . . . . . .
QBM Cell Science . . . . . . . . . . .
QIAGEN Finance . . . . . . . . . . . .
QIAGEN Euro Finance . . . . . . .
Ownership
Percentage
50.00%
19.50%
100.00%
100.00%
Equity Investments
As of December 31,
2006
2005
$2,623,000
$ 546,000
$ 169,000
$ 248,000
Share of income (loss)
For the years ended December 31,
2006
2005
2004
$883,000
$574,000
$103,000
—
$1,009,000 $(1,079,000) $(2,312,000)
$ (28,000) $
3,000 $
18,000
$ 66,000 $ (73,000) $
51,000
$ 204,000
—
—
Ownership
Percentage
Company
Operon Biotechnologies, Inc. . . . . . . . . . . . . . . . . . . . . . . .
Protedyne Corporation . . . . . . . . . . . . . . . . . . . . . . . . . . . .
16.00%
3.11%
Cost Investment at December 31,
2006
2005
$4,000,000
—
$4,000,000
$2,121,000
For PreAnalytiX, the total assets amounted to $7.5 million and $4.1 million as of December 31, 2006 and
2005, respectively. The shareholders’ equity for PreAnalytiX amounted to $7.0 million as of December 31, 2006
and $3.4 million as of December 31, 2005. In 2006, PreAnalytiX revenues totaled $7.8 million and $4.7 million
in 2005. PreAnalytiX net income was $3.2 million and $97,000 in 2006 and 2005, respectively.
As of December 31, 2006 and 2005, total assets of QBM Cell Science totaled $576,000, and $522,000,
respectively, and shareholders’ equity amounted to $578,000 and $451,000, respectively. In 2006, QBM Cell
Science recorded revenues of $523,000 and a net loss of $37,000. In 2005, a net loss of $107,000 was recorded.
The method of accounting for an investment depends on the extent of the Company’s control. The Company
monitors changes in circumstances that may require a reassessment of the level of control. The Company
periodically reviews the carrying value of these investments for impairment, considering factors such as the most
recent stock transactions and book values from the recent financial statements. The fair value of cost-method
investments is estimated when there are identified events or changes in circumstances that may have an impact
on the fair value of the investment. During 2006, in connection with the acquisition of Gentra, the Company’s
$2.1 million investment in Protedyne was fully impaired based on management’s assessment of the
recoverability of the invested amount. The impairment charge is included in acquisition, integration and related
costs in the accompanying consolidated statement of income. The Company has a .073% cost-method investment
in Ingenium Biopharmaceutical AG which has been fully impaired in a prior year.
F-28
QIAGEN N.V. AND SUBSIDIARIES
NOTES TO CONSOLIDATED FINANCIAL STATEMENTS—(Continued)
13. Intangible Assets
The following sets forth the acquired intangible assets by major asset class as of December 31, 2006 and
December 31, 2005:
2006
Weighted
Average
Life
Gross
Carrying
Amount
2005
Gross
Carrying
Amount
Accumulated
Amortization
Accumulated
Amortization
Amortized Intangible Assets:
Patent and license rights . . . . 9.6 years $ 41,362,000 $(11,744,000) $30,025,000 $ (8,488,000)
Developed technology . . . . . 11.9 years
78,814,000 (11,690,000) 48,128,000
(4,862,000)
Customer base, Trademarks
and non-compete
agreements . . . . . . . . . . . . 11.6 years
24,220,000
(2,470,000) 10,226,000
(463,000)
$144,396,000 $(25,904,000) $88,379,000 $(13,813,000)
Unamortized Intangible Assets:
Goodwill . . . . . . . . . . . . . . . .
$160,141,000
$93,914,000
The changes in the carrying amount of goodwill, by segment, for the years ended December 31, 2006 and
2005, are as follows:
Germany
North America
BALANCE AT DECEMBER 31,
2004 . . . . . . . . . . . . . . . . . . . . . . . $20,980,000 $ 5,478,000
Goodwill acquired during the
year . . . . . . . . . . . . . . . . . . . . . . . .
24,461,000
17,882,000
Purchase adjustment for earn-out . . .
1,271,000
—
Purchase adjustments . . . . . . . . . . . .
(119,000)
—
Effect of foreign currency
translation . . . . . . . . . . . . . . . . . . .
(3,675,000)
342,000
BALANCE AT DECEMBER 31,
2005 . . . . . . . . . . . . . . . . . . . . . . .
Goodwill acquired during the
year . . . . . . . . . . . . . . . . . . . . . . . .
Earn-out and milestone payments . .
Purchase adjustments . . . . . . . . . . . .
Effect of foreign currency
translation . . . . . . . . . . . . . . . . . . .
BALANCE AT DECEMBER 31,
2006 . . . . . . . . . . . . . . . . . . . . . . .
Asia
Other
Countries
Total
$ 1,405,000
$28,400,000
$ 56,263,000
447,000
78,000
—
(203,000)
—
(39,000)
42,790,000
1,349,000
(158,000)
(2,794,000)
(6,330,000)
93,914,000
42,918,000
23,702,000
1,727,000
25,567,000
—
7,358,000
—
40,610,000
—
(2,355,000)
6,896,000
4,768,000
—
818,000
500,000
—
48,324,000
12,626,000
(2,355,000)
5,228,000
2,000
298,000
2,104,000
7,632,000
$55,504,000
$61,959,000
$13,689,000
$28,989,000
$160,141,000
Purchase adjustments represent the final allocation of purchase price and changes in our estimates of lease
accruals for cancelled lease space.
Amortization expense on intangible assets totaled approximately $10.3 million, $5.9 million and $2.5
million, respectively, for the years ended December 31, 2006, 2005 and 2004. In connection with the acquisitions
as more fully discussed in Note 4, $2.2 million of purchase price was allocated to in-process research and
development and expensed during the year ended December 31, 2006.
F-29
QIAGEN N.V. AND SUBSIDIARIES
NOTES TO CONSOLIDATED FINANCIAL STATEMENTS—(Continued)
Amortization of intangibles for the next five years is expected to be approximately:
Amortization
Years ended December 31:
2007 . . . . . . . . . . . . . . . . . . . . . . . . . . . . . . . . . . . . . . . . . . . . . . . . . . . . . . . . . . . . . .
2008 . . . . . . . . . . . . . . . . . . . . . . . . . . . . . . . . . . . . . . . . . . . . . . . . . . . . . . . . . . . . . .
2009 . . . . . . . . . . . . . . . . . . . . . . . . . . . . . . . . . . . . . . . . . . . . . . . . . . . . . . . . . . . . . .
2010 . . . . . . . . . . . . . . . . . . . . . . . . . . . . . . . . . . . . . . . . . . . . . . . . . . . . . . . . . . . . . .
2011 . . . . . . . . . . . . . . . . . . . . . . . . . . . . . . . . . . . . . . . . . . . . . . . . . . . . . . . . . . . . . .
$13,298,000
$13,173,000
$12,771,000
$12,301,000
$11,920,000
14. Income Taxes
Income before income taxes for the years ended December 31, 2006, 2005 and 2004 consisted of:
Pretax income in The Netherlands . . . . . . . . . . . . . . .
Pretax income from foreign operations . . . . . . . . . . . .
2006
2005
2004
$ 16,131,000
89,937,000
$ 6,474,000
90,790,000
$ 6,585,000
66,102,000
$106,068,000
$97,264,000
$72,687,000
The provisions for income taxes for the years ended December 31, 2006, 2005 and 2004 are as follows:
2006
$
386,000
21,143,000
Current—The Netherlands . . . . . . . . . . . . . . . . . . . . .
—Foreign . . . . . . . . . . . . . . . . . . . . . . . . . . . .
Deferred—The Netherlands . . . . . . . . . . . . . . . . . . . .
—Foreign . . . . . . . . . . . . . . . . . . . . . . . . . . .
Total provision for income taxes . . . . . . . . . . . . . . . . .
2005
$
700,000
31,552,000
2004
$
164,000
26,383,000
21,529,000
32,252,000
26,547,000
376,000
13,624,000
—
2,787,000
(1,246,000)
(1,319,000)
14,000,000
2,787,000
(2,565,000)
$35,529,000
$35,039,000
$23,982,000
The Netherlands statutory income tax rate for the years ended December 31, 2006, 2005 and 2004 was
29.6%, 31.5% and 34.5%, respectively. The principal items comprising the differences between income taxes
computed at The Netherlands statutory rate the effective tax rate for the years ended December 31, 2006, 2005
and 2004 are as follows:
2006
Amount
Income taxes at The Netherlands
statutory rate . . . . . . . . . . . . . . . . . . . .
Earnings of subsidiaries tax at different
rates . . . . . . . . . . . . . . . . . . . . . . . . . . .
Tax on non-deductible expenses . . . . . . .
Other items, net . . . . . . . . . . . . . . . . . . . .
Total provision for income taxes . . . . . . .
Percent
$31,396,000
5,011,000
(1,119,000)
241,000
$35,529,000
F-30
2005
Amount
Percent
2004
Amount
Percent
29.6% $30,638,000
31.5% $25,077,000
34.5%
4.7
(1.0)
0.2
5.7
(1.6)
0.4
2.0
(2.2)
(1.3)
5,508,000
(1,534,000)
427,000
33.5% $35,039,000
1,488,000
(1,600,000)
(983,000)
36.0% $23,982,000
33.0%
QIAGEN N.V. AND SUBSIDIARIES
NOTES TO CONSOLIDATED FINANCIAL STATEMENTS—(Continued)
Certain countries benefit from tax holidays which represent a tax exemption period aimed to attract foreign
investment in certain tax jurisdictions. These agreements include programs that reduce up to 100% of taxes in
years covered by the agreements. The Company’s tax holidays expire at various dates through 2011.
The Company has recorded a net deferred tax liability of $6.0 million and a net deferred tax liability of
$786,000 at December 31, 2006 and 2005, respectively which are reflected on the Company’s consolidated
balance sheets at December 31, 2006 and 2005 as follows:
2006
2005
Current deferred tax asset . . . . . . . . . . . . . . . . . . . . . . . . . . .
Current deferred tax liabilities . . . . . . . . . . . . . . . . . . . . . . .
Non-current deferred tax asset . . . . . . . . . . . . . . . . . . . . . . .
Non-current deferred tax liabilities . . . . . . . . . . . . . . . . . . .
$ 18,627,000
(5,360,000)
2,409,000
(21,705,000)
$ 11,617,000
(1,179,000)
6,346,000
(17,570,000)
Net deferred tax liabilities . . . . . . . . . . . . . . . . . . . . . . . . . .
$ (6,029,000)
$
(786,000)
The components of the net deferred tax liability at December 31, 2006 and 2005 are as follows:
2006
Deferred tax asset:
Allowance for bad debts . . . . . . . . . . . . . . . . . . . . . . . .
Bonus/commission accrual . . . . . . . . . . . . . . . . . . . . . .
Vacation accrual . . . . . . . . . . . . . . . . . . . . . . . . . . . . . .
Warranty accrual . . . . . . . . . . . . . . . . . . . . . . . . . . . . . .
Accrued liabilities . . . . . . . . . . . . . . . . . . . . . . . . . . . . .
Depreciation and amortization . . . . . . . . . . . . . . . . . . .
Tax credits . . . . . . . . . . . . . . . . . . . . . . . . . . . . . . . . . .
Net operating loss carryforward . . . . . . . . . . . . . . . . . .
Inventories . . . . . . . . . . . . . . . . . . . . . . . . . . . . . . . . . .
Deferred revenues . . . . . . . . . . . . . . . . . . . . . . . . . . . . .
Capitalized start-up costs . . . . . . . . . . . . . . . . . . . . . . .
Capital leases . . . . . . . . . . . . . . . . . . . . . . . . . . . . . . . .
Intangibles . . . . . . . . . . . . . . . . . . . . . . . . . . . . . . . . . .
United States state income taxes . . . . . . . . . . . . . . . . .
Other . . . . . . . . . . . . . . . . . . . . . . . . . . . . . . . . . . . . . . .
Valuation allowance . . . . . . . . . . . . . . . . . . . . . . . . . . .
Deferred tax liability:
Depreciation and amortization . . . . . . . . . . . . . . . . . . .
Inventory . . . . . . . . . . . . . . . . . . . . . . . . . . . . . . . . . . . .
Allowance for bad debt . . . . . . . . . . . . . . . . . . . . . . . . .
Accrued liabilities . . . . . . . . . . . . . . . . . . . . . . . . . . . . .
Intangibles . . . . . . . . . . . . . . . . . . . . . . . . . . . . . . . . . .
Currency revaluation . . . . . . . . . . . . . . . . . . . . . . . . . .
United States state income taxes . . . . . . . . . . . . . . . . .
Other . . . . . . . . . . . . . . . . . . . . . . . . . . . . . . . . . . . . . . .
Net deferred tax liabilities . . . . . . . . . . . . . . . . . . . . . . . . . .
F-31
$
625,000
592,000
381,000
455,000
1,895,000
288,000
618,000
19,553,000
5,427,000
1,301,000
76,000
749,000
4,691,000
313,000
532,000
(10,692,000)
2005
$
690,000
220,000
319,000
244,000
1,479,000
317,000
744,000
6,610,000
3,911,000
1,212,000
1,214,000
623,000
3,311,000
383,000
1,136,000
(1,105,000)
26,804,000
21,308,000
(9,950,000)
(542,000)
(221,000)
(691,000)
(15,145,000)
(4,894,000)
(1,017,000)
(373,000)
(9,486,000)
(407,000)
—
(519,000)
(11,187,000)
—
(34,000)
(461,000)
(32,833,000)
(22,094,000)
$ (6,029,000)
$
(786,000)
QIAGEN N.V. AND SUBSIDIARIES
NOTES TO CONSOLIDATED FINANCIAL STATEMENTS—(Continued)
As of December 31, 2006 and 2005, the Company had net operating loss carryforwards in The Netherlands
totaling approximately $5.5 million and $5.6 million, respectively which expire in various years through 2011.
As of December 31, 2006 and 2005, the Company had foreign NOL carryforwards totaling approximately $27.0
million and $15.8 million, respectively. These NOL’s were primarily generated from the revaluation of liquid
assets and operating losses from the Company’s subsidiaries. A portion of these NOL’s, approximately $4.5
million at December 31, 2006, expire in various years through 2013. The balance does not expire.
Deferred tax assets as of December 31, 2006 and 2005, relating primarily to net operating loss
carryforwards have been reduced by a valuation allowance of approximately $10.7 million and $1.1 million,
respectively, to a net amount that management believes is more likely than not to be realized. At December 31,
2006, $9.3 million of the Company’s valuation allowance relates to deferred tax assets for which any
subsequently recognized tax benefits will reduce goodwill of an acquired business. To the extent that future
valuation allowances are required, the effect of the allowance will be recorded in the provision for income taxes
in the period the determination is made.
At December 31, 2006 and 2005, there were no deferred income tax liabilities recognized for taxes that
would be payable on the unremitted earnings of certain of the group’s subsidiaries. The Company has either no
liability to additional taxation should any amounts be remitted due to the availability of double taxation relief or
such remittance is not expected to occur and the tax impact would be insignificant.
There are no income tax consequences for the Company regarding payment of dividends to the shareholders
of the Company. To date, the Company has never paid dividends.
The Company periodically performs a comprehensive review of its tax positions and accrues amounts for
tax contingencies. Based upon these reviews, the status of ongoing tax audits, and the expiration of applicable
statute of limitations, accruals are adjusted as necessary. Such amounts are included within taxes payable within
the accompanying consolidated balance sheets. The resolution of tax audits is unpredictable and could result in
tax liabilities that are significantly different than those which have been estimated and accrued by the Company.
15. Accrued and Other Liabilities
Accrued and other liabilities at December 31, 2006 and 2005 consist of the following:
2006
2005
Royalties . . . . . . . . . . . . . . . . . . . . . . . . . . . . . . . . . . . . . . . . . . . . . . . . .
Payroll and related accruals . . . . . . . . . . . . . . . . . . . . . . . . . . . . . . . . . .
Deferred revenue . . . . . . . . . . . . . . . . . . . . . . . . . . . . . . . . . . . . . . . . . . .
Sales and other taxes . . . . . . . . . . . . . . . . . . . . . . . . . . . . . . . . . . . . . . . .
Acquisition and related costs . . . . . . . . . . . . . . . . . . . . . . . . . . . . . . . . .
Accrued interest on long-term debt, due to QIAGEN Finance . . . . . . . .
Accrued interest on long-term debt, due to QIAGEN Euro Finance . . .
Professional and other fees . . . . . . . . . . . . . . . . . . . . . . . . . . . . . . . . . . .
Warranty . . . . . . . . . . . . . . . . . . . . . . . . . . . . . . . . . . . . . . . . . . . . . . . . .
Relocation and restructuring costs . . . . . . . . . . . . . . . . . . . . . . . . . . . . .
Other . . . . . . . . . . . . . . . . . . . . . . . . . . . . . . . . . . . . . . . . . . . . . . . . . . . .
$ 9,392,000
16,376,000
6,432,000
3,847,000
6,163,000
3,410,000
4,695,000
1,923,000
1,413,000
326,000
12,220,000
$ 9,045,000
12,691,000
4,557,000
4,056,000
5,203,000
3,410,000
—
2,888,000
1,332,000
119,000
9,406,000
Total accrued liabilities . . . . . . . . . . . . . . . . . . . . . . . . . . . . . . . . . . . . . .
$66,197,000
$52,707,000
F-32
QIAGEN N.V. AND SUBSIDIARIES
NOTES TO CONSOLIDATED FINANCIAL STATEMENTS—(Continued)
16. Lines of Credit and Debt
The Company has five separate lines of credit amounting to $12.4 million, with interest rates ranging from
6.19% to 7.75%, none of which was utilized at December 31, 2006 and 2005. There were no short-term
borrowings outstanding at December 31, 2006 and 2005.
Long-term debt consists of the following:
2006
EUR 30.0 million note payable bearing interest at EURIBOR plus 0.75% (4.37%
and 2.40% at December 31, 2006 and 2005, respectively), payments of EUR
5.0 million (approximately $6.6 million at December 31, 2006) due annually
through June 2011 . . . . . . . . . . . . . . . . . . . . . . . . . . . . . . . . . . . . . . . . . . . . . . . . $ 39,591,000
EUR 5.0 million note payable bearing interest at EURIBOR plus 0.75%,
payment of EUR 5.0 million due in June 2008 . . . . . . . . . . . . . . . . . . . . . . . . . .
6,599,000
Note payable to QIAGEN Euro Finance bearing interest at an effective rate of
4.2% due in May 2013 . . . . . . . . . . . . . . . . . . . . . . . . . . . . . . . . . . . . . . . . . . . . 300,000,000
Notes payable to QIAGEN Finance bearing interest at an effective rate of 1.95%
due in August 2011 . . . . . . . . . . . . . . . . . . . . . . . . . . . . . . . . . . . . . . . . . . . . . . . 150,000,000
2005
$ 41,447,000
5,921,000
—
150,000,000
Total long-term debt . . . . . . . . . . . . . . . . . . . . . . . . . . . . . . . . . . . . . . . . . . . . . . . .
Less current portion . . . . . . . . . . . . . . . . . . . . . . . . . . . . . . . . . . . . . . . . . . . . . . . . .
496,190,000
6,599,000
197,368,000
5,921,000
Long-term portion . . . . . . . . . . . . . . . . . . . . . . . . . . . . . . . . . . . . . . . . . . . . . . . . . .
$489,591,000
$191,447,000
The loan agreement related to the note payable of EUR 30.0 million contains certain financial and
non-financial covenants, including but not limited to restrictions on the encumbrance of land, restrictions on the
transfer of any patents to third parties and the maintenance of certain financial ratios. The Company was in
compliance with these covenants at December 31, 2006 and 2005.
In August 2004, the Company completed the sale of $150.0 million principal amount of 1.50% convertible
unsubordinated notes (Notes) due 2024, through its unconsolidated subsidiary QIAGEN Finance. The net
proceeds of the Notes were loaned by QIAGEN Finance to consolidated subsidiaries in the U.S. and Switzerland.
At December 31, 2004, $150.0 million is included in long-term debt for the amount of Notes proceeds payable to
QIAGEN Finance. These long-term notes payable to QIAGEN Finance have an effective interest rate of 1.95%
and are due in August 2011. Interest on the Notes is payable semi-annually in February and August. The Notes
were issued at 100% of principal value, and are convertible into 11.9 million shares of common shares at the
option of the holder upon the occurrence of certain events at a price of $12.6449 per share, subject to adjustment.
The Notes may be redeemed, in whole or in part, at QIAGEN’s option on or after 7 years, at 100% of the
principal amount provided the actual trading price of our common stock exceeds 120% of the conversion price
for twenty consecutive trading days. In addition, the holders of the Notes may require QIAGEN to repurchase all
or a portion of the Notes for 100% of the principal amount, plus accrued interest, on August 18, 2011, 2014 and
2019. Based on an estimation using available over-the-counter market information on the convertible bond issued
by QIAGEN Finance, the fair value of the Notes at December 31, 2006 was approximately $200.0 million. The
Company has reserved the 11.9 million shares of common stock for issuance in the event of conversion.
In May 2006, the Company completed the offering of $300.0 million of 3.25% senior convertible notes
(2006 Notes) due in 2026 through a new unconsolidated subsidiary QIAGEN Euro Finance (Luxembourg) S.A.
(Euro Finance). The net proceeds of the 2006 Notes were loaned by Euro Finance to consolidated subsidiaries of
the Company. At September 30, 2006, $300.0 million is included in long-term debt for the amount of 2006 Notes
F-33
QIAGEN N.V. AND SUBSIDIARIES
NOTES TO CONSOLIDATED FINANCIAL STATEMENTS—(Continued)
proceeds payable to Euro Finance. These long-term notes payable to EUR Finance have an effective interest rate
of 4.2% and are due in May 2013. Interest on the 2006 Notes is payable semi-annually in May and November.
The 2006 Notes were issued at 100% of principal value, and are convertible into 15.0 million shares of common
stock at the option of the holder upon the occurrence of certain events at a price of $20.00 per share, subject to
adjustment. QIAGEN N.V. has an agreement with Euro Finance to issue shares to the investors in the event of
conversion. This subscription right, along with the related receivable, is recorded at fair value in the equity of
QIAGEN N.V. as paid-in capital. The 2006 Notes cannot be called for the first 7 years and are callable thereafter
subject to a provisional call trigger of 130% of the conversion price. In addition, the holders of the 2006 Notes
may require QIAGEN to repurchase all or a portion of the outstanding Notes for 100% of the principal amount,
plus accrued interest, on May 16, 2013, 2017 and 2022. Based on an estimation using available over-the-counter
market information on the convertible bond issued by QIAGEN Euro Finance, the fair value of the Notes at
December 31, 2006 was approximately $316.5 million. The Company has reserved the 15.0 million shares of
common stock for issuance in the event of conversion.
Future principal maturities of long-term debt as of December 31, 2006 are as follows:
Year ending December 31,
2007 . . . . . . . . . . . . . . . . . . . . . . . . . . . . . . . . . . . . . . . . . . . . . . . . . . . . . . . . .
2008 . . . . . . . . . . . . . . . . . . . . . . . . . . . . . . . . . . . . . . . . . . . . . . . . . . . . . . . . .
2009 . . . . . . . . . . . . . . . . . . . . . . . . . . . . . . . . . . . . . . . . . . . . . . . . . . . . . . . . .
2010 . . . . . . . . . . . . . . . . . . . . . . . . . . . . . . . . . . . . . . . . . . . . . . . . . . . . . . . . .
2011 . . . . . . . . . . . . . . . . . . . . . . . . . . . . . . . . . . . . . . . . . . . . . . . . . . . . . . . . .
Thereafter . . . . . . . . . . . . . . . . . . . . . . . . . . . . . . . . . . . . . . . . . . . . . . . . . . . .
$
6,599,000
13,197,000
6,599,000
6,599,000
163,196,000
300,000,000
$496,190,000
Interest expense on long-term debt was $10.6 million, $3.8 million and $3.8 million for the years ended
December 31, 2006, 2005 and 2004, respectively.
17. Share-Based Compensation
During 2005, the Company adopted the QIAGEN N.V. Amended and Restated 2005 Stock Plan (the Plan).
The Plan allows for the granting of stock rights and incentive stock options, as well as non-qualified options,
stock grants and stock based awards, generally with terms of up to 10 years, subject to earlier termination in
certain situations. Generally, options granted prior to October 2004 vested over a three-year period. During 2004
and 2005, the Company accelerated the vesting of certain options. The vesting and exercisability of certain stock
rights will be accelerated in the event of a Change of Control, as defined in the Plan. To date all grants have been
at the market value on the grant date or at a premium above the closing market price on the grant date. The
Company had approximately 17.7 million shares of common stock reserved and available for issuance under this
plan at December 31, 2006.
During the years ended December 31, 2006 and 2005, the Company granted 201,500 and 2.7 million stock
options, respectively. Following are the weighted-average assumptions used in valuing the stock options granted
to employees for the years ended December 31:
2006
Stock price volatility . . . . . . . . . . . . . . . . . . . . . . . . . . . . . . . . . . . . . . . . . . . . .
Risk-free interest rate . . . . . . . . . . . . . . . . . . . . . . . . . . . . . . . . . . . . . . . . . . . .
Expected life (in years) . . . . . . . . . . . . . . . . . . . . . . . . . . . . . . . . . . . . . . . . . . .
Dividend rate . . . . . . . . . . . . . . . . . . . . . . . . . . . . . . . . . . . . . . . . . . . . . . . . . . .
Forfeiture rate . . . . . . . . . . . . . . . . . . . . . . . . . . . . . . . . . . . . . . . . . . . . . . . . . .
F-34
2005
43% 52%
4.74% 4.02%
6.00
4.26
0%
0%
9%
0%
QIAGEN N.V. AND SUBSIDIARIES
NOTES TO CONSOLIDATED FINANCIAL STATEMENTS—(Continued)
A summary of the status of the Company’s employee stock options as of December 31, 2006 and changes
during the twelve months then ended is presented below:
Number of
Shares
All Employee Options
Weighted
Average
Exercise
Price
Weighted
Average
Contractual
Term
Aggregate
Intrinsic
Value
Outstanding at January 1, 2006 . . . . . . . . . . . . . . . . . . . . . . . . 13,585,295
Granted . . . . . . . . . . . . . . . . . . . . . . . . . . . . . . . . . . . . . . . . . .
201,500
Exercised . . . . . . . . . . . . . . . . . . . . . . . . . . . . . . . . . . . . . . . . . (1,586,676)
Forfeited and cancelled . . . . . . . . . . . . . . . . . . . . . . . . . . . . . .
(483,580)
$12.743
$15.554
$ 6.934
$16.511
Outstanding at December 31, 2006 . . . . . . . . . . . . . . . . . . . . .
11,716,539
$13.427
5.99
$44,268,117
Exercisable at December 31, 2006 . . . . . . . . . . . . . . . . . . . . .
11,499,364
$13.395
5.92
$44,166,577
Vested and expected to vest at December 31, 2006 . . . . . . . .
11,684,835
$13.422
.03
$44,261,299
The weighted-average grant-date fair value of options granted during years ended December 31, 2006, 2005
and 2004 was $7.52, $5.82 and $6.82, respectively. The total intrinsic value of options exercised during the years
ended December 31, 2006 was $12 million.
As a result of adopting SFAS No. 123(R) on January 1, 2006, the Company’s income before income taxes
and net income for the year ended December 31, 2006, is approximately $326,000 and $214,000 lower,
respectively, than if it had continued to account for share-based compensation under Opinion 25. The Company
anticipates that the adoption will have a greater impact in future periods.
The unrecognized share based compensation expense related to employee stock option awards is
approximately $701,000 and will be recognized over a weighted average period of approximately 1.7 years.
The following table illustrates the effect on net income and net income per share if the Company had
applied the fair value recognition provisions of SFAS No. 123(R) to equity-based compensation for the years
ended December 31, 2005 and 2004.
2005
2004
Net income, as reported . . . . . . . . . . . . . . . . . . . . . . . . . . . . . . . . . . . .
Deduct: Total stock-based employee compensation expense
determined under the fair value based method for all awards, net
of related tax effects . . . . . . . . . . . . . . . . . . . . . . . . . . . . . . . . . . . . .
$ 62,225,000
$ 48,705,000
Pro forma net income . . . . . . . . . . . . . . . . . . . . . . . . . . . . . . . . . . . . . .
$ 48,390,000
$ 36,481,000
Earnings per share:
Basic—as reported . . . . . . . . . . . . . . . . . . . . . . . . . . . . . . . . . . . . . . . .
Basic—pro forma . . . . . . . . . . . . . . . . . . . . . . . . . . . . . . . . . . . . . . . . .
Diluted—as reported . . . . . . . . . . . . . . . . . . . . . . . . . . . . . . . . . . . . . . .
Diluted—pro forma . . . . . . . . . . . . . . . . . . . . . . . . . . . . . . . . . . . . . . .
$
$
$
$
$
$
$
$
(13,835,000)
0.42
0.33
0.41
0.32
(12,224,000)
0.33
0.25
0.33
0.25
Prior to the adoption of SFAS 123(R), the Company presented all tax benefits of deductions resulting from
the exercise of stock options as operating cash flows in the Consolidated Statement of Cash Flows. SFAS 123(R)
requires the cash flows resulting from the tax benefits generated from tax deductions in excess of the
compensation costs recognized for those options (excess tax benefits) to be classified as financing cash flows.
F-35
QIAGEN N.V. AND SUBSIDIARIES
NOTES TO CONSOLIDATED FINANCIAL STATEMENTS—(Continued)
At December 31, 2006, 2005 and 2004, options were exercisable with respect to 11.5 million, 13.4 million
and 9.5 million common shares at a weighted average price of $13.40, $12.81 and $13.39 per share, respectively.
The options outstanding at December 31, 2006 expire in various years through 2016. Information about stock
options outstanding at December 31, 2006 is summarized as follows:
Weighted
Number
Outstanding
at 12/31/06
Weighted
Average
Remaining
Contract Life
Weighted
Average
Exercise
Price
Number
Exercisable
at 12/31/06
Weighted
Average
Exercise
Price
$ 1.060 - $ 6.018
$ 6.024 - $ 8.940
$ 9.000 - $10.430
$10.610 - $11.750
$11.850 - $11.985
$12.110 - $13.150
$13.280 - $15.480
$15.810 - $20.563
$20.800 - $47.750
$49.750 - $49.750
1,751,672
1,289,563
1,312,244
1,233,310
1,181,469
1,171,411
1,473,714
1,278,561
994,925
29,670
4.92 Years
4.17 Years
6.60 Years
7.96 Years
8.35 Years
7.68 Years
5.89 Years
4.89 Years
3.80 Years
3.58 Years
$ 5.394
$ 8.283
$10.155
$11.344
$11.968
$12.786
$14.830
$18.885
$33.453
$49.750
1,751,672
1,289,563
1,296,569
1,233,310
1,181,469
1,171,411
1,423,714
1,127,061
994,925
29,670
$ 5.394
$ 8.283
$10.159
$11.344
$11.968
$12.786
$14.832
$19.928
$33.453
$49.750
$ 1.060 - $49.750
11,716,539
5.99 Years
$13.427
11,499,364
$13.395
Range of
Exercise Prices
During the fourth quarters of 2005 and 2004, and considering the new accounting implications of SFAS
No. 123(R), the Company accelerated the vesting of 1.2 million and 829,000 stock options, respectively. The
2005 acceleration applied to certain in-the-money options and to options held by Supervisory and Managing
Board members. Under the accounting guidance of APB 25 and FASB Interpretation No. 44 “Accounting for
Certain Transactions Involving Stock Compensation—An Interpretation of APB Opinion No. 25, “the 2005
acceleration of vesting did not result in any compensation expense as these options, after applying an estimate of
the termination of services, had a de minimis intrinsic value. The 2004 acceleration applied to stock options that
had a price greater than or equal to the fair market value of the Company’s common shares (out-of-the-money) as
of the close of day that the plan was approved by the Supervisory Board, or $10.62. The accelerated options were
given a sales restriction, such that any shares held through the exercise of an accelerated option could not be sold,
prior to the original vesting date. Under the accounting guidance of APB 25, the 2004 acceleration of vesting did
not result in any compensation expense as these options had no intrinsic value. The accelerations, however, will
allow the Company to avoid recording approximately $2.8 million, after tax, of future compensation expense that
would have been required to be recognized under SFAS No. 123(R). Upon adoption of SFAS No. 123(R) on
January 1, 2006, the Company did not have any stock-based compensation expense from these accelerated
options. The Supervisory Board took the action based on its belief that it is in the best interest of the Company’s
shareholders and the Company as it will reduce reported compensation expense in future periods. The Company
has worked with equity based compensation plan experts to evaluate its stock-based compensation plans and
incentive strategies in light of the provisions of SFAS No. 123(R). The Company’s aim is to implement an equity
based compensation plan structure that will give employees a long-term incentive arrangement while minimizing
compensation expense.
18. Commitments and Contingencies
Lease Commitments
The Company leases facilities and equipment under operating lease arrangements expiring in various years
through 2011. Certain facility and equipment leases constitute capital leases expiring in various years through
2018. The accompanying consolidated financial statements include the assets and liabilities arising from these
F-36
QIAGEN N.V. AND SUBSIDIARIES
NOTES TO CONSOLIDATED FINANCIAL STATEMENTS—(Continued)
capital lease obligations. Rent expense under operating lease agreements was $9.1 million, $7.5 million and $7.5
million for the years ended December 31, 2006, 2005 and 2004, respectively.
Minimum future obligations under capital and operating leases at December 31, 2006 are as follows:
2007 . . . . . . . . . . . . . . . . . . . . . . . . . . . . . . . . . . . . . . . . . . . . .
2008 . . . . . . . . . . . . . . . . . . . . . . . . . . . . . . . . . . . . . . . . . . . . .
2009 . . . . . . . . . . . . . . . . . . . . . . . . . . . . . . . . . . . . . . . . . . . . .
2010 . . . . . . . . . . . . . . . . . . . . . . . . . . . . . . . . . . . . . . . . . . . . .
2011 . . . . . . . . . . . . . . . . . . . . . . . . . . . . . . . . . . . . . . . . . . . . .
Thereafter . . . . . . . . . . . . . . . . . . . . . . . . . . . . . . . . . . . . . . . .
Capital Leases
Operating
Leases
$ 1,488,000
1,563,000
1,534,000
1,550,000
1,491,000
10,366,000
$ 8,396,000
6,426,000
3,833,000
2,975,000
1,652,000
140,000
17,992,000
$23,422,000
Less: Amount representing interest . . . . . . . . . . . . . . . . . . . . .
(5,160,000)
Less: Current portion . . . . . . . . . . . . . . . . . . . . . . . . . . . . . . . .
12,832,000
(823,000)
Long-term portion . . . . . . . . . . . . . . . . . . . . . . . . . . . . . . . . . .
$12,009,000
Licensing and Purchase Commitments
The Company has licensing agreements with companies, universities and individuals, some of which require
certain up-front payments. Royalty payments are required on net product sales ranging from one to 20 percent of
covered products. Several of these agreements have minimum royalty requirements. The accompanying
consolidated financial statements include accrued royalties relating to these agreements in the amount of $9.3
million and $9.0 million at December 31, 2006 and 2005, respectively. Royalty expense relating to these
agreements amounted to $24 million, $21.8 million and $20.9 million for the years ended December 31, 2006,
2005 and 2004, respectively. Royalty expense is primarily recorded in cost of sales, with a small portion recorded
as research and development expense depending on the use of the technology under license. Some of these
agreements also have minimum raw material purchase requirements and requirements to perform specific types
of research.
At December 31, 2006, the Company had commitments to purchase certain products, and for future
minimum guaranteed royalties. They are as follows:
2007 . . . . . . . . . . . . . . . . . . . . . . . . . . . . . . . . . . . . . . . . . . . . .
2008 . . . . . . . . . . . . . . . . . . . . . . . . . . . . . . . . . . . . . . . . . . . . .
2009 . . . . . . . . . . . . . . . . . . . . . . . . . . . . . . . . . . . . . . . . . . . . .
2010 . . . . . . . . . . . . . . . . . . . . . . . . . . . . . . . . . . . . . . . . . . . . .
2011 . . . . . . . . . . . . . . . . . . . . . . . . . . . . . . . . . . . . . . . . . . . . .
Thereafter . . . . . . . . . . . . . . . . . . . . . . . . . . . . . . . . . . . . . . . . .
F-37
Purchase
Commitments
Royalty
Commitments
$13,810,000
9,355,000
172,000
172,000
172,000
1,438,000
$ 635,000
413,000
413,000
413,000
413,000
888,000
$25,119,000
$3,175,000
QIAGEN N.V. AND SUBSIDIARIES
NOTES TO CONSOLIDATED FINANCIAL STATEMENTS—(Continued)
Contingent Consideration Commitments
Pursuant to the purchase agreements for certain acquisitions, as discussed more fully in Note 4, the
Company could be required to make additional contingent cash payments totaling up to $44.6 million based on
the achievement of certain revenue and operating results milestones as follows: $16.9 million in 2007, $6.7
million in 2008, $4.0 million in 2009, and $17.0 million payable in any 12 month period from now until 2010 if
revenues exceed a certain amount and $1.0 million payable upon the grant of certain patent rights.
Employment Agreements
Certain of our employment contracts contain provisions which guarantee the payments of certain amounts in
the event of a change in control, as defined, or if the executive is terminated for reasons other than cause, as
defined in those agreements. At December 31, 2006, the commitment under these agreements totaled $17.0
million.
Contingencies
From time to time, the Company may be party to legal proceedings incidental to its business. As of
December 31, 2006 and 2005, certain claims, suits or complaints arising out of the normal course of business
have been filed or were pending against the Company. Although it is not possible to predict the outcome of such
litigation, based on the facts known to the Company and after consultation with legal counsel, management
believes that such litigation will not have a material adverse effect on its financial position or results of
operations.
In the ordinary course of business, the Company warrants to customers that its products are free of defect
and will conform to published specifications. Generally, the applicable product warranty period is one year from
the date of delivery of the product to the customer or of site acceptance, if required. Additionally, the Company
typically provides limited warranties with respect to its services. From time to time, the Company also makes
other warranties to customers, including warranties that its products are manufactured in accordance with
applicable laws and not in violation of third party rights. The Company provides for estimated warranty costs at
the time of the product sale. The Company believes its warranty reserves as of December 31, 2006 and 2005
appropriately reflect the estimated cost of such warranty obligations.
19. Employee Benefit Plans
The Company maintains various benefit plans, including defined contribution and defined benefit plans. The
Company’s U.S. defined contribution plan is qualified under Section 401(k) of the Internal Revenue Code, and
covers substantially all U.S. employees. Participants may contribute a portion of their compensation not
exceeding a limit set annually by the Internal Revenue Service. This plan includes a provision for the Company
to match a portion of employee contributions. Total expense under the 401(k) plan was $881,000, $782,000 and
$683,000 for the years ended December 31, 2006, 2005 and 2004, respectively. The Company also has a defined
contribution plan which covers certain German executives. The Company makes matching contributions up to an
established maximum. In 2006, 2005 and 2004, matching contributions to the plan totaled approximately
$295,000, $82,000 and $82,000, respectively.
The Company has four defined benefit, non-contributory retirement or termination plans that cover certain
employees in Germany, France, Japan and Italy. These defined benefit plans provide benefits to covered
individuals satisfying certain age and service requirements. For certain plans, the Company calculates the vested
benefits to which employees are entitled if they separate immediately as of December 2006, in compliance with
F-38
QIAGEN N.V. AND SUBSIDIARIES
NOTES TO CONSOLIDATED FINANCIAL STATEMENTS—(Continued)
the Emerging Issues Task Force Issue No. 88-21, “Determination of Vested Benefit Pension Plan” (EITF 88-1).
The benefits accrued on a pro-rata basis during the employees’ employment period are based on the individuals’
salaries, adjusted for inflation. The liability under the defined benefit plans was $2.0 million at December 31,
2006 and $1.3 million at December 31, 2005. The adoption of SFAS No. 158 resulted in an increase to the
pension liability of $333,000 deferred taxes of $129,000, and an increase in the loss of accumulated other
comprehensive income of $204,000 in the consolidated balance sheet for the year ending December 31, 2006.
20. Related Party Transactions
From time to time, the Company has transactions with companies in which the Company holds an interest
all of which are individually and in aggregate immaterial except for certain transactions with the joint venture
PreAnalytiX, Operon Biotechnologies, Inc., QIAGEN Finance and QIAGEN Euro Finance.
The Company has a 50% interest in a joint venture company, PreAnalytiX GmbH, which is accounted for
under the equity method. During 2005, the loans of both joint venture partners were converted to additional
capital and each joint venture partner made an additional investment of approximately $2.9 million. As of
December 31, 2006 and 2005, the Company had accounts receivable from PreAnalytix of $20,000 and $359,000,
and accounts payable to PreAnalytix of $219,000 and $960,000, respectively.
In 2004, the Company sold a significant portion of its synthetic DNA business unit to Operon
Biotechnologies, Inc. (OBI) and agreed to provide certain transition services for a period of six months. The
Company also has a Manufacturing and Supply Agreement with OBI, wherein QIAGEN granted to OBI an
exclusive license to manufacture and supply certain RNA products to the Company. At December 31, 2005, the
Company had prepaid amounts of $2.0 million related to orders placed under this agreement. During the years
ended December 31, 2006 and 2005, the Company had sales to OBI of $1.1 million and $645,000, respectively.
As of December 31, 2006 and 2005, the Company had a loan receivable from OBI of $5.2 million and $6.3
million, accounts receivable from OBI of $236,000 and $35,000, and accounts payable to OBI of $898,000 and
$265,000, respectively.
The Company has a 100% interest in QIAGEN Finance (Luxembourg) S.A. (QIAGEN Finance) and
QIAGEN Euro Finance (Luxembourg) S.A. (Euro Finance), which were established for the purpose of issuing
convertible debt. As discussed in Note 6, QIAGEN Finance and Euro Finance are variable interest entities with
no primary beneficiary, thus they are not consolidated. Accordingly, the convertible debt is not included in the
consolidated statements of QIAGEN N.V., though QIAGEN N.V. does report the full obligation of the debt
through its liabilities to QIAGEN Finance and Euro Finance. As of December 31, 2006 and 2005, the Company
had loans payable to QIAGEN Finance of $150.0 million, amounts due to QIAGEN Finance of $3.4 million and
amounts receivable from QIAGEN Finance of $2.9 million and $2.4 million, respectively. As of December 31,
2006, the Company has a loan payable to Euro Finance of $300.0 million amounts due to Euro Finance of $4.7
million and amounts receivable from Euro Finance of $1.9 million.
In 2004, QIAGEN entered into a consulting agreement with Dr. Metin Colpan, the Company’s former Chief
Executive Officer and current Supervisory Board member, pursuant to which Dr. Colpan shall be paid a fee of
EUR 2,750 per day for consulting services, subject to adjustment. During 2006 and 2005 the Company paid
approximately $524,000 and $447,000, respectively, to Dr. Colpan for scientific consulting services under this
agreement.
21. Segment and Related Information
The Company manages its business based on the locations of its subsidiaries. Therefore, reportable
segments are based on the geographic locations of the subsidiaries. In 2006, considering recent acquisitions, the
Company revised its segment presentation. The Company’s reportable segments include the Company’s
F-39
QIAGEN N.V. AND SUBSIDIARIES
NOTES TO CONSOLIDATED FINANCIAL STATEMENTS—(Continued)
production, manufacturing and sales facilities located throughout the world. In addition, the Company’s
Corporate segment includes its holding company located in The Netherlands and two subsidiaries located in
Germany which operate only in a corporate support function. The reportable segments derive revenues from the
Company’s entire product and service offerings. It is not practicable to provide a detail of revenues for each
group of similar products and services offered by the Company.
The Company evaluates performance based on several factors, of which the primary financial measure is
operating income. The accounting policies of the segments are the same as those described in the summary of
significant accounting policies in Note 2 of the Notes to Consolidated Financial Statements.
Summarized financial information concerning the Company’s reportable segments is shown in the following
tables:
Net Sales
North America . . . . . . . . . . . . . . . . . . . . . . . . . . .
Germany . . . . . . . . . . . . . . . . . . . . . . . . . . . . . . .
Switzerland . . . . . . . . . . . . . . . . . . . . . . . . . . . . .
Asia . . . . . . . . . . . . . . . . . . . . . . . . . . . . . . . . . . .
Rest of World . . . . . . . . . . . . . . . . . . . . . . . . . . .
Corporate . . . . . . . . . . . . . . . . . . . . . . . . . . . . . . .
Subtotal . . . . . . . . . . . . . . . . . . . . . . . . . . . . . . . .
Intersegment Elimination . . . . . . . . . . . . . . . . . .
Total . . . . . . . . . . . . . . . . . . . . . . . . . .
2006
2005
2004
$ 318,865,000
220,325,000
40,044,000
49,875,000
109,025,000
525,000
$ 285,242,000
187,381,000
36,957,000
35,266,000
88,924,000
985,000
$ 284,393,000
163,841,000
37,936,000
41,563,000
74,117,000
65,000
738,659,000
(272,881,000)
$ 465,778,000
634,755,000
(236,360,000)
$ 398,395,000
601,915,000
(221,286,000)
$ 380,629,000
Net sales are attributed to countries based on the location of the Company’s subsidiary. During 2006, 2005
and 2004, no single customer represented more than ten percent of consolidated net sales.
2006
2005
2004
Intersegment Sales
North America . . . . . . . . . . . . . . . . . . . . . . . . . . .
Germany . . . . . . . . . . . . . . . . . . . . . . . . . . . . . . .
Switzerland . . . . . . . . . . . . . . . . . . . . . . . . . . . . .
Asia . . . . . . . . . . . . . . . . . . . . . . . . . . . . . . . . . . .
Rest of World . . . . . . . . . . . . . . . . . . . . . . . . . . .
Corporate . . . . . . . . . . . . . . . . . . . . . . . . . . . . . . .
$(115,924,000)
(129,438,000)
(26,518,000)
(784,000)
(188,000)
(29,000)
$(103,357,000)
(107,882,000)
(25,058,000)
—
(15,000)
(48,000)
$(103,739,000)
(90,220,000)
(24,592,000)
(2,596,000)
(74,000)
(65,000)
Total . . . . . . . . . . . . . . . . . . . . . . . . . .
$(272,881,000)
$(236,360,000)
$(221,286,000)
F-40
QIAGEN N.V. AND SUBSIDIARIES
NOTES TO CONSOLIDATED FINANCIAL STATEMENTS—(Continued)
All intersegment sales are accounted for by a formula based on local list prices and manufacturing costs and
eliminated in consolidation.
2006
2005
2004
Operating Income (Loss)
North America . . . . . . . . . . . . . . . . . . . . . . . . . . . . . . .
Germany . . . . . . . . . . . . . . . . . . . . . . . . . . . . . . . . . . .
Switzerland . . . . . . . . . . . . . . . . . . . . . . . . . . . . . . . . .
Asia . . . . . . . . . . . . . . . . . . . . . . . . . . . . . . . . . . . . . . .
Rest of World . . . . . . . . . . . . . . . . . . . . . . . . . . . . . . .
Corporate . . . . . . . . . . . . . . . . . . . . . . . . . . . . . . . . . . .
$ 31,414,000
53,956,000
(1,558,000)
8,302,000
15,594,000
(6,550,000)
$36,095,000
43,279,000
(305,000)
7,182,000
14,136,000
(3,959,000)
$39,381,000
28,668,000
1,492,000
8,206,000
10,485,000
(3,455,000)
Subtotal . . . . . . . . . . . . . . . . . . . . . . . . . . . . . . . . . . . .
Intersegment Elimination . . . . . . . . . . . . . . . . . . . . . .
101,158,000
(557,000)
96,428,000
(1,591,000)
84,777,000
(637,000)
Total . . . . . . . . . . . . . . . . . . . . . . . . . . . . . .
$100,601,000
$94,837,000
$84,140,000
The Corporate component of operating income (loss) is primarily general and administrative expenses. The
intersegment elimination represents primarily the elimination of intercompany profit.
2006
2005
2004
Depreciation and Amortization
North America . . . . . . . . . . . . . . . . . . . . . . . . . . . . . . . .
Germany . . . . . . . . . . . . . . . . . . . . . . . . . . . . . . . . . . . .
Switzerland . . . . . . . . . . . . . . . . . . . . . . . . . . . . . . . . . .
Asia . . . . . . . . . . . . . . . . . . . . . . . . . . . . . . . . . . . . . . . .
Rest of World . . . . . . . . . . . . . . . . . . . . . . . . . . . . . . . .
Corporate . . . . . . . . . . . . . . . . . . . . . . . . . . . . . . . . . . . .
$10,074,000
14,070,000
1,638,000
1,626,000
1,850,000
780,000
$ 6,538,000
13,829,000
1,753,000
231,000
1,641,000
963,000
$ 7,522,000
11,331,000
1,680,000
393,000
1,431,000
604,000
Total . . . . . . . . . . . . . . . . . . . . . . . . . . . . . . .
$30,038,000
$24,955,000
$22,961,000
2006
Assets
North America . . . . . . . . . . . . . . . . . . . . . . . . . . . . . . . . . . . . . . .
Germany . . . . . . . . . . . . . . . . . . . . . . . . . . . . . . . . . . . . . . . . . . . .
Switzerland . . . . . . . . . . . . . . . . . . . . . . . . . . . . . . . . . . . . . . . . .
Asia . . . . . . . . . . . . . . . . . . . . . . . . . . . . . . . . . . . . . . . . . . . . . . .
Rest of World . . . . . . . . . . . . . . . . . . . . . . . . . . . . . . . . . . . . . . . .
Corporate . . . . . . . . . . . . . . . . . . . . . . . . . . . . . . . . . . . . . . . . . . .
Subtotal . . . . . . . . . . . . . . . . . . . . . . . . . . . . . . . . . . . . . . . . . . . .
Intersegment Elimination . . . . . . . . . . . . . . . . . . . . . . . . . . . . . . .
Total . . . . . . . . . . . . . . . . . . . . . . . . . . . . . . . . . . . . . . .
$
313,599,000
352,173,000
93,134,000
71,580,000
103,205,000
1,360,732,000
2,294,423,000
(1,082,411,000)
$ 1,212,012,000
2005
$ 296,243,000
360,803,000
77,916,000
26,181,000
68,606,000
254,493,000
1,084,242,000
(318,944,000)
$ 765,298,000
Assets of Corporate include cash and cash equivalents, investments, prepaid assets and certain intangibles.
The intersegment elimination represents intercompany investments and advances.
F-41
QIAGEN N.V. AND SUBSIDIARIES
NOTES TO CONSOLIDATED FINANCIAL STATEMENTS—(Continued)
At December 31, 2006 and 2005, for Switzerland, the net investment in equity method investees was
$2,623,000 and $883,000, respectively. The Netherlands had a net investment in equity method investees of
$963,000 and $677,000 as of December 31, 2006 and 2005, respectively.
2006
2005
2004
Capital Expenditures
North America . . . . . . . . . . . . . . . . . . . . . . . . . . . . . . . .
Germany . . . . . . . . . . . . . . . . . . . . . . . . . . . . . . . . . . . .
Switzerland . . . . . . . . . . . . . . . . . . . . . . . . . . . . . . . . . .
Asia . . . . . . . . . . . . . . . . . . . . . . . . . . . . . . . . . . . . . . . .
Rest of World . . . . . . . . . . . . . . . . . . . . . . . . . . . . . . . .
Corporate . . . . . . . . . . . . . . . . . . . . . . . . . . . . . . . . . . . .
$ 4,206,000
20,638,000
2,211,000
804,000
1,130,000
6,000
$ 3,258,000
8,093,000
1,468,000
232,000
671,000
6,000
$ 2,592,000
8,048,000
1,040,000
191,000
722,000
28,000
Total . . . . . . . . . . . . . . . . . . . . . . . . . . . . . . .
$28,995,000
$13,728,000
$12,621,000
2006
2005
Long-Lived Assets
North America . . . . . . . . . . . . . . . . . . . . . . . . . . . . . . . . . . . . . . . . . . .
Germany . . . . . . . . . . . . . . . . . . . . . . . . . . . . . . . . . . . . . . . . . . . . . . .
Switzerland . . . . . . . . . . . . . . . . . . . . . . . . . . . . . . . . . . . . . . . . . . . . .
Asia . . . . . . . . . . . . . . . . . . . . . . . . . . . . . . . . . . . . . . . . . . . . . . . . . . .
Rest of World . . . . . . . . . . . . . . . . . . . . . . . . . . . . . . . . . . . . . . . . . . .
Corporate . . . . . . . . . . . . . . . . . . . . . . . . . . . . . . . . . . . . . . . . . . . . . . .
$189,680,000
245,818,000
9,293,000
30,627,000
38,843,000
12,151,000
$130,077,000
201,879,000
8,884,000
4,434,000
32,111,000
11,310,000
Total . . . . . . . . . . . . . . . . . . . . . . . . . . . . . . . . . . . . . . . . . .
$526,412,000
$388,695,000
F-42
SCHEDULE II
QIAGEN N.V. AND SUBSIDIARIES
SCHEDULE II—VALUATION AND QUALIFYING ACCOUNTS
FOR THE YEARS ENDED DECEMBER 31, 2006, 2005 AND 2004
Balance at
Beginning of
Year
Foreign
Exchange
and Other
Provision
Charged to
Expense
Write-Offs
Balance at
End of Year
Year Ended December 31, 2004:
Allowance for doubtful accounts . . . . . . . .
$3,046,000
$ (144,000) $128,000
$(383,000) $2,647,000
Year Ended December 31, 2005:
Allowance for doubtful accounts . . . . . . . .
$2,647,000
$ 307,000
$ 54,000
$(620,000) $2,388,000
Year Ended December 31, 2006:
Allowance for doubtful accounts . . . . . . . .
$2,388,000
$1,734,000
$378,000
$(333,000) $4,167,000
S-1
Exhibit 8.1
LIST OF SUBSIDIARIES
The following is a list of the Registrant’s subsidiaries as of December 31, 2006, other than certain subsidiaries that did not in the
aggregate constitute a significant subsidiary.
Company Name
QIAGEN BV
QIAGEN Deutschland Holding GmbH
QIAGEN GmbH
QIAGEN Finance (Deutschland) GmbH
QIAGEN Hamburg GmbH
QIAGEN, Inc. (Canada)
QIAGEN, Inc. (USA)
QIAGEN Instruments AG
QIAGEN KK
QIAGEN Ltd.
QIAGEN North American Holding Inc.
QIAGEN NV
QIAGEN Pty. Ltd.
QIAGEN S.A.
QIAGEN Sciences, Inc.
QIAGEN Shared Services, Inc.
QIAGEN SpA
QIAGEN Vertriebsges. mbH
Genaco Biomedical Products, Inc.
Gentra Systems, Inc.
Nextal Biotechnology Inc.
Shenzhen PG Biotech Co. Ltd.
Jurisdiction of
Incorporation
The Netherlands
Germany
Germany
Germany
Germany
Canada
California
Switzerland
Japan
UK
California
Netherlands
Australia
France
Maryland
Maryland
Italy
Austria
USA
USA
Canada
China
Exhibit 12.1
CERTIFICATION UNDER SECTION 302
I, Peer M. Schatz, certify that:
1. I have reviewed this annual report on Form 20-F of QIAGEN N.V;
2. Based on my knowledge, this report does not contain any untrue statement of a material fact or omit to state a material fact
necessary to make the statements made, in light of the circumstances under which such statements were made, not misleading with
respect to the period covered by this report;
3. Based on my knowledge, the financial statements, and other financial information included in this report, fairly present in all
material respects the financial condition, results of operations and cash flows of the company as of, and for, the periods presented in
this report;
4. The company’s other certifying officer(s) and I are responsible for establishing and maintaining disclosure controls and procedures
(as defined in Exchange Act Rules 13a-15(e) and 15d-15(e)) and internal control over financial reporting (as defined in Exchange Act
Rules 13a-15(f) and 15d-15(f)) for the company and have:
(a) Designed such disclosure controls and procedures, or caused such disclosure controls and procedures to be designed under
our supervision, to ensure that material information relating to the company, including its consolidated subsidiaries, is made
known to us by others within those entities, particularly during the period in which this report is being prepared;
(b) Designed such internal control over financial reporting, or caused such internal control over financial reporting to be
designed under our supervision, to provide reasonable assurance regarding the reliability of financial reporting and the
preparation of financial statements for external purposes in accordance with generally accepted accounting principles;
(c) Evaluated the effectiveness of the company’s disclosure controls and procedures and presented in this report our conclusions
about the effectiveness of the disclosure controls and procedures, as of the end of the period covered by this report based on
such evaluation; and
(d) Disclosed in this report any change in the company’s internal control over financial reporting that occurred during the period
covered by the annual report that has materially affected, or is reasonably likely to materially affect, the company’s internal
control over financial reporting; and
5. The company’s other certifying officer(s) and I have disclosed, based on our most recent evaluation of internal control over
financial reporting, to the company’s auditors and the audit committee of the company’s board of directors (or persons performing the
equivalent functions):
(a) All significant deficiencies and material weaknesses in the design or operation of internal control over financial reporting
which are reasonably likely to adversely affect the company’s ability to record, process, summarize and report financial
information; and
(b) Any fraud, whether or not material, that involves management or other employees who have a significant role in the
company’s internal control over financial reporting.
Date: March 30, 2007
/s/ Peer M. Schatz
Peer M. Schatz
Managing Director and Chief Executive Officer
Exhibit 12.2
CERTIFICATION UNDER SECTION 302
I, Roland Sackers, certify that:
1. I have reviewed this annual report on Form 20-F of QIAGEN N.V;
2. Based on my knowledge, this report does not contain any untrue statement of a material fact or omit to state a material fact
necessary to make the statements made, in light of the circumstances under which such statements were made, not misleading with
respect to the period covered by this report;
3. Based on my knowledge, the financial statements, and other financial information included in this report, fairly present in all
material respects the financial condition, results of operations and cash flows of the company as of, and for, the periods presented in
this report;
4. The company’s other certifying officer(s) and I are responsible for establishing and maintaining disclosure controls and procedures
(as defined in Exchange Act Rules 13a-15(e) and 15d-15(e)) and internal control over financial reporting (as defined in Exchange Act
Rules 13a-15(f) and 15d-15(f)) for the company and have:
(a) Designed such disclosure controls and procedures, or caused such disclosure controls and procedures to be designed under
our supervision, to ensure that material information relating to the company, including its consolidated subsidiaries, is made
known to us by others within those entities, particularly during the period in which this report is being prepared;
(b) Designed such internal control over financial reporting, or caused such internal control over financial reporting to be
designed under our supervision, to provide reasonable assurance regarding the reliability of financial reporting and the
preparation of financial statements for external purposes in accordance with generally accepted accounting principles;
(c) Evaluated the effectiveness of the company’s disclosure controls and procedures and presented in this report our conclusions
about the effectiveness of the disclosure controls and procedures, as of the end of the period covered by this report based on
such evaluation; and
(d) Disclosed in this report any change in the company’s internal control over financial reporting that occurred during the period
covered by the annual report that has materially affected, or is reasonably likely to materially affect, the company’s internal
control over financial reporting; and
5. The company’s other certifying officer(s) and I have disclosed, based on our most recent evaluation of internal control over
financial reporting, to the company’s auditors and the audit committee of the company’s board of directors (or persons performing the
equivalent functions):
(a) All significant deficiencies and material weaknesses in the design or operation of internal control over financial reporting
which are reasonably likely to adversely affect the company’s ability to record, process, summarize and report financial
information; and
(b) Any fraud, whether or not material, that involves management or other employees who have a significant role in the
company’s internal control over financial reporting.
Date: March 30, 2007
/s/ Roland Sackers
Roland Sackers
Managing Director and Chief Financial Officer
Exhibit 13.1
CERTIFICATIONS UNDER SECTION 906
Pursuant to section 906 of the Sarbanes-Oxley Act of 2002 (subsections (a) and (b) of section 1350, chapter 63 of title 18,
United States Code), each of the undersigned officers of QIAGEN N.V., does hereby certify, to such officer’s knowledge, that:
The Annual Report for the year ended December 31, 2006 (the “Form 20-F”) of the Company fully complies with the
requirements of Section 13(a) or 15(d) of the Securities Exchange Act of 1934, and the information contained in the Form 20-F fairly
presents, in all material respects, the financial condition and results of operations of the Company.
Dated: March 30, 2007
/s/ Peer M. Schatz
Peer M. Schatz
Managing Director and Chief Executive Officer
Dated: March 30, 2007
/s/ Roland Sackers
Roland Sackers
Managing Director and Chief Financial Officer
A signed original of this written statement required by Section 906 has been provided to the Company and will be retained by the
Company and furnished to the Securities and Exchange Commission or its staff upon request.
Exhibit 15.1
CONSENT OF INDEPENDENT REGISTERED PUBLIC ACCOUNTING FIRM
We consent to the incorporation by reference in the Registration Statements (Form S-8 Nos. 333-7166, 333-107491, 333-12372 and
333-127393) pertaining to the QIAGEN N.V. 1996 Employee, Director and Consultant Stock Option Plan and the QIAGEN N.V.
Amended and Restated 2005 Stock Plan of our reports dated March 30, 2007, with respect to the consolidated financial statements
and schedule of QIAGEN N.V., QIAGEN N.V.’s assessment of the effectiveness of internal control over financial reporting and the
effectiveness of internal control over financial reporting of QIAGEN N.V., included in the Annual Report (Form 20-F) for the year
ended December 31, 2006.
/s/ ERNST & YOUNG LLP
McLean, Virginia
March 30, 2007
The Form 20-F
Disclaimers and Trademarks
Registered names, trademarks, etc. used in this document,
TRADEMARKS
even when not specifically marked as such, are not to be
Our name together with our logo is registered as a trade-
considered unprotected by law.
mark in the United States and a number of other countries:
QIAGEN ®.
DISCLAIMER
In this annual report, QIAGEN is using the term molecular
Other trademarks registered in the United States and in
diagnostics. The use of this term is in reference to certain
other countries include, inter alia: QIAexpress ®, QIAwell ®,
countries, such as the United States, limited to products sub-
QIAEX ®, QIA prep ®, QIA amp ®, QIA quick ®, Oligotex ®,
ject to regulatory framework. Current QIAGEN molecular
RN easy ®, BIOROBOT ®, ENDOFREE ®, R.E.A.L . ®, PolyFect ®,
diagnostics products are 34 EU CE IVD assays, six EU CE
SuperFect ®, DN easy ®, UltraFect ®, TurboFilter ®, HotStarTaq ®,
IVD sample preparation products, one 510k PAX RNA pro-
EFFECTENE ®, QIA ®, DyeEx ®, Omniscript ®, Sensiscript ®,
duct, nine China SFDA IVD assays, and 98 general purpose
HiSpeed ®, Targetene ®, TransMessenger ®, MagAttract ®,
reagents.
DirectPrep ®, InhibitEX ®, DoubleTag ®, QuantiScript ®,
QIAGEN Instruments (BioRobot product line, QIAcube,
FlexiGene ®, QuantiTect ®, DNA protect ®, RNA protect ®,
UltraSens ®, pAlliance ®, MinElute ®, EverGene ®, ProofStart ®,
The Form 20-F is an integral part of this Annual Report.
BioSprint) are intended for laboratory use. No claim or
LiquiChip ®, CryoCell ®, LabelStar ®, EasyXpress ®,
representation is intended for its use to provide information
RNAiFect ®, and BioSprint ®.
for the diagnosis, prevention, or treatment of a disease.
Registered trademarks in countries outside the United States
It contains detailed financial information on the Company
as well as other information, including information on the
The BioRobot MD x DSP system is intended for in-vitro
include: QIABRAN E™, ProofTaq™, Easylabel™,
markets and risks and on QIAGEN‘s directors, management
diagnostic use in Europe.
BioSprint™, AllPrep™, Qproteome™, FastLane™,
GeneGlobe™, LyseBlue™, CompactPrep™, TurboCapture™,
and advisors. It also contains a summary of the Company’s
Code of Ethics and descriptions on securities other than
The BioRobot MD x DSP system is not available in all
equity securities, information on controls and procedures.
countries; please inquire.
If the Form 20-F insert is missing from this Annual Report,
siRNA technology licensed to QIAGEN is covered by
it can be requested from the Company or can be down-
various patent applications, owned by the Massachusetts
CoralLoad™, EpiTect™, NEXTAL™, and EASYXTAL™.
This Annual Report may also contain trade names or
loaded from the Company’s homepage www.qiagen.com
Institute of Technology, the Carnegie Institute of Washington,
in the Investor Relations section.
Alnylam Corporation, and others.
trademarks of companies other than QIAGEN.
© 2007 QIAGEN, all rights reserved.
This Annual Report, in addition to historical information,
Multiplex PCR Kits: Certain specific embodiments of the
contains certain forward-looking statements made pursuant
process of multiplex PCR may be covered by patents of
to the Private Securities Litigation Reform Act of 1995. Such
third parties in certain countries and may require a license.
statements may involve significant risks and uncertainties
and actual results could differ materially from those ex-
Qproteome GlycoArray Analysis technology is subject
pressed or implied herein. Please refer to the section en-
to the proprietary rights of Procognia Ltd. and sold under
titled “Risk Factors” under Item 3 of our Form 20-F for the
license.
year ended December 31, 2006, which accompanies and
is part of this Annual Report, for a discussion related to forward-looking statements contained in this Annual Report.
Glossary
AMINO ACIDS The ‘building blocks’ (subunits) of proteins.
GENOME The entire genetic information of an organism.
AVIAN FLU “Avian influenza” (also known as bird flu, avi-
In most organisms consists of DNA, in some viruses can
consist of RNA.
an flu, influenza virus A flu, type A flu, genus A flu) is
caused by an influenza A virus (subtype H5N1). It is hosted
by birds, but may infect several species of mammals.
BIOMARKER Refers to e.g. proteins which indicate a rele-
vant biological condition (e.g., disease or predisposition to
a disease).
BIOMEDICAL RESEARCH Involves thorough investigation of
any matter related to the domain of living or biological systems. Usually biomedical denotes a greater stress on problems related to human health and diseases.
GENOMIC DNA A representative sample of all the DNA
in a genome.
GENOMICS The scientific study of genes and their role in
an organism‘s structure, growth, health, disease (and / or
resistance to disease, etc.).
GENOTYPING Genetic fingerprinting, DNA testing, DNA
typing, and DNA profiling - Study or testing of variations in
the genetic information among different individuals.
HIGH-THROUGHPUT SCREENING Testing of large numbers
CE MARK The CE mark (officially CE marking) is a manda-
of samples per day, often simultaneously.
tory safety mark on many products placed on the single
market in the European Economic Area (EEA).
MASS SPECTROMETRY Analytical technique used to
CLINICAL TRIAL Research studies. The most commonly
performed clinical trials evaluate new drugs, medical devices, biologics, or other interventions to patients in strictly
scientifically controlled settings, and are required for Food
and Drug Administration approval of new therapies.
DNA Deoxyribonucleic acid. Macromolecule with a double
helix structure built up from the four bases adenine, guanine,
cytosine, and thymine. DNA transmits genetic information.
DNA METHYLATION Type of chemical modification of DNA
that can be inherited without changing the DNA sequence.
DNA SEQUENCING The process used to obtain the sequen-
tial arrangement of nucleotides in the DNA.
DRUG METABOLISM Drug metabolism is the chemical
alteration of a drug by the body.
DRUG TARGET Target for clinically relevant or therapeutic
molecules used to fight genetic disorders and disease.
EPIGENOMICS The genome-wide study of the distribution
of methylated and unmethylated nucleoside residues within
the genome.
FDA The Food and Drug Administration (FDA) is an agency
of the United States Department of Health and Human
Services and is responsible for regulating food, dietary
supplements, drugs, biological medical products, blood
products, medical devices, radiation-emitting devices,
veterinary products, and cosmetics in the United States.
FUNCTIONAL GENOMICS Study of the functions of genes.
GENE EXPRESSION Transfer of genetic information to its
active form, usually from DNA via RNA (transcription) into
protein (translation).
GENE EXPRESSION PROFILING Determines which genetic
information has been transferred to its active form.
GENE INTERACTION The collaboration of several different
measure the composition of a sample by generating a mass
spectrum representing the masses of sample components.
MESSENGER RNA (mRNA) RNA molecules that acts as
messenger of the genetic information encoded by a gene
(DNA) produced by the process of transcription. Serves as
the template for protein synthesis during translation and
frequently has a tail of adenine-residues (poly-A+ mRNA).
METABOLIC ENZYME A protein that catalyzes biochemical
reactions in processes for the synthesis, modification, and
breakdown of molecules (e.g. drugs) within a living organism. The metabolic enzyme pattern differs within individuals and provides a basis for the research of individual drug
responses in patients.
METABOLIC MARKERS A molecular marker associated
with a metabolic function.
METABOLIC PROFILING The measurement of biochemical
intermediates within a tissue in order to describe the functioning of metabolic pathways.
METABOLISM The entire set of enzyme-catalyzed transfor-
mations of organic nutrient molecules (to sustain life) in living cells. Conversion of food and water into nutrients that
can be used by the body’s cells, and the use of those nutrients by those cells (to sustain life, grow, etc.).
METABOLOMICS The scientific study of an organism‘s me-
tabolic response to an environmental stimulus or a genetic
modification.
MICROARRAY Array of many macromolecules spotted onto a solid phase to allow interactions with target molecules
in solution. For example, DNA oligonucleotides spotted onto a chip interact with target RNA molecules that hybridize
to reveal the presence of certain species of RNA molecules
in a mixed population.
MICROFLUIDIC ASSAYS Assays performed on an extremely
small scale using very small flow systems of liquids.
genes in the production of one phenotypic character.
MOLECULAR BIOLOGY The study of life processes at the
GENE SILENCING Repression of gene expression – espe-
molecular level, typically through the study of nucleic acids
and proteins.
cially using the recently discovered mechanism of RNAi
(RNA interference). siRNA duplexes can be designed to target and repress expression of specific genes.
MOLECULAR DIAGNOSTICS The use of DNA, RNA, and
proteins to test for specific states of health or disease.
GENE THERAPY Use of DNA to replace or modify the
NUCLEIC ACID Single or double-stranded polynucleotide.
function of faulty genes in a living organism in order to cure or prevent disease and genetic disorders.
RNA or DNA.
GENETIC MODIFICATION (GM) Genetic engineering, and
containing DNA and the nucleolus.
the now-deprecated gene splicing are terms for the process
of manipulating genes, usually outside the organism‘s normal reproductive process.
NUCLEUS Small, membrane-bound compartment of cells
NUTRIGENOMICS The application of genetic information
(genomics, proteomics and metabolomics) to human nutrition, especially the relationship between nutrition and
health.
PATHOGEN A pathogen or infectious agent is a biological
agent that causes disease or illness to its host.
PCR Polymerase chain reaction. The sequence-specific amplification of DNA molecules using heat-stable polymerase
enzymes.
PHARMACOGENETICS The study of the association between genetics and response to drug therapy to select “the
right medicine for the right patient”.
PHARMACOGENOMICS Refers to the entire spectrum of
genes that determine drug behavior and sensitivity. By analyzing the whole genome, pharmacogenomics is concerned
with genetic effects on drugs themselves and with the genetic variances that contribute to the variable effects of drugs
in different individuals.
PHARMACOKINETICS The study of the pharmacological
effects between drugs and living structures (e.g., tissues,
organs).
POLYMERASES An enzyme that catalyzes the production
of a nucleic acid strand by using an existing strand as a
template – used in PCR and RT-PCR.
PROTEIN EXPRESSION The translation and post-trans-
lational processing of proteins.
PROTEOME The entire set of proteins that an organism can
produce.
PROTEOMICS The scientific study of an organism‘s proteins
and their role in an organism‘s structure, growth, health,
disease (and/or the organism‘s resistance to disease, etc.).
REAL-TIME RT-PCR Reverse-transcriptase polymerase chain
reaction in real time. A technique which converts RNA
molecules into DNA molecules and then monitors their
amplification by PCR. Often used to measure the amount
of a specific RNA molecule in a sample.
RNA Ribonucleic acid. Includes many types of biologically
relevant molecules, especially mRNA (messenger RNA)
which is copied from DNA and encodes proteins.
RNAi RNA Interference, is one methodology to cause gene
silencing.
RT-PCR Reverse-transcriptase polymerase chain reaction.
A technique that transcribes RNA molecules into DNA molecules, which are then amplified by PCR.
SARS Severe acute respiratory syndrome is an atypical
pneumonia, caused by the SARS coronavirus (SARS CoV),
a novel coronavirus.
siRNA Short interfering RNA, a specific short sequences of
double-stranded RNA (dsRNA) of less than 30 base pairs.
SYSTEMS BIOLOGY Combination of analytical results of
various analytes to understand basic biological principles
and interactions on a cellular level.
THERANOSTICS The developments of diagnostic tests that
can identify which patients are most suited for a drug and
provide feedback on how well the drug is working.
TOXICOGENOMICS A form of analysis for toxicology and
toxin-determination analogous to DNA-testing in the forensic identification of individuals.
TRANSFECTION Introducing DNA into eukaryotic cells,
such as animal cells.
TRANSLATIONAL MEDICINE Translational medicine is a
branch of medical research that attempts to more directly
connect basic research to patient care.
X-RAY CRYSTALLOGRAPHY Technique in which the
pattern produced by the diffraction of X-rays through the
closely spaced lattice of atoms in a crystal is recorded and
then analyzed to reveal the nature of that lattice.
QIAGEN Global Contacts
Amsterdam
Düsseldorf
Venlo
Hamburg
Stockholm
London
Zurich
Vienna
Paris
Milan
Montreal
Beijing
Toronto
Tokyo
Seoul
Valencia
Shenzhen
Huntsville
Kuala Lumpur
Germantown
Singapore
Melbourne
QIAGEN Companies
QIAGEN Distributors
and Importers
The Netherlands
QIAGEN N.V.
Spoorstraat 50
5911 K J Venlo
Phone (+31) 77-320-8400
Fax
(+31) 77-320-8409
QIAGEN Benelux B.V.
Spoorstraat 50
5911 K J Venlo
Phone (+31) 77-327-0757
Fax
(+31) 77-327-0758
Austria
QIAGEN Vertriebs GmbH
Löwengasse 47/6
1030 Vienna
Phone (+43) 1-710-1500
Fax
(+43) 1-710-1500-10
France
QIAGEN S.A.
3 avenue du Canada
LP 809
91974 Courtaboeuf Cedex
Phone (+33) 1-60-920-920
Fax
(+33) 1-60-920-925
Germany
QIAGEN GmbH
QIAGEN Strasse 1
40724 Hilden
Phone (+49) 2103-29-0
Fax
(+49) 2103-29-21777
QIAGEN Hamburg GmbH
Königstrasse 4a
22767 Hamburg
Phone (+49) 40-413647-00
Fax
(+49) 40-413647-10
Australia
QIAGEN Pty Ltd
PO Box 641
Doncaster
Victoria 3108
Phone (+61) 3-9840-9800
Fax
(+61) 3-9840-9840
Italy
QIAGEN S.p.A.
Via Grosio, 10/10
20151 Milan
Phone (+39) 2-33-43-04-11
Fax
(+39) 2-33-43-04-26
Canada
QIAGEN, Inc.
2800 Argentia Road, Unit 7
Mississauga,
Ontario L5N 8L2
Phone (+1) 800-572-9613
Fax
(+1) 800-713-5951
Japan
QIAGEN K.K.
Forefront Tower II
13-1, Kachidoki 3 Chome
Chuo-ku, Tokyo 104-0054
Phone (+81) 3-5547-0811
Fax
(+81) 3-5547-0818
Nextal Biotechnologies
1751 Richardson Street, Suite 6101
Montreal, Quebec, H3K 1G6
Phone (+1) 514-849-8057
Fax
(+1) 514-849-4588
Malaysia
QIAGEN Sdn. Bhd.
Level 13, Wisma E&C
No. 2 Lorong Dungun Kiri
Damansara Heights
50490 Kuala Lumpur
Phone (+603) 2094-5170
Fax
(+603) 2094-5171
Norway
QIAGEN AS
Frysjaveien 40
0884 Oslo
Phone (+47) 23-00-53-53
Fax
(+47) 23-00-53-50
P.R. China
Tiangen Biotech (Beijing) Co., Ltd.
4th Floor, Beilu Building
35 Chengfu Road
Haidian District
Beijing 100083
Phone (+86) 10-8262-9288
Fax
(+86) 10-8261-3663
PG Biotech Co., Ltd.
F6, R3-B
High-Tech Industrial Park
Shen Nan Avenue
Shenzhen 518057
Phone (+86) 755-2650-4888
Fax
(+86) 755-2673-3666
Singapore
Research Biolabs Pte Ltd
73 Ayer Rajah Crescent #04-05
Ayer Rajah Industrial Estate
Singapore 139952
Phone (+65) 6777-5366
Fax
(+65) 6778-5177
South Korea
QIAGEN Korea Ltd.
#1012 C Bldg.
Woolim-Lions Valley
371-28 Gasandong
Gumchungu
Seoul 153-786
Phone (+82) 1544-7145
Fax
(+82) 1544-7146
Sweden
QIAGEN AB
Frösundaviks Allé 15
16970 Solna
Phone (+46) 8-5090-4682
Fax
(+46) 8-655-2610
Switzerland
QIAGEN AG
QIAGEN Instruments AG
Garstligweg 8
8634 Hombrechtikon
Phone (+41) 55-254-21-11
Fax
(+41) 55-254-21-00
United Kingdom
QIAGEN Ltd.
QIAGEN House
Fleming Way
Crawley
West Sussex, RH10 9NQ
Phone (+44) 1293-422-900
Fax
(+44) 1293-422-922
USA
QIAGEN North American Holdings, Inc.
19300 Germantown Rd
Germantown, MD 20874
Phone (+1) 240-686-7774
Fax
(+1) 240-686-7775
QIAGEN, Inc.
27220 Turnberry Lane
Suite 200
Valencia, CA 91355-1106
Phone (+1) 800-426-8157
Fax
(+1) 800-718-2056
QIAGEN Sciences, Inc.
19300 Germantown Rd
Germantown, MD 20874
Phone (+1) 240-686-7700
Fax
(+1) 240-686-1618
Genaco Biomedical Products, Inc.
2707 Artie Street
Building 100, Suite 20
Huntsville, AL 35805
Phone (+1) 256-704-4875
Fax
(+1) 256-425-0053
www.qiagen.com


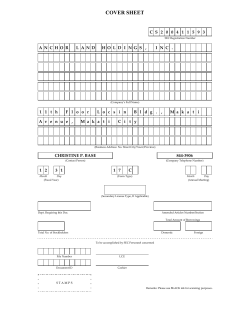

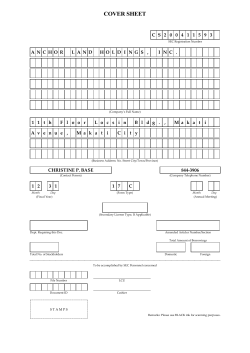
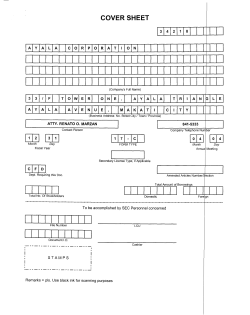


© Copyright 2026