
Document 280131
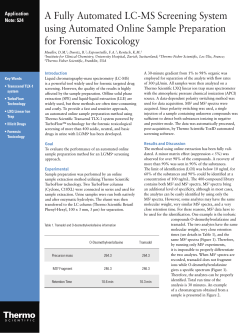
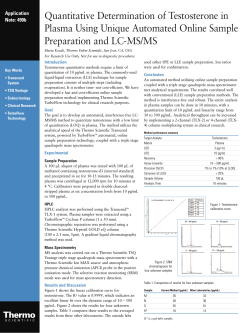
Detection of Mycotoxins in Corn Meal Extract Using Automated Online Sample Preparation with Liquid Chromatography-Tandem
Mass Spectrometry
Yang Shi, Catherine Lafontaine, Timothy B. Haney, François A. Espourteille; Thermo Fisher Scientific, Franklin, MA, USA
The LC method schematic views from Thermo Scientific Aria OS software are shown in
Figures 2 and 3.
Overview
LC/MS Methods using positive ESI mode (Method A):
Purpose: To develop a rapid and sensitive automated online sample preparation
LC-MS/MS method to detect and quantify multiple mycotoxins in corn meal extract and
also to shorten assay time and increase throughput.
TurboFlow Method Parameters
Column: TurboFlow Cyclone-P column 0.5 x 50 mm
Injection Volume: 10 μL
Solvent A: 10 mM ammonium acetate in water
Solvent B: 0.1% formic acid in acetonitrile (ACN)
Solvent C: 1:1:1 ACN: isopropanol: acetone (v:v:v) with 0.3% formic acid
Methods: Automated online sample preparation using Thermo Scientific TurboFlow
technology coupled with the Thermo Scientific TSQ Vantage triple stage quadrupole
mass spectrometer.
Results: Two quick, automated online sample preparation LC-MS/MS methods have
been developed that are sensitive enough to detect mycotoxins in corn meal extract.
Introduction
Since the discovery of aflatoxin in 1960, mycotoxins research has received
considerable attention. Mycotoxins are a group of naturally occurring toxic substances
produced by certain molds, which can contaminate food and feed. The inhalation or
absorption of mycotoxins into the body may cause sickness, such as kidney, liver
damage, and cancers, or even death in man or animals.1 From a food safety
perspective, the aflatoxins, ochratoxin A, patulin, fumonisins, trichothecenes and
zearalenone are the mycotoxins of major concern. Many countries now monitor
mycotoxin levels in food products. Liquid chromatography-mass spectrometry (LC/MS)
is currently a common analytical approach for the quantification of mycotoxin
contamination.2 Sample preparation for LC-MS/MS analysis can be time- and laborintensive, often involving pH modification, solid phase extraction, multi-step extract
clean-up, and pre-concentration.3 The strict regulation published by the European
Union (EU) in 1999 asking for lower detection limits and higher method reliability
presented a new analytical challenge.4
In this study we describe an easy, comprehensive, LC-MS/MS method using a Thermo
Scientific Transcend TLX-1 system powered by TurboFlow™ technology to analyze
multiple mycotoxin residues in corn meal extract. Figure 1 illustrates a typical
Transcend™ TLX-1 system with the TSQ Vantage™ triple stage quadrupole mass
spectrometer.
FIGURE 1. Typical Layout of a Transcend TLX-1 system with a TSQ
Vantage triple stage quadrupole mass spectrometer
FIGURE 2. Method A view in Aria OS software
HPLC Method Parameters
Analytical Column: Thermo Scientific Hypersil GOLD column 2.1 x 100 mm, 1.9μm
Solvent A: 0.1% formic acid in water
Solvent B: 0.1% formic acid in ACN
Mass Spectrometer Parameters
MS: TSQ Vantage triple stage quadrupole mass spectrometer
Ionization Source: heated electrospray ionization (H-ESI)
Spray Voltage: 5KV
Sheath Gas (N2): 50 arbitrary units
Auxiliary Gas (N2): 20 arbitrary units
Vaporizer Temp: 209 °C
Capillary Temp: 270 °C
Collision Gas: 1.5mTorr
Because DON, NIV and 3-AcDON have a better signal response under negative
ionization mode, a separate LC-MS/MS method was developed. Figure 5 shows the
chromatograms of DON, NIV and 3-AcDON identified at 100 ng/mL fortified in the corn
meal extract. Figure 6 presents the linear fit calibration curves for DON and NIV,
indicating excellent linear fits over the dynamic range. Table 3 summarizes detection,
quantitation limits and standard curve linearity for 3 analytes analyzed in negative ion
mode. For all analytes, the quantitation limits obtained using the present methodology
exceed the EU’s maximum level standards.6 To the best of our knowledge, this is the first
application of its type to detect these 3 compounds using an online sample clean-up
technique coupled to tandem mass spectrometry.
TABLE 3. LOD, LOQ and standard curve linearity for analytes detected in negative
ion mode
FIGURE 5. Selected chromatograms of DON, NIV and 3-AcDON detected at 100
ng/mL fortified in the corn meal extract
Conclusion
Developing a rapid and sensitive quantitative method is always a major goal for
mycotoxins analysis.7 Two quick, automated online sample preparation LC-MS/MS
methods have been developed that are sensitive enough to detect mycotoxins in corn
meal extract. By eliminating manual sample preparation, the reliability of this
methodology was improved significantly. The sample throughput could be improved by
multiplexing the two methods on different LC channels using a Transcend TLX-2 (or
TLX-4) system. Future work will focus on the application of this methodology on various
food matrices and references.
FIGURE 3. Method B view in Aria OS software
References
LC/MS Methods using negative ESI mode (Method B):
TurboFlow Method Parameter
Column: research column A 0.5 x 50 mm
Injection Volume: 10 μL
Solvent A: water
Solvent B: methanol
Solvent C: 0.1 % ammonium hydroxide
Solvent C: 45:45:10 ACN: isopropanol: acetone (v:v:v)
1. Pitt, J.I. What are mycotoxins? Australian Mycotoxin Newsletter. 1996, 7(4), 1.
2. Spanjer, M.C., Rensen, P.M., Scholten, J.M. LC-MS/MS multi-method for
mycotoxins after single extraction, with validation data for peanut, pistachio,
wheat, maize, cornflakes, raisins and figs. Food Addit. Contam. Part A Chem.
Anal. Control Expo. Risk Assess. 2008, 25, 472-89.
3. Shephard, G.S., Determination of mycotixins in human foods, Chem. Soc. Rev.,
2008, 37, 2468-77.
4. DS/CEN/CR 13505, Food analysis-Biotoxins –Criteria of analytical methods of
mycotoxins, European Committee for Standardization, May 20, 1999.
5. Li, W., Herrman, T.J., Dai, S. Y., Rapid Determination of Fumonisins in CornBased Products byLiquid Chromatography/Tandem Mass Spectrometry, J. AOAC
Int., 2010, 93, 1472-81.
6. http://eur-lex.europa.eu/LexUriServ/LexUriServ.do?uri=CONSLEG:2006R1881
:20100701:EN:PDF. Accessed on Mar. 15, 2011
7. Rahmani, A., Jinap, S., Soleimany, F., Quantitative and qualitative analysis of
mycotoxins, Compr. Rev. Food Sci. Food Safety, 2009, 8, 202-251
Results and Discussion
HPLC Method Parameters
Analytical Column: Hypersil GOLD™ column 2.1 x 50 mm, 1.9μm
Solvent A: 0.1% formic acid in water
Solvent B: 0.1% formic acid in ACN
Mass Spectrometer Parameters
MS: TSQ Vantage triple stage quadrupole mass spectrometer
Ionization Source: H-ESI
Spray Voltage: 4.5KV
Sheath Gas (N2): 50 arbitrary units
Auxiliary Gas (N2): 20 arbitrary units
Vaporizer Temp: 250 °C
Capillary Temp: 270 °C
Collision Gas: 1.5mTorr
Figure 4 shows the comparison of chromatograms of 8 positive analytes at 1:100
dilutions in methanol and corn meal extract, indicating excellent chromatographic
separation in both solvent standard and matrix. Matrix-matched calibration standards
showed linear response of two orders of magnitude (r2 > 0.99) for 6 of them (Table 2).
Significant signal enhancement was observed for FB1 and FB2 due to matrix-induced
ionization variability, which was previously reported by other researchers.5 In future work,
the isotope-labeled internal standard might be used to compensate for the matrix
interference.
FIGURE 6. Calibration curves for DON and NIV
FIGURE 4. The comparison of chromatograms of 8 positive analytes in methanol
and corn flour extract (1:100 dilution of stock mixture)
TABLE 1. The list of analytes and their MS transitions
Methods
The matrix standard curve
Five grams of corn meal purchased from a local grocery store was extracted using
25 mL of 70 % methanol in water followed by 60 minutes of ultra-sonication. The
extract sat overnight at room temperature. The resulting solution was then centrifuged
at 6000 RPM for 20 minutes. The supernatant was used to prepare the matrix
calibrators and QC samples. Each milliliter of supernatant corresponds to 0.2 g solid
corn meal powder as the unit of conversion.
The analyte stock mix solutions were prepared in methanol. Table 1 lists selected
reaction monitoring (SRM) transitions and stock concentrations for individual analytes.
The remaining three compounds, deoxynivalenol (DON), nivalenol (NIV) and 3-acetylDON (3-AcDON) were analyzed under negative electrospray ionization (ESI) mode.
Compounds
Parent ion
(m/z)
Primary product ion
(m/z)
Secondary product ion
(m/z)
Aflatoxins B1
313
241
285
Aflatoxins B2
315
259
287
Aflatoxins G1
329
243
283
Aflatoxins G2
331
245
275
Zearalenone (ZEA)
319
187
185
Ochratoxin A (OTA)
404
239
221
Fumonisins B1 (FB1)
722
334
352
Fumonisins B2 (FB2)
706
336
318
Deoxynivalenol (DON)
295
138
265
Nivalenol (NIV)
311
281
205
3-Acetyl-DON (3-AcDON)
337
307
173
Red: Negative ESI mode
TABLE 2. Limit of detection (LOD), limit of quantitation (LOQ) and standard
curve linearity for analytes detected in positive ion mode
Compounds
LOD
(ng/g)
LOQ
(ng/g)
r2
B1
0.25
0.50
0.9956
G1
0.25
0.50
0.9910
OTA
5.00
5.00
0.9937
ZEA
50.00
50.00
0.9955
FB1
12.50
12.50
0.9984
FB2
12.50
12.50
0.9965
All trademarks are the property of Thermo Fisher Scientific and its subsidiaries. This information is not intended to
encourage use of these products in any manners that might infringe the intellectual property rights of others.


© Copyright 2026