
IMPORTANT!
IMPORTANT!
This is a sample appraisal report that is intended to
reflect the typical content and format of reports
prepared by Evergreen Valuation Services for HUD
multifamily lenders. This sample report does not reflect
an appraisal of any specific property, as that would
violate client confidentiality. Instead, this report has
been assembled from multiple appraisals prepared by
EVS. For example, the improvement description may be
taken from one appraisal, while the Land Sales Analysis
may be from another appraisal, and the Income
Approach may be from yet another appraisal. The
appraisers have also attempted to disguise the subject
properties from the various component reports.
Consequently, the reader should not look for consistency
between the various sections of this sample report.
A SELF CONTAINED COMPLETE APPRAISAL REPORT OF
A 312-unit apartment
Known as Stubblebrooke
Located at 1123 Brain Lane
Spotford, Texas
HUD Project No. N/A
Client File No. N/A
EVS File No. 10-001
PREPARED FOR
Mr. Jimmy Sanford
World’s Best HUD Lender
123 Main Street
Suite #100
Houston, TX 77042
EFFECTIVE DATE OF APPRAISAL
July 1, 2010
PREPARED BY
Evergreen Valuation Services
7062-B Lakeview Haven
Suite 116
Houston, TX 77095
Evergreen Valuation Services
DENVER ! DETROIT ! HOUSTON
July 28, 2010
EVS File No.:
Client File No.:
10-001
N/A
Mr. Jimmy Sanford
World’s Best HUD Lender
123 Main Street
Suite #100
Houston, TX 77042
Re:
An appraisal report of a 312-unit apartment, known as Stubblebrooke, located at 1123 Brain Lane,
Spotford, Texas.
Dear Mr. Sanford:
Per your request, we have made an investigation and analysis of the following described property and the
improvements associated with the site:
The legal description is quite lengthy and relegated to the Addenda.
The subject appraisal has been prepared in order to estimate the market value as defined subsequently in this
report where the value reported reflects a market value for the rights in realty. The subject property was
physically inspected on July 1, 2010 and the value reported is based on the date of inspection. This appraisal
report has been prepared and reviewed by staff appraisers associated with Evergreen Valuation Services, Inc.,
each of whom is recognized and acknowledged by individual resume and by signature on the Certificate
following the Correlation and Final Value Estimate.
The appraisers are unbiased with respect to the parties involved and have no present nor contemplated future
interest in the property appraised. Accordingly, statements of fact are to the best of the appraisers' knowledge
correct, and compensation for making the appraisal has in no manner been contingent upon the value
conclusions reported herein.
The appraisal assignment is a self-contained report of an appraisal performed under Standards Rule 1 of
USPAP which satisfies the requirements of Title XI of the Federal Institutions Reform, Recovery and
Enforcement Act of 1989 (FIRREA), and the regulations promulgated thereunder.
This report is also subject to the enclosed Statement of Limiting Conditions and Assumptions. Further, this
report has been prepared at the request, for the benefit, and for the exclusive use of World’s Best HUD
Lender, its successor, affiliates, designates, and assignees, and no other party shall have any right to rely on
any services provided by Evergreen Valuation Services without written consent.
COMMERCIAL REAL ESTATE APPRAISAL AND CONSULTING
7062-B Lakeview Haven, Suite 116, Houston, Texas 77095
Houston Office (281) 855-9410 • Denver Office (303) 674-8514 • Detroit Office (586) 677-7494
Mr. Jimmy Sanford
July 28, 2010
Page Two
This report is prepared subject to the "Certification and Final Value Estimate" and certain assumptions and
limiting conditions which are delineated within the text of this report.
Based on our investigation and analyses, we have derived the following value estimate(s) for the subject
property:
As Is
Prospective Value
Market Value
Upon Stabilization
Final Value Estimate
$23,000,000
N/A
Effective Date
July 1, 2010
N/A
The following report provides an analysis of the subject property and its relationship to the neighborhood and
general market conditions. The report also sets forth the methodology and procedures utilized in our analysis.
Respectfully submitted,
EVERGREEN VALUATION SERVICES
_____________________________________
___________________________________
Andrew C. McCloskey
John Rocco Pallante
Inspecting Appraiser
Review Appraiser
State Certified Appraiser
State Certified Appraiser
Texas
Colorado
TX-1338629-G
CG40012104
EVERGREEN VALUATION SERVICES
Professional Real Estate Appraisers & Consultants
Table of Contents
PART I - INTRODUCTION
PAGE
Summary of Salient Facts & Conclusions . . . . . . . . . . . . . . . . . . . . . . . . . . . . . . . . . . . . . . . . . . . . . 1
Subject Photographs . . . . . . . . . . . . . . . . . . . . . . . . . . . . . . . . . . . . . . . . . . . . . . . . . . . . . . . . . . . . . 5
Assumptions & Limiting Conditions . . . . . . . . . . . . . . . . . . . . . . . . . . . . . . . . . . . . . . . . . . . . . . . . . 8
PART II - NATURE OF ASSIGNMENT
Property Identification . . . . . . . . . . . . . . . . . . . . . . . . . . . . . . . . . . . . . . . . . . . . . . . . . . . . . . . . . . .
Client and Intended Users of the Appraisal . . . . . . . . . . . . . . . . . . . . . . . . . . . . . . . . . . . . . . . . . . .
Function and Intended Use of the Appraisal . . . . . . . . . . . . . . . . . . . . . . . . . . . . . . . . . . . . . . . . . .
Effective Date(s) . . . . . . . . . . . . . . . . . . . . . . . . . . . . . . . . . . . . . . . . . . . . . . . . . . . . . . . . . . . . . . .
Property Rights Appraised . . . . . . . . . . . . . . . . . . . . . . . . . . . . . . . . . . . . . . . . . . . . . . . . . . . . . . .
Definition of Market Value . . . . . . . . . . . . . . . . . . . . . . . . . . . . . . . . . . . . . . . . . . . . . . . . . . . . . . .
Scope of The Assignment . . . . . . . . . . . . . . . . . . . . . . . . . . . . . . . . . . . . . . . . . . . . . . . . . . . . . . . .
History of Ownership . . . . . . . . . . . . . . . . . . . . . . . . . . . . . . . . . . . . . . . . . . . . . . . . . . . . . . . . . . .
Real Estate Tax Information . . . . . . . . . . . . . . . . . . . . . . . . . . . . . . . . . . . . . . . . . . . . . . . . . . . . . .
14
14
14
14
14
15
15
17
18
PART III - REGIONAL AND NEIGHBORHOOD ANALYSIS
Regional Analysis . . . . . . . . . . . . . . . . . . . . . . . . . . . . . . . . . . . . . . . . . . . . . . . . . . . . . . . . . . . . . . 22
Neighborhood Analysis . . . . . . . . . . . . . . . . . . . . . . . . . . . . . . . . . . . . . . . . . . . . . . . . . . . . . . . . . . 34
Apartment Market Analysis . . . . . . . . . . . . . . . . . . . . . . . . . . . . . . . . . . . . . . . . . . . . . . . . . . . . . . . 38
PART IV - SUBJECT PROPERTY DATA
Site Analysis . . . . . . . . . . . . . . . . . . . . . . . . . . . . . . . . . . . . . . . . . . . . . . . . . . . . . . . . . . . . . . . . . . 43
Description of Improvements . . . . . . . . . . . . . . . . . . . . . . . . . . . . . . . . . . . . . . . . . . . . . . . . . . . . . 44
Highest and Best Use Analysis . . . . . . . . . . . . . . . . . . . . . . . . . . . . . . . . . . . . . . . . . . . . . . . . . . . . 48
PART V - VALUATION AND CONCLUSIONS
The Appraisal Process . . . . . . . . . . . . . . . . . . . . . . . . . . . . . . . . . . . . . . . . . . . . . . . . . . . . . . . . . . . . . . 52
Cost Approach . . . . . . . . . . . . . . . . . . . . . . . . . . . . . . . . . . . . . . . . . . . . . . . . . . . . . . . . . . . . . . . . . . .
Comparable Land Sales . . . . . . . . . . . . . . . . . . . . . . . . . . . . . . . . . . . . . . . . . . . . . . . . . . . . . . . . . .
Land Sales Analysis . . . . . . . . . . . . . . . . . . . . . . . . . . . . . . . . . . . . . . . . . . . . . . . . . . . . . . . . . . . .
Replacement Cost of Improvements . . . . . . . . . . . . . . . . . . . . . . . . . . . . . . . . . . . . . . . . . . . . . . . .
Accrued Depreciation . . . . . . . . . . . . . . . . . . . . . . . . . . . . . . . . . . . . . . . . . . . . . . . . . . . . . . . . . . .
Cost Approach Conclusions . . . . . . . . . . . . . . . . . . . . . . . . . . . . . . . . . . . . . . . . . . . . . . . . . . . . . .
HUD Sample Report.wpd
Evergreen Valuation Services
54
55
60
64
68
69
Table of Contents
Sales Comparison Approach to Value . . . . . . . . . . . . . . . . . . . . . . . . . . . . . . . . . . . . . . . . . . . . . . . . .
Comparable Improved Sales . . . . . . . . . . . . . . . . . . . . . . . . . . . . . . . . . . . . . . . . . . . . . . . . . . . . . .
Summary and Analysis of Comparable Sales . . . . . . . . . . . . . . . . . . . . . . . . . . . . . . . . . . . . . . . . .
Price Per Unit Analysis . . . . . . . . . . . . . . . . . . . . . . . . . . . . . . . . . . . . . . . . . . . . . . . . . . . . . . . . . .
Price Per Square Foot Analysis . . . . . . . . . . . . . . . . . . . . . . . . . . . . . . . . . . . . . . . . . . . . . . . . . . . .
Effective Gross Income Multiplier Analysis . . . . . . . . . . . . . . . . . . . . . . . . . . . . . . . . . . . . . . . . . .
Sales Comparison Approach Conclusions . . . . . . . . . . . . . . . . . . . . . . . . . . . . . . . . . . . . . . . . . . . .
70
72
79
79
83
86
87
Income Approach to Value . . . . . . . . . . . . . . . . . . . . . . . . . . . . . . . . . . . . . . . . . . . . . . . . . . . . . . . . . . 88
Comparable Rentals . . . . . . . . . . . . . . . . . . . . . . . . . . . . . . . . . . . . . . . . . . . . . . . . . . . . . . . . . . . . 89
Rental Income Analysis . . . . . . . . . . . . . . . . . . . . . . . . . . . . . . . . . . . . . . . . . . . . . . . . . . . . . . . . . 102
HUD Form 92273 (Estimates of Market Rent by Comparison) . . . . . . . . . . . . . . . . . . . . . . . . . . 103
Expense Analysis . . . . . . . . . . . . . . . . . . . . . . . . . . . . . . . . . . . . . . . . . . . . . . . . . . . . . . . . . . . . . . 110
HUD Form 92274 (Operating Expense Analysis Worksheet) . . . . . . . . . . . . . . . . . . . . . . . . . . . 114
Stabilized Pro-Forma . . . . . . . . . . . . . . . . . . . . . . . . . . . . . . . . . . . . . . . . . . . . . . . . . . . . . . . . . . . 122
Direct Capitalization . . . . . . . . . . . . . . . . . . . . . . . . . . . . . . . . . . . . . . . . . . . . . . . . . . . . . . . . . . . 123
Conclusions . . . . . . . . . . . . . . . . . . . . . . . . . . . . . . . . . . . . . . . . . . . . . . . . . . . . . . . . . . . . . . . . . . 125
Reconciliation and Final Estimate of Value . . . . . . . . . . . . . . . . . . . . . . . . . . . . . . . . . . . . . . . . . . . . . 126
Certification of Value . . . . . . . . . . . . . . . . . . . . . . . . . . . . . . . . . . . . . . . . . . . . . . . . . . . . . . . . . . 129
Qualifications of Appraisers . . . . . . . . . . . . . . . . . . . . . . . . . . . . . . . . . . . . . . . . . . . . . . . . . . . . . 131
ADDENDA
Addendum A - HUD Form 92264 (Multifamily Summary Appraisal Report)
Addendum B - Site & Improvement Exhibits
Addendum C - Rent Roll
Addendum D - Operating Statements
Addendum E - Fee Agreement
HUD Sample Report.wpd
Evergreen Valuation Services
Summary Of Salient Facts
Name:
Stubblebrooke
HUD Project Number:
N/A
Proposed Financing Under Section:
223f
Legal Description:
The legal description is quite lengthy and relegated to the
Addenda.
Property Type:
312-unit apartment
Location:
The subject is in the extraterritorial jurisdiction (ETJ) of the City
of Spotford, which is a suburban community located 15 miles
southwest of the Houston CBD. Specifically, the site is situated
on the west side of Brain Lane, roughly ¼ mile north of Avenue
C.
Street Number:
1123
Street Name:
Brain Lane
City:
Spotford
County:
Fruit Bend
State:
Texas
Zip Code:
77223
Census Tract:
86
Placement Code:
N/A
Site Description:
The subject site is a level, rectangular interior tract.
Land Area:
11.772 acres or 512,788 Square Feet
Frontage/Access:
A site survey was not provided. The site has frontage along the
west side of Brain Lane and is accessed via one curbcut.
Visibility is good.
Flood Hazard:
The site is generally level and there is no evidence of drainage
problems.
According to FEMA Community Panel
#48157C0255J, dated January 3, 1997, the site is located in Zone
X, which is outside the limits of the 100-year flood hazard zone.
Utilities:
Water -
Fruit Bend WCID #2
Sewer -
Fruit Bend WCID #2
Electric -
Direct Energy
Natural Gas -
Not used
HUD Sample Report.wpd
Evergreen Valuation Services
1
Summary Of Salient Facts
Zoning:
None
Permitted Uses:
The subject is not zoned, but it is in the Spotford ETJ, so all
development must be approved by the City of Spotford. As a
recently completed project, the subject is assumed to be a legally
conforming use.
Code Violations:
The appraisers are not aware of any building code or safety
violations.
Soil Conditions:
In the absence of a soil survey, it is assumed that the subject soils
are capable of supporting a moderate scale development.
Easements/Encroachments:
The appraisers are not aware of any adverse easements or
encroachments, and it is specifically assumed that none exist.
Improvement Description:
This site is improved with a 312-unit garden style apartment
complex completed in 2007 and 2008. There are sixteen threestory apartment buildings. A large clubhouse/leasing center is at
the site’s entrance. The buildings on the southern half of the site
were built in 2007, with the northern half completed in 2008.
Construction characteristics include wood framing, brick and
cementitious siding exteriors, and pitched roofs covered with
composition shingles.
Total Revenue Units:
312
Total Non-Revenue Units:
0
Apartment Buildings:
16
Stories:
3
Accessory Buildings:
The leasing office is adjacent to the pool area and measures
approximately 4,795 SF.
Project Amenities:
Project amenities include a clubhouse, resort-style swimming
pool, spa, patio with two fireplaces adjacent to the pool, fitness
center, theater room, game room, sand volleyball, playground,
jogging trail, and car wash.
Unit Amenities:
Unit amenities include 9' ceilings, granite countertops, microwave
oven (MW), full-size washer/dryer (WD), garden tubs, computer
niches, and patios/balconies.
Condition:
Good
Parking Spaces
499 total, with 48 carports and 48 garages
Parking Ratio:
1.60 per unit
Parking Compliance:
Since the subject is in the Spotford ETJ, there are no specific
parking requirements. If it were within Spotford city limits, the
code would require 544 spaces, which is slightly more than the
499 currently provided. As a practical matter, the existing
parking appears adequate for multifamily use.
HUD Sample Report.wpd
Evergreen Valuation Services
2
Summary Of Salient Facts
Year Completed:
2007-2008
Total Economic Life (Years):
50
Overall Effective Age (Years):
1
Remaining Economic Life (Years):
49
Average Unit Size (SF):
898
Project Density:
26.5 :units per acre
Unit Mix
Floorplan
Units
SF
Total SF
Special Amenities/Comments
1 Bed 1.0 Bath
172
745
128,140
Standard appliances
2 Bed 2.0 Bath
128
1,067
136,576
Standard appliances, balcony
3 Bed 2.0 Bath
12
1,286
15,432
312
898
280,148
Total (Mean)
Net Rentable Area (SF):
280,148
Basements (SF):
0
Leasing Office (SF):
4,795
Other Common Areas (SF):
312
Commercial Space (SF):
0
Garages (SF):
0
Gross Building Area (SF):
285,255
Current Occupancy:
91%
Percent Leased:
91%
Standard appliances, no balcony
(Mechanical, etc.)
Stabilized Vacancy & Collection Loss: 8.0%
Current Average Rent/SF:
$0.94
/SF/month
Quoted Street Rent/SF:
$0.95
/SF/month
Proposed Gross Potential Rent:
$0.95
/SF/month
Highest and Best Use - If Vacant:
Landbanking, pending future multifamily development
Highest and Best Use - As Improved:
Continued use as a 312-unit apartment project
Purpose of the Report:
To estimate the “As Is” Market Value of the subject property
Property Rights Appraised:
Fee Simple Estate
HUD Sample Report.wpd
Evergreen Valuation Services
3
Summary Of Salient Facts
Function of the Appraisal:
This report is intended to facilitate underwriting for proposed
refinancing.
Deferred Maintenance:
$0
Lease-Up Costs:
$0
Effective Date of Appraisal:
July 1, 2010
As Is
N/A
Upon Completion
N/A
Upon Stabilization
Date of Property Inspection:
July 1, 2010
Date of Report:
July 28, 2010
Stabilized Proforma
Total
Potential Gross Rental Income:
Plus: Other Income
Less: Vacancy/Collection Loss 8.0%
Less: Loss to Lease at 1.5%
Effective Gross Income:
Less: Operating Expenses
Less: Reserves for Replacement
$/SF
$/Unit
$3,194,400
$11.40
$10,238
$223,291
$0.80
$716
7.2%
($255,552)
($0.91)
($819)
(8.2)%
($47,916)
($0.17)
($154)
(1.5)%
$11.12
$9,981
100.0%
($1,404,524)
($5.01)
($4,502)
(45.1)%
($78,000)
($0.28)
($250)
(2.5)%
$1,631,700
$5.82
Value Indications
As Is
Market Value
Prospective Value
Upon Stabilization
Cost Approach:
$22,700,000
N/A
Sales Comparison Approach:
$23,500,000
N/A
Income Approach:
$22,500,000
N/A
$23,000,000
N/A
$/SF NRA:
$82.10
N/A
$/Unit:
$73,718
N/A
Stabilized Cap Rate By Analysis:
7.25%
Resulting Cap Rate:
7.09%
$5,230
Appraisers:
Evergreen Valuation Services
Andrew C. McCloskey
John Rocco Pallante
EVS File Number:
10-001
Client File Number:
N/A
HUD Sample Report.wpd
102.6%
$3,114,223
Net Operating Income
Market Value Conclusion:
% of EGIM
Evergreen Valuation Services
52.4%
4
Subject Photographs
Exterior view
Exterior view
Exterior view
Exterior view
Exterior view
Exterior view
Exterior view
Exterior view
Evergreen Valuation Services
Subject Photographs
Clubhouse/leasing office
Clubhouse interior
Clubhouse interior
Fitness center
Patio with two fireplaces (between pool & clubhouse)
Pool area
Playground
Sign at property entrance
Evergreen Valuation Services
Subject Photographs
View along Brand Lane looking south
View along Brand Lane looking north
Typical kitchen
Typical kitchen
Typical bathroom
Typical bathroom
Typical living area
Typical living area
Evergreen Valuation Services
Assumptions & Limiting Conditions
This appraisal report is subject to the following assumptions and limiting conditions. These assumptions are
considered necessary by the appraisers to make a proper estimate of value in accordance with the appraisal
assignment. The first 21 categories reflect standard assumptions and limiting conditions that are applicable
to all appraisals performed by Evergreen Valuation Services (EVS). Categories 22 and 23 detail extraordinary
conditions or assumptions that are unique to the subject property. The appraisers may also cite specific
assumptions and limiting conditions elsewhere throughout the appraisal report.
1.
COPIES, PUBLICATION, DISTRIBUTION, USE OF REPORT - Possession of this report or
any copy thereof does not carry with it the right of publication, nor may it be used for other than its
intended use; the physical reports remain the property of the appraiser for the use of the client, the
fee being for the analytical services only. The report may not be used for any purpose by any person
or corporation other than the client and or their assignee. Please be advised that you have the right
to assign the appraisal to an investor, and an assignee may rely on the appraisal as though it were
addressed to the assignee.
Neither all nor any part of the contents of this report shall be conveyed to the public through
advertising, public relations efforts, news, sales or other media, without the written consent and
approval of EVS, nor may any reference be made in such a public communication to the Appraisal
Institute or the MAI designation.
This appraisal is to be used only in its entirety and no part is to be used without the whole report.
All conclusions and opinions set forth in the report were prepared by the appraisers whose signatures
appear on the appraisal report, unless indicated as "Review Appraiser". No change of any item in
the report shall be made by anyone other than the appraisers, and the appraisers and firm shall have
no responsibility if any unauthorized change is made.
2.
CONFIDENTIALITY - The appraisers may not give a copy of the report to anyone other than the
client or his designee as specified in writing. Furthermore, the appraisers will not divulge the
material contents of the report, either orally or in writing, to anyone other than the client or designee.
Exceptions may be made if the report is subpoenaed by a court of law with proper authority, or if
requested by the Appraisal Institute to assist in ethics enforcement.
3.
EXHIBITS - The sketches and maps in this report are included to assist the reader in visualizing the
property and are not necessarily to scale. Various photos, if any, are included for the same purpose
and are not intended to represent the property in other than actual status, as of the date of the photos.
4.
TRADE SECRETS - This appraisal consists of "trade secrets and commercial or financial
information" which is privileged and confidential and exempt from disclosure under 5 U.S.C. 552
(b)(4). Notify EVS, of any request to reproduce this appraisal in whole or in part.
HUD Sample Report.wpd
Evergreen Valuation Services
8
Assumptions & Limiting Conditions
5.
INFORMATION USED - No responsibility is assumed for accuracy of information furnished by
others, including the client, his designees, public records, published data sources, or other real estate
professionals. The comparable data relied upon in this report has been confirmed with one or more
parties familiar with the transaction or from affidavit, and all are considered appropriate for inclusion
to the best of our knowledge and judgment. In some instances, the data may have been verified by
associates who may not have worked on this particular appraisal.
6.
COMPONENT VALUES - The estimated values for the entire property applies only under the
current or proposed utilization. The separate value estimates for land and improvements, if any, must
not be used in conjunction with any other appraisal and are invalid if so used.
7.
LIMITS OF EXPERTISE (LEGAL, ENGINEERING, HIDDEN COMPONENTS) - The
appraisers assume no responsibility for matters beyond their personal expertise or the scope of the
assignment, including all legal issues and items related to architecture, mechanics, engineering, or
soil conditions.
No opinion is rendered as to the title, which is presumed to be good and merchantable. The property
is appraised as if free and clear of encumbrances, unless otherwise stated in this report. The legal
description set forth in this report is assumed to be accurate, but the appraisers make no warranty.
The soils at the subject property appear reasonably firm to the untrained eye; however, the degree
of subsidence in the area is not known. The appraisers do not warrant against problems that could
arise from soil conditions. The appraisal is based on there being no hidden or unapparent conditions
of the property site, subsoil, or structures that would render it more or less valuable. No
responsibility is assumed for any such conditions or for any expertise or engineering required to
discover or correct them.
All mechanical components are assumed to be in operable condition and typical of the market and
property type. Unless otherwise stated, the condition of heating, cooling, ventilating, electrical and
plumbing equipment is considered to be commensurate with the overall condition of the
improvements.
8.
TESTIMONY, CONSULTATION, COMPLETION OF CONTRACT FOR APPRAISAL
SERVICES - The contract for appraisal, consultation or analytical service is fulfilled and the total
fee payable upon completion of the report. The fee for this appraisal or study is for the service
rendered and not for the time spent on the physical report. Neither the appraisers nor any other
employees of EVS will be asked or required to give testimony in court or hearing because of having
made the appraisal, in full or in part. Nobody associated with EVS will engage in post-appraisal
consultation with the client or third parties except under separate arrangement and at an additional
fee.
HUD Sample Report.wpd
Evergreen Valuation Services
9
Assumptions & Limiting Conditions
9.
AUXILIARY AND RELATED STUDIES - Unless stated within the body of the report, the
appraisers have neither prepared nor been provided with auxiliary studies related to the subject
property, including an environmental impact study, special market study, highest and best use
analysis, or feasibility study. If any such studies are subsequently made available to EVS, the
appraisers reserve the unlimited right to alter, amend, revise or rescind any of the statements,
findings, opinions, value estimates, or conclusions set forth in this appraisal report.
10.
DOLLAR VALUES, PURCHASING POWER - The Market Value estimated and the costs used
are as of the date of the estimate of value. All dollar amounts are based on the purchasing power and
price of the dollar as of the date of the value estimate.
11.
THE EXISTENCE OF HAZARDOUS SUBSTANCES - Unless otherwise stated in this report,
the appraiser(s) have no knowledge of the existence of hazardous waste products or any resultant
contamination, including, without limitation, asbestos, polychlorinated biphenyl, petroleum leakage,
or agricultural chemicals, which may or may not be present on the property. Furthermore, the
appraisers are not qualified to test for such substances or conditions. The values derived herein
specifically assume no such substances or conditions exist at the property. If evidence to the contrary
is subsequently revealed, the appraisers reserve the right to alter any value estimates accordingly.
No responsibility is assumed for any such conditions, nor for any expertise or studies required to
discover or correct them. The client is urged to retain an expert in the field of environmental
conditions and hazards.
12.
LEGALITY OF USE - Unless otherwise stated in this report, the appraisal is based on the specific
assumption that the property is in full compliance with all applicable regulations and laws regarding
environmental conditions, zoning, building codes, and use regulations. It is further assumed that all
required licenses, consents, or permits from any controlling authority have been or can be obtained
or renewed for any use considered in the value estimate.
13.
INCLUSIONS - The value estimates derived herein consider only the real estate component. Any
business value, furnishings, and equipment, except as specifically indicated and typically considered
as a part of real estate, have been disregarded
14.
PROPOSED IMPROVEMENTS, CONDITIONAL VALUES - Any proposed improvements or
repairs are assumed to be completed in good and workmanlike manner according to information
provided or adopted by the appraisers. In cases of proposed construction, any statements or
conclusion are subject to modification upon inspection of the completed property. Any such
inspections or modifications will only be performed at an additional fee, unless specifically
delineated in the original letter of engagement. Any estimates of value are valid only for the effective
dates shown, and subject to stated assumptions regarding the operating levels and extent of
completion as of those dates.
HUD Sample Report.wpd
Evergreen Valuation Services
10
Assumptions & Limiting Conditions
15.
VALUE CHANGES, DYNAMIC MARKET INFLUENCES - Any value estimates presented
herein are effective only for the dates indicated and are based on information available at the time
the appraisal was prepared. Values can change significantly over time due to a variety of market
forces. Furthermore, the value estimates presented herein are no guarantee that the property can
actually be sold for a specific amount. Sale prices can be influenced by numerous factors, including
exposure, time, promotional effort, terms, motivation, and other conditions surrounding the offering.
The value estimate considers the productivity and relative attractiveness of the property in the
marketplace, both physically and economically.
In cases of appraisals involving the capitalization of income benefits, the estimate of value is a
reflection of the appraisers’ estimate of current and/or future income levels, coupled with investor
yield requirements and other factors derived from general and specific market information. Such
estimates are made as of the date of the estimate of value, and they are subject to change over time
due to dynamic market influences.
16.
FACTORS EXCLUDED FROM CONSIDERATION - Any estimates of value or other
conclusions derived by the appraisers are not based in whole or in part upon the race, color, national
origin, sexual preference, or familial status of the current owner or occupants of the subject property
or any properties in the vicinity of the subject.
17.
THE AMERICANS WITH DISABILITIES ACT (ADA) - ADA became effective January 26,
1992. The appraisers have not made a specific compliance survey and analysis of this property to
determine whether or not it is in conformity with the various detailed requirements of the ADA. It
is possible that a compliance survey of the property, together with a detailed analysis of the
requirements of the ADA, could reveal that the property is not in compliance with one or more of the
requirements of the act. If so, this fact could have a negative effect upon the value of the property.
Unless stated elsewhere in this report, the appraisers have no direct evidence of noncompliance, and
the value estimate specifically assumes no compliance issues. The client is advised to seek a
qualified expert on ADA requirements.
18.
MANAGEMENT OF THE PROPERTY - It is assumed that the property will be under prudent
and competent ownership and management, neither inefficient nor super-efficient.
19.
VALUE CONCLUSION - The final value conclusion is of the surface estate only. No consideration
has been given to value, if any, of the subsurface rights of the subject property.
20.
CONTINUING EDUCATION - As of the date of this report, all appraisers signing this appraisal
are current with continuing education requirements of the various states in which they may be
licensed.
HUD Sample Report.wpd
Evergreen Valuation Services
11
Assumptions & Limiting Conditions
21.
ACCEPTANCE OF THE REPORT - Acceptance of and/or use of this appraisal report constitutes
acceptance of all conditions set forth herein.
22.
HYPOTHETICAL CONDITIONS A.
23.
None
EXTRAORDINARY ASSUMPTIONS A.
None
HUD Sample Report.wpd
Evergreen Valuation Services
12
PART II
NATURE OF ASSIGNMENT
HUD Sample Report.wpd
Evergreen Valuation Services
13
Nature Of The Assignment
Property Identification
The subject property consists of a 11.772-acre site improved with a 312-unit apartment known as
Stubblebrooke. The subject is in the extraterritorial jurisdiction (ETJ) of the City of Spotford, which is a
suburban community located 15 miles southwest of the Houston CBD. Specifically, the site is situated on
the west side of Brain Lane, roughly ¼ mile north of Avenue C. The address is 1123 Brain Lane, Spotford,
Texas 77223.
The subject site is improved with a 2-story garden style apartment project containing 312 units. The property
has an estimated net rentable area (NRA) of 280,148 SF and a gross building area (GBA) of 285,255 SF.
Completed in 2007, the improvements are generally considered to be in good condition.
Legal Description
The subject property is legally described as follows:
The legal description is quite lengthy and relegated to the Addenda.
The appraisers have not commissioned a survey or had one verified by legal counsel. It is recommended that
the legal description be verified before being used in a legal document or conveyance.
Purpose of The Appraisal
To estimate the “As Is” Market Value of the subject property
Client and Intended Users of the Appraisal
World’s Best HUD Lender, its officers, administrators, employees, and lending participants (if any).
Intended Use of The Appraisal
This report is intended to facilitate underwriting for proposed refinancing.
Effective Date(s) of Appraisal
As Is Market Value July 1, 2010
Upon Completion N/A
Upon Stabilization N/A
Property Rights Appraised
This report addresses the subject property’s Fee Simple Estate. According to the Dictionary of Real Estate
Appraisal (Third Edition, 1993), published by the Appraisal Institute, Fee Simple Estate is defined as follows:
Absolute ownership unencumbered by any other interest or estate, subject only to the
limitations imposed by the governmental powers of taxation, eminent domain, police power,
and escheat.
HUD Sample Report.wpd
Evergreen Valuation Services
14
Nature Of The Assignment
Definition of Market Value
Market Value - is defined as the most probable price which a property should bring in a competitive and
open market under all conditions requisite to a fair sale, the buyer and seller each acting prudently,
knowledgeably and assuming the price is not affected by undue stimuli. Implicit in this definition is the
consummation of a sale as of a specified date and the passing of title from seller to buyer under the conditions
whereby:
a.
buyer and seller are typically motivated;
b.
both parties are well informed or well advised, and each acting in what they consider their
own best interest;
c.
a reasonable time is allowed for exposure in the open market;
d.
payment is made in terms of cash in U.S. Dollars or in terms of financial arrangements
comparable thereto; and
e.
the price represents the normal consideration for the property sold unaffected by special or
creative financing or sales concessions granted by anyone associated with the sale.1
As Is Market Value - is defined as an estimate of the market value of a property in the condition observed
upon inspection and as it physically and legally exists without hypothetical conditions, assumptions, or
qualifications as of the date the appraisal is prepared.2
Prospective Value Upon Completion - represents the anticipated market value for a property at a point in time
when all improvements have been physically constructed, but before reaching stabilized operating levels.
Prospective Value Upon Stabilization - represents the anticipated market value for a property at a point in
time when all improvements have been physically constructed and the property has been leased to its
optimum level of long term occupancy. At such point, all capital outlays for tenant improvements, leasing
commissions, marketing costs, and other carrying charges are assumed to have been absorbed.
Scope of The Assignment
The scope of the appraisal report, as stipulated by the terms of the assignment, is to prepare the appraisal in
a format that complies with the Appraisal Foundation and the Appraisal Institute. In valuing the subject, the
appraisers have narratively evaluated and described the general area, neighborhood area, site, zoning and
improvement data, if any, impacting the subject in order to analyze the highest and best use of the site as
vacant. The following Scope of Investigation more specifically describes the procedures followed in the
reporting and the documentation of the collected data.
1
2
Federal Regulation, 12 CFR 564, as promulgated by the OTC, effective August 23, 1990
Statement of Policy 12 CFR 571.27
HUD Sample Report.wpd
Evergreen Valuation Services
15
Nature Of The Assignment
Scope of Investigation
Area and Neighborhood Analysis: For the Area and Neighborhood Analysis, the appraiser personally
inspected the surrounding area and utilized published and non-published data to help draw conclusions about
the affect of the area and neighborhood data impacting the subject. Information for this section of the report
was published by various private and public entities. Non-published, yet public information, was obtained
from the various state and other government related entities. Area real estate brokers, agents and appraisers
were also consulted for their opinions of the aforementioned.
Site Description and Analysis: The subject property was visually examined by the appraiser on July 1,
2010. Local governmental bodies and utility suppliers were consulted to secure information regarding utility
availability, plat maps, zoning, flood hazards, and tax information.
Property Data Provided by Client/Borrower: The following chart lists the property data provided to the
appraisers by the client and/or the owner’s representatives. All other information contained within this report
was obtained from third-party sources.
Data Provided to Appraisers
Item
Provided
Comments
Rent Roll
Y
Dated May 2010
Historic Operating Statements
Y
2008 and 2009
Proforma Budget
Y
2010 budget (7 months)
Site Plan
Y
Floor Plans
Y
Purchase Agreement
N
Not applicable
Land Use Regulatory Agreement
N
Not applicable
HAP Contract
N
Not applicable
Appraisal Questionnaire
Y
Completed during site inspection
Marketing Package
N
Engineering Reports
N
Highest And Best Use: In determining the Highest and Best Use of the subject property as though vacant
and/or improved, the appraiser utilized information obtained for, and reported in, the Area and Neighborhood
Analyses, and the remaining sections of this appraisal. This information revealed the historic and future
significance of the area to the subject, as well as the contribution of the area development in designating a
proposed use for the subject. The four criteria examined to establish the Highest and Best Use were; 1)
Physically Possible, 2) Legally Permissible, 3) Financially Feasible and 4) Maximally Productive.
Assignment Conditions: As defined in USPAP, assignment conditions can include assumptions,
extraordinary assumptions, hypothetical conditions, laws and regulations, jurisdictional exceptions, and
other conditions that affect the scope of work. The usual assumptions, extraordinary assumptions, and
hypothetical conditions, if any, were addressed in the Assumptions and Limiting Conditions section of this
HUD Sample Report.wpd
Evergreen Valuation Services
16
Nature Of The Assignment
report. In addition to these typical items, the client has also required that this report be prepared in
accordance with HUD’s Multifamily Accelerated Processing (MAP) Guide, dated May 15, 2002. Some
aspects of HUD’s appraisal requirements may conflict with USPAP and other accepted appraisal techniques.
These are Jurisdictional Exceptions, defined by USPAP as an assignment condition established by applicable
law or regulation, which precludes an appraiser from complying with a part of USPAP.
Valuation Analysis: The appraisers considered all approaches to valuation that might be appropriate for this
property type. The following chart summarizes the appraisers’ rationale for inclusion or exclusion of each
approach in this particular analysis.
Approaches to Value
Valuation Approach
Presented Rationale
Cost Approach
Y
Required by HUD and appropriate for a new project.
Insurable Value
N
Not requested
Income Approach
Y
Rent comps were surveyed to estimate market rents. Expense
projections supported by historics and expense comps. Direct
capitalization applied to stabilized proforma.
Sales Comparison Approach
Y
Actual sale prices reflect the net result of investor evaluations.
History of Ownership
According to Fruit Bend Central Appraisal District records, the subject is currently owned by Stubblebrooke
Partners, LP. The vacant site was acquired from Stubblebrooke Phase II LP on June 27, 2006 at an
undisclosed price. The current owner subsequently developed the existing apartment project. The appraisers
are not aware of any offers or attempts to market the property for sale during the past three years.
HUD Sample Report.wpd
Evergreen Valuation Services
17
Real Estate Taxes
For the subject property, the assessed value is calculated at 100% of the market value, as estimated by the
Fruit Bend Central Appraisal District (FBCAD). The following table summarizes the subject's preliminary
assessment and estimated taxes.
Summary of 2010 Preliminary Assessment and Projected Taxes
ID Number
Component
Assessed
Value
Ratio
Taxable
Value
R111774
Land
$1,316,120
100%
$1,316,120
$1.985
$26,122
$17,845,940
100% $17,845,940
$1.985
$354,199
Total Real Estate
$19,162,060
100% $19,162,060
$1.985
$380,321
Personal Property
$20,000
100%
$20,000
$1.985
$397
100% $19,162,060
$1.985
$380,321
Building
Total Taxes
$19,162,060
Tax Rate
Per $100
Taxes
The State of Texas is a non-disclosure state, meaning that the sale price of a property does not have to be
reported. Therefore, property taxes are not automatically adjusted to the sale price of the property.
Additionally, the Texas Constitution requires that taxation of properties must be “equal and uniform.” Thus,
the assessment for a property must be similar to comparable properties in the area. As a check on the
reasonableness of the assessment, the appraisers have researched assessments for similar properties. For
consistency, the FBCAD building sizes are utilized, which may vary from sizes cited elsewhere in this report.
Summary of Tax Comparables
Name
Units
GBA
Preserve @ Colony Lakes
420
385,548
Lakeland Estates
264
Trestles
Avg SF
YOC
Assessed Value
$/Unit
$/SF
918
2004
$34,488,160
$82,115 $89.45
241,092
913
2008
$18,177,390
$68,854 $75.40
188
176,984
941
1999
$14,813,770
$78,797 $83.70
Stubblebrooke
240
240,864
1,004
2002
$17,817,590
$74,240 $73.97
Average/Mean
Stubblebrooke
278
312
261,122
266,837
939
855
2007
$21,324,228
$19,162,060
$76,001 $80.63
$61,417 $71.81
The subject’s preliminary 2010 assessment is $19,162,060, which is 16.7% less than the market value
estimated herein. The subject’s preliminary assessment is also lower than all four tax comps. Based on the
information presented, it seems that the subject is underassessed. At the same time, recognizing that all
assessments are preliminary at this point, some of the comps may be overassessed, and the assessments could
be reduced pending ongoing appeals. All factors considered, the appraisers have adopted a projected
assessment for the real estate of $22,000,000, which equates to $70,513/unit or $82.45/SF.
HUD Sample Report.wpd
Evergreen Valuation Services
18
Real Estate Taxes
Projected Assessment and Taxes - Year One
ID Number
Assessed
Value
Ratio
Taxable
Value
Total Real Estate
$22,000,000
100%
$22,000,000
$1.985
$436,700
Personal Property
$20,000
100%
$20,000
$1.985
$397
$22,020,000
100%
$22,020,000
$1.985
$437,097
Total Taxes
HUD Sample Report.wpd
Evergreen Valuation Services
Tax Rate
Per $100
Taxes
19
PART III
REGIONAL & NEIGHBORHOOD ANALYSES
HUD Sample Report.wpd
Evergreen Valuation Services
20
Wint
ers B
ayo
Wint
ers B
ayou
105
234
Montgomery
Montgomery
Montgomery
Montgomery
Oak
Oak Grove
Grove
Regional Map
Dobbin 105
Plantersville
Plantersville Dobbin
Gary
Gary
Keenan
Mi
ll C Plantersville
Leonidas
Leonidas
Gary
Gary
Keenan
ree
k
94
94
75
91
91
105
336
75
ree
k
Rayburn
Raybur
Hightower
Hightower Ray
Ray
Westcott
Westcott
Westcott
Westcott
59
Seaman
Seaman
59
Hightower
Hightower
ClevelandSeaman
Seaman
Cleveland
Cleveland
Grady
Grady
105
Grady
Grady
91
91
45
an Jacinto River
4
105
k
ree
Blackberry
Blackberry
Willis
Willis
94
94
acinto River
Pe
ac
hC
Peree
ac k
hC
yC
k
Blackberry
Blackberry
And Shoot
Shoot
Cut
Cut And
105
Conroe
Conroe
45
Waukegan
Waukegan
Youens
Youens
And
Shoot
And
Shoot
Cut
Cut
Security
Siding105
Security Siding
Conroe
Montgomery
MontgomeryConroe
88
88
105
336
ay
ou
k
Cre
e
Cy
pre
ss
Cre
e
k
Ce
da
rB
Ce
da
rB
ay
ou
Peach C
reek
reek
ey C
Can k
ree
ey C
Can
Peach C
reek
105
Williams
Williams
Leonidas
88
Leonidas
k
88
Waukegan
Waukegan
Corners
Four
Corners
Four
ee
Youens
84
Youens
r
84
Siding
Security
Security Siding
Williams
Williams
Mace
Mace
eC
Montgomery
Karen
83
Karen
83
k Montgomery
321
Grangerland
Grangerland
ak
Corners
Four
Corners
Four
ee
L
84
r
84
Todd
Todd
Fetzer
Fetzer
C
Karen
83
59
Karen
ke
83
321
Grangerland
Grangerland
La242 W G Jones State Forest
Fetzer
Fetzer
Grove
Plum
Grove
Plum
Magnolia
Magnolia
80
80
59
Egypt
Egypt 242 W G Jones State Forest
Ventura
Plum
Ventura
Grove
Plum Grove
Magnolia
Magnolia
80
80
Tamina
Tamina
Egypt
Egypt
Spring Creek
Ventura
Ventura
249
78
78
Caney
New
New Caney
Oklahoma
Tamina
Tamina
Oklahoma
Spring Creek
ou
The
The Woodlands
Woodlands
249
ay
78
ng
78
Prairie
Caney
Caney
Decker
New
New
Oklahoma
B
Prairie
Decker
Oklahoma
77
Rayford
77
Rayford
C
Hufsmith
Hufsmith
ce
ou
The
Sprreek
Hegar
The Woodlands
Woodlands
Hegar
Lu
ay
ing
Prairie
Decker
B
Park
Brown
Prairie
Decker
72
77
Porter
Porter
72
Rayford
77
Rayford
Cre
River
Terrace
River Terrace
Hufsmith
Hufsmith
Tomball
Tomball
ce
Avonak
Avonak
Hegar
ek
Hegar
Lu
Park
BrownPark
Spring
Spring
72
New Kentucky
Porter
Porter
72
Acres
Timberlane
Acres
Timberlane
321
River
Terrace
River Terrace
70B
Rotherwood
70B
Tomball
Tomball
Rotherwood
Avonak
Avonak
Hill
Rose
Hill
Rose
k
e
Eastgate
Spring
Waller
Waller
e
New Kentucky Park
Cr
Hidden
Dunnam
Timberlane
Echo
Hidden Echo
45
Acres
Timberlane Acres
494 Dunnam
321
70B
Rotherwood
Klein
70B
Spring
Rotherwood
Klein
A
Rose
Hill
Rose Hill
59
k
e
Waller
Waller
e
Eastgate
Eastgate
r
C
Echo
Hidden
Dunnam
Echo
Hidden
Hockley
45
Huffman
Huffman
Hockley
494 Dunnam
Klein
Spring
Klein
66
66 Westfield
Westfield
Mi
ll C
Todd
Todd reek
290
Cr
ee
k
Co
w
Street
Atlas
DeLorme.
98
USA
USA
StreetAtlas
AtlasUSA
DeLorme. Street
98
98DeLorme.
Street
Atlas
DeLorme.
98
Co
w
yC
ree
k
Genther
Station
Genther Station
36
USA
Street
Atlas
DeLorme.
1998
©
USA
StreetAtlas
AtlasUSA
DeLorme. Street
©
1998DeLorme.
©1998
USA
Street
Atlas
DeLorme.
1998
©
u
te Bayo
Chocola
te Bayo
u
Oyster Creek
Otey
Genther
Station
Genther Station
36
Chocola
Cr
ee
k
Oyster Creek
ek
k
ee
Cr
Cy
pre
ss
Kohrville
59
90
Hill
Hill
Moonshine
Moonshine
Huffman
Huffman
146
Bordersville
66
Louetta
66Bordersville
Westfield
Westfield
Louetta
Bammel
Kohrville
Kohrville Bammel
Sheeks
IAH
Sheeks 90 146
IAH
Hill
Hill
Moonshine
Moonshine
Harmaston
Harmaston
Bordersville
Humble
Humble
Bordersville
Park
63
Louetta
63
Louetta
290
Bammel
Bammel
Cypress
Cypress Grant Woods
Sheeks
IAH
Sheeks
62
Esperson
IAH
62
Esperson
Harmaston
Harmaston
G
249
re
Humble
Humble
ens BPark
Grant Woods
63
Hot
Wells
63
Hot
Wells
Cypress
Cypress
ayou
61
61 Aldine
Aldine
62
Espe
Esp
8
62
Esp
8
249 Greens
Bayou
White
Hot
Wells
HotOak
Wells
Bayo60
u60 61
61 Aldine
Crosby
Crosby
Park
Dwight D Eisenhower
Aldine
8
Satsuma
8
Houston 60
North Houston
White Oak Bayou North
60
MtDwight
Houston
Crosby
Gardens
Gardens
MagnoliaCrosby
D Eisenhower ParkMagnolia
57B
57B
Satsuma
Satsuma
290
Houston
North
North Houston
Central Park
90
Mt
Houston
Mt
Houston
eGardens
Heights
HeightsSheldon W M A
Highland
Highland
dar B
Magnolia
MagnoliaCGardens
57B
57B
ayo
290 Fairbanks
Fairbanks
Harris
Central Park
Harris
Park
Warren
90
Sheldon
Sheldon
Ceda u
Heights
Heights
Highland
Highland
r Ba 207
Sheldon
90U W M A
Park
Pelham Park
Park Kerr Harris
Bear Creek Park Binglewood
Fairbanks
you
Fairbanks
Harris
Warren Park
Sheldon
Sheldon
Highlands
Highlands 795
59
261
795 797
797207
90U
Park
Hutcheson
Kerr
Park
Park
Pelham
Creek
Park
Park
Bear
Binglewood
Nob Hill Park
Highlands
Highlands
6
Village
Village
Hilshire
59
Hilshire
261
795 77
22
Katy 745
Cardiff
10 330
22Hutcheson Park
Cardiff 90 Katy
Coady
Barker
Coady Cedar795
745 10 Barker
Cloverleaf
Cloverleaf
Nob Hill10Park
783
Tuffly Park
783
Bayou
Cedar Bayou
Addicks
99
6
Village
Village
Hilshire
Hilshire
742
742Katy
22
Katy 745
Cardiff
Tanglewood ParkHouston
10 330
22
Cardiff 90
Coady
Barker
Coady
745 10 Barker
Houston
737
Cloverleaf
Cloverleaf
737
783
Channelview
10
Park
Tuffly
783
Cedar
Bu
B
Cedar B
134
0
99
Village
Village
HillAddicks
Bunker
Bunker Hill
Park Park
River Oaks
ffa742
Tanglewood
Baytown
Baytown
Property
Park
Park
Galena
Galena
l742
Houston
Houston
737
oB
737 Subject
527 45 Hidalgo
Meadow
Park
Briar
Park
Channelview
Channelview
134
Bua
55
10B River Oaks Park
Village
Village 10B
Hill
Bunker
Bunker Hill
fyfa
201
Fonde45Park 610
Baytown
Baytown
Property
Subject
Alief
Alief
oluo
Park
Galena
Galena
Stubblebrooke
Clodine
Bellaire
Bellaire
Clodine
Park
Park
Deer
Deer
225 Park
59Park
527
Par
Meadow
Briar
Roseland
Park
Hidalgo
146
Ba
55
10B
10B Brookline Park
Fulshear
Fulshear Jo Stubblebrooke
Lansdale Park
201
yo
Fonde
Park
35 Park
Red
Bluff
Alief
Alief
610
Bellaire
4B
Clodine
4B
Clodine
Park 146
Deer
u
Deer Park
225
59
Roselan
ne
90A
10G
10G Park
ParkPark
Sharpstown
La
La Porte
Porte
Brookline
Fulshear
Fulshear s CJro
Lansdale
Houston Lomax
Dow Park
South
35 Red
Bluff Park
Beac
Beac
Lomax
4B
4B
enee
Hill
Hill
Park
Andover
90A
Foster
Foster
8
Four
ks
Corners
Four Corners
10G
10G
Park Hager Park
Sharpstown
La
Porte
La
Porte
Cr
Park
Wilson
Evalyn
Park
Dow
Houston
Houston
South
South
146D
HOU
Lomax
HOU
Lomax
ee
sant
288 Andover Park
Hill
sant Hill
Foster
Foster Sugar
8
k Land
Genoa
Corners
Four Corners
Genoa
Hager Park
Mykawa
Mykawa
Land Four
Sugar
34
Stafford
Stafford
34
Park
Wilson
Evalyn
Brentwood Park
501 146D
HOU
HOU
288
8 3
Shadows
Skyscraper
Genoa
Shadows
Skyscraper
Genoa
Mykawa
Bayou Park
Armand
Mykawa
Land
Land
Sugar
Sugar
34
90A
Stafford
34
Brentwood Park
501
Herbert
Herbert Stafford
Hobby
Hobby
Surf
Surf Oaks
Oaks
8
Shadows
Village
Village
Skyscraper
Brookside
Brookside
3
Skyscraper Shadows
Park
Armand Bayou
9990A
Herbert
59
Herbert
Hobby
Smada
Hobby
29
Smada
Rosenberg
Rosenberg
29
Dewalt
Dewalt
City
City
Lake
Lake
Clear
Clear
Surf
Oaks
Surf
Oaks
Pearland
Pearland
Village
Village
Brookside
Brookside
Sunset Park
99
27
27
59
Fresno
Fresno
Cl
Smada
29
Smada
1
Rosenberg
Rosenberg
29
Dewalt
Dewalt
City
City
Lake
Lake
Clear
Clear
Bay
Nassau
Friendswood
Booth
Booth
529
ea 26
Pearland
Pearland
Sunset Park
r C 26 45 27
Trammels
Trammels 6
27
146
Fort
Palmetto
Fort Bend
Bend
59
Fresno
Fresno
Palmetto
Cr l
A
1
eea 26
Booth
Booth
529
Bay
Nassau
Nassau Bay
Friendswood
Friendswood
Hastings
6
Siding
Hastings Siding
kr 26
Thompsons
Trammels
36
40
Arcola
Arcola
35
City
City146
League
League
45
Cr
Fort
Palmetto
Fort Bend
Bend
59
Palmetto
Leo
San
San Leo
ee 23
Pleak
Siding
Hastings Siding
Pleak
k 23
36
Thompsons
Thompsons
House
House Arcola
540
Arcola Hastings
35
City
League City
20
20 League
Manvel
Manvel
Dickinson
Dickinson
San
San
23
23
Pleak
The
Pleak
The Heights
Heights D
House
288
House
Whaley
Corner
Whaley Corner
icki
20
ter
20 Hulen
School
ter School
ster
19
Manvel
Manvel
19
Park
Dickinson
Dickinson
n
Park
Hulen
17
Fairchilds
17
Fairchilds
The
The Heights
Heights Dson B
35C
Juliff
Juliff 288
Whaley
Corner
Whaley Corner
icki ayou
Foster
School
Foster School
19
19
k
n
Park
Hulen Park
son
17
173 Hulen
ree
Fairchilds
35C
197
Juliff
Juliff
Bay
Needville
Needville Fairchilds
Alvin
Alvin
ig C
B
6
o
Long
Point
Long Point
Point
Sandy
Sandy Point
Fe 15|16
SantauFe
reek
15|16 3 348 197 Texa
College
Alvin
College
Community Alvin
Alvin Community
Needville
Needville
Alvin 6 Santa
ig C
B
Point
Long
Long Point
English
Four
English
Point
Sandy
Sandy Point
Corners
Four Corners
TT
Alta Loma
Fe
Fe 15|16
Santa
Santa
15|16
341348
Rosharon
Alvin
Lochridge
College
Community College
Alvin Community
Lochridge
Guy
Guy
146
English
Bra
Four
English
Camp
Corners
Four Corners
Hitchcock
Hitchcock
Mohawk
Camp Mohawk
Alta Loma
zos Lochridge
6
341
Rosharon
Rosharon
RivLochridge
Guy
Guy
ard R
45 146
Bonney
e
Bonney
Bra r
Mohawk
Camp
Hitchcock
Hitchcock
Mohawk
Camp
Mooredale
iver
35
Junction
City
Terminal
Texas
Mooredale
Texas City Terminal Junction 6
zos
44
n Be
Ri v
rnard
Aust
Liverpool
45
Bonney
er
Bonney
Damon
Damon
in B
River
Otey
Mooredale
35
Junction
Otey
City
Terminal
Texas
Mooredale
Bayou
Camp
Halls
Junction
City
Terminal
Texas
Halls Bayou Camp
ay
44
Aust ou
Liverpool
Liverpool
Damon
Damon
in
288
Otey
Hockley
Hockley
Bay
ou
288B
288
288B
28
28
Ways
Camp
Anderson
Halls
BayouAnderson
Camp Ways
Halls Bayou
Peterson
Landing
Peterson Landing
Peterson
Landing
Peterson Landing
Anderson
Ways
Anderson Ways
Regional Analysis
Environmental Factors
Location: The Office of Management and Budget (OMB) reviewed the Metropolitan Area standards in 1999
and 2000. The new standards replace the Metropolitan Area classification with a Core-Based Statistical Area
(CBSA) classification. The new Core-Based Statistical Area (CBSA) consists of a county containing an
Incorporated Place or Census Designated Place with a population of at least 10,000 along any adjacent
counties that have at least 25% of employed residents of the county who work in the CBSAs core or central
county.
CBSAs are categorized as being either Metropolitan (core population of at least 50,000) or Micropolitan
(core population between 10,000 and 50,000). This allows common statistics to be collected for less urban
areas of the nation. These two county-based CBSA definitions will cover approximately 90% of the U.S.
population.
The subject property is located in the Houston-Sugarland-Baytown CBSA, which includes ten counties:
Austin, Brazoria, Chambers, Harris, Fruit Bend, Galveston, Liberty, Montgomery, San Jacinto, and Waller.
Topography: Houston is located in the low, flat coastal plains of southeast Texas, approximately 50 miles
inland from the Gulf of Mexico and 25 miles from Galveston Bay. The proximity of the Gulf of Mexico
results in an average precipitation level of 45 inches annually. The humidity level increases during the
summer months making these months quite hot and humid. For the most part, however, the area's climate
is relatively mild. Houston has become an air-conditioned city, and its climate has been an advantage in
attracting corporate relocations and industrial users. The topography of the area is flat and level, consisting
of both wooded and open land. The official altitude of the City of Houston is 49 feet above sea level, while
Harris County ranges from sea level to 310 feet.
Climate: The Houston climate is characterized by mild winters and log, hot, muggy summers.
Vehicular Transportation: As with most large urban areas within the United States, Houston lacks an
effective mass transit system and relies almost exclusively on the automobile. Houston has the most
extensive freeway and tollway system in the southwest. Houston currently has 2,400 lane-miles of freeways
and over 280 lane-miles of tollway, including the Sam Houston, Hardy and Westpark Tollways. The Houston
Regional Mobility Plan calls for an additional 1,500 lane-miles of freeways and tollways to be built. Through
the combined effort of governmental agencies, Harris County transportation improvement expenditures have
averaged $1 billion per year since 1986. More funds are being spent in Houston on transportation and the
highway system than any other state, except California. The State of Texas spent approximately $5 billion
on improving Houston-area highways between 1990 and 2000.
Mass (Public) Transportation: Integral to Houston transportation is its Metropolitan Transit System
(METRO). Over 1,116 buses serve about 1,285 square miles and there are 25 Park & Ride locations with
28,500 parking spaces. In 2003 METRO built an estimated $325 million, 7.5-mile light rail line from the
University of Houston-Downtown to south of the Reliant Astrodome. Running at street level in its own
corridor but crossing with traffic at intersections, the electrically powered system has signal priority and will
remove about 1,200 daily bus trips from the busy Main and Fannin street corridors. The Main Street corridor
HUD Sample Report.wpd
Evergreen Valuation Services
22
Regional Analysis
is the key artery linking downtown Houston to Midtown, the Third Ward, the world-renowned Texas Medical
Center, three major universities, the Museum District, Hermann Park, the Zoo and the growing Reliant Park,
where a new football stadium, exhibition center and other venues have been built. METRORail is projected
to spur $500 million to $1 billion in economic development along its path, and its annual boardings are
estimated at 10 million to 13 million by 2020, or about 40,000 boardings each weekday. Construction started
in April 2001 and METRORail opened in December 2003.
Air Transportation: The Houston airport system is the ninth largest in the United States and 12th largest in
the world. Houston Intercontinental Airport ranks 12th in the nation in domestic passengers and 8th in
international passengers. Twenty-three airlines (12 domestic, 11 foreign) fly out of Houston, providing daily
nonstop and direct service to 113 domestic and 38 international destinations. Houston’s George Bush
Intercontinental Airport (IAH), north of the Houston CBD, garners 70% of the systems total traffic, while
William P. Hobby Airport (HOU), south of the CBD, accounts for 30%. Ellington Field (EFD), southeast
of Hobby, is both a commercial airport and a center for aerospace development.
Shipping: The Houston Ship Channel and the Port of Houston makes Houston a major transportation center.
The channel's turning basin is approximately four miles east of Houston's Central Business District. The
impact of the port is magnified by the intra-coastal waterway. Low cost barge transportation is available on
this 1,177 mile waterway that links Houston with 9,812 miles of commercially navigable waterways in the
mid-continent regions of the Mississippi River and its tributary systems, as well as 2,500 miles of waterway
along the Gulf of Mexico.
Flood Control: A concern in the Houston area in terms of environmental impact is the matter of flood
control. Several bond issues have been passed in recent years in an attempt to help finance different flood
control projects throughout the region, into the next century. While the Houston area is subject to flood
problems because of its elevation and soil composition, the problem has been limited to a large degree by
improvements made by the Harris County Flood Control District. Even with these improvements, in June
of 2001, Tropical Storm Allison created $4.88 billion in damage to Harris County, including nearly $2 billion
to Texas Medical Center facilities. Apartments and residential properties sustained about $1.76 billion in
damage. Flooding destroyed an estimated 2,744 homes and county businesses suffered an estimated $1.08
billion in damages.
Air Quality: The Houston area is home to a large concentration of petrochemical companies, which have long
had a negative impact on local air quality, and Houston consistently ranks as one of the most polluted (air
pollution) cities in the nation. In fact, an annual “State of the Air” study conducted by the American Lung
Association lists Houston as having the 5th most polluted air, behind four California cities. The poor air
quality is a negative factor in attracting new business and may result in reduced federal transportation funds
targeting freeway construction, a major source of air pollution. As a result of continual heavy industrial
activity over the past 50 years, many areas are also burdened with contaminated soil and water. These factors
do not preclude future development but are generally seen as factors which would limit most uses other than
those that are industrial related. Also, with the current attitudes (lawsuits, government regulations, etc.)
related to environmental contamination and resultant legal liability, it is advisable, and in many cases
mandatory, that any agreement to purchase real estate be subject to an environmental study.
HUD Sample Report.wpd
Evergreen Valuation Services
23
Regional Analysis
Railroads: There are four major rail systems that serve Houston and its Port. These include the Santa Fe,
Union Pacific-Missouri Pacific, Burlington Northern, and Southern Pacific rail systems. AMTRAK also
offers passenger service to most major cities from the Washington Street station.
Health Care: There are 85 hospitals with over 19,300 beds throughout Harris County. Virtually every
medical specialty is represented. Houston’s Texas Medical Center is the largest medical center in the world.
It is a leader in space sciences, bioengineering and biotechnology. Funded research activities at member
institutions total more than $714 million annually. The Texas Medical Center boasts one of the first and still
the largest air emergency service, as well as a highly successful inter-institutional transplant program. In
addition, more heart surgeries are performed at the Texas Medical Center than anywhere in the world.
Forty-two not-for-profit member institutions make up the Texas Medical Center, including 13 hospitals, two
medical schools, four schools of nursing and schools of dentistry, public health, pharmacy and virtually all
health-related careers. The main campus of the Texas Medical Center is located on about 675 acres just south
of Hermann Park in central Houston. Throughout the years, the Texas Medical Center has undergone massive
development with the addition of many major hospitals and medical research centers. The Medical Center's
growth has paralleled Houston's growth.
Texas Medical Center - Facts and Figures
5.1 million total patient visits per year
15,352 international patients
61,030 total positions within Texas Medical Center Institutions
6,176 licensed beds; 345 bassinets
19,332 students attending regular classes
70,568 participants enrolled in educational or professional retraining
189,000 visitors to the Museum of Health and Medical Science, includes 91,000 students attending its
educational programs
2,366 short courses, seminars, and workshops offered
12,227 volunteers assisting with a wide variety of tasks benefitting the TMC
$5.4 billion combined operating budgets for member institutions
$13.5 billion indirect impact on Houston’s economy
$7.0 billion member institutions’ capital investment
$714 million expended for research activities of TMC member institutions
$2.5 billion in research grants received by TMC member institutions during the past five years
$1 billion spent in expanding or renovating the facilities and infrastructure from 2000 - 2002
740 acres with more than 100 permanent buildings
22 million gross square feet in physical plant space
Source: Texas Medical Center website www.tmc.edu
HUD Sample Report.wpd
Evergreen Valuation Services
24
Regional Analysis
Cultural Attractions: Houston is one of only four U.S. cities with permanent companies in the performing
arts of opera, ballet, symphony, and theater. The 17-block Theater District is located downtown and is home
to eight performing arts organizations and more than 12,000 seats. Only New York City has more seats
concentrated in one geographic area. Performing centers include Jones Hall, Nina Vance Alley Theater,
Houston Music Hall, and the privately funded Wortham Center.
Houston offers a variety of art galleries and museums, including the Museum of Fine Arts, the Contemporary
Arts Museum, the de Menil Collection, the Rice Museum, the Rothko Chapel, the Museum of American
Architecture, the Houston Museum of Natural Science, the San Jacinto Museum of History, the Burke Baker
Planetarium and NASA's Johnson Space Center and its $70 million, 183,000-SF visitor center, Space Center
Houston.
Recreation: Houston has 298 municipal parks encompassing 19,100 land acres and 12,500 water-covered
acres. In addition, Harris County maintains 95 county parks with over 15,500 acres. Cruises are available
along the Ship Channel and on Clear Lake. The Gulf of Mexico and Galveston Island are also tourist
attractions situated approximately 50 miles south of the Houston Central Business District. Other recreational
facilities include Six Flags-Astroworld, Splash Town USA, the 42-acre Houston Zoo, Gulf Greyhound Park
in Texas City, and the Sam Houston Race Park in northwest Harris County. Houston is home to professional
baseball’s Houston Astros and the newly constructed Minute Maid Park (2000). The Houston Rockets of the
NBA and Houston Comets of the WNBA moved into the $235 million Toyota Center in 2003. The NFL
awarded the City of Houston the 32nd franchise, known as the Houston Texans, which began play in 2002 in
a new, $400+ million retractable roof stadium adjacent to the Astrodome. Houston also hosted the 2004
Super Bowl and MLB All-Star Game. Finally, Houston is home to the Aeros of the AHL.
Tourism: Houston’s downtown has been revitalized with the opening of Bayou Place, as well as numerous
restaurants and musical entertainment that has helped bring nightlife back to the downtown area. Houston
has over 11,000 restaurants including more gold-medal award winning restaurants than any other city in the
United States. A wide variety of shopping opportunities are available including the Galleria Mall, which is
legendary for its variety of shops and international ambiance. Moody Gardens in Galveston is less than a
one hour drive south of the city and features a huge aquarium pyramid, a rainforest pyramid, and two IMAX
theaters. Galveston also has a historic area as well as numerous sites and activities along the Gulf shore. Just
east of Houston is the famed San Jacinto Battleground, the site of one of the most famous battles in the fight
for Texas’ independence from Mexico.
Governmental Policies
City and County Government: The City of Houston has a mayor-council form of government in which the
mayor and 14 council members (five that are elected at large and nine from single member districts) serve
as the ruling legislative body. These 15 officials and the city controller are elected for two-year terms running
concurrently. A county judge and four commissioners perform the principal administrative and legislative
functions for Harris County and serve four-year staggered terms.
HUD Sample Report.wpd
Evergreen Valuation Services
25
Regional Analysis
Zoning: Houston and the unincorporated portions of surrounding counties are currently not zoned; thus, there
are few impediments to development. In 1990 the Houston City Council mandated the development of a
comprehensive zoning ordinance, which was rejected by voters in 1993. However, a Residential Protection
Ordinance was adopted on July 1, 1992, which is intended to protect single family and duplex development
from detrimental commercial uses. Overall, the lack of zoning is considered a positive influence on the
regional economy inasmuch as the market (consumers) determines development patterns. However, there
are instances of incompatible uses, especially in older neighborhoods. Some of the smaller municipalities
in the region do have typical zoning ordinances.
Major Public Projects: In addition to the government’s role in providing tax incentives and improved
transportation, continued expansion of public facilities has benefitted the Houston metropolitan area. The
George R. Brown Convention Center underwent a $165 million expansion in 2003 that added 700,000 square
feet to the building's existing 1.15 million square feet of meeting and exhibit space. Near the convention
center, the City of Houston built a 1,200-room, $285 million Hilton Americas Hotel, which opened in late
2003. A $265 million Downtown Baseball Stadium for the Houston Astros (Minute Maid Park) was built
and opened in the Spring 2000; a $400+ million domed football stadium opened in September 2002 for the
new Houston football team (Texans); and a new $235 million downtown arena for the Houston Rockets,
Comets and Aeros (Toyota Center) opened in late 2003.
Taxation: In Houston, there are no state or local, personal or corporate income taxes. There is a limited
8.25% sales tax (6% state, 1.25% city, 1% transit authority) on purchases of nine cents or more with certain
food and drug items exempt. The only taxes generally applied to all types of Texas businesses are ad valorem
taxes, corporate fees and annual corporation franchise taxes. The ad valorem taxes are assessed by the cities,
school districts, counties, road and municipal utility districts. While tax rates vary by jurisdiction, total real
estate taxes in the area are generally $2.50 to $3.00 per $100 of assessed value. Due to new legislation passed
in May 2006, the rates charged by school districts were reduced by $0.17 in 2006, and an additional $0.33
in 2007. To offset the lost revenues, the state has increased taxes on the sale of used cars and cigarettes. The
franchise tax has also been expanded.
Social Forces
Population: The following chart summarizes population trends for the region.
Historical and Projected Population Trends
Projection
Growth Rate
2000 - 2009
2014
2009 - 2014
Region
2000
Houston CBSA
4,715,403
5,788,330
2.30%
6,183,639
1.33%
City of Houston
1,955,243
2,110,138
0.85%
2,142,822
0.31%
20,851,820
24,697,574
1.90%
26,680,559
1.56%
281,279,915 305,921,712
0.94%
317,062,794
0.72%
State of Texas
United States
HUD Sample Report.wpd
2009
Growth Rate
Evergreen Valuation Services
26
Regional Analysis
Over the past 9 years, the population of the CBSA has increased at a compounded annual rate of 2.30%.
During the same period, the Texas growth rate was 1.90% and the national growth rate was 0.94%. Over the
next five years, the CBSA population is projected to increase at a compounded annual rate of 1.33%, while
the State of the Texas is projected to grow at a rate of 1.56% and the nation is projected to grow at a rate of
0.94%. The population of the City of Houston is projected to grow, which is encouraging in light of the fact
that most urban centers across the United States continue to lose population.
Households: The following chart summarizes trends in household growth for the region.
Historical and Projected Household Trends
Projection
Growth Rate
2000 - 2009
2014
2009 - 2014
Region
2000
Houston CBSA
1,656,797
1,959,394
1.88%
2,134,580
1.73%
City of Houston
718,572
753,272
0.53%
778,069
0.65%
7,393,354
8,513,290
1.58%
9,186,460
1.53%
105,417,477 113,833,591
0.86%
117,644,422
0.66%
State of Texas
United States
2009
Growth Rate
As of 2009, the average household size for the CBSA is 2.95 persons, compared to 2.90 for the state and 2.69
for the nation. From 2000 to 2009, the number of households in the CBSA grew at a compounded annual
rate of 1.88%, which is significantly lower than the previously noted population growth rate of 2.30%. This
suggests an increase in average household size. By 2014 the average household size for the CBSA is
projected to decrease to 2.90 persons.
Income Levels: The following chart summarizes trends in median household income levels.
Historical and Projected Trends in Household Income
Region
2000
2009
Growth Rate
Projection
Growth Rate
2000 - 2009
2014
2009 - 2014
Houston CBSA
$44,674
$58,581
3.06%
$63,857
1.74%
City of Houston
$36,871
$46,540
2.62%
$50,641
1.70%
State of Texas
$39,933
$52,111
3.00%
$56,953
1.79%
United States
$42,253
$53,679
2.70%
$57,994
1.56%
As of 2009, the median income in the CBSA was $58,581, which is 12.42% higher than the statewide median
of $52,111, and 9.13% higher than the national median of $53,679. Over the past 9 years, the median income
for the CBSA has grown at a compounded rate of 3.06%, compared to 3.00% for the State of Texas and
2.70% for the nation. Over the next 5 years, the median income for the CBSA is projected to grow at a slower
rate of 1.74%, compared to 1.79% for the State of Texas and 1.56% for the nation. By 2014, the CBSA
median income is projected to reach $63,857, which would be 12.12% higher than the projected statewide
median of $56,953 and 10.11% higher than the projected national median of $57,994.
HUD Sample Report.wpd
Evergreen Valuation Services
27
Regional Analysis
Education: Public education in Houston is supervised by various Independent School Districts, the largest
of which is the Houston Independent School District (HISD). The following is a summary of recent
enrollments at area colleges and universities:
Senior Colleges and Universities
University of Houston - Central Campus
University of Houston - Downtown
University of Houston - Clear Lake
Texas Southern University
Prairie View A&M University
Rice University
University of St. Thomas
Houston Baptist University
South Texas College of Law
35,180
11,408
7,812
12,199
8,351
5,607
11,366
2,600
1,250
Junior Colleges
Houston Community College System
North Harris Montgomery Community College
San Jacinto College District
Lee College
Wharton County Junior College
51,894
37,606
24,144
6,332
5,886
Medical Schools/Colleges
UT Health Science Center (6 institutions)
Baylor College of Medicine
Texas Woman’s University - Houston Center
3,335
1,262
1,025
Sources: Educational institutions and Texas Higher Education Coordinating Board
The following chart summarizes educational attainment for the CBSA, the state, and the nation.
Educational Attainment for Adults Over 25
Education Level
th
CBSA
State
United States
Less than 9 Grade
9.8%
10.0%
7.6%
9th - 12th Grade
9.7%
10.2%
12.1%
High School Graduate
25.5%
26.7%
28.6%
Some College, No Degree
19.9%
20.8%
21.1%
Associate’s Degree
6.2%
6.5%
6.3%
Bachelor’s Degree
19.3%
17.5%
15.6%
9.5%
8.4%
8.9%
Graduate or Prof. Degree
Source: SRC, LLC
HUD Sample Report.wpd
Evergreen Valuation Services
28
Regional Analysis
Among adults over 25 years of age, 28.8% have bachelor or graduate degrees, significantly higher than the
statewide figure of 25.8% and much higher than the national figure of 24.4%. An additional 6.2% have
associates (two-year) degrees, compared to 6.5% for the state and 6.3% for the nation. At the other end of
the spectrum, 19.6% of area adults failed to complete high school, which is similar to the statewide figure of
20.2% and similar to the national figure of 19.6%. Overall, the region has a moderately well educated
population.
Economic Conditions
Current Conditions: Refer to the following paragraphs for the current state of the Houston area economy,
as reported in Moody’s Economy.com (as of March 2010).
The Houston economy is recovering, but the pace is a bit slower than that of other Texas metro areas.
Although payrolls in many service industries are firming and oil exploration companies are rehiring,
construction payrolls continue to decline. Th e unemployment rate rose through the fourth quarter of 2009,
and in January stood at 8.5%.
In terms of exploration, the doubling in oil prices since early 2009 has boosted local activity - the number of
active rigs is up 60% from last May’s trough, and this trend will continue. As a result, the number of energy
deals is growing again. In January, IPOs are under way by Cobalt (oil), Crimson (natural gas), and Plains
All American (natural gas storage). Further Energy XXI Ltd. announced a major discovery in its Davy Jones
ultra-deep prospect in the Gulf of Mexico. Although the discovery was actually made in only 20 feet of
water, it raises expectations about the ultra-deep potential of the Gulf of Mexico shelf, a big positive for
exploration and related manufacturing of supplies and equipment.
On the downstream side, although local refiners dialed back the pace of construction of their upgrades during
the recession, the national recovery means that the activity will continue. In March 2009, both Shell and
Valero had slowed the rate of completion of their respective expansion projects at Port Arthur. Moreover,
the current mix of relatively low oil demand, relatively high oil prices, and remaining uncertainty about
federal environmental legislation will prevent a quick re-acceleration. Nonetheless, the longer-term trend
toward higher energy demand means that Shell will complete its massive Motiva project by 2012, a delay of
no more than a year and a half.
The Houston housing market is improving, and will continue to do so at a moderate pace in 2010. Sales of
existing single-family homes have jumped by about 40% since mid-2009 on the strength of homebuyer tax
credits and low mortgage interest rates. Further, prices have reversed the dip that occurred in late 2008 and
early 2009, though they have not begun to appreciate steadily yet. With inventories at about six months of
sales, supply and demand are roughly in balance. As a result, new permits for single-family homes are up
by more than 50% from their late 2008 trough, though that remains well below the pre-recession pace.
However, still-high unemployment, defaults and business failures will prevent a more robust recovery until
2011.
Th e near-term outlook for non-energy industries is improving, though uncertainties remain. In December,
the U.S. Government Accounting Office ruled against the Army’s award of a huge military vehicle contract
HUD Sample Report.wpd
Evergreen Valuation Services
29
Regional Analysis
to Oshkosh, WI instead of local BAE. Still, 3,000 BAE jobs remain at risk as the Army reviews the bid.
Separately, Houston’s medical device-making industry is growing. IDev Technologies, which makes stents,
expects to double its staff over the next two years, and Cardiovascular Systems, which makes catheters to
treat arterial disease, is on track to open its new manufacturing facility in April, employing 250 over the next
fi ve years. The presence of three major medical research institutions in Houston is the magnet attracting such
companies.
Employment: Through most of the 1980s, the Houston economy was dominated by the energy sector.
However, substantial structural alteration in Houston’s economy over the past 20 years has reduced Houston’s
vulnerability to downturns in the energy sector. At its 1981 peak, employment in upstream energy sectors
(exploration, drilling, etc.) was almost 70% of base employment. Today, it stands at 35% with just three of
the top ten private employers focused on energy. Despite the diversification, Houston remains a leader in the
energy field and changes in energy markets continue to affect Houston far more than the nation as a whole.
Houston Non-Agricultural Employment
December
2009
December
2008
Mining & Construction
269,900
297,600
(27,700)
-9.3%
Manufacturing
225,000
244,100
(19,100)
-7.8%
Trade, Transportation & Utilities
510,400
545,100
(34,700)
-6.4%
34,300
36,100
(1,800)
-5.0%
Financial Activities
141,700
143,900
(2,200)
-1.5%
Professional and Business Services
366,800
384,700
(17,900)
-4.7%
Educational and Health Services
296,600
289,900
6,700
2.3%
Leisure and Hospitality
230,600
229,000
1,600
0.7%
87,600
90,200
(2,600)
-2.9%
372,700
367,500
5,200
1.4%
2,535,600
2,628,100
(92,500)
-3.5%
Sector
Information
Other Services
Government
Total Non-Ag Employment
Δ
12/08 - 12/09
%Δ
12/08 - 12/09
Source: Texas Workforce Commission; LMI Tracer - Economic Profiles
As outlined, the Houston CBSA has lost 92,500 jobs over the past 12 months. This reflects a fairly
substantial decrease and only three of the sectors realized employment gains. Conversely, seven of the sectors
realized employment losses, with four sectors realizing losses greater than 17,000 jobs.
HUD Sample Report.wpd
Evergreen Valuation Services
30
Regional Analysis
Rank
1
2
3
4
5
6
7
8
9
10
11
Largest Regional Employers
Name
Industry
Wal-Mart Stores
Retail
Continental Airlines
Airline
Administaff
Employment Agency
Exxon/Mobil
Energy
Kroger Company
Food Service
Memorial Hermann Healthcare System
Healthcare
McDonald’s Corporation
Food Service
Halliburton
Energy
Shell Oil Company
Energy
Methodist Hospital
Healthcare
Hewlett Packard (Formerly Compaq)
Computer Technology
Employees
21,610
19,732
18,244
17,069
15,969
15,864
12,638
12,557
10,435
10,375
10,000
Source: Houston Chronicle
Unemployment: From 1982 to 1987, the Houston area lost 150,000 jobs and unemployment increased to
beyond 12%. Since 2000, the Houston area unemployment has generally increased although some decreases
were seen between 2004 - present. The unemployment rate has averaged 5.5% since 2001, and is currently
at 6.5%. Houston’s unemployment rate is well within the range that most economists consider to represent
full employment. Labor availability, although a problem in some industries, remains somewhat better in
Houston than in many other metropolitan areas. It is expected that the unemployment rate should increase
slightly over the next twelve months.
Houston Area Unemployment Rates
2010 2009 2008 2007 2006 2005 2004 2003 2002 2001
January
8.8% 6.5% 4.6% 4.6% 5.6% 5.9% 6.7% 6.8% 5.9% 4.3%
February
8.5% 6.5% 4.3% 4.6% 5.3% 5.9% 6.4% 6.7% 5.7% 4.0%
March
8.5% 6.6% 4.2% 4.1% 5.0% 5.4% 6.5% 6.5% 5.7% 4.2%
April
8.5% 6.3% 3.9% 3.8% 4.9% 5.2% 6.0% 6.5% 5.8% 4.1%
May
N/A 6.9% 4.4% 3.8% 5.0% 5.3% 6.1% 6.8% 5.9% 4.3%
June
N/A 8.0% 5.0% 4.4% 5.6% 5.7% 6.8% 7.6% 6.7% 5.2%
July
N/A 8.4% 5.1% 4.6% 5.5% 5.5% 6.5% 7.2% 6.5% 4.9%
August
N/A 8.4% 5.2% 4.1% 5.1% 5.3% 6.2% 7.1% 6.3% 5.2%
September
N/A 8.5% 5.1% 4.3% 4.7% 5.8% 5.9% 6.8% 6.1% 4.9%
October
N/A 8.5% 5.2% 3.8% 4.5% 5.4% 5.8% 6.5% 5.9% 5.0%
November
N/A 8.2% 5.4% 4.0% 4.5% 5.6% 5.9% 6.5% 6.2% 5.1%
December
N/A 8.3% 5.6% 4.2% 4.0% 5.1% 5.7% 6.1% 6.0% 5.2%
Annual or YTD Average
8.6% 7.5% 4.7% 4.2% 5.0% 5.5% 6.2% 6.8% 6.1% 4.7%
Source: Texas Workforce Commission (Houston - Baytown - Sugarland CBSA); LMI Tracer - Unemployment Rates
HUD Sample Report.wpd
Evergreen Valuation Services
31
Regional Analysis
Regional Analysis Conclusions
The general regional economy was concluded as being stable with projections for slow but continued growth.
Property values are expected to stagnate as the diversified Houston economy experiences minimal growth
or a slight contraction over the short to intermediate term. The Houston economy benefits from instability
in the energy markets, and thus the long term outlook is difficult to predict with regards to the volatile world
energy market. Moody’s Economy.com notes Houston is beginning its recovery with a small lag compared
with other Texas metro areas. Upstream energy businesses will lead the way in 2010 as oil prices remain
high, and downstream will add later on as fundamental oil demand firms. Longer term, above-average
population growth and further expansion in energy, health related and distribution industries will help propel
above-average gains.
HUD Sample Report.wpd
Evergreen Valuation Services
32
6
Neighborhood Map
Sprin
Sprin
S
10
6
745
745
0
Barker
Barker
748
Barker
Barker
748
747
747
751
751
10
10
Addicks
Addicks
Addicks
Addicks
751
751
10
753B
753B
754
754
755
755
753B
753B
10
754
754
10
8
755
755
757
757
10
Park
Bendwood
Buffalo
B
V
Bunker
Poin
Poin
Piney
PineyHill
Piney
Piney PP
Buffalo Bayou
ayou
u
yo
Ba
o
l
u
ffa
yo
Piney
Point Gully
Gully
Piney
Bu
Murray Park
Ba Point
o
l
ffa
u
Gull
Piney
Point
Gull
Piney Point
B
Murray Park
Medical
Rosewood
Medical
Rosewood
RD
Buffalo Bayou
6
6
WESTHEIMER
8
Buffalo Bay
ou
WESTHEIMER RD
Buffalo Bay
ou
Rosewood
Me
Rosewood Me
Briar M
WESTHEIMER RD
8
WESTHEIMER RD
P
Blossom Heights B
Andrau Airpark
Clodine
Clodine
F-M 1093
59
Jeanetta
Jeanetta
Alief
Alief
Alief
Alief
Brays B
ayou
Clodine
Clodine
F-M 1093
Blossom Heig
Jeanetta
Jeanetta
Andrau Airpark
Brays B
ayou
3
758A
759
758A759
10
Vi
Hedwig
Hedwig Vi
Bendwood Park
Hedwi
Hedwig
Villag
Hill
Bunker
Bunker Hill
8
748
748
ayou
Buffalo
B
758A
759
758A759
757
757
59
Bellaire
West
Bellaire West
-M 1093
6
Crain Park
Bellaire
West
Bellaire West
Crain Park
Sharpstown Park
6
Sharpstown
ayou
ys B
a
r
B
ay
ys B
Bra
59
Subject Property
Four
Corners
Four Corners
Subject Property
Stubblebrooke
Four Corners
Stubblebrooke Four Corners
Oak Hill
8
99
Figure Four Lake
6
r
ste
Oy
ee
Cr
k
Lake
Gannoway
6
Fish
White Lake
k Lake
e
e
Lake
Gannoway
r
rC
Fish Lake
Lake
White
e
t
s
Red
Red Gully
Gully
90A
Oy
Cleveland Lake 59
Pumpkin Lakes
Red Gully
Gully Sugar
Sugar Land Muni/Hull Field Red
Land
Sugar Land
Cleveland Lake 59
Pumpkin Lakes
Lake
Eldridge
Sugar Land Muni/Hull Field 90A
Land
Sugar
Sugar Land
Horseshoe Lake
Eldridge Lake
Char
90ALake
Horseshoe Lake
Brooks Lake
Char6 Lake
90A
6
Old River Lake
Paynes
Lake
Paynes
Brooks
Old River Lake
99
D
2R
76
FM
2
RD
D 76 762
ROA
FM
59
Houston Fishing Club Lake
Smada
Smada
99
FM
59
59
6
59
6
Old River
F-M
762
F-M
762
Old River
Crabb
Crabb
CRABB
Crabb
Crabb
RIVER
R
CRABB
A
GE
ORD
GE R
P S
A GE
OR
GE
Hermann Hospital Lake
27
Trammels
Trammels
6
Trammels
Trammels
59
Black Lake
S
RD
USA
Street
Atlas
DeLorme.
1998
©
USA
StreetAtlas
AtlasUSA
DeLorme. Street
©
1998DeLorme.
©1998
USA
Street
Atlas
DeLorme.
1998
©
D
Booth
Booth
F-M
Booth
Booth
27
59
F-M
P
Street
Atlas
DeLorme.
98
USA
USA
StreetAtlas
AtlasUSA
DeLorme. Street
98
98DeLorme.
Street
Atlas
DeLorme.
98
Dewalt
Dewalt
Lake
Hermann Hospital
6
D
RIVER
R
8
City8
Missouri 90A
Stafford
Stafford
City
Missouri
Missouri City
Lake
Houston Fishing Club
Stafford
Stafford
Frost Lake
Paynes
Herbert
PaynesHerbert
Frost Lake
Herbert
Herbert
Smada
Smada
90A
90A
90A
90A
reek
ek
es
Cr
eek
ake
8
99
Oyster C
Oak Hill
ekFigure Four Lake
reek
Cre
Oyster C
eek
ter
59
Black Lake
ster Creek
747
747
Oyster Creek
745
745
Neighborhood Analysis
A property is an integral part of its surroundings and must not be treated as an entity separate and apart from
its surroundings. Therefore, in order to determine the value of a property, a careful and thorough analysis
must be made of the area in which the property under study is found. This area is commonly referred to as
a neighborhood.
A neighborhood can be a portion of a city, a community or an entire town. It is usually considered to be an
area that exhibits a fairly high degree of homogeneity as to use, tenancy and certain other characteristics.
Homogeneity is a state of uniform structure or composition throughout. The value of a property is not found
exclusively in its physical characteristics. Physical, economic, political and sociological forces found in the
area interact to influence real estate values. In order to determine the degree of influence extended by these
forces on a property, their past, present and probable future trends must be analyzed in depth.
The following information is presented in summary chart form to give the reader a quick overview of the
subject neighborhood and how it compares to other neighborhoods in the greater Houston area.
Summary of Neighborhood Characteristics
Location
Built Up
Urban
Fully Developed
X Over 75%
X Suburban
25% to 75%
Rural
Under 25%
Growth Rate
Rapid
X Steady
Slow
Property Values
Increasing
X Stable
Declining
Demand/Supply
Shortage
X In Balance
Oversupply
Rent Controls
Yes
X No
Likely
Overview
The boundaries of the subject neighborhood may be defined as follows.
Neighborhood Boundaries
North
US 90A
South
Lexington Boulevard
East
FM 1092
West
US 59 (Southwest Freeway)
Location
The subject is in the extraterritorial jurisdiction (ETJ) of the City of Spotford, which is a suburban community
located 15 miles southwest of the Houston CBD. Specifically, the site is situated on the west side of Brain
Lane, roughly ¼ mile north of Avenue C. For this analysis, the subject neighborhood may be defined as the
HUD Sample Report.wpd
Evergreen Valuation Services
34
Neighborhood Analysis
area bounded by US 90A on the north, Lexington Boulevard on the south, FM 1092 on the west, and US 59
(Southwest Freeway) on the east. The western half of the neighborhood falls within the City of Sugar Land,
while the eastern half encompasses portions of Missouri City, the City of Spotford, and unincorporated Fruit
Bend County. Despite the various jurisdictions, the neighborhood is fairly homogenized in terms of
demographics and overall appeal.
Except for that portion within the City of Spotford, the neighborhood is served by the Fruit Bend Independent
School District. The City of Spotford has the only municipal school district (Spotford Municipal School
District) in all of Texas.
Even though Spotford is known as a bedroom community of Houston, it is estimated the daytime population
is four times the number of permanent residents. Notable companies include United Parcel Service, Texas
Instruments (Spotford’s largest employer), and Tyco.
Access
Access to and through the neighborhood is considered good. The subject is roughly 1.5 miles east of US 59
(Southwest Freeway) and about four miles southwest of the Sam Houston Parkway, which is a tollroad
forming a loop around the Houston area. US 90A is a major east-west highway and forms the neighborhood’s
northern boundary. Overall, from the subject neighborhood, one can reasonably make connections to all parts
of the Houston metropolitan area.
Land Use
The neighborhood witnessed considerable development throughout the1990s and 2000s. US 59 (southwest
Freeway) is lined with commercial uses, including numerous retail centers, restaurants, and the local
operations of Texas Instruments. Spotford-Dewalt Road also has a scattering of retail-commercial
developments. Single-family homes and two golf courses (Riverbend Country Club and Sugar Creek Country
Club) are the largest land uses. The area within a mile of the subject is improved with a large concentration
of apartments.
Just south of the subject is the Shri Swaminarayan
Mandir temple. This Mandir, which opened in
2004, is the first constructed of stone in United
States. The 25,620-SF structure is constructed
entirely of marble from Italy and limestone from
Turkey. There is no iron or steel anywhere in the
structure. The stone that makes up the temple was
shipped to India where it was hand-carved with
traditional Vedic deities and motifs.
Approximately 33,000 individually marked pieces
were then shipped to Houston and assembled.
HUD Sample Report.wpd
Evergreen Valuation Services
35
Neighborhood Analysis
Land uses immediately surrounding the subject include a church to the north, the Shri Swaminarayan Mandir
temple to the south, and multifamily apartments to the east and west. The property appears to fit well into
the neighborhood and its surroundings.
The following chart summarizes land uses for the neighborhood, as estimated by the appraisers from visual
observation.
Neighborhood Land Uses
Present Land Use
50 % 1 Family
6
% 2 to 4 Family
15 % Multifamily
2
% Condo/Coop
15 % Commercial
2
% Industrial
10 % Vacant
Change In Use
X Not Likely
From
Likely
N/A
Taking Place
to
N/A
Predominant
Occupancy
Owner
X Tenant
6
% Vacant
Demographics
Population: The following chart summarizes population trends within 1-, 2-, and 3-mile radii of the subject,
as well as comparative figures for the CBSA.
2000
2009
2014
2000
2009
Census
Estimate
Projection
-2009 Growth Rate
-2014 Growth Rate
Neighborhood Population Trends
1-Mile
2-Mile
7,781
29,843
12,778
37,454
18,818
40,865
5.67%
2.56%
8.05%
1.76%
3-Mile
75,899
89,915
90,105
1.90%
0.04%
CBSA
4,715,403
5,788,330
6,183,639
2.30%
1.33%
Over the past 9 years, the population of the subject neighborhood (1-mile-mile radius) has grown at a
compounded rate of 5.67%, while the CBSA population has grown at a rate of 2.30%. Over the next 5 years,
the population of the subject neighborhood is projected to grow at a compounded rate of 8.05%, while the
CBSA population is projected to grow at rate of 1.33%.
HUD Sample Report.wpd
Evergreen Valuation Services
36
Neighborhood Analysis
Households: The following chart illustrates trends in household formation for the neighborhood.
2000 Census
2009
2014
2000
2009
Estimate
Projection
-2009 Growth Rate
-2014 Growth Rate
Neighborhood Household Trends
1-Mile
2-Mile
2,719
9,800
4,164
6,904
4.85%
10.64%
11,490
14,183
1.78%
4.30%
3-Mile
25,989
CBSA
1,656,797
28,681
31,821
1.10%
2.10%
1,959,394
2,134,580
1.88%
1.73%
Over the past 9 years, the number of households in the neighborhood has grown at a compounded rate of
4.85%, while the number of households in the CBSA grew at a rate of 1.88%. Over the next 5 years, the
number of households in the subject neighborhood is projected to grow at a compounded rate of 10.64%,
while the number of households in the CBSA is projected to grow at a rate of 1.73%.
Income Levels: The following chart summarizes income trends for the neighborhood.
2000
2009
2014
2000
2009
Neighborhood Median Household Income Trends
1-Mile
2-Mile
3-Mile
Census
$63,199
$70,996
$65,599
Estimate
$70,215
$80,977
$79,678
Projection
$70,291
$82,334
$83,482
-2009 Growth Rate
1.18%
1.47%
2.18%
-2014 Growth Rate
0.02%
0.33%
0.94%
CBSA
$44,674
$58,581
$63,857
3.06%
1.74%
As of 2009, the median household income for the neighborhood (1-mile-mile radius) was $70,215, which is
19.86% greater than the CBSA median of $58,581. Over the 9 year period from 2000 to 2009, median
income for the neighborhood has grown at a compounded rate of 1.18%, while the CBSA grew at a greater
rate of 3.06%. Over the next five years, income growth is projected at 0.02% for the neighborhood and
1.74% for the CBSA.
Conclusions
In summary, the subject is located in a suburban community roughly 15 miles southwest of the Houston
Central Business District. The neighborhood’s primary corridors are devoted primarily to mixed commercial
use including retail, office and some vacant land. The neighborhood saw significant development activity
in the 1990s and 2000s. Access to the neighborhood is good via the Southwest Freeway and the Sam
Houston Tollway, which enable convenient connections to all parts of the Houston Metro area.
HUD Sample Report.wpd
Evergreen Valuation Services
37
Apartment Market Analysis
Macro Market Analysis
This apartment market analysis is primarily based on information provided within REVAC’s Year-End 2009
Apartment Occupancy & Rental Survey. A summary of the existing, under construction and planned
multifamily housing development is shown in the following table:
Year Built
Prior to 1960
1960 - 69
1970 - 79
1980 - 89
1990 - 94
1995 - 99
2000 - 04
2005 - 09
TOTAL EXISTING
UNDER CONSTRUCTION
PROPOSED
TOTALS
# of
Units
13,095
68,705
185,969
124,886
16,363
50,333
53,296
70,019
582,666
3,793
3,231
589,690
# of
Projects
476
972
987
671
74
216
225
272
3,893
16
10
3,919
Avg. # of
Units/Year
1,310
6,871
18,597
12,489
3,273
10,067
10,659
14,004
9,711
3,793
3,231
9,828
Avg. Size of
Apt. Complex
28
71
188
186
221
233
237
257
150
237
323
150
% of
Market
12.1%
24.8%
25.2%
17.1%
1.9%
5.5%
5.7%
6.9%
99.3%
0.4%
0.3%
100.0%
As outlined, the overall apartment market is comprised of numerous 1960s, 1970s and early 1980s era
projects. In fact, approximately 79.2% of the existing units were built prior to 1990. However, the amount
of new development has increased substantially since 1990. In particular, there were 104 projects built in
1999 totaling 25,472 units. Not since 1984, when 18,416 units were built, had there been so much
development. The 53,296 units added between 2000 - 2004 was slightly higher than the previous 5-year
period. Likewise, the 2005 to 2009 construction, which has averaged 14,004 units, is above the previous
annual 10-year average of 10,363 units per year. The 26 projects currently under construction and/or
proposed for 2010 - 2011 total 7,024 units. Admittedly, some proposed projects may never be built; however,
many projects in the planning stages likely to be built within the next 12 to 18 months have not been
announced.
Absorption/Occupancy: The Houston housing market is fairly stagnant, with decreasing occupancies and
nominal absorption. Listed below is a summary of the net absorption and occupancy rates of multifamily
complexes within the Houston area:
HUD Sample Report.wpd
Evergreen Valuation Services
38
Apartment Market Analysis
12 Months Ending
Net Absorption (Units)
Occupancy Rate
Year-End 2009
(4,753)
87.6%
Year-End 2008
799
89.4%
Year-End 2007
(918)
90.3%
Year-End 2006
6,192
93.4%
Year-End 2005
17,816
90.8%
TOTALS
19,136
AVERAGE - 5 YEARS
3,827
90.3%
As outlined, the Houston apartment market showed signs of improvement in the latter part of 2005 - 2006.
Of course, much of the 2005 improvement can be attributable to housing victims of Hurricane Katrina. Many
former Louisiana residents have opted to stay although others have left. As a consequence, the long term
impact on occupancy is relatively modest. The year-end 2007 performance was less than desirable and can
be described as stagnant, while the 2008 performance showed a continued decline in occupancies and
negligible absorption. However, over the last twelve (12) months ending year-end 2009, declining
occupancies and negative absorption has been realized.
Although 70,019 units were added over the past 5 years, net absorption was a positive 19,136 units while
occupancy declined from 90.8% to 87.6%. The negative absorption in year-end 2009 was attributable to the
substantial new construction experienced during the preceding years. Under construction and proposed
development for 2010 - 2011 is lower than the most recent history, thus the potential to increase overall
occupancy exists.
Rental Rates: A summary of historic rental rates on resident paid utility projects within the Houston region
are shown in the following table:
Survey Period
Average Unit
Size (SF)
Average
Monthly Rent
Average Monthly
Rent PSF
Annual
Change
Year-End 2009
868
$738
$0.850
1.23%
Year-End 2008
862
$724
$0.840
4.14%
Year-End 2007
858
$692
$0.807
1.32%
Year-End 2006
853
$679
$0.796
1.44%
Year-End 2005
850
$667
$0.785
---
Compounded Annual Change (Year-End 2005 - Year-End 2009)
2.01%
Total Change (Year-End 2005 - Year-End 2009)
8.35%
As outlined, area rental rates have increased at a compounded annual average rate of 2.01% over the past four
years, or 8.35% overall. Most importantly, the most recent 12-month change has been 1.23%.
HUD Sample Report.wpd
Evergreen Valuation Services
39
Apartment Market Analysis
Submarket Analysis
For purposes of this analysis, the subject's submarket is best reflected by all apartments located within
REVAC’s Market Area 23 (Fort Bend County).
Supply: The following table presents multifamily construction within the submarket.
Year Built # of Projects # of Units
Prior to 1960
0
0
1960 - 1969
0
0
1970 - 1979
9
1,409
1980 - 1989
16
3,338
1990 - 1999
17
4,213
2000 - 2009
21
5,688
Totals
63
14,648
Units Per Year
0
0
141
334
421
569
293
% of Total
0.00%
0.00%
9.62%
22.79%
28.76%
38.83%
100.00%
As outlined, there are a total of 14,648 units in the submarket. A total of 5,688 or 38.83% of the total were
built since 2000, which parallels the growth statistics cited in the neighborhood analysis. According to
REVAC, one new addition has come online since mid-2009 (West End Ranch Apartment, Sugarland - 312
units) and no new projects have been announced. However, given the amount of vacant land available
throughout the county, along with projected household growth, new supply will come on line when
construction financing becomes available.
The following table summarized vacancy and rental rates for the subject’s submarket.
Vacancy
Rental Rates
Physical
Change
Economic
Change
$/Month
$/SF
Change
Yr End 09
6.7%
0.7%
11.8%
0.8%
$856
$0.94
-0.6%
Mid Yr 09
6.0%
-1.3%
11.0%
-1.4%
$861
$0.95
-2.5%
Yr End 08
7.3%
-2.5%
12.4%
-2.9%
$869
$0.97
1.3%
Mid Yr 08
9.8%
1.8%
15.3%
1.5%
$857
$0.96
5.9%
Yr End 07
8.0%
0.5%
13.8%
1.7%
$819
$0.91
0.9%
Mid Yr 07
7.5%
0.9%
12.1%
1.8%
$811
$0.90
1.4%
Yr End 06
6.6%
0.0%
10.3%
-0.5%
$802
$0.89
1.3%
Mid Yr 06
6.6%
-0.9%
10.8%
-1.2%
$791
$0.88
1.0%
Yr End 05
7.5%
-2.7%
12.0%
-2.7%
$773
$0.87
0.5%
Mid Yr 05
10.2%
-
14.7%
-
$766
$0.86
-
HUD Sample Report.wpd
Evergreen Valuation Services
40
Apartment Market Analysis
As of year-end 2009, physical vacancy within the submarket stood at 6.7%, up from 6.0% at mid-year 2009.
Further, economic vacancy rose to 11.8%, up from 11.0% six months earlier, but down from the 12.4%
reported for year-end 2008. Over the past five years, physical vacancy has averaged 7.6%, while economic
vacancy averaged 12.4%. Overall, the subject’s submarket is considered fairly stable and improving with
modest increases in rents and occupancies anticipated.
Micro-Market Analysis
The most direct test of the submarket is a survey of properties that actually compete with the subject property.
Following is a summary of the rent comparables detailed later in the Income Approach.
Summary of Rent Comparables
No. Name
Sub Stubblebrooke
Units
Avg. Unit
Size (SF)
Avg Rent Avg Rent
Per Month
PSF
312
898
$853
YOC
Occup
$0.950
2007
91%
1
Lakeland Estates
264
913
$906
$0.992
2008
92%
2
Preserve @ Colony Lakes
420
918
$838
$0.913
2004
92%
3
Sandybrooke
240
1,004
$946
$0.942
2002
89%
4
Trestles
188
941
$888
$0.943
1999
91%
5
Southwind
312
969
$975
$1.006
2003
92%
Total/Average (Incl. Subject)
289
941
$901
$0.958
2003
91.2%
Weighted Averages
289
937
$896
$0.956
1214
91.4%
Among the subject and its direct competitors, rental rates range from $0.91/SF to $1.01/SF. On a per unit
basis, average rents range from $838/month to $975/month. Occupancy levels range from 89% to 92%, with
an average of 91.2% and a weighted average of 91.4%. The specific relationship between the subject and the
comparables is detailed further in the Income Approach section of this report.
HUD Sample Report.wpd
Evergreen Valuation Services
41
PART IV
SUBJECT PROPERTY DATA
HUD Sample Report.wpd
Evergreen Valuation Services
42
Site Description
Location:
The subject is in the extraterritorial jurisdiction (ETJ) of the City of
Spotford, which is a suburban community located 15 miles southwest
of the Houston CBD. Specifically, the site is situated on the west side
of Brain Lane, roughly ¼ mile north of Avenue C. The street address
is 1123 Brain Lane, Spotford, Texas 77223.
Dimensions, Area and Shape:
According to the survey provided, the subject site measures 11.77
acres. The subject site is a level, rectangular interior tract. For a visual
representation of the subject tract, please refer to the exhibits following
this section.
Easements & Encroachments:
The appraisers are not aware of any adverse easements or
encroachments, and it is specifically assumed that none exist.
Surrounding Land Uses:
The subject is surrounded largely by residential properties, including
several similar multifamily projects.
Utilities:
Water Sewer Electric Natural Gas -
Soil Conditions:
In the absence of a soil survey, it is assumed that the subject soils are
capable of supporting a moderate scale development.
Topography/Drainage/Flood:
The site is generally level and there is no evidence of drainage
problems. According to FEMA Community Panel #48157C0255J,
dated January 3, 1997, the site is located in Zone X, which is outside
the limits of the 100-year flood hazard zone.
Access/Frontage:
A site survey was not provided. The site has frontage along the west
side of Brain Lane and is accessed via one curbcut. Visibility is good.
Zoning Classification:
None
Permitted Uses:
The subject is not zoned, but it is in the Spotford ETJ, so all
development must be approved by the City of Spotford. As a recently
completed project, the subject is assumed to be a legally conforming
use.
HUD Sample Report.wpd
Fruit Bend WCID #2
Fruit Bend WCID #2
Direct Energy
Not used
Evergreen Valuation Services
43
Improvement Description
This site is improved with a 312-unit garden style apartment complex completed in 2007 and 2008. There
are sixteen three-story apartment buildings. A large clubhouse/leasing center is at the site’s entrance. The
buildings on the southern half of the site were built in 2007, with the northern half completed in 2008.
Construction characteristics include wood framing, brick and cementitious siding exteriors, and pitched roofs
covered with composition shingles.
According to the rent roll provided, the subject has a net rentable area (NRA) of 280,148 SF, indicating an
average unit size of 898 SF (280,148 SF ÷ 312 units). The clubhouse/leasing office measures approximately
4,795 SF, and other building areas measure 312 SF, resulting in a gross building area (GBA) of 285,255 SF.
The improvements are distributed over the site area of 11.772 acres. The subject exhibits a land to building
ratio of 26.50:1 and an overall project density of 26.5 units per acre. The subject site has 499 parking spaces,
indicating a parking ratio of 1.60 spaces per unit.
Overall, the subject improvements are considered to be in good condition and compete favorably with
neighboring properties. The following chart summarizes the unit mix for the subject property.
Unit Mix for Subject Property
Units
Unit Type
SF/Unit Total SF
Amenities/Special Features
1 Bed 1.0
Bath
172
745
128,140
Standard appliances
2 Bed 2.0
Bath
128
1,067
136,576
Standard appliances, balcony
3 Bed 2.0
Bath
12
1,286
15,432
312
898
280,148
Total (Mean)
Standard appliances, no balcony
The following charts summarize project and unit amenities at the subject property.
Project Amenities
Guest room(s)
0
X Community Room(s)
1
Sauna/Steam room(s)
0
X Swimming Pool(s)
1
X Exercise room(s)
1
Tennis Court(s)
0
Laundry Facilities (coin)
Racquet Ball Court(s)
0
X Picnic/Play areas
1
X Jacuzzi(s)/Community Whirlpool(s)
1
X Other (theater, game room, volleyball, jogging trail
Project Security System (describe)
HUD Sample Report.wpd
Evergreen Valuation Services
44
Improvement Description
Unit Amenities
X Ranges
(electric)
X Disposal/Compactor
X Refrigerator
X Air Conditioning (central)
X Microwave
0
X Carpet
X Dishwasher
X Window treatments
X Balcony/Patio
Fireplace(s)
X Laundry hookups (in units)
Security System (describe)
Vaulted ceiling/Skylight(s)
0
X Washer/Dryer (in units)
Other
0
(granite counters, computer niches)
312
The following chart summarizes the ratings of various features of the subject property, as estimated by the
appraisers. These ratings are relative to competing properties in the same market.
Comparative Rating of Subject Property
Project Features
Good
Avg
Location
X
General Appearance
X
Amenities & Recreational Facilities
X
Density (units per acre)
X
Unit Mix
X
Quality of Construction (materials & finish)
X
Condition of Exterior
X
Condition of Interior
X
Appeal to Market
X
Soundproofing - Vertical
X
Soundproofing - Horizontal
X
Unit Features
Good
Condition of Improvements
Avg
Poor
Fair
Poor
X
Room Sizes and Layout
X
Adequacy of Closets and Storage
X
Kitchen Equipment, Cabinets, Workspace
X
Plumbing - Adequacy and Condition
X
Electrical - Adequacy and Condition
X
Soundproofing - Adequacy and Condition
X
Insulation - Adequacy and Condition
X
Overall Livability
X
Appeal and Marketability
X
HUD Sample Report.wpd
Fair
Evergreen Valuation Services
45
Improvement Description
A more detailed description of the improvements is below. This description is based upon the appraiser’s
personal observations, information provided by the on-site management, and/or what is typical within the
marketplace. It should be noted that no plans or specifications of the subject property were furnished to the
appraisers.
Foundation:Concrete
slab.
The apartment
foundations.
buildings
have
reinforced
concrete
slab
Structural:
Wood framed. The buildings feature standard wood framed
construction with 2" x 4" stud walls.
Exterior Walls:
Brick/Siding. The building exteriors are primarily brick, with some
cementitious siding.
Roofs:
The subject buildings feature pitched, composition shingle roofs. There
is no evidence of recent rain damage, and the roofs are assumed to be
free of leaks.
Interior Walls:
Wood studs covered with gypsum board that is taped, textured and
painted. Painted wood molding throughout.
Ceilings:
Gypsum board that is taped, textured and painted. Generally, ceilings
are 8 feet high.
Sub-Floors:
The ground floors feature a concrete slab, while all upper floors are
lightweight concrete over plywood decking.
Floor Covering:
Vinyl/Ceramic/Carpet. Floor covering is vinyl in the kitchen, ceramic
tile in the bathrooms, and carpeting in the other rooms.
Doors:
Insulated steel entry doors have a locking door knob, peek hole, and
deadbolt. All interior doors are hollow core wood with wood trim.
Windows:
Windows are double-pane glass in vinyl-clad aluminum frames.
Restrooms:
Bathrooms feature porcelainized steel tubs with ceramic surrounds,
standard toilet, and vanity with drop-in sink.
Kitchen Equipment:
Double stainless steel sink with garbage disposal, dishwasher, electric
range/oven with matching vent/hood, frost free refrigerator, wood
cabinets, and laminate counters.
HUD Sample Report.wpd
Evergreen Valuation Services
46
Improvement Description
Plumbing and Electrical:
The plumbing system and electrical work are assumed to be in
accordance with local codes. Hot water is provided by individual
electric heaters. Units are individually metered for electric. The
property is master-metered for water, which is passed through to the
tenants via a RUBS.
HVAC:
Forced air. All the units have forced air HVAC with electric furnaces
and ground-mounted compressors.
Fire Protection:
All units have smoke detectors.
Paving/Parking:
Driveways and sidewalks are concrete paved, while the parking lot is
asphalt. The subject property has 403 surface parking spaces, 48
carports, and 48 garages, yielding a parking ratio of 1.60 spaces per
unit.
Parking Compliance:
Since the subject is in the Spotford ETJ, there are no specific parking
requirements. If it were within Spotford city limits, the code would
require 544 spaces, which is slightly more than the 499 currently
provided. As a practical matter, the existing parking appears adequate
for multifamily use.
Laundry Facilities:
Each unit includes a full-size washer/dryer, so there are no common
laundry rooms.
Land to Building Ratio:
26.50:1 (on GBA)
Economic Life:
According to the Marshall & Swift Valuation Service Guide, properties
similar to the subject have an expected economic life of 50 years
(Average quality, Class "D" construction). Considering the quality of
construction and ongoing capital improvements, the subject
improvements are estimated to have an overall effective age of 1
year(s). Therefore, a remaining economic life of 49 years is projected.
Deferred Maintenance:
Considering the age of the subject improvements, they were generally
observed to be in good condition, and the appraisers have deducted $0
for deferred maintenance.
Code Violations:
The appraisers are not aware of any building code or safety violations.
HUD Sample Report.wpd
Evergreen Valuation Services
47
Highest & Best Use
A property must be appraised in terms of its Highest and Best Use. According to The Appraisal of Real
Estate, Tenth Edition, page 275, Copyright 1992, by the Appraisal Institute. The definition of highest and
best use is defined as:
The reasonable probable and legal use of vacant land or an improved property, which is
physically possible, appropriately supported, financially feasible, and that results in the
highest value.
When a site contains improvements, the highest and best use may be determined to be different from the
existing use. Implied in this definition is that the determination of highest and best use takes into account the
contribution of a specific use to the community and community development goals, as well as the benefits
of that use to individual property owners. An additional implication is that the highest determination of
highest and best use results from the appraiser's judgment and analytical skills; that is, the use determined
from analysis represents an opinion, not a fact to be found. In appraisal practice, the concept of highest and
best use represents the premise upon which value is based. In the context of most probable selling price,
another appropriate term to reflect highest and best use would be the most probable use.
Any determination of highest and best use includes identifying the motivations of probable purchasers. The
motivations are based on perceptions of benefits that accrue to property ownership. Different motivations
influence the highest and best use and are significant to an appraiser's conclusions about the highest and best
uses of any parcel of real estate.
The benefits of investment properties that are not owner occupied relate to net income potential and to
eventual resale or refinancing. The highest and best use decision for investment property is often influenced
by the income tax and inflation hedge aspects of the existing or proposed improvements. Determination of
the type and intensity of the improvement to be placed on the investor's land often requires an after-tax return
analysis of various alternatives.
Land or improved property that has resale profit as its principal potential benefit is purely speculative. The
price such land commands in the market reflects the real motivation of the purchaser/speculator.
This portion of the appraisal process is based on the definition of Highest and Best Use supplied previously.
From this definition, it is obvious that market value of the land or site and of an improved property are both
estimated under the assumption that potential purchasers will pay prices that reflect their analysis of the most
profitable use of both land, as vacant, and property, as improved.
A use must meet four criteria as follows: (1) Physically Possible; (2) Legally Permissible; (3) Financially
Feasible; (4) Maximally Productive.
Physically Possible: The physical characteristics of a site can affect the uses to which it can be put. These
characteristics can include size, location, shape, topography, easements, utility availability, and surrounding
properties. The first constraint imposed on the possible use of the property is dictated by the physical aspects
of the site itself. A tract’s size and location within a given block are two of the most important determinants
HUD Sample Report.wpd
Evergreen Valuation Services
48
Highest & Best Use
of value. In general, the larger the site, the greater its potential to achieve economies of scale and flexibility
in development. The key determinant in developing a site is the permitted size of the project. More land
permits higher density development, higher floor to area ratios (FAR), etc. The total number of square feet
allowed for a building structure tends to rise in proportion to the size of the lot. Location is important when
considering a site's proximity to open plazas, retail trade areas, work force areas, public transportation, major
highways (access/visibility), etc.
The subject is in the extraterritorial jurisdiction (ETJ) of the City of Spotford, which is a suburban community
located 15 miles southwest of the Houston CBD. Specifically, the site is situated on the west side of Brain
Lane, roughly ¼ mile north of Avenue C. The site encompasses 11.772 acres, sufficient to support a
moderate-scale development. The subject site is a level, rectangular interior tract. All typical utilities are
available to the site. Land uses immediately surrounding the subject include a church to the north, a Shri
Swaminarayan Mandir temple to the south, and multifamily apartments to the east and west. The property
appears to fit well into the neighborhood and its surroundings.
Based upon the physical characteristics, and considering the subject’s configuration and immediate
surroundings, the site is best suited to multifamily development, either for sale condominiums or rental
apartments.
Legally Permissible: In the case of properties that are held in what is normally referred to as Fee Simple
ownership, there are several restrictions on the rights of the property owner affecting the use and enjoyment
of the property. These restrictions are the powers of the government: police power, eminent domain, escheat
and taxation.
The influence of these restrictions lie primarily in the government police power. Police power is exercised
by the imposing of restrictions on the uses of land. These restrictions may take the form of zoning codes,
building codes, historic district controls or environmental regulations. The subject is not zoned, but it is in
the Spotford ETJ, so all development must be approved by the City of Spotford. As a recently completed
project, the subject is assumed to be a legally conforming use.
Eminent domain also plays a part in the highest and best use of land through easements that can be created
by the condemnation of a portion of property. A ready example is utility easements which are typically found
along property borders in the city. While these easements are owned by the property owner, his use of these
areas may be restricted.
In the case of utility easements, underground easements cannot be built over, while above-ground easements
may have height restrictions imposed upon possible improvements constructed under them. The subject
property was not noted to have any easements which were considered to detrimentally affect the property;
however, easements are a legal covenant and the services of a competent title attorney would be required to
ascertain exactly whether any detrimental easements exist. Considering the physical and legal characteristics,
the subject site appears best suited to multifamily development.
HUD Sample Report.wpd
Evergreen Valuation Services
49
Highest & Best Use
Financially Feasible: The best evidence of feasibility is the level of ongoing development. As detailed in
the Apartment Market Analysis, new construction has slowed considerably in the greater Houston market,
and it has effectively come to a halt in the subject’s submarket. Absorption has been reasonably strong, so
while vacancy has increased, the market has held up reasonably well. However, construction financing is
extremely difficult to obtain. Until financing becomes more readily available, it is unlikely that new market
rate developments will break ground.
Maximally Productive: The maximally productive use is considered to be that use among all financially
feasible uses that would bring the greatest return to the land. Based on the constraints and conditions outlined
above, it is reasonable to conclude that the highest and best use of the subject parcel, as vacant, would be
multifamily development.
Highest and Best Use As Vacant
To determine the highest and best use of the subject property, as vacant, the appraisers conducted a thorough
analysis, including an inspection of the property and studies of the neighborhood, region, and trends. The
site's physical attributes and surrounding development were also considered. Based on available evidence,
the highest and best use, as vacant, is to hold for future multifamily development as the economy improves.
Highest and Best Use, As Improved
The existing improvements are of a design that meets the existing demand of the immediate marketplace, and
they are mainly consistent with the highest and best use identified for the site as if vacant. Thus, the highest
and best use, as improved, is continued use as a multifamily apartment project.
HUD Sample Report.wpd
Evergreen Valuation Services
50
PART V
VALUATIONS AND CONCLUSIONS
HUD Sample Report.wpd
Evergreen Valuation Services
51
Appraisal Process
The following appraisal report is prepared pursuant to and in conformity with, the procedural techniques
established by the nationally recognized professional real estate appraisal organizations and the federally
imposed guidelines for insured institutions.
Specifically, those procedures include consideration of present market conditions, estimated future conditions,
and the financial realities of the subject property and general investment markets which are inclusive of, but
not limited to realty.
The appraisal process typically involves the three approaches to value. These approaches are based on the
following three facets of value:
1.
The current cost of replacing a property less losses in value from deterioration and functional and
economic obsolescence (accrued depreciation)(Cost Approach).
2.
The value indicated by recent sales of comparable properties in the marketplace (Sales Comparison
Approach).
3.
The market value that the property's net earning power will support based upon a capitalization of
net income, stabilization, and residual equity buildup (Income Approach).
The requisites of the appraisal process call for valuations made independently of each other, specifically an
Income Approach, Sales Comparison Approach, and a Cost Approach.
The Cost Approach assumes that a property's value is equivalent to its replacement cost. This falls under the
theory of substitution where the rationalization of its support is premise upon the assumption that a property's
optimum value cannot exceed the cost of duplicating the property on a similar site.
The Sales Comparison/Market Approach is determined by direct units of comparison where value can be
converted to price per square foot, acres, rooms, units, or income multipliers and overall rates. The theory
is that a prudent investor would pay no more for a given facility/property than what the typical market
purchaser would pay for a comparable facility, all things being equal.
The Income Approach is derived from the rationalization of substitution, where the price one would pay for
a property equals the attributable value of its earning ability where measured by the yield an investor will
obtain.
The final step in the appraisal process is the reconciliation of value indications. This is the consideration of
the indicated value resulting from each of the three approaches. The appraiser considers the relative
applicability of each of the three approaches to arrive at the final estimate of defined value.
The individual nature of the real property leads to a question of determining the most appropriate appraisal
procedure for valuation. Although this can not be easily answered, the subject is real property, and as such,
market value can be estimated.
HUD Sample Report.wpd
Evergreen Valuation Services
52
Appraisal Process
After examining the range between the value indications, the appraiser places major emphasis on the one, or
on those, which appear to produce the most reliable and applicable solution to the specific appraisal task. One
takes into account the purpose of the appraisal, the type of property, and the adequacy and relative reliability
of the data processed in each of the three approaches. These considerations influence the weight to be given
to each approach.
The aforementioned procedures to the appraisal process have been considered and incorporated in this
narrative report.
HUD Sample Report.wpd
Evergreen Valuation Services
53
Cost Approach
The Cost Approach to Value is predicated on the assumption that investors consider the replacement cost of
any improvements, less accrued depreciation, plus the value of the land component as an indicator of market
value. A summary of the cost approach is as follows.
The Cost Approach to Value basically consists of four steps:
1. Estimate the value of the land considered as vacant and available for utilization at its highest and
best use.
2. Estimate the reproduction or replacement cost new of the improvements as of the date of the
appraisal, plus the entrepreneur's profit and any other related development cost.
3. Estimate the contributory value of improvements by deduction of all forms of accrued depreciation.
The following are the three major forms of depreciation.
A.
B.
C.
Physical deterioration, curable and incurable.
Functional obsolescence, curable and incurable.
External obsolescence, typically incurable.
4. Add land value to the contributory value of improvements for an indication of market value.
Land Value
In order to estimate the value of the land, the Sales Comparison method is used. In this method, market sales
of similar sites are compared to the subject property with respect to such factors as location, physical
characteristics, type of use, and date of sale. The weakness of this approach is that no two properties are ever
exactly alike, amenities and purchase considerations are intangible qualities and difficult to compare, and the
exact condition of each sale is sometimes unknown. The strength of this approach is that it measures the
actions of buyers and sellers in the marketplace.
Units of comparison for vacant land are price per front foot, price per acre, price per square foot, or price per
unit. The method of comparison is based on the method typically used to purchase vacant tracts in a given
market. The price per square foot appears prevalent within the marketplace for vacant tracts of land with the
subject’s size and use potential. Therefore, the price per square foot was utilized as the basis for estimating
the subject’s land value.
A location map and details of the best comparables identified are presented on the following pages.
HUD Sample Report.wpd
Evergreen Valuation Services
54
Apartment Land Sale 1
Address/Location:
8200 E. 77th Street S.
City:
Houston
County:
Harris
Grantor:
Kindred Healthcare Operating I
Grantee:
Spicewood LLC
Date of Sale:
6/13/09
Consideration:
$1,100,000
Terms:
Cash to seller
Adjustments:
$0
Cash Equivalent Price:
$1,100,000
Price Per Square Foot:
$5.05
Price Per Buildable Unit:
$11,000
Price Per Buildable SF:
$13.75
Net Acres:
5.00
Net Square Feet:
217,800
Units Proposed/Allowed:
100
Square Feet Proposed/Allowed:
80,000
Shape:
Panhandle
Terrain:
Level
Zoning:
RM-1 (Multifamily)
Utilities:
All public
Frontage:
Panhandle to S. Memorial
Special Flood Zone:
None
Planned Use:
Patio homes
Comments:
Though zoned for multifamily, this site was purchased for
use as a 25-27 lot patio home development. Several
easements impacted this site, which reduced the gross area
of 8.51 acres to a net area of roughly 5 acres. To evaluate
the potential value as a multifamily site, the appraisers have
assumed a density of 20 units per acre and an average unit
size of 800 SF.
HUD Sample Report.wpd
Evergreen Valuation Services
55
Apartment Land Sale 2
Address/Location:
8400 E. 134th St. S.
City:
Houston
County:
Harris
Grantor:
Resco Enterprises, Inc.
Grantee:
Autumn Park LP
Date of Sale:
11/28/09
Consideration:
$800,000
Terms:
Cash to seller
Adjustments:
$0
Cash Equivalent Price:
$800,000
Price Per Square Foot:
$4.58
Price Per Buildable Unit:
$10,000
Price Per Buildable SF:
$12.50
Net Acres:
4.01
Net Square Feet:
174,676
Units Proposed/Allowed:
80
Square Feet Proposed/Allowed:
64,000
Shape:
Irregular/usable
Terrain:
Level
Zoning:
RM-3 (Multifamily)
Utilities:
All public
Frontage:
Ample on 134th
Special Flood Zone:
None
Planned Use:
Congregate care
Comments:
Though zoned for multifamily, this site was purchased for
use as a 40-unit congregate care facility for the elderly,
which will receive federal tax credits. To evaluate the
potential value as a multifamily site, the appraisers have
assumed a density of 20 units per acre and an average unit
size of 800 SF.
HUD Sample Report.wpd
Evergreen Valuation Services
56
Apartment Land Sale 3
Address/Location:
14000 N. 106th Ave E.
City:
Houston
County:
Harris
Grantor:
Owasso Land Trust LLC
Grantee:
First United Methodist Church of Owasso
Date of Sale:
10/20/09
Consideration:
$2,100,000
Terms:
Cash to seller
Adjustments:
$0
Cash Equivalent Price:
$2,100,000
Price Per Square Foot:
$3.86
Price Per Buildable Unit:
$8,400
Price Per Buildable SF:
$10.50
Net Acres:
12.50
Net Square Feet:
544,500
Units Proposed/Allowed:
250
Square Feet Proposed/Allowed:
200,000
Shape:
Irregular/usable
Terrain:
Level
Zoning:
RM-2 (Multifamily)
Utilities:
All public
Frontage:
Ample on 106th
Special Flood Zone:
None
Planned Use:
Church
Comments:
This site was zoned for multifamily use, but it was
purchased for construction of a new church, which is also
permitted under the RM-2 zoning. To evaluate the potential
value as a multifamily site, the appraisers have assumed a
density of 20 units per acre and an average unit size of 800
SF.
HUD Sample Report.wpd
Evergreen Valuation Services
57
Apartment Land Sale 4
Address/Location:
SEC E. 81st & Hwy 169
City:
Houston
County:
Harris
Grantor:
Buckler Corporation
Grantee:
Merit Texas Properties
Date of Sale:
3/18/09
Consideration:
$4,052,486
Terms:
Cash to seller
Adjustments:
$0
Cash Equivalent Price:
$4,052,486
Price Per Square Foot:
$6.51
Price Per Buildable Unit:
$13,691
Price Per Buildable SF:
N/A
Net Acres (excludes flood area):
14.28
Net Square Feet:
622,037
Units Proposed:
296
Square Feet Proposed:
N/A
Shape:
Rectangular
Terrain:
Level
Zoning:
CO
Utilities:
All public
Frontage:
Ample along E. 81st and Highway 169
Special Flood Zone:
None
Planned Use:
296-unit apartments
Comments:
This site was also purchased for development of a 296-unit
luxury apartment project known as Meadowbrook Villas.
HUD Sample Report.wpd
Evergreen Valuation Services
58
Apartment Land Sale 5
Address/Location:
7877 S. Memorial
City:
Houston
County:
Harris
Grantor:
Lamar E. Wallace
Grantee:
Villas on Memorial, LP
Date of Sale:
2/9/09
Consideration:
$2,340,000
Terms:
Cash to seller
Adjustments:
$0
Cash Equivalent Price:
$2,340,000
Price Per Square Foot:
$6.11
Price Per Buildable Unit:
$14,904
Price Per Buildable SF:
N/A
Net Acres:
8.79
Net Square Feet:
382,892
Units Proposed:
157
Square Feet Proposed:
N/A
Shape:
Rectangular
Terrain:
Level
Zoning:
RM-3
Utilities:
All public
Frontage:
Ample along S. Memorial
Special Flood Zone:
None
Planned Use:
157-unit apartments
Comments:
This tract has been developed with the Villas on Memorial,
a 157-unit luxury apartment project.
HUD Sample Report.wpd
Evergreen Valuation Services
59
West Houston
Comparable Land Sales
Spring
Spring
Nob Hill Park
S
S
Nob Hill Park
6
6
747
747
745
745
10
Barker
Barker
748
Barker
Barker
748
747
747
751
751
10
10
10
Addicks
Addicks
751
751
Addicks
Addicks
753B
753B
754
754
755
755
753B
753B
10
754
754
758A
759
758A759
757
757
10
755
755
8
10
Bendwood
748
748
8
757
757
Park
10
Hedwig
Hedw
Hed
Vil
Vil
Hill
Bunker
Bunker Hill
Bendwood Park
Buffalo
B
ayou
Buffalo
B
Hil
Bunker
Bunker
Po
PineyHil
Piney
Pine
Buffalo Bayou
ayou
u
yo
Ba
o
l
u
ffa
yo
Piney
Point Gully
Gully
Piney
Bu
Murray Park
Ba Point
o
l
ffa
u
G
Piney
G
Point
Piney Point
B
Murray Park
Medic
Rosewood
Medic
Rosewood
RD
Buffalo Bayou
6
6
WESTHEIMER
u
Buffalo Bay
ou
ay
o
Buffalo Bay
ou
WESTHEIMER RD
Land Sale 3
Land Sale 3
Blossom H
Jeanetta
Jeanetta
Jeanetta
Jeanetta
59
Alief
Alief
Alief
Brays B
ayou
5
Bellaire
West
Bellaire West
3
Blossom Heights
5
Andrau
Sale 5
LandAirpark
Clodine
Clodine
F-M 1093
8
Andrau
Sale
LandAirpark
Brays B
ayou
F-M 1093
Rosewood
Rosewood M
8
WESTHEIMER RD
WESTHEIMER RD
Clodine
Clodine
6
Crain Park
Bellaire
West
Bellaire West
Crain Park
Sharpstown P
6
Sharpsto
ayou
ys B
Bra
ys B
Bra
9
59
59
Four
Corners
Four Corners
Sale 4
Four
Corners
Four Corners
C
Oyreek
ste
Oak
Hill99
Sale 4
Land
rC
ree
Cr
kFigure Four Lake
Joneek
99
e es C
ree
Figure Four Lake
k
y Lake
8
6
Lake
Gannoway
6
Fish
White Lake
k Lake
e
Gannoway Lake
re
rC
Fish Lake
White Lake
ste
Red
Gully
y
Red Gully
90A
O
Cleveland Lake 59
Pumpkin Lakes
Property
Subject
Red
Gully
Red
Gully
Sugar Land Muni/Hull Field
Land
Sugar
Sugar Land
Cleveland Lake 59
Pumpkin Lakes
Property
Subject
Stubblebrooke
Lake
Eldridge
Sugar Land Muni/Hull Field 90A
Land
Land
Sugar
Sugar
Horseshoe Lake
Stubblebrooke
Lake
Eldridge
Char
90ALake
Horseshoe Lake
Brooks Lake
Char6 Lake
90A
6
90A
Old River Lake
90A
99
90AMemorial
yy Ryon
Hospital
Ryon
Memorial Hospital
90A
90A
Houston Fishing Club Lake
Frost Lake
Paynes
Herbert
PaynesHerbert
Frost Lake
Herbert
Herbert
Smada
Smada
Smada
Smada
99
Polly
Hospital
Ryon Memorial
Memorial Hospital
Polly Ryon
59
6
59
FM
6
2
76
FM
D
2R
76
59
F-M
762
F-M
762
CRABB
Crabb
Crabb
RIVER
R
CRABB
P
G
P
A GE
OR
GE
USA
Street
Atlas
DeLorme.
1998
©
USA
StreetAtlas
AtlasUSA
DeLorme. Street
©
1998DeLorme.
©1998
USA
Street
Atlas
DeLorme.
1998
©
Crabb
Crabb
A
Street
Atlas
DeLorme.
98
USA
USA
StreetAtlas
AtlasUSA
DeLorme. Street
98
98DeLorme.
Street
Atlas
DeLorme.
98
Land Sale 2Old River
Land Sale 2Old River
Hermann Hospital Lake
Lake
Hermann Hospital
6
D
RIVER
R
Dewalt
Dewalt
Dewalt
Dewalt
D
Booth
Booth
F-M
Booth
27
59
F-M
27
Trammels
Trammels
6
Trammels
rC
re
ek
RD
59
8
City
City8
Missouri
Missouri 90A
Stafford
Stafford
Missouri City
Lake
Houston Fishing Club
Stafford
Stafford
59
Oy
ste
Old River Lake
Paynes
Lake
Paynes
Brooks
Land Sale 1
Land Sale 1
reek
r
k
reek
e
ys t
ee
Cr
Oyster C
O
8
Oyster C
Oak
Hill
Land
10
758A
759
758A759
rC
re
ek
745
745
Cost Approach
Land Sales Analysis
The following summary chart represents a recap of the land sales detailed on the preceding pages.
Summary of Comparable Land Sales
Buildable Basis
# Location
Date
Price
Acres
$/SF
Units
$/Unit
1 8200 E. 77th Street S.
6/13/09
$1,100,000
5.00
$5.05
100
$11,000
2 8400 E. 134th St. S.
11/28/09
$800,000
4.01
$4.58
80
$10,000
3 14000 N. 106th Ave E.
10/20/09
$2,100,000
12.50
$3.86
250
$8,400
4 SEC E. 81st & Hwy 169
3/18/09
$4,052,486
14.28
$6.51
296
$13,691
5 7877 S. Memorial
2/9/09
$2,340,000
8.79
$6.11
157
$14,904
$2,078,497
8.92
$5.22
177
$11,599
N/A
11.77
N/A
312
N/A
Average of Comparables
Subject Property
Adjustment Rationale
The subject site measures approximately 11.772 acres, while the comparable sales range in size from 4.01
to 14.28 acres. Before the application of any adjustments, the comparables indicate prices ranging from
$3.86/SF to $6.51/SF, with a mean of $5.22/SF. While the comparable sales were chosen based on their
similarities to the subject, an exact match is impossible. Therefore, adjustments may be necessary to account
for differences between each sale and the subject. As per HUD guidelines, features considered for possible
adjustment include time, location, zoning, plottage, demolition, and piling. Each feature is addressed
individually in the following paragraphs.
Time: The first factor analyzed was market conditions. The sales transpired between and February 9, 2009
and November 28, 2009. Over this period, values have remained relatively constant, and no time adjustments
are warranted.
Location: The location of a property is probably the single most important factor impacting price, yet it is
also the most subjective, as it represents the aggregate impact of such features as access, visibility, adjoining
properties, area demographics, proximity to employment centers, and access to transportation. The appraisers
have personally visited each comparables and rendered an opinion as to the overall strength of each
comparable’s location relative to the subject. All factors considered, Sales 2 and 3 are considered similar to
the subject in overall locational attributes, and no adjustments are applied. The adjustments applied to Sales
1, 4, and 5 are based on observed differences in pricing between these three tracts and Sales 2 and 3, which
are more similar to the subject.
Zoning: All the comparables were zoned for multifamily development, consistent with the highest and best
use identified for the subject site, and no zoning adjustments are necessary.
HUD Sample Report.wpd
Evergreen Valuation Services
60
Cost Approach
Plottage: Plottage refers to value increases that may be enjoyed by assembling multiple parcels to create a
more useful or marketable tract. Often, a developer will pay a substantial premium to acquire a specific
parcel, such as the last piece needed to assemble an entire city block for high-rise development. None of the
comparables presented herein were part of an assemblage, and no adjustments are applied.
Demolition: All the comparables were vacant at the time of sale, so there were no demolition costs involved.
Pilling, Etc.: None of the comparables required unusual site work or foundation considerations, and no
adjustments are applied.
The following is a summary of the adjustments applied to the land sales:
HUD Sample Report.wpd
Evergreen Valuation Services
61
Land Sales Adjustment Grid
Comp 1
Comp 2
Comp 3
Comp 4
Comp 5
8200 E. 77th Street S.
8400 E. 134th St. S.
14000 N. 106th Ave E.
SEC E. 81st & Hwy 169
7877 S. Memorial
Date of Sale
June 13, 2009
November 28, 2009
October 20, 2009
March 18, 2009
February 9, 2009
Sales Price
$1,100,000
$800,000
$2,100,000
$4,052,486
$2,340,000
Size per Sq. Ft.
217,800
174,676
544,500
622,037
382,892
Price per Sq. Ft.
$5.05
$4.58
$3.86
$6.51
$6.11
0%
0%
0%
0%
0%
-10%
0%
0%
-20%
-20%
Zoning
0%
0%
0%
0%
0%
Plottage
0%
0%
0%
0%
0%
Demolition
0%
0%
0%
0%
0%
Pilling, Etc.
0%
0%
0%
0%
0%
Other
0%
0%
0%
0%
0%
Total Adjustment Factor
-10%
0%
0%
-20%
-20%
Adjusted Sq. Ft. Price
$4.55
$4.58
$3.86
$5.21
$4.89
Concluded Value
$4.50
Adjustments (%)
Time
Location
Cost Approach
After all adjustments, the comparables offer value indications ranging from $3.86/SF to $5.21/SF, with an
average of $4.62/SF. Theoretically, after adjustment, the comparables should yield the same indication. The
observed range of indications reflects the imperfections in the real estate market. Overall, the data supports
a value conclusion of $4.50/SF, applied as follows:
Land Value Estimate
512,788 SF
x
$4.50 /SF = $2,307,547
Rounded = $2,310,000
HUD Sample Report.wpd
Evergreen Valuation Services
63
Cost Approach
Replacement Cost of Improvements
The Cost Approach to value is based upon the assumption that an informed purchaser will pay no more than
the cost of producing a substitute property with the same utility as the subject property. In other words, a
buyer will typically pay no more than the subject’s reproduction cost. Reproduction cost is defined as:
"The cost of construction at current prices of an exact duplicate or replica using the
same materials, construction standards, design, layout, and quality of workmanship,
and embodying all deficiencies, superadequacies and obsolescence of the subject
building" (Real Estate Appraisal Terminology, Revised Edition, Pg. 205).
The cost estimates utilized herein were obtained through the Marshall Valuation Service (MVS). The MVS
provides an estimate of replacement cost new (rather than reproduction cost), which is defined as:
"The cost of construction at current prices of a building having utility equivalent to
the building being appraised but built with modern materials and according to
current standards, design, and layout." (Real Estate Appraisal Terminology,
Revised Edition, Pg. 205).
As the subject’s proposed improvements appear to have no functional problems, for the purpose of this
analysis, replacement cost is considered to be very similar to the reproduction cost.
Marshall & Swift Estimate: The costs new provided by the MVS handbook include the following:
1)
average architect's and engineer's fees, including plans, plan check and
building permits, and surveys to establish building lines and grades;
2)
normal interest on building funds, excluding land, during the period of construction and
processing fee or service charge;
3)
sales taxes on materials;
4)
normal site preparation including excavation for foundation and backfill;
5)
utilities from structure to lot line figured for typical setback;
6)
contractor's overhead and profit including job supervision, worker's compensation, fire and
liability insurance, unemployment insurance, etc.
HUD Sample Report.wpd
Evergreen Valuation Services
64
Cost Approach
Determination of Replacement Cost New: To determine the replacement cost new for the subject structures
and components, the calculator method was utilized. Appropriate multipliers were applied to the indicated
MVS base cost(s) to account for time and the subject’s particular location and shape.
The subject property appears to be an average Class “D" Multiple Residence, as defined by Marshall & Swift.
The following chart summarizes cost estimates for the various components of the subject building(s).
Summary of Base Building Costs
Multipliers
Component
Area (SF) Base Cost
Apartments (NRA)
Patios/Balconies
Basements
Hallways/Maintenance/Common
Office/Leasing
Garages
Area
Local Current
Total
280,148
$60.00
1.000
0.89
0.97
$14,511,106
18,720
$20.00
1.000
0.89
0.97
$323,220
0
$15.00
1.000
0.89
0.97
$0
312
$44.00
1.000
0.89
0.97
$11,851
4,795
$44.00
1.000
0.89
0.97
$182,139
0
$0.00
1.000
0.89
0.97
$0
Total Base Building Cost
$15,028,316
Appliances & Amenities: Based on Marshall & Swift data, the appraisers have derived the following cost
estimates for the subject’s appliances and special amenities.
Appliances and Individual Unit/Clubhouse Amenities
Component
Number
Cost/Unit
Total Cost
Garbage Disposal
312
$75
$23,400
Refrigerator
312
$400
$124,800
Dishwasher
312
$350
$109,200
Oven/Range
312
$350
$109,200
Exhaust Fan & Hood
312
$75
$23,400
Microwaves
312
$150
$46,800
Fireplaces
0
$500
$0
Washers/Dryers
0
$700
$0
Ceiling Fans
0
$75
$0
Total Appliance Cost
$436,800
Contrary to market norms, HUD form 92264 has no space to account for the cost of appliances. Thus,
when completing the form, the appraisers have combined the estimated appliance costs with the base
building costs.
HUD Sample Report.wpd
Evergreen Valuation Services
65
Cost Approach
Site Improvements: Based on Marshall & Swift data, the appraisers have derived the following cost
estimates for the subject’s site improvements.
Site Improvements
Component
Quantity
Paving (Incl. drives, parking, sidewalks)
Unit Cost
Total
403
$900
$362,700
Carports
48
$1,000
$48,000
Garages
48
$4,000
$192,000
Pool(s)
1
$100,000
$100,000
Fencing
1
$85,000
$85,000
Signage
1
$15,000
$15,000
Landscaping
1
$50,000
$50,000
Office Furnishings
1
$10,000
$10,000
Total Site Improvements
$862,700
Indirect Costs: The indirect costs not included in the base cost amount obtained from the Marshall Valuation
Service manual include such items as property taxes during construction, escrow fees and legal fees
associated with the land, interest on the land, discount points and fees paid in connection with interim
financing, accounting, appraisal fees, marketing and lease-up costs (inclusive of on site payroll cost for a
leasing agent during the pre-leasing and commissions paid to apartment locator companies). Indirect costs
for the subject are estimated at 10% of the total hard costs, or $1,632,782.
Developer’s Fee: In addition to the above, a developer’s fee should be considered. The developer’s fee,
which is distinct from entrepreneurial incentive, represents compensation for the overall management of the
project, i.e., the time, energy, and experience the developer invests in the project and the risks the developer
takes. It is equivalent to the salary the developer might otherwise obtain. This type fee can vary significantly
from developer to developer, but could generally be expected to run from 1.25% to 2.00% of the total project
cost. For this analysis, the appraisers have elected to use a fee of 1.50% of the total project cost, exclusive
of the land cost.
Entrepreneurial Profit: Finally, consideration must be given for entrepreneurial profit, which is the
anticipated profit required to entice an entrepreneur to invest capital in a project. It is the difference between
the total cost of development and marketing and the market value of a property after completion and
stabilization. One means to extract entrepreneur's profit would be to analyze recently constructed properties
in the same market for the difference between their sales prices and total development costs (site, direct and
indirect costs, excluding developer's profit).
HUD Sample Report.wpd
Evergreen Valuation Services
66
Cost Approach
An attempt was made to estimate entrepreneur's profit from the market by researching sales of recently
completed multi-family complexes. The certainty of this method is questionable, as it only accounts for the
actual amount of profit realized and not the amount required to typically influence a developer to undertake
a project. The actual profit yielded may exceed or be less than the anticipated profit. Due to this lack of data,
it was necessary to contact developers and investors. Based on these conversations, allowances for
entrepreneurial profit typically were in the neighborhood of 10% to 20% for properties with similar total
values and utility. Based on this data, the appraisers have utilized an allowance of 12%.
Based on the preceding analyses, the subject’s replacement cost new is approximated as follows.
Summary of Replacement Cost New Via Marshall & Swift Method
Stubblebrooke
Component
Cost
Buildings
$/Unit
$/SF NRA
$15,028,316
$48,168
$53.64
Appliances
436,800
$1,400
$1.56
Site Improvements
862,700
$2,765
$3.08
$16,327,816
$52,333
$58.28
1,632,782
$5,233
$5.83
$17,960,598
$57,566
$64.11
269,409
$863
$0.96
2,155,272
$6,908
$7.69
TOTAL ESTIMATED RCN
$20,385,278
$65,337
$72.77
ROUNDED
$20,390,000
$65,353
$72.78
SUB-TOTAL HARD COSTS
Soft (Indirect) Costs @
10%
SUB-TOTAL HARD AND SOFT COSTS
Developer’s Fee @
1.50%
Entrepreneurial Profit @ 12%
As indicated, the total replacement cost new (RCN) of the subject improvements is estimated at $20,390,000
(rounded), which equates to $72.78/SF of NRA or $65,353/unit.
HUD Sample Report.wpd
Evergreen Valuation Services
67
Cost Approach
Accrued Depreciation
The Dictionary of Real Estate Appraisal, Third Edition, published by the American Institute of Real Estate
Appraisers, defines accrued depreciation as:
"The difference between the reproduction or replacement costs of the improvements on the
effective date of the appraisal and the market value of the improvements on the same date."
To estimate the amount of accrued depreciation, which affects the subject property as of the date of appraisal,
the breakdown method has been utilized in conjunction with the market extraction method. The breakdown
method consists of analyzing each type of depreciation separately and then summing up each category of
depreciation to arrive at a total estimate of depreciation with the subject property. Below is a list of these five
categories:
1)
2)
3)
4)
5)
Curable physical deterioration
Incurable physical deterioration
Curable functional obsolescence
Incurable functional obsolescence
External obsolescence
Curable Physical Deterioration: Physical curable deterioration pertains to items of deferred maintenance.
As mentioned in the improvement analysis, the improvements exhibit deferred maintenance estimated at $0.
Incurable Physical Deterioration: This type of depreciation is defined as that loss from cost new which
is impossible to offset or which would involve expenditures beyond the ability of the property to support.
The project was completed in 2007, and the subject is estimated to have an effective age of 1 years. Further,
a 50-year economic life is projected. In determining physical deterioration, the straight-line method is often
employed, often because this is simply the easiest to quantify. However, the straight-line method does not
accurately reflect the market’s perception of actual depreciation. For this analysis, the appraisers have relied
on depreciation schedules published by Marshall & Swift. According to Marshall & Swift, a building with
an effective age of 1 years and an economic life of 50 years exhibits physical depreciation of 0%, applied as
follows.
Physical Depreciation (Per Marshall & Swift)
Effective Age
Economic Life
% Depreciation
1
50
0.00%
Replacement Cost
$20,385,278
$ Depreciation
$0
Functional Obsolescence: Functional Obsolescence is defined as that loss from cost new due to causes
within the property bounds except for physical deterioration. The subject is an older property, but it continues
to serve well as an apartment project and exhibits no functional obsolescence.
HUD Sample Report.wpd
Evergreen Valuation Services
68
Cost Approach
External Obsolescence: This type of depreciation is defined as "that loss from cost new, as of the date of
the appraisal, due to causes external to the property." External obsolescence may be due to a variety of
causes, including changes in neighborhoods from higher to lower uses; decreases or rapid increases in
population; changes in uses of property that may be inharmonious, incongruous, or even illegal.
Economic/external obsolescence attacks a neighborhood and displays itself in conditions that environs a
structure rather than in the actual building or property itself. External obsolescence is caused by
environmental forces beyond the control of the property itself which have an adverse affect on property
values. Because of its external nature, this form of depreciation is typically considered incurable and may
affect either the value of the land, the value of the improvements, or both.
Examples of such external obsolescence might include the infiltration of some incompatible use into the
neighborhood, the enactment of legislation which restricts certain property rights, an economic recession, a
dramatic shift in market supply/demand conditions, or an adverse change in Highest and Best Use trends in
the area.
Economic obsolescence is best calculated based on the difference between actual income levels and feasibility
levels. The replacement cost of the subject property, including land and excluding physical depreciation, is
estimated at $22,695,278. At an overall rate of 7.25%, an NOI of $1,645,408 would be required to justify
the depreciated cost of this development. As detailed later in the Income Approach, the subject is actually
generating an NOI of $1,631,700, indicating a shortfall of $13,708. Given the scale of the property, this is
a negligible amount, and no economic obsolescence is recognized
Cost Approach Conclusions
A summary of the Cost Approach is presented below.
Summary of Cost Approach
Total Estimated RCN
$20,385,278
Less: Depreciation
Curable Physical Deterioration
0
Incurable Physical Deterioration-
0
Functional Obsolescence-
0
External Obsolescence-
0
Total Depreciation
$0
Depreciated RCN
$20,385,278
Plus: Land Value
$2,310,000
Cost Approach Value Indication
$22,695,278
Rounded
$22,700,000
HUD form 92264 does not recognize depreciation. The “Summation Value” presented therein reflects
the replacement cost plus land value, and it is not the same as the Cost Approach value derived above.
HUD Sample Report.wpd
Evergreen Valuation Services
69
Sales Comparison Approach
The Sales Comparison Approach is the method of appraisal in which the value of a property is inferred from
sales of comparable properties. It is also known as the comparative or comparable sales approach, the
comparison method, or the market data approach to value.
Properties subjected to the comparison process, both subject and comparables, must have at least the potential
of a similar, if not identical, highest and best use if a valid value estimate is to result. In other words, all of
the properties compared must have the capacity to satisfy the needs and desires of the same buyer. The market
approach to value takes different forms, depending upon the type of property being appraised, but the method
is essentially the same. This technique can be expressed as follows:
1.
Describe and classify asset: The description of the property under appraisement should only cover
those attributes that are significant and relevant to value. If the asset is of a diverse nature, it should
be divided into value classes.
2.
Find sales involving comparable assets: This means finding comparable properties that have been
sold recently in the subject community. Verification and documentation of the sales is highly
important.
3.
Select appropriate units of comparison: The basis of the market approach to value is a comparison
of one asset to another. Before a comparison can occur, a unit of comparison must be established.
Appropriate units of comparison for the assessment of apartments are established using a per unit and
per net rentable square foot value. With improved property, sales are broken down into useful units
so that reasonable and logical comparisons can be made. The most common three comparisons are:
4.
A.
Effective Gross Income Multiplier: This is the sales price divided by the effective gross
scheduled income of the investment facility at stabilized occupancy. Abbreviation: EGIM
B.
Net Operating Income: This is the gross scheduled income less vacancy and less operating
expenses, but without consideration to interest, loan amortization, depreciation, or income
taxes. Abbreviation: NOI
C.
Overall Rate: This is a single year's rate between net operating income and total price. It
is computed by dividing the NOI by the gross selling price. Abbreviation: OAR
Compare each sold asset with the subject property, adjust for differences to indicate market value of
the subject asset in each comparison: Every piece of real estate is unique unto itself, so there will
never be a sold property that is identical in every respect to the subject property. The appraiser
searches for those comparable sales that have the most in common. There will, however, be areas
of difference. These areas of difference break down into two categories, namely tangible and
intangible.
HUD Sample Report.wpd
Evergreen Valuation Services
70
Sales Comparison Approach
Intangible differences would include terms, time, and condition of sale. Tangible differences would
include location (with regard to streets, visibility, traffic patterns, and volumes, growth trends, etc.),
size, zoning, age, nature, quality, and condition of improvements, etc. If a material difference is
found between the sold property and the subject property under appraisement, it is necessary to adjust
for the difference.
5.
Find central tendency of indicated values: After making the comparisons, each sale will have
provided an indicated value for the subject property. From this array of indicated prices, the
appraiser must distill a single figure. Judgment is more useful than mathematics in arriving at this
conclusion, because some of the comparable sales will carry more weight than others. The value
indications must be reconciled into a single indicator of value for the comparative sales approach.
Hopefully the value indicators will be within a narrow range. In selecting the single value estimate,
it is not proper to simply average the results. Rather, the process is one of reviewing the adjustments
made and placing the greatest reliance on the value indicated by the most comparable properties or
property.
A location map and several comparable improved sales are detailed on the following pages. The sales are
the best comparables that could be confirmed by the appraisers. Several other sales in the area were
identified, but they were excluded to variations in project size, unit size, date of sale, age of property,
location, or other pertinent factors.
HUD Sample Report.wpd
Evergreen Valuation Services
71
Improved Sale No. 1
Property Identification
Name:
Alexan Spotford
Address:
12700 Spotford
City/State:
Spotford, TX
Proximity to Subject:
3 miles northeast
Date of Sale:
April 1, 2009
Grantor:
Spotford II Holdings, LP
Grantee:
Spotford RS, LLC
Financing Terms:
Cash to seller
Price & Adjustments
Total
$/Unit
$/SF
$/Room
$23,375,000
$88,542
$84.44
$24,709
Cap Ex / Excess Land: $0
$0
$0.00
$0
Net Sale Price:
$88,542
$84.44
$24,709
Financing Adjustment: $0
$0
$0.00
$0
Adjusted Sale Price:
$23,375,000
$88,542
$84.44
$24,709
Cap Rate:
7.28%
Expense Ratio:
43.28%
EGIM:
7.80
Nominal Sale Price:
$23,375,000
Unit Mix (Monthly Figures)
Units
Unit Type
SF/Unit
Total SF Rooms
$/Unit
$/Room
$/SF
Gross Rent
1 Bed
1.0 Bath
48
752
36,096
144
$771
$257
$1.03
$37,008
1 Bed
1.0 Bath*
8
840
6,720
24
$947
$316
$1.13
$7,576
1 Bed
1.0 Bath
72
852
61,344
216
$813
$271
$0.95
$58,536
1 Bed
1.0 Bath*
4
876
3,504
12
$950
$317
$1.08
$3,800
1 Bed
1.0 Bath
8
897
7,176
24
$876
$292
$0.98
$7,008
2 Bed
2.0 Bath*
4
1,181
4,724
16
$1,118
$280
$0.95
$4,472
2 Bed
2.0 Bath*
2
1,212
2,424
8
$1,165
$291
$0.96
$2,330
2 Bed
2.0 Bath
64
1,235
79,040
256
$1,050
$263
$0.85
$67,200
2 Bed
2.0 Bath
24
1,312
31,488
96
$1,125
$281
$0.86
$27,000
3 Bed
2.0 Bath
12
1,438
17,256
60
$1,475
$295
$1.03
$17,700
3 Bed
2.0 Bath*
6
1,490
8,940
30
$1,480
$296
$0.99
$8,880
3 Bed
2.0 Bath
12
1,508
18,096
60
$1,385
$277
$0.92
$16,620
264
1,049
276,808
946
$978
$273
$0.93
$258,130
TOTAL/AVG
* Attached garage
HUD Sample Report.wpd
Evergreen Valuation Services
72
Improved Sale No. 1
Site Description
Land Area (Acres):
11.14
Flood Hazard:
None
Land Area (SF):
485,258
Topography:
Generally level
Configuration:
Rectangular
Land to Building Ratio: 1.75
Description of Improvements
Building Type:
Garden
Occupied at Sale:
93%
YOC:
2006
Basement:
None
Quality/Class:
A
Covered Parking:
Carports, detached garages, 24
attached garages
Condition:
Good
Design & Appeal:
Average
Location Rating:
Good
Site/View:
Average
Amenities:
Clubhouse, pool, hot tub, fitness Utilities Included:
center, billiards, security gates,
Functional Utility:
intrusion alarms, patio/balcony,
HVAC
WD
None
Average
Forced Air
Income Analysis
Income/Expense Estimates
$/SF
$/Unit
Market Rent:
$11.19
$11,733
Other Income:
$0.65
$682
Operating Expenses:
$4.45
$4,666
Reserves:
$0.24
$250
Total Expenses:
$4.69
$4,916
Pro-Forma Income Statement
Gross Potential Rents:
Annually
$3,097,560
Other Income:
179,925
Less: Vacancy:
(216,829)
Less: Loss to Lease:
(61,951)
Effective Gross Income:
Vacancy/Collection:
7.0%
Less: Operating Expenses:
Loss to Lease Factor:
2.0%
Net Operating Income:
2,998,705
(1,297,796)
7.28%
$1,700,909
Comments
This property is located in Spotford, roughly 3 miles northeast of the subject. The buyer changed the name from
Alexan Spotford to Retreat @ Spotford. Occupancy at the time of sale was 94%. Effective rents at the time of sale
were a few cents lower than the subject’s estimated market rents, which is appropriate since this property has larger
average unit size.
Confirmation Source
Broker, third party appraiser
HUD Sample Report.wpd
Evergreen Valuation Services
73
Improved Sale No. 2
Property Identification
Name:
Westchase Forest
Address:
11355 Richmond Avenue
City/State:
Houston, TX
Proximity to Subject:
8 miles north
Date of Sale:
October 21, 2009
Grantor:
Drever Westchase, LP
Grantee:
Olympus Properties, LLC
Financing Terms:
Cash to seller
Price & Adjustments
Total
$/Unit
$/SF
$/Room
$23,169,500
$57,924
$68.90
$16,838
Cap Ex / Excess Land: $0
$0
$0.00
$0
Net Sale Price:
$57,924
$68.90
$16,838
Financing Adjustment: $0
$0
$0.00
$0
Adjusted Sale Price:
$23,169,500
$57,924
$68.90
$16,838
Cap Rate:
7.49%
Expense Ratio:
53.34%
EGIM:
6.23
Nominal Sale Price:
$23,169,500
Unit Mix (Monthly Figures)
Units
Unit Type
SF/Unit
Total SF Rooms
$/Unit
$/Room
$/SF
Gross Rent
1 Bed
1.0 Bath
84
576
48,384
252
$671
$224
$1.16
$56,364
1 Bed
1.0 Bath
60
729
43,740
180
$735
$245
$1.01
$44,100
1 Bed
1.0 Bath
96
886
85,056
288
$818
$273
$0.92
$78,528
2 Bed
1.0 Bath
144
967
139,248
576
$887
$222
$0.92
$127,728
3 Bed
2.5 Bath
16
1,242
19,872
80
$1,117
$223
$0.90
$17,872
400
841
336,300 1,376
$811
$236
$0.97
$324,592
TOTAL/AVG
Site Description
Land Area (Acres):
15.65
Flood Hazard:
None
Land Area (SF):
681,714
Topography:
Level
Configuration:
Rectangular
Land to Building Ratio: 2.03
HUD Sample Report.wpd
Evergreen Valuation Services
74
Improved Sale No. 2
Description of Improvements
Building Type:
Garden
Occupied at Sale:
96%
YOC:
1999
Basement:
None
Quality/Class:
B+
Covered Parking:
Garages, carports
Condition:
Average
Design & Appeal:
Average
Location Rating:
Fair-avg
Site/View:
Average
Amenities:
Clubhouse, security access, two Utilities Included:
pools, fitness center, business
Functional Utility:
center, MW, patio/balcony,
HVAC
WDC
None
Average
Forced Air
Income Analysis
Income/Expense Estimates
$/SF
$/Unit
Pro-Forma Income Statement
Market Rent:
$11.58
$9,738
Gross Potential Rents:
Other Income:
$0.40
$336
Operating Expenses:
$5.60
$4,708
Reserves:
$0.30
$250
Total Expenses:
$5.90
$4,958
Annually
$3,895,104
Other Income:
134,520
Less: Vacancy:
(311,608)
Less: Loss to Lease:
0
Effective Gross Income:
Vacancy/Collection:
8.0%
Less: Operating Expenses:
Loss to Lease Factor:
0.0%
Net Operating Income:
3,718,016
(1,983,280)
7.49%
$1,734,736
Comments
This property is located on the west side of Houston, roughly 8 miles north of the subject. This neighborhood exhibits
relatively low income levels, with a median household income of $51,184 in a 1-mile radius, compared to $70,215
for the subject. Proforma operating data is based on actual figures.
Confirmation Source
Broker, third party appraiser
HUD Sample Report.wpd
Evergreen Valuation Services
75
Improved Sale No. 3
Property Identification
Name:
Lakes @ Cinco Ranch
Address:
2855 Commercial Center Blvd
City/State:
Katy, TX
Proximity to Subject:
15 miles northwest
Date of Sale:
May 15, 2010
Grantor:
Sendero Associates LP
Grantee:
Francis Property Management
Financing Terms:
Cash to seller
Price & Adjustments
Total
$/Unit
$/SF
$/Room
$20,675,000
$94,839
$86.69
$25,525
Cap Ex / Excess Land: $75,000
$344
$0.31
$93
Net Sale Price:
$95,183
$87.00
$25,617
Financing Adjustment: $0
$0
$0.00
$0
Adjusted Sale Price:
$20,750,000
$95,183
$87.00
$25,617
Cap Rate:
6.74%
Expense Ratio:
50.17%
EGIM:
7.39
Nominal Sale Price:
$20,750,000
Unit Mix (Monthly Figures)
Units
Unit Type
SF/Unit
Total SF Rooms
$/Unit
$/Room
$/SF
Gross Rent
1 Bed
1.0 Bath
24
733
17,592
72
$860
$287
$1.17
$20,640
1 Bed
1.0 Bath
12
802
9,624
36
$940
$313
$1.17
$11,280
1 Bed
1.0 Bath
54
860
46,440
162
$975
$325
$1.13
$52,650
2 Bed
1.0 Bath
12
1,109
13,308
48
$1,190
$298
$1.07
$14,280
2 Bed
2.0 Bath
40
1,252
50,080
160
$1,325
$331
$1.06
$53,000
2 Bed
2.0 Bath
48
1,300
62,400
192
$1,425
$356
$1.10
$68,400
3 Bed
2.0 Bath
16
1,331
21,296
80
$1,460
$292
$1.10
$23,360
3 Bed
2.0 Bath
12
1,480
17,760
60
$1,550
$310
$1.05
$18,600
218
1,094
238,500
810
$1,203
$324
$1.10
$262,210
TOTAL/AVG
HUD Sample Report.wpd
Evergreen Valuation Services
76
Improved Sale No. 3
Site Description
Land Area (Acres):
13.85
Flood Hazard:
None
Land Area (SF):
603,306
Topography:
Level
Configuration:
Rectangular
Land to Building Ratio: 2.53
Description of Improvements
Building Type:
Garden
Occupied at Sale:
91%
YOC:
2003
Basement:
None
Quality/Class:
A+
Covered Parking:
Attached garages, detached
garages, carports
Condition:
Good
Design & Appeal:
Average
Location Rating:
Excellent
Site/View:
Average
Amenities:
Clubhouse, pool, fitness center, Utilities Included:
access gate, patio/balcony, Functional Utility:
intrusion alarms, MW, WD
HVAC
None
Average
Forced Air
Income Analysis
Income/Expense Estimates
$/SF
$/Unit
Market Rent:
$13.19
$14,434
Other Income:
$0.43
$470
Operating Expenses:
$5.68
$6,214
Reserves:
$0.23
$250
Total Expenses:
$5.91
$6,464
Pro-Forma Income Statement
Gross Potential Rents:
Annually
$3,146,520
Other Income:
102,555
Less: Vacancy:
(314,652)
Less: Loss to Lease:
(125,861)
Effective Gross Income:
Vacancy/Collection:
10.0%
Less: Operating Expenses:
Loss to Lease Factor:
4.0%
Net Operating Income:
2,808,562
(1,409,180)
6.74%
$1,399,382
Comments
The Lakes @ Cinco Ranch is located in Katy, a desirable satellite community west of Houston. This property
exhibited some minor deferred maintenance, which the buyers estimated at $75,000. Income and expenses are based
on actual trailing-3 month operations.
Confirmation Source
Reliable 3rd party involved in the transaction
HUD Sample Report.wpd
Evergreen Valuation Services
77
249
Island
Rock
Howth
Island Lawrence
Rock
Howth
Key
LawrenceSpKey
rin
econd
Corinth
econd Corinth
gC
Howth
Howth
6
Sprreek
0 Second Corinth
ing
Corinth
Second
290A
C
Egypt
Egypt
Spring Creek
Ventura
Ventura
Oklahoma
Oklahoma
Spring Creek
Oklahoma
Oklahoma
Hufsmith
45
Tamina
Tamina
78
78
Tamina
Tamina
59
59
New Caney
East Fork Sa
n Jac
Magnolia
Ventura
Ventura
Magnolia
Magnolia
East Fork Sa
n
Comparable Improved Sales
Fetzer
Fetzer
Magnolia
Magnolia
Peach
Creek
M
n
r San Jaci83
83
Wesket CFork
Grangerland
Grangerland
River
State Forest
La242 W G Jones
San Jacinto
West F45ork
Egypt
Egypt 242 W G Jones State Forest
Karen
Karen
Peach
Creek
k Island
ck
Island Lawrence
Creek
Key
Cedar
Cedar Creek
Key
Lawrence
L
Todd
Todd
Fetzer
Fetzer
reek
ey C
Can k
ree
ey C
Can
Courtney
Courtney
Courtney
Courtney
Brown
College
Brown College
Creek
Cedar
wn
College
wn College
G
Plum
Plum Gr
G
Plu
Plu
er
R
ar d
ern er
n B iv
Sa ar d R
ern
nB
35
Bayo
u
ille B
ayou
Ashwood
Ashwood
k
ek
re
USA
Street
Atlas
DeLorme.
1998
©
USA
StreetAtlas
AtlasUSA
DeLorme. Street
©
1998DeLorme.
©1998
USA
Street
Atlas
DeLorme.
1998
©
Creek
sC
ne k
Joree
C
Street
Atlas
DeLorme.
98
USA
USA
StreetAtlas
AtlasUSA
DeLorme. Street
98
98DeLorme.
Street
Atlas
DeLorme.
98
Ocean
Old
Old Ocean
Ocean
Old
Old Ocean
Can
al
Bayou
Bayou
Chocola
te
er
288B 558
Angleton
Angleton
Angleton
Bailey
Prairie Angleton
Bailey Prairie
r
ive
s
ne
Podo
Ashwood
Ashwood
Podo
Podo
iv
Brazos R
iv
Brazos R
Sa
Jo
Danciger
Danciger
Pledger
Pledger
Magnet
Magnet
Danciger
Columbia
Columbia
West
West
60
35
Magnet
Magnet
Columbia
West
West Columbia
Podo
Chocola
te
r
ive
dR
nar
Ber ver
San rd Ri
na
Ber
60
Oyster Creek
San
Oyster Creek
Cr
ee
k
San Bernard River
Wes
t
Wes
t
Can
al
The
The Woodlands
Woodlands
249
78
New Caney
78
Decker
Prairie
Decker Prairie
77
77 Rayford
Rayford
Hufsmith
Hufsmith
The
Hegar
The Woodlands
Woodlands
Hegar
Prairie
Decker
Park
Brown
Prairie
Decker
72
Porter
Porter River
72 77
77 Rayford
Rayford
Terrace
River Terrace
Hufsmith
Hufsmith
6
Tomball
Tomball
ree
Avonak
Avonak
Hegar
Hegar
290
k
Spring
l
Park
Brown
290A
72
New Kentucky Park
Porter
Porter
72
Acres
Timberlane
Acres
Timberlane
River
Hempstead
Terra
River Terra
70B
Rotherwood
70B
Tomball
Tomball
Rotherwood
Avonak
Avonak
Hill
Rose
Hill
Rose
k
ewisville
e
Waller
Waller
ewisville
e
Spring
Spring
r
Dunnam
New Kentucky Park
C
70A
Ech
Hidden
Dunnam
Acres
Timberlane
70A
Ech
Hidden
g
Acres
Timberlane
494
in
r
Hempstead
70B
Rotherwood
Klein
70B
Sp
Rotherwood
Klein
290A
Rose
Hill
Rose Hill
59
k
Lewisville
e
Waller
Waller
Lewisville
e
68
r
68
Dunnam
C
70A
Hidden
70A
Hidden
Hockley
Huffm
Huffm
Hockley
494 Dunnam
Klein
Spring
Klein
Westfield
Westfield
k
159
chran
Waller
290A
Waller
ee
Kohrville
Kohrville
r
59
68
68
Hill
C
Moonshine
Moonshine
Hockley
H
H
Hockley
Bordersville
45
Bordersville
rCochran
ss
Creek
Westfield
Westfield
Bammel
Bammel
290
ek
re
Waller
Kohrville
Louetta
pWaller
re
Louetta Kohrville
y
IAH
Hill
Moonshine
C
IAH
Harmaston
C
Harmaston
Clear Cre
Bordersville
s
Humble
Humble
Bordersville
WoodsBammel
Park
63
6345
Bammel
290
Cypress
Cypress Grant
es
ek
Louetta
pr
Louetta
y
IAH
62
IAH
62
Harmaston
Harmaston
Monaville
Greens BPark
Monaville C
249 Woods
Humble
Humble
Grant
63
Hot
Wells
63
Hot
Wells
Cypress
Cypress
ayou
61
61 Aldine
Aldine
62
8
62
8
Monaville
Monaville
Victor
249 Greens
Victor
Bayou
White
Hot
Wells
HotOak
Wells
Bayo60
u60 61
61 Aldine
Dwight D Eise
8
Satsuma
Satsuma
8
Victor
Houston 60
North Houston
Victor
White Oak Bayou North
60
Mt
Houston
Mt Houston
Side
Sunny
Sunny Side
Magnoli
Magnol
Dwight D
57B
57BHouston
Satsuma
North
290Satsuma
Central Park
90
Houston
Mt
Mt
Houston
Sunny Side
Heights
HeightsSheldon W M A
Highland
Highland
Mag
Mag
57B
57B
290 Fairbanks
Fairbanks
Harris
Park
Central
Harris
Park
Warren
Sheldon
Sheldon 9
Clemons
Clemons
Heights
Highland
Cr
Sheldon
90U W M A
2 Park Kerr Harris
Park
Pelham Park
Bear Creek Park Sale
Binglewood
Fairbanks
Fairbanks
ee
Pattison
Pattison Sale 3
Harris
Sheld
Warren Park
k
Sheldo
Clemons
Clemons
59
2 261 Park Kerr Park
Park
Hutcheson
Park 90U
Pelham
Forest
Creek
Park Sale
Bear
Binglewood
3
Sale
NobWestchase
Hill Park
Pattison
Ranch
Cinco
@
Lakes
6
FelipeBrookshire
San
San Felipe
Village
Hilshire
Hilshire Village
5922
ark
261
Katy
Katy 745
Brookshire
10
22Hutcheson Park
750
745 10
750
Forest
90
Cloverleaf
Cloverleaf 783
NobWestchase
Hill10Park
Tuffly Park
783
Ranch
Cinco
@
Lakes
Addicks
99
Felipe
San
6
Village
Village
Hilshire
Hilshire
723
10
723
Ter
River
742
742Katy
Brookshire
Katy 745
Brookshire
Tanglewood Park Houston 22
10
22
750
745 10
750
731
731
737
90B
Cloverleaf
Cloverleaf
737
10
Tuffly Park
783134
Channelview
Channelview783
26B
26B
99
Addicks
u
Addicks
0 Frydek
Village
Village
Hill
Hill
Bunker
Bunker
Oaks
Park
River
723
10
Frydek
ffa742
723
Rive
Park Houston Galena
Tanglewood 45
Park
Park
Galena
731
l742
731
737
oB
737
527
Briar Meadow Park
San
Channelview
Hidalgo Park
134J
26B
Bua
26BChannelview
Bunker Hill Village 10B
10B River Oaks Park
Frydek
Frydek
fyfa
Fonde45Park 610
Alief
Alief
oluo
Park
Park
Galena
Galena
Bellaire
Clodine
Park
Deer
Clodine
ParS
225
527
Briar Meadow59Park
Hidalgo Park
Ba
k
10B
10B Brookline Park
s Cree Fulshear
Fulshear Jo
Lansdale Park
yo
Fonde
Alief
Park
35 Park
Red
Bluff
610
Bessie
4B
Clodine
Deer
4B
Bellaire
Bellaire
Clodine
u
225
59
ne
90A
Pleasant
Pleasant
Andover Park
k
ParkPark
Sharpstown
Brookline Park
s Cree Fulshear
Fulshear s CJro
Lansdale
Dow Park
Houston
Houston
South
South
35 Red
Bluff Park
Bessie
4B
4B
Simonton
enee
90A
Foster
El
Foster
8
El Pleasant
Pleasant
ParkPark
Four
Andover
ks
Cristy Park
Corners
Four Corners
Park Hager Park Carter
Sharpstown
Grandview
Cr
Dow
Houston
South Houston
HOU
HOUPark South
Simonton
e
288
ek
Foster
Foster Sugar
8
Carter Park
Corners
Four
Park
Cristy
Corners
Four
Park
Park
Wilson
Hager
Evalyn
Land
Land
Sugar
34
Grand
Stafford
Stafford
34 HOU
60
Brentwood Park
36
HOU
Orchard
288
8 3Evalyn Wilson Park
Shadows
Skyscraper
Shadows
Skyscraper
Arman
Land
Land
Sugar
Sugar
Stafford
34
90A
34
60
Brentwood Park
Herbert
Herbert
36
Hobby
Hobby
Orchard
Orchard
8 3
Shadows
Village
Village
Skyscraper
Brookside
Shadows
SkyscraperBrookside
A
9990A
Herbert
59
Herbert
Hobby
Smada
HobbySale 1
29
Smada
Rosenberg
Rosenberg
29
Dewalt
Dewalt
La
Clear
Clear La
Pearland
Pearland
Village
Village
Brookside
Brookside
Sunset Park
Subject Property 99 59
27
27
90A
FresnoSale 1
Cl
Smada
29
Smada
1
Rosenberg
Rosenberg
29
Dewalt Fresno
Bernard
East
East Bernard
Clea
Clea
Booth
Booth Trammels
529
ea 26
Nass
Nass
Friendswood
Friendswood
26
6DewaltAlexan Spotford
Pearland
Pearland
Park
Sunset
rC
Property
Subject
Stubblebrooke
27
45 27
Fort
90A59
Palmetto
Fort Bend
Bend
Fresno
Fresno
Palmetto
Cr l
1
Leagu
Bernard
East
East Bernard
Booth
Booth Trammels
529
Spotford
Alexan
N
N
Friendswood
Friendswood eeakr 26
Siding
Hastings
26 Leagu
A
6
Siding
Hastings
36 Stubblebrooke
Thompsons
Thompsons
Arcola
540
35
45
Cr
Fort
Palmetto
Fort Bend
Bend
59
Palmetto
Le
Shel
Shel
ee 23
Powell
Hastings
Pleak
Point
Siding
Powell Point
Hastings Siding
Pleak
k 23
36
Thompsons
Thompsons
House
House Arcola
540
35
20
20
Manvel
Manvel
23
23
Point
Powell
Pleak
The
Point Marker
Powell
Pleak
The Heights
Heights D
Historical
19
House
288
19
House
Whaley
Corner
Whaley Corner
icki
20
20
Manvel
Manvel
541
n
s
School
Foster
Fairchilds
o
School
Foster
Fairchilds
The
Heights
n
The
Heights
35C
Historical Marker
Juliff
Juliff
B
288
Corner
D
Whaley
a
Whaley Corner
icki you
541
nso
Foster
School
Foster School
reek
Fairchilds
nB
35C
Juliff
Needville
Needville Fairchilds
Alvin
Alvin
ig C
ayo
60
B
6
Point
Long
uFe
Long Point
k
Point
Point
Sandy
Sandy
e
Santa
e
r
C
College
Community
Alvin
College
Alvin Community Alvin
Pe
g
Needville
Needville
Alvin
i
60
B
6
ac
Long
Point
Long Point
English
Four
English
hC
Point
Sandy
Sandy Point
Corners
Four Corners
Alta
Santa
Alvin
Rosharon
Rosharon
Lochridge
College
Community College
Alvin Community
Lochridge
Peree
Guy
ac k
English
Four
English
hC
Camp
Corners
Four Corners
Mohawk
Camp Mohawk
Rosharon
Rosharon
Lochridge
k
re
Lochridge
ee
Guy
r
Dinsmore
Bonney
Dinsmore ek
Bonney
C
Camp
Mohawk
Camp Mohawk
Mooredale
35
Mooredale
Burr
Burr
w
ek
Co
Aust
Liverpool
Liverpool
re
Dinsmore
Bonney
Dinsmore
Bonney
Damon
Damon
i
n
C
Otey
Mooredale
Bayo
35
Otey
Mooredale
Halls
Burr
C
Bayou C
Halls Bayou
Burr
ow
Aust u
183
Liverpool
Liverpool
Damon
Damon C
i
Boling
Boling
n
288
Otey
Bayo
Otey
Halls
Ba
Halls Ba
9
Newgulf
Newgulf
Orozimbo
Orozimbo
u
Station
Genther
Landing
Peterson
Lefman
Station
Genther
Landing
Peterson
Lefman
Boling
Boling
288
28
36
Newgulf
Orozimbo
Danbury
Danbury
Orozimbo
Don-Tol
Station
Genther
Peterson
Lefman
Station
Genther
Landing
Peterson Landing
Lefman
City
City Don-Tol
Lane
Lane
28
36
Anchor
Anchor
Danbury
Danbury
288B 558
Don-Tol
Don-Tol
City
Lane
Lane City
Anchor
Pledger
Pledger
Anchor
Van
Van Pelt
Pelt
Bailey
Prairie
Bailey Prairie
Retrieve
Retrieve
Van
Van Pelt
Pelt
Retrieve
Retrieve
35
288
Mims
Mims
Mims
Mims
36
288
36
Hoskins
Hoskins
Hoskins
Red
Red Fish
Fish
Red
Red
Sales Comparison Approach
Summary and Analysis of Comparable Sales
As a review, the subject property consists of a 280,148-SF, 312-unit apartment developed in 2007. The
improvements are in good condition with a current occupancy of 91%. The following chart summarizes the
pertinent characteristics of the comparables detailed on the preceding pages.
Summary of Comparable Improved Sales
#
Date
Units
Avg SF
Per Unit
YOC
Price/Unit
Price/SF
EGIM
OAR
1 4/1/09
264
1,049
2006
$88,542
$84.44
7.80
7.28%
2 10/21/09
400
841
1999
$57,924
$68.90
6.23
7.49%
3 5/15/10
218
1,094
2003
$95,183
$87.00
7.39
6.74%
AVG
294
994
0
$80,550
$80.11
7.14
7.17%
SUBJECT
312
898
2007
N/A
N/A
N/A
In examining the various comparables vis-a-vis the subject, the appraisers have employed several different
units of comparison, as outlined in the following sections.
Price Per Unit Analysis
The first analysis in this approach will focus on the price per unit. The sale price per unit is derived by
dividing the adjusted sale price by the number of units. Among the comparables, unadjusted prices range
from $57,924/unit to $95,183/unit. The spread in pricing is attributed to various differences between each
comparable and the subject.
The adjustment grid on the following page depicts how the comparables compare to the subject with respect
to such factors as quality, average unit size, location, age/condition, and amenities. If the comparable is
considered inferior to the subject, then a positive adjustment is applied. Conversely, if the property is
considered superior to the subject, then a downward adjustment would be indicated.
HUD Sample Report.wpd
Evergreen Valuation Services
79
IMPROVED SALES ADJUSTMENT GRID
Element
Subject
Sale 1
Sale 2
Sale 3
Name
City
Sale Price/Unit
Property Rights
Stubblebrooke
Spotford
N/A
Fee Simple
Financing Terms
Cash Assumed
Condition of Sale
Arm’s Length Assumed
Date of Sale/Time
July 1, 2010
Alexan Spotford
Spotford, TX
$88,542
Fee Simple
Cash to seller
0%
Arm’s Length
0%
April 1, 2009
0%
Westchase Forest
Houston, TX
$57,924
Fee Simple
Cash to seller
0%
Arm’s Length
0%
October 21, 2009
0%
Lakes @ Cinco Ranch
Katy, TX
$94,839
Fee Simple
Cash to seller
0%
Arm’s Length
0%
May 15, 2010
0%
$88,542
$57,924
$94,839
Good
-5%
Average
0%
Average
0%
A
0%
2006
0%
Good
0%
276,808
0%
1,049
-9%
None
0%
Average
0%
Forced Air
0%
Carports, detached
garages, 24 attached
garages
0%
Fair-avg
5%
Average
0%
Average
0%
B+
5%
1999
10%
Average
5%
336,300
0%
841
3%
None
0%
Average
0%
Forced Air
0%
Time Adjusted, Cash
Equivalent Price
N/A
Location
Average
Site/View
Average
Design & Appeal
Average
Quality
A
Year Built
2007
Condition
Good
Net Rentable Area (SF)
280,148
Unit Mix/Average Size
898
Basement
None
Functional Utility
Average
Heating/Cooling
Forced air
Parking On/Off Site
Amenities
48 carports ; 48 garages
Access gate, clubhouse, pool,
spa, heated sitting area by pool,
fitness center, business center,
theater room, car wash,
playground, VB, jogging trail,
patio/balcony, WD, MW
Net Adjustment
Adjusted Price
Average
HUD Sample Report.wpd
0%
Excellent
-10%
Average
0%
Average
0%
A+
-3%
2003
3%
Good
0%
238,500
0%
1,094
-11%
None
0%
Average
0%
Forced Air
0%
Attached garages,
detached garages,
carports
0%
Clubhouse, pool, hot tub, fitness
center, billiards, security gates,
intrusion alarms, patio/balcony,
WD
Clubhouse, security access,
two pools, fitness center,
business center, MW,
patio/balcony, WDC
Clubhouse, pool, fitness
center, access gate,
patio/balcony, intrusion
alarms, MW, WD
0%
2%
0%
-14%
$76,146
$75,457
30%
$75,301
-21%
$74,923
Evergreen Valuation Services
Garages, carports
80
Sales Comparison Approach
Economic Adjustment Factors
Property Rights Conveyed: All of the properties were reportedly sold in fee simple ownership (subject to
short-term leases). No adjustments are necessary for property rights.
Financing Terms: In accordance with the definition of market value, the appraisers reviewed each of the
comparable sales for the effects of any special financing. A typical arrangement that requires adjustment to
the sale price is financing by a seller or third party at a below-market interest rate. To the extent that
financing adjustments are needed, they are usually calculated based on the present value of the difference in
payments between market terms and actual terms. In this instance, all the comparables involved cash
equivalent terms, and no financing adjustments were necessary.
Conditions of Sale: Sale transactions can involve unusual conditions that might result in higher or lower
prices than would otherwise be expected. The parties may be motivated by the desire to assemble a larger
holding, unusual tax considerations, eminent domain proceedings, or other non arm’s-length situations. All
the comparables presented herein represent arm’s length transactions and require no adjustments.
Date of Sale/Time: Market conditions or time adjustments relate to increases or decreases in property value,
usually based on the supply/demand ratio of the market. The sales transpired between April 1, 2009 and May
15, 2010. Over this relatively narrow time span, no time adjustments are necessary.
Physical Adjustment Factors
Improved Sale No. 1, Alexan Spotford, is located in Spotford, TX, 3 miles northeast of the subject, and is
considered to have slightly superior locational attributes. The subject was built in 2007, and Sale 1 was built
in 2006. Within this age range, no adjustment is necessary. Sale 1 has an average unit size of 1,049 SF,
while the subject has an average unit size of 898 SF, and the appraisers applied a downward adjustment of
9%. After considering the various attributes summarized in the adjustment grid, the net percentage
adjustment applied to Sale 1 for physical factors is -14%. If the unit size adjustment were excluded, the net
percentage adjustment would be -5%. After all adjustments, Sale 1 offers an indication of $76,146/unit.
Improved Sale No. 2, Westchase Forest, is located in Houston, TX, 8 miles north of the subject, and is
considered slightly inferior with respect to location. Sale 2 was built in 1999, and an upward adjustment is
appropriate. Sale 2 has an average unit size of 841 SF, significantly smaller than the subject’s average unit
size of 898 SF, and the appraisers applied an upward adjustment of 3%. For the various physical factors
considered, the net percentage adjustment applied to Sale 2 is 30%. Excluding the adjustment for average
unit size, the net percentage adjustment would be 27%. After all adjustments, Sale 2 offers an indication of
$75,301/unit.
Improved Sale No. 3, Lakes @ Cinco Ranch, is located in Katy, TX, 15 miles northwest of the subject, and
is considered slightly superior with respect to location. Sale 3 was built in 2003, and an upward adjustment
is appropriate. Sale 3 has an average unit size of 1,094 SF, significantly larger than the subject’s average
unit size of 898 SF, and the appraisers applied a downward adjustment of 11%. For the various physical
factors considered, the net percentage adjustment applied to Sale 3 is -21%. Excluding the adjustment for
HUD Sample Report.wpd
Evergreen Valuation Services
81
Sales Comparison Approach
average unit size, the net percentage adjustment would be -10%. After all adjustments, Sale 3 offers an
indication of $74,923/unit.
Conclusion - Per Unit Analysis
After all adjustments, the comparables offer indications ranging from $74,923/unit to $76,146/unit, with a
mean of $75,457/unit. All factors considered, the appraisers have concluded a value of $75,000/unit, applied
to the subject as follows:
Price Per Unit Indication
312 Units
HUD Sample Report.wpd
x
$75,000/Unit =
$23,400,000
Less: Deferred Maintenance =
$0
Less: Lease-Up Costs =
$0
Net Value Indication =
$23,400,000
ROUNDED =
$23,400,000
Evergreen Valuation Services
82
Sales Comparison Approach
Price Per Square Foot Analysis
The comparable sales were previously examined and compared to the subject on a per unit basis. The
comparables are now examined on a per square foot basis. On a per square foot basis, the unadjusted prices
for the comparables range $68.90/SF to $87.00/SF, after adjusting for deferred maintenance and rent loss.
As with the per unit analysis, adjustments are applied to the comparables to reflect differences vis-a-vis the
subject. For the most part, the percentage adjustments applied herein are identical to those applied previously
in the per unit analysis. The one exception is the size adjustment. On a per unit basis, a comparable with a
larger unit size is adjusted downward. On a per square foot basis, however, the larger comparable is adjusted
upward, reflecting the inverse relationship between average unit size and price per square foot.
A second adjustment grid evaluating the comparables on a per square foot basis is presented on the following
page.
HUD Sample Report.wpd
Evergreen Valuation Services
83
IMPROVED SALES ADJUSTMENT GRID
Element
Subject
Sale 1
Sale 2
Sale 3
Name
City
Sale Price/Unit
Property Rights
Stubblebrooke
Spotford
N/A
Fee Simple
Financing Terms
Cash Assumed
Condition of Sale
Arm’s Length Assumed
Date of Sale/Time
July 1, 2010
Alexan Spotford
Spotford, TX
$84.44
Fee Simple
Cash to seller
0%
Arm’s Length
0%
April 1, 2009
0%
Westchase Forest
Houston, TX
$68.90
Fee Simple
Cash to seller
0%
Arm’s Length
0%
October 21, 2009
0%
Lakes @ Cinco Ranch
Katy, TX
$86.69
Fee Simple
Cash to seller
0%
Arm’s Length
0%
May 15, 2010
0%
$84.44
$68.90
$86.69
Good
-5%
Average
0%
Average
0%
A
0%
2006
0%
Good
0%
276,808
0%
1,049
6%
None
0%
Average
0%
Forced Air
0%
Carports, detached
garages, 24 attached
garages
0%
Fair-avg
5%
Average
0%
Average
0%
B+
5%
1999
10%
Average
5%
336,300
0%
841
-3%
None
0%
Average
0%
Forced Air
0%
Time Adjusted, Cash
Equivalent Price
N/A
Location
Average
Site/View
Average
Design & Appeal
Average
Quality
A
Year Built
2007
Condition
Good
Net Rentable Area (SF)
280,148
Unit Mix/Average Size
898
Basement
None
Functional Utility
Average
Heating/Cooling
Forced air
Parking On/Off Site
Amenities
48 carports ; 48 garages
Access gate, clubhouse, pool,
spa, heated sitting area by pool,
fitness center, business center,
theater room, car wash,
playground, VB, jogging trail,
patio/balcony, WD, MW
Net Adjustment
Adjusted Price
Average
HUD Sample Report.wpd
0%
Excellent
-10%
Average
0%
Average
0%
A+
-3%
2003
3%
Good
0%
238,500
0%
1,094
8%
None
0%
Average
0%
Forced Air
0%
Attached garages,
detached garages,
carports
0%
Clubhouse, pool, hot tub, fitness
center, billiards, security gates,
intrusion alarms, patio/balcony,
WD
Clubhouse, security access,
two pools, fitness center,
business center, MW,
patio/balcony, WDC
Clubhouse, pool, fitness
center, access gate,
patio/balcony, intrusion
alarms, MW, WD
0%
2%
0%
1%
$85.29
$85.22
24%
$85.43
-2%
$84.95
Evergreen Valuation Services
Garages, carports
84
Sales Comparison Approach
Conclusion - Per Square Foot Analysis
After all adjustments, the comparables offer indications ranging from $84.95/SF to $85.43/SF, with a mean
of $85.22/SF. Based on the available evidence, the appraisers have concluded a value of $85.00/SF, applied
to the subject as follows:
Price Per Square Foot Indication
280,148 SF
HUD Sample Report.wpd
x
$85.00 /SF =
$23,812,580
Less: Deferred Maintenance =
$0
Less: Lease-Up Costs =
$0
Net Value Indication =
$23,812,580
ROUNDED =
$23,810,000
Evergreen Valuation Services
85
Sales Comparison Approach
Effective Gross Income Multiplier Analysis
The effective gross income multiplier is also indicative of the income/investment nature of a property such
as the subject. However, the primary concern of an investor is the net return after expenses as opposed to the
gross earning potential. Thus, this method is most useful when the expense character of the property is highly
similar to the property being analyzed. The principal advantage of the technique is that the reflection of rental
income is direct. Therefore, differences between properties which could necessitate subjective adjustments
by the appraiser have been resolved by the free action of the rental market. If the comparable properties have
some advantage over the subject in age, condition, accessibility, location or physical characteristics, the
difference in actual rental presumably reflects the extent of this advantage. The following chart summarizes
the estimated EGIMs of the comparable sales.
Summary of Comparable EGIMs
Sale #
EGIM
Expense Ratio
1
7.80
43.28%
2
6.23
53.34%
3
7.39
50.17%
Average
7.14
48.93%
Subject
7.30
47.60%
The EGIMs of the comparable sales range from 6.23 to 7.80, with an average of 7.14. Effective gross income
multipliers are typically correlated with operating expense ratios (OER). As OERs increase, the efficiency
of the property's income producing capacity is diminished, so EGIMs decrease. This general trend is
demonstrated by the comparables. As detailed later in the Income Approach section of this report, the subject
has an operating expense ratio of 47.60%. This is sightly below the mean of the comparables, suggesting
an EGIM slightly above the mean of the comparables. Considering the evidence, an EGIM of 7.30 is
considered appropriate for the subject property, resulting in the following value indication:
EGIM Indication
STABILIZED EGI x
EGIM
$3,114,223 x
7.30
Less: Deferred Maintenance
Less: Lease-Up Costs
Net Value Indication
ROUNDED
HUD Sample Report.wpd
=
=
=
=
=
=
VALUE
$22,733,829
$0
$0
$22,733,829
$22,730,000
Evergreen Valuation Services
86
Sales Comparison Approach
Sales Comparison Approach Conclusions
The following chart summarizes the value indications derived for the subject property by the various
valuation techniques employed in this Sales Comparison Approach analysis:
Summary of Value Indications
As Is
Prospective Value
Technique
Market Value
Market Value
Price Per Unit
$23,400,000
N/A
Price Per Square Foot
$23,810,000
N/A
EGIM
$22,730,000
N/A
The various indications fall into a tight range, with the highest and lowest value indications varying by just
4.8%. Overall, the data supports the following value conclusion(s) via the Sales Comparison Approach:
Sales Comparison Approach Conclusions
As Is
Prospective Value
Unit of Comparison
Market Value
Market Value
Total Value
$23,500,000
N/A
Value Per Unit
$75,321
N/A
Value Per Square Foot
$83.88
N/A
HUD Sample Report.wpd
Evergreen Valuation Services
87
Income Approach
The Income Approach to value assumes a direct relationship between value and income. The two primary
methods of estimating value from a property’s income are Direct Capitalization and Yield Capitalization
(Discounted Cash Flow Analysis).
In Direct Capitalization, value is estimated by deducting all applicable expenses from anticipated gross
income to arrive at projected net income for the coming year. This amount is then capitalized at a rate which
is commensurate with the risk inherent in the ownership of the property. Direct Capitalization is most
appropriate for stabilized income streams where the property being analyzed reflects occupancy rates typical
of the market.
With respect to Yield Capitalization or Discounted Cash Flow Analysis, value is estimated by deducting all
applicable expenses from anticipated gross income to arrive at projected net income during each year of the
projection period, which is then discounted at a rate commensurate with the perceived risk. A reversion value
is computed at the end of the projection period, and this amount is also discounted and added to the present
value of the annual income streams to derive an estimate of value. The analysis method involves a variety
of projections relative to changes in the income stream over time as a result of changes in occupancy and
inflationary factors. This method is well suited to properties that are not at stabilized operating levels, or
when fluctuating income streams are anticipated.
Gross Income Estimate
The potential gross income estimate is obtained by estimating the market rent for the subject property.
Market rent is defined in The Appraisal of Real Estate, Tenth Edition, Copyright 1993, Appraisal Institute
as:
"The total income attributable to a real property at 100% occupancy before operating
expenses are deducted."
This definition is in reference to the amount of money a property should produce based on actual rents being
received from similar properties with comparable amenities located in the same neighborhood or other similar
areas. Therefore, research and analysis of lease rates on units considered similar to or competitive with the
subject was necessary.
Information was obtained from owners, developers, managers and leasing agents, and/or other knowledgeable
persons involved in lease transactions, and data concerning the properties considered generally similar to or
competitive with the subject.
In addition to the analysis of the cited rent comparables, current occupancy levels, absorption rates and
general market trends were discussed with active real estate professionals in the subject neighborhood. The
data presented emphasizes competing facilities in the market with property types most similar to the subject.
HUD Sample Report.wpd
Evergreen Valuation Services
88
Rent Subject
Name:
Stubblebrooke
Address:
1123 Brain Lane
Proximity to Subject: Same
Overview:
2-story garden style
Class/Quality:
A
Year Built/Renovated: 2007
Occupancy:
91%
Condition:
Good
Concessions:
Reduced rents
Utilities Included:
None
Amenities:
Access gate, clubhouse, pool, spa, heated sitting area by pool, fitness center, business
center, theater room, car wash, playground, VB, jogging trail, patio/balcony, WD,
MW
Private Basements:
None
Covered Parking:
Carport ($30) / Detached garage ($75)
Comments:
The rents shown below are those currently quoted. Rents were reduced as an
advertised “limited time special.” Consequently, the quoted rents are below the
actual rents in place for each unit type.
Rental Data
# Units
Unit Type
Size (SF)
$/Month
$/SF
Total SF
Total Rent
1 Bd
1.0 Bath
172
745
$750
$1.01
128,140
$129,000
2 Bd
2.0 Bath
128
1,067
$950
$0.89
136,576
$121,600
3 Bd
2.0 Bath
12
1,286
$1,300
$1.01
15,432
$15,600
312
898
$853
$0.95
280,148
$266,200
Totals & Means
Amenities
Location Quality:
Pool/Rec. Area:
Garages/Carports:
Air Conditioning:
Carpet/Drapes:
Other:
HUD Sample Report.wpd
Average
Pool, hot tub
Some
Central
Yes/Yes
N/A
Balcony/Patio:
Washer/Dryer:
Storage:
Site/View:
Design/Appeal:
Other:
Evergreen Valuation Services
Yes/Yes
Individual
None
Average
Average
N/A
89
Rent Subject
Appliances
Range/Oven:
Refrigerator:
Dishwasher:
Electric
Frost Free
Yes
Disposal:
Microwave:
Other:
Services/Utilities (Paid by & Type):
Heat/Type:
Tenant/Forced air
Cook/Type:
Tenant/Electric
HUD Sample Report.wpd
Yes
Yes
N/A
Electricity:
Individual meters
Water Cold/Hot: Tenant/Tenant
Evergreen Valuation Services
90
Rent Comp 1
Name:
Lakeland Estates
Address:
630 Colony Lakes Estates Dr
Proximity to Subject:
1/8 mile northeast
Overview:
3-story garden style
Class/Quality:
A+
Year Built/Renovated:
2008
Occupancy:
92%
Condition:
Good
Concessions:
None
Utilities Included:
None
Amenities:
Access gate, clubhouse, pool, spa, fitness center, business center, playground,
patio/balcony, MW, WD
Private Basements:
None
Covered Parking:
Carport ($25) / detached garage ($65)
Comments:
This is a good quality property that features such finishes as granite countertops.
Current specials range from one month to six weeks free. The rents cited below are
net of concessions.
Rental Data
# Units Size (SF)
Unit Type
$/Month
$/SF
Total SF
Total Rent
1
Bd
1.0 Ba
60
655
$710
$1.08
39,300
$42,625
1
Bd
1.0 Ba
12
746
$811
$1.09
8,952
$9,735
1
Bd
1.0 Ba
72
801
$816
$1.02
57,672
$58,740
2
Bd
2.0 Ba
12
1,092
$1,013
$0.93
13,104
$12,155
2
Bd
2.0 Ba
96
1,098
$1,050
$0.96
105,408
$100,760
3
Bd
2.0 Ba
12
1,388
$1,270
$0.91
16,656
$15,235
264
913
$906
$0.99
241,092
$239,250
Totals & Means
Amenities
Location Quality:
Pool/Rec. Area:
Garages/Carports:
Air Conditioning:
Carpet/Drapes:
Other:
HUD Sample Report.wpd
Average
Pool, hot tub
Some
Central
Yes/Yes
N/A
Balcony/Patio:
Washer/Dryer:
Storage:
Site/View:
Design/Appeal:
Other:
Evergreen Valuation Services
Yes/Yes
Individual
None
Average
Average
N/A
91
Rent Comp 1
Appliances
Range/Oven:
Refrigerator:
Dishwasher:
Electric
Frost Free
Yes
Disposal:
Microwave:
Other:
Services/Utilities (Paid by & Type):
Heat/Type:
Tenant/Forced air
Cook/Type:
Tenant/Electric
HUD Sample Report.wpd
Yes
Yes
N/A
Electricity:
Individual meters
Water Cold/Hot: Tenant/Tenant
Evergreen Valuation Services
92
Rent Comp 2
Name:
Preserve @ Colony Lakes
Address:
1000 Farrah Lane
Proximity to Subject:
Next door
Overview:
3-story garden style
Class/Quality:
A-
Year Built/Renovated:
2004
Occupancy:
92%
Condition:
Good
Concessions:
None
Utilities Included:
None
Amenities:
Access gate, clubhouse, pool, spa, fitness center, business center, patio/balcony,
WD
Private Basements:
None
Covered Parking:
Carport ($35) / Detached garage ($75)
Comments:
The current special is one month free for one- and two-bedroom units.
Rental Data
Unit Type
# Units Size (SF)
$/Month
$/SF
Total SF
Total Rent
1 Bd 1.0 Ba
72
647
$669
$1.03
46,584
$48,180
1 Bd 1.0 Ba
72
746
$733
$0.98
53,712
$52,800
1 Bd 1.0 Ba
72
801
$775
$0.97
57,672
$55,770
2 Bd 2.0 Ba
72
1,047
$871
$0.83
75,384
$62,700
2 Bd 2.0 Ba
72
1,098
$880
$0.80
79,056
$63,360
3 Bd 2.0 Ba
60
1,219
$1,150
$0.94
73,140
$69,025
420
918
$838
$0.91
385,548
$351,835
Totals & Means
Amenities
Location Quality:
Pool/Rec. Area:
Garages/Carports:
Air Conditioning:
Carpet/Drapes:
Other:
HUD Sample Report.wpd
Average
Pool, hot tub
Some
Central
Yes/Yes
N/A
Balcony/Patio:
Washer/Dryer:
Storage:
Site/View:
Design/Appeal:
Other:
Evergreen Valuation Services
Yes/Yes
Individual
None
Average
Average
N/A
93
Rent Comp 2
Appliances
Range/Oven:
Refrigerator:
Dishwasher:
Electric
Frost Free
Yes
Services/Utilities (Paid by & Type):
Heat/Type:
Tenant/Forced air
Cook/Type:
HUD Sample Report.wpd
Tenant/Electric
Disposal:
Microwave:
Other:
Yes
Yes
N/A
Electricity:
Water
Cold/Hot:
Individual meters
Evergreen Valuation Services
Tenant/Tenant
94
Rent Comp 3
Name:
Sandybrooke
Address:
1025 Dulles Avenue
Proximity to Subject:
1/4 mile northwest
Overview:
3-story garden style
Class/Quality:
A
Year Built/Renovated:
2002
Occupancy:
89%
Condition:
Good
Concessions:
1 month free
Utilities Included:
None
Amenities:
Access gate, clubhouse, fitness center, business center, pool, spa, VB,
patio/balcony, WD, MW
Private Basements:
None
Covered Parking:
Carport ($30) / detached garage ($75)
Comments:
The current special is one month free, taken up front or prorated over the lease
term. The rents cited below are net of concessions.
Rental Data
Unit Type
# Units Size (SF)
$/Month
$/SF
Total SF
Total Rent
1 Bd
1.0
Ba
48
714
$755
$1.06
34,272
$36,240
1 Bd
1.0
Ba
48
827
$825
$1.00
39,696
$39,600
2 Bd
1.0
Ba
24
961
$930
$0.97
23,064
$22,320
2 Bd
2.0
Ba
48
1,104
$975
$0.88
52,992
$46,800
2 Bd
2.0
Ba
48
1,205
$1,025
$0.85
57,840
$49,200
3 Bd
2.0
Ba
24
1,375
$1,365
$0.99
33,000
$32,760
240
1,004
$946
$0.94
240,864
$226,920
Totals & Means
Amenities
Location Quality:
Pool/Rec. Area:
Garages/Carports:
Air Conditioning:
Carpet/Drapes:
Other:
HUD Sample Report.wpd
Average
Pool, hot tub
Some
Central
Yes/Yes
N/A
Balcony/Patio:
Washer/Dryer:
Storage:
Site/View:
Design/Appeal:
Other:
Evergreen Valuation Services
Yes/Yes
Individual
None
Average
Average
N/A
95
Rent Comp 3
Appliances
Range/Oven:
Refrigerator:
Dishwasher:
Electric
Frost Free
Yes
Services/Utilities (Paid by & Type):
Heat/Type:
Tenant/Forced air
Cook/Type:
HUD Sample Report.wpd
Tenant/Electric
Disposal:
Microwave:
Other:
Yes
Yes
N/A
Electricity:
Water
Cold/Hot:
Individual meters
Evergreen Valuation Services
Tenant/Tenant
96
Rent Comp 4
Name:
Trestles
Address:
1201 Dulles Avenue
Proximity to Subject:
Just west
Overview:
3-story garden style
Class/Quality:
A
Year Built/Renovated:
1999
Occupancy:
91%
Condition:
Good
Concessions:
Reduced rents
Utilities Included:
None
Amenities:
Access gate, clubhouse, pool, fitness center, patio/balcony, MW, WD
Private Basements:
None
Covered Parking:
Carport ($35) / detached garage ($85)
Comments:
Rents were recently reduced as a “special.”
Rental Data
Unit Type
# Units Size (SF)
$/Month
$/SF
Total SF
Total Rent
1 Bd 1.0 Ba
24
793
$750
$0.95
19,032
$18,000
1 Bd 1.0 Ba
72
810
$833
$1.03
58,320
$59,976
2 Bd 2.0 Ba
60
1,036
$929
$0.90
62,160
$55,740
2 Bd 2.0 Ba
24
1,115
$939
$0.84
26,760
$22,536
3 Bd 2.0 Ba
8
1,339
$1,328
$0.99
10,712
$10,624
188
941
$888
$0.94
176,984
$166,876
Totals & Means
Amenities
Location Quality:
Pool/Rec. Area:
Garages/Carports:
Air Conditioning:
Carpet/Drapes:
Other:
HUD Sample Report.wpd
Average
Pool, hot tub
Some
Central
Yes/Yes
N/A
Balcony/Patio:
Washer/Dryer:
Storage:
Site/View:
Design/Appeal:
Other:
Evergreen Valuation Services
Yes/Yes
Individual
None
Average
Average
N/A
97
Rent Comp 4
Appliances
Range/Oven:
Refrigerator:
Dishwasher:
Electric
Frost Free
Yes
Disposal:
Microwave:
Other:
Services/Utilities (Paid by & Type):
Heat/Type:
Tenant/Forced air
Cook/Type:
Tenant/Electric
HUD Sample Report.wpd
Yes
Yes
N/A
Electricity:
Individual meters
Water Cold/Hot: Tenant/Tenant
Evergreen Valuation Services
98
Rent Comp 5
Name:
Southwind
Address:
9720 Broadway
Proximity to Subject:
1 mile northeast
Overview:
3-story garden style
Class/Quality:
A-
Year Built/Renovated:
2003
Occupancy:
92%
Condition:
Good
Concessions:
None
Utilities Included:
None
Amenities:
Access gate, clubhouse,
patio/balcony, MW, WD
Private Basements:
None
Covered Parking:
Carport ($35) / detached garage ($75)
Comments:
Rents are quoted as a range for each unit type, and the approximate midpoint is
presented below.
fitness center, pool, spa, playground, carwash,
Rental Data
# Units Size (SF)
Unit Type
$/Month
$/SF
Total SF
Total Rent
1 Bd 1.0 Ba
60
687
$800
$1.16
41,220
$48,000
1 Bd 1.0 Ba
60
755
$815
$1.08
45,300
$48,900
1 Bd 1.0 Ba study
72
943
$925
$0.98
67,896
$66,600
2 Bd 2.0 Ba
48
1,085
$1,030
$0.95
52,080
$49,440
2 Bd 2.0 Ba
40
1,275
$1,210
$0.95
51,000
$48,400
3 Bd 2.0 Ba
32
1,400
$1,335
$0.95
44,800
$42,720
312
969
$975
$1.01
302,296
$304,060
Totals & Means
Amenities
Location Quality:
Pool/Rec. Area:
Garages/Carports:
Air Conditioning:
Carpet/Drapes:
Other:
HUD Sample Report.wpd
Average
Pool, hot tub
Some
Central
Yes/Yes
N/A
Balcony/Patio:
Washer/Dryer:
Storage:
Site/View:
Design/Appeal:
Other:
Evergreen Valuation Services
Yes/Yes
Individual
None
Average
Average
N/A
99
Rent Comp 5
Appliances
Range/Oven:
Refrigerator:
Dishwasher:
Electric
Frost Free
Yes
Disposal:
Microwave:
Other:
Services/Utilities (Paid by & Type):
Heat/Type:
Tenant/Forced air
Cook/Type:
Tenant/Electric
HUD Sample Report.wpd
Yes
Yes
N/A
Electricity:
Individual meters
Water Cold/Hot: Tenant/Tenant
Evergreen Valuation Services
100
6
WESTHEIMER RD
WESTHEIMER RD
W
ES
RD
E
TH
ER
IM
RD
Brays B
ayou
RD
ER
IM Clodine
Clodine
Brays
HE
RD
T
R
ES
ME Clodine
W
I
E
Clodine
TH
ES
W
F-M 1093
F-M 1093
Brays B
ayou
Brays Bayou
Andrau A
Andr
Brays Bayou
ou
W
E
R
ME
EI
H
ST
Brays Bayou
Bay
falo
Buf ou
ay
lo B
fa
Buf
Comparable Rents
Alief
Brays B
Alief ayou
Bayou
Brays B
6
Quillian
Me
Quillian Me
M
6
Quillia
Quilli
Rent 5
Rent 5
Southwind
Southwind
Rent 3
Rent 3
Sandybrooke
Sandybrooke
Four
Corners
Four Corners
6
Property
Subject
Four
Corners 6
Four Corners
Property
Subject
Stubblebrooke
Stubblebrooke
99
Rent 1
1
Estates
LakelandRent
Lakeland Estates
6
6
Oy
ste
r
ee
Cr
k
99
Oyst
er Cr
eek
Pumpkin Lakes
Oyst
er Cr
eek
White Lake
Rent 2
Rent 2 Lakes
Preserve @ Colony
Red
Red Gully
Gully
Preserve @ Colony Lakes
Red
Red Gully
Gully
Pumpkin Lakes
99
Gannoway Lake
White Lake
Cre
ek
99
Gannoway Lake
Cre
ek
r
Fish Lake Rent 4
Rent 4
Fish Lake
Trestles
Trestles
Oy
ster
ste
k
Oy
ster
Oy
ee
Cr
90A
Cleveland Lake
Sugar Land Muni/Hull Field
Cleveland Lake
Field Land
Sugar Land Muni/Hull
Land
Sugar
Sugar
Alkire Lake
Eldridge Lake
Lake
Venetian
Land
Land
Sugar
Sugar
6
Alkire Lake
Venetian Lake Eldridge Lake
90A 6
Horseshoe Lake
59
90A
Horseshoe Lake
Char Lake
99
59
90A
Char Lake
Houston
H
59
90A
A
6
90A
90A
6
Thompson
Chapel
Thompson Chapel
Paynes
Paynes
59
Paynes
Paynes
Lake
Brooks
First
Mall
First Colony
Colony Mall
First
Mall
First Colony
Colony Mall
Thompson
Chapel
Thompson Chapel
Street
Atlas
DeLorme.
98
USA
USA
StreetAtlas
AtlasUSA
DeLorme. Street
98
98DeLorme.
Street
Atlas
DeLorme.
98
59
USA
Street
Atlas
DeLorme.
1998
©
USA
StreetAtlas
AtlasUSA
DeLorme. Street
©
1998DeLorme.
©1998
USA
Street
Atlas
DeLorme.
1998
©
Brooks Lake
reek
ter C
s
y
O
Herbert
Herbert
ter
Oys
6
Herbert
Herbert
Income Approach
Rental Income Analysis
In this portion of the Income Approach, the objective is to determine if the present rental rates for the subject
are at market. This is achieved by comparison of the subject’s rates with competing facilities such as the
comparables surveyed. A summary of the comparables, inclusive of the subject, is presented in the table
below.
Summary of Rent Comparables
No. Name
Sub Stubblebrooke
Units
Avg. Unit Avg Rent
Size (SF) Per Month
Avg Rent
PSF
YOC
Occup
312
898
$853
$0.950
2007
91%
1
Lakeland Estates
264
913
$906
$0.992
2008
92%
2
Preserve @ Colony Lakes
420
918
$838
$0.913
2004
92%
3
Sandybrooke
240
1,004
$946
$0.942
2002
89%
4
Trestles
188
941
$888
$0.943
1999
91%
5
Southwind
312
969
$975
$1.006
2003
92%
Average of Comparables
289
941
$901
$0.958
2003
91%
Weighted Average
289
937
$896
$0.956
91%
Among the subject and competing properties, quoted rents range from $0.913/SF to $1.006/SF, with an
average of $0.959/SF and a weighted average of $0.956/SF. The subject’s current quoted rents average
$0.950/SF, which is within the range of the comparables.
In order to determine the reasonableness of current quoted rents, the appraisers have rated each of the
comparables in relation to the subject in several categories. This was accomplished utilizing form HUD92273 (Estimates of Market Rent by Comparison). In general, one form is prepared for each unit type. In
some instances, units that are similar in size and other features may be combined for analysis on a single
form. The subject has one style of one-bedroom units and one style of two-bedroom units. The ground floor
units have no balconies or patios, so they tend to rent for $10 less. An adjustment grid is presented for the
units with balconies. A slightly lower rent is then concluded for the ground floor units. Several forms HUD92273 are presented on the following pages.
HUD Sample Report.wpd
Evergreen Valuation Services
102
OMB Approval No. 2502-0029
(exp. 10/30/2012)
U.S. Department of Housing and Urban Development
Office of Housing
Federal Housing Commissioner
Estimates of Market Rent
by Comparison
Public reporting burden for this collection of information is estimated to average 1 hour per response, including the time for reviewing instructions, searching existing data sources, gathering and maintaining the data needed, and completing and reviewing the collection of information.
This information is required by the Housing Appropriation Act of 9/28/1994. The information is needed to analyze the reasonableness of the Annual Adjustment Factor formula, and will be used where rent levels for a specific unit type, in a Substantial Rehabilitation or New Construction
Contract, exceed the existing FMR rent. The information is considered nonsensitive and does not require special protection. This agency may not collect this information, and you are not required to complete this form, unless it displays a currently valid OMB control number.
1. Unit Type
2. Subject Property (Address)
A. Comparable Property No. 1 (address)
B. Comparable Property No. 2 (address)
C. Comparable Property No. 3 (address)
D. Comparable Property No. 4 (address)
1 Bd - 1 Ba
Stubblebrooke
Lakeland Estates
Preserve @ Colony Lakes
Sandybrooke
Trestles
Southwind
1123
630 Colony Lakes Estates Dr
1000 Farrah Lane
1025 Dulles Avenue
1201 Dulles Avenue
9720 Broadway
Brain Lane
Characteristics
Data
Data
Adjustments
+
Data
Adjustments
+
Data
Adjustments
+
Data
E. Comparable Property No. 5 (address)
Adjustments
+
Adjustments
+
Data
3. Effective Date of Rental
July 1, 2010
July 1, 2010
July 1, 2010
July 1, 2010
July 1, 2010
July 1, 2010
4. Type of Project/Stories
2-story garden style
3-story garden style
3-story garden style
3-story garden style
3-story garden style
3-story garden style
5. Floor of Unit Building
Any
Any
Any
Any
Any
Any
6. Project Occupancy %
91.4%
92%
92%
89%
91%
92%
7. Concessions
Reduced rents
None
None
1 month free
Reduced rents
None
8. Year Built
2007
2008
9. Sq. Ft. Area
745
746
10. Number of Bedrooms
1
1
2004
($1)
746
($30)
2002
$0
1
1999
714
$16
1
793
2003
($23)
1
815
11. Number of Baths
1
1
1
1
1
1
12. Number of Rooms
3
3
3
3
3
3
13. Balc./Terrace/Patio
Yes/Yes
Yes/Yes
Yes/Yes
Yes/Yes
Yes/Yes
Yes/Yes
14. Garage or Carport
Some
Some
Some
Some
Some
Some
15. Equipment
16. Services
($32)
1
a. A/C
Central
Central
Central
Central
Central
Central
b. Range/Oven
Electric
Electric
Electric
Electric
Electric
Electric
c. Refrigerator
Frost Free
Frost Free
Frost Free
Frost Free
Frost Free
Frost Free
d. disposal
Yes
Yes
Yes
Yes
Yes
Yes
e. Microwave
Yes
Yes
Yes
Yes
Yes
Yes
f. Dishwasher
Yes
Yes
Yes
Yes
Yes
Yes
g. Washer / Dryer
Individual
Individual
Individual
Individual
Individual
Individual
h. Carpet/Drapes
Yes/Yes
Yes/Yes
Yes/Yes
Yes/Yes
Yes/Yes
Yes/Yes
i. Pool/Rec. Area
Pool, hot tub
Pool, hot tub
Pool, hot tub
Pool, hot tub
Pool, hot tub
Pool, hot tub
a. Heat/Type
Tenant/Forced air
Tenant/Forced air
Tenant/Forced air
Tenant/Forced air
Tenant/Forced air
Tenant/Forced air
b. Cook/Type
Tenant/Electric
Tenant/Electric
Tenant/Electric
Tenant/Electric
Tenant/Electric
Tenant/Electric
c. Electricity
Individual meters
Individual meters
Individual meters
Individual meters
Individual meters
Individual meters
d. Water Cold/Hot
Tenant/Tenant
Tenant/Tenant
Tenant/Tenant
Tenant/Tenant
Tenant/Tenant
Tenant/Tenant
17. Storage
None
None
None
None
None
None
18. Project Location
Average
Average
Average
Average
Average
Average
19. Other
N/A
N/A
N/A
N/A
N/A
N/A
Other
N/A
N/A
N/A
N/A
N/A
N/A
Other
N/A
N/A
N/A
N/A
N/A
N/A
$750
$811
$733
$755
$750
$755
20. Unit Rent Per Month
21. Total Adjustment
($1)
22. Indicated Rent
23. Correlated Subject Rent
$810
$750
($2)
($2)
$731
($14)
$741
($23)
$727
($32)
$723
If there are any Remarks, check here and add the remarks to the back page
Note: In the adjustments column, enter dollar amounts by which subject property varies from
comparable properties. If subject is better, enter a “Plus” amount and if subject is inferior to the
comparable, enter a “Minus” amount. Use back of page to explain adjustments as needed.
Previous editions are obsolete
Appraiser’s Signature
Date
July 28, 2010
Reviewer’s Signature
Date
July 28, 2010
form HUD-92273 (07/2003)
OMB Approval No. 2502-0029
(exp. 10/30/2012)
U.S. Department of Housing and Urban Development
Office of Housing
Federal Housing Commissioner
Estimates of Market Rent
by Comparison
Public reporting burden for this collection of information is estimated to average 1 hour per response, including the time for reviewing instructions, searching existing data sources, gathering and maintaining the data needed, and completing and reviewing the collection of information.
This information is required by the Housing Appropriation Act of 9/28/1994. The information is needed to analyze the reasonableness of the Annual Adjustment Factor formula, and will be used where rent levels for a specific unit type, in a Substantial Rehabilitation or New Construction
Contract, exceed the existing FMR rent. The information is considered nonsensitive and does not require special protection. This agency may not collect this information, and you are not required to complete this form, unless it displays a currently valid OMB control number.
1. Unit Type
2. Subject Property (Address)
A. Comparable Property No. 1 (address)
B. Comparable Property No. 2 (address)
C. Comparable Property No. 3 (address)
D. Comparable Property No. 4 (address)
2 Bd - 2 Ba
Stubblebrooke
Lakeland Estates
Preserve @ Colony Lakes
Sandybrooke
Trestles
Southwind
1123
630 Colony Lakes Estates Dr
1000 Farrah Lane
1025 Dulles Avenue
1201 Dulles Avenue
9720 Broadway
Brain Lane
Characteristics
Data
Data
Adjustments
+
Data
Adjustments
+
Data
Adjustments
+
Data
E. Comparable Property No. 5 (address)
Adjustments
+
Adjustments
+
Data
3. Effective Date of Rental
July 1, 2010
July 1, 2010
July 1, 2010
July 1, 2010
July 1, 2010
July 1, 2010
4. Type of Project/Stories
2-story garden style
3-story garden style
3-story garden style
3-story garden style
3-story garden style
3-story garden style
5. Floor of Unit Building
Any
Any
Any
Any
Any
Any
6. Project Occupancy %
91.4%
92%
92%
89%
91%
92%
7. Concessions
Reduced rents
None
None
1 month free
($40)
Reduced rents
None
($16)
1,036
8. Year Built
2007
2008
9. Sq. Ft. Area
1,067
1,092
10. Number of Bedrooms
2
2
2004
($12)
2002
1,047
$8
2
1999
1,104
2
2003
$14
2
1,085
11. Number of Baths
2
2
2
2
2
2
12. Number of Rooms
4
4
4
4
4
4
13. Balc./Terrace/Patio
Yes/Yes
Yes/Yes
Yes/Yes
Yes/Yes
Yes/Yes
Yes/Yes
14. Garage or Carport
Some
Some
Some
Some
Some
Some
15. Equipment
16. Services
a. A/C
Central
Central
Central
Central
Central
Central
b. Range/Oven
Electric
Electric
Electric
Electric
Electric
Electric
c. Refrigerator
Frost Free
Frost Free
Frost Free
Frost Free
Frost Free
Frost Free
d. disposal
Yes
Yes
Yes
Yes
Yes
Yes
e. Microwave
Yes
Yes
Yes
Yes
Yes
Yes
f. Dishwasher
Yes
Yes
Yes
Yes
Yes
Yes
g. Washer / Dryer
Individual
Individual
Individual
Individual
Individual
Individual
h. Carpet/Drapes
Yes/Yes
Yes/Yes
Yes/Yes
Yes/Yes
Yes/Yes
Yes/Yes
i. Pool/Rec. Area
Pool, hot tub
Pool, hot tub
Pool, hot tub
Pool, hot tub
Pool, hot tub
Pool, hot tub
a. Heat/Type
Tenant/Forced air
Tenant/Forced air
Tenant/Forced air
Tenant/Forced air
Tenant/Forced air
Tenant/Forced air
b. Cook/Type
Tenant/Electric
Tenant/Electric
Tenant/Electric
Tenant/Electric
Tenant/Electric
Tenant/Electric
c. Electricity
Individual meters
Individual meters
Individual meters
Individual meters
Individual meters
Individual meters
d. Water Cold/Hot
Tenant/Tenant
Tenant/Tenant
Tenant/Tenant
Tenant/Tenant
Tenant/Tenant
Tenant/Tenant
17. Storage
None
None
None
None
None
None
18. Project Location
Average
Average
Average
Average
Average
Average
19. Other
N/A
N/A
N/A
N/A
N/A
N/A
Other
N/A
N/A
N/A
N/A
N/A
N/A
Other
N/A
N/A
N/A
N/A
N/A
N/A
$950
$1,013
$871
$975
$929
20. Unit Rent Per Month
21. Total Adjustment
($12)
22. Indicated Rent
23. Correlated Subject Rent
$1,001
$950
$6
$877
($56)
$919
$1,030
$14
$943
($9)
$1,021
If there are any Remarks, check here and add the remarks to the back page
Note: In the adjustments column, enter dollar amounts by which subject property varies from
comparable properties. If subject is better, enter a “Plus” amount and if subject is inferior to the
comparable, enter a “Minus” amount. Use back of page to explain adjustments as needed.
Previous editions are obsolete
($2)
($9)
2
Appraiser’s Signature
Date
July 28, 2010
Reviewer’s Signature
Date
July 28, 2010
form HUD-92273 (7/2003)
OMB Approval No. 2502-0029
(exp. 10/30/2012)
U.S. Department of Housing and Urban Development
Office of Housing
Federal Housing Commissioner
Estimates of Market Rent
by Comparison
Public reporting burden for this collection of information is estimated to average 1 hour per response, including the time for reviewing instructions, searching existing data sources, gathering and maintaining the data needed, and completing and reviewing the collection of information.
This information is required by the Housing Appropriation Act of 9/28/1994. The information is needed to analyze the reasonableness of the Annual Adjustment Factor formula, and will be used where rent levels for a specific unit type, in a Substantial Rehabilitation or New Construction
Contract, exceed the existing FMR rent. The information is considered nonsensitive and does not require special protection. This agency may not collect this information, and you are not required to complete this form, unless it displays a currently valid OMB control number.
1. Unit Type
2. Subject Property (Address)
A. Comparable Property No. 1 (address)
B. Comparable Property No. 2 (address)
C. Comparable Property No. 3 (address)
D. Comparable Property No. 4 (address)
3 Bd - 2 Ba
Stubblebrooke
Lakeland Estates
Preserve @ Colony Lakes
Sandybrooke
Trestles
Southwind
1123
630 Colony Lakes Estates Dr
1000 Farrah Lane
1025 Dulles Avenue
1201 Dulles Avenue
9720 Broadway
Brain Lane
Characteristics
Data
Data
Adjustments
+
Data
Adjustments
+
Data
Adjustments
+
Data
E. Comparable Property No. 5 (address)
Adjustments
+
Adjustments
+
Data
3. Effective Date of Rental
July 1, 2010
July 1, 2010
July 1, 2010
July 1, 2010
July 1, 2010
July 1, 2010
4. Type of Project/Stories
2-story garden style
3-story garden style
3-story garden style
3-story garden style
3-story garden style
3-story garden style
5. Floor of Unit Building
Any
Any
Any
Any
Any
Any
6. Project Occupancy %
91.4%
92%
92%
89%
91%
92%
7. Concessions
Reduced rents
None
None
1 month free
Reduced rents
None
8. Year Built
2007
2008
2004
2002
1999
2003
9. Sq. Ft. Area
1,286
1,388
10. Number of Bedrooms
3
3
($47)
1,219
$32
3
1,375
($44)
3
1,339
($26)
3
1,400
11. Number of Baths
2
2
2
2
2
2
12. Number of Rooms
5
5
5
5
5
5
13. Balc./Terrace/Patio
Yes/Yes
Yes/Yes
Yes/Yes
Yes/Yes
Yes/Yes
Yes/Yes
14. Garage or Carport
Some
Some
Some
Some
Some
Some
15. Equipment
16. Services
a. A/C
Central
Central
Central
Central
Central
Central
b. Range/Oven
Electric
Electric
Electric
Electric
Electric
Electric
c. Refrigerator
Frost Free
Frost Free
Frost Free
Frost Free
Frost Free
Frost Free
d. disposal
Yes
Yes
Yes
Yes
Yes
Yes
e. Microwave
Yes
Yes
Yes
Yes
Yes
Yes
f. Dishwasher
Yes
Yes
Yes
Yes
Yes
Yes
g. Washer / Dryer
Individual
Individual
Individual
Individual
Individual
Individual
h. Carpet/Drapes
Yes/Yes
Yes/Yes
Yes/Yes
Yes/Yes
Yes/Yes
Yes/Yes
i. Pool/Rec. Area
Pool, hot tub
Pool, hot tub
Pool, hot tub
Pool, hot tub
Pool, hot tub
Pool, hot tub
a. Heat/Type
Tenant/Forced air
Tenant/Forced air
Tenant/Forced air
Tenant/Forced air
Tenant/Forced air
Tenant/Forced air
b. Cook/Type
Tenant/Electric
Tenant/Electric
Tenant/Electric
Tenant/Electric
Tenant/Electric
Tenant/Electric
c. Electricity
Individual meters
Individual meters
Individual meters
Individual meters
Individual meters
Individual meters
d. Water Cold/Hot
Tenant/Tenant
Tenant/Tenant
Tenant/Tenant
Tenant/Tenant
Tenant/Tenant
Tenant/Tenant
17. Storage
None
None
None
None
None
None
18. Project Location
Average
Average
Average
Average
Average
Average
19. Other
N/A
N/A
N/A
N/A
N/A
N/A
Other
N/A
N/A
N/A
N/A
N/A
N/A
Other
N/A
N/A
N/A
N/A
N/A
N/A
$1,300
$1,270
$1,150
$1,365
$1,329
20. Unit Rent Per Month
21. Total Adjustment
($47)
22. Indicated Rent
23. Correlated Subject Rent
$1,223
$1,300
$30
$1,180
($44)
$1,321
$1,335
($26)
$1,303
($54)
$1,281
If there are any Remarks, check here and add the remarks to the back page
Note: In the adjustments column, enter dollar amounts by which subject property varies from
comparable properties. If subject is better, enter a “Plus” amount and if subject is inferior to the
comparable, enter a “Minus” amount. Use back of page to explain adjustments as needed.
Previous editions are obsolete
($2)
($54)
3
Appraiser’s Signature
Date
July 28, 2010
Reviewer’s Signature
Date
July 28, 2010
form HUD-92273 (7/2003)
Income Approach
The appraisers have estimated market rent for the subject units as outlined on the preceding HUD forms.
Based on the data presented, it appears that the subject’s current quoted rents are essentially equal to market
rents. The following chart summarizes the estimated potential gross rental income (PGRI) for the subject,
as well as current rents in place for each unit type.
Calculation of Potential Gross Rental Income
Unit Type
1 Bd 1.0 Ba
2 Bd 2.0 Ba
3 Bd 2.0 Ba
Total/Avg
# of
#
Size
Vac
Units
Vac
(SF)
SF
172
128
12
312
16
9
2
27
745
1,067
1,286
898
Actual Rents*
Total
Low
High
Quoted
Avg
$/SF
11,920 $115,596 $700 $775 $741 $0.99
9,603 $111,384 $900 $975 $936 $0.88
2,572 $12,830 $1,200 $1,325 $1,283 $1.00
24,095 $239,810 N/A
N/A
$841 $0.94
Estimated Market Rents
Rent
Monthly
$750
$950
$1,300
$853
$750
$950
$1,300
$853
$/SF
Total/YR
$1.01 $1,548,000
$0.89 $1,459,200
$1.01
$187,200
$0.95 $3,194,400
* Vacant units are not included in averages. Discounted employee units, if any, are included at the quoted street rates.
Based upon the current rent roll, the subject’s actual collected rents average $841/unit, which equates to
$0.94/SF. These current rents are approximately 1.4% below the estimated market rent of $853/unit, or
$0.95/SF. Part of this difference will be considered in a subsequent loss to lease adjustment.
Parking Income
The subject property has 403 surface parking spaces, 48 carports, and 48 garages. Surface parking is free,
while carports and garages command a premium. The following chart summarizes estimated parking income
at the subject property.
Parking Income
Number
Type
x
Monthly Rate
x
12 months
= Income
403
surface spaces
x
$0
x
12 months
=
48
carports
x
$35
x
12 months
= $20,160
48
garages
x
$75
x
12 months
= $43,200
$0
Total Potential Parking Income = $63,360
Less: Vacancy = ($5,069)
= $58,291
HUD Sample Report.wpd
Evergreen Valuation Services
106
Income Approach
Laundry Income
This income category includes the net proceeds to the property owner after splitting the washer/dryer income
with the equipment lessor. The following chart summarizes historic and projected laundry income.
Historic Laundry Income
2008
Year End
2009
Year End
2010
Annualized
Appraiser’s
Estimate
Laundry Income
$0
$0
$0
$0
Per Unit
$0
$0
$0
$0
$0.00
$0.00
$0.00
$0.00
Per Sq. Ft.
Miscellaneous Income
This category include income that may be attributed to deposit forfeitures, non-refundable pet deposits, lost
key charges, vending (excluding washer and dryer income), application fees, late charges, NSF charges, or
any other related charges. Following is a summary of historic and projected miscellaneous income.
Historic Miscellaneous Income
2008
Year End
2009
Year End
2010
Annualized
Appraiser’s
Estimate
$111,390
$172,672
$144,919
$165,000
Per Unit
$357
$553
$464
$529
Per Sq. Ft.
$0.40
$0.62
$0.52
$0.59
Miscellaneous Income
Over the past few years, the subject’s miscellaneous income has ranged from $111,390 ($357/unit) to
$172,672 ($553/unit), with an average of $148,495 ($476/unit). Giving most weight to the subject’s historic
performance, the appraisers have projected other income at $165,000 annually, which equates to $0.59/SF
or $529/unit. It is further noted that the historic figures have been generated at stabilized occupancy levels,
so no further adjustment is necessary for vacancy and collection loss. The subject’s potential gross income
(PGI) is calculated as follows:
HUD Sample Report.wpd
Evergreen Valuation Services
107
Income Approach
Calculation of Potential Gross Income
Potential Gross Rental Income:
Parking, Laundry, & Miscellaneous Income:
Potential Gross Income:
Total
$/SF
$/Unit
$3,194,400
$11.40
$10,238
$223,291
$0.80
$716
$3,417,691
$12.20
$10,954
Vacancy & Collection Loss
L.W. Ellwood, in his Ellwood Tables for Real Estate Appraising and Financing, provides a good example
of what a vacancy rate really means. An excerpt from his discussion in this publication is presented below:
A 7% vacancy allowance, for instance, does not mean that exactly 7% of the rent roll will
be lost every year by reason of vacancies. A property may enjoy virtually full occupancy for
several years, then encounter a period of competition when vacancies amount to 20% or
more. Naturally, the net income will be down in such periods, and so will the reversionary
value of the property. However, this does not invalidate the projection of the analysis so
long as a 7% annual allowance for vacancy is sufficient to cover average occupancy for the
projected term.
According to the current rent roll, the subject is currently 91% occupied. Among the rent comparables
surveyed by the appraisers, current occupancy levels range from 89% to 92%, with an average of 91.2%.
Over the past few years, the subject has consistently maintained occupancy levels in the mid to high 90s, and
the comparables report similar histories. For purposes of this analysis, the appraisers have adopted a
stabilized vacancy and collection loss allowance of 8%, resulting in the following adjustment.
Vacancy and Collection Loss Calculation
8%
x
$3,194,400 (PGRI) =
$255,552
Loss To Lease
Based upon the current rent roll, the subject’s actual collected rents average $841/unit, which equates to
$0.937/SF. These current rents are approximately 1.38% below the estimated market rents. This difference
is known as “loss to lease” and is the result of several factors. First, a prudent property manager will often
sign renewals with good tenants at a modest discount, as this reduces the costs associated with turnover, such
as lost rent during down time and make-ready expenses. Second, since rental rates tend to increase
periodically, older leases are often at slightly lower rents. For example, if typical leases are for 12 months
and rents are increasing at 4% annually, then at any given moment actual rents in place are likely to be 2%
below market.
HUD Sample Report.wpd
Evergreen Valuation Services
108
Income Approach
Considering the rents projected herein, as well as the vacancy/collection allowance employed, a stabilized
loss to lease factor of 1.5% is considered reasonable for the subject, resulting in the following adjustment.
Loss to Lease Calculation
1.5%
x $3,194,400 (PGRI) =
$47,916
HUD does not recognize loss to lease. Therefore, when completing form 92264, the appraisers have
combined loss to lease with the vacancy and collection loss adjustment.
Effective Gross Income
Given the preceding assumptions regarding rental rates, other income, vacancy and collection loss, and loss
to lease factors, the subject’s effective gross income (EGI) is estimated as follows:
Calculation of Effective Gross Income
Potential Gross Rental Income (PGRI)
Less: Vacancy and Collection Loss @ 8%
Less: Loss to Lease @
1.5%
$3,194,400
($255,552)
($47,916)
Plus: Parking, Laundry, & Miscellaneous Income
Effective Gross Income
$223,291
$3,114,223
The following table illustrates the relationship between the subject’s historic EGI and the figure projected in
this analysis.
Historic vs. Projected EGI
Effective Gross Income
% Change
2008
Year End
2009
Year End
2010
Annualized
Appraiser’s
Estimate
$2,250,113
$3,127,997
$2,913,363
$3,114,223
N/A
39.0%
-6.9%
6.9%
The projected EGI of $3,114,223 is 6.9% higher than the most recent reporting period. According to the rent
roll provided, current rents total $239,810 per month, or $2,877,720 annualized. Allowing for other income
of $223,291, an annualized EGI of $3,101,011 is indicated. Thus, the appraisers’ projected EGI is
essentially equal to current annualized levels. It is important to recognize that the annualized EGI has been
negatively impacted by a recent decrease in occupancy levels. Most participants are optimistic about a
HUD Sample Report.wpd
Evergreen Valuation Services
109
Income Approach
rebound, so current income may not be entirely representative of stabilized levels. Overall, the stabilized EGI
projected for the subject appears reasonable and attainable.
Expense Analysis
The appraisers were provided with operating statements for 2008, 2009, and the first four months of 2010.
For comparison purposes, the 2010 figures have been annualized, though the appraisers recognize that not
all expenses are incurred in a straight-line fashion throughout the year. Thus, annualized expenses may
distort some specific categories. Over the reporting period, the subject’s total expenses, exclusive of reserves,
have ranged from $4.03/SF to $4.56/SF, with a mean of $4.26/SF. On a per unit basis, the subject’s expenses
have ranged from $3,620/unit to $4,091/unit, with a mean of $3,827/unit. The operating statements provided
do not necessarily conform to the specific expense categories required for HUD appraisals. In compiling
these figures, the appraisers used there best judgment in allocating expenses among the various subcategories.
The following charts summarize historical operating expenses reported for the subject property, expressed
as annual totals, per square foot, and per unit. HUD form 92274 (Operating Expense Analysis Worksheet)
is presented subsequently.
HUD Sample Report.wpd
Evergreen Valuation Services
110
Income Approach
Historic Operating Statements for Stubblebrooke - Annual Totals
2008
2009
Year End
Year End
Net Rental Revenue
$2,082,223
$2,898,325
Parking Income
$56,500
$57,000
Laundry Income
$0
$0
Miscellaneous Income
$111,390
$172,672
Effective Gross Income
$2,250,113
$3,127,997
1 Advertising
$61,413
$97,579
2 Management
$65,949
$92,697
$29,565
$59,388
3 Other Admin
4 Total Administrative
$156,927
$249,664
5 Elevator
$0
$0
6 Fuel
$0
$0
7 Lighting & Misc. Power
$85,420
$109,257
8 Water
$93,232
$97,096
9 Gas
$0
$0
10 Garbage & Trash Removal
$12,104
$14,457
11 Payroll
$262,544
$221,741
$0
$0
12 Other Operating
13 Total Operating
$453,300
$442,551
14 Decorating
$1,820
$7,543
15 Repairs
$22,293
$59,287
16 Exterminating
$0
$0
17 Insurance
$125,973
$124,433
18 Ground Expenses
$33,116
$35,239
$0
$0
19 Other Maintenance
20 Total Maintenance
$183,202
$226,502
$0
$0
21 Replacement Reserve
22 Total Operating Expenses w/ Reserves
$793,429
$918,717
23 Taxes/Real Estate
$291,240
$298,140
24 Personal Property Tax
$0
$0
25 Employee Payroll Tax
$44,751
$59,614
26 Other
$0
$0
$0
$0
27 Other
28 Total Taxes
$335,991
$357,754
29 Total Expenses
$1,129,420
$1,276,471
Net Operating Income
$1,120,693
$1,851,526
Operating Expense Ratio
50.19%
40.81%
Payroll Taxes
17.05%
26.88%
Management Fee
2.93%
2.96%
HUD Sample Report.wpd
Evergreen Valuation Services
2010
Annualized
$2,709,444
$59,000
$0
$144,919
$2,913,363
$71,673
$103,605
$49,737
$225,015
$0
$0
$105,783
$91,881
$0
$16,992
$232,012
$0
$446,668
$15,093
$41,883
$0
$72,111
$33,825
$0
$162,912
$0
$834,595
$306,107
$0
$35,652
$0
$0
$341,759
$1,176,354
$1,737,009
40.38%
15.37%
3.56%
111
Income Approach
Historic Operating Statements for Stubblebrooke - Per Square Foot
2008
2009
2010
280,148 SF NRA
Year End
Year End
Annualized
Net Rental Revenue
$7.43
$10.35
$9.67
Parking Income
$0.20
$0.20
$0.21
Laundry Income
$0.00
$0.00
$0.00
Miscellaneous Income
$0.40
$0.62
$0.52
Effective Gross Income
$8.03
$11.17
$10.40
1 Advertising
$0.22
$0.35
$0.26
2 Management
$0.24
$0.33
$0.37
$0.11
$0.21
$0.18
3 Other Admin
4 Total Administrative
$0.56
$0.89
$0.80
5 Elevator
6 Fuel
7 Lighting & Misc. Power
8 Water
9 Gas
10 Garbage & Trash Removal
11 Payroll
12 Other Operating
13 Total Operating
$0.00
$0.00
$0.30
$0.33
$0.00
$0.04
$0.94
$0.00
$1.62
$0.00
$0.00
$0.39
$0.35
$0.00
$0.05
$0.79
$0.00
$1.58
$0.00
$0.00
$0.38
$0.33
$0.00
$0.06
$0.83
$0.00
$1.59
14
15
16
17
18
19
20
$0.01
$0.08
$0.00
$0.45
$0.12
$0.00
$0.65
$0.03
$0.21
$0.00
$0.44
$0.13
$0.00
$0.81
$0.05
$0.15
$0.00
$0.26
$0.12
$0.00
$0.58
21 Replacement Reserve
22 Total Operating Expenses w/ Reserves
$0.00
$2.83
$0.00
$3.28
$0.00
$2.98
23
24
25
26
27
28
29
$1.04
$0.00
$0.16
$0.00
$0.00
$1.20
$4.03
$1.06
$0.00
$0.21
$0.00
$0.00
$1.28
$4.56
$1.09
$0.00
$0.13
$0.00
$0.00
$1.22
$4.20
$4.00
$6.61
$6.20
Decorating
Repairs
Exterminating
Insurance
Ground Expenses
Other Maintenance
Total Maintenance
Taxes/Real Estate
Personal Property Tax
Employee Payroll Tax
Other
Other
Total Taxes
Total Expenses
Net Operating Income
HUD Sample Report.wpd
Evergreen Valuation Services
112
Income Approach
Historic Operating Statements for Stubblebrooke - Per Unit
2008
2009
312 Units
Year End
Year End
Net Rental Revenue
$6,674
$9,290
Parking Income
$181
$183
Laundry Income
$0
$0
Miscellaneous Income
$357
$553
Effective Gross Income
$7,212
$10,026
1 Advertising
$197
$313
2 Management
$211
$297
$95
$190
3 Other Admin
4 Total Administrative
$503
$800
5 Elevator
6 Fuel
7 Lighting & Misc. Power
8 Water
9 Gas
10 Garbage & Trash Removal
11 Payroll
12 Other Operating
13 Total Operating
2010
Annualized
$8,684
$189
$0
$464
$9,338
$230
$332
$159
$721
$0
$0
$274
$299
$0
$39
$841
$0
$1,453
$0
$0
$350
$311
$0
$46
$711
$0
$1,418
$0
$0
$339
$294
$0
$54
$744
$0
$1,432
$6
$71
$0
$404
$106
$0
$587
$24
$190
$0
$399
$113
$0
$726
$48
$134
$0
$231
$108
$0
$522
21 Replacement Reserve
22 Total Operating Expenses w/ Reserves
$0
$2,543
$0
$2,945
$0
$2,675
23
24
25
26
27
28
29
$933
$0
$143
$0
$0
$1,077
$3,620
$956
$0
$191
$0
$0
$1,147
$4,091
$981
$0
$114
$0
$0
$1,095
$3,770
$3,592
$5,934
$5,567
14
15
16
17
18
19
20
Decorating
Repairs
Exterminating
Insurance
Ground Expenses
Other Maintenance
Total Maintenance
Taxes/Real Estate
Personal Property Tax
Employee Payroll Tax
Other
Other
Total Taxes
Total Expenses
Net Operating Income
HUD Sample Report.wpd
Evergreen Valuation Services
113
OMB Approval No. 2502-0331
(exp. 3/31/2002)
U.S. Department of Housing
and Urban Development
Office of Housing
Federal Housing Commissioner
Operating Expense Analysis
Worksheet
See Instructions on back and Refer to Handbook
4480.1 for details on completing this form.
Public reporting burden for this collection of information is estimated to average 16 hours per response, including the time for reviewing instructions, searching
existing data sources, gathering and maintaining the data needed, and completing and reviewing the collection of information. This agency may not conduct
or sponsor, and a person is not required to respond to, a collection of information unless that collection displays a valid OMB control number.
This information is being collected under Public Law 101-625 which requires the Department of to implement a system for mortgage insurance for mortgages
insured under Sections 207, 221, 223, 232, or 241 of the National Housing Act. The information will be used by HUD to approve rents, property appraisals,
and mortgage amounts, and to execute a firm commitment. Confidentiality to respondents is ensured if it would result in competitive harm in accord with the
Freedom of Information Act (FOIA) provisions or if it could impact on the ability of the Department’s mission to provide housing units under the various Sections
of the Housing legislation.
Project Name Stubblebrooke
Project Number
City
Date of Appraisal (mm/dd/yyyy)
(Initial Occupancy)
Spotford , Texas
Signature of Processor
N/A
7/1/10
Signature of Reviewer
Date (mm/dd/yyyy)
7/28/10
Project Name
Place One
French Villa
Whispering Pines
Southern Elms
Stubblebrooke
Project Number
N/A
N/A
N/A
N/A
N/A
Location
Houston, TX
Houston, TX
Spotford, TX
Katy, TX
Spotford
Type of Projects &
Number of Stories
2-story garden
2-story garden
3-story garden
3-story garden
2-story garden style
Type of Construction
Conventional
Conventional
Conventional
Conventional
Conventional
No. of Living Units
270
234
270
565
312
Age of Project
2005
2006
2007
2008
2007
Project Unit
Composition
No. of Each Type Unit
BRM
BRM
BRM
1
2
3
BRM
BRM
BRM
1
2
BRM
BRM
BRM
BRM
BRM
1
2
3
BRM
BRM
BRM
1
2
BRM
BRM
Sq. Ft. Each Type Unit
Average Unit Area
1,003
BRM
BRM
BRM
0
1
2
3
0
172
128
12
0
745
1,080
1,013
848
898
Same Tax Rate as Subject Yes
Yes
No/Similar
Yes
N/A
Same Utility Rate *
Yes
No/Similar
Yes
Yes
Effective Date/Updating
1/1/10
Operating Yr./Percentage
Equip. & Services
1,2,3,4,5,6,8,20
Incl. Rent **
0%
0%
1/1/10
1
4
7
Ranges & Refrig.
Dishwasher
Microwave
Items of Expense by
Unit of Comparison***
2
5
8
1/1/09
1,2,3,4,5,6,8,9,20
Equipment Included in Rent
0%
0%
1,067 1,286
N/A
0%
0%
1/1/09
1,2,3,4,5,6,8,20
BRM
Projections
1,2,3,4,5,6,8,9,20
1,2,3,4,5,6,8,20
Services Included in Rent
Carpet & Drapes
Laundry Fac.
Pool/Tennis
Exp.
Adj.
+
-
3
6
9
Ind.
Exp.
Disposal
Air Cond.
Other
Exp
Gas
Elec.
Other Fuel
UpAdj.
dated + Exp.
Ind.
Exp.
9 Heat
13 Heat
18 Heat
Exp
10 Cooking
14 Cooking
19 Hot Water
UpAdj. Ind.
dated + - Exp.
Exp.
11 Hot Water
15 Hot Water
20 Water
Exp
Updated
Exp.
Adj.
+ -
12 A/C
16 A/C
21 Other
Ind.
Exp.
17 Lights
Correlated
Expense
1. Advertising
$167
$167
$214
$214
$167
$167
$100
$100
$158
$49,262
2. Management
$369
$369
$382
$382
$334
$334
$183
$183
$295
$92,049
3. Other
$369
$369
$382
$382
$334
$334
$183
$183
$142
$44,336
$595
$185,647
$0
4. Total Admin.
5. Elevator
$0
$0
$0
$0
$0
$0
$0
$0
$0
6. Fuel
$0
$0
$0
$0
$0
$0
$0
$0
$0
$0
7. Lighting & Misc. Power
$296
$296
$235
$235
$233
$233
$173
$173
$253
$78,820
8. Water
$285
$285
$278
$278
$259
$259
$379
$379
$316
$98,525
$6
$6
$21
$21
$11
$11
$16
$16
$0
$0
$37
$37
$64
$64
$33
$33
$29
$29
$54
$16,749
$885
$885
$927
$927
$885
$885
$869
$869
$805
$251,238
$0
$0
$0
$0
$0
$0
$0
$0
$0
$0
$1,427
$445,332
9. Gas
10. Trash Removal
11. Payroll
12. Other
13. Total Operating
Previous editions are obsolete
form HUD-92274 (5/2003)
Items of Expense by
Unit of Comparison***
Exp.
Adj.
+
-
Ind.
Exp.
Exp
UpAdj.
dated + Exp.
Ind.
Exp.
Exp
UpAdj. Ind.
dated + - Exp.
Exp.
Exp
Updated
Exp.
Adj.
+ -
Ind.
Exp.
Correlated
Expense
14. Decorating
$111
$111
$128
$128
$111
$111
$42
$42
$111
$34,484
15. Repairs
$300
$300
$312
$312
$306
$306
$230
$230
$300
$93,599
16. Exterminating
17. Insurance
18. Ground Expenses
19. Other
$0
$0
$0
$37
$37
$436
$0
$0
$0
$0
$436
$278
$278
$310
$174
$174
$0
$0
$162
$162
$222
$222
$0
$0
$0
$0
$0
$0
$0
$0
$310
$347
$108,377
$127
$127
$114
$35,469
$0
$0
$0
$0
$872
$271,929
$2,894
$902,908
$0
20. Total Maint.
20a. Total Operating Expense Exclusive of Reserve Time and Trend (Sum of lines 4, 13 and 20)
20b. Trend Adjustment (
1.4972%
x 20a)
To (date) (mm/dd/yyyy)
Annual Rate
7/1/10
$13,519
3.0%
21. Replacement Reserve (Per Applicable Formula from Forms HUD-92264 or HUD-92264B)
$250
23. Taxes/Real Estate
24. Personal Prop. Tax
$2,222
$2,222 $2,073
$78,000
$994,427
22. Total Operating Expenses Including Reserve Time and Trend (Sum of Lines 20a, 20b and 21)
$2,073 $1,667
$1,667 $1,444
$1,444
$1,379
$430,258
$22
$22
$30
$30
$30
$30
$27
$27
$1
$391
$170
$170
$207
$207
$174
$174
$193
$193
$161
$50,248
26. Other
$0
$0
$0
$0
$0
$0
$0
$0
$0
$0
27. Other
$0
$0
$0
$0
$0
$0
$0
$0
$0
$0
$1,541
$480,897
25. Emp. Payroll Tax
28a. Total Taxes w/o
Trend
28b. Trend Adjustment (
1.4972%
x 28a)
To (date) (mm/dd/yyyy)
7/1/10
Annual Rate
3.0%
$7,200
28. Total Taxes (Including Time and Trend) (Sum of Lines 28a and 28b)
29. Total Expenses (Sum of Lines 22 and 28)
$488,097
$4,752
$1,482,524
* If “NO,” reflect in adjustments.
** Enter appropriate numbers from table for subject and comparables and reflect in adjustments
*** Enter expense items in suitable unit of comparison
(Attach additional pages to Explain Adjustments as Needed)
In the narrative appraisal, the appraisers have estimated most expenses based on historic levels, with some implied increases to reflect
inflationary factors. This HUD form presents expenses as if they were based exclusively on the expense comparables, then a uniform
inflation factor is applied to each line item. Thus, the line items presented in this form do not precisely correspond to the figures
utilized in the narrative report. Instead, each line item is equal to the projection set forth in the narrative, divided by “one plus the
trend adjustment.” Once the trend adjustment is applied on the form, the totals are identical. Furthermore, it is noted that some
individual line items may fall outside the range of the comparables. This is because the appraisers have placed greatest weight on
the subject’s actual historic expenses, which are usually the best indicator of future expenses.
Previous editions are obsolete
form HUD-92274 (5/2003)
Income Approach
Among the comparables presented, total operating expenses range from $0.00/SF to $0.00/SF, with a mean
of $0.00/SF. On a per unit basis, the range is $0/unit to $0/unit, with a mean of $0/unit.
In accordance with HUD appraisal reporting guidelines, the appraisers have utilized the expense categories
stipulated on HUD form 92274 (Operating Expense Analysis Worksheet). It is understood that several
categories will not apply to a given property, but the reader should be aware that each category has been
considered by the appraisers. In the following paragraphs, each expense category is addressed individually.
All estimates assume that the subject is operating at a stabilized occupancy levels.
Administrative Expenses
As defined by HUD, this broad category includes advertising, management fees, and miscellaneous
administrative expenses (telephone, office expenses, postage, professional fees, etc.).
1) Advertising: This item includes advertising and promotion costs and includes commissions paid
to outside leasing agents, locator fees, tenant referral fees, and tenant relations. Over the past few
years, this item has ranged from $0.22/SF ($197/unit) to $0.35/SF ($313/unit), with a mean of
$0.27/SF ($246/unit). Among the expense comparables, advertising expenses range from $0.12/SF
to $0.20/SF, with a mean of $0.16/SF. On a per unit basis, the comparables range from $100/unit
to $214/unit, with a mean of $162/unit. Weighing historic expenses most heavily, the appraisers have
projected advertising expenses at $50,000, which equates to $0.18/SF or $160/unit.
2) Management Fee: Management expenses are typically calculated as a percentage of effective
gross income (EGI). Over the past few years, the subject has reported management fees ranging from
2.93% to 3.56%, with a mean of 3.15%. The appraisers have appraised numerous apartment projects,
and management fees typically range from 3.0% to 5.0%, depending on rent levels and the number
of units. The subject pays a fee of 4.0% to the management company, while the remaining fee is
essentially for asset management, rather than property management. For this analysis, management
expense is projected at 3.00%. Applied to the projected EGI of $3,114,223, the management fee is
calculated at $93,427, which equates to $0.33/SF or $299/unit. Among the expense comparables,
management expenses range from $0.22/SF to $0.37/SF, with a mean of $0.32/SF. On a per unit
basis, the comparables range from $183/unit to $382/unit, with a mean of $317/unit. Overall, the
comparables support the management expense projected for the subject.
3) Other Administrative: This figure typically includes office equipment/supplies, copies, printing,
telephones, professional fees, answering service, and miscellaneous administrative expenses. Over
the past few years, these items have ranged from $0.11/SF ($95/unit) to $0.21/SF ($190/unit), with
a mean of $0.17/SF ($148/unit). Among the expense comparables, administrative expenses range
from $0.16/SF to $0.18/SF, with a mean of $0.17/SF. On a per unit basis, the comparables range
from $148/unit to $185/unit, with a mean of $172/unit. For this analysis, administrative expenses
are projected at $45,000, which equates to $0.16/SF or $144/unit.
HUD Sample Report.wpd
Evergreen Valuation Services
116
Income Approach
4) Total Administrative: Among the expense comparables, total administrative expenses (categories
1-3) range from $0.51/SF to $0.72/SF, with a mean of $0.65/SF. On a per unit basis, the comparables
range from $431/unit to $765/unit, with a mean of $651/unit. Based on the preceding paragraphs, the
subject’s total administrative expenses are projected at $188,427, which equates to $0.67/SF or
$604/unit.
Operating Expenses
As defined by HUD, “operating expenses” include utilities, payroll, trash removal, and elevator expenses.
5) Elevator: The subject has no elevators, so this expense is projected at $0.
6) Fuel: The subject does not utilize heating fuel, so this expense item is projected at $0.
7) Lighting & Miscellaneous Power: The subject units are individually metered for electric, so this
category includes common area electric, as well as unit electric for vacant units. Actual utility
expenses have ranged from $0.30/SF ($274/unit) to $0.39/SF ($350/unit), with a mean of $0.36/SF
($321/unit). Among the expense comparables, electric expenses range from $0.20/SF to $0.30/SF,
with a mean of $0.24/SF. On a per unit basis, the comparables range from $173/unit to $296/unit,
with a mean of $234/unit. Weighing recent expenses most heavily, the appraisers have allocated
$80,000, which equates to $0.29/SF or $256/unit.
8) Water (and Sewer): This expense category has ranged from $0.33/SF ($294/unit) to $0.35/SF
($311/unit), with a mean of $0.34/SF ($302/unit). Among the expense comparables, water and sewer
expenses range from $0.26/SF to $0.45/SF, with a mean of $0.31/SF. On a per unit basis, the
comparables range from $259/unit to $379/unit, with a mean of $300/unit. On a stabilized basis, the
appraisers have allocated $100,000, which equates to $0.36/SF or $321/unit.
9) Natural Gas: Gas expenses have ranged from $0.00/SF ($0/unit) to $0.00/SF ($0/unit), with a
mean of $0.00/SF ($0/unit). Among the expense comparables, natural gas expenses range from
$0.01/SF to $0.02/SF, with a mean of $0.01/SF. On a per unit basis, the comparables range from
$6/unit to $21/unit, with a mean of $13/unit. On a stabilized basis, the appraisers have allocated $0,
which equates to $0.00/SF or $0/unit.
10) Garbage & Trash Removal: In recent years, this item has ranged from $0.04/SF ($39/unit) to
$0.06/SF ($54/unit), with a mean of $0.05/SF ($47/unit). Among the expense comparables, trash
removal expenses range from $0.03/SF to $0.06/SF, with a mean of $0.04/SF. On a per unit basis,
the comparables range from $29/unit to $64/unit, with a mean of $41/unit. For this analysis, the
appraisers have allocated $17,000, which equates to $0.06/SF or $54/unit.
HUD Sample Report.wpd
Evergreen Valuation Services
117
Income Approach
11) Payroll: This category includes salaries, contract labor, and employee apartments (if any).
Payroll taxes and employee benefits are addressed later. In recent years, the subject’s payroll
expenses have ranged from $0.79/SF ($711/unit) to $0.94/SF ($841/unit), with a mean of $0.85/SF
($765/unit). Among the expense comparables, payroll expenses range from $0.86/SF to $1.03/SF,
with a mean of $0.91/SF. On a per unit basis, the comparables range from $869/unit to $927/unit,
with a mean of $892/unit. As a rule of thumb, a property should have one management person and
one maintenance person for every 100-120 units. Thus, the subject should have one full-time
manager and a part-time leasing assistant. Assuming respective salaries of $28,000 and $10,000,
total management salaries would be $38,000. Considering the age of the property, the appraisers
have assumed two full-time maintenance people, who should be able to handle all maintenance
functions, including most landscaping duties. Assuming respective salaries of $28,000 and $22,000,
total maintenance salaries are estimated at $50,000. Allowing for bonuses and/or occasional
temporary help, the appraisers have projected total payroll expenses at $255,000, which equates to
$0.91/SF or $817/unit. This is lower than annualized expenses, but it is slightly higher than 2001
levels and it is consistent with the expense comparables.
12) Other Operating: This is a miscellaneous expense category, and the appraisers have allocated
$0 for the subject property.
13) Total Operating Expenses: Among the expense comparables, total operating expenses
(categories 5-12 per HUD definition) range from $1.40/SF to $1.73/SF, with a mean of $1.51/SF.
On a per unit basis, the comparables range from $1,422/unit to $1,526/unit, with a mean of
$1,481/unit. Based on the preceding paragraphs, the subject’s total operating expenses are projected
at $452,000, which equates to $1.61/SF or $1,449/unit.
Maintenance Expenses
As defined by HUD, “maintenance” expenses include decorating, repairs, exterminating, insurance, and
grounds expenses.
14) Decorating: This category typically includes painting, carpet cleaning, and miscellaneous items
associated with make ready between tenants. Historically, this expense category has ranged from
$0.01/SF ($6/unit) to $0.05/SF ($48/unit), with a mean of $0.03/SF ($26/unit). Among the expense
comparables, decorating expenses range from $0.05/SF to $0.12/SF, with a mean of $0.10/SF. On
a per unit basis, the comparables range from $42/unit to $128/unit, with a mean of $98/unit. The
appraisers have estimated this expense at $35,000, which equates to $0.12/SF or $112/unit.
HUD Sample Report.wpd
Evergreen Valuation Services
118
Income Approach
15) Repairs: The repairs expense category includes expenses for basic building maintenance,
mechanical repairs, windows, doors, locks, drywall, plumbing, and electrical. Historically, this
category has ranged from $0.08/SF ($71/unit) to $0.21/SF ($190/unit), with a mean of $0.15/SF
($132/unit). Among the expense comparables, maintenance and repair expenses range from $0.27/SF
to $0.30/SF, with a mean of $0.29/SF. On a per unit basis, the comparables range from $230/unit
to $312/unit, with a mean of $287/unit. On a stabilized basis, this expense category is projected at
$95,000, which equates to $0.34/SF or $304/unit.
16) Exterminating: Historically, this category has ranged from $0.000/SF ($0/unit) to $0.000/SF
($0/unit), with a mean of $0.000/SF ($0/unit). Among the expense comparables, exterminating
expenses range from $0.000/SF to $0.000/SF, with a mean of $0.000/SF. On a per unit basis, the
comparables range from $0/unit to $0/unit, with a mean of $0/unit. On a stabilized basis, this
expense category is projected at $0, which equates to $0.00/SF or $0/unit.
17) Insurance: The subject’s insurance expense has ranged from $0.26/SF ($231/unit) to $0.45/SF
($404/unit), with a mean of $0.38/SF ($345/unit). Among the expense comparables, insurance
expenses range from $0.04/SF to $0.40/SF, with a mean of $0.27/SF. On a per unit basis, the
comparables range from $37/unit to $436/unit, with a mean of $265/unit. Since the terrorist attacks
of September 11, 2001, the insurance industry has recently implemented significant increases in
premiums, which are not reflected in the comparables. The subject has recently negotiated a new
insurance policy at a significantly higher annual premium of $23,487. Giving most weight to this
actual expense, insurance expenses are projected at $110,000 annually, which equates to $0.39/SF
or $353/unit.
18) Grounds Expenses: This category includes all landscaping and grounds maintenance.
Historically, the subject's grounds expenses have ranged from $0.12/SF ($106/unit) to $0.13/SF
($113/unit), with a mean of $0.12/SF ($109/unit). Among the expense comparables, grounds
expenses range from $0.15/SF to $0.22/SF, with a mean of $0.17/SF. On a per unit basis, the
comparables range from $127/unit to $222/unit, with a mean of $171/unit. For this analysis, the
appraisers have projected grounds expenses at $36,000, which equates to $0.13/SF or $115/unit.
19) Other Maintenance: This is a miscellaneous expense category, and the appraisers have allocated
$0 for the subject property.
20) Total Maintenance Expenses: Among the expense comparables, total maintenance expenses
(categories 14-20) range from $0.62/SF to $0.96/SF, with a mean of $0.83/SF. On a per unit basis,
the comparables range from $622/unit to $1,038/unit, with a mean of $822/unit. Based on the
preceding paragraphs, the subject’s total maintenance expenses are projected at $276,000, which
equates to $0.99/SF or $885/unit.
HUD Sample Report.wpd
Evergreen Valuation Services
119
Income Approach
21) Reserves for Replacement: The reserves for replacement expense is an account that is set up for
the ultimate replacement of such short-lived items such as HVAC, roofs, parking lot, kitchen
appliances, and floor coverings. Generally this account is an interest-bearing account that is only
utilized when necessary. It is recognized that many property owners do not utilize this procedure,
but merely consider the replacement of such items a capital expenditure, and some of these expenses
may be included in the repairs and maintenance category. HUD specifically requires that reserves
be calculated as 0.6% of the total replacement cost of the structures, excluding site improvements,
profit, fees, and personal property. For rehab properties, the HUD formula is 0.4% of the mortgage
amount. As estimated in the Cost Approach section of this appraisal, the estimated replacement cost
of the subject buildings is $15,028,316. Applying a rate of 0.6%, reserves would be $90,170,which
equates to $0.32/SF or $289/unit.
While HUD specifies a formula for calculating reserves, HUD also requires that the appraiser and
the engineer utilize the exact same inputs on HUD-92264. The engineers at EBI Consultants
concluded a reserves amount at $250/unit. This figure is consistent with market norms, and the
appraisers believe this is a much more realistic figure than that derived by applying the HUD
formula. Employing their broad experience and judgment, the appraisers have adopted the engineer’s
estimate for replacement reserves. Thus, reserves are estimated at $78,000,which equates to
$0.28/SF or $250/unit.
22) Total Operating Expenses With Reserves: Among the expense comparables, total operating
expenses with reserves (categories 1-3, 5-12 , 14-19, and 21) range from $2.84/SF to $3.08/SF, with
a mean of $3.00/SF. On a per unit basis, the comparables range from $2,607/unit to $3,329/unit, with
a mean of $2,953/unit. Based on the preceding paragraphs, the subject’s total operating expenses with
reserves are projected at $994,427, which equates to $3.55/SF or $3,187/unit.
Taxes
The following paragraphs address various types of taxes paid by the subject property.
23) Real Estate Taxes: As detailed in the Real Estate Tax Section of this report, real estate taxes are
estimated at $436,700 ($1.56/SF or $1,400/unit).
24) Personal Property Taxes: As detailed in the Real Estate Tax Section of this report, personal
property taxes are estimated at $397.
25) Payroll Taxes: This expense includes payroll taxes for personnel, as well as worker’s
compensation and insurance benefits. This item is usually estimated as a percentage of salaries. At
the subject property, these items have ranged from 15.4% to 26.9%, with a mean of 19.8%. Among
the expense comparables, payroll taxes range from 19.16% to 22.30%, with a mean of 20.82%. A
typical figure of 20.0% is adopted herein. As detailed in the preceding paragraphs, the subject’s total
salary expenses are projected at $255,000. Total payroll taxes and related benefits are thus estimated
at $51,000, which equates to $0.18/SF or $163/unit.
HUD Sample Report.wpd
Evergreen Valuation Services
120
Income Approach
26) Other Taxes: This category is for miscellaneous taxes, which the appraisers have projected at
$0 annually.
27) Other Taxes: This is another category for miscellaneous taxes, which the appraisers have
projected at $0 annually.
28) Total Taxes: As detailed in the preceding paragraphs, total taxes are estimated at $488,097
($1.74/SF or $1,564/unit). Among the expense comparables, total taxes range from $0.00/SF to
$0.00/SF, with a mean of $0.00/SF. On a per unit basis, the comparables range from $0/unit to
$0/unit, with a mean of $0/unit.
29) Total Expenses: Total operating expenses for the subject property are estimated at $1,482,524
($5.29/SF or $4,752/unit). The expense comparables do not include reserves. For comparison
purposes, it is necessary to adjust the subject’s projected expenses to pre-reserves levels. Excluding
reserves, projected expenses equate to $5.01/SF, or $4,502/unit. Among the expense comparables,
total expenses (net of reserves) range from $0.00/SF to $0.00/SF, with a mean of $0.00/SF. On a per
unit basis, the comparables range from $0/unit to $0/unit, with a mean of $0/unit. All factors
considered, the projections made for the subject are reasonable and well supported.
Net Operating Income
Net operating income (NOI) is the income remaining after all operating expenses have been satisfied,
including reserves. This income provides a return to the owner or a means of servicing debt on the subject
property. Based on the preceding estimates of income and expenses, the resulting stabilized NOI is
$1,631,700, which equates to $5.82/SF or $5,230/unit. The following is a summary tabulation of the proforma operating projections for the subject property.
HUD Sample Report.wpd
Evergreen Valuation Services
121
Income Approach
Stabilized Proforma for Stubblebrooke
280,148 SF
312Units
Potential Gross Rental Income
Parking Income
Laundry Income
Miscellaneous Income
Potential Gross Income
Less: Vacancy/Collection Loss @
8.0%
Less: Loss to Lease @ 1.5%
Amount
$3,194,400
$58,291
$0
$165,000
$3,417,691
($255,552)
($47,916)
$/SF
$11.40
$0.21
$0.00
$0.59
$12.20
($0.91)
($0.17)
$/Unit
$10,238
$187
$0
$529
$10,954
($819)
($154)
Effective Gross Income
$3,114,223
$11.12
$9,981
100.0%
Advertising
Management @ 3.0%
Other Admin
Total Administrative
$50,000
$93,427
$45,000
$188,427
$0.18
$0.33
$0.16
$0.67
$160
$299
$144
$604
1.6%
3.0%
1.4%
6.1%
5 Elevator
6 Fuel
7 Lighting & Misc. Power
8 Water
9 Gas
10 Garbage & Trash Removal
11 Payroll
12 Other Operating
13 Total Operating
$0
$0
$80,000
$100,000
$0
$17,000
$255,000
$0
$452,000
$0.00
$0.00
$0.29
$0.36
$0.00
$0.06
$0.91
$0.00
$1.61
$0
$0
$256
$321
$0
$54
$817
$0
$1,449
0.0%
0.0%
2.6%
3.2%
0.0%
0.5%
8.2%
0.0%
14.5%
14
15
16
17
18
19
20
$35,000
$95,000
$0
$110,000
$36,000
$0
$276,000
$0.12
$0.34
$0.00
$0.39
$0.13
$0.00
$0.99
$112
$304
$0
$353
$115
$0
$885
1.1%
3.1%
0.0%
3.5%
1.2%
0.0%
8.9%
21 Replacement Reserves
22 Total Operating Expenses w/ Reserves
$78,000
$994,427
$0.28
$3.55
$250
$3,187
2.5%
31.9%
23
24
25
26
27
28
$436,700
$397
$51,000
$0
$0
$488,097
$1.56
$0.00
$0.18
$0.00
$0.00
$1.74
$1,400
$1
$163
$0
$0
$1,564
14.0%
0.0%
1.6%
0.0%
0.0%
15.7%
29 Total Expenses
$1,482,524
$5.29
$4,752
47.6%
Net Operating Income
$1,631,700
$5.82
$5,230
52.4%
1
2
3
4
Decorating
Repairs
Exterminating
Insurance
Ground Expenses
Other Maintenance
Total Maintenance
Taxes/Real Estate
Personal Property Tax
Employee Payroll Tax @
Other
Other
Total Taxes
HUD Sample Report.wpd
20.0%
Evergreen Valuation Services
% of EGI
102.6%
1.9%
0.0%
5.3%
109.7%
-8.2%
-1.5%
122
Income Approach
Direct Capitalization
To estimate the appropriate overall rate, four separate methods of deriving overall capitalization rates have
been employed. The methods utilized consist of rates derived from recent sales of similar properties,
Investment Surveys, Band of Investment, and the Debt Coverage Formula.
Overall Rates Derived From Market Sales
The appraisers have extracted capitalization rates from the sales presented in the Sales Comparison Approach.
A summary of the sales is as follows:
Summary of Comparable Improved Sales
#
Date
Units
YOC
Price/Unit
1
4/1/09
264
2006
2
10/21/09
400
3
5/15/10
218
Average
294
Subject
312
Price/SF
OAR
$88,542
$84.44
7.28%
1999
$57,924
$68.90
7.49%
2003
$95,183
$87.00
6.74%
$80,550
$80.11
7.17%
N/A
7.25%
2007
N/A
Among the improved sales presented, extracted OARs range from 6.74% to 7.49%, with an average of 7.17%.
Based on the data presented, the comparables support an overall rate for the subject on the order of 7.25%.
Investment Surveys
The following chart summarizes overall rates (OAR) presented in various noted publications.
Surveyed Overall Rates
Source
Korpacz
RERC
Mean Values
Property Type
Low
High
Avg
National Apartment Market
5.00%
11.00%
7.85%
First Tier Apartments
6.50%
10.00%
8.20%
Second Tier Apartments
7.50%
11.00%
9.00%
Third Tier Apartments
8.00%
13.00%
9.70%
5.00%
13.00%
8.69%
Both Korpacz and RERC suggests decreases around 20 basis points over the past quarter, and the trend
appears to suggest further decreases. Houston has become an increasingly popular investment market,
because properties are available below replacement cost, and rents are believed to have bottomed out.
Consequently, cap rates in Houston are 30 bps lower than most other markets in what RERC defines as the
South region. Considering the specific attributes of the subject property (i.e., size, age, condition, location,
amenities, etc.), the surveys support an OAR for the subject on the order of 7.00% to 7.50%.
HUD Sample Report.wpd
Evergreen Valuation Services
123
Income Approach
Band of Investment
Another method of selecting the rate is through the band of investment. The overall rate may be divided into
the rate that will return cash requirements to a debt investor (lender) and to an equity investor. The net cash
flow used in this model does not account for debt service to the lender as an expense. The anticipated debt
service is accounted for within the overall rate. The premise behind the band of investment method is the
relationship between the loan interest rate and the equity yield rate.
Historically, it was held that the loan interest rate (yield to lender) is the lowest component of the overall yield
rate, expressed as follows: Ym<Yo<Ye, where Ym represents the yield to the mortgage, Yo the overall yield,
and Ye the yield to the equity position. This relationship was true because the overall rate applies to net
operating income or net proceeds which are cash flows that include both debt service plus equity cash flows.
The equity cash flow is the riskier cash flow, the debt service the safest of the three, and the net income is a
sum of the debt and equity cash flows.
For several years, and through 2007, the ready availability of capital resulted in intense competition for
properties, driving down cap rates to levels that were often below the mortgage constant. Equity investors
were still assuming the riskiest position of the real estate investment, yet they were apparently willing to
accept a rate of return that was lower than the lender’s return. This is contrary to decades of accepted
investment theory, but it was demonstrated on a regular basis.
Given the recent turmoil in the capital markets, and the resultant scarcity of financing for commercial real
estate, equity yields, and therefore cap rates, are generally believed to have increased during 2008 and 2009.
However, going into 2010, it appears that cap rates have decreased.
The following assumptions were used to estimate an appropriate overall rate via the band of investment.
Band of Investment Assumptions
Term
30 Years
Mortgage Interest Rate
5.50%
Loan To Value Ratio
70%
Equity Yield Rate
8.00%
Mortgage Constant
6.81%
Band of Investment Calculations
Component
Percentage
Rate
Contribution
Debt-
70%
x
6.81%
=
4.77%
Equity-
30%
x
8.00%
=
2.40%
Indicated OAR
7.17%
HUD Sample Report.wpd
Evergreen Valuation Services
124
Income Approach
Direct Capitalization Conclusions
The following chart summarizes the various rates derived in this analysis:
Summary of Overall Rates
Source
Indicated Rate
Market Sales
7.25%
Published Surveys
7.25%
Band of Investment
7.17%
Mean Rate Derived
7.22%
The mean rate above is 7.22%. Considering the specific attributes of the subject property (size, age, location,
stability, etc.), the appraisers have selected an overall rate of 7.25%. This rate is applied to the previously
estimated NOI of $1,631,700 to arrive at the following value estimate via direct capitalization.
DIRECT CAPITALIZATION SUMMARY
Pro-Forma NOI ÷
$1,631,700 ÷
OAR =
Value
7.25% = $22,506,200
Less: Deferred Maintenance =
$0
Net Value Indication = $22,506,200
ROUNDED = $22,500,000
HUD Sample Report.wpd
Evergreen Valuation Services
125
Final Reconciliation
The Final Reconciliation is the process whereby the final value estimate is derived from the various
indications of value. The procedure evaluates the quantity and quality of available data and draws a
conclusion based on the most applicable indicators. The appraisers have considered all three approaches to
value and have arrived at the following conclusions:
Valuation Technique
As Is
Market Value
Prospective Value
Upon Stabilization
Cost Approach
$22,700,000
N/A
Insurable Value
N/A
N/A
Sales Comparison Approach
$23,500,000
N/A
Income Approach
$22,500,000
N/A
In the Direct Sales Comparison Approach, sales of comparable properties were utilized to derive a value
indication for the subject property. In determining value indications via this approach, comparisons were
made based upon the sales’ physical characteristics relative to the subject’s and the Effective Gross Income
Multiplier. The resulting range from the three methods was fairly narrow, and the appraisers are confident
that the value indications are well supported.
In the Income Approach, direct capitalization was utilized in deriving a value for the subject property.
Income and expense projections are consistent with the subject’s historic performance and are further
supported by ample market data. Overall, the Income Approach indication of $22,500,000 is considered a
reliable indicator of market value for the subject property.
In deriving the following value estimate(s) for the subject property, the Income Approach and Sales
Comparison Approach are weighted nearly equally.
As Is
Prospective Value
Market Value
Upon Stabilization
Final Value Estimate
$23,000,000
N/A
Effective Date
July 1, 2010
N/A
Marketing Time and Exposure Time
An estimate of exposure time is required by USPAP for market value appraisal assignments (Standards Rules
1-2(c)(iv) and 7-2(c)(iv)). An estimate of marketing time is not mandated by USPAP, but it is often required
by the client and so becomes an assignment condition in those assignments. The following definitions are
taken from USPAP (AO-7):
HUD Sample Report.wpd
Evergreen Valuation Services
126
Final Reconciliation
Exposure Time: The estimated length of time the property interest being appraised would
have been offered on the market prior to the hypothetical consummation of a sale at market
value on the effective date of the appraisal; a retrospective opinion based on an analysis of
past events assuming a competitive and open market.”
Marketing Time: The amount of time it might take to sell a real or personal property
interest at the concluded market value level during the period immediately after the effective
date of an appraisal.”
The only distinction between exposure time and marketing time is that exposure time occurs before the
effective date of the appraisal, whereas marketing time occurs after the effective date. While USPAP requires
an estimate of exposure time (and sometimes marketing time), this is probably the least precise and most
subjective aspect of the entire appraisal process. There are countless factors that can impact marketing or
exposure time:
1) Is the property priced reasonably? If a property is marketed at an unreasonably high asking price, potential
investors may be discouraged from even submitting an offer. Conversely, if a $2 million property is listed
at $1 million, it could sell almost instantly.
2) Is the listing broker appropriately qualified with respect to this property type or specific market? A
particular broker may have extensive experience and success selling apartments in Houston, yet she could
be completely unqualified to market an apartment building in Manhattan, or even a shopping center in
Houston. The appraisers have seen several instances where a property is listed with an incompetent broker
simply because of previous successful business transactions or even personal relationships.
3) Is financing available for this particular property type? Following the financial meltdown of 2007 and
through the subsequent (ongoing) recession, financing for office buildings, retail, industrial, and hotels
became virtually unattainable. By contrast, financing for apartments remained available at relatively
favorable terms through Fannie Mae, Freddie Mac, and HUD. If financing is not available for a particular
property type, then the pool of investors is limited to cash buyers, which are scarce in any market. Thus, an
estimate of a reasonable marketing time may necessitate an analysis of the capital markets and a prediction
as to when financing may become available for a particular property type.
4) How many total investors are seeking this property type? When there are just a few investors buying
properties, they tend to concentrate their efforts on the better properties in major metro areas. When there
are a great number of investors, they tend to broaden their search to include secondary or even tertiary
markets. When there are few investors, a property in Dallas may sell within 6 months, while a property in
Enid, Oklahoma may languish on the market for 2 years. When the market is hot, both properties may sell
in less than six months.
While it is possible to identify several tangible factors that may impact marketing time and exposure time,
it is difficult to translate these factors into a specific time period. The problem is further exacerbated by the
numerous intangible factors that impact investor decisions. An investor’s personal connection to a specific
locale may cause them to choose one property over another. For example, an investor from Miami who
enjoys skiing may select a property in Colorado over an equally desirable asset in Kansas City. Similarly,
a Dallas investor with family ties to Utah may choose a Salt Lake City property over a similar asset in
Phoenix, simply because it gives her the chance to visit her family more often. Notwithstanding all the
HUD Sample Report.wpd
Evergreen Valuation Services
127
Final Reconciliation
difficulties in estimating exposure time and marketing time, the appraisers are required to render opinions in
the form of a specific time frame, or a range of time.
RERC & Korpacz both conduct quarterly surveys of investor requirements, and one of the components is an
estimate of marketing time. The latest results are below:
Marketing Time In Months
Publication & Date
Property Type
Range
Average
Korpacz Q1 2010
Apartments
1 - 18
8.06
Korpacz Q4 2009
Apartments
1 - 18
8.86
RERC Q1 2010
Apartments
6.20
RERC Q4 2009
Apartments
6.10
Based on the published data, as well as ongoing conversations with market participants and familiarity with
industry trends, the appraisers have estimated exposure time and marketing time for the subject as follows:
Exposure Time:
Marketing Time:
HUD Sample Report.wpd
6-9 months
6-9 months
Evergreen Valuation Services
128
Certification Of Value
Per Standard Rule 2-3, we certify that, to the best of our knowledge and belief:
*
The statements of fact contained in this report are true and correct.
*
The reported analyses, opinions, and conclusions are limited only by the reported assumptions and
limiting conditions, and are our personal, unbiased professional analysis, opinions, and conclusions.
*
We have no present or prospective interest in the property that is the subject of this report, and we
have no personal interest or bias with respect to the parties involved.
*
Our compensation is not contingent on an action or event resulting from the analyses, opinions, or
conclusions in, or the use of, this report.
*
Our analyses, opinions, and conclusions were developed, and this report has been prepared, in
conformity with the Uniform Standards of Professional Appraisal Practice.
*
Andrew Charles McCloskey made a personal inspection of the property that is the subject of this
report. John Rocco Pallante did not make personal inspections of the subject property.
*
This appraisal report has been made in conformity with, and is subject to, the requirements of the
Code of Professional Ethics and Standards of Professional Conduct of the Appraisal Institute and
the Appraisal Foundation.
*
No pertinent information has knowingly been withheld. No single item of information was
completely relied upon to the exclusion of the other information and all data was analyzed within
the framework of our judgment, knowledge, and experience.
*
This appraisal was not based on a requested minimum value, or the approval of a loan.
*
This appraisal report is subject to peer review by duly authorized members of the Appraisal Institute.
HUD Sample Report.wpd
Evergreen Valuation Services
129
Certification Of Value
*
As of the date of appraisal, Andrew Charles McCloskey is certified by the State of Texas as a
General Real Estate Appraiser. John Rocco Pallante is certified by the State of Colorado as a
General Real Estate Appraiser.
*
No other individual has provided professional assistance to the undersigned.
*
The appraisers have not provided any services regarding the subject property over the past three
years.
*
Based on our investigation and analyses, we have derived the following value estimate(s) for the
subject’s fee simple estate:
As Is
Prospective Value
Market Value
Upon Stabilization
Final Value Estimate
$23,000,000
N/A
Effective Date
July 1, 2010
N/A
Evergreen Valuation Services
_____________________________________
___________________________________
Andrew C. McCloskey
Inspecting Appraiser
State Certified Appraiser
Texas
TX-1338629-G
John Rocco Pallante
Review Appraiser
State Certified Appraiser
Colorado
CG40012104
HUD Sample Report.wpd
Evergreen Valuation Services
130
Addendum A
HUD Form 92264
OMB Approval No. 2502-0029
(exp. 10/30/2012)
U.S. Department of Housing and Urban Development
Office of Housing
Federal Housing Commissioner
Multifamily Summary
Appraisal Report
This form is in compliance with the requirements of the Uniform Standards of Professional Appraisal Practice for written reports, except where the Jurisdictional
Exception is invoked to allow for minor deviations, as noted throughout.
Additional technical direction is contained in the HUD Handbooks referenced in the lower right corner.
SAMA
Application Processing Stage
Feasibility (Rehab)
X Fee Simple
Property Rights Appraised
X Firm
Leasehold
Project Name
Project Number
Stubblebrooke
N/A
Stubblebrooke
Purpose. This appraisal evaluates the subject property as security for a long-term insured mortgage. Included in the appraisal (consultation for Section 221) are the
analyses of market need, location, earning capacity, expenses, taxes, and warranted cost of the property.
Scope. The Appraiser has developed, and hereunder reports, conclusions with respect to: feasibility; suitability of improvements; extent, quality, and duration of earning
capacity; the value of real estate proposed or existing as security for a long-term mortgage; and several other factors which have a bearing on the economic soundness
of the subject property.
A. Location and Description of Property
1. Street Nos.
2. Street
3. Municipality
1123
Brain Lane
4a. Census Tract No.
86
7. Type of Project
11. Number of Units
Proposed
Revenue
Non-Rev.
312
0
X Existing
8. No. Stories
Fruit Bend
Texas
77223
9b. Basement Floor
X Slab on Grade
3
Town House
12. No. of
Bldgs.
6. State/Zip Code
9a. Foundation
Row House
Semi-Detached
5. County
See Narrative
2-5 Sty. Elev.
X Walkup
Detached
4c. Legal Desc. (Optional)
N/A
Highrise
Elevator(s)_____
10.
Tulsa
4b. Placement Code
Partial Basement
Full Basement
Structural Slab
Crawl Space
Slab on Grade
13a. List Accessory Bldgs. and Area
The leasing office is adjacent to the pool area and measures approximately 4,795 SF.
16
13b. List Recreation Facilities and Area
Project amenities include a clubhouse, resort-style swimming pool, spa, patio with two fireplaces adjacent to the pool, fitness center, theater room, game room, sand
volleyball, playground, jogging trail, and car wash.
13c. Neighborhood Description
Location
Built Up
Urban
X Suburban
Fully Developed X Over 75%
Rural
25% to 75%
Present Land Use
50
% 1 Family
6
% 2 to 4 Family
Under 25%
15
% Multifamily
2
% Condo/Coop
Growth Rate
Rapid
X Steady
Slow
15
% Commercial
2
% Industrial
Property Values
Increasing
X Stable
Declining
10
% Vacant
Demand/Supply
Shortage
X In Balance
Oversupply
Rent Controls
Yes
X No
Likely
Change In Use
X Not Likely
Likely
From N/A
Predominant
Occupancy
Owner X Tenant
Taking Place
to N/A
6
% Vacant
Description of Neighborhood. (Note: Race and racial composition of the neighborhood are not appraisal factors.) Describe the boundaries of the neighborhood and
those factors, favorable or unfavorable, that affect marketability, including neighborhood stability, appeal, property conditions, vacancies, rent control, etc.
15
Site Information
14. Dimensions
N/A
15a. Zoning
ft. by
N/A
ft. or
15b. Zoning Compliance
512,788
X
sq. ft
Legal
15c. Highest and Best Use As Improved
X
None
Illegal
Present Use
Legal nonconforming (Grandfathered use)
Proposed Use
No Zoning
Other use (explain)
15d. Intended M/F Use (summarize: e.g., Market Rent: Hi-Med.-Lo-End; Rent Subsidized; Rent Restricted with or without Subsidy; Applicable Percentages)
The subject property is a market-rent apartment project near the middle of the rental range in its market.
Building Information
16a. Yr. Built
2007
16b.
Manufactured Housing
Modules
X Conventionally Built
Components
17a. Structural System 17b. Floor System
Wood framed
Page 1 of 8
Previous editions are obsolete
Vinyl/Ceramic/Car
pet
17c. Exterior Finish
Brick/Siding
18. Heating-A/C System
Forced air
form HUD-92264 (8/95)
ref Handbooks 4465.1
B. Additional Information Concerning Land or Property
19. Date Acquired
20. Purchase Price
December 15, 1999
21. Additional Costs
Paid or Accrued
$3,225,000
$0
24a. Relationship (Business, Personal, or Other)
Sewers
N/A
23b. Outstanding Balance
$3,225,000
N/A
X Yes
No If “Yes,” explain:
According to Fruit Bend Central Appraisal District records, the subject is currently owned by Stubblebrooke
Partners, LP. The vacant site was acquired from Stubblebrooke Phase II LP on June 27, 2006 at an undisclosed
price. The current owner subsequently developed the existing apartment project. The appraisers are not aware
of any offers or attempts to market the property for sale during the past three years.
None known
Public
X
23a. Total Cost
24b. Has the Subject Property been sold in the past 3 years
Between Seller and Buyer
25. Utilities
Water
22. If Leasehold,
Annual Ground Rent
Community
Distance From
To site
26. Unusual Site Features
Cuts
Fills
To site
X
High Water Table
Rock Formations
Erosion
Poor Drainage
Retaining Walls
Off Site Improvements
None
Other (Specify)
C. Estimate of Income (Attach forms HUD-92273, 92264-T, as applicable)
27. No. of Each
Family Type Unit
Rentable Living Area
(Sq. Ft.)
Unit Rent
per Mo. ($)
Composition of Units
Total Monthly Rent
For Unit Type ($)
(a)
172
745
1
Bedroom(s)
1.0
Bath(s)
$750
$129,000
(b)
128
1,067
2
Bedroom(s)
2.0
Bath(s)
$950
$121,600
(c)
12
1,286
3
Bedroom(s)
2.0
Bath(s)
$1,300
$15,600
(d)
(e)
(f)
(g)
(h)
(i)
(j)
(k)
(l)
(m)
(n)
$266,200
28. Total Estimated Rentals for All Family Units
29. Number of Parking
Spaces
Offstreet Parking and Other Non-Commercial Ancillary Income (Not Included in Unit Rent)
Attended
X Self Park
Open Spaces
403
@
$0.00
per month =
$0
Covered Spaces
96
@
$50.60
per month =
$4,858
Laundry
499
Other
Total Spaces
499
312
Living Units @
$0.00
Miscellaneous income
Other
per month =
$0
per month =
$15,193
per month =
$20,051
Total Monthly Ancillary Income
30. Commercial Income (Attach Documentation)
Area-Ground Level
N/A
sq. ft. @
N/A
per sq. ft./month =
N/A
Other Levels
N/A
sq. ft. @
N/A
per sq. ft./month =
N/A
=
Total Monthly
Commercial Income
$0
$286,251
31. Total Estimated Monthly Gross Income at 100 Percent Occupancy
$3,435,012
32. Total Annual Rent (Item 31 x 12 months)
33. Gross Floor Area
285,255 Sq. Ft.
34. Net Rentable Residential Area
280,148
35. Net Rentable Commercial Area
Sq. Ft.
0
Sq. Ft
36. Non-Revenue Producing Space
Type of Employee
No. Rms.
Composition of Unit
Location of Unit in Project
36a. Personal Benefit Expense (PBE) (May produce additional revenue and expenses to be considered above and below.)
Tenant Employee-Paid Utilities
Type(s)
Employee tenants pay standard utilities
Monthly Cost
$0
Landlord Employer-Paid Utilities
Type(s)
Landlord pays no extraordinary utilities for employee tenants
Monthly Cost
$0
Page 2 of 8
Previous editions are obsolete
form HUD-92264 (8/95)
ref Handbooks 4465.1
D. Amenities and Services Included in Rent (Check and circle appropriate items; fill-in number where Indicated)
37a. Unit Amenities
X Ranges
37b. Project Amenities
(electric)
X Disposal/Compactor
Guest room(s) No.
X Refrig. (Gas or Elec.)
X Air Conditioning (central or window)
X Micro Wave
X Dishwasher
X Carpet
X Window treatment (blinds, drapes, shades)
X Balcony/Patio
Sauna/Steam room(s) No.
Tennis Court(s) No.
Fireplace(s) No. 0
1
X Swimming Pool(s) No.
1
Racquet Ball Courts No.
0
X Picnic/Play areas No.
1
Laundry Facilities (coin)
0
X Jacuzzi(s)/Community Whirlpool(s) No.
Security System (describe)
1
X Other (theater, game room, volleyball, jogging trail
(granite counters, computer niches)
37c. Unit Rating
Good
Condition of Improvement
Aver.
Fair
Poor
37d. Project Rating
X
Good
Aver.
Location
Fair
Poor
X
Room Sizes and Layout
X
General Appearance
X
Adequacy of Closets and Storage
X
Amenities & Rec. Facilities
X
Kitchen Equip., Cabinets, Workspace
X
Density (units per acre)
X
Plumbing - Adequacy and Condition
X
Unit Mix
X
Electrical - Adequacy and Condition
X
Quality of Construction (matl. & finish)
X
Soundproofing - Adequacy and Condition
X
Condition of Exterior
X
Insulation - Adequacy and Condition
X
Condition of Interior
X
Overall Livability
X
Appeal to Market
X
Appeal and Marketability
X
Soundproofing - Vertical
X
Soundproofing - Horizontal
X
38. Services
39. Special Assessments
Gas:
Heat
X Hot Water
Cooking
Air Conditioning
Elec:
X Heat
Hot Water
X Cooking
X Air Conditioning
Heat
Hot Water
Water
Other:
0
Project Security System(s) (describe)
Upper level vaulted ceiling/Skylight(s) No.
Other
0
X Community Room(s) No.
X Exercise room(s) No. 1
X Laundry hookups (in units)
X Washer/Dryer (in units)
0
a.
X
Lights/etc.
Other (specify)
Prepayable
Non-Prepayable
b.
Principal Balance
N/A
c.
Annual Payment
N/A
d.
Remaining Term
N/A
Years
E. Estimate of Annual Expenses
Administrative
Maintenance
1. Advertising
$50,000
14. Decorating
$35,000
2. Management
$93,427
15. Repairs
$95,000
3. Other
$45,000
16. Exterminating
4. Total Administrative
$188,427
$0
17. Insurance
$110,000
18. Ground Expense
19. Other
Operating
$36,000
$0
5. Elevator Main. Exp.
$0
20. Total Maintenance
6. Fuel (Heating and Domestic Hot water)
$0
21. Replacement Reserve (0.006 x total structures Line G41)
7. Lighting & Misc. Power
8. Water
9. Gas
10. Garbage & Trash Removal
11. Payroll
12. Other
13. Total Operating
$80,000
$276,000
or (0.004 x MTG. For Rehab)
$100,000
$0
$78,000
22. Total Operating Expenses
$994,427
Taxes
$17,000
$255,000
23. Real Estate: Est. Assessed Value
$0
at
$452,000
$19.8500
24. Personal Prop. Est. Assessed Value
at
$19.8500
$22,000,000
per $1000
$436,700
$20,000
per $1000
$397
25. Empl. Payroll Tax
$51,000
26. Other
$0
27. Other
$0
28. Total Taxes
$488,097
29. Total Expenses (Attach form HUD-92274, as necessary)
Page 3 of 8
Previous editions are obsolete
$1,482,524
form HUD-92264 (8/95)
ref Handbooks 4465.1
F. Income Computations
30a. Estimated Residential Project Income (Line C28 x 12)
$3,194,400
b. Estimated Ancillary Project Income (Line C29 x 12)
$240,612
c.
d.
c. Residential and Ancillary Occupancy Percentage *
ì
90.5%
d. Effective Gross Residential and Ancillary Income
(Line 30c. X (Line 30a. Plus Line 30b.)
$3,114,223
e. Total Residential & Ancillary Project Exp (Line E29)
$1,482,524
31. Net Residential and Ancillary Income to Project
(Line 30d. Minus Line 30e.)
G. Estimated Replacement Cost
36a. Unusual Land Improvements
b. Other Land Improvements
c. Total Land Improvements
Total Project Net Income (Line 31 plus Line 33)
35a
Residential and Ancillary Project Expense Ratio
(Line E29 divided by Line 30d.)
80%
$13,893,615
$165,581
$0
$0
$14,059,196
Fees
Builder’s Gen. Overhead at 2.0%
Builder’s Profit
at 5.0%
Arch. Fee-Design
at 2.0%
Arch. Fee-Supvr.
at 1.0%
Bond Premium
Other Fees
Total Fees
Total All Improvements
(Lines 36c. Plus 41 plus 42 plus 49)
51. Cost Per Gross Sq. Ft.
52. Estimated Construction Time (Months)
47.6%
Commercial Expense Ratio
(Line 32d. Divided by 32c.)
Carrying Charges & Financing
53. Interest:
N/A Mos. at
on
N/A
$784,273
43.
44.
45.
46.
47.
48.
49.
50.
$0
$1,631,700
N/A
* Vacancy and collection loss rates and corresponding residential and commercial
occupancy percentages are analyzed through market data, but subject by
Jurisdictional Exception to overall HUD underwriting mandates
N/A
$784,273
Structures
37. Main Buildings
38. Accessory Buildings
39. Garages
40. All Other Buildings
41. Total Structures
42. General Requirements
$0
34.
b.
Commercial Occupancy * (80% Maximum)
(See Instructions)
ì Includes loss to lease
$0
Total Commercial Project Expenses
(From Attached Analysis)
Net Commercial Income to Project
(Line 32c. Minus Line 32d.)
35b.
$0
(Line 32a. X Line 32b.)
33.
$1,631,700
32a. Estimated Commercial Income (Line C30 x 12)
Effective gross Commercial Income
$296,869
$742,173
$296,869
$148,435
N/A
N/A
$1,484,347
$16,327,816
$57.24
18
Note 1: Jurisdictional Exception: In HUD programs, land, and/or existing
improvements are not valued for their “highest and best use,” but instead, for their
intended multifamily use (See Section J analysis below.)(Exception: Title II or VI
Preservation). Offsite improvements are assumed completed in new construction
land valuations (See Line M17 for estimated cost.) Unusual costs of site
preparation are deducted from the “Value of the Site Fully Improved” to determine
Warranted Price of Land Fully Improved.”
N/A
N/A
54.
55.
56.
57.
58.
59.
60.
61.
Taxes
Insurance
FHA Mtg. Ins. Prem.
FHA Exam. Fee
FHA Inspec. Fee
Financing Fee
AMPO (N. P. only)
FNMA/GNMA Fee
N/A
N/A
N/A
N/A
N/A
N/A
N/A
N/A
62.
63.
Title & Recording
Total Carrying Charges & Financing @
6.0%
Legal, Organization & Audit Fee
64. Legal @ 2.0%
$326,556
65. Organization @ 1.0%
$163,278
66. Cost Certification Audit Fee @ 1.0%
$163,278
67. Total Legal, Organization & Audit (64+65+66)
68. Builder and Sponsor Profit & Risk @ 13.5%
69. Consultant Fee (N. P. only)
70. Supplemental Management Fund (Depreciation)
71. Contingency Reserve (Sec. 202 or Rehab Only)
72. Total Est. Development Cost (Excl. Of Land or
Off-site Cost) (50 plus 63 plus 67 thru 71)
73a. Warranted Price of Land J-14(3)(New Constr)
512,788 sq. ft. @
$2,310,000
$4.50 /sq. ft.
73b. As Is Property Value (Rehab only)
73c. Off-Site (if needed, Rehab only)
74.
N/A
N/A
Total Estimated Replacement Cost of Project
(72 plus 73a or 73b and 73c)
$979,669
$653,113
$2,424,681
N/A
$0
N/A
$20,385,278
$2,310,000
* see note 1
* see note 2
* see note 1
$22,695,278
H. Remarks
(Note 2: For Rehab only: Estimated Value of land without Improvements
N/A
Estimated Value of land and improvements “As Is” by Residual Method, i.e., After Rehabilitation Correlated Value minus line G72 Cost or Rehabilitation Improvements
equals
N/A
; line G73b is the lesser of this residual amount, and the amount estimated by Supplemental form HUD-92264 “As Is”.)
The figure on Line 70 reflects total depreciation from all sources, as detailed in the narrative report.
I. Estimate of Operating Deficit
Periods
1. 1st ( N/A ) Mos
Gross Income
N/A
Occup. %
N/A
Effec. Gross
N/A
Expenses
N/A
Net Income
N/A
Debt Serv.
Reqmt.
N/A
Deficit
N/A
2. 2nd ( N/A ) Mos
N/A
N/A
N/A
N/A
N/A
N/A
N/A
3. Total Operating Deficit
N/A
Page 4 of 8
Previous editions are obsolete
form HUD-92264 (8/95)
ref Handbooks 4465.1
J. Project Site Analysis and Appraisal (See Chapter 2, Handbook 4465.1)
1. Is Location and Neighborhood acceptable?
X
Yes
No
2. Is Site adequate in Size for proposed Project?
X
Yes
No
3. Is Site Zoning permissive for intended use?
X
Yes
No
4. Are Utilities available now to serve the Site?
X
Yes
No
5. Is there a Market at this location for the Facility at the proposed Rents?
X
Yes
No
6.
7.
X Site acceptable for type of Project proposed under Section
223f
. (If checked, acceptance subject to qualification listed at bottom of
Site not acceptable (see reasons listed at bottom of page 6.)
Date of Inspection
7/1/10
Note: The Effective Date of all land valuations is the date of inspection.
Location of Project
8. Value Fully Improved
Size of Subject Site
1123
Brain Lane
Spotford , Texas
77223
512,788 Sq. Ft.
Comparable Sales
Address No. 1
Comparable Sales
Address No. 2
Comparable Sales
Address No. 3
Comparable Sales
Address No. 4
Comparable Sales
Address No. 5
8200 E. 77th Street S.
8400 E. 134th St. S.
14000 N. 106th Ave E.
SEC E. 81st & Hwy 169
7877 S. Memorial
Date of Sale
June 13, 2009
November 28, 2009
October 20, 2009
March 18, 2009
February 9, 2009
Sales Price
$1,100,000
$800,000
$2,100,000
$4,052,486
$2,340,000
Size per Sq. Ft.
217,800
174,676
544,500
622,037
382,892
Price per Sq. Ft.
$5.05
$4.58
$3.86
$6.51
$6.11
Adjustments (%)
Time
0%
0%
0%
0%
0%
-10%
0%
0%
-20%
-20%
Zoning
0%
0%
0%
0%
0%
Plottage
0%
0%
0%
0%
0%
Demolition
0%
0%
0%
0%
0%
Pilling, Etc.
0%
0%
0%
0%
0%
Other
0%
0%
0%
0%
0%
Total Adjustment Factor
-10%
0%
0%
-20%
-20%
Adjusted Sq. Ft. Price
$4.55
$4.58
$3.86
$5.21
$4.89
$2,330,856
$2,348,529
$1,977,696
$2,672,598
$2,507,074
Value “As Is” No. 1
Value “As Is” No. 2
Value “As Is” No. 3
Date of Sale
N/A
N/A
N/A
Sales Price
N/A
N/A
N/A
Size per Sq. Ft.
N/A
N/A
N/A
Price per Sq. Ft.
N/A
N/A
N/A
Time
N/A
N/A
N/A
Location
N/A
N/A
N/A
Zoning
N/A
N/A
N/A
Plottage
N/A
N/A
N/A
Demolition
N/A
N/A
N/A
Pilling, Etc.
N/A
N/A
N/A
Other
N/A
N/A
N/A
Total Adjustment Factor
N/A
N/A
N/A
Adjusted Sq. Ft. Price
Indicated Value by
Comparison
N/A
N/A
N/A
N/A
N/A
N/A
Location
Indicated Value by
Comparison
9. Value of Site Fully Improved
10.
$2,310,000
Adjustments (%)
11. Value of Site “As Is” by Comparison
Page 5 of 8
Previous editions are obsolete
N/A
form HUD-92264 (8/95)
ref Handbooks 4465.1
12. Acquisition Cost (Last Arms-Length Transaction)
Buyer
Stubblebrooke Partners LP
Address
N/A
Seller
Stubblebrooke Phase II LP
Address
N/A
Date
June 27, 2006
Price
N/A
Source
Tax records
13. Other Costs
(1) Legal Fees and Zoning Costs
N/A
(2) Recording and Title Fees
N/A
(3) Interest on Investment
N/A
(4) Other
N/A
(5) Acquisition Cost (From 12 above)
N/A
(6) Total Cost to Sponsor
N/A
14. Value of Land and Cost Certification
(1) Fair Market Value of land fully improved (from 9 above)
$2,310,000
(2) Deduct unusual items fro Section G, item 36a
N/A
(3) Warranted price of land fully improved (Replacement Cost items excluded) (enter G-73)
N/A
For Cost Certification Purposes
(3a) Deduct cost of demol.
N/A
and required off-sites
N/A
To be paid by Mtgor. or by special assessments
N/A
(4) Estimate of “As Is” by subtraction from improved value
N/A
(5) Estimate of “As Is” by direct comparison with similar unimproved sites (from 11 above)
N/A
(6) “As Is” base on acquisition cost to sponsor (from 13 above)
N/A
(7) Commissioner’s estimated value of land “As Is” (the lesser of [4] or [5] above)*
N/A
* Where land is purchased from LPA or other Governmental authority for specific reuse, use the lesser of 4, 5, or 6.
K. Income Approach to Value
(1) Estimated Remaining Economic Life
49 Years
(2) Capitalization Rate Determined BY (See Chapter 7, Handbook 4465.1)
X
Overall Rate From Comparable Projects
7.25%
X
Rate From Band of Investment
7.17%
Cash Flow to Equity
(3) Rate Selected
7.25%
(4) Net Income (Line F34)
$1,631,700
(5) Capitalized Value (Line 4 divided by Line 3)
$22,500,000
(6) Value of Lease Fee (See Chapter 3, Handbook 4465.1) Ground Rent
divided by Cap. Rate
N/A
equals Value of Leased Fee
N/A
N/A
Remarks: (See item 6 and 7 on page 5)
Page 6 of 8
Previous editions are obsolete
form HUD-92264 (8/95)
ref Handbooks 4465.1
L. Comparison Approach to Value
7. The undersigned has recited three sales of properties most similar and proximate to the subject property and has described and analyzed these in this analysis.
If there is a significant variation between the subject and comparable properties, the analysis includes a dollar adjustment reflecting the market reaction to those items
or an explanation supported by the market data. If a significant item in the comparable property is superior to, or more favorable than, the subject property, a minus
(-) adjustment is made, thus reducing the indicated value of the subject property. If a significant item in the comparable property is inferior to, or less favorable than,
the subject property, a plu (+) adjustment is made, thus increasing the indicated value of the subject property. *[(1) equals the Sales Price divided by Gross Annual
Rent]
Subject
Comparable
Comparable
Comparable
Item
Property
Sale No. 1
Sale No. 2
Sale No. 3
Address
1123 Brain Lane
Spotford , Texas
12700 Spotford
Spotford, TX
11355 Richmond Avenue
Houston, TX
2855 Commercial Center Blvd
Katy, TX
Same
3 miles northeast
8 miles north
15 miles northwest
Proximity to subject
Sales Price
N/A
Sales price per NRA
N/A
$84.44
$68.90
$86.69
$2,808,562
Gross Annual Rent
X Unf.
Furn.
X Unf.
Furn. $23,169,500
X Unf.
Furn.
$20,675,000
$3,114,223
$2,998,705
$3,718,016
Gross rent multiplier (1)*
7.30
7.80
6.23
7.39
Sales price per unit
N/A
$88,542
$57,924
$94,839
Sales price per room
N/A
$24,709
$16,838
$25,525
Broker, third party appraiser
Broker, third party appraiser
Reliable 3rd party involved in the
transaction
Description
Description
Description
N/A
Cash to seller
Data Source
Owner/Lender
Adjustments
Sales or financing
concessions
Date of sale/time
+ (-) $ Adjust
+ (-) $ Adjust
Description
$0
Cash to seller
$0
Cash to seller
$0
10/21/09
$0
Fair-avg
$2,896
Excellent
7/1/10
4/1/09
Location
Average
Good
Site/view
Average
Average
$0
Average
$0
Average
Design and appeal
Average
Average
$0
Average
$0
Average
A
A
$0
B+
$2,896
Quality of construction
($4,427)
+ (-) $ Adjust
$0
5/15/10
$0
($9,484)
$0
$0
A+
($2,845)
Year built
2007
2006
$0
1999
$5,792
2003
$2,845
Condition
Good
Good
$0
Average
$2,896
Good
$0
Net Rentable Area
280,148 Sq. ft.
276,808 Sq. ft.
$0
No. Room count No. No. Room count No.
of
of
Units Tot. Br. Ba. Vac Units Tot. Br. Ba. Vac
Unit Breakdown
6
60
72
2
3
4
Basement description
0
1
2
1
1
1
None
92
20
4
5
2 1.5
3 1.5
336,300 Sq. ft.
$0
No. Room count No.
of
Units Tot. Br. Ba. Vac
($7,969)
None
$0
24
72
2
3
0
1
238,500 Sq. ft.
$0
No. Room count No.
of
Units Tot. Br. Ba. Vac
1
1
$1,738
None
$0
116
20
3
4
1
2
1
1
($10,432)
None
$0
Functional utility
Average
Average
$0
Average
$0
Average
$0
Heating/cooling
Forced air
Forced Air
$0
Forced Air
$0
Forced Air
$0
Some
Carports, detached
garages, 24 attached
garages
$0
Attached garages,
detached garages,
carports
$0
Parking on/off site
$0
Access gate, clubhouse, Clubhouse, pool, hot tub,
pool, spa, heated sitting area fitness center, billiards,
Project amenities and fee by pool, fitness center, security gates, intrusion
business center, theater alarms, patio/balcony,
(if applicable)
room, car wash, playground, WD
VB,
jogging
trail,
patio/balcony, WD, MW
Other
N/A
Net Adjustment (Total)
+
Adjusted sales price of comparables
8. Indicated Value by Sales Comparison Approach
Reconciliation
Capitalization
N/A
$22,500,000
$0
Garages, carports
Clubhouse, security
access,
two pools,
fitness center, business
c e n t e r ,
M W ,
patio/balcony, WDC
N/A
X
-
N/A
($12,396)
X +
$76,146
$23,500,000
Summation
$1,158
Clubhouse, pool, fitness
center, access gate,
patio/balcony, intrusion
alarms, MW, WD
$0
-
N/A
$17,513
+
$75,437
or
$0
$0
X
-
($19,916)
$74,923
$75,321 per unit
$22,695,278
9. The market value (or replacement cost) of the property, as of the effective date of the appraisal, is
Comparison
$23,000,000
$23,500,000
** see note below
** Note:
For Section 221 mortgage insurance application processing, acceptable risk analysis produces a supportable replacement cost estimate, and the estimate reflected here is the
replacement cost new/summation approach result. In effect, such “appraisals” are in fact USPAP “consultations” concerning economically supportable cost limits. For Section 207 and 223
processing, all three approaches to value are included in the appraisal, but the subject property is appraised for its intended multifamily use, not necessarily its “highest and best use.” The
definition provided in USPAP for “market value” is generally observed, but see Handbook 4465.1, paragraph 8-4, for qualifications.
Effective Dates: For new construction or substantial rehabilitation proposals, the effective date of the improvements component cost estimation is the Line G53 month estimate added to the
report and certification below. The land value component is values as of the inspection date. For Section 223, the effective date of the appraisal is the same as the reporting date, but assumes
(hypothetically) the completion of all required repairs/work write-up items.
Comments on: (continue on separate page if necessary)
1. Sales comparison (including reconciliation of all indicators of value as to consistency and relative strength and evaluation of the typical investors’/purchasers’ motivation in that market).
2. Analysis of any current agreement of sale, option, or listing of the subject and analysis of any prior sales of subject and comparables within three years of the date of appraisal.
Page 7 of 8
Previous editions are obsolete
form HUD-92264 (8/95)
ref Handbooks 4465.1
M. To Be Completed by Construction Cost Analyst
Cost Not Attributable to Dwelling Use
Total Est. Cost of Off-Site Requirements
10. Parking
16. Off-Site
11. Garage
12. Commercial
13. Special Ext. Land Improvements
14. Other
15. Total
17. Total Off-Site Costs
N. Signatures and Appraiser Certification
Architectural Processor
Date
Architectural Reviewer
Date
Cost Processor
Date
Cost Reviewer
Date
I certify to the best of my knowledge and belief:
" The statements of fact contained in this report are true and correct.
" the reported analyses, opinions, and conclusions are limited only by the reported assumption and limiting conditions, and are my
personal, unbiased professional analysis, opinions, and conclusions.
" I have no present or prospective interest in the property that is the subject of this report, and I have no personal interest or bias with
respect to the parties involved.
" my compensation is not contingent upon the reporting of a predetermined value or direction in value that favors the cause of the client,
the amount of the value estimate, the attainment of a stipulated result, or the occurrence of a subsequent event.
" my analyses, opinions, and conclusions were developed, and this report has been prepared, in conformity with the Uniform Standards
of Professional Appraisal Practice; HUD Handbook 4465.1, The Valuation Analysis Handbook for Project Mortgage Insurance; HUD
Handbook 4480.1, Multifamily Underwriting Forms Catalog; and other applicable HUD handbooks and Notices.
" I have made a personal inspection of the property that is the subject of this report.
" no one provided significant professional assistance to the appraisers signing this report, except for the Architectural and Engineering,
and Cost Estimation professionals signing above. These professionals’ estimations of the subject property’s dimensions and “hard”
Replacement costs have been relied upon by the Appraiser and Review Appraiser.
Warning: HUD will prosecute false claims and statements. Conviction may result in criminal and/or civil penalties. (18 U.S.C. 1001, 1010, 1012; 31 U.S.C. 3729,
3802)
Appraiser
Date
State Certification Number
State
Review Appraiser
Date
State Certification Number
State
7/28/10
TX-1338629-G
The Review Appraiser certifies that he/she
7/28/10
Texas
Did
X
CG40012104
Colorado
Did not inspect the subject property
Chief, Housing Programs Branch
Date
Director, Housing Development
Date
Field Office Manager/Deputy
Date
Director, Housing Development
Date
O. Remarks and Conclusion (continue on separate page if necessary. Appraisal reports must be kept for a minimum of five years.)
This form appraisal was prepared in conjunction with a full narrative appraisal and has been incorporated into that narrative appraisal. The form, by design, precludes
a detailed description and analysis of the appraisal process. For further clarification on specific issues, the reader is advised to consult the narrative appraisal report.
Public Reporting Burden for this collection of information is estimated to average 114 hours per response, including the time for reviewing instructions, searching existing
data sources, gathering and maintaining the data needed, and completing and reviewing the collection of information. This agency may not conduct or sponsor, and
a person is not required to respond to, a collection of information unless that collection displays a valid OMB control number.
This information is being collected under Public Law 101-625 which requires the Department of to implement a system for mortgage insurance for mortgages insured
under Sections 207, 221, 223, 232, or 241 of the National Housing Act. The information will be used by HUD to approve rents, property appraisals, and mortgage
amounts, and to execute a firm commitment. Confidentiality to respondents is ensured if it would result in competitive harm in accord with the Freedom of Information
Act (FOIA) provisions or if it could impact on the ability of the Department’s mission to provide housing units under the various Sections of the Housing legislation.
Page 8 of 8
Previous editions are obsolete
form HUD-92264 (8/95)
ref Handbooks 4465.1


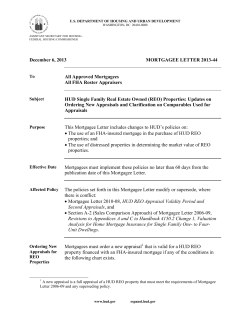


© Copyright 2026