
HORRY COUNTY, SOUTH CAROLINA COMPREHENSIVE ANNUAL FINANCIAL REPORT
HORRY COUNTY, SOUTH CAROLINA
COMPREHENSIVE ANNUAL FINANCIAL REPORT
FOR THE FISCAL YEAR ENDED JUNE 30, 2013
Myrtle Beach International
Airport New Terminal—
opened in 2013
Highway 22 & Highway 17
Boat Landing on
Intracoastal
Waterway—
opened in 2013
Highway 17 Bypass & Highway
707 (“Backgate”) Interchange—
under construction
Horry County Museum
Renovated Burroughs School—
opened in 2013
Photos provided by Horry County Public Information Office, Infrastructure and Regulation
Division, and Department of Airports.
HORRY COUNTY, SOUTH CAROLINA
COMPREHENSIVE ANNUAL
FINANCIAL REPORT
FOR THE FISCAL YEAR ENDED JUNE 30, 2013
PREPARED BY THE FINANCE DEPARTMENT
HORRY COUNTY, SOUTH CAROLINA
HORRY COUNTY, SOUTH CAROLINA
COMPREHENSIVE ANNUAL
FINANCIAL REPORT
YEAR ENDED JUNE 30, 2013
TABLE OF CONTENTS
INTRODUCTORY SECTION
Letter of Transmittal
Certificate of Achievement for Excellence in
Financial Reporting
List of Principal Officials
Organization Chart
i-xix
xx
xxi - xxii
xxiii
FINANCIAL SECTION
Independent Auditor's Report
1-3
Management's Discussion and Analysis
4-21
Audited Basic Financial Statements
Statement of Net Position (Government-Wide)
Statement of Activities (Government-Wide)
Balance Sheet - Governmental Funds
Statement of Revenues, Expenditures, and Changes in Fund Balances Governmental Funds
Statement of Net Position - Proprietary Funds
Statement of Revenues, Expenses and Changes in Net Position - Proprietary Funds
Statement of Cash Flows - Proprietary Funds
Statement of Fiduciary Net Position - Fiduciary Funds
Notes to Financial Statements
Required Supplementary Information
Budgetary Comparison Schedules - General Fund
Required Supplementary Information for Governments
that use the Modified Approach for Infrastructure Assets
Schedule of Funding Progress for Other Post Employment Benefits Plan
-CONTINUED-
22-24
25
26-28
29-31
32-33
34-35
36-37
38
39-99
100-103
104-106
107
Other Financial Information
Combining Non-Major Governmental Financial Statements:
Combining Balance Sheets - Non-Major Governmental Funds
Combining Statements of Revenues, Expenditures and Changes in
Fund Balances - Non-Major Governmental Funds
108
109
Individual Fund Financial Statements
General Fund:
Balance Sheets
Schedules of Revenues, Expenditures and Changes in Fund Balances GAAP Basis
110
111-127
Special Revenue Funds:
Combining Balance Sheet - Non-Major Special Revenue Funds
128-129
Combining Statement of Revenues, Expenditures and Changes in Fund Balance Non-Major Special Revenue Funds
130-131
Balance Sheets - Fire Special Revenue Fund
132
Schedules of Revenues, Expenditures and Changes in Fund Balance - Budget
(GAAP Basis) and Actual - Fire Special Revenue Fund
133
Balance Sheets - Tourism and Promotion Special Revenue Fund
134
Schedules of Revenues, Expenditures and Changes in Fund Balance - Budget
(GAAP Basis) and Actual - Tourism and Promotion Special Revenue Fund
135
Balance Sheets - Waste Management Recycling Special Revenue Fund
136
Schedules of Revenues, Expenditures and Changes in Fund Balance - Budget
(GAAP Basis) and Actual - Waste Management Recycling Special Revenue Fund
137
Balance Sheets – Higher Education Special Revenue Fund
138
Schedules of Revenues, Expenditures and Changes in Fund Balance – Budget
(GAAP Basis) and Actual - Higher Education Special Revenue Fund
139
Balance Sheets – Horry–Georgetown TECH Special Revenue Fund
140
Schedules of Revenues, Expenditures and Changes in Fund Balance – Budget
(GAAP Basis) and Actual - Horry–Georgetown TECH Special Revenue Fund
141
Balance Sheets - Watershed Special Revenue Fund
142
Schedules of Revenues, Expenditures and Changes in Fund Balance - Budget
(GAAP Basis) and Actual - Watershed Special Revenue Fund
143
Balance Sheets - Mt. Gilead Special Revenue Fund
144
Schedules of Revenues, Expenditures and Changes in Fund Balance - Budget
(GAAP Basis) and Actual - Mt. Gilead Special Revenue Fund
145
Balance Sheets - Socastee Recreation Special Revenue Fund
146
Schedules of Revenues, Expenditures and Changes in Fund Balance - Budget
(GAAP Basis) and Actual - Socastee Recreation Special Revenue Fund
147
Balance Sheets - Road Maintenance and CTC Special Revenue Fund
148
Schedules of Revenues, Expenditures and Changes in Fund Balance - Budget
(GAAP Basis) and Actual - Road Maintenance and CTC Special Revenue Fund
149
Balance Sheets - Beach Nourishment Special Revenue Fund
150
Schedules of Revenues, Expenditures and Changes in Fund Balance - Budget
(GAAP Basis) and Actual - Beach Nourishment Special Revenue Fund
151
Balance Sheets - Grants Special Revenue Fund
152
Schedules of Revenues, Expenditures and Changes in Fund Balance - Budget
(GAAP Basis) and Actual - Grants Special Revenue Fund
153
-CONTINUED-
Special Revenue Funds (continued):
Balance Sheets - Admissions Tax Special Revenue Fund
Schedules of Revenues, Expenditures and Changes in Fund Balance - Budget
(GAAP Basis) and Actual - Admissions Tax Special Revenue Fund
Balance Sheets - Victim Witness Assistance Special Revenue Fund
Schedules of Revenues, Expenditures and Changes in Fund Balance - Budget
(GAAP Basis) and Actual - Victim Witness Assistance Special Revenue Fund
Balance Sheets - Senior Citizens Special Revenue Fund
Schedules of Revenues, Expenditures and Changes in Fund Balance - Budget
(GAAP Basis) and Actual - Senior Citizens Special Revenue Fund
Balance Sheets - Arcadian Shores Special Revenue Fund
Schedules of Revenues, Expenditures and Changes in Fund Balance - Budget
(GAAP Basis) and Actual - Arcadian Shores Special Revenue Fund
Balance Sheets - Baseball Stadium Special Revenue Fund
Schedules of Revenues, Expenditures and Changes in Fund Balance - Budget
(GAAP Basis) and Actual - Baseball Stadium Special Revenue Fund
Balance Sheets - Economic Development Special Revenue Fund
Schedules of Revenues, Expenditures and Changes in Fund Balance - Budget
(GAAP Basis) and Actual - Economic Development Special Revenue Fund
Balance Sheets - Stormwater Management Special Revenue Fund
Schedules of Revenues, Expenditures and Changes in Fund Balance – Budget
(GAAP Basis) and Actual - Stormwater Management Special Revenue Fund
Balance Sheets - Hidden Woods Special Revenue Fund
Schedules of Revenues, Expenditures and Changes in Fund Balance - Budget
(GAAP Basis) and Actual - Hidden Woods Special Revenue Fund
Balance Sheets - GIS/IT Special Revenue Fund
Schedules of Revenues, Expenditures and Changes in Fund Balance - Budget
(GAAP Basis) and Actual - GIS/IT Special Revenue Fund
Balance Sheets - Multi-County Business Park Rollback Special Revenue Fund
Schedules of Revenues, Expenditures and Changes in Fund Balance - Budget
(GAAP Basis) and Actual - Multi-County Business Park Rollback
Special Revenue Fund
Balance Sheets - E-911 Special Revenue Fund
Schedules of Revenues, Expenditures and Changes in Fund Balance - Budget
(GAAP Basis) and Actual - E-911 Special Revenue Fund
Balance Sheets - CDBG Grant Program Special Revenue Fund
Schedules of Revenues, Expenditures and Changes in Fund Balance - Budget
(GAAP Basis) and Actual - CDBG Grant Program Special Revenue Fund
Balance Sheets - Recreation Special Revenue Fund
Schedules of Revenues, Expenditures and Changes in Fund Balance - Budget
(GAAP Basis) and Actual - Recreation Special Revenue Fund
-CONTINUED-
154
155
156
157
158
159
160
161
162
163
164
165
166
167
168
169
170
171
172
173
174
175
176
177
178
179
Capital Projects Funds:
Combining Balance Sheet - Major Capital Projects Funds
Combining Statement of Revenues, Expenditures and Changes in Fund Balance Major Capital Projects Funds
Balance Sheets - General Improvement Capital Projects Fund
Statements of Revenues, Expenditures and Changes in Fund Balance General Improvement Capital Projects Fund
Balance Sheets - Capital Projects Sales Tax Fund
Statements of Revenues, Expenditures and Changes in Fund Balance Capital Projects Sales Tax Fund
Balance Sheets - Developer Contributions Capital Projects Fund
Statements of Revenues, Expenditures and Changes in Fund Balance Developer Contributions Capital Projects Fund
Debt Service Funds:
Balance Sheets – RIDE Program Debt Service Fund – Major Fund
Schedules of Revenues, Expenditures and Changes in Fund Balance – Budget
(GAAP Basis) and Actual - RIDE Program Debt Service Fund – Major Fund
Combining Balance Sheet - Non-Major Debt Service Funds
Combining Statement of Revenues, Expenditures and Changes in Fund Balances –
Non-Major Debt Service Funds
Balance Sheets – General Debt Service Fund
Schedules of Revenues, Expenditures and Changes in Fund Balance – Budget
(GAAP Basis) and Actual - General Debt Service Fund
Balance Sheets – Special Obligation Debt Service Fund
Schedules of Revenues, Expenditures and Changes in Fund Balance – Budget
(GAAP Basis) and Actual - Special Obligation Debt Service Fund
Proprietary (Enterprise) Funds:
Statements of Net Position – Department of Airports Enterprise Fund
Statements of Revenues, Expenses and Changes in Net Position –
Department of Airports Enterprise Fund
Statements of Cash Flows – Department of Airports Enterprise Fund
Internal Service Fund:
Statements of Net Position – Fleet Service Internal Service Fund
Statements of Revenues, Expenses and Changes in Net Position – Fleet Service
Internal Service Fund
Statements of Cash Flows – Fleet Service Internal Service Fund
Fiduciary (Agency) Funds
Combining Statement of Changes in Assets and Liabilities – All Agency Funds
-CONTINUED-
180
181
182
183
184
185
186
187
188
189
190
191
192
193
194
195
196-197
198-199
200-201
202
203
204
205-209
Capital Assets Used in the Operation of Governmental Funds:
Schedules of Capital Assets Used in the Operation of Governmental Funds by Source
Schedule of Capital Assets Used in the Operation of Governmental Funds by
Function and Activity
Schedules of Changes in Capital Assets Used in the Operation of Governmental
Funds by Function and Activity
210
211
212
Victim’s Rights:
Schedule of Court Fines, Assessments and Surcharges
213
Capital Projects Sales Tax:
Budgetary Comparison Schedules
214
General Improvements Capital Projects Fund:
Schedules of Revenues, Expenditures and Changes in Fund Balance – Budget
(GAAP Basis) and Actual
215
STATISTICAL SECTION (UNAUDITED AND NOT COVERED BY THE REPORT
OF INDEPENDENT AUDITORS)
Net Position by Component
Changes in Net Position
Fund Balances of Governmental Funds
Changes in Fund Balances of Governmental Funds
Assessed Value and Estimated Actual Value of Taxable Property
Property Tax Rates
Principal Property Taxpayers
Property Tax Levies and Collections
Ratios of Outstanding Debt by Type
Ratios of General Bonded Debt Outstanding
Direct and Overlapping Governmental Activities Debt
Legal Debt Margin Information
Pledged-Revenue Coverage
Demographic and Economic Statistics
Principal Employers
Gross Retail Sales Figures
Full-Time Equivalent Government Employees by Function
Operating Indicators by Function
Capital Asset Statistics by Function
216
217-218
219
220-221
222
223-224
225
226
227
228
229
230
231
232
233
234
235
236-237
238
HORRY COUNTY, SOUTH CAROLINA
INTRODUCTORY SECTION
HORRY COUNTY, SOUTH CAROLINA
Post Office Box 296
Conway, South Carolina 29528
HORRY COUNTY
FINANCE DEPARTMENT
1301 Second Avenue
Conway, South Carolina 29526
Phone: (843) 915-5180
Fax: (843) 915-6181
www.horrycounty.org
HORRY COUNTY, SOUTH CAROLINA
LETTER OF TRANSMITTAL
DECEMBER 4, 2013
To the Honorable Chairman, Members of the County Council, County Administrator, and the
Citizens of Horry County:
We are pleased to submit the Comprehensive Annual Financial Report (CAFR) of the
County of Horry (the “County”) for the fiscal year ended June 30, 2013. This report is prepared for
the purpose of disclosing the County’s financial condition to its residents, elected officials and other
interested parties. The financial statements contain all disclosures necessary to enable the reader
to gain an understanding of the County’s financial activities.
This report consists of management’s representations concerning the finances of the
County. Consequently, management assumes full responsibility for both the completeness and
reliability of the information presented in this report. To provide a reasonable basis for making
these representations, management of the County has established a comprehensive internal
control framework that is designed both to protect the government’s assets from loss, theft or
misuse and to compile sufficient reliable information for the preparation of the County’s financial
statements in conformity with Generally Accepted Accounting Principles (GAAP). Because the
cost of internal control should not outweigh the benefits, Horry County’s comprehensive framework
of internal controls has been designed to provide reasonable rather than absolute assurance that
the financial statements are free of material misstatement. As management, we assert that, to the
best of our knowledge and belief, this financial report is complete and reliable in all material
respects.
The County financial statements have been audited by Elliott Davis LLC. The independent
auditors’ report is presented as the first component of the Financial Section of the CAFR. The goal
of the independent audit was to provide reasonable assurance that the basic financial statements
of the County for fiscal year ended June 30, 2013, are fairly stated in accordance with GAAP. The
independent audit involved examining, on a test basis, evidence to support the amounts and
disclosures in the basic financial statements; assessing the accounting principles used and
significant estimates made by management; and evaluating the overall financial statement
presentation. The independent auditor concluded, based upon the audit, that there was a
reasonable basis for rendering an unqualified opinion that the County financial statements for the
fiscal year ended June 30, 2013 are fairly presented in conformity with GAAP.
GAAP require that management provide a narrative introduction, overview, and analysis to
accompany the basic financial statements in the form of Management’s Discussion and Analysis.
This letter of transmittal is designed to complement the Management’s Discussion and Analysis
and should be read in conjunction with it. The County’s Management Discussion and Analysis can
be found immediately following the report of the independent auditors.
Profile of the Government
Horry County is the northeastern most county in the State of South Carolina.
Encompassing 1,134 square miles, it is also the largest. The County was incorporated in 1801
with a population of 550. The county was named after Peter Horry who was a descendent of
Huguenot settlers and whose family owned several large plantations in the area. He served as a
member of the South Carolina General Assembly and as a Brigadier General of Militia during the
American Revolution under General Francis Marion, who was known as the Swamp Fox.
Surrounded on the three sides by ocean, rivers, and swamps, Horry developed a distinctive
culture, which gave rise to its name, “The Independent Republic of Horry County”. From the time
of incorporation, the County stood off the edge of South Carolina, both literally and figuratively.
In 1975, the County adopted the Council-Administrator form of government. Under this
type of government, each member of council is elected from a district in which he/she lives and a
chairman is elected at-large. There are twelve council members in total. Each council member is
elected for four-year terms, half of the members being elected every two years. Elections are held
every even-numbered year in the month of November.
The Home Rule Act, passed by the General Assembly in 1976, dictates the responsibility of
the Council. According to the act, County Council’s function is to make policy through ordinances
and resolutions and shape those policies through the budget process. The Council is also
responsible for appointing the County Administrator, the Registrar of Deeds (RMC) and the Clerk to
Council.
The Administrator is responsible for carrying out the policies and ordinances passed by
council, for over-seeing day-to-day operations of the government, and for appointing the County’s
Assistant Administrators. The Administrator performs all necessary administrative duties, as
directed by Council, and ensures efficient operation of all County functions.
The County provides a full range of services, including police and fire protection, EMS and
E-911 services, the construction and maintenance of highways, streets and other infrastructure,
health and social services, recreational and cultural activities, economic development, industrial
park development, and other general administrative support services.
In addition, air
transportation and terminal support are provided under an Enterprise Fund concept, with charges
set to provide adequate coverage of operating expenses and payments on outstanding debt.
The Council is required to adopt a final budget by no later than the close of the fiscal year.
This annual budget serves as the foundation for the County’s financial planning and control. All
department heads present a departmental budget to the Department of Budget and Revenue
Management, which is reviewed and a balanced financial plan is presented to the Administrator.
Once the Administrator is satisfied with the recommended budget, it is forwarded to County
Council. Council must, according to state law, have three readings of the financial plan ordinance
ii
and a public hearing before it can be passed and become law. The Administrator is authorized to
transfer budgeted funds within a department and between departments, within the same fund.
Budget transfers between funds require amendments to the original ordinance. Formal budgetary
integration is employed as a management control device during the year. No department funded
by the County shall spend or obligate funds in excess of the amount budgeted in total for each fund
under any circumstance.
Factors Affecting Financial Condition
Stability and continued growth in tourism along with improving real estate indicators from
increased building permits and RMC values provide a base for the County to continue enhancing
our constituent services, focus on economic development, and development of needed
infrastructure for the future.
The information following in this letter and presented in the financial statements will give
greater details of these accomplishments and is perhaps best understood when it is considered
from the broader perspective of the specific environment within which the County operates.
Local Economy
Most of the County’s sixty (60) miles of beaches
stretching from Little River to Pawley’s Island have been
developed residentially or commercially while at least 32
percent of the remainder of the County is yet to be developed.
This stretch of the beach is known as the “Grand Strand”. The
County leads the state’s tourism industry with 31.4 percent of
the total domestic traveler spending in 2011. Forty percent of
the state’s second homes are also located within the County.
The Grand Strand is a major U.S. tourist center. According to a Tourism Economic Impact
report produced by the Travel Industry Association of America, 2008 domestic visitor expenditures
in the County exceeded $3.1 billion, accounting for approximately 31.0 percent of the $9.9 billion of
domestic visitor expenditures in the State of South Carolina. The County leads all counties of the
State in visitor spending, lodging rentals, employment and tax revenues resulting from travel and
tourism. The natural assets of the Grand Strand are the Atlantic Ocean and the mild climate.
Average temperature for both air and sea water range from 80 degrees during the summer to
about 50 degrees during the winter.
Over the past five years, the Grand Strand area has received numerous accolades from
regional and national publications. US News & World Report honored Myrtle Beach in multiple
categories, including #6 Best Family Beach Vacations, #6 Best Family Vacations in the U.S.A., #7
Best Affordable U.S. Vacations, and #9 Best Beaches in the U.S.A. Myrtle Beach was described as
“one of the best East Coast family vacation destinations” and notes that “Southern hospitality is
alive and well at Myrtle Beach”. TripAdvisor named Myrtle Beach as the #1 Best Beach in the
United States, and also one of the Top 10 Best in the World. Myrtle Beach ranked as one of the
iii
“Top 100 Small Places for Business and Careers” in a Forbes magazine Survey (2009).
TopRetirements.com ranked Myrtle Beach 25 out of 100 on its “2011: Best Places to Retire” listing.
Most recently, Myrtle Beach was listed on away.com “Cheat Sheet of Best Beaches for
2012”; Trip Advisor “2011 Traveler’ Choice Awards”; Better Homes & Gardens Real Estate
“America’s Most Fun, Affordable Cities’; Travel Channel “Top 10 Vacation Spots” and Travel Ticker
“Top 5 Summer Travel Destinations of 2011.”
Golf Digest magazine named four Myrtle Beach area golf
courses to its 2009-2010 lists of “America's Top 100 Great
Public Golf Courses.” Golf Digest also named Myrtle Beach as
a “Best Value for the Money Destination” in its 2008 Travel and
Destination Survey. A number of specific golf courses, hotels
and attractions have been cited for superlative ratings by
magazines and agencies including Travel and Leisure magazine, Travelocity, Restaurant Business
Magazine and EscapeHomes.com.
According to the Myrtle Beach Area Chamber of Commerce (the “Chamber”), the Grand
Strand currently has 102 eighteen-hole championship golf courses hosting more than 3.4 million
paid rounds in 2010 vs. 3.1 million in 2009.
In its 50th Anniversary year (2004), Sports Illustrated named Myrtle Beach a “Sportstown
USA” noting that “its leaders recognize that sports are a tremendous force for good in the
community.”
In 2010, Myrtle Beach opened the 1.2 mile Oceanfront Boardwalk, which was recognized
as the nation’s number three boardwalk by National Geographic magazine and one of the best
U.S. boardwalks by Travel & Leisure magazine.
Based upon an estimate of annual visitors to the Myrtle Beach area conducted for the
Chamber by D. K. Shifflet & Associates, Ltd., approximately 14.0 million people visited the area in
2010. Based upon the Chamber’s 2010 conversion study, 16 percent of the area's visitors came
from North Carolina and 35 percent from New York, Pennsylvania, Ohio and Virginia. Georgia,
Tennessee, Kentucky, Maryland and Michigan round out the top ten states, outside of South
Carolina, whose residents visit the area. In 2010, the Chamber received nearly 15,000 inquiries
from foreign countries. About 98 percent of those came from Canada, with most of the remaining 2
percent coming from England, Germany, France and United Kingdom.
Traffic to the
VisitMyrtleBeach.com website originated from all 50 states and 203 different countries. The top ten
states for web traffic were: North Carolina, South Carolina, New York, Pennsylvania, Georgia,
Ohio, Virginia, Illinois, New Jersey, Tennessee and Maryland.
According to the Chamber's 2010 In-Market Visitor Profile Study, the destination continues
to attract adults traveling with children in an average party size of five members. Of all travel party
types, 64 percent are families, 29 percent are couples, 3 percent are groups of three or more
adults, 3 percent are single adults and 1 percent is single adults with children. The average length
of stay in 2010 was five days for leisure travelers and three days for business travelers. Grand
iv
Strand leisure travelers spent an average of $121 per person per day and group business travelers
an average of $190 per person per day. Most Grand Strand visitors (88 percent) used their own
cars as their primary means of transportation. A majority (49 percent) of them stayed in hotels,
while 29 percent stayed in condominiums or villas.
There are approximately 98,573 bedrooms available for rent along the Grand Strand
including 58 percent in hotels/motels, 22 percent in vacation rentals, 11 percent in timeshares, and
9 percent campgrounds. Average hotel and motel occupancy rates on the Grand Strand, as
reported in the Grand Strand Economic Quarterly Report for the Second Quarter – 2013, was 53.6
percent in 2013 vs. 50.9 percent in 2012 and the average daily rate was $94.06 in 2013 vs. $89.29
in the prior year. Gross retail sales in the County were $9.01 billion in 2013.
The following graph shows that the County’s revenues which are heavily reliant upon the
tourism industry have stabilized through these tough economic times and are returning to historic
highs. The graph reports actual revenues from State and Local Accommodations Tax (ATAX) as
well as Hospitality Fees for FY 2007 – FY 2013.
45,000,000
40,000,000
35,000,000
30,000,000
25,000,000
Local ATAX
State ATAX
Hospitality 1%
Hospitality 11/2%
20,000,000
15,000,000
10,000,000
5,000,000
-
FY 07
FY 08
FY 09
FY 10
FY 11
FY 12
FY 13
The following table shows the improving trends, since the economic slow-down in 2008, in
retail sales for businesses located in the County for the years shown.
Year
2008
2009
2010
2011
2012
2013
Total Retail Sales
$9,064,308,659
8,212,831,863
7,858,031,821
8,291,304,481
8,751,960,729
9,011,131,130
The County is more than a bustling center of tourism, it is also a comfortable place in which
to live, raise a family, and simply relax and enjoy life. County residents have the unique
opportunity to both enjoy the pleasant tranquility of country living as well as the numerous
amenities offered along the Grand Strand resort areas.
v
Commercial and Residential Development
The County’s economy has reflected stabilization in most of its market segments. However,
the real estate market will require more time to fully recover. Fortunately, a fast paced development
environment in prior years has generated substantial growth in the County’s assessable tax base
which is providing a reliable source of revenue to fund the general government activities.
The single family residential market is experiencing resurgence with greater sales volume
and higher median sales prices. The Coastal Carolina Association of Realtors reported a 14.6%
year over year sales growth in its Grand Strand Market Report for the September 2013. A median
sales price increase of 5.9% was also noted along with an increase of 7.3% and 13.7% for condo
sales growth and sales price, respectively.
Adjacent to the 1.2 mile, $6.5 million, Oceanfront
Boardwalk opened in Myrtle Beach in 2010, developers have
completed a 200-foot tall SkyWheel along with a Jimmy Buffet’s
LandShark Bar & Grill. These new attractions, opened in May
2011, are expected to reinvigorate the downtown Myrtle Beach
area and create an additional 150 jobs.
WonderWorks, the upside-down science attraction, opened in April of 2011 at Broadway at
the Beach. The attraction, one of only four in the country, has four floors of interactive exhibits as
well as activities such as laser tag, indoor ropes course, and a café and created more than 100
new jobs for the Grand Strand.
The County’s largest development, Carolina Forest, was opened by International Paper in
2000. Carolina Forest is approximately 17 square miles, or 10,850 acres. To compare, the City of
Myrtle Beach is also approximately 17 square miles or 10,700 acres. In thirty years, 50,000 to
60,000 people could live in Carolina Forest, with it possibly growing into an incorporated town.
There will be 37 subdivisions, eight to 10 golf courses, and five million square feet of commercial
space. The County’s goal has been to make this the County’s first fully zoned and planned
community. The overall concept is to intersperse houses with sidewalks, arranged by subdivisions
with matching signage, all planned around a downtown district with an old-fashioned Main Street
called “Town Centre”. The population is estimated to be approximately 60 percent retirees and 40
percent younger families. The growth is expected to take place over the next 20 to 30 years. In
the last Census Carolina Forest experienced a population growth of 506 percent over the prior ten
years and the adjacent community of Forestbrook grew 125 percent.
As of the spring of 2012, two fire/rescue stations, recreation center and library have been
completed in the Carolina Forest area. Three elementary schools, a middle school, a high school,
and an academy for the arts, sciences and technology have been constructed in the Carolina
Forest area by the Horry County School District. New commercial development in Carolina Forest
is located within the International Drive area with a Lowe’s Food grocery store, 264 unit apartment
complex, two convenience stores, McDonalds and Bojangles Famous Chicken ’n Biscuits
restaurants, and announcement of a CVS Pharmacy.
vi
The Market Common opened April 3, 2008 in Myrtle Beach, on the site of the former Myrtle
Beach Air Force Base, combining housing with about 40 national and local retail stores and
restaurants. The Market Common is an upscale, master-planned urban village, located just 1 mile
from the ocean and minutes from all Myrtle Beach attractions. Residents can walk to the
exceptional shopping and dining options in this area.
In 1999 the Grande Dunes Resort project was begun as a high profile, full service resort
stretching from the beach to the Intracoastal Waterway between 82nd Avenue North and the Dunes
Golf and Beach Club in Myrtle Beach. The residential resort, touting classic Mediterranean
architecture, provides numerous upscale amenities to include golf and tennis facilities, an ocean
club, and private marina. Accommodations, upscale shops and restaurants are all part of the
Marina Village section of the development, which is open to the public. On September 16, 2008
Grande Dunes Marketplace celebrated its grand opening. This property, located across Highway
17 from the Marina Inn at Grande Dunes and anchored by a 49,000 square-foot Lowes Foods and
CVS Drugstore, offers more than 91,000 square-feet of retail space with room for 19 tenants as
well as future out parcel spaces. The Grande Dunes Marketplace provides an array of fine retailers
and restaurants for Myrtle Beach visitors and residents.
Coastal Grand Mall on US 501 and US 17 Bypass opened in March of 2004 and houses
anchor stores such as Belk, Sears, Dillards, JC Penney, Dick’s Sporting Goods, and Bed Bath &
Beyond. In addition to the mall, space is available for up to 20 out parcels for free standing
businesses. Shopping opportunities continue to be bountiful by improvements to the Grand Strand
– from the Tanger Outlet Stores on US 501 to the Tanger Outlet Center located in the
northernmost section of Myrtle Beach on US 17. Myrtle Beach Mall (formerly known as Colonial
Mall), Barefoot Landing and Broadway on the Beach continue to make enhancements to the
shopping arena by adding specialty shops, the Pavilion Nostalgia Park and increasing the number
of new restaurants.
Sayebrook Town Center expanded in 2013 with the opening of a new 135,000 square foot
Target store along with national retailers Marshalls, Petco, and local commercial space.
Coastal North Town Center in North Myrtle Beach has initiated construction and plans to
open the 348,000 square foot facility in 2014. The facility will be anchored by a Publix Super
Market, Hobby Lobby, TJ Maxx, Ylta Beauty, Dick’s Sporting Goods, Ross Dress for Less, Rack
Room Shoes, PetSmart, and Versona Accessories.
vii
The Healthcare industry continues as a leading segment of our commercial base with each
of the major institutions Grand Strand Regional Medical Center, Conway Medical Center, and
McLeod Health (Loris and Seacoast) present in our principal employers top 10 list along with Blue
Cross Blue Shield.
Foreclosures
As with many areas of the country, the Grand Strand is experiencing a high volume of
foreclosures. Tom Maeser, a real estate analyst for the Coastal Carolinas Association of Realtors,
indicates that areas with more investor properties, such as Myrtle Beach, tend to have a higher
number of foreclosures because as values drop below the mortgage amounts and the owners
aren’t making enough rental income, the owners will let the property go into foreclosure. Revenue
in the Master in Equity office declined 24% to $2.1 million from the $2.7 million average for the last
three fiscal years.
Property Assessed Value and Reassessment
While general economic trends softened, fiscal year 2011 was a reassessment year for the
County. The reassessment process resulted in a total assessed value for the County that was
slightly above the tax year 2009 assessed value, resulting in a minimal amount of millage roll-back.
State law has a specific calculation requirement regarding rolling-back millage in a reassessment
year so that the government does not generate more revenue as a result of reassessment. This
methodology is so conservative that in actuality, the County generates less revenue in a
reassessment year than in the prior year. The County is required to roll-back millage to generate
the amount of revenue that was actually collected in the prior year, not what was billed. By rolling
the millage back to the actual prior year collected amount, the reassessment year revenue drops
from the prior year as a result of taxes that are billed that are not collected in that year. In fiscal
year 2012, lower assessed value for personal property resulted in lower revenue; however
increased real property values resulted in an overall stable assessed values and tax revenue.
Horry County’s Assessed Values for Real and Personal Property
Real(1)
Personal(1)
Total(1)(2)
Tax Year
2007
$1,466,803,000
$302,173,000
$1,768,976,000
2008
1,663,986,000
306,600,000
1,970,586,000
2009
1,703,167,000
303,012,000
2,006,179,000
2010
1,753,786,000
275,204,000
2,028,990,000
2011
1,766,946,000
277,772,000
2,044,718,000
2012
1,764,836,000
289,034,000
2,053,870,000
(1)
(2)
Numbers Rounded
Does not include Merchant’s Inventory of $10,571,700
The South Carolina General Assembly, in its 2011 session, modified the annual operating
millage limits and roll-back limitations on increases in assessed value through reassessment on a
prospective basis. This amendment modifies the roll-back calculation to use taxes billed vs. taxes
collected in the previous year and increases the millage cap to include the current year population
and CPI percentage increases plus any allowable but not imposed increases for the preceding
viii
three years. The 2011 Amendments further provided for an exemption from the increase in
assessed value as of the date of an assessable transfer equal to 25 percent of the assessed value
of certain real property subject to a 6 percent assessment ratio (generally, commercial property).
Building Permits Issued
The following table shows that the unincorporated area of the County declined from its peak
in construction during fiscal years 2006 and 2007. As the housing and construction markets began
to slow-down during fiscal year 2007, along with the impact of the challenges in the banking
industry during fiscal year 2008, building permits issued dropped to a five year low of 6,679 in fiscal
year 2009. The volume of permits and related revenue stabilized in fiscal years 2010, 2011, and
2012, During 2013, the number or permits issued increased in excess of 11%; additionally the
values increased at a much greater pace resulting in a 31% increase in revenues .
Number of Building
Permits Issued
8,459
6,679
7,397
7,258
7,250
8,082
Fiscal Year
2008
2009
2010
2011
2012
2013
Revenue
$4,726,984
2,460,389
2,338,830
2,106,250
2,321,424
3,046,517
Revenue sources that increased as the commercial and residential development flourished
include business license fees, building permit fees, and RMC recording fees and documentary
stamps. As the economy made a downward turn during fiscal year 2008, revenues from these
sources began to decline, but revenues from the Master in Equity’s Office, who handles
foreclosures, began to increase. Revenues from these economically sensitive areas appear to
have stabilized and are now reflecting a moderate growth. The FY 2014 budget anticipates
increased revenue levels from these sources from the FY 2013 actual revenues.
16,000,000
Register of Deeds
Building Permits
Master in Equity
Business Licenses
14,000,000
12,000,000
10,000,000
8,000,000
6,000,000
4,000,000
2,000,000
-
FY 09
FY 10
FY 11
ix
FY 12
FY 13
Long-term Financial Planning
Fund balance in the General Fund at June 30, 2013 of $40.0 million (29.2 percent of the
fiscal year 2014 General Fund expenditure budget) continues to fall within the policy guidelines set
by County Council for budgetary and planning purposes (15 percent of the next year’s General
Fund operating budget).
To address the ongoing capital needs for the growing county, County Council approved the
development of a Capital Improvement Program Policy. This policy calls for the adoption of a
formal five-year Capital Improvements Program to be updated annually. The policy calls for the
County to budget as pay-as-you-go funding for capital improvements an amount equal to at least 3
percent of General Fund operating revenues.
Major Initiatives
Economic Development
Our strong commitment to building and diversifying our economy is evidenced by our
support and funding of the Myrtle Beach Regional Economic Development Corporation. Results
include a number of expansions and openings announced in 2012 and 2013 with announcements
of 734 new jobs.
Native Sons is one of the largest screen printing and embroidery
companies on the east coast with local, regional and national clients
including Abercrombie & Fitch. They are head-quartered in Myrtle
Beach and announced a 79 job expansion with a capital investment of
$2.175 million in 2012.
BauschLinneman, a Surteco company, announced a corporate
headquarters and manufacturing relocation into Horry County in 2012.
They make laminated paper products and edge bandings with wood
grain coatings for the furniture industry. The relocation will result in 55
new jobs and a capital investment of $7.715 million. The facility will be
open and operational October 2013. They are currently hiring.
Frontier Communications announced a 90 job customer support center that included a $1.55
million capital investment in 2012. Today, the company has 130 jobs filled and is looking to add 20
more employees.
x
Canfor Southern Pine, a forest products manufacturer
headquartered in Horry County, announced a 56 job expansion with a
$3.6 million capital investment in 2012.
Connecticut based PTR Industries announced a large relocation
of their firearms manufacturing facility to Horry County on June 24,
2013. The project will consist of 145 new jobs and a capital investment
of $8 million. Production is expected to begin by December of 2013
after the renovation of a County owned building is complete.
The County is currently developing an International Technology and Aeronautical Park (the
“ITAP”) on 460 acres located on the County-owned Myrtle Beach International Airport property.
Initial spending for development of the Park is $3.8 million. Phase two of the development includes
a ramp and taxiway from the existing Myrtle Beach International Airport runway with a $5.2 million
budget funded by a $3.75 million FAA grant, Rural Development Fund contributions and proceeds
from airport land sales. Spending during FY2013 of $545,000 is for survey, testing, and design.
The County currently operates three (3) industrial parks, and is in the planning stages of
two additional parks, which are industry specific. Overall, community commitment exists to bring in
new industry – as demonstrated by the example of Horry Electric Cooperative’s contributions,
through the Rural Development Act, to assist in the infrastructure development of two of these
parks. Through these contributions, the County has funded the construction of a shell building
within the County’s “Certified Park” known as Cool Spring Business Park. Another industrial park
project being pursued in conjunction with Grand Strand Water & Sewer is a Marine Park in
Bucksport.
Airport
The Myrtle Beach International Airport
(the “Airport” or “MYR”), located in the City of
Myrtle Beach (the ”City”) one mile from the
Atlantic Ocean, serves as the scheduled
commercial service airport for the County and the
Grand Strand region. The Airport is owned by
the County and operated by its Department of
xi
Airports, an Enterprise Fund of the County. The Airport is equipped to handle aircraft of all sizes,
including wide-body type aircraft.
771,564 passengers enplaned at MYR in fiscal year 2013, versus 818,002 enplanements in
fiscal year 2012. This 5.7% decline is partially attributable to decrease in seat capacity offered by
airlines servicing MYR during the first half of the fiscal year. Carriers increased seating capacity in
the second half of the 2013 fiscal year. Passenger enplanements for the 2013 calendar year
through August 31 increased by more than 12% from the same period in calendar 2012.
Passenger enplanements for the month of August 2013 were 21% higher than August 2012 and
represent the highest enplanement activity for August in the Airport's history. The Airport is served
by Delta Air Lines, Spirit Air Lines, US Airways, and United Airlines as Signatory Airlines. The
Signatory Airlines along with Allegiant, Porter, and WestJet, offer daily, nonstop flights to and from
over 25 destinations and connections through hubs in Atlanta, Charlotte, Chicago, New York and
Newark, among others.
Horry County broke ground on the Terminal Capacity
Enhancement Program on May 17, 2010 for the program to involve
airside and landside improvements to the current facility plus an
addition of a new 240,000 SF passenger terminal and concourse
increasing the number of departure gates from seven (7) to thirteen
(13) while adding three (3) new ground loading positions. To support
the expansion, a new automated baggage handling system, and new
passenger boarding bridges were added while the airport's apron
pavement and taxiway were reconstructed and expanded. A new rental
car facility with a pedestrian canopy was added to maximize the
efficiency of the facility, and a covered exit plaza with employee
facilities were added while the existing parking lot, roadway circulation and access roads were
renovated and expanded. In all, the total footprint of the airport terminal
has increased from 155,000 SF to 430,000 SF. Concurrently, the
Airport expanded Taxiway “A” and extended Harrelson Boulevard, the
major traffic artery to and from the Airport, to span the distance
between US Highway 17 on the west side of the City and Highway 17
Business running parallel to the coast on the City’s east side.
In addition to the commercial airline facilities, complete services are available at the Airport
for all size general aviation, corporate and charter aircraft, including helicopters. Several air cargo
companies also have flight operations from the Airport. The Airport's General Aviation Terminal
(“GAT”) annually accommodates over 45,000 passengers arriving in private aircraft. The Airport
recently completed and opened for business a new $4 million GAT facility with 11,000 square feet
of space on a single level. The new facility incorporates many state-of-the-art systems to ensure a
sustainable “green” design. The old facility is slated for demolition.
The County also owns and operates general aviation airports in North Myrtle Beach,
Conway and Loris. Both the Grand Strand Airport located in North Myrtle Beach and the ConwayHorry County Airport located in Conway serve private and corporate aircraft with parking, refueling
xii
and maintenance. Currently, there are no services available on the Loris Airport. In February
2006, the South Carolina Department of Commerce, Division of Aeronautics released an economic
impact study of the County’s airports. That study, prepared by Wilbur Smith Assoc., estimates the
direct and indirect economic impact of the four county airports is over $776.3 million annually.
Road Improvement and Development Effort (RIDE)
The most aggressive road construction program in the history of the County, Road
Improvement and Development Effort (RIDE), was approved by Governor Beasley in September
1996. The RIDE Project was the initiation of a comprehensive solution for transportation problems
which pairs significant funding from the local level with funding provided by the State of South
Carolina. The County enacted an ordinance in the fall of 1996 that implemented a 1.5% Hospitality
Fee (accommodations, restaurants, amusements, golf and theaters) effective January 1, 1997.
The purpose of this fee is to provide the financial ability for the County to partner with the State of
South Carolina to meet the infrastructure needs of the County.
The participating parties in the RIDE project are the County, the South Carolina
Transportation Infrastructure Bank and the South Carolina Department of Transportation. The role
of the South Carolina Transportation Infrastructure Bank is to provide the necessary financing and
funding for the RIDE project. More detailed information about the technical aspects of the
intergovernmental agreement is provided in Note 17 of the basic financial statements.
Pursuant to the Horry County Road Improvement and Development Effort Program (the
“RIDE Program”), the County entered into various long-term loan agreements with the South
Carolina Transportation Infrastructure Bank (the “SIB”) to provide funding for various road
construction projects in the County. The State Infrastructure Bank has made available financial
assistance, in the form of both loans and grants, to the County under several intergovernmental
agreements (IGA). The following three loans were made under these agreements: IGA Loan #1 $300,000,000, IGA Loan #2 - $247,577,000 and IGA Loan #3 - $2,279,950 for a total of
$549,856,950. The County is required to make payments from its Hospitality 1.5% Special
Revenue Fund to repay loans #1 and #2. Loan #3 has been repaid from Admissions Tax revenue.
The County is not obligated to make payments from any other source of funds and the County’s full
faith, credit and taxing power are not pledged in connection with the loans from the State
Infrastructure Bank. The current and long-term portion of outstanding debt service related to the
RIDE project as of June 30, 2013 is $230.1 million. Future debt service payments for the RIDE
project are expected to be $260.1 million.
In June of 2007, the County entered into an Intergovernmental Agreement with the State
Infrastructure Bank in which the County received a funding commitment for the extension of the
Carolina Bays Parkway and the widening of Highway 707 of $150 million from the State
Infrastructure Bank. A portion of the revenue from the Capital Local Option Sales Tax initiative
passed by the voters in 2006, ($93.6 million) serves as the local match for the SIB funds.
Additionally, in November of 2007 the State Infrastructure Bank approved additional funding of $85
million, without a local match requirement, for the extension of the Carolina Bays Parkway due to
increased costs.
xiii
Road Projects
On November 7, 2006, the voters of the County passed a one-cent
Capital Projects Sales Tax that went into effect May 2007, and by state law, will
end seven years later. The County is slated to receive $425.3 million over this
seven-year period to fund the below listed projects.
Estimated Cost
Prioritized Road Projects and status as of July 1, 2013
As presented in referendum
1.
$ 19,600,000
Pave 20 miles of County dirt roads – completed at a cost of
approximately $11.7 million.
2.
$
Resurface 12 miles of County roads – completed at a cost of $923,000.
3.
$ 49,500,000
Construct grade separated interchange at the intersection of U.S. Hwy 17
Bypass and SC Hwy. 707 at the back gate of the Myrtle Beach Air Base –
design and right-of-way acquisition complete; construction approximately
65 percent complete;; construction began in spring 2011. A Federal
Match Grant of $15 million was awarded to this project in fiscal year
2011. Additionally, $1 million of Urban GSATS funds have been allocated
to the project. Current estimate of $121.7 million.
4.
$132,250,000
Widen SC Hwy. 707 from Enterprise Road to the County line including
intersection improvements at SC Hwy 544 – design complete; right-ofway acquisition in progress; initial construction began in spring 2011 but
was halted due to permitting delays; construction has restarted in 2013.
Current estimate of $103.4 million.
5.
$ 25,750,000
Pave 25 miles of County dirt roads – completed at a cost of $10.6 million.
6.
$
Resurface 12 miles of County roads – completed at a cost of $923,000.
7.
$ 46,000,000
Construct Aynor overpass – opened to traffic in August 2012. Current
estimate of $15.97 million.
8.
$ 1,035,000
Resurface 12 miles of County roads – construction began in spring 2011
and is currently 99% complete. Current estimate of $1.035 million.
9.
$ 76,000,000
Widen Glenn’s Bay Road to 3 lanes and construct a grade separated
interchange at US Hwy. 17 Bypass – design complete; right-of-way
acquisition in progress; construction planned for Spring 2014. Current
estimate of $80.1 million.
10. $ 1,080,000
Resurface 12 miles of County roads – construction began in 2012 and is
currently 44% complete. Current estimate of $1.35 million.
11. $27,750,000
Pave 25 miles of County dirt roads; construction began in 2012. Current
estimate of $20.94 million
12. $ 1,125,000
Resurface 12 miles of County roads
915,000
990,000
xiv
13. $ 6,500,000
Pave 2 lanes of International Drive from Carolina Forest to SC Hwy. 90 –
design and right-of-way acquisition underway. Current estimate of $15.5
million.
14. $
682,500
Resurface 7 miles of County roads.
15. $36,100,000
Pave 30 miles of County dirt roads.
With this funding source approved, the County entered into an Intergovernmental
Agreement with the State of South Carolina Department of Transportation (SCDOT) to manage the
improvements to the four SCDOT facilities, i.e. the Backgate Interchange at Highway 17 &
Highway 707; widening Highway 707 to five lanes; construct an Aynor Overpass; and to widen
Glenns Bay Road including an interchange at Highway 17 and Glenns Bay Road.
As of June 30, 2013, the capital project sales tax fund had generated $396.8 million in
revenue. Spending totaled $140.4 million through year end which results in $256.4 million balance
on hand at year end for use in construction on the above projects.
County Council, understanding the need to address road connector/capacity/safety
improvements within the County, tasked staff to develop a list of unimproved connector roads.
Following staff’s presentation and recommendations at the 2006 budget retreat, County Council
approved the following priority list of projects and allocated funding to begin the process of making
the needed improvements to six of the eleven projects on the priority list. An additional $1.3 million
phase for interchange improvements on Carolina Forest Boulevard is scheduled to begin in 2014.
1.Postal Way(1.40 miles) - completed at a cost 7.Hwy 501-90 connector road
of $1,729,327
through Atlantic Center (0.65)
8.Scipio Lane (1.80 miles)
2.River Oaks Blvd. (5.10 miles) - 1st phase
completed at a cost of $2,066,755.
3.Carolina Forest Boulevard (5.70 mi)- 1st
9.Tournament Blvd. (1.50 miles)
phase completed at a cost of $1,897,500
10.Hwy. 707 to Hwy. 17 and Hwy.
4.Hwy. 17 Frontage Rd @ Indigo Creek
17 to Farrow Blvd. within the old
(0.24mi) - completed at a cost of $115,124
5.Glenns Bay Rd widening & interchge(0.43 mi) - Air Base (4.50 mi)
funded by RIDE II
11.Fries Bay Road (3.40 miles)
6. International Drive (4.70 miles) - funded by
RIDE II
xv
A recognized need for the County is direct Interstate
Highway access. The National I-73/I-74/I-75 Association is
actively promoting the need of I-73 to enhance the economic
success and quality of life to our region. Actual construction has
begun on the initial phase of the connection of I-95 to our area.
Environmental work is complete on both the northern and
southern sections and the Federal Highway Administration has
signed the Record of Decision for each. South Carolina
Department of Transportation (the “SCDOT”) has completed the right-of-way plans for the southern
section, and right-of-ways acquisition is underway for the corridor from I-95 to US 501
(approximately 5 miles). TIGER (Transportation Investment Generating Economic Recovery) funds
in the amount of $10 million were received by SCDOT in February 2010 and these funds were
used in August 2011 in Dillon County for a bridge replacement on Catfish Church Road (S-17-63)
over I-95 and widening on US 501 and US 301 near Latta. This work is a portion of the overall I-73
project and is expected to be completed in August, 2013. In April 2011, the SCDOT Commission
approved a bond package for projects statewide, including $105 million for construction of an
approximate 5.7 mile length of I-73 from I-95 to US 501 in Dillon County, including partial
interchanges at I-95 and US 501. The construction plans for this section are complete. Approval of
the bond package by the Joint Bond Review Committee and the State Budget and Control Board is
needed. SCDOT continues to coordinate with the US Army Corps of Engineers on permit review
and approval of the entire I-73 corridor. There is currently no firm timetable for any additional work
on the northern section. The total estimated cost of the entire segment in South Carolina is
approximately $2.4 billion.
Capital Projects Completed and Projects under Construction
In FY 2013, the County constructed its newest boat landing on
the Intracoastal Waterway near the intersection of Highway 17 and
Highway 22 at a cost of $1.35 million. The landing has 46 parking
spots, picnic tables and two boat ramps. The facility was funded as a
cooperative project by the County Transportation Committee, Horry
County Recreation Department, US Fish and Wildlife Services and the
SC Department of Natural Resources.
The County’s Fire/Rescue opened its new Juniper Bay Station 8
joint Fire and EMS on January 12, 2013. This new $1.034 million facility
replaces a thirty year old facility and greatly expands the department’s
response capabilities from this location.
In the FY 2008 budget, County Council approved funding of $12 million for library facilities,
and prioritized its use for libraries in Carolina Forest, North Myrtle Beach, Surfside Beach, Aynor,
and Bucksport. The North Myrtle Beach and Surfside Beach facilities opened in May and October
2011, respectively. The Aynor Library renovation construction was complete and the County
celebrated its grand re-opening in June 2012.
xvi
The Carolina Forest Library was completed in fiscal year 2012
and opened on September 4, 2012. The $4 million Carolina Forest
Library is 20,000 square foot and will host 24 computer stations for the
public to access as well as a public meeting room, a conference room
that can accommodate small groups, a young adult area, and a
separate children’s area, which will include its own programming area
featuring eight computer stations. The library will be handicap
accessible and will feature an enlarged outdoor book return area.
Interior improvements are complete at the Bucksport library
which reopened on April 1, 2013. Library renovations totaling $129,000
include the reconfiguration of space to make more room for 12
computers and more space for programming. The library also received
new carpet, a fresh coat of paint, new furnishings and shelving. Mobile
shelving was also installed, which allows for more space options to
accommodate patrons and various programs that are hosted in the
library. Bucksport Library is the first public library in the state to install
such mobile shelving that will be accessible to the public.
The Horry County Museum project to renovate the Burroughs
School completed during fiscal year 2013 with $6.5 million in
renovations to external and internal foundations and structural systems,
internal finishes, mechanical and environmental systems, and exhibits.
The New Museum reopened November 5, 2013.
The Historic Burroughs School, constructed between 1905 and 1909, is listed on the
National Register of Historic Places. The newly renovated and larger facility has allowed the
Museum to provide bigger exhibits, more nationally recognized traveling exhibits, and public
programming in the auditorium. New exhibits include:
• Photography-a changing gallery that currently features local
photographer Jack Thompson.
• Textiles-another changing gallery that highlights historic sewing
machines, washing machines, quilts and costumes.
• A gallery in honor of the 150th anniversary of the American Civil
War with items from the South Carolina Museum and the 7th
South Carolina Infantry reenactment group.
• A reconstructed waddle and daub Native American house with artifacts from the area.
• Natural History-showcasing native animals including black bears, birds of prey, fossils, and
alligators.
• Grand Strand-An area that tells the story of the 20th Century Grand Strand and our tourism
culture.
• Military History-This exciting new area features a camp similar
to Peter Horry’s campaign tent as well as relics of life from the
Civil War and the history of the Myrtle Beach Air Force Base.
xvii
•
•
Agriculture & Industry-Illustrates the progression of agriculture from naval stores and
turpentine to logging and eventually tobacco cultivation in Horry County.
Open Storage-A home for artifacts that are fascinating but not a part of the themed
galleries.
The County’s Parks and Recreation Departments completed
combined officiating, concession, and restroom facilities at both the
Carolina Forest Softball Complex ($350,000) and the Morris Graham
Park ($364,000)
Information Technology Projects
An additional strategic initiative for our Public Safety Division is an upgrade in its
communication and data systems to a digital platform. Fiscal year 2012 included the purchase of
an upgrade in Motorola computer aided dispatch (CAD) software. This upgrade is currently in the
installation process. The County is evaluating the responses of a request for proposals (RFP) for
both an Enterprise Resource Planning (ERP) and Property Tax Billing systems. This project is
anticipated to require twenty-four (24) months to complete with implementation planned to begin in
January 2014.
Horry County has announced the launch of a new website redesign at
www.horrycounty.org. The redesign includes technological and aesthetic enhancements with
improved navigation, better organization of content that also incorporates current web
technologies. Horry County Information Technology/GIS staff has been working for nine months on
the redesign, which is intended to better meet the needs of customers and visitors by making the
site more functional, cleaner and appealing for site visitors. In addition, the site has been updated
to feature the new branding elements similar to the county’s government access channel that was
introduced in 2012.
Horry County is contracting with Emergency Communications Network, Inc. of Ormond
Beach, Florida, for its “CodeRED” high-speed telephone emergency notification services. The
CodeRED system gives county officials the ability to deliver pre-recorded emergency telephone
notification/information messages to targeted areas or the entire county at a rate of up to 60,000
calls per hour. Implementation is planned for the fall of 2013.
Funding
The County’s Capital Improvement Plan focuses on on-going projects that are to be funded
primarily with pay-as-you go funding, or grants. During 2013, the County issued no additional debt
to fund current year capital needs. Additionally, the County initiated $.46 million of new capital
leases for the acquisition ruggedized laptop computers Public Safety and tractors for Beach
Services. During the Fiscal Year, the County approved up to $.85 million in General Obligation
Bonds for the Hidden Woods Special Tax District that will be issued in Fiscal Year 2014.
xviii
Awards and Acknowledgements
The Government Finance Officers Association of the United States and Canada (GFOA)
awarded a Certificate of Achievement for Excellence in Financial Reporting to Horry County for its
comprehensive annual financial report (CAFR) for the fiscal year ended June 30, 2012. This was
the twenty-sixth consecutive year that Horry County has achieved this prestigious award. In order
to be awarded a Certificate of Achievement, a government must publish an easily readable and
efficiently organized comprehensive annual financial report. This report must satisfy both generally
accepted accounting principles and applicable legal requirements.
A Certificate of Achievement is valid for a period of one year only. We believe that our
current comprehensive annual financial report continues to meet the Certificate of Achievement
Program’s requirements and we are submitting it to the GFOA to determine its eligibility for another
certificate.
In addition, Horry County also received the GFOA’s Distinguished Budget Presentation
Award for its annual budget document dated July 1, 2012 for fiscal year ended June 30, 2013. This
was the twenty-fourth consecutive year that Horry County has received this prestigious award. In
order to qualify for the Distinguished Budget Presentation Award, the government’s budget
document had to be judged proficient as a policy document, a financial plan, an operations guide,
and a communications device.
The preparation of this report could not be accomplished without the efficient and dedicated
services of the staff of the entire Finance Department. A special acknowledgement goes to Ms.
Julie Bilderback, Financial Analyst, and Ms. Pam Hill, Financial Planning and Reporting Manager
for their leadership in this effort. I appreciate the efforts of the staff of Elliott Davis, LLC who
provide technical guidance and assistance. I also express my gratitude to the many County
employees from other departments who support the efforts of the Finance Department in the
preparation of this report. Special appreciation goes to the Horry County Council; the County
Administrator; the Assistant County Administrators, and the Budget Director for their leadership
and support in planning and conducting the financial operations of the County in a fiscally
responsible and progressive manner.
Respectfully submitted,
Barry R Spivey, CPA CGMA
Finance Director
xix
HORRY COUNTY, SOUTH CAROLINA
Mark Lazarus
Chairman
Jody Prince
District 10
W. Paul Prince
District 9
1801
Harold Worley
District 1
Al Allen
District 11
Brent Schulz
District 2
James R. Frazier
District 7
Carl Schwartzkopf
District 8
Marion Foxworth
District 3
Gary Loftus
District 4
Vice Chair
Paul D. Price Jr.
District 5
Bob Grabowski
District 6
05.02.13
MEMBERS OF COUNTY COUNCIL
Mark Lazarus
Gary Loftus
Harold G. Worley
Brent J. Schulz
Marion D. Foxworth, III
Paul D. Price, Jr.
Robert P. Grabowski
James R. Frazier
Carl H. Schwartzkopf
W. Paul Prince
Jody Prince
Al Allen
Chairman
Member, District 4 and Vice Chairman
Member, District 1
Member, District 2
Member, District 3
Member, District 5
Member, District 6
Member, District 7
Member, District 8
Member, District 9
Member, District 10
Member, District 11
_______________________________________
ELECTED OFFICIALS
M. Lois Eargle
Auditor
Melanie Huggins-Ward
Clerk of Court
Robert Edge, Jr.
Coroner
Deirdre W. Edmonds
Judge of Probate
Phillip E. Thompson
Sheriff
Jimmy Richardson
Solicitor Fifteenth Circuit
Roddy Dickinson
Treasurer
_______________________________________
APPOINTED OFFICIALS
Margie Livingston
Pat Hartley
Clif Boyer
Cynthia Graham Howe
Orrie West
Ballery Skipper
Sandy Martin
Wendell Allen
Chief Magistrate
Clerk of Council
Library
Master in Equity
Public Defender Fifteenth Circuit
Register of Deeds
Registration & Election
Veteran’s Affairs
_______________________________________
ADMINISTRATIVE OFFICIALS
Chris Eldridge
Anne Wright
Paul Whitten
Steve Gosnell
Pat Apone
Arrigo Carotti
Rendel Mincey
County Administrator
Assistant County Administrator - Administration
Assistant County Administrator – Public Safety
Assistant County Administrator - Infrastructure
and Regulation
Interim Director Department of Airports
County Attorney
Assessor
As of 11/19/13
1801
FINANCIAL SECTION
INDEPENDENT AUDITOR’S REPORT
AND
MANAGEMENT’S DISCUSSION AND ANALYSIS
INDEPENDENT AUDITOR’S REPORT
To the Honorable Chairman and Members of County Council
Horry County, South Carolina
Report on the Financial Statements
We have audited the accompanying financial statements of the governmental activities, the business-type activities,
each major fund and the aggregate remaining fund information of Horry County, South Carolina (the "County"), as of
and for the year ended June 30, 2013, and the related notes to the financial statements, which collectively comprise
the County’s basic financial statements as listed in the table of contents.
Management’s Responsibility for the Financial Statements
Management is responsible for the preparation and fair presentation of these financial statements in accordance
with accounting principles generally accepted in the United States of America; this includes the design,
implementation, and maintenance of internal control relevant to the preparation and fair presentation of financial
statements that are free from material misstatement, whether due to fraud or error.
Auditor’s Responsibility
Our responsibility is to express opinions on these financial statements based on our audit. We did not audit the
financial statements of Horry County Department of Airports (enterprise fund), Shoreline Behavioral Health
Services, or the Horry County Solid Waste Authority (both discretely presented component units). The Horry
County Department of Airports’ financial statements represent 100 percent of the assets, net assets, and revenues
of the business-type activities. The Shoreline Behavioral Health Services’ and the Horry County Solid Waste
Authority’s financial statements represent 100 percent of the assets, net assets, and revenues of the discretely
presented component units. Those financial statements were audited by other auditors whose reports thereon
have been furnished to us, and our opinion insofar as it relates to the amounts included for the enterprise fund
and both discretely presented component units, is based solely on the reports of the other auditors. We
conducted our audit in accordance with auditing standards generally accepted in the United States of America and
the standards applicable to financial audits contained in Government Auditing Standards, issued by the
Comptroller General of the United States. Those standards require that we plan and perform the audit to obtain
reasonable assurance about whether the financial statements are free from material misstatement.
An audit involves performing procedures to obtain audit evidence about the amounts and disclosures in the
financial statements. The procedures selected depend on the auditor’s judgment, including the assessment of the
risks of material misstatement of the financial statements, whether due to fraud or error. In making those risk
assessments, the auditor considers internal control relevant to the entity’s preparation and fair presentation of
the financial statements in order to design audit procedures that are appropriate in the circumstances, but not for
the purpose of expressing an opinion on the effectiveness of the entity’s internal control. Accordingly, we express
no such opinion. An audit also includes evaluating the appropriateness of accounting policies used and the
reasonableness of significant accounting estimates made by management, as well as evaluating the overall
presentation of the financial statements.
We believe that the audit evidence we have obtained is sufficient and appropriate to provide a basis for our audit
opinions.
Elliott Davis LLC | www.elliottdavis.com
Opinions
In our opinion, based on our audit and the reports of other auditors, the financial statements referred to above
present fairly, in all material respects, the respective financial position of the governmental activities, the businesstype activities, the aggregate discretely presented component units, each major fund and the aggregate remaining
fund information of the County as of June 30, 2013, and the respective changes in financial position and, where
applicable, cash flows thereof for the year then ended in accordance with accounting principles generally accepted
in the United States of America.
Other Matters
Required Supplementary Information
Accounting principles generally accepted in the United States of America require that the management’s
discussion and analysis and the required supplementary information, consisting of the budgetary comparison
schedules – general fund, required supplementary information for governments that use the modified approach
for infrastructure assets, and the schedule of funding progress for other post employment benefits plan, be
presented to supplement the basic financial statements. Such information, although not a part of the basic
financial statements, is required by the Governmental Accounting Standards Board, who considers it to be an
essential part of financial reporting for placing the basic financial statements in an appropriate operational,
economic, or historical context. We and other auditors have applied certain limited procedures to the required
supplementary information in accordance with auditing standards generally accepted in the United States of
America, which consisted of inquiries of management about the methods of preparing the information and
comparing the information for consistency with management’s responses to our inquiries, the basic financial
statements, and other knowledge we obtained during our audit of the basic financial statements. We do not
express an opinion or provide any assurance on the information because the limited procedures do not provide us
with sufficient evidence to express an opinion or provide any assurance.
Other Information
Our audit was conducted for the purpose of forming opinions on the financial statements that collectively
comprise the County’s basic financial statements. The introductory section, combining and individual major and
nonmajor fund financial statements, budgetary comparison major and nonmajor fund financial schedules, capital
asset schedules, fines, assessments, and surcharges schedule, capital project sales tax budgetary schedule, general
improvements capital project budgetary schedule, and statistical section are presented for purposes of additional
analysis and are not a required part of the basic financial statements. The schedule of expenditures of federal
awards is presented for purposes of additional analysis as required by U.S. Office of Management and Budget
Circular A-133, Audits of States, Local Governments, and Non-Profit Organizations, and is also not a required part
of the basic financial statements.
The combining and individual major and nonmajor fund financial statements, budgetary comparison major and
nonmajor fund financial schedules, capital asset schedules, fines, assessments, and surcharges schedule, capital
project sales tax budgetary schedule, general improvements capital project budgetary schedule, and the schedule
of expenditures of federal awards are the responsibility of management and were derived from and relate directly
to the underlying accounting and other records used to prepare the basic financial statements. Such information
has been subjected to the auditing procedures applied in the audit of the basic financial statements and certain
additional procedures, including comparing and reconciling such information directly to the underlying accounting
and other records used to prepare the basic financial statements or to the basic financial statements themselves,
and other additional procedures in accordance with auditing standards generally accepted in the United States of
America by us and other auditors. In our opinion, based on our audit, the procedures described above, and the
report of other auditors, the combining and individual major and nonmajor fund financial statements, budgetary
comparison major and nonmajor fund financial schedules, capital asset schedules, fines, assessments, and
surcharges schedule, capital project sales tax budgetary schedule, general improvements capital project budgetary
schedule, and the schedule of expenditures of federal awards are fairly stated, in all material respects, in relation
to the basic financial statements taken as a whole.
2
The introductory and statistical sections have not been subjected to the auditing procedures applied in the audit
of the basic financial statements and, accordingly, we do not express an opinion or provide any assurance on
them.
Other Reporting Required by Government Auditing Standards
In accordance with Government Auditing Standards, we have also issued our report dated December 4, 2013 on
our consideration of the County’s internal control over financial reporting and our tests of its compliance with
certain provisions of laws, regulations, contracts, grant agreements and other matters. The purpose of that report
is to describe the scope of our testing of internal control over financial reporting and compliance and the results of
that testing, and not to provide an opinion on the internal control over financial reporting or on compliance. That
report is an integral part of an audit performed in accordance with Government Auditing Standards in considering
the County’s internal control over financial reporting and compliance.
Charleston, South Carolina
December 4, 2013
3
Management’s Discussion and Analysis
Management’s Discussion and Analysis provides a narrative overview and analysis of the
County’s financial activities for fiscal year ended June 30, 2013. We encourage readers to consider the
information presented here in conjunction with the basic financial statements and additional information
furnished in our Letter of Transmittal, which can be found on the pages prior to this report.
FINANCIAL HIGHLIGHTS
•
•
•
•
•
•
The Statement of Net Position reflects total assets of $1.53 billion. This represents an $70.2
million increase from fiscal year 2012. Capital assets increased $50.4 million due primarily to
spending for new construction including $44.3 million for the expansion of the airport, $10.9
million in construction of road improvements, $5.5 million in construction of the museum, $1.3
million in construction of Highway 22 boat landing, $1.0 million in construction for fire stations,
1.1 million in construction for park and recreation centers, $.5 million in construction for libraries,
and $4.9 million in light and heavy fleet equipment. The spending for new construction is
reduced by depreciation during the year of $24.4 million and asset disposals of $1.4 million.
Total liabilities decreased $37.6 million from fiscal year 2012. During fiscal year 2013, payments
on existing County bond obligations totaled $37.3 million including $24.3 million for RIDE debt
with the State Infrastructure Bank.
Total net position of the County totaled $1.02 billion at June 30, 2013 and increased by $109.3
million from fiscal year 2012. Net investment in capital assets increased $48.2 million.
Restricted net position decreased $18.2 million due primarily to the business-type activities
$14.7 million utilization of funds held for capital projects. In addition, restricted net position for
governmental activities decreased $6.1 million as the reserves for RIDE Debt Service of $48.0
million reduces its related debt. Restricted funding for capital projects increased $37.4 million
from growth in revenue accumulated for future construction expenditures. Governmental
activities represent $774.0 million of net position and the business-type activities represent
$245.5 million.
At June 30, 2013, fund balance for the General Fund was $40.0 million or 32.5 percent of total
General Fund expenditures, compared to $36.7 million or 30.1 percent for the previous year.
The fiscal year 2013 budget anticipated using $10.6 million of fund balance. Actual results
reflect a $3.3 million increase in fund balance due primarily to an $8.3 million expenditure
savings.
Property tax revenue for the General Fund for fiscal year 2013 was $74.9 million compared to
$73.5 million for fiscal year 2012, an increase of 1.9 percent.
Tourism related revenues, primarily used to fund infrastructure and related debt service,
reflected positive growth in fiscal year 2013 as Capital Project Sales Tax increased 1.2 percent
to $66.2 million and Hospitality Fees increased 1.2 percent to $38.9 million.
OVERVIEW OF THE FINANCIAL STATEMENTS
The County’s financial statements focus on the County as a whole, and on major individual
funds. “Funds” are self-balancing sets of accounts that account for specific financial activities that may
be regulated, restricted or limited in various ways. This discussion and analysis is intended to serve as
an introduction to the County’s basic financial statements. The County’s basic financial statements are
comprised of three components - 1) government-wide financial statements, 2) fund financial
statements, and 3) notes to the financial statements. This report also contains other required and nonrequired supplementary information in addition to the basic financial statements themselves.
GOVERNMENT-WIDE FINANCIAL STATEMENTS
The government-wide financial statements report information about the County as a whole using
accounting methods similar to those used by private-sector companies. These statements are
4
designed to be corporate-like in that all governmental and business-type activities are consolidated into
columns, which present a total for the primary government.
The Statement of Net Position includes all of the County’s assets and liabilities, with the
difference between the two reported as net position. This statement combines and consolidates
governmental funds’ current financial resources (short-term spendable resources) with capital assets
and long term obligations. Net position are the difference between the County’s assets and its liabilities.
All of the current year’s revenues and expenses are accounted for in the statement of activities
regardless of when cash is received or paid. Therefore, this statement includes some items that will
impact cash flows in future fiscal periods, such as collections of delinquent taxes and the use of earned
leave time. This statement is focused on both the gross and net cost of various functions (including
governmental, business-type, and component units), which are supported by the government’s general
tax and other revenues. This statement presents information showing how the government’s net
position changed during the most recent fiscal year.
These two government-wide statements report the County’s net position and how they have
changed. Net position, the difference between the County’s assets and liabilities, measure the
County’s financial position. Over time, increases or decreases in net position may serve as a useful
indicator of whether the financial position of the County is improving or deteriorating.
The government-wide financial statements of the County are divided into three categories:
• Governmental activities are functions that are principally supported by taxes and
intergovernmental revenues. Most of the County’s basic services are included here, such as
police, fire, public works, parks and recreation, and general administration. Property taxes and
state and federal grants finance most of these activities.
• Business-type activities are functions that are intended to recover all or a significant portion of
the costs through user fees and charges. The County’s Department of Airports is reported here.
• Component units are separate legal entities for which the County is financially accountable and
for which the nature and significance of their relationship with the primary government are such
that exclusion could cause the County's financial statements to be misleading or incomplete.
Shoreline Behavioral Health Services and the Horry County Solid Waste Authority are
component units of the County.
The government-wide financial statements can be found on pages 22 through 25 of this report.
FUND FINANCIAL STATEMENTS
The fund financial statements provide more detailed information about the County’s most
significant funds, not the County as a whole. A fund is a grouping of related accounts that is used to
maintain control over resources that have been segregated for specific activities or objectives. Some
funds are required by State law and by bond covenants. The County uses other funds to control and
manage money for particular purposes or to demonstrate compliance with the use restrictions
associated with certain taxes and grants.
All of the County’s funds are grouped in the following three categories: governmental funds,
proprietary funds, and fiduciary funds.
Governmental funds are used to account for essentially the same functions reported as
governmental activities in the government-wide financial statements. Unlike the government-wide
financial statements, which report total financial position, the governmental fund financial statements
focus only on near-term inflows and outflows of spendable resources, as well as presenting spendable
resources available at the end of the fiscal year. This information is useful in determining a
government’s near-term financing requirements.
5
Because the focus of governmental funds is narrower than that of the government-wide financial
statements, it is useful to compare the information presented for governmental funds with similar
information presented for governmental activities in the government-wide financial statements. By
doing so, readers may better understand the long-term impact of the government’s near-term financing
decisions. Both the governmental fund balance sheet and the governmental fund statement of
revenues, expenditures, and changes in fund balances provide reconciliations to facilitate this
comparison between governmental funds and governmental activities.
The County maintains four major governmental funds. Information is presented separately in
the governmental fund balance sheet and in the governmental fund statement of revenues,
expenditures, and changes in fund balance for the General Fund, General Improvement Capital
Projects Fund, Capital Project Sales Tax Fund, and RIDE Program Debt Service Fund, which are
considered to be the major funds. Data for the other twenty-seven (27) governmental funds are
combined into a single, aggregated presentation. Individual fund data for each of these non-major
governmental funds is provided in the form of combining statements in the supplementary information
section of this report.
During fiscal year 2011, the County implemented Government Accounting Standards Board
(GASB) Statement No. 54 – Fund Balance Reporting and Governmental Fund Type Definitions. A new
classification hierarchy is established by this Statement based primarily on the extent to which a
government is bound to observe constraints imposed upon the use of its resources reported in
government funds. Prior classification of fund balance as Reserved and Unreserved are replaced with
classifications of Nonspendable, Restricted, Committed, Assigned, and Unassigned. Note 1 to the
Financial Statements provides the County’s accounting policy for determining fund balance
classification assignment. Additionally, this Statement provides guidance for governmental fund type
definitions. Implemented within these financial statements is a consolidation of several special revenue
funds (Hospitality 1.5%, Hospitality 1%, and Local Accommodations) with the fund primarily utilizing
those revenues for enhanced clarity in the source and uses of those financial resources.
The County adopts an annual appropriated budget for its general fund, special revenue funds,
and debt service funds. The general improvement capital projects funds adopt project length budgets.
Additionally, budgetary controls are maintained for certain proprietary fund types.
Proprietary funds provide the same type of information as the government-wide financial
statements, only in more detail. The County maintains two different types of proprietary funds.
Enterprise funds are used to account for operations (a) that are financed and operated in a
manner similar to private business enterprises – where the intent of the governing body is that the costs
(expenses, including depreciation) of providing goods or services to the general public on a continuing
basis will be financed or recovered primarily through user charges; or (b) where the governing body has
decided that periodic determination of revenues earned, expenses incurred, and/or net income is
appropriate for capital maintenance, public policy, management control, accountability, or other
purposes. The Enterprise Fund reports the activities of the Department of Airports.
Internal Service Funds are used to account for operations that provide goods and services to
other departments or agencies of the primary government, or to other governments on a costreimbursement basis. The County’s Internal Service Fund reports the activities of Fleet Services, which
accounts for the maintenance and replacement of all county vehicles including heavy equipment and
light equipment. Because these services predominantly benefit governmental rather than businesstype functions, the activities of the Fleet Services Fund have been included within governmental
activities in the government-wide financial statements.
Fiduciary funds are used to account for resources held for the benefit of parties outside the
government. They are custodial in nature and therefore do not measure the results of operations, and
6
consist primarily of property taxes and other revenues collected, temporarily retained and distributed by
the County Treasurer to other governments or agencies.
NOTES TO THE FINANCIAL STATEMENTS
The notes to the financial statements provide additional information that is essential to a full
understanding of the data provided in the government-wide and fund financial statements. The notes to
the financial statements can be found on pages 39 through 99 of this report.
OTHER INFORMATION
In addition to the basic financial statement notes, this report also contains certain required
supplementary information. This information includes a budgetary comparison schedule for the General
Fund, information relating to the condition rating and actual rating and actual maintenance/preservation
of the County’s road infrastructure and the Department of Airport’s infrastructure as well as the funding
status of the County’s post employment benefit obligation.
GOVERNMENT-WIDE FINANCIAL ANALYSIS
As noted earlier, net position may serve over time as a useful indicator of a government’s
financial condition and position. In the case of the County, as reflected in the primary government
funds, assets exceeded liabilities and deferred inflows of resources by $1.02 billion at the close of the
fiscal year ended June 30, 2013.
At the end of fiscal year 2013, the County reported the following Net Position:
Horry County’s Net Position
(amounts expressed in thousands)
Current and Other Assets
Capital Assets, net
Total Assets
Current Liabilities
Long-term Liabilities
Total Liabilities
Deferred Inflows of Resources:
Unavailable revenueService concession arrangement
Total deferred inflows of resources
Net Position:
Net investment in capital assets
Restricted
Unrestricted (deficit)
Total Net Position
Governmental
Business-type
Activities
Activities
2013
$ 497,188
703,547
1,200,735
84,134
342,645
426,779
Total
2012
2013
2012
$ 453,092 $ 98,366 $ 122,636
696,020
229,217
186,357
1,149,112
327,583
308,993
83,528
14,669
14,597
62,569
62,057
381,450
464,978
77,238
76,654
593,157
343,178
(162,379)
$ 773,956 $
576,387
348,119
(240,372)
684,134 $
4,792
4,792
6,230
6,230
169,529
32,929
43,095
245,553
138,123
45,038
42,948
$ 226,109
$
2013
595,554
932,764
1,528,318
98,803
405,214
504,017
2012
$ 575,728
882,377
1,458,105
98,125
443,507
541,632
4,792
4,792
6,230
6,230
762,686
714,510
376,107
393,157
(119,284) (197,424)
$ 1,019,509 $ 910,243
Net Position of the County’s governmental activities increased 13.1 percent from $684.1 million
to $774.0 million. Net investment in Capital Assets and Restricted Net Position of the County’s
governmental activities increased 1.2 percent to $936.3 million at year end. Net investment in Capital
Assets and Restricted Net Position of the County’s governmental activities are restricted as to the
purpose for which they can be used or are invested in capital assets (buildings, roads, bridges, and so
on). The County continues to invest in needed capital improvements and provides for a large portion of
7
annual capital needs without the use of debt thereby increasing Net Position. Restricted Net Position
include $256.4 million excess Capital Project Sales Tax revenues over expenditures. The funds are
restricted to specific projects and have accumulated due to permitting delays for several major road
projects. As projects are completed, the expenditures will exceed revenue in subsequent years and
utilize this accumulated excess over the next several years.
Unrestricted Net Position reflected a $162.4 million deficit at the end of this year. This deficit is
primarily the result of the County’s long term debt payable for new roads which are not recorded as
County assets because they are State roads, not County roads. In 1996, the County partnered with the
State of South Carolina in the RIDE (Road Improvement and Development Effort) program which pairs
funding provided at the local level with funding provided by the State of South Carolina in order to
facilitate transportation improvements within the County. The RIDE program debt is repaid from a 1.5%
county-wide Hospitality Fee enacted locally in 1997. The decrease in the deficit in governmental
activities Unrestricted Net Position from June 30, 2012 to June 30, 2013 of $31.2 million is primarily
attributed to the reduction in the RIDE loans payable of $24.3 million reduced with the use of funds set
aside for capital projects of $4.6 million and the increase in long term liability for employee benefits of
$.7 million. Net position does not represent the County’s position regarding spending, which is
presented in the governmental fund statements.
The Net Position of our business-type activities increased 8.6 percent from $226.1 million in
2012 to $245.6 million in 2013. This increase resulted from positive non-operating revenues and federal
and state restricted capital project grant revenues.
The total fund balances for governmental funds was $414.3 million at the end of fiscal year
2013. Capital assets are not reported in these funds because they are not financial resources, and are
not available to pay for current period expenditures. Capital assets as of June 30, 2013, which are not
included in this fund balance totaled $703.6 million. Long-term liabilities of $342.7 million are not due
and payable in the current period and therefore are also not reported in these funds. A majority of the
long-term liabilities, $203.7 million, is the long-term portion due on the RIDE Intergovernmental
Agreements. Under these agreements, the County partnered with the State in receiving $550 million in
loans for road construction in order to meet the infrastructure needs of the County. The County agreed
to deposit all receipts of the 1.5 percent portion of its county-wide Hospitality Fee into a Loan Servicing
Account at the State Transportation Infrastructure Bank. The State Transportation Infrastructure Bank
has provided the funding for various road construction projects in the County through these loans,
which the County is repaying with the 1.5% Hospitality Fee. The constructed roads are State roads and
are therefore not reflected in capital assets of the County. In accordance with the RIDE
Intergovernmental Agreements, the State Treasurer can withhold funds allotted or appropriated by the
State to the County and apply those funds to make or complete the required debt service payments
should the 1.5 percent portion of the Hospitality Fee not meet the debt service requirements. The
citizens of the County have benefited from the construction of these roads that otherwise would not
have been possible without the enactment of the Hospitality Fee in January 1997. As of June 30, 2013,
the County has remitted to the State Transportation Infrastructure Bank approximately $48.0 million of
1.5% Hospitality Fees collected in excess of the amount required to meet the scheduled debt service
payments. This amount is held in an interest-bearing reserve account by the State Transportation
Infrastructure Bank and equates to over one year’s debt service requirement.
8
Governmental activities
Governmental activities increased the County’s Net Position during the year by $89.8 million.
This increase was primarily attributable to revenues from Capital Projects Sales Tax and 1.5%
Hospitality Fee used in capital projects and debt reduction along with increased revenues in real
property and vehicle taxes, Cable TV fees and increased funding from the state LGF. Key elements of
this increase are as shown below.
Horry County’s Changes in Net Position
(amounts expressed in thousands)
Governmental
Business-Type
Activities
2013
Revenues:
Program Revenues:
Fees for services
$ 46,287
Operating Grants and Contributions
4,207
Capital Grants and Contributions
4,899
General Revenues: Property Taxes,
Shared Rev and Unallocated
201,863
Other
50,912
Total Revenues
308,168
Expenses:
General Government
33,488
Public Safety
99,823
Infrastructure and Regulation
27,786
Improvements to state roadways
25,118
2,753
Health and Social Services
Culture, recreation and tourism
11,376
Economic Development
2,882
HGTC and Higher Education Com.
4,635
Debt Service
10,485
Airports
Total Expenses
Increase in Net Position
Net Position – July 1
Net Position – June 30
Total
Activities
2012
2013
2012
$ 42,179
2,368
6,726
$ 24,433
2,424
14,565
192,851
50,395
294,519
504
41,926
33,091
106,451
28,236
15,722
2,659
10,523
3,555
4,547
9,652
218,346
89,822
684,134
$ 773,956
$ 68,020
7,088
19,675
603
44,113
201,863
51,416
350,094
192,851
50,998
338,632
-
-
33,488
99,823
27,786
25,118
2,753
11,376
2,882
4,635
10,485
33,091
106,451
28,236
15,722
2,659
10,523
3,555
4,547
9,652
214,436
80,083
22,482
22,482
19,444
19,834
19,834
24,279
22,482
240,828
109,266
19,834
234,270
104,362
604,051
$684,134
226,109
$245,553
201,830
226,109
910,243
$1,019,509
805,881
$910,243
$
25,841
4,720
12,949
$
2012
70,720
6,631
19,464
9
$
2013
Program Revenues and Expenses – Governmental Activities
Program Revenues by Function
(Fees for Service, Operating Grants and Contributions,
and Capital Grants and Contributions)
25,000
2013
2012
20,000
15,000
10,000
5,000
-
General Government
Public Safety
Infrastructure and
Regulation
Other
Program revenues in governmental activities increased $4.1 million for fiscal year 2013.
Program revenues are comprised of Fees for Services, Operating Grants and Contributions, and
Capital Grants and Contributions. In 2013, Fees for Services increased by $4.1 million from Cable TV,
Planning, Business licenses, Building Inspection Permits, EMS fees and RMC Fees. as lower revenues
were generated through the Master in Equity and Magistrate Courts. Grants and Contributions of $9.1
million were stable.
120,000
Program Expenses by Function
100,000
2013
80,000
2012
60,000
40,000
20,000
-
General
Government
Public Safety
Infrastructure Improvements to
and Regulation State Roadways
Other
Debt Service
Program expenses in governmental activities increased $3.9 million due primarily to $9.4 million
for improvements to state roadways funded through the Capital Project Sales Tax and Road
Maintenance/CTC funds. Current year spending decreased $6.6 million in public safety expenditures
primarily in the Capital Projects Fund as the prior year had completed the Detention Center and
10
communications upgrades. Current year spending on debt service and in additional operating costs for
recreation facilities increased and were offset by decreases in transportation projects and economic
development.
Revenues by Source - Governmental Activities
250,000
FY 2013
200,000
FY 2012
150,000
100,000
50,000
-
Charges for Services
Property Taxes, Shared Revenue
& Unallocated Intergovernmental
Other
Revenues in the governmental activities increased $13.6 million for fiscal year 2013 which
include the increases noted above in Program Revenues of $4.1 million, increases in property taxes
and fees–in-lieu of taxes of $3.5 million, General Revenues of $1.9 million (Capital Projects Sales Tax),
Intergovernmental-unrestricted of $3.5 million (LGF and Capital Projects Fund boat landing funding
from State) and Other Revenue of $.5 million (Hospitality Fees).
Business-type activities
Business-type activities increased the County’s net position by $19.4 million, primarily the result
of capital grant revenues and other non-operating revenues.
Revenues and Expenses: Business-Type
Activities
50,000
45,000
Revenues
40,000
Expenses
35,000
30,000
25,000
20,000
15,000
10,000
5,000
-
2013
2012
FINANCIAL ANALYSIS OF THE COUNTY’S FUNDS
As noted earlier, the County uses fund accounting to ensure and demonstrate compliance with
finance-related legal requirements, as well as the restrictions on the use of certain revenues.
Governmental funds
The focus of the County’s governmental funds is to provide information on near-term inflows,
outflows, and balances of spendable resources. Such information is useful in assessing the County’s
11
financing requirements. In particular, committed and unassigned fund balance may serve as a useful
measure of a government’s net resources available for spending at the end of the fiscal year.
As of the end of fiscal year 2013, the County’s governmental funds reported combined ending
fund balances of $414.3 million, an increase of $43.6 million from the prior year. Unassigned Fund
Balance which is undesignated in the governmental funds of $7.1 million is available for spending at the
County’s discretion. The remainder of the Fund Balance is restricted and nonspendable, to indicate
that it is not available for new spending or committed and assigned because it has already been
identified for a specific purpose.
Horry County's Governmental Funds Ending Fund
Balance
(amounts expressed in thousands)
2013
Nonspendable
Inventory and prepaid
Restricted
Debt service
Capital
Other
Committed
Stabilization
Future general fund budget
Economic development
Capital
Other
OPEB
Assigned
Other purposes
Unassigned
Total
$
$
1,994
2012
$
189
Variance
$
1,805
61,326
257,388
45,964
61,755
224,517
35,463
(429)
32,871
10,501
19,327
7,058
1,960
3,663
7,132
896
18,479
8,371
4,159
11,492
343
848
(1,313)
(2,199)
(7,829)
7,132
553
474
7,138
414,320
5,974
370,742
474
1,164
43,578
$
$
The General Fund, General Improvements Capital Projects Fund, Capital Projects Sales Tax
Fund, and the RIDE Program Debt Service Fund are reported as major funds.
General Fund
The General Fund is the chief operating fund of the County. At the end of fiscal year 2013, total
Fund Balance reached $40.0 million. Council committed $27.5 million of fund balance for a fiscal
stabilization reserve ($19.3 million) and use in the fiscal year 2013 budget ($8.2 million). An additional
$473,501 is assigned resulting in an Unassigned Fund Balance of $8.3 million. As a measure of the
General Fund’s liquidity, it may be useful to compare both Unassigned Fund Balance and total Fund
Balance to total fund expenditures. Unrestricted Fund Balance represents 30.1 percent of the total
General Fund expenditures, while total fund balance represents 32.6 percent of that same amount.
The Fund Balance of the General Fund increased by $3.3 million during the current fiscal year.
This increase is a result of revenues over budget of $5.5 million coupled with positive expenditure
savings to budget of $8.3 million. Due to deliberate measures to control spending, the expected use of
$10.6 million from Fund Balance, as anticipated in the budget, was not needed to fund FY 2013
operations.
12
Net change in fund balance
(amounts expressed in thousands)
Planned use of fund balance
$ (10,602)
Revenues over budget
Expenditures under budget
Other Financing Sources (Uses) under budget
Net budget savings from the General Fund
$
Net change in Fund Balance from FY 2012
$
5,508
8,338
56
$ 13,902
3,300
The following chart shows the increases and decreases in revenue, expenditures and other
financing sources (uses) for fiscal year 2013 when compared to the revenue, expenditure and other
financing sources (uses) reported for fiscal year 2012. The revenue, expenditure and other financing
sources (uses) activity for fiscal year 2013 generated a net increase in Fund Balance of $3.3 million in
the General Fund.
Comparison of FY 2013 General Fund Results to FY 2012
(amounts expressed in thousands)
Increase in Property Taxes, primarily vehicle due to increased values & billings
Increase in Intergovernmental Revenue, primarily from increased State-shared LGF revenue &
federal prisoner housing
Increase in Fees and Fines, primarily from Cable TV fee franchise fee increase & change to
quarterly payments
Increase in Register of Deeds Documentary Stamps, due to increased instruments filed
Increase in Licenses and Permits, primarily due to increased residential building permits and
business licenses collections
Decrease in Cost Allocations, decreased central service allocations to other funds
Inrease in Other Revenues, primarily from increased casino boat fees and delinquent tax overage
Increase in net Other Financing Sources (Uses), primarily due to a transfer out to the Economic
Development Fund a decrease in transfers in from the Road/CTC and the Capital Projects fund.
Increase in Expenditures, primarily due to increased operational cost at the Library, Museum,
EMS, Legal and overall department overhead; decreased funding for MBREDC
Net increase in General Fund results compared to FY 2012 results
Net decrease in fund balance from FY 2012 General Fund results
Net increase in the fund balance of the General Fund from FY 2012 results
$
1,392
2,065
2,407
423
807
(381)
1,001
(3,007)
(1,045)
3,662
(362)
$ 3,300
RIDE Program Debt Service Fund
The County receives a 1.5% Hospitality Fee assessed county-wide on accommodations,
prepared foods, beverages and admissions. The proceeds of this fee, after payment of an
administrative fee to the General Fund, are pledged to repay the RIDE debt owed to the State
Infrastructure Bank. These fees are recorded as revenue in the RIDE Program Debt Service Fund and
used to fund the debt service payments. Due to the growth in tourism in recent years, the Hospitality
Fees have exceeded the required debt service and the County has remitted approximately $48.0 million
to the State Infrastructure Bank (SIB) above the amount required for the scheduled debt. That amount,
plus the amount collected but not yet remitted at year end and Hospitality Fee collections in July 2013
13
on sales that occurred during the month of June, make up the fund balance in this fund. Hospitality
Fees and investment earnings total $33.5 million in 2013. This is a $290,431 increase over the prior
fiscal year. Expenditures of $31.7 million reflect the RIDE debt service for the year. Debt Service is
programmed to increase over the next four years and is projected to utilize a portion of the accumulated
Fund Balance.
Horry County's RIDE Program Debt Service
Fund
(amounts expressed in thousands)
Fund Balance, July 1, 2012
$ 46,548
Revenues
Expenditures
Other Financing Sources (Uses)
Net change in Fund Balance FY 2013
33,504
(31,738)
(319)
1,448
Fund Balance, June 30, 2013
$ 47,995
Deposited with SIB, June 30, 2013
$ 40,336
General Improvement Capital Projects Fund and the Capital Project Sales Tax Fund
The General Improvement Capital Projects Fund reflects the funding sources and the
expenditures for the County’s general government capital improvements, excluding those reported in
the Capital Projects Sales Tax and the Grants Fund. Primary funding sources are debt proceeds,
transfers in as pay-as-you go funding, and interest earnings. During fiscal year 2013, $460,300 in lease
financing was initiated to fund various equipment needs. The fund balance of $8.8 million at June 30,
2013 reflects the resources previously funded and available to complete the capital projects currently in
process.
Horry County's General Improvement
Capital Project Fund
(amounts expressed in thousands)
Fund Balance, July 1, 2012
$ 10,445
Revenues
Expenditures
Other Financing Sources (Uses)
Net change in Fund Balance FY 2013
Fund Balance, June 30, 2013
2,502
(5,610)
1,417
(1,692)
$
8,753
The Capital Projects Sales Tax Fund reports the revenue from a one cent sales tax which
County businesses began collecting in May 2007, as well as the related expenditures for the road
projects that were approved by referendum in November 2007. Sales tax and Interest revenue
increased $.8 million or 1.2 percent in fiscal year 2013 to a total of $66.2 million. Total receipts life to
date of the program through June 30, 2013 are $377.2 million. The program places a cap of $425.3
million on total receipts which are estimated to fully fund the approved infrastructure. The County has
chosen a pay-as-you-go basis for expenditures and maintains in fund balance the excess of revenues
over expenditures to date for the projects. Expenditures for 2013 total $32.6 million and includes
construction of $25.1 million on State roadways and $7.5 million on County roadways. The excess of
revenues over expenditures of $33.7 million in 2013 increases the accumulated fund balance to $256.4
million. The funds are restricted to specific projects and have accumulated due to permitting delays for
14
several major road projects. As projects are completed, the expenditures will exceed revenue in
subsequent periods and utilize this accumulated excess over the next several years.
Horry County's Capital Project Sales Tax
Fund
(amounts expressed in thousands)
Fund Balance, July 1, 2012
$ 222,792
Revenues
Expenditures
Net change in Fund Balance FY 2013
66,248
(32,592)
33,656
Fund Balance, June 30, 2013
$ 256,449
Proprietary funds
The County’s proprietary funds provide the same type of information found in the governmentwide financial statements, but in more detail. All proprietary funds are reported as major funds. Net
Position of proprietary funds at the end of the year amounted to $276.8 million. The Department of
Airports reflects a $19.4 million or 8.6 percent increase in 2013. This increase resulted from positive
non-operating revenues and federal and state restricted capital project grant revenues. The Internal
Service Fund provides for the repair and replacement of the County’s light and heavy equipment fleet
with the exception of heavy fire apparatus. Net Position includes the undepreciated cost of the covered
fleet vehicles in service of $13.4 million at June 30, 2013. This reflects a $1.8 million increase during
the year including $4.5 million of assets purchased, less $3.9 million for annual depreciation and assets
disposals. The remaining Fund Balance of $17.8 million is restricted for future replacement of the
covered equipment.
Horry County’s Proprietary Funds Net Position
(amounts expressed in thousands)
Internal
Department
Service Fund
of Airports
2013
Net investment in capital
assets
Restricted for:
Debt Service
Capital
Unrestricted
Total net position
2012
2013
2012
Total
2013
2012
$169,529 $138,123 $ 13,448 $12,526 $182,977 $150,649
16,926
16,003
43,095
14,298
30,740
42,948
17,815
-
16,973
-
16,926
33,818
43,095
14,298
47,713
42,948
$245,553 $226,109 $ 31,263 $29,499 $276,816 $255,608
Other factors concerning the finances of these funds have been addressed in the discussion of
the County’s business-type activities.
General Fund Budgetary Highlights
The final budgeted revenues were adjusted for budgetary amendments that netted to an
increase of $1.8 million from the original budget. These increases were reflected in intergovernmental
revenues for increased funding from the State Local Government Fund and a new prisoner housing
agreement with the federal government.
15
The final budgeted expenditures and transfers out were increased by $4.1 million over the
original budget. The primary reason for these expenditure budget adjustments was $2.3 million in the
roll-forward of certain prior year budgets, including a $1.07 million transfer of restricted funds to the
Economic Development Fund, $500,000 additional for OPEB, $146,000 in enhancements to the
Detention Center transport program, $360,000 employee Christmas gift, $95,000 for additional
positions, and $499,000 in additional contingency.
Considering these budget amendments, General Fund revenues were more than the final
budget by $5.5 million and expenditures were less than the final budget by $8.3 million.
The major differences between the final budget and the actual amounts for both revenue and
expenditures are summarized as follows:
• Property taxes were higher than budget by $1.2 million. Increases were experienced in fees-in-lieu of
taxes of $63,000 and prior year tax collections of $418,000. Increases in vehicle taxes of $869,000
offset the budget shortfall in personal property of $150,000.
• Intergovernmental revenues were higher than the budget by $2.1 million primarily due to an increase
in the state funding from the Local Government Fund and increased housing of federal prisoners.
• Fees and fines were over budget by $2.4 million, primarily due to a one-time change in the receipt of
Cable TV fees along with a 1% increase in franchise fees being $2.0 above budget, coupled with
lower Master in Equity fees due to a decrease in forfeiture cases.
• RMC Documentary Stamps were over budget by $479,000 due to increased values of real estate
transactions.
• Licenses and permits were over budget by $.9 million, due to higher building inspection permits and
business licenses.
• Cost allocation was under budget by $219,000 due to reduced central service costs and changes in
basis allocations.
• Other revenue was under budget by $.9 million due to higher Casino Boat fees and increased
miscellaneous revenues.
• Various departmental spending was reduced below budgeted amounts as a result of management
controls on hiring and spending. The largest departmental savings are detailed in the table below:
16
Horry County's General Fund Budget to
Actual Variance
(amounts expressed in thousands)
Final
(Favorable)
Budget
Public Works
$
Detention Center
Department Overhead
County Council
Police
Code Enforcement
Maintenance
Library
County Engineer
IT/GIS
Assessor
Grants Administration
Solicitor
Planning
Registrar of Deeds
County Administrator
Finance
Legal
Actual
8,941 $
7,433 $
20,734
19,619
4,745
3,835
1,619
940
17,194
16,715
2,828
2,354
4,700
4,244
4,243
3,836
1,318
982
6,205
5,945
3,222
2,966
250
37
5,299
5,104
1,617
1,438
1,050
909
338
210
1,370
1,244
847
734
$
Total of above
Various other departments (under) budget
$
Total expenditures (under) budget
Variance
(1,508)
(1,115)
(910)
(679)
(479)
(474)
(456)
(407)
(336)
(260)
(256)
(213)
(195)
(179)
(141)
(128)
(126)
(113)
(7,975)
(641)
(8,616)
Capital Assets and Debt Administration
Capital Assets
The County’s investment in capital assets for its governmental and business-type activities as of
June 30, 2013 amounts to $932.8 million (net of accumulated depreciation). This investment in capital
assets includes land, buildings, improvements (other than buildings), leasehold improvements,
equipment, intangible assets, infrastructure, and construction in progress. The total increase of $50.4
million in the County’s investment in capital assets (net of accumulated depreciation) for the current
fiscal year was a 5.7 percent change from the prior year (a 1.1 percent increase for governmental
activities and a 23.0 percent increase for business-type activities).
Some of the significant capital events that occurred during the current fiscal year which
increased capital assets were $44.3 million for the expansion of the airport, $10.9 million in construction
of road improvements, $5.5 million in construction of the museum, $1.3 million in construction of
Highway 22 boat landing, $1.0 million in construction for fire stations, 1.1 million in construction for park
and recreation centers, $.5 million in construction for libraries, and $4.9 million in light and heavy fleet
equipment. These addition amounts are reduced by depreciation during the year of $24.4 million and
asset disposals of $1.4 million.
17
Horry County’s Capital Assets
(amounts expressed in thousands)
Governmental
Business-type
Activities
Activities
2013
Land, Easements, and
Improvements
Intangible Assets
2012
2013
Total
2012
2013
2012
$ 27,331 $ 26,360 $ 48,651 $ 42,163 $ 75,982 $ 68,523
552
552
-
-
552
552
462,134
451,269
9,182
9,182
471,316
460,451
22,544
26,666
1,684
70,158
24,228
96,824
163,927
162,615
128,313
31,355
292,240
193,970
Office Furniture
187
418
-
-
187
418
Vehicles
799
1,618
-
-
799
1,618
Machinery and Equipment
12,758
15,914
9,636
5,292
22,394
21,206
Heavy Equipment
11,075
9,135
-
-
11,075
9,135
-
-
31,751
28,207
31,751
28,207
2,240
1,473
-
-
2,240
1,473
Infrastructure
Construction-in-Progress
Buildings and
Improvements
Runways and Taxiways
Other
Total
$703,547 $696,020 $229,217 $186,357 $932,764 $882,377
Additional information on the County’s capital assets can be found in Note 7 of the Notes to the
Basic Financial Statements.
Modified Approach for Infrastructure
The County has adopted the modified approach for reporting its road infrastructure. Using this
approach, the County does not depreciate infrastructure assets but maintains an up-to-date inventory of
road infrastructure asset conditions. The County must also document that the road infrastructure assets
are being preserved at or above the condition level established.
The County's road system consists of approximately 53.6 percent paved roads and 46.4 percent
unpaved roads. The condition of the road pavement is measured using several distress factors found in
pavement surfaces. The County implemented a new pavement management system (MicroPAVER) on
July 1, 2010 in an effort to better assess the paved road network within the County. The pavement
management system uses a measurement scale that is based on a condition index ranging from 1 for
failed pavement to 5 for a pavement in perfect condition. The condition index is used to classify roads in
good or better condition (rating 4 or 5), fair condition (rating 3), and substandard condition (rating 1 or
2). It is the County's goal to maintain at least 70.0 percent of its street system at fair or better condition
level. No more than 30.0 percent should be in a substandard condition. Condition assessments are
determined every year. The implementation of this new evaluation system resulted in a more thorough
and accurate assessment of condition of the road infrastructure and resulted in an increase in the
percentage of fair and better condition roads. The following assessment for fiscal year 2013 shows that
the County is in compliance with the target condition levels that have been established. The prior year
is presented to show the change in measurement through this new pavement management system.
18
Percentage of Miles in Fair or Better Condition
Arterial
Collector
Access
Overall system
2013
75.9%
81.3%
91.8%
91.0%
2012
81.1%
76.8%
89.9%
88.5%
The County created a long-term road improvement program that had been paving at least 16
miles of dirt roads per year from fiscal year 2004 through 2008. In fiscal year 2009, as a result of an
expected revenue shortfall, this was decreased to 14.5 miles and in fiscal year 2010 it was further
reduced to 9.7 miles per year. Due to continued revenue shortfalls, it was further reduced to 8.9 miles
in fiscal year 2011 and 9.0 miles in fiscal year 2012 (which included 1 mile funded by the County
Transportation Committee (CTC). Funding for the dirt road paving program has stabilized during FY 13
to allow approximately 11 miles of paving per year (including the one mile of CTC-funded
improvements). As these roads are paved, they become part of the County's pavement management
system.
In November 2006, a one-cent Capital Projects Sales Tax was passed by voter referendum and
is dedicated to specific road projects, including resurfacing 67 miles of County maintained roads over a
seven year period. During fiscal year 2009, County Council increased the road maintenance fee by
$10.00 and dedicated it to the resurfacing program.
Included in the one-cent Capital Project Sales Tax program are various projects to improve
existing state roadways. The County is managing the construction and funding the expenditures
through the collections of sales tax. The cost of these roadway improvements is included in the
statement of activities when the expense is incurred. The table below reflects the cost incurred to date
for these projects:
Horry County's Improvements to State
Roadways
(amounts expressed in thousands)
Current
Project to
Year
Date
Backgate interchange
Widen 707
Widen Glenns Bay
International
$
19,899 $ 70,243
2,634
14,989
2,513
5,789
550
72
Total
$
25,118 $ 91,571
Additional information on infrastructure assets can be found in Required Supplementary
Information (RSI).
Debt Administration
At June 30, 2013, the County had total bonded debt outstanding of $172.1 million. This
represents a decrease from the prior year of $9.9 million which is the normal amortization of prior
balances. Of the total bonded debt outstanding, $104.6 million comprises debt backed by the full faith
and credit of the government. The remainder of the County’s debt represents bonds secured solely by
specified revenue sources, such as the 1% Hospitality Fee pledged to repay the Special Obligation
Bonds, and the Airport revenues pledged to repay the Revenue Bonds. Under agreements with the City
19
of Myrtle Beach, the County has also pledged a portion of the 1% Hospitality Fee to repay 30 percent of
the Certificates of Participation issued by the City of Myrtle Beach for a baseball stadium. The RIDE –
Intergovernmental Loan Agreements with the State of South Carolina Transportation Infrastructure
Bank are being repaid by the county-wide 1.5% Hospitality Fee.
Special Obligation Bonds and Revenue Bonds are limited obligations of the County and do not
constitute general obligations, or pledge of the faith, credit or taxing power of the County or any other
political subdivision.
The County’s bonds with outstanding balances as of June 30, 2013 are presented in the
following table.
Horry County’s General Obligation and Revenue Bonds Outstanding
(amounts expressed in thousands)
General Obligation Bonds
Special Obligation Bonds
Revenue Bonds
Baseball Stadium COPS
RIDE IGA Loans
Total
Governmental
Business-type
Activities
Activities
Total
2013
2012
2013
2012
2013
2012
$ 108,600 $ 117,794 $
- $
- $ 108,600 $ 117,794
1,860
3,665
1,860
3,665
- 60,590
60,590
60,590
60,590
1,051
1,233
1,051
1,233
230,067 254,386
- 230,067
254,386
$ 341,578 $ 377,078 $ 60,590 $ 60,590 $ 402,168 $ 437,668
The above chart summarizes the outstanding principal balances on the debt issues, and does
not include unamortized premium and issuance costs which are included in the government-wide
statement of net position.
The County maintains various reserves from which to pay future debt service. At June 30, 2013,
amounts reserved for debt service totaled $78.3 million. This represents an increase of $2.2 million
from the prior year. Favorable increases in the 1.5% Hospitality Fee revenue exceeded annual debt
service and increased the accumulated excess dedicated to the repayment of the RIDE IGA loans by
$1.4 million. General debt reflected a $1.8 million decrease and Revenue Bonds reflected a $2.6 million
increase as planned in the current year budget. The table below reflects the County’s reserve amounts
by category of obligation. These amounts are reflected as restricted net position and fund balance
within the financial statements.
Horry County’s Debt Service Reserves
(amounts expressed in thousands)
General Debt
Special Obligation
Revenue Bonds
RIDE IGA Loans
Total
Governmental
Business-type
Activities
Activities
Total
2013
2012
2013
2012
2013
2012
$ 11,021 $ 12,822 $
- $
- $ 11,021 $ 12,822
2,310
2,385
2,310
2,385
16,926
14,298
16,926
14,298
46,548
47,994
46,548
47,994
$ 61,326 $ 61,755 $ 16,926 $ 14,298 $ 78,252 $ 76,052
Additional information on the County’s debt can be found in Note 8 of the Notes to the Basic Financial
Statements.
20
Economic Factors and Next Year’s Budgets and Rates
The following summarizes some economic factors:
•
As of June 2013, the unemployment rate for the County per the Bureau of Labor Statistics (not
seasonally adjusted) was 8.6 percent, down from 9.5 percent at June 2012. This rate ranked the
County as the 17th lowest unemployment rate of the forty-six counties in the state. The range of
unemployment rates for South Carolina counties in June 2013 was a low of 6.9 percent to a
high of 16.2 percent. The unemployment rate for the state of South Carolina as of June 2013
was 8.2 percent, down from 9.4 percent at June 2012.
•
The fiscal year 2013 County base tax millage is 45.2 mills, equivalent to a tax rate of .0452
percent of assessed value. This was the lowest county base tax rate in South Carolina.
The fiscal year ended June 30, 2013 indicated growth in the tourism market which provided overall
financial stability. Economic factors affecting the area’s real estate market are improving and having
a positive impact on personal and business incomes, and impacted the preparation of the fiscal
year 2014 budget compared to fiscal year 2013 as follows:
• increasing revenue – in all major categories with exception of project interest earnings;
• increasing expenditures overall, including full position budgeting ($4.1 million), 2% cost of living
adjustment for employees ($1.6 million), higher cost for employee healthcare and retirement
($1.3 million), higher public safety services with a new street crimes unit ($.4 million), and higher
capital outlay($.6 million); and
• prior year excess fund balance was appropriated in the amount of $8.2 million.
All of these factors were considered in preparing the County’s budget for the 2014 fiscal year. The
County applications in process for grant funding will result in budget amendments upon notification
of grant award.
During fiscal year 2013, unassigned fund balance in the General Fund increased from $7.1 million
to $8.3 million due to the positive net change in Fund Balance from excess revenues over
expenditures in 2013 of $3.3 million. Unrestricted fund balance in the General Fund increased from
$36.5 million to $37.0 million. Projections at this time indicate that at the end of fiscal year 2014, the
unreserved fund balance for the General Fund will remain above the 15 percent of total General
Fund expenditures requirement set by the Financial Policy Ordinance.
Requests for Information
This financial report is designed to present users with a general overview of the County’s finances
and to demonstrate the County’s accountability. If you have questions concerning any of the
information provided in this report or need additional financial information, contact the Barry Spivey,
Finance Director, 1301 Second Avenue, Conway, SC 29526.
21
AUDITED BASIC FINANCIAL STATEMENTS
HORRY COUNTY, SOUTH CAROLINA
STATEMENT OF NET POSITION
JUNE 30, 2013
(amounts expressed in thousands)
Primary Government
Businesstype
Activities
Governmental
Activities
Assets
Current assets:
Cash and cash equivalents
Pooled Cash
Investments
Funds held in trust
Interest receivable
Receivables, net:
Property taxes
Accounts and other
Fees
Due from primary government
Due from other governments
Internal balances
Inventories
Prepaid items
Restricted - funds held in trust
Total current assets
$
2,889
108,772
280,503
1,244
91
5,554
4,972
8,211
37,025
784
423
1,939
42,088
494,495
Service concession arrangement (SCA)
Bond issuance costs, net
Total non-current assets
Total assets
31,597
19,156
74
$
34,486
108,772
299,659
1,244
165
$
374
-
$
15,870
21,730
25
849
5,789
(784)
957
69
57,707
5,554
5,821
8,211
42,814
1,380
2,008
42,088
552,202
309
102
56
841
1,256
759
108
37
108
39,893
-
6,298
27,625
1,025
34,948
6,298
27,625
1,025
34,948
250
250
-
485,028
195,975
22,544
703,547
32,456
195,077
1,684
229,217
517,484
391,052
24,228
932,764
138
799
937
7,918
27,672
654
36,244
2,693
706,240
1,200,735
4,792
919
269,876
327,583
4,792
3,612
976,116
1,528,318
1,187
2,028
36,244
76,137
Non-current assets:
Restricted assets:
Cash and cash equivalents
Investments
Accounts receivable
Total restricted assets
Capital assets:
Land, easements, intangible assets and infrastructure
Depreciable capital assets, net
Construction-in-progress
Total capital assets, net
$
Total
Component Units
Horry
Shoreline
County
Behavior
Solid Waste
Services
Authority
- CONTINUED -
22
HORRY COUNTY, SOUTH CAROLINA
STATEMENT OF NET POSITION
- CONTINUED (amounts expressed in thousands)
Primary Government
Businesstype
Activities
Governmental
Activities
Liabilities
Current liabilities payable fron non-restricted assets:
Accounts payable - trade
Accounts payable - other
Accrued salaries, related taxes and compensated absences
Accrued expenses
Due to other governments
Due to component units
Construction and retainage payable
Other liabilities
Unavailable revenue - fees and other
Unearned revenue
Accrued interest payable
General and special obligation bonds payable - current portion
IGA #1 payable - current portion
IGA #2 payable - current portion
Loans payable - current portion
Capital lease obligations - current portion
Landfill closures costs
Amounts due to tenants
Total current liabilities payable from non-restricted assets
$
8,135
3,374
3,860
2,198
861
222
20,476
3,691
1,598
11,837
13,340
13,027
1,515
84,134
Non-current (long-term) liabilities:
General and special obligation bonds payable
Revenue bonds payable
IGA loans payable
Loans payable
Capital lease obligations
Compensation for future absences
Net post employment benefit obligation
Landfill closures costs
Landfill post closure care costs
Total long-term liabilities
Total liabilities
Total
Shoreline
Behavior
Services
$ 8,461
3,374
4,425
649
2,198
861
11,123
20,476
3,691
107
1,598
11,837
13,340
13,027
1,615
478
97,260
-
1,543
1,543
1,543
1,543
-
-
101,862
203,700
2,354
12,454
22,275
342,645
426,779
60,397
586
905
681
62,569
77,238
101,862
60,397
203,700
2,940
13,359
22,956
405,214
504,017
84
30
46
160
284
115
1,273
17,691
8,082
27,161
28,979
-
4,792
4,792
4,792
4,792
-
-
Deferred Inflows of Resources
Unavailable revenue - service concession arrangement
Total deferred inflows of resources
- CONTINUED -
23
$
74
35
10
5
124
Horry County
Solid Waste
Authority
326
565
649
10,901
107
100
478
13,126
Current liabilities payable from restricted assets:
Accrued interest payable
Total current liabilities payable from restricted assets
$
Component Units
$
925
383
510
1,818
HORRY COUNTY, SOUTH CAROLINA
STATEMENT OF NET POSITION
- CONTINUED (amounts expressed in thousands)
Primary Government
Businesstype
Activities
Governmental
Activities
Net Position
Net investment in capital assets
Restricted for capital projects
Restricted for public safety
Restricted for culture, recreation and tourism
Restricted for infrastructure and regulation
Restricted for economic development
Restricted for health and social services
Restricted for debt service
Restricted for other purposes
Unrestricted (deficit)
Total net position
$
593,157
17,596
4,440
7,358
296,627
4,006
77
12,074
1,000
(162,379)
773,956
$
169,529
16,003
16,926
43,095
245,553
Component Units
Total
762,686
33,599
4,440
7,358
296,627
4,006
77
29,000
1,000
(119,284)
$ 1,019,509
The accompanying notes are an integral part of these financial statements.
24
Shoreline
Behavior
Services
Horry County
Solid Waste
Authority
847
897
-
36,244
10,914
47,158
$
1,744
$
HORRY COUNTY, SOUTH CAROLINA
STATEMENT OF ACTIVITIES
FOR THE YEAR ENDED JUNE 30, 2013
(amounts expressed in thousands)
Program Revenue
Functions and Programs
Fees for
Services
Expenses
Net (Expense) Revenue and Changes in Net Position
Primary Governmental
Component Units
Operating
Grants and
Contributions
Capital Grants
and
Contributions
Governmental
Activities
Business -type
Activities
$
$
$
$
Totals
Shoreline
Solid Waste
Behavior
Authority
Primary government
Governmental activities:
General government
$
Public safety
(33,488)
$
20,979
13
57
(12,439)
-
$
(12,439)
$
-
$
-
(99,823)
12,811
2,224
590
(84,198)
-
(84,198)
-
-
(2,753)
79
-
-
(2,674)
-
(2,674)
-
-
Infrastructure and regulation
Improvements to state roadways
(27,786)
(25,118)
12,261
-
188
-
4,224
-
(11,113)
(25,118)
-
(11,113)
(25,118)
-
-
Culture, recreation and tourism
Economic development
Debt service
HGTC and Higher Education Commission
(11,376)
(2,882)
(10,485)
(4,635)
88
69
-
9
1,773
-
28
-
(11,279)
(1,012)
(10,485)
(4,635)
-
(11,279)
(1,012)
(10,485)
(4,635)
-
-
(218,346)
46,287
4,207
4,899
(162,953)
-
(162,953)
-
-
(22,482)
24,433
2,424
14,565
-
18,940
18,940
-
-
(22,482)
24,433
2,424
14,565
-
18,940
18,940
-
Health and social services
Total governmental activities
Business-type activities:
Airports
Total business-type activities
Total primary government
$
(240,828)
$
(2,130)
$
70,720
$
6,631
$
1,281
$
1,047
$
19,464
$
-
$
(162,953)
$
18,940
$
$
-
$
(144,013)
-
$
-
$
$
198
$
-
Component units
Health services
$
Landfill
Total component units
(22,705)
$
(24,835)
17,971
$
19,252
124
$
1,171
278
$
278
-
$
-
$
-
-
$
-
$
198
(4,332)
$
(4,332)
General Revenue
General Revenue
Property taxes
Capital Project Sales Tax
Fees-in-lieu of taxes
113,580
-
113,580
67,253
-
67,253
-
-
3,350
-
3,350
-
-
Intergovernmental - unrestricted
Accommodations tax
Local accommodations tax
17,680
3,976
981
-
17,680
3,976
981
-
-
Hospitality tax
Unrestricted investment earnings
Miscellaneous
Gain/(loss) on disposal of asset
Total general revenue
38,937
1,770
5,100
148
252,775
198
306
504
38,937
1,968
5,406
148
253,279
Change in net position
Net position - beginning of year, restated
Net position - end of year
$
89,822
19,444
109,266
494
684,134
226,109
910,243
1,250
245,553
$ 1,019,509
773,956
$
The accompanying notes are an integral part of these financial statements.
25
(6)
302
296
$
1,744
96
47
181
324
(4,008)
51,166
$
47,158
HORRY COUNTY, SOUTH CAROLINA
BALANCE SHEET
GOVERNMENTAL FUNDS
JUNE 30, 2013
Assets
Cash and cash equivalents
Pooled cash and investments
Interest receivable
Receivables, net:
Property taxes
Accounts and other
Fees
Due from other funds
Due from other governments
Inventories
Prepaid items
Restricted cash and investments
Total Assets
Liabilities
Accounts payable - trade
Accounts payable - other
Construction and retainage payable
Accrued salaries and wages
Due to other funds
Due to component units
General Fund
General
Improvement
Capital
Projects
Capital Project
Sales Tax
$
$
7,136,957
22,761
$
65,939
1,332,460
751,808
9,309,925
15,700,808
$ 258,533,040
4,798,230
40,336,129
$ 48,041,655
1,854,117
45,043
1,940,629
373,850
3,347,387
19,228
1,244,262
$ 68,867,764
5,554,148
4,972,233
7,421,256
1,738,312
22,831,285
55,655
1,938,473
43,332,233
$ 461,685,497
$
$
$
$
2,889,077
57,983,556
26,775
3,700,031
4,861,251
682,397
1,364,462
2,450,630
55,655
1,919,245
1,000,034
$ 76,933,113
$
$
$
2,567,919
3,373,981
3,198,598
278,772
102,278
465,781
91,089
-
242,824,439
7,793
2,015,707
68,774
-
- CONTINUED -
26
RIDE Program
Debt Service
Other NonMajor
Governmental
Funds
Total
Governmental
Funds
$
$
$
2,906,502
794
47,208
-
100
60,017,651
25,497
2,146,777
62,437
633,762
627,938
759,306
2,889,177
370,869,105
83,620
7,196,184
3,373,981
222,300
3,832,360
953,918
861,584
HORRY COUNTY, SOUTH CAROLINA
BALANCE SHEET
GOVERNMENTAL FUNDS
- CONTINUED -
General Fund
General
Improvement
Capital
Projects
Capital Project
Sales Tax
RIDE Program
Debt Service
Liabilities (continued)
Due to other governments
Due to taxpayers for overpayment
Funds held in trust- delinquent taxes
Unavailable revenue-fees and other
Unavailable revenue-property taxes
Other liabilities
Total liabilities
2,175,236
1,322,387
14,583,249
1,740,118
3,031,536
4,557,572
36,931,646
556,870
2,084,481
47,208
Fund Balances
Nonspendable
Restricted for capital projects
Restricted for public safety
Restricted for culture, recreation and tourism
Restricted for infrastructure and regulation
Restricted for economic development
Restricted for health and social services
Restricted for debt service
Restricted for other purposes
Committed to public safety
Committed to culture, recreation and tourism
Committed to infrastructure and regulation
Committed to economic development
Committed to other capital projects
Committed to stabilization
Committed to other purposes
Committed to OPEB
Assigned to other purposes
Unassigned (deficit)
Total fund balances
Total liabilities and fund balances
1,974,900
1,000,000
31,554
565,506
1,069,618
19,326,932
6,393,248
895,661
473,501
8,270,547
40,001,467
76,933,113
939,481
499,237
1,951,719
1,699,343
3,663,275
8,753,055
9,309,925
256,448,559
256,448,559
$ 258,533,040
47,994,447
47,994,447
$ 48,041,655
$
$
- CONTINUED -
27
Other Non-Major
Governmental
Funds
23,050
1,950,828
1,528,048
13,242
7,745,388
$
19,228
7,134,839
7,420,671
26,294,874
4,063,755
49,977
13,331,442
158,340
1,156,313
1,960,461
664,823
(1,132,347)
61,122,376
68,867,764
Total
Governmental
Funds
2,198,286
1,322,387
14,583,249
3,690,946
4,559,584
4,570,814
47,365,593
1,994,128
939,481
7,134,839
7,420,671
282,743,433
4,063,755
49,977
61,325,889
1,000,000
689,131
3,673,538
2,768,961
1,960,461
3,663,275
19,326,932
7,058,071
895,661
473,501
7,138,200
414,319,904
$ 461,685,497
HORRY COUNTY, SOUTH CAROLINA
BALANCE SHEET
GOVERNMENTAL FUNDS
- CONTINUED -
Reconciliation to amounts reported for Governmental Activities in the Statement of Net Position:
Total fund balances - governmental funds
(amounts
expressed in
thousands)
$
Capital assets (exclusive of Internal Service Fund Capital Assets) used in governmental activities are not financial resources
and therefore are not reported in these funds.
414,320
690,099
Some of the County's taxes will be collected after year end, but not available soon enough to pay for current period's
expenditures.
19,542
Internal service funds are used by management to charge the costs of fleet services to individual funds. The assets and
liabilities of the Internal Service Fund are included in governmental activities.
31,263
OPEB costs reported in the statement of activities does not require the use of current financial resources and therefore
is not reported as a liability in the governmental funds
(22,275)
Long-term liabilities, including bonds payable that are not due and payable in the current period and, therefore, are not
reported in these funds.
(358,993)
Net position end of year - governmental activities
$
The accompanying notes are an integral part of these financial statements.
28
773,956
HORRY COUNTY, SOUTH CAROLINA
STATEMENT OF REVENUES, EXPENDITURES, AND CHANGES IN FUND BALANCES
GOVERNMENTAL FUNDS
FOR THE YEAR ENDED JUNE 30, 2013
Revenues
Real property taxes
Personal property taxes
Vehicle taxes
Intergovernmental
Sales tax
Accommodation tax
Fees and fines
Local Accommodations tax
Hospitality fees
Documentary stamps
License and permits
Interest on investments
Cost allocation
Other
Total revenues
Expenditures
Current:
General government
Public safety
Health and social services
Infrastructure and regulation
Culture, recreation and tourism
Economic development
HGTC & Higher Education Commission
Other
Debt service
Capital outlay
Total expenditures
General Fund
$ 65,076,726
4,578,270
5,219,154
12,997,029
223,670
21,973,894
786,415
1,225,346
2,763,904
7,343,942
103,680
2,786,824
3,561,772
128,640,626
General
Improvement
Capital
Projects
$
1,509,543
707,889
84,261
200,000
2,501,693
Capital
Project
Sales Tax
$
65,731,883
515,872
66,247,755
RIDE
Program
Debt Service
$
32,646,978
857,140
33,504,118
Other NonMajor
Governmental
Funds
$ 36,180,896
2,763,646
3,419,238
7,884,752
3,858,389
13,496,340
194,152
5,064,131
209,237
1,138,167
74,208,948
Total
Governmental
Funds
$ 101,257,622
7,341,916
8,638,392
22,391,324
65,731,883
4,082,059
36,178,123
980,567
38,936,455
2,763,904
7,343,942
1,770,190
2,786,824
4,899,939
305,103,140
28,636,208
73,792,603
1,735,300
12,380,697
4,330,763
1,194,308
828,631
122,898,510
1,023,790
681,965
60,451
3,844,141
5,610,347
25,118,162
7,473,478
32,591,640
31,738,130
31,738,130
12,580
18,521,785
796,586
15,423,446
6,185,399
1,752,693
4,635,000
16,076,128
4,602,976
68,006,593
29,672,578
92,996,353
2,531,886
52,922,305
10,576,613
1,752,693
4,635,000
1,194,308
47,814,258
16,749,226
260,845,220
- CONTINUED -
29
HORRY COUNTY, SOUTH CAROLINA
STATEMENT OF REVENUES , EXPENDITURES, AND CHANGES IN FUND BALANCES
GOVERNMENTAL FUNDS
- CONTINUED -
Excess (deficiency) of revenues over (under)
expenditures
Other Financing Sources (Uses)
Sales of assets
Lease financing
Transfers in
Transfers out
Total other financing sources (uses)
Net change in fund balance
Fund balances at beginning of year
Fund balances at end of year
General Fund
General
Improvement
Capital Projects
Capital Project
Sales Tax
5,742,116
(3,108,654)
33,656,115
145,365
1,780,839
(4,368,514)
(2,442,310)
460,300
2,626,999
(1,670,186)
1,417,113
-
3,299,806
(1,691,541)
33,656,115
1,446,739
222,792,444
$ 256,448,559
46,547,708
$ 47,994,447
36,701,661
$ 40,001,467
$
10,444,596
8,753,055
- CONTINUED -
30
RIDE Program
Debt Service
Other NonMajor
Governmental
Funds
Total
Governmental
Funds
6,202,355
44,257,920
2,694
5,285,021
(4,623,505)
664,210
148,059
460,300
9,692,859
(10,981,454)
(680,236)
6,866,565
43,577,684
54,255,811
61,122,376
370,742,220
$ 414,319,904
1,765,988
(319,249)
(319,249)
$
HORRY COUNTY, SOUTH CAROLINA
STATEMENT OF REVENUES, EXPENDITURES AND CHANGES IN FUND BALANCES
GOVERNMENTAL FUNDS
- CONTINUED Reconciliation to amounts reported for Governmental Activities in the Statement of Activities:
(amounts expressed
in thousands)
$
43,578
Net change in fund balances - total governmental funds
Governmental funds report capital outlays as expenditures. However, in the statement of activities, the cost of those assets
are allocated over their estimated useful lives and reported as depreciation expense. This is the amount by which capital
outlay expenditures exceeded depreciation expense in the current period.
6,605
Revenues in the Statement of Activities that do not provide current financial resources are not reported as revenues in these
funds.
1,106
Contributed property is not reported as revenue in governmental funds. However, in the statement of activities, the cost of
property contributed is reported in the current period. In the current period, these amounts are:
5
Some expenses reported in Statement of Activities do not require the use of current financial resources and, therefore, are
not reported as expenditures in these funds.
(2,187)
The issuance of long-term debt provides current financial resources to governmental funds, while repayment of the principal
and interest consumes current financial resources of governmental funds. This amount is the net effect of these differences
in the treatment of long-term debt and related items.
38,952
The net revenue (expense) and transfer of fund balance of certain activities of internal service funds reported with
governmental activities.
Change in net position - Governmental Activities
1,763
$
The accompanying notes are an integral part of these financial statements.
31
89,822
HORRY COUNTY, SOUTH CAROLINA
STATEMENT OF NET POSITION
PROPRIETARY FUNDS
JUNE 30, 2013
Business-type Activities
Enterprise Fund
Department of
Airports
Assets
Current assets:
Cash and cash equivalents
Pooled cash and investments
Investments
Accounts receivable, net
Interest receivable
Due from other governments
Prepaid items
Inventories
Total current assets
$
Noncurrent assets:
Restricted assets:
Cash and cash equivalents
Investments
Accounts receivable
Total restricted assets
31,596,962
19,156,277
848,911
74,145
5,789,146
69,231
957,498
58,492,170
Governmental
ActivitiesInternal
Service Fund
$
100
18,406,004
7,531
367,425
18,781,060
6,297,807
27,624,875
1,025,051
34,947,733
-
Capital assets, net:
Land, easements and infrastructure
Depreciable capital assets, net
Construction-in-progress
Total capital assets, net
32,455,493
195,077,396
1,683,619
229,216,508
13,448,066
13,448,066
Service concession arrangement (SCA)
4,792,038
-
918,936
269,875,215
13,448,066
Bond issuance costs, net
Total noncurrent assets
Total assets
$
- CONTINUED -
32
328,367,385
$
32,229,126
HORRY COUNTY, SOUTH CAROLINA
STATEMENT OF NET POSITION
PROPRIETARY FUNDS
JUNE 30, 2013
- CONTINUED Governmental
ActivitiesInternal
Service Fund
Business-type Activities
Enterprise Fund
Department of
Airports
Liabilities
Current liabilities:
Accounts payable-trade
Construction accounts and
retainage payable
Accrued salaries, wages and
compensated absences
Due to other funds
Other accrued expenses
Unearned revenue
Capital leases payable current portion
Amounts due to tenants, airlines, car rentals
$
326,391
$
938,231
10,900,728
-
565,499
784,394
648,445
107,153
28,031
-
99,499
478,168
13,910,277
966,262
1,543,097
-
1,543,097
-
Total current liabilities
15,453,374
966,262
Non-current liabilities:
Revenue bonds payable
Compensated absences - long term
Net other post-employment benefits obligation
Capital leases
Total non-current liabilities
60,396,745
905,253
681,155
585,979
62,569,132
-
78,022,506
966,262
4,792,038
-
169,529,044
13,448,066
16,926,018
16,002,795
43,094,984
245,552,841
17,814,798
31,262,864
Current liabilities payable from
restricted assets:
Accrued interest payable
Total current liabilities payable
from restricted assets
Total liabilities
Deferred Inflows of Resources
Unavailable Revenue from
Service Concession Arrangement
Net position
Net investment in capital assets
Restricted for:
Debt service
Capital
Unrestricted
Total net position
Total liabilities, deferred inflows of resources and
net position
$
328,367,385
$
The accompanying notes are an integral part of these financial statements.
33
32,229,126
HORRY COUNTY, SOUTH CAROLINA
STATEMENT OF REVENUES, EXPENSES AND CHANGES IN NET POSITION
PROPRIETARY FUNDS
FOR THE YEAR ENDED JUNE 30, 2013
Business-type Activities
Enterprise Fund
Department of
Airports
Operating Revenues
Landing fees
Airline terminal rents
Concessions and rentals
Security fees
Leases
Fuel sales - FBO
Other airline services
Federal revenueTSA LEO reimbursement program
Charges for service
Other
Total operating revenues
$
1,425,463
4,961,141
6,920,652
182,358
791,511
3,754,998
540,066
Governmental
Activities Internal Service
Fund
$
-
119,007
442,580
19,137,776
5,878,736
207,835
6,086,571
Less, signatory airline rebate and
incentive fee waivers
Net operating revenues
(606,587)
18,531,189
6,086,571
Operating Expenses
Salaries and benefits
Utilities
Outside and professional services
Maintenance and supplies
Fuel cost of sales
Vehicle and equipment expense
Insurance
Business and transportation
Office supplies
Supplies and materials
Horry County administrative costs
Depreciation and amortization
Indirect cost allocation
Contractual services
Other
Total operating expenses
6,766,679
1,146,519
951,361
772,028
2,884,229
454,085
327,776
245,362
39,800
200,000
7,365,755
21,153,594
868,284
1,265,789
35,846
3,414,309
4,947
33,974
226,003
5,849,152
Operating income (loss)
(2,622,405)
- CONTINUED -
34
237,419
HORRY COUNTY, SOUTH CAROLINA
STATEMENT OF REVENUES, EXPENSES AND CHANGES IN NET POSITION
PROPRIETARY FUNDS
FOR THE YEAR ENDED JUNE 30, 2013
- CONTINUED Governmental
Activities Internal Service
Fund
Business-type Activities
Enterprise Fund
Department of
Airports
Nonoperating Revenues
(Expenses)
Passenger Facility Charges (PFC's)
Contract Facility Charges (CFC's)
State
grant revenuerevenues
Intergovernmental
Tree removal
Redevelopment Authority grant revenue
Revenue - Utility Companies for ITAP
Interest income
Interest expense
Interest subsidy on Recovery Zone Economic Bonds
Gain (loss) on disposal/sale of capital assets
3,202,752
2,505,421
1,873,612(9,200)
150,000
400,000
198,082
(1,319,640)
306,584
193,775
24,905
212,677
Total non-operating revenues
7,501,386
237,582
Net income before capital contributions and transfers
4,878,981
475,001
Capital contributions, net
Transfers in
14,564,728
-
1,288,596
Change in net position
19,443,709
1,763,597
226,109,132
245,552,841
29,499,267
31,262,864
Net Position
Beginning of year
End of year
$
The accompanying notes are an integral part of these financial statements.
35
$
HORRY COUNTY, SOUTH CAROLINA
STATEMENT OF CASH FLOWS
PROPRIETARY FUNDS
FOR THE YEAR ENDED JUNE 30, 2013
Business Type
Activities Enterprise FundDepartment of
Airports
Cash Flows From Operating Activities
Cash received from:
Landing fees, terminal rents, concessions leases and other fees
FBO sales and services
Service and miscellaneous charges
Other
Cash paid for:
Salaries and benefits
Maintenance, supplies, fuel, utilities and equipment
Other supplies and miscellaneous costs
Net cash provided by operating activities
Cash Flows From Non-Capital
Financing Activities
Tree removal
Transfers in
Net cash (used in) provided by non-capital financing activities
Cash Flows From Capital and Related
Financing Activities
Receipt of passenger and contract facility charges
Acquisition and construction of capital assets
Interest paid on bonds and notes
Principal payments on capital lease obligation
Receipt of intergovernmental and private grants
Proceeds from AIP and TSA grants
Proceeds from disposition of capital assets
Receipt of Federal Subsidy for "RZEDB" (Series 2010B)
Net cash used in capital and related financing activities
- CONTINUED -
36
$
13,075,350
4,484,674
429,675
(6,665,738)
(7,794,546)
3,529,415
(9,200)
(9,200)
5,495,888
(50,253,665)
(313,549)
(53,589)
2,788,046
11,093,927
193,775
306,584
(30,742,583)
Governmental
Activities Internal Service
Fund
$
6,086,571
(1,574,692)
(35,846)
4,476,033
1,288,596
1,288,596
(4,481,586)
358,299
(4,123,287)
HORRY COUNTY, SOUTH CAROLINA
STATEMENT OF CASH FLOWS
PROPRIETARY FUNDS
- CONTINUED Business-Type
Activities Enterprise FundDepartment of
Airports
Cash Flow From Investing Activities
Investment purchases
Investment sales
Interest on investments
Net cash provided by investing activities
Net increase (decrease) in cash and cash equivalents
Cash and cash equivalents at beginning of year
(of which $20,240,191 is restricted for Airports)
Cash and cash equivalents at end of year
(of which $6,297,807 is restricted for Airports)
Reconciliation of operating income (loss) to net cash
provided (used) by operating activities
Operating income (loss)
Adjustments to reconcile operating income to net cash
provided by operating activities:
Depreciation and amortization
Change in certain assets and liabilities:
(Increase) in accounts receivable, net
(Increase) in inventories
(Increase) in prepaid items
Increase in accounts payable
Increase in accrued salaries, wages and
compensated absences
Increase in net other post-employment benefit obligation
(Decrease) in other accrued expenses
(Decrease) in due to other funds
(Decrease) in unearned revenue
(Decrease) in amounts due to tenants
Net cash provided by operating activities
Governmental
Activities Internal Service
Fund
(46,781,152)
46,560,085
242,182
21,115
37,559
37,559
(27,201,253)
1,678,901
65,096,022
16,727,203
$
37,894,769
$
18,406,104
$
(2,622,405)
$
237,419
7,365,755
$
3,414,309
(299,125)
(529,773)
(5,291)
66,321
19,959
803,080
50,837
50,104
(232,298)
(72,347)
(133,822)
(108,541)
3,529,415
1,266
4,476,033
$
The accompanying notes are an integral part of these financial statements.
37
HORRY COUNTY, SOUTH CAROLINA
STATEMENT OF NET POSITION
FIDUCIARY FUNDS
JUNE 30, 2013
Agency Funds
Assets
Cash and investments
Pooled cash and investments
Interest Receivable
Taxes receivable
Total assets
$
16,064,223
210,066,385
1,704
180,754,884
406,887,196
Liabilities
Due to others
Total liabilities
$
$
406,887,196
406,887,196
$
The accompanying notes are an integral part of these financial statements.
38
HORRY COUNTY, SOUTH CAROLINA
NOTES TO FINANCIAL STATEMENTS
Note 1. Summary of Significant Accounting Policies
Horry County, (the “County”) a political subdivision of the State of South Carolina, was incorporated
in the year 1801. Horry County is located in the northeastern coastal area of South Carolina. It is
bounded on the north by the North Carolina state line, east by the Atlantic Ocean, west by Dillon
and Marion Counties of South Carolina, and south by Georgetown County, South Carolina. The
County seat and administrative offices are located in the city of Conway, South Carolina.
The County operates under a Council-Administrator form of government and is governed by a
chairman and eleven council members.
The financial statements of the County have been prepared in accordance with Generally Accepted
Accounting Principles (GAAP) as applied to governmental units. The Government Accounting
Standards Board (GASB) is the primary standard-setting body for governmental accounting and
financial reporting principles.
These financial statements include the implementation of GASB Statement No. 34, Basic Financial
Statements and Management's Discussion and Analysis for State and Local Governments, as of
July 1, 2001. GASB Statement No. 34 established new financial reporting requirements for
governments and caused the County to restructure much of the information that it presented in the
past. Specifically, the Statement established specific standards for the basic financial statements,
management’s discussion and analysis (MD&A), and certain required supplementary information
(RSI) other than the MD&A. In addition, the Statement requires the County to retroactively report
its general capital assets, including infrastructure capital assets, in its government-wide statement
of net assets (now ‘net position’ per GASB Statement No. 63), and report depreciation expense on
all depreciable capital assets in the statement of activities. The Statement also required the
County’s general long-term indebtedness to be reported in its government-wide statement of net
assets (now ‘net position’ per GASB Statement No. 63).
These financial statements include the implementation of GASB Statement No. 63, Financial
Reporting of Deferred Outflows of Resources, Deferred Inflows of Resources, and Net Position, as
of July 1, 2012. GASB Statement No. 63 provides financial reporting guidance for deferred outflows
of resources and deferred inflows of resources. Concepts Statement No. 4, Elements of Financial
Statements, introduced and defined those elements as a consumption of net assets by the
government that is applicable to a future reporting period, and an acquisition of net assets by the
government that is applicable to a future reporting period, respectively. This Statement amends the
net asset reporting requirements in Statement No. 34, Basic Financial Statements—and
Management’s Discussion and Analysis—for State and Local Governments, and other
pronouncements by incorporating deferred outflows of resources and deferred inflows of resources
into the definitions of the required components of the residual measure and by renaming that
measure as net position, rather than net assets.
The County's more significant accounting policies are described below:
A. Reporting Entity
Using the criteria of GASB Statement No. 14, The Financial Reporting Entity, and GASB Statement
No. 39, Determining Whether Certain Organizations Are Component Units, the basic financial
statements of the County present the reporting entity of the County that consists of the primary
government and those organizations for which the primary government is financially accountable
and for which the nature and significance of their relationship with the primary government are such
that exclusion could cause the County's financial statements to be misleading or incomplete.
39
HORRY COUNTY, SOUTH CAROLINA
NOTES TO FINANCIAL STATEMENTS
Note 1. Summary of Significant Accounting Policies (continued)
A. Reporting Entity (continued)
Financial accountability involves either appointments of a voting majority of the separate
organization's board and either a) the ability to impose will by the primary government, or b) the
possibility that the separate organization will provide a financial benefit to or impose a financial
burden on the primary government. "Blended" component units are separate entities that are,
substantially, part of the primary government's operations and are combined with financial data of
the primary government. "Discretely presented" component units, on the other hand, are reported in
separate columns in the government-wide financial statements to indicate that they are not as
closely related to the operations of the primary government. A summary of the County's blended
and discretely presented component units follows:
Discretely Presented Component Units
The County has two discretely presented component units and both have a June 30 fiscal year end.
The Shoreline Behavioral Health Services (formerly known as Horry County Commission on
Alcohol and Drug Abuse) (SBHS) is responsible for the coordination of all substance abuse
prevention, intervention, treatment, and educational programs within Horry County Council's
jurisdiction. County Council is responsible for the appointment of all members of SBHS's governing
board and fiscal control. In the event of dissolution of the Commission, all assets shall be
transferred to the County and the County would become financially accountable for these services
to the citizens.
The Horry County Solid Waste Authority (HCSWA) was created by Horry County Council to develop
and implement a solid waste disposal and resource recovery/recycling system for the County. The
HCSWA is governed by a board appointed by the County Council. The County Administrator serves
as an ex-officio member of that board. Approval of the budget, all debt issuances and the legal
liability for HCSWA operations remains with the County.
Complete financial statements for SBHS and HCSWA may be obtained at their respective
administrative offices:
Shoreline Behavioral Health Services
2404 Wise Road
Conway, South Carolina 29526
Horry County Solid Waste Authority
Finance Department
Post Office Box 1664
Conway, South Carolina 29528
40
HORRY COUNTY, SOUTH CAROLINA
NOTES TO FINANCIAL STATEMENTS
Note 1. Summary of Significant Accounting Policies (continued)
B. Basis of Presentation
Government-Wide and Fund Financial Statements
Government-Wide Financial Statements - The Government-Wide financial statements consist of a
Statement of Net Position and a Statement of Activities and reports information on all of the
nonfiduciary activities of the government as a whole. Separate columns are used to distinguish
between the County's governmental and business-type activities and discretely presented
component units. Governmental activities are generally those activities financed by taxes,
intergovernmental revenues, and other non-exchange revenues. These activities are usually
reported in governmental funds and internal service funds. Business-type activities are those
activities which are financed in whole or in part by user fees charged to external parties for goods
and services. These activities are usually reported in enterprise funds. The primary government is
reported separately from certain legally separate component units. At June 30, 2013, the County's
component units were Shoreline Behavioral Health Services and the Horry County Solid Waste
Authority.
The Statement of Net Position reports all financial and capital resources of the County using the
following format: assets, plus deferred outflows of resources, less liabilities, less deferred inflows of
resources, equals net position, rather than net assets, fund balance or equity. The statement of
activities demonstrates the degree to which the direct expenses of a given function or segment are
offset by program revenues and reflects the "net (expenses) revenue" of the County's individual
functions before applying "general" revenues. Eliminations have been made to minimize the
double-counting of internal activities.
Direct expenses are those that are clearly identifiable with a specific function or segment. Certain
indirect costs are included in the program expense reported for individual functions and activities.
Program revenues are derived directly from the program itself or from parties outside the reporting
government's taxpayers or citizenry, and thus reducing the net cost of the function to be financed
from the government's general revenues. Such revenues include (1) charges to customers or
applicants who purchase, use, or directly benefit from goods, services, or privileges provided by a
given function or segment, (2) operating grants and contributions, and (3) capital grants and
contributions, including special assessments that are restricted to meeting the operational or capital
requirements of a particular function or segment. Internally dedicated resources are reported as
general revenues rather than as program revenues. All revenues are general revenues unless they
are required to be reported as program revenues.
Fund Financial Statements - Separate financial statements are provided for governmental funds,
proprietary funds, and fiduciary funds, even though the latter are excluded from the governmentwide financial statements. The focus of governmental and enterprise fund financial statements is on
major funds. Major individual governmental funds and major individual enterprise funds are
reported as separate columns in the fund financial statements, with non-major funds being
aggregated and displayed in a single column displayed as "other".
The County reports the following major governmental funds: General Fund, General Improvement
Capital Projects, Capital Projects Sales Tax, and RIDE Program Debt Service Fund. The County
reports the Department of Airports as a major proprietary fund.
A schedule of "other" non-major funds is presented separately as part of Other Financial
Information. Because of the basis of accounting and reporting differences, summary reconciliations
to the government-wide financial statements are presented at the end of each applicable fund
financial statement.
41
HORRY COUNTY, SOUTH CAROLINA
NOTES TO FINANCIAL STATEMENTS
Note 1. Summary of Significant Accounting Policies (continued)
B. Basis of Presentation (continued)
A summary of fund financial statement types follows:
Governmental Fund Types
General Fund - The General Fund is a major fund and the main operating fund of the County and
is used to account for all financial resources except those required to be accounted for in another
fund.
Special Revenue Funds - Special revenue funds are used to account for the proceeds of specific
revenue sources (other than major capital projects) that are legally or donor restricted to
expenditures for specified purposes. Special revenue funds consists of the following: Fire, Tourism
and Promotion, Waste Management Recycling, Higher Education, Horry-Georgetown Technical
College (HGTC) Watersheds, Mt. Gilead, Socastee Recreation, Road Maintenance & CTC, Beach
Nourishment, Grants, Admissions Tax, Victim Witness Assistance, Senior Citizen, Baseball
Stadium, Arcadian Shores, Economic Development, Stormwater Management, Hidden Woods,
GIS/IT, B&C Multi-County Business Park, E-911, CDBG Grant Program, and Recreation.
Capital Projects Funds - Capital projects funds are used to account for financial resources used
for the acquisition or construction of major capital facilities and equipment (other than those
financed by the proprietary funds). Capital projects funds consist of the General Improvement and
the Capital Projects Sales Tax Fund, which are major funds and the Capital Projects Developer
Contributions Fund. The Capital Projects Sales Tax fund accounts for the one cent increase in
sales tax legally restricted for infrastructure improvements and the Capital Projects Developer
Contributions accounts for the donations made by developers for specific land improvements or
other designated capital uses.
Debt Service Funds - Debt service funds account for the accumulation of financial resources for
the payment of interest and principal on certain general long-term debt of the County, other than
debt service payments financed by proprietary fund types. Debt service funds consist of the
following: General Debt and Special Obligation Debt. The RIDE Program Fund, a major debt
service fund, accounts for the funds accumulated for, and payment of principal, insured and
uninsured portions, interest, and fees on intergovernmental loan agreements with the South
Carolina Transportation Infrastructure Bank for the Horry County Road Improvement Development
Efforts (RIDE) projects.
Proprietary Fund Types
Enterprise Funds - Enterprise funds are used to account for operations (a) that are financed and
operated in a manner similar to private business enterprises--where the intent of the governing
body is that the costs (expenses, including depreciation) of providing goods or services to the
general public on a continuing basis be financed or recovered primarily through user charges; or (b)
where the governing body has decided that periodic determination of revenues earned, expenses
incurred, and/or net income is appropriate for capital maintenance, public policy, management
control, accountability, or other purposes. The Department of Airports Fund, a major Enterprise
Fund, accounts for revenue and expenses for the operations of the Conway, Loris and Grand
Strand general aviation airports, and the Myrtle Beach International Airport.
42
HORRY COUNTY, SOUTH CAROLINA
NOTES TO FINANCIAL STATEMENTS
Note 1. Summary of Significant Accounting Policies (continued)
B. Basis of Presentation (continued)
Internal Service Fund - Internal Service Funds are used to account for operations that provide
goods and services to other departments or agencies of the primary government, or to other
governments, on a cost-reimbursement basis. The only internal service fund is Fleet Services. The
Fleet Service Fund accounts for the maintenance and replacement of all County vehicles including
heavy and light equipment.
Fiduciary Fund Type
Agency Funds - Agency funds are used to account for assets held by the County in a trustee
capacity or as an agent for individuals, private organizations, other governments, and for other
funds. Agency Funds are custodial in nature (assets equal liabilities), do not involve measurement
of results of operations, and consist primarily of property taxes and other revenues collected,
temporarily retained and distributed by the County Treasurer to other governments in accordance
with state of South Carolina Statutes.
Discretely Presented Component Units - For the government-wide financial statements, the
accounts of the discretely presented component units SBHS and HCSWA are presented under the
basis of accounting as an enterprise fund, as described above.
C. Measurement Focus and Basis of Accounting
The accounting and financial reporting treatment applied to a fund is determined by its
measurement focus. Basis of accounting refers to when revenues and expenditures, expenses, and
transfers – and assets, deferred outflows of resources, liabilities, and deferred inflows of resources
- are recognized in the accounts and reported in the financial statements.
Under GASB Statement No. 34, the government-wide financial statements are reported using the
economic resources measurement focus and the accrual basis of accounting, as are the proprietary
fund financial statements. Agency funds, which are the only fiduciary funds of the County, do not
have a measurement focus. As a general rule, revenues and expenses are recorded when
transactions occur, regardless of the timing of related cash flows. Property taxes are recognized as
revenues in the year for which they are levied. Grants and similar items are recognized as revenue
as soon as all eligibility requirements imposed by the grantor have been met. Additionally, the
effects of interfund activities are eliminated from the government-wide financial statements, except
for amounts due between the County's governmental activities and business-type activities.
Governmental fund financial statements are reported using the current financial resources
measurement focus and the modified accrual basis of accounting. Under the modified accrual basis
of accounting, revenues are recognized when susceptible to accrual (i.e., when they become both
measurable and available). "Measurable" means the amount of the transaction can be identified
and "available" means collectible within the current period or soon enough thereafter (generally not
to exceed 60 days) to be used to pay liabilities of the current period. Expenditures generally are
recorded when a liability is incurred, as under accrual accounting. However, debt service
expenditures, as well as expenditures related to compensated absences and claims and
judgments, are recorded only when payment is due.
Those revenues susceptible to accrual are property taxes, charges for services, and hospitality
fees. Revenues from state and federal grants are recorded when expenditures are incurred.
43
HORRY COUNTY, SOUTH CAROLINA
NOTES TO FINANCIAL STATEMENTS
Note 1. Summary of Significant Accounting Policies (continued)
C. Measurement Focus and Basis of Accounting (continued)
Entitlements and shared revenues are recognized at the time of receipt or earlier if the susceptible
to accrual criteria is met. Interest revenue is considered available when earned. Major revenues
that are determined not to be susceptible to accrual because they are either not available soon
enough to pay liabilities of the current period or are not objectively measurable include fees and
fines (except hospitality fees), licenses and permits.
Unavailable revenue arises when potential revenue does not meet both the "measurable" and
"available" criteria for recognition in the current period. Unavailable revenue also arises when
resources are received by the County before it has a legal claim to them, as when grant money is
received prior to the occurrence of qualifying expenditures. In subsequent periods, when both
revenue recognition criteria are met or when the County has a legal claim to the resources, the
liability for unavailable revenue is removed from the balance sheet and revenue is recognized.
All proprietary funds and the discretely presented component units are accounted for on a flow of
economic resources measurement focus. Under this method, the accrual basis of accounting is
utilized, revenues are recognized when earned and expenses are recorded at the time liabilities are
incurred. All assets and liabilities associated with the operation of these funds are included on the
Statement of Net Position. Proprietary fund type operating statements present increases (i.e.,
revenue) and decreases (i.e., expenses) in net position by distinguishing operating revenues and
expenses from non-operating items. Operating revenues and expenses generally result from
providing services and producing and delivering goods in connection with a proprietary fund's
principal ongoing operations. Operating expenses for enterprise funds and internal services funds
include the cost of sales and services, administrative expenses, and depreciation on capital assets.
All revenues and expenses not meeting this definition are reported as non-operating revenues and
expenses.
The County's fiduciary fund type consists of only agency funds, which are custodial in nature and
do not involve measurement of results of operations. Agency funds use the same basis of
accounting as proprietary fund types, accrual basis of accounting.
Estimates
The preparation of financial statements in conformity with generally accepted accounting principles
requires management to make certain estimates and assumptions that affect the reported amounts
of assets and liabilities and disclosure of contingent assets and liabilities at the balance sheet date,
and reported amounts of revenues and expenses during the reporting period. Estimates are used to
determine depreciation and amortization expense, the allowance for doubtful accounts, signatory
airline rebates, and certain claims and judgment liabilities (e.g., rebatable arbitrage), among other
accounts. Actual results could differ from those estimates.
Cash Equivalents and Pooled Cash and Investments
In March 2003, the GASB issued its Statement No. 40, Deposit and Investment Risk Disclosures,
an amendment of GASB Statement No. 3. The Statement requires specific disclosures for credit
risk, concentration of credit risk, interest rate risk, and foreign currency risk. It also modifies GASB
Statement No. 3 by limiting the required disclosure of custodial credit risk to “category 3” deposits
and investments. This Statement was implemented by Horry County for the year ended June 30,
2005.
44
HORRY COUNTY, SOUTH CAROLINA
NOTES TO FINANCIAL STATEMENTS
Note 1. Summary of Significant Accounting Policies (continued)
D. Assets, Liabilities, Deferred Outflows/Inflows of Resources, Net Position/
Fund Balance, Revenue, Expenditures and Expenses
Cash Equivalents and Pooled Cash and Investments(continued)
Cash includes currency on hand, demand deposits with financial institutions and other accounts
that have the general characteristics of demand deposits, in that, additional funds may be deposited
any time and withdrawn without prior notice or penalty.
The County pools the cash of substantially all funds into an internal cash and investment pool that
is available for use by all funds with the exception of the school district portion of the agency fund
which has its own cash and investment pool and the one cent capital project sales tax, and where
legal restrictions prohibit the commingling of funds. Allocation of interest earned is made to each
fund based on pro rata equity with the exception of school district and capital project sales tax,
which earn interest on its actual investments. Each individual fund's portion of the pool is displayed
on the combined balance sheet as "pooled cash and investments".
The County's Department of Airports Enterprise Fund and the discretely presented component
units, SBHS and HCSWA, maintain separate cash and investment accounts, generally in the form
of cash in-the bank, certificates of deposit, and repurchase agreements.
For purposes of the statement of cash flows for the proprietary fund, cash equivalents are deposit
accounts (including restricted assets other than deposits with other agencies) with an original
maturity of three months or less from date of purchase, and other short-term highly liquid
investments that are readily convertible to known amounts of cash.
Investments
Quoted market prices are used to determine the fair value of investments. Investments are stated at
fair value, with accrued interest shown under a separate caption on the financial statements.
Reinvested interest on certain debt service and capital projects investments is included in the
investment accounts. At June 30, 2013, the fair value of the County's investments approximated
cost.
The fair value of the County and HCSWA’s position in the South Carolina Local Government
Investment Pool (SCLGIP) is the same as the value of the pool shares. The SCLGIP is not
registered with the Securities Exchange Commission as an investment company. The State
Treasurer is responsible for oversight of the SCLGIP.
Receivables and Allowance for Doubtful Accounts
Accounts receivable are stated net of their allowance for uncollectible amounts. Receivables in
governmental funds include revenue accruals that are recognized when they become measurable
and available as previously defined.
Property taxes receivable represents delinquent and unpaid real and personal property tax billings
(five years for vehicle personal property taxes and ten years for all other property taxes), less an
allowance for amounts estimated to be uncollectible.
45
HORRY COUNTY, SOUTH CAROLINA
NOTES TO FINANCIAL STATEMENTS
Note 1. Summary of Significant Accounting Policies (continued)
D. Assets, Liabilities, Deferred Outflows/Inflows of Resources, Net Position/
Fund Balance, Revenue, Expenditures and Expenses (continued)
Due from Other Governments
Receivables from State, Federal, or other local governmental agencies are recorded as revenue for
the period of the allocation or as earned based on expenditures made for which reimbursement is
due.
Inventories and Prepaid Items
Inventories are valued at cost using the first-in, first-out method for the primary government and the
discretely presented component unit, SBHS, and the average cost method for the discretely
presented component unit, HCSWA.
Inventories in the general fund consist of tile used for subsurface drains and gift shop items at the
Horry County Museum and at the L. W. Paul Living History Farm. The cost of the inventory item is
recorded as an expenditure at the time the items are consumed. Inventories in the Road
Maintenance/CTC Special Revenue fund are construction materials held for construction.
Inventories in the Department of Airports Enterprise Fund consist primarily of aviation gas, jet fuels,
supplies, and parts held for consumption, and are stated at the lower of cost, determined using the
first-in, first-out, (FIFO) method, or market. Accordingly, the cost is recorded as an asset at the
time individual inventory items are purchased and then expended as the supplies and parts are
consumed (consumption method).
Inventories of the discretely presented component unit, HCSWA, consist of expendable office
supplies held for consumption and bags provided to the public for use and separation of recyclable
materials.
Certain payments to vendors reflect costs applicable to future accounting periods and are recorded
as prepaid items and are recorded as an expenditure at the time they are consumed.
Interfund Receivables and Payables
Short-term advances between funds are accounted for in the appropriate interfund receivable and
payable accounts. Transactions which constitute reimbursements of a fund for expenditures or
expenses initially made from that fund which are properly applicable to another fund are recorded
as expenditure or expense (transfers out) in the reimbursing fund and as reductions of the
expenditure or expense (transfers in) in the fund that is reimbursed.
Restricted Assets
Restricted assets include monies or other resources, the use of which is restricted by legal or
contractual requirements. In the enterprise fund, restricted assets are derived from certain grants,
bonds, and contract ordinances, and receivables associated with Passenger Facility Charges
(PFC's) and Contract Facility Charges (CFC's).
When both restricted and unrestricted resources are available for use, it is the County’s policy to
use restricted resources first, then unrestricted resources as they are needed. When the Airport
incurs an expense that may be paid from unrestricted or restricted funds, the Airport first uses
restricted funds as allowed by legal or contractual requirements.
46
HORRY COUNTY, SOUTH CAROLINA
NOTES TO FINANCIAL STATEMENTS
Note 1. Summary of Significant Accounting Policies (continued)
D. Assets, Liabilities, Deferred Outflows/Inflows of Resources, Net Position/
Fund Balance, Revenue, Expenditures and Expenses (continued)
Capital Assets and Depreciation
Capital assets, which include land, buildings, improvements, machinery and equipment,
construction in progress and infrastructure assets are reported in the applicable governmental or
business-type activities columns in the government-wide financial statements. Capital assets used
in the operations of governmental funds and are not specifically related to activities reported in
proprietary or fiduciary funds, have been reported as assets in the governmental activities column
of the government-wide financial statements.
Capital assets are defined by the County as those assets with an initial, individual cost of more than
$5,000 and an estimated useful life in excess of two years. The County has chosen the modified
approach of accounting for infrastructure under GASB Statement No. 34. Under the modified
approach, infrastructure is treated as an inexhaustible capital asset, thereby eliminating the need
for depreciation accounting. The County must demonstrate that they are maintaining networks or
subsystems of infrastructure assets at a selected condition level to qualify to use the modified
approach.
All capital assets are valued at historical cost or estimated historical cost if actual historical cost is
not available. Donated capital assets are valued at their estimated fair value or appraised value on
the date donated. The costs of normal repairs and maintenance that do not add to the value of the
asset or materially extend asset lives are not capitalized. Public domain (infrastructure) capital
assets (e.g., roads, bridges, sidewalks and other assets that are immovable and of value only to the
government) have been capitalized using actual and estimated historical costs of major general
infrastructure assets that were acquired or significantly reconstructed, or that received significant
improvements in fiscal years ending after June 30, 1980.
Depreciation of all exhaustible capital assets has been provided using the straight-line method over
the estimated useful lives of the respective assets ranging as follows: land improvements and
easements, 20-40 years; buildings, 10-40 years; runways, taxiways and rehabilitations, 30-40
years; vehicles, machinery and equipment, 3-15 years.
The County's discretely presented component units’ capital assets are stated at cost less
accumulated depreciation. Depreciation of HCSWA's Subtitle D landfill is calculated based on the
percent of the landfill's capacity used times its cost.
Intangible Assets & Amortization
Intangible assets lack physical substance, are nonfinancial in nature, and have an initial useful life
extending beyond a single reporting period. Intangible assets may include easements, internally
generated computer software, water rights, timber rights, patents, copyrights and trademarks and
are reported in the applicable governmental or business-type activities columns in the governmentwide financial statements. External and internal expenditures such as development, implementation
and testing is included as part of the asset.
47
HORRY COUNTY, SOUTH CAROLINA
NOTES TO FINANCIAL STATEMENTS
Note 1. Summary of Significant Accounting Policies (continued)
D. Assets, Liabilities, Deferred Outflows/Inflows of Resources, Net Position/
Fund Balance, Revenue, Expenditures and Expenses (continued)
Intangible Assets & Amortization (continued)
Under GASB Statement No. 51, intangible assets not yet placed in service are reported as
construction in progress. Expenditures associated with an intangible asset are capitalized when
placed into operation and the existing guidance for depreciating capital assets applies to amortizing
intangible assets with finite lives. The amortization period and method is reviewed at least
annually. Changes in the expected useful life or the expected pattern of consumption of future
economic benefits embodied in the asset is accounted for by changing the amortization period or
method, as appropriate, and are treated as changes in accounting estimates. As of June 30, 2013,
the County’s value of copyrights was $20,000 and intangible assets subject to amortization are
internally developed software with a net value of $532,070.
Capitalization of Interest
Interest incurred during the construction phase of proprietary fund capital assets is reflected in the
capitalized value of the asset being constructed, net of interest earned on the invested proceeds
over the same period. With regard to assets acquired with tax-exempt debt, the amount of interest
to be capitalized is calculated by offsetting interest expense on the tax-exempt debt with interest
earned on invested proceeds from the date of the borrowing until completion of the project. With
regard to assets not acquired with tax-exempt debt, the amount of interest to be capitalized is the
product of the average accumulated expenditures during the year for such assets and the weighted
average interest rate on borrowings and is limited to the sum of interest expense on the tax-exempt
debt not previously capitalized and all other interest expense. Interest is not capitalized on assets
acquired or constructed with gifts and grants (contributed capital) that are restricted by the donor or
grantor to acquisition of those assets to the extent that funds are available from such grants and
gifts. During the year ended June 30, 2013, within the proprietary fund, capitalized interest of
$5,667,266 is associated with Terminal Capacity Enhancement Program (TCEP) and included in
the related capital asset valuation at June 30, 2013.
Deferred Charges (Bond Issuance Costs)
Bond issuance costs including bond premiums and discounts are deferred and amortized over the
life of the related bond issue using the straight-line method. In the fund financial statements,
governmental fund types recognize bond premium and discounts, as well as bond issuance costs,
during the current period. The face amount of the debt issued is reported as other financing
sources.
Service Concession Arrangement
In fiscal year 2013, Horry County adopted GASB Statement No. 60. GASB Statement No. 60
establishes guidance for accounting and financial reporting for service concession arrangements
(SCA). Horry County evaluates concession contracts against the criteria set forth in the standard
and recognizes any service concession arrangements, associated liabilities, and unavailable
revenues on the Statement of Net Position.
Deferred Inflows/Outflows of Resources
According to GASB 63, in addition to assets, liabilities and net position, the statement of financial
position will sometimes report a separate section for deferred inflows and deferred outflows of
resources. Deferred outflows of resources represents a consumption of net position that applies to
a future period(s) and so will not be recognized as an outflow of resources (expense/ expenditure)
until then.
48
HORRY COUNTY, SOUTH CAROLINA
NOTES TO FINANCIAL STATEMENTS
Note 1. Summary of Significant Accounting Policies (continued)
D. Assets, Liabilities, Deferred Outflows/Inflows of Resources, Net Position/
Fund Balance, Revenue, Expenditures and Expenses (continued)
Deferred Inflows/Outflows of Resources(continued)
Deferred inflows of resources represents an acquisition of net position that applies to a future
period(s) and so will not be recognized as an inflow of resources (revenue) until that time. The
County has one type that qualifies for reporting in this category. Unavailable revenue related to a
service concession arrangement is recognized and amortized over the life of the arrangement using
the straight line method. This is reported in the proprietary funds’ statements of net position, and
the enterprise fund statements of net position in the Other Financial Information section.
Compensated Absences
The government-wide and proprietary fund financial statements record an expense and a liability
when employees earn compensated absence credits. Governmental fund financial statements
record a liability for compensated absences payable at June 30 only if the liability has matured but
has not yet been paid at that date (for example, as a result of employee resignations and
retirements).
Long-term Obligations
In the government-wide financial statements and the proprietary fund types in the fund financial
statements, long-term debt and other long-term obligations are reported as liabilities in the
applicable governmental activities, business-type activities, or proprietary fund type statement of
net position. Long-term debt represents unmatured principal of general and special obligation and
revenue bond indebtedness. Other long-term obligations represent outstanding net present value
portions due on capital lease obligations, long-term contracts using actual or imputed interest rates
and long-term portions of claims or judgments including rebatable arbitrage. Liabilities arising from
interfund activities do not constitute general long-term liabilities.
Part of the County’s long-term obligations is its Road Improvement and Development Effort (RIDE)
program. This obligation represents borrowings by the County from the State of South Carolina for
the purpose of constructing and improving state roads. Since these roads are property of the State
and are capitalized in the State’s basic financial statements, these RIDE obligations are recorded
as infrastructure and regulation expenses as incurred. The County has determined that these
roads are not assets of the County. These obligations are funded by a special 1.5% hospitality fee
passed into law by the County to fund these improvements. See Notes 8 and 17 for further
discussion.
Net Position & Fund Balance - Flow Assumptions & Policies
In accordance with GASB 63, the County is required to use the term net position instead of net
assets as in prior year. In the government-wide financial statements, the difference between the
County's total assets plus deferred outflows of resources less total liabilities and deferred inflows of
resources represents net position. Net position for both the governmental and business-type
activities displays three components – Net investment in capital assets; restricted component of net
position (distinguished between major categories of restrictions); and unrestricted. Unrestricted net
position represents the net position available for future operations. With the implementation of
GASB 54, the County's financial policy (Section 2-7.05) states, the following actions are required for
fund balance to be classified as “restricted”, "committed" or "assigned":
49
HORRY COUNTY, SOUTH CAROLINA
NOTES TO FINANCIAL STATEMENTS
Note 1. Summary of Significant Accounting Policies (continued)
D. Assets, Liabilities, Deferred Outflows/Inflows of Resources, Net Position/
Fund Balance, Revenue, Expenditures and Expenses (continued)
Net Position & Fund Balance - Flow Assumptions & Policies (continued)
(a) Restricted - amounts that can be spent only for the specific purposes stipulated by
external resource providers (i.e.: grants, creditors), constitutionally, or through enabling legislation
(i.e.: legislation that creates a new revenue source and restricts its use). These restrictions may be
changed or lifted only with the consent of resource providers.
(b) Committed - amounts that can be used only for the specific purpose determined by a
formal action of County Council. Such commitments may be changed or lifted only by the County
Council taking the same formal action that imposed the constraint originally (i.e.: use of fund
balance to fund subsequent year’s budgeted expenditures). Amounts classified as “committed” will
be so designated by Council Resolution, and can only be changed by the same action that initially
authorized them, unless that authorizing document states otherwise.
(c) Assigned - amounts intended to be used by the County for specific purposes. County
Council delegates the authority to classify fund balance as “assigned” to the County Administrator
and his/her designee, within the Finance Department, per County’s financial policy.
In
governmental funds other than the General Fund, assigned fund balance represents the amount
that is not restricted or committed. This indicates that resources in other governmental funds are,
at a minimum, intended to be used for the purpose of that fund.
With the implementation of GASB 54, other fund balance classifications could be non-spendable,
which represents an amount that is legally or contractually required and cannot be spent, or
unassigned, which represents amounts not included in the other fund balance categories. As of
June 30, 2013, nonspendable amounts included $1,380 for seminars, $1,290,266 for annual
maintenance & IT/GIS service contracts, $10,141 for blanket bond insurance, $500,068 for worker’s
compensation insurance, $136,618 for health/life insurance, $48,089 for tile inventory and $7,566
for museum inventory.
The policy for the order of expenditure of funds by fund balance classification as they become
available for spending is as follows: Future qualifying expenditures will first reduce the amount of
fund balance classified as restricted, followed by the reduction of unrestricted fund balance starting
first with “committed”, then “assigned”, then “unassigned” as applicable when expenditures are
incurred for purposes for which amounts in any of those fund balance classifications could be used.
The County's stabilization policy is as follows: A fiscal stabilization reserve is to be maintained in
the General Fund, the Fire Fund, the Recreation Fund, and the Stormwater Fund. The stabilization
funds are shown as a part of the restricted fund balance in the Fire Fund, Recreation Fund and
Stormwater Fund. Since this policy is approved by County Council Ordinance, the Council
authorizes the fiscal stabilization reserve to be classified as “committed” fund balance in the
General Fund. The fiscal stabilization reserve can be spent under extreme exigent circumstances.
Extreme exigent circumstances exist only if revenue shortfalls cannot be met through reducing
expenditures without impacting the health, safety and/or welfare of the County; or unexpected
expenditures are required in excess of the budgeted expenditures in order to provide for the health,
safety and/or welfare of the County.
50
HORRY COUNTY, SOUTH CAROLINA
NOTES TO FINANCIAL STATEMENTS
Note 1. Summary of Significant Accounting Policies (continued)
D. Assets, Liabilities, Deferred Outflows/Inflows of Resources, Net Position/
Fund Balance, Revenue, Expenditures and Expenses (continued)
Net Position & Fund Balance - Flow Assumptions & Policies (continued)
Use of the fiscal stabilization reserve is most likely to occur in the event of a natural disaster or an
unexpected significant reduction in revenue sources in excess of 5% of the approved budgeted
revenue for that fund. Use of the fiscal stabilization reserve requires approval by Council
Resolution.
In the event that the fiscal stabilization reserve is spent, the following must be followed to replenish
the reserve balance:
1. Withdrawals up to 25% of the reserve shall be restored within five fiscal years;
2. Withdrawals of 25% of the reserve up to 50% of the reserve shall be restored within eight fiscal
years;
3. Withdrawals of 50% of the reserve up to 75% of the reserve shall be restored within ten fiscal
years;
4. Withdrawals of 75% of the reserve up to 100% of the reserve shall be restored within twelve
fiscal years.
This fiscal stabilization reserve should be maintained at a level of at least 15% of the fund’s next
year budgeted expenditures and transfers out, excluding those amounts that are funded by onetime funding sources.
The County's minimum fund balance policy states that all governmental funds responsible for the
payment of debt service must maintain within fund balance an amount equal to at least 50% of the
next year’s debt service amount and this policy, approved by County Council Ordinance, authorizes
this amount to be classified as “committed” fund balance. This requirement applies to the General
Debt Service Fund and Fire Fund. The Airport Enterprise Fund will maintain reserves at levels that
comply with the applicable regulatory requirements such as bond covenants and requirements of
various funding sources.
Non-exchange Transactions, Contributed Capital and Transfers
Pursuant to GASB Statement No. 33 Accounting and Financial Reporting for Non-Exchange
Transactions, deeded properties and Federal, state and local government assistance in the form of
non-operating grants that are permanent in nature and restricted for the construction or acquisition
of specific property and equipment have been recorded after non-operating revenue as required by
GASB Statement No. 34.
Grants and fees that are considered program-related are recognized as operating revenue. The
Department of Airports Enterprise Fund is a recipient of certain Federal Aviation Administration
(FAA) Airport Improvement Program (AIP) grants. These capital cost-reimbursed grants have been
recognized as non-operating capital contributions. The Airport receives TSA Security Operations
grants which are recognized as operating revenues. The County & Airport have received grant
funds from the South Carolina Department of Transportation (“SCDOT”) for road improvements.
Passenger Facility Charges
Passenger Facility Charges ("PFC'S") collected pursuant to Federal FAA regulations from enplaned
passengers via airlines' remittances are restricted for future construction, capitalization, and related
debt services of the Airport as approved by the FAA.
Contract Facility Charges
Contract Facility Charges ("CFC'S") collected pursuant to certain agreements on automobile
rentals, are restricted for debt service and future construction projects related to automobile rental
tenants.
51
HORRY COUNTY, SOUTH CAROLINA
NOTES TO FINANCIAL STATEMENTS
Note 1. Summary of Significant Accounting Policies (continued)
D. Assets, Liabilities, Deferred Outflows/Inflows of Resources, Net Position/
Fund Balance, Revenue, Expenditures and Expenses (continued)
Lease Accounting
The revenue from terminal building space rentals and other leased sites is accounted for under the
operating lease method. Base monthly rentals are computed on the square footage occupied by the
tenant times the rent per square foot, which varies with each tenant. Tenant leases are normally for
periods of three to five years with options to renew; however, lease terms provide for early
termination by either party with a 30-day notification. Annual rent increases are primarily based on
annual increases in the Consumer Price Index, where applicable.
In addition, lease revenues from air carriers are based on certain compensatory "signatory" and
"non-signatory" airline lease and use agreements which are subject to annual rate negotiations.
Lease costs, if material, are deferred and amortized over the life of the lease.
Leased Property Under Capital Lease
Leased property under capital leases is depreciated using the straight-line method over the term of
the lease. Leases are deemed to be capital leases if they meet the criteria as defined in the FASB
Codification.
Property Taxes
The County assesses and levies property taxes in accordance with applicable laws of the State of
South Carolina. Real property and personal property owned and used in the County, except that
which is exempt from taxation under the Constitution and Laws of the State, is subject to taxation.
An annual ordinance establishing the millage rate associated with the levy is adopted each year as
a part of the budget process.
Real property and all personal property other than vehicles are assessed for property tax purposes
as of December 31 of each year. The basis for value of taxable real property within the County is
taken from the records of the County Assessor. Taxes are levied by the County Auditor as of
January 1, billed in October, and are due by January 15 in the year following their levy. Tax billings
are considered delinquent 166 days after the first billing date, at which time the applicable property
is subject to lien, and interest and penalties are assessed.
New vehicle property taxes are assessed and levied by the County Auditor within 120 days of the
registration date of the vehicle and payment is due upon receipt of the property tax notice. Other
vehicle property taxes are assessed and levied in the month the vehicle is scheduled for license
renewal with the South Carolina Department of Transportation and payment is due before the end
of the month of the scheduled renewal.
County property tax revenues are recognized at the time of levy for the budget period to which they
apply. Delinquent and unpaid property taxes are reported as receivables, less amounts estimated
to be uncollectible.
Cost Allocation - Indirect
The County records interdepartmental cost allocations designed to redistribute general fund
operating expenditures to other governmental and proprietary funds. These allocations are based
upon cost allocation plans prepared in accordance with United States Office of Management and
Budget requirements and include an estimate of allocable costs based upon the cost allocation
plan.
52
HORRY COUNTY, SOUTH CAROLINA
NOTES TO FINANCIAL STATEMENTS
Note 1. Summary of Significant Accounting Policies (continued)
D. Assets, Liabilities, Deferred Outflows/Inflows of Resources, Net Position/
Fund Balance, Revenue, Expenditures and Expenses (continued)
Future Landfill Closure and Postclosure Care Costs
In accordance with GASB Statement No. 18, Accounting For Municipal Solid Waste Landfill Closure
and Postclosure Care Costs, the discretely presented component unit, HCSWA, recognizes
expenses for landfill closure and postclosure care costs over the life of the landfill's operation in
proportion to the usage of the landfill's total capacity. Federal and state regulations related to landfill
closure procedures are comprehensive and require postclosure care and monitoring for a period
extending thirty (30) years after closure.
E. Reclassification
Certain items in the prior year have been reclassified to conform to the current year presentation.
F. Subsequent events
In preparing these financial statements, the County has evaluated events and transactions for
potential recognition or disclosure through December 4, 2013, the date the financial statements
were available to be issued.
Note 2. Stewardship, Compliance and Accountability
A. Budgets and Budgetary Accounting
Annual appropriated legal-based budgets are adopted by County Council for governmental fund
types including the general, special revenue and debt service funds. Capital projects fund, general
improvement fund and capital project sales tax fund adopted project-length budgets. Budgetary
comparisons to actual of the general fund are presented as Required Supplementary Information.
Capital Projects project-length budget comparisons are presented following individual fund-level
schedules. Additionally, budgetary controls are maintained for certain proprietary fund types. For
example, annual operating and capital budgets are prepared for the Department of Airports and
Fleet Services for fiscal year ended June 30, 2013, which were approved and adopted by County
Council. However, budgetary comparisons to actual for proprietary fund types are not required to be
presented in the accompanying basic financial statements.
Prior to July 1 of each year, the budget is legally enacted by the passage of an ordinance. The
ordained budget includes proposed expenditures and the means of financing them. The County's
budget serves as an approved plan to facilitate financial control and operational evaluation.
Additional budget appropriations must be approved by County Council at the fund level of
expenditures.
The County Administrator is authorized to transfer budgeted amounts between departments when
deemed necessary and upon request from the department head. Total expenditures in any one of
the governmental fund types may exceed the original ordained budgeted amount for that fund
without prior amendment by County Council. Accordingly, formal budgetary integration is employed
at the fund-level as a management control device during the year.
53
HORRY COUNTY, SOUTH CAROLINA
NOTES TO FINANCIAL STATEMENTS
Note 2. Stewardship, Compliance and Accountability (continued)
A. Budgets and Budgetary Accounting (continued)
At fiscal year end, June 30, 2013, any funds budgeted for capital projects which have not been
completed and said funds have not been budgeted to other capital projects, road maintenance fees
and funds budgeted for the local road improvement accounts, which have not been expended,
funds budgeted for the one penny sales tax capital road plan that have not been expended, other
County Council road improvement, parks maintenance and recreation funds which have not been
expended, grant funds or donations which have not been expended, Stormwater Management
funds budgeted for capital projects, funds budgeted for site improvements at the recycle centers
which have not been expended, chemicals and contract spraying which have not been expended,
funds for Maintenance Life Cycle Program which have not been expended, funds for County
Council expense accounts which have not been expended, funds for Recreation capital
improvements and programs which have not been expended, funds for capital items authorized by
purchase order but not received, accommodations tax funds approved by the Accommodations Tax
Committee and County Council which have not been expended, funds budgeted for Myrtle Beach
Regional Economic Development Corporation (MBREDC) which have not been expended, funds
budgeted for road improvements in the Hidden Woods Special Tax District which have not been
expended, funds budgeted for offsite morgue which have not been expended, and funds approved
for infrastructure improvements in admission tax districts which have not been spent shall reflect as
a commitment of fund balance in the Comprehensive Annual Financial Report and shall be brought
forward in the fiscal year 2014 as budgeted fund balance and not represented in the approved
revenue and expenditure budget amounts. This automatic re-budgeting shall not require a
supplemental budget ordinance and shall be limited to the amount available above the required
fund balance for the previous fiscal year.
B. Encumbrances
Under encumbrance accounting, outstanding purchase orders, contracts, and other commitments
for unperformed contracts and goods and services are recorded in order to reserve that portion of
the applicable appropriation in the governmental fund types. At year-end, encumbrances are
carried forward and are reported within the category of restricted fund balance if the encumbrance
will be relieved by grant funds or other external restricted funds or as committed fund balance.
Details of significant encumbrances are included in Note 18 Commitments and Contingencies.
Note 3. Deposits and Investments
State Statute authorizes the County to invest in (1) obligations of the United States and agencies
thereof; (2) general obligations of the State of South Carolina or any of its political units provided
such obligations are rated as an "A" or better by Moody's Investors Service, Inc. and Standard and
Poor's Corporation or their respective successors; (3) interest bearing accounts in financial
institutions to the extent that the same are insured by an agency of the Federal government; (4)
certificates of deposit where the certificates are collaterally secured by securities of the type
described above, held by a third party as escrow agent or custodian, of a market value not less
than the amount of the certificates of deposit so secured, including interest, provided, however,
such collateral shall not be required to the extent the same are insured by an agency of the Federal
Government; (5) or deposit accounts with banking institutions insured and secured in the same
manner. The Statutes provide that all authorized investments shall have maturities consistent with
the time or times when the invested monies will be needed in cash.
54
HORRY COUNTY, SOUTH CAROLINA
NOTES TO FINANCIAL STATEMENTS
Note 3. Deposits and Investments (continued)
A. Deposits
Deposits include cash and cash equivalents on deposit in banks and non-negotiable certificates of
deposit. All deposits under the control of the County Treasurer are fully insured or collateralized.
As of June 30, 2013, reported amount of the County’s deposits was $141.0 million and the bank
balance was $151.8 million. Of the $151.8 million bank balance exposed to custodial credit risk,
the balance was covered by federal depository insurance or collateralized with securities held by
the counterparty’s trust department, line of credit, or agent in the County’s name.
B. Investments
Investment Policy
All of the County’s investments are presented at fair value. Securities are valued at the last
reported sales price as provided by an independent pricing service. Investment income consists of
realized and unrealized appreciation (depreciation) in the fair value of investments and interest
income earned.
At June 30, 2013, the County had the following investments and maturities:
Investment Type
Certificates of Deposit
Money Market funds
U.S. Government Agencies Securities
State of S.C. Treasurer's Investment
Pool
Total investments held in the County’s
name
Investment Maturities
(amounts shown in thousands)
Three months
More than
Fair Value
or less
three months
$
110,537
$
13,556
$
96,981
76,504
76,504
223,017
17,780
205,238
195,210
195,210
$
605,269
$
303,050
$
302,219
Custodial Credit Risk
Custodial credit risk for investments is the risk that in the event of a failure of the counterparty to a
transaction, the County will not be able to recover the value of investments or collateral securities
that are in possession of an outside party. The primary government’s repurchase agreements are
fully collateralized with U.S. Government Securities. The County’s policy with respect to custodial
credit risk is that all of the County’s investments must be insured or collateralized.
Credit Risk
As of June 30, 2013, the County’s investments in U.S. Government Agencies Securities are rated
Aaa by Moody’s Investors. Statues also allow the State Treasurer to assist local governments in
investing funds. The State Treasurer also provides oversight for the State Treasurer’s Investment
Pool which is unrated, of which; the fair value of the County’s investments is the same as the value
of the pooled shares. The County’s investment in the money market fund, repurchase agreement,
and certificate of deposit are also unrated.
55
HORRY COUNTY, SOUTH CAROLINA
NOTES TO FINANCIAL STATEMENTS
Note 3. Deposits and Investments (continued)
B. Investments(continued)
Credit Risk (continued)
Credit risk is the risk that an issuer or other counterparty to an investment will not fulfill its
obligations to the County. The County’s credit risk policy to mitigate the potential for loss of
principal is to purchase only high investment grade fixed-income securities. The County’s
repurchase agreements are fully collateralized by U.S. Government Securities and are not subject
to credit risk.
Interest Rate Risk
Interest rate risk is the risk that changes in the interest rates will adversely affect the fair value of an
investment. The County’s respective maturity dates are as noted above. The County does not
have a policy with respect to interest rate risk.
Concentration of Credit Risk
Concentration of credit risk is the risk of loss attributed to the magnitude of a government’s
investments in a single issuer. The County does not have a policy for reducing this risk to any
single issuer. As of June 30, 2013, the County had 65.67% of its investments invested with BB&T,
and 14.42% with Conway National Bank.
The County does not invest in foreign securities or have transactions with foreign currency, and as
a result does not have a policy for foreign currency risk.
Component Units
HCSWA:
A. Deposits
At June 30, 2013, the carrying amount of the HCSWA’s total cash deposits, including certificates of
deposit, was $33,596,042 with corresponding bank balances of $33,614,777. Of that balance,
$1,500,000 was covered by federal depository insurance and $32,114,777 was collateralized with
securities held by the pledging financial institutions’ trust department in the HCSWA’s name. At
year end, petty cash on hand totaled $1,700.
Custodial credit risk is the risk that in the event of a bank failure, the HCSWA’s deposits may not be
returned to it. The HCSWA’s deposit policy for custodial credit risk requires all deposits in excess
of federal depository insurance to be collateralized with securities held by the pledging financial
institution’s trust department in the HCSWA’s name.
B. Investments
Investments consisted of the following at June 30, 2013:
Investment Type
State of S.C. Treasurer's
Investment Pool
Maturities
Standard &
Poor’s Credit
Rating
Fair Value
% of Total
Investments
N/A
Not Rated
$4,002,109
100.00%
56
HORRY COUNTY, SOUTH CAROLINA
NOTES TO FINANCIAL STATEMENTS
Note 3. Deposits and Investments (continued)
C. Designated Cash, Cash Equivalents & Investments
In accordance with formal resolutions of the HCSWA’s Board of Directors, cash, cash equivalents
and investments have been designated for the following purposes at June 30, 2013 and are not
considered to be available to pay for operating expenses:
Landfill Closure Costs
Landfill Postclosure Care Costs
Equipment Replacement
Construction
MRF Contingency
OPEB Obligation
Waste Diversion
$
12,112,600
7,133,842
3,893,175
9,942,809
74,392
773,481
643,240
$
34,573,539
SBHS:
A. Deposits
It is the Commission’s policy for deposits to be fully secured by collateral valued at market or par,
whichever is lower, less the amount of Federal Deposit Insurance Corporation Insurance (FDIC).
SBHS is exposed to certain custodial credit risks from the use of local financial institutions for its
depository accounts. At June 30, 2013, a total of $448,265 was on deposit with local institutions in
the name of SBHS. These deposits are covered by the FDIC up to $250,000 per institution. Any
deposits in excess of FDIC limits are collateralized by securities held by the pledging financial
institution in SBHS’s name. SBHS did not recognize any losses due to default by counterparties
relating to depository relationships.
57
HORRY COUNTY, SOUTH CAROLINA
NOTES TO FINANCIAL STATEMENTS
Note 3. Deposits and Investments (continued)
B. Investments
SBHS does not have policies with respect to credit rate risk, interest rate risk, concentration of credit risk or foreign currency risk. At
June 30, 2013, SBHS had no investments.
A reconciliation of deposits and investments to cash and cash equivalents shown on the government-wide, fiduciary financial statements
and discretely presented component units (SBHS and HCSWA) is as follows:
Cash on hand
Carrying amount of deposits
Carrying amount of investments
Totals
Cash and cash equivalents
Pooled cash and investments
Investments
Funds held in trust - restricted
Cash and cash equivalents - restricted
Investments - restricted
Funds held in trust - restricted
Totals
Primary
Government
$
29
95,437
424,706
$
520,172
$
$
34,486
108,772
299,659
1,244
6,298
27,625
42,088
520,172
(amounts shown in thousands)
Discretely Presented
Component Units
Fiduciary Fund
Agency
Total
SBHS
HCSWA
$
$
29
$
$
2
45,568
141,005
374
33,596
180,563
605,269
4,002
$
226,131
$
746,303
$
374
$
37,600
$
$
58
16,064
29,504
180,563
226,131
$
$
50,550
138,276
480,222
1,244
6,298
27,625
42,088
746,303
$
$
374
374
$
$
15,870
21,730
37,600
HORRY COUNTY, SOUTH CAROLINA
NOTES TO FINANCIAL STATEMENTS
Note 4. Receivables
Receivables for the primary government, including applicable allowances for uncollectible accounts, at
June 30, 2013, are as follows:
(amounts shown in thousands)
Business-type
Activity
Property taxes
Less, allowance for uncollectibles and
amounts not available for current period
Net property taxes
Government
Activities
$
18,103
(12,549)
5,554
Accounts and other
EMS billings
Less, allowance for uncollectibles
Net accounts and other
18,737
Totals
18,103
(12,549)
5,554
1,119
(270)
849
1,337
6,186
466
222
8,211
$
$
-
3,290
19,736
(18,054)
4,972
Fees
Road fees
Hospitality fees
Stormwater Management fees
Other fees
Net fees
Total receivables, net
Department
of Airports
$
-
4,409
19,736
(18,324)
5,821
-
1,337
6,186
466
222
8,211
$
849
$
19,586
Property taxes receivable include delinquent and unpaid taxes, penalties and interest, if applicable, and is
reported in the accompanying financial statements of the primary government net of that portion not
available for current year budget appropriations as levied.
Government Activities accounts receivable include amounts owed to the County as a result of magistrates
court, clerk of court fines and assessments, and billings relating to emergency medical transportation.
Fees receivable include Accommodations tax, Hospitality fees, Road Maintenance, Stormwater
Management and E911 fees.
Department of Airports current accounts receivable include airfield landing fees, leased sites, terminal
building, FBO sales & airport services.
Receivables at June 30, 2013 for the discretely presented component unit HCSWA totaled $1,256,097
and included amounts from trade accounts receivable and $15,000 in allowance for doubtful accounts.
Receivables (current and non-current) at June 30, 2013 for the discretely presented component unit SBHS
totaled $558,865 and included amounts from client accounts receivable, returned checks, employee
receivables, and $3,869,750 allowance for uncollectible accounts.
Amounts due form private party represents amount charged individuals for services. SBHS has
established an allowance based upon management's best estimate of the amount collectible and
considers this to be a significant estimate. SBHS uses collection programs through the South Carolina
Department of Revenue (SCDOR) to collect past due amounts from Private Parties. These programs are
called 'Debt Setoff' and 'GEAR'.
1) Debt Setoff - Debt Setoff is a program whereby individual income tax refunds are intercepted and
sent to creditors. The SCDOR charges an administrative fee to the debtor of $25.
2) GEAR - Gear is a program whereby the SCDOR impounds a portion of individuals recurring wages.
Amounts impounded are remitted monthly to Shoreline less an administrative fee of 28.5%.
For the fiscal year ended June 30, 2013, SBHS's revenue for Debt Setoff and GEAR was $125,159.
During the year ended June 30, 2013, SBHS restated opening net assets for the long-term portion of
private pay accounts previously unrecorded. This restatement resulted in a $250,000 increase to opening
net position.
59
HORRY COUNTY, SOUTH CAROLINA
NOTES TO FINANCIAL STATEMENTS
Note 5. Interfund Receivables and Payables
In the government-wide Statement of Net Position, interfund receivables and payables (internal balances) between
governmental activities and Business-type activities have been eliminated. In the governmental and proprietary funds financial
statements, short-term interfund receivables and payables at June 30, 2013 were as follows:
(amounts shown in thousands)
Due From
Due To
General Fund
Beach Renourishment
Baseball Stadium
Special Obligation Debt
Total
General
Fund
$
$
34
22
223
279
Arcadian
Shores
$
$
217
217
Tourism &
Promotion
CDBG
Grant
Program
$
$
16
95
111
$
$
300
300
RIDE Debt
Service
$
$
47
47
Airport
$
$
784
784
Total
$
$
1,364
129
22
223
1,738
Amounts due between primary governments and component units were as follows:
Primary government:
General Fund
Waste Management Recycling Fund
Component units:
SHBS
HCSWA
Interfund
Receivable
Interfund
Payable
$
$
$
102
759
861
102
759
861
$
The outstanding balances between funds result mainly from the time lag between the dates that 1) interfund goods or services
are provided or reimbursable expenditures occur, 2) transactions are recorded in the accounting system, and 3) payments
between funds are made.
60
HORRY COUNTY, SOUTH CAROLINA
NOTES TO FINANCIAL STATEMENTS
Note 5. Interfund Receivables and Payables (continued)
The following table summarizes interfund transfers during the year ended June 30, 2013:
(amounts shown in thousands)
Transfers from
Capital
Projects
Fund
General
Fund
RIDE
Program
Debt Service
Non-major
Governmental
Funds
$
$
Total
Transfers to
General Fund
Road Maintenance
Beach Renourishment
Grants
Victim Witness
Economic Development
Recreation
Capital Projects
General Debt Service
Fleet Internal Service
Total
$
$
7
199
325
171
1,038
20
2,409
200
4,369
$
$
712
958
1,670
$
319
319
$
750
280
111
969
20
218
2,145
130
4,623
$
$
1,781
287
310
1,294
171
1,038
40
2,627
2,145
1,288
10,981
Transfers are used to 1) move revenues from the fund with collection authorization to the debt service fund as debt
service principal and interest payments become due, 2) move restricted amounts from the fund with the collection
authorization to the appropriate fund recording the expenditures as they become due, 3) move unrestricted general
fund revenues to finance various programs that the government must account for in other funds in accordance with
budgetary authorizations.
Note 6. Due From Other Governments
Amounts due from other governments for the primary governments and component units on the Statement of Net Position at
June 30, 2013 are as follows:
State
Federal
Total
General
$ 2,339
112
$ 2,451
(amounts shown in thousands)
Business-type
Activities
Governmental Activities
Special
Capital
Department
Revenue
Projects
Total
of Airports
$
1,473
$
31,227
$
35,039
$
1,874
1,986
5,789
$
3,347
$
31,227
$
37,025
$
5,789
61
Discretely Presented
Component Units
SBHS
$
$
56
56
SWA
108
$
108
$
HORRY COUNTY, SOUTH CAROLINA
NOTES TO FINANCIAL STATEMENTS
Note 7. Capital Assets
A summary of the changes in capital assets during the year ended June 30, 2013 are as follows:
(amounts shown in thousands)
Governmental Activities
General Capital Assets
Not subject to depreciation:
Land and easements
Intangible Assets
Infrastructure
Balance
June 30, 2012
$
Additions
Construction-in-progress
Total capital assets not depreciated
Subject to depreciation/amortization:
Land improvements
Buildings
Building improvements
Office furniture
Vehicles
Heavy equipment
Computer equipment
Intangible assets
Other
Totals
Total General Capital Assets
5,414
196,113
21,917
10,552
19,903
5,315
39,363
532
4,686
303,795
804,607
2
65
17
268
704
347
535
1,938
21,138
(666)
(1,002)
(17)
(5)
(1,690)
(2,402)
1,366
1,817
6,761
281
716
787
11,728
-
(1,911)
(50,947)
(4,468)
(10,134)
(18,285)
(3,072)
(29,083)
(3,213)
(121,113)
683,494
(414)
(6,454)
(877)
(248)
(979)
(320)
(3,836)
(555)
(13,683)
7,455
558
976
13
5
1,552
(850)
-
(2,325)
(57,401)
(5,345)
(10,382)
(18,706)
(2,416)
(32,906)
(3,763)
(133,244)
690,099
15,092
12,518
27,610
1,548
3,305
4,853
(1,091)
(1,526)
(2,617)
-
15,549
14,297
29,846
(9,458)
(5,626)
(15,084)
12,526
(1,925)
(1,489)
(3,414)
1,439
1,089
1,011
2,100
(517)
-
(10,294)
(6,104)
(16,398)
13,448
Internal Service Fund Capital Assets
Subject to depreciation/amortization:
Machinery and equipment
Heavy equipment
Totals
Less, accumulated depreciation/amortization:
Machinery and equipment
Heavy equipment
Totals
Net internal service fund capital assets
Net capital assets - Governmental Activities
$
696,020
$
17
7,638
7,655
11,545
19,200
8,894
$
$
(1)
(689)
(690)
(22)
(712)
Balance
June 30, 2013
Transfers
22,857
20
451,269
474,146
26,666
500,812
Less, accumulated depreciation/amortization:
Land improvements
Buildings
Building improvements
Office furniture
Vehicles
Heavy equipment
Computer equipment
Other
Totals
Net general capital assets
$
Deletions
(1,367)
$
$
1
3,916
3,917
(15,645)
(11,728)
-
$
22,874
20
462,134
485,028
22,544
507,572
6,782
197,930
28,743
10,569
19,505
5,298
40,409
532
6,003
315,771
823,343
$
703,547
Roadway improvements by the County using Capital Project Sales Tax for infrastructure owned and maintained by the state are not
capitalized but are expensed as incurred. Total roadway improvements expensed for the years ended June 30, 2013 and 2012 were
$25,118 and $30,722, respectively.
62
HORRY COUNTY, SOUTH CAROLINA
NOTES TO FINANCIAL STATEMENTS
Note 7. Capital Assets (continued)
(amounts shown in thousands)
Balance
Business-type Activities
Not subject to depreciation:
Land and easements
Infrastructure
Balance
Construction in progress
Total capital assets not depreciated
23,293
9,182
32,475
70,158
102,633
Subject to depreciation:
Buildings and improvements
Runways and taxiways
Machinery and equipment
Land improvements
Totals
Total Business-Type Assets
61,608
56,275
14,034
24,540
156,457
259,090
Less accumulated depreciation:
Buildings and improvements
Runways and taxiways
Machinery and equipment
Land improvements
Totals
Net capital assets Business-type Activities
Additions
June 30, 2012
$
$
186,357
June 30, 2013
$
$
99,438
5,798
5,705
7,747
118,688
167,999
(30,253)
(28,068)
(8,742)
(5,670)
(72,733)
$
49,311
49,311
Deductions
(79)
(190)
(269)
(118,073)
(2,480)
(2,254)
(1,359)
(1,240)
(7,333)
$
160,666
(19)
(19)
(117,785)
(117,804)
160,967
62,073
19,549
32,287
274,876
309,016
79
188
267
$
(117,806)
23,274
9,182
32,456
1,684
34,140
(32,654)
(30,322)
(9,913)
(6,910)
(79,799)
$
229,217
Capital assets of the discretely presented component units, HCSWA and SBHS at June 30, 2013, are as
follows:
(amounts shown in thousands)
SBHS
HCSWA
$
138
$
7,918
26,463
1,455
12,044
17,422
138
6,413
654
1,731
70,914
Component Units
Land
Subtitle D (Class 3) landfill
Buildings
Vehicles, machinery and equipment
Other improvements
Construction-in-progress
Totals
Less, accumulated depreciation:
Subtitled D (Class 3) landfill
Buildings
Vehicles, machinery and equipment
Other improvements
Totals
Net capital assets - Component Units
$
63
(665)
(129)
(794)
937
$
(20,823)
(2,736)
(9,515)
(1,596)
(34,670)
36,244
HORRY COUNTY, SOUTH CAROLINA
NOTES TO FINANCIAL STATEMENTS
Note 7. Capital Assets (continued)
Construction-in-progress amounts included above are as follows:
Governmental Activities
Road Improvements
GIS Arial Photography
Fiber Installation
Financial System
Coastal Access Improvement
Horry County Museum
Machinery & Equipment
Recreation
Little River Projects
Fire Stations
Total
(amounts shown in thousands)
$
21,119
836
364
69
58
50
27
15
4
2
$
22,544
Estimated total costs to complete these projects approximates $251 million of which $247 million
is for road improvements.
The Airport's construction-in-progress at June 30, 2013, is composed of the following:
Business-type Activities: (Department of Airports)
Completion Phase of Terminal Capacity Enhance Program
(TCEP)
East Side Commerce Park
MYR Runway Rehabilitation
CRE Hangar Improvements
ITAP Ramp & Taxiway
CRE Pavement Phase I
Hangar 3232 Renovation
HYW Community Hangar
Ramp 66 Purchase
Airport Layout Plan
Harrelson Boulevard Phase II
Total
(amounts shown in thousands)
$
$
457
45
204
20
545
198
173
17
6
9
10
1,684
The Terminal Capacity Enhancement Program total construction project budget was established
at $118,748,071. Project expenditures of $16,130 and $110,375,528 were capitalized during
fiscal years 2012 and 2013 respectively.
Estimated additional costs to complete these projects are estimated at $17 million. As of June
30, 2013, the Airport had outstanding purchase orders relating to the projects above of
$9,903,666. $6,500,741 of these encumbrances has been included in value of TCEP assets
capitalized during the 2013 fiscal year.
In December 2012, the airport sold a 1.93 acre parcel of land at the Grand Strand Airport. The
historical combined cost of both parcels was $19,300, and the sale resulted in a non-operating
gain of $208,064 for the 2013 fiscal year. The Airport also disposed of $268,323 in machinery
and equipment in the current fiscal year. The disposals resulted in a $1,429 loss
64
HORRY COUNTY, SOUTH CAROLINA
NOTES TO FINANCIAL STATEMENTS
Note 7. Capital Assets (continued)
Department of Airport Facilities
Prior to March 1993, the Airport used certain airfield facilities of the Myrtle Beach Air Force Base
through a joint-use agreement, orginally executed in the mid 1970's, with the United States Air Force
(USAF). Coincident with the excecution of the joint-use agreement, the Air Force and Horry County
executed the Base Lease agreement which leased to the County the acreage on the air force base on
which to operate the airport terminal. In March 1993, the base was officially closed and the joint-use
agreement was terminated. At the time of closure, the Air Force extended the Base Lease agreement
with the County to include the airfield facilities previously used by the airport in accordance with the
joint use agreement.
The term of the Base Lease agreement was extended to December 31, 2028. The agreement called
for the transfer of ownership of the property in fee simple to the County from USAF for the land and
facilities at the end of the lease, but contemplated an earlier transfer based upon the USAF meeting
certain criteria set forth in the agreement. The transfer of ownership was completed on June 17,
2003, and a fee simple deed to the property was recorded in the County's name in the Register of
Deeds office of Horry County on that date at Deed Book 2623, page number 1491. The property
transferred excluded portions of Myrtle Beach International Airport (MYR) property which are still
undergoing environmental remediation and cleanup efforts by the United States Government.
With respect to the runway, aprons, taxiways, drainage system, etc., associated with the USAF
property conveyance, no historical or estimated values are available. Until such time that a fair market
value can be established, a value of $1.00 has been recorded representing "Land" and "Aviation
Easements". Buildings and structures are being specifically identified and recorded at fair market
value at the date of the gift.
Horry County Department of Airports is obligated by the Federal Aviation Administration (FAA) to
maintain a current Airport Layout Plan (ALP). In order to maintain a current ALP, the Department
reviews and updates its Master Plan whenever strategically necessary. The Airport completed the
updated ALP in fiscal year 2011.
Depreciation allocation - Governmental
The amount of depreciation charged to each governmental function for the year ended June 30, 2013
is as follows: general government ($4,046,960); public safety ($7,404,222); Infrastructure and
regulation ($436,493); culture and recreation ($1,567,966) and health and social services ($227,433).
Capital assets held by the Internal Service Fund ($3,414,309).
65
HORRY COUNTY, SOUTH CAROLINA
NOTES TO FINANCIAL STATEMENTS
Note 8. Long-Term Debt
Long-term debt at June 30, 2013, is comprised of general and special obligation bonds, revenue bonds,
RIDE - Intergovernmental Loan Agreements (IGA), accumulated compensated absences liability, other
post employment benefits, and long-term capital leases.
General obligation (G.O.) bonds are issued to provide funds for the acquisition and construction of major
capital facilities and equipment. G.O. bonds are direct obligations that pledge the full faith, credit and
taxing power of the County. The South Carolina Constitution limits local government units borrowing
power to eight percent of its assessed property values. The limitation excludes bonded indebtedness
existing prior to December 1, 1997, (date of the Constitutional Amendment), certain special levies
assessed on properties located in specific areas receiving special benefits, and other prescribed
indebtedness approved by the voters.
Special obligation bonds are issued to provide funds for the acquisition and construction of major capital
facilities and equipment and are secured by the pledge of the Hospitality Fees Special Revenue Fund
revenues (Special Fund portion) of the County.
Revenue bonds are issued to provide funds for the acquisition and construction of major capital facilities
and are secured by the pledge of specific net revenues of the County. Such revenue bonds are recorded
in the Enterprise Funds.
The County has also entered into certain IGA with the State of South Carolina Transportation
Infrastructure Bank.
Special obligation bonds, revenue bonds, and IGA Loans are limited obligations of the County and do not
constitute the general obligations, or pledge of the faith, credit or taxing power of the County or any other
political subdivision.
On September 1, 2005, the County issued $30,000,000 of General Obligation Refunding Bonds, Series
2005A (the “2005A Bonds”) with interest rates ranging from 3.500% to 4.125%. The net proceeds of the
2005A Bonds were placed in an irrevocable trust account and were issued to partially defease the 2000
General Obligation Bonds- Judicial Center, including payment of the prepayment penalty on the Bonds.
The 2005A Bonds are payable through March 2022, and the full faith, credit and taxing power of the
County are irrevocably pledged for the payment thereof. As a result of the transaction, the County
reduced total debt service payments by $6,878,384 and realized an economic gain (difference between
the present values of the old and new debt service payments) of $1,379,795. The outstanding principal
balance of the 2005A Bonds at June 30, 2013 was $21.260 million.
On September 1, 2005, the County issued $5,010,000 of General Obligation Refunding Bonds, Series
2005B (the “2005B Bonds”) with interest rates ranging from 3.000% to 3.580%. The net proceeds of the
2005B Bonds were placed in an irrevocable trust account and were issued to partially defease the 2000
General Obligation Bonds- Fire Protection, including payment of the prepayment penalty on the Bonds.
The 2005B Bonds are payable through March 2015, and the full faith, credit and taxing power of the
County are irrevocably pledged for the payment thereof. As a result of the transaction, the County
reduced total debt service payments by $3,128,855 and realized an economic gain (difference between
the present values of the old and new debt service payments) of $224,618. The outstanding principal
balance of the 2005B Bonds at June 30, 2013 was $1.705 million.
The 2005B Bonds are not subject to redemption on or prior to March 1, 2016. The 2005B Bonds
maturing on or after March 1, 2017, are subject to redemption at the option of the County on or after
March 1, 2016, at any time as a whole or in part in such order of maturities as the County may determine,
at par, together with the interest accrued thereon to the date fixed for redemption.
66
HORRY COUNTY, SOUTH CAROLINA
NOTES TO FINANCIAL STATEMENTS
Note 8. Long-Term Debt (continued)
On December 30, 2009, the County issued $5,040,000 of General Obligation Bonds, Series 2009A and
$6,960,000 of General Obligation Bonds, Series 2009B (Federally Taxable – Build America Bonds –
Direct Payment Bonds). The proceeds of the Series 2009A & Series 2009B Bonds will be used to provide
funds for constructing and equipping library and various recreation facilities and the full faith, credit and
taxing power of the County are irrevocably pledged for the payment thereof.
Beginning with March 1, 2010, the Series 2009A bonds requires semi-annual interest-only payments until
March 1, 2011, when the Series 2009A bonds are payable semiannually in principal installments of
$455,000 to $570,000 plus interest at 2.0% to 4.0% over ten years. The Series 2009B bonds provide for
interest installments only for the first ten years of the life of the bonds. Beginning in fiscal year 2021, the
Series 2009B bonds will be payable in principal installments of $595,000 to $815,000 plus interest at
4.75% to 5.75% over ten years. The Series 2009B bonds were issued under the guidelines provided in
the American Recovery and Reinvestment Act (“ARRA”) as Build American Bonds. The County, under the
guidelines set forth in the ARRA, is eligible to apply for an interest subsidy payment from the United
States Treasury for Build America Bonds of 35% of the interest payable on the bond. The subsidy
payments have not been pledged to the payment of any Bonds and would be part of the County’s general
revenues. The County received an interest subsidy of $129,098 for the year ended June 30, 2013.
The 2009A Bonds are not subject to redemption on or prior to March 1, 2020. The 2009B Bonds
maturing on or after March 1, 2021, are subject to redemption at the option of the County on or after
March 1, 2020, at any time as a whole or in part in such order of maturities as the County may determine,
at par, together with the interest accrued thereon to the date fixed for redemption.
Advance Refundings
The balance of outstanding advanced refunding at June 30, 2013 is $7,910,000.
On December 6, 2011 the County issued $8,740,000 of General Obligation Bonds with an average
interest rate of 2.473% were issued to advance refund $6,015,000 of outstanding 2004A GO Bonds (Fire
Bonds) with a coupon rate ranging from 3.0% to 5% and $1,895,000 of outstanding 2004B GO Bonds
(Tech Bonds) with a coupon rate ranging from 3.25% to 5.5%. The net proceeds of $8,955,931 (after
payment of $183,710 in underwriting discount and issuance costs) plus an additional $2,573 in additional
funds were used to purchase US Government securities. Those securities were deposited in an
irrevocable trust with Wells Fargo Bank to provide for future debt service payment on the 2004A and
2004B GO Bonds. As a result the 2004A and 2004B GO Bonds are considered to be defeased for
payments due after March 2014 and the liability for these bonds has been removed from the
governmental activities column of the statement of net position.
The reacquisition price exceeded the net carrying amount of the old debt by $931,431. This amount is
being netted against the new debt and amortized over the remaining life of the new debt, which is equal
to the life of the refunded debt. This advance refunding was undertaken to reduce total debt service
payments over the next thirteen years by $622,908 and resulted in an economic gain (difference between
the present values of the debt service payment of the old and new debt) of $615,665.
67
HORRY COUNTY, SOUTH CAROLINA
NOTES TO FINANCIAL STATEMENTS
8. Long-Term Debt (continued)
A. Governmental Activities Debt
Change in the county's long-term debt for its Governmental Activities as follows:
(amounts shown in thousands)
Balance
June 30, 2012
General and Special Obligation Bonds:
G.O. Bonds of 2004 (Series A) dated June 1 for $11
million with interest at 3.0% to 5.0% - Fire Protection
District
$
G.O. Bonds of 2004 (Series B) dated June 1 for $3
million with interest at 3.25% to 5.50% - HGTC Bond
Additions
1,260
$
Deletions
-
$
(615)
$
Balance
Current
June 30, 2013
Portion
645
$
645
280
-
(140)
140
140
G.O Bonds of 2005 (Series A) dated September 1
for $30 million with interest at 3.5% to 4.125% Judicial Center Refunding
23,175
-
(1,915)
21,260
1,995
G.O. Bonds of 2005 (Series B) dated September 1
for $5.01 million with interest at 3% to 3.8% - Fire
Protection Refunding
2,515
-
(810)
1,705
840
G.O. Bonds of 2007 dated April 11 for $11 million
with interest at 4% to 4.5% -Health
Department/Museum
8,035
-
(665)
7,370
690
G.O. Bonds of 2008 dated May 20 for $12 million
with interest at 4% to 5% -Libraries
10,140
-
(475)
9,665
490
G.O. Bonds of 2008 dated May 20 for $50 million
with interest at 4% to 5% -Detention Center
38,665
-
(2,940)
35,725
3,030
Special Hospitality Fee Bonds of 2009 dated May 7
for $8.155M with interest at 3% to 4%- Hospitality
Fee Refunding
3,665
-
(1,805)
1,860
1,860
G.O. Bonds of 2009 (Series A) dated December 30
for $5.04 million with interest at 2% to 3% Recreation and Library
4,120
-
(470)
3,650
480
G.O. Bonds of 2009 (Series B) dated December 30
for $6.96 million with interest at 2% to 3% Recreation and Library
6,960
-
6,960
-
G.O. Bonds of 2010 (Series B) dated June 3 for
$1.67 million with interest at 2.5% to 4.0% - Series
2001 A&B Refunding - Higher Education (HGTC
Bldg. remodeling)
1,670
-
(145)
1,525
170
G.O. Bonds of 2010 (Series B) dated June 3 for
$12.02 million with interest at 2.5% to 4.0% - Series
2001 A&B Refunding - S.S. Complex, Libraries &
Court House
12,020
-
(950)
11,070
1,235
214
-
(69)
145
71
G.O. Bonds of 2011 (Series A) dated December 6
for $6.64M with interest at 2% to 4% - Series 2004A
Refunding - Fire Protection District
6,640
-
-
6,640
-
G.O. Bonds of 2011 (Series B) dated December 6
for $2.1M with interest at 2% to 3% - Series 2004B
Refunding - HGTC Bond
2,100
-
-
2,100
-
G.O. Bonds of 2010 (Series A) dated June 15 for
$350,000 with interest at 2.79% - Boat Landing
Certificates of Participation dated September 1,
1998 for $3.088M with interest at 3% to 5%Baseball Stadium
Total general and special obligation bonds
Unamortized premiums
Net general and special obligation bond debt
$
-
1,233
-
(182)
1,051
191
122,692
2,387
-
(11,181)
(199)
111,511
2,188
11,837
-
113,699
$ 11,837
125,079
$
68
-
$
(11,380)
$
HORRY COUNTY, SOUTH CAROLINA
NOTES TO FINANCIAL STATEMENTS
8. Long-Term Debt (continued)
A. Governmental Activities Debt (continued)
Other general long-term obligations of the County's governmental activities at June 30, 2013 are as follows:
Balance
June 30, 2012
Other general long-term obligations:
RIDE - IGA Loan #1
Less, amounts imputed for interest
Net RIDE - IGA Loan #1
$
75,000
(6,035)
68,965
(amounts shown in thousands)
Balance
Additions
Deletions June 30, 2013
$
-
$ (15,000)
2,085
(12,915)
$
60,000
(3,950)
56,050
Current
Portion
$ 13,340
13,340
RIDE - IGA Loan #2
185,421
-
(11,404)
174,017
13,027
Net RIDE - IGA Loans payable
254,386
-
(24,319)
230,067
26,367
187
2,248
184
1,386
232
672
355
5,264
20,675
13,401
293,726
372
88
460
1,600
8,650
10,710
(187)
(426)
(184)
(523)
(116)
(333)
(86)
(1,855)
(9,567)
(35,741)
1,822
863
116
339
269
372
88
3,869
22,275
12,484
268,695
437
421
116
339
88
92
22
1,515
30
27,912
418,805
$ 10,710
$ (47,121)
382,394
$ 39,749
Capital lease obligation - fiber optic network
Capital lease obligation - CAD
Capital lease obligation - computers
Capital lease obligation - fiber ring
Capital lease obligation - toughbooks
Capital lease obligation - fiber relocation
Capital lease obligation - toughbooks
Capital lease obligation - toughbooks
Capital lease obligation - tractors
Net capital leases
Post employment benefit obligation, net
Accumulated compensation absences, net
Total other general long-term obligations
Total Net Governmental Activities Debt
$
$
The current portion of compensated absences has typically been liquidated from the general fund, other governmental funds
and the Internal Service fund.
The County is funding the post employment benefit obligation on a pay - go basis from the General Fund.
RIDE Intergovernmental Agreements
As described in Note 17, the RIDE Intergovernmental Agreement (IGA) Loan #1 provides for debt service payments to be
made without interest over twenty (20) years. Accordingly, an estimated amount of interest has been imputed based on
calculated rate of 3.25% which is a rate representative of the IGA Loan #2 Amended Agreement.
69
HORRY COUNTY, SOUTH CAROLINA
NOTES TO FINANCIAL STATEMENTS
Note 8. Long-Term Debt (continued)
B. Business-type Activities (Enterprise Funds) Debt
Revenue Bonds - Department of Airports
In November 17, 2010, the $50,870,000 Airport Revenue Bonds, Series 2010A and $9,720,000 Taxable
Airport Revenue Bonds, Series 2010B were issued by Horry County, South Carolina, a political
subdivision of the State of South Carolina.
The Series 2010A Bonds were issued to pay a portion of the cost of construction of the TCEP at the
Myrtle Beach International Airport and to fund the capitalized interest on the Series 2010A Bonds through
December 1, 2010, fund the debt service reserve and pay the costs of issuance of the Series 2010A
Bonds. The net original issue discount for 2010A Bond was $211,085. The unamortized discount at June
30, 2013 is $193,255.
The Series 2010B Bonds were issued to pay the cost of the Harrelson Boulevard Improvements, fund the
capitalized interest on the Series 2010B Bonds through December 1, 2011, fund the debt service reserve
requirements and pay cost of issuance of the Series 2010B Bonds. The County has elected to treat the
Series 2010B Bonds as “Recovery Zone Economic Development Bonds” for the purposes of the Internal
Revenue Code of 1986. Subject to the County’s compliance with certain requirements of the Code, the
County expects to receive cash subsidy payments from the United States Treasury equal to 45% of the
interest payable on the Series 2010B Bonds.
On March 1, 2013, the federal government implemented sequestration measures that reduced the
amount of the subsidy due to the Horry County Department of Airports by 8.7% of the budgeted amount
for the last quarter of the 2013 fiscal year. The 8.7% reduction remained in place for payments made
though the end of federal fiscal year 2013 (ending September 30, 2013).
In Fiscal Year 2013, the County received an interest subsidy of $306,584.
The revenue bonds are secured by the pledge of revenues derived by MYR. The Bonds are limited
obligations of the County and do not constitute the general obligation, or a pledge of the faith, credit, or
taxing power of the County or any other political subdivision. The County has agreed to establish rates
and charges for use of MYR services and facilities that are reasonably expected to yield net revenues
equal to at least 1.25 times the aggregate debt service to become due on the revenue bonds in the
forthcoming fiscal year. Net revenues are defined as revenues less maintenance and operations
expenses of MYR. The revenue bond ordinance also requires that certain funds be established and
certain financial conditions be maintained.
Long-term 'revenue bonded' debt of the Department of Airports Enterprise Fund at June 30, 2013, is as
follows:
(amounts shown in thousands)
Balance
Balance
Revenue Bonds:
June 30, 2012 Additions Deletions June 30, 2013
Revenue bond, 2010A Series
dated November 17, for $50.87 million
with interest at 4.375% to 5% due 20112040
$
50,870
$
$
$
50,870
Taxable Revenue bond, 2010B Series
dated November 17, for $9.72 million
with interest at 7.328% due 2011-2040
9,720
9,720
Total revenue bonded debt
Less, original issue discount
Net Revenue Bonds
60,590
(200)
$
60,390
70
7
$
7
$
-
60,590
(193)
$
60,397
HORRY COUNTY, SOUTH CAROLINA
NOTES TO FINANCIAL STATEMENTS
Note 8. Long-Term Debt (continued)
C. Annual Requirements for Long-Term (Bonds and Loans) Debt
Annual principal requirements to amortize general and special obligation bonds, revenue bonds, certificates of participation (COPS), and RIDE
Intergovernmental Agreements (IGA) loans #1 and #2 at their respective present values at June 30, 2013, are summarized as follows:
Years Ending
June 30,
2014
2015
2016
2017
2018
2019-2023
2024-2028
2029-2033
2034-2038
2039-2040
Total
Years Ending
June 30,
2014
2015
2016
2017
2018
2019-2023
2024-2028
2029-2033
2034-2038
2039-2041
Total
G.O.
Bonds
Principal
9,787
10,173
9,650
9,985
10,390
48,855
8,160
1,600
$ 108,600
$
Interest
4,347
3,955
3,547
3,193
2,814
7,760
1,589
138
$
27,343
$
RIDE IGA
Loan #1
Principal
Interest
$
13,340
$
1,660
13,778
1,221
14,232
768
14,700
300
$
56,050
$
3,949
(amounts shown in thousands)
Special
Baseball
Stadium
Obligation
COPS
Bonds
Principal
Interest
Principal
Interest
$
1,860
$
58
$
190
$
53
200
43
210
33
220
23
231
11
$
1,860
$
58
$
1,051
$
163
RIDE IGA
Loan #2
Principal
Interest
$
13,027
$
4,981
14,750
4,578
16,751
4,122
18,881
3,606
20,843
3,028
89,765
5,719
$
174,017
$
26,034
Airport
Revenue
Bonds
Principal
Interest
$
1,215
$
3,086
1,270
3,038
1,320
2,987
1,370
2,934
1,415
2,893
8,060
13,458
10,020
11,506
12,595
8,836
15,875
4,931
7,450
642
$
60,590
$
54,311
Total
Debt Service
Requirements
Principal
Interest
$
39,419
$
14,185
40,171
12,835
42,163
11,457
45,156
10,056
32,879
8,746
146,680
26,937
18,180
13,095
14,195
8,974
15,875
4,931
7,450
642
$
402,168
$ 111,858
D. SBHS
On June 18, 2003, the Commission issued $960,000 in Hospital Revenue Bonds, Series 2003 with an interest rate of 4.46%.
Hospital Revenue Bond
Interest Rate
4.46%
Maturity Date
6/18/2013
71
Balance 6/30/13
$
-
HORRY COUNTY, SOUTH CAROLINA
NOTES TO FINANCIAL STATEMENTS
Note 9. Capital and Operating Leases and Other Long-Term Liabilities
A. Capital Lease Obligations
A capital lease is an agreement which specifies a transfer of benefits and risk of ownership to the lessee.
Governmental Activities:
The County's capital leases have been recorded at the present value of the future minimum lease payments as follows:
Year Ended June 30,
(amounts shown in thousands)
Fiber
2014
Toughbook
Relocation
Computers
$
$
346
2015
2016
2017
2018
Total lease payments
Less, interest
Fiber
Toughbook
Ring
92
$
Computers
464
$
125
-
92
464
-
346
93
277
928
125
(7)
(8)
(65)
(9)
Present value of future
minimum lease payments
Less, current portion
Total non-current portion
$
339
269
863
116
(339)
-
(88)
181
(421)
442
(116)
-
$
$
$
Toughbook
Year Ended June 30,
2014
Computers
$
96
2015
2016
2017
2018
Total lease payments
Less, interest
CAD
$
Tractors
487
$
23
Total
$
1,633
96
487
23
1,162
96
95
383
487
488
1,949
23
22
91
699
605
4,099
(11)
(127)
(3)
(230)
Present value of future
minimum lease payments
Less, current portion
Total non-current portion
$
372
1,822
88
3,869
(92)
280
(437)
1,385
(22)
66
(1,515)
2,354
$
$
$
Business-type Activities (Enterprise Funds):
During the year ended June 30, 2006, the Airport entered into a ten year non-cancelable lease for a generator for the Airport. The
annual interest rate on the lease is 2.87% per annum. The value of the generator at acquisition was $425,000 and the net book
value of the generator as of June 30, 2013 and June 30, 2012 was $89,262 and $135,625, respectively.
The present value of the minimum lease payments follows:
Total
Year Ended June 30,
2014
50,314
2015
50,314
2016
41,928
Total payments
142,556
Less, interest
(6,931)
Present value of future minimum lease payments
Less, current portion
Total non-current portion
135,625
$
72
(46,363)
89,262
HORRY COUNTY, SOUTH CAROLINA
NOTES TO FINANCIAL STATEMENTS
Note 9. Capital and Operating Leases and Other Long-Term Liabilities (continued)
A. Capital Lease Obligations (continued)
Business-type Activities (Enterprise Funds):
During the year ended June 30, 2013, the Airport entered into a second ten year non-cancelable lease for an additional generator for
the Airport’s new terminal building. This additional lease was effective April 1, 2013. The annual interest rate on the lease is 1.15%
per annum. The fair market value of the generator at acquisition was $558,650, and the net book value of the generator as of June
30, 2013 was $549,853.
The present value of the minimum lease payments follows:
Year Ended June 30,
Total
2014
59,148
2015
59,148
2016
59,148
2017
59,148
2018
59,148
2019-2023
285,882
Total payments
581,622
Less, interest
(31,769)
Present value of future minimum lease payments
549,853
Less, current portion
Total non-current portion
$
(53,136)
496,717
In January 2006, the Airport entered into a lease agreement with Atlanta Air Services (lessee) for hangar space at MYR. Under the
terms of the agreement, the lessee was permitted to offset its rental obligations for certain capital improvements made to the
premises. During 2006, the lessee completed the necessary capital improvements and as such is due rental credits in the sum of
$300,000 to be applied to the rent payments at $50,000 annually. The remaining balance at June 30, 2013 is a current liability of
$50,000.
The changes in the County's capital leases and other long-term obligations for its business-type activities for the year ended
June 30, 2013 are as follows:
Balance
June 30, 2012
Additions
Deletions
Capital leases
$
180,417
$
549,853
Compensated absences
$ 1,200,384
$
1,207,004
Due to tenants for capital improvements
$
50,000
$
Net OPEB obligation
$
631,051
$
73
$
Amounts
due within
one year
Balance
June 30, 2013
(44,792)
$
685,478
$
99,499
$ (1,200,384)
$
1,207,004
$
301,751
-
$
$
-
$
-
50,105
$
$
681,156
$
-
(50,000)
-
HORRY COUNTY, SOUTH CAROLINA
NOTES TO FINANCIAL STATEMENTS
Note 9. Capital and Operating Leases and Other Long-Term Liabilities (continued)
B. Operating Lease Agreements
Lessor (Department of Airports)
The Department of Airports Enterprise Fund derives a substantial portion of its revenues from charges to air carriers, aeronautical
businesses and schools, and concessionaires. Substantially all of the assets classified as fixed assets in the balance sheet are held
by the Airport for the purpose of rental or related use. The Airport, as lessor, leases land, buildings, and terminal space to air carriers,
and concessionaires on a fixed fee as well as a contingent fee basis. All leases of the Airport are treated as operating leases for
accounting purposes. Most of the leases provide for an annual review and redetermination of the rental amounts. The following is a
schedule of future minimum rentals receivable on non-cancelable operating leases as of June 30, 2013:
(amounts shown in thousands)
$
5,404
5,230
5,208
5,159
976
6,045
$
28,022
Year Ended June 30,
2014
2015
2016
2017
2018
2019-2023
Total
The total historical cost and net book value of certain property leased to parties external to Horry County, South Carolina reporting
entity is $44,469,880 and $18,001,293, respectively at June 30, 2013.
Lessor (SBHS)
At June 30, 2013 future minimum payments under noncancelable operating leases with remaining terms in excess of one year were
as follows:
Year Ended June 30,
2014
$
10,635
2015
1,270
2016
2017
2018
Total
$
11,905
Total lease expense for the fiscal year ended June 30, 2013 was approximately $12,286.
C. Other Long-Term Liabilities
SBHS at June 30, 2013
On December 15, 2011, the Commission entered into a loan agreement with BB&T in the amount of $85,000 for the purpose of
facility repairs/upgrades. Note payable-repairs are due monthly with interest only at 3.4% and will mature on December 15, 2014, at
which time the unpaid principal balance outstanding will be due. For the year ended June 30, 2013, $84,185 of loan proceeds have
been expended. Auto loan is due monthly with payments of $414 per month at 5.75% with final payment due June 2014.
Beginning
Balance
Compensated absences
Net OPEB obligation
Notes payable - auto
Revenue bonds payable
Notes payable - repairs
Total Long-term liabilities
$
$
83,001
328,852
9,710
116,339
63,895
601,797
Additions
$
$
52,908
19,338
20,290
92,536
Deductions
$
$
70,548
302,810
4,534
116,339
494,231
Future maturities of long-term debt are as follows:
Year ending June 30,
2014
2015
2016
2017
2018
Interest
2,798
1,431
$
4,229
$
74
Principal
5,176
84,185
$
89,361
$
Amounts
due within
one year
Ending
Balance
$
$
65,361
45,380
5,176
84,185
200,102
$
$
35,295
5,176
40,471
HORRY COUNTY, SOUTH CAROLINA
NOTES TO FINANCIAL STATEMENTS
Note 9. Capital and Operating Leases and Other Long-Term Liabilities (continued)
C. Other Long-Term Liabilities (continued)
HCSWA at June 30, 2013
Beginning
Compensated absences
Net OPEB obligation
Landfill closure costs
Landfill postclosure care costs
Total Long-term liabilities
Balance
Additions
Deductions
317,634
1,063,751
13,694,577
6,719,363
$ 21,795,325
$ 263,961
232,795
4,506,242
1,362,487
$ 6,365,485
$ 231,847
23,096
$ 254,943
$
Ending
Amounts
due within
Balance
one year
$
349,748
1,273,450
18,200,819
8,081,850
$ 27,905,867
$
$
235,000
510,000
745,000
Total lease expense for the fiscal year ended June 30, 2013 was approximately $12,286.
Note 10. Amounts Due to Airlines (Signatory Airlines Agreements)
The Department of Airports, primarily the Myrtle Beach International Airport (the "MBIA"), has entered into
separate, but substantially similar, Signatory Airline Contract and Use Agreements (the Signatory Airline
Agreements) with 5 passenger airlines. The Signatory Airline Agreements had an original term commencing
July 1, 2002 and terminating June 30, 2007, but remain in effect on a month-to-month holdover basis. The
holdover term under each Signatory Airline Agreement may be terminated by either the County or the Signatory
Airline upon 30 days’ notice. The Airport is finalizing review of the terms of the new Signatory Airline
Agreement, which will be effective July 1, 2012. As of June 30, 2013, Spirit Airlines, US Airways, Delta Air Lines
(System), United Airlines and Vision Airlines were signatory airlines. Collectively, these carriers are called
“Signatory Airlines”.
mechanisms for the airfield and terminal facilities at the Airport. Interim rates charged during the fiscal year are
subject to a retroactive adjustment based upon actual year-end costs and activity levels (the Settlement). Any
Settlement owed to the Signatory Airlines is applied to any balance owed by the airlines for rates and charges.
For the fiscal year ended June 30, 2013, the County estimates the Settlement due to the Signatory Airlines is
$297,350. This amount is included in amounts due to tenants on the accompanying Statements of Net Position.
Horry County has also entered into agreements with airlines that serve the Airport and are not parties to
Signatory Airline Agreements, which are referred to Non-signatory Airlines. The County assesses fees, rentals,
and charges to the Non-Signatory Airlines at 125% of the fees, rentals, and charges charged to the Signatory
Airlines. The Non-Signatory Airlines do not participate in the year-end settlement. As of June 30, 2013, the
Non-Signatory Airlines operating at the Airport were Allegiant Air, Porter Airlines, and WestJet.
Horry County’s Air Service Development Program that began in September 2008 and continued for fiscal year
2013 provided, at the County’s sole discretion, for reduced landing fees from $2.03 to $1.36 per 1,000 lbs.,
which reduced landing and apron fee revenue by approximately $504,786. The airport also waived airline fees
of $309,237 as incentives for new service. The County has agreed to extend the Air Service Development
program. For fiscal year 2014, the combined incentive landing fee and apron fee for Signatory airlines will be
$.82 and $.14 per 1,000 lbs.
75
HORRY COUNTY, SOUTH CAROLINA
NOTES TO FINANCIAL STATEMENTS
Note 11. Landfill Closure and Postclosure Care Costs
Federal and state laws and regulations require the HCSWA to place a final cover on its permitted landfill sites when they stop
accepting waste and to perform certain maintenance and monitoring functions at the site for thirty years after closure. Although
closure and postclosure care costs will be paid only near or after the date the landfill stops accepting waste, the HCSWA
reports a portion of these closure and postclosure care costs as operating expenses in each period based on landfill capacity
used as of each balance sheet date. The percentage utilization of the estimated total capacity for each of the HCSWA's
permitted landfill sites was 100%, 66.2%, and 67.5% of the Unlined, Class 3 landfill sites, and construction and demolition
respectively. For purposes of postclosure care, the unlined and the construction and demolition landfills are considered a
single permitted site with 88.3% utilization of the estimated total capacity at June 30, 2013.
The closure and postclosure care liabilities at June 30, 2013 represent the cumulative amounts reported to date based on
utilization of the estimated total capacity of the permitted landfill sites less costs incurred to date and were as follows:
Closure Costs
Postclosure Care Costs
Total
Unlined
510
N/A
$
510
$
(amounts shown in thousands)
Construction
Class 3
& Demolition
$
7,520
$
10,171
4,610
3,472
$
12,130
$
13,643
$
$
Total
18,201
8,082
26,283
The HCSWA will recognize the remaining estimated closure and postclosure care costs, as shown below, as the remaining
estimated capacity of the permitted landfills are filled.
Postclosure
Closure Costs
Care Costs
Class 3
$
6,065
$
2,354
Construction and Demolition
5,044
$
N/A
Unlined / Construction and Demolition
N/A
460
$
11,109 $
2,814
The HCSWA has closed out the east and west hills of the unlined landfill, with the saddle area to be closed out during the year
ending June 30, 2014. The Subtitle D (Class 3) landfill is expected to be closed during the year ending June 30, 2019. The
construction and demolition landfill is anticipated to be closed during the year end June 30, 2025. The estimated closure and
postclosure care costs are based on what it would cost today to perform all required closure and postclosure care. Actual costs
ultimately incurred for closure and postclosure care may be higher due to inflation, changes in technology, or changes in
regulations.
The HCSWA is required by federal and state laws to provide financial assurance that funds will be available when needed for
closure and postclosure care costs through compliance with one of several approved alternative methods. The method utilized
by the SWA is the local government financial test. At June 30, 2013, the HCSWA is in compliance with federal and state
financial assurance requirements.
In accordance with formal resolutions of the HCSWA's Board of Directors, $12,112,600 and $7,133,842 of cash, cash
equivalents and investments at June 30, 2013 are designated for landfill closure and postclosure care costs, respectively. If
the designated funds are inadequate or additional closure and postclosure care requirements are mandated or otherwise found
to be necessary (due to changes in technology or applicable laws or regulations, for example) these costs need to covered
through additional charges to future landfill users.
Note 12. Net Position and Fund Balances
Net position:
Net position of the government-wide and proprietary fund financial statements represents the difference of total assets and
deferred outflows, less liabilities and deferred inflows. Reported amounts for net investment in capital assets and restricted net
assets are as follows at June 30, 2013:
Net investment in Capital Assets:
Primary Government
Component units
Less, G.O., special revenue bonds payable and
capital leases, net of unspent proceeds
Less, construction and retainage
payable for capital items
Total net investment in capital assets
Governmental
Activities
(amounts shown in thousands)
Component Units
Business-type
Activities
SHBS
HCSWA
$
$
703,547
(110,168)
$
(222)
593,157
229,217
-
$
(48,787)
$
76
(10,901)
169,529
937
$
(90)
$
847
36,244
-
$
36,244
HORRY COUNTY, SOUTH CAROLINA
NOTES TO FINANCIAL STATEMENTS
Note 12. Net Position and Fund Balances (continued)
As required by the County’s Financial Policies Ordinance, a fiscal stabilization reserve is to be maintained in the General Fund, the
Fire Fund, the Recreation Fund, and the Stormwater Management Fund. The fiscal stabilization reserve is to be maintained at an
amount equal to 15% of the fund's next year's budgeted expenditures and transfers out, excluding those amounts that are funded
by one-time funding sources. This policy was approved by County Council Ordinance 68-10 on October 10, 2010, therefore the
fiscal stabilization reserve is classified as “committed” or "restricted" fund balance. Ordinance 69-10 also requires all governmental
funds responsible for the payment of debt service to maintain an amount in fund balance equal to at least 50% of the next year's
debt service amount.
The adopted budget for fiscal year 2014 includes total expenditures and other uses. By reducing this total for any amount being
funded by a use of fund balance and/or debt service requirement, the current required stabilization reserve for each of the above
identified funds is reported below:
General Fund
Fire Fund
Stormwater Management Fund
Recreation Fund
General Debt Service Fund
FY 2014
Operating budget
$
128,846,213
$
18,290,898
$
4,376,000
$
4,252,503
n/a
15% Stabilization
reserve at
June 30, 2013
$
19,326,932
$
2,743,635
$
656,400
$
637,875
n/a
FY 2014 Debt
Service
n/a
$ 1,745,837
n/a
n/a
$ 14,376,784
Related restricted
fund balance at
June 30, 2013
n/a
$
872,919
n/a
n/a
$
11,021,254
At June 30, 2013 the Arcadian Shores Fund had a deficit fund balance of $149,326. This deficit fund balance will be repaid from
future tax revenues and fee increases.
Note 13. Capital Contributions (amounts shown in thousands)
For the governmental activities, capital contributions during the fiscal year ended June 30, 2013, is as follows:
Governmental
Activities
$
5
$
5
Donated capital assets
Total
For the proprietary (enterprise) funds, capital contributions during the fiscal year ended June 30, 2013, are as follows:
Business -Type
Activities
$
14,565
$
14,565
Grants and other cash contributions
Total
Capital contributions in the discretely presented component unit HCSWA for the fiscal year ended June 30, 2013, are as follows:
Grants and other cash contributions
Totals
$
$
77
HCSWA
278
278
HORRY COUNTY, SOUTH CAROLINA
NOTES TO FINANCIAL STATEMENTS
Note 14. Employee Benefit Plans
A. South Carolina Retirement and Police Officers' Retirement Systems
(with amounts expressed thousands)
The following retirement related disclosure is made under the current GASB Statements 25 & 27.
All County employees, except for police department personnel, participate in the South Carolina
Retirement System (SCRS), a cost-sharing, multiple-employer, public employee retirement system.
County police officers participate in the South Carolina Police Officers’ Retirement System (SCPORS), a
cost-sharing, multiple-employer, public employee retirement system.
The plan is administered by the Retirement Division of the South Carolina Public Employee Benefit
Authority (PEBA), a public employee retirement system. The County and generally all full-time or parttime equivalent County employees in a permanent position are required to participate in and contribute to
the SCRS or SCPORS as a condition of employment unless exempted by law as provided in Section 9-1480 of the South Carolina Code of Laws, as amended, or are eligible and elect to participate in the State
Optional Retirement Program (ORP). The plans provide a life-time monthly retirement annuity benefits to
members as well as disability, survivor options, annual benefit adjustments, death benefits, and incidental
benefits to eligible employees and retired members. The County’s contributions are actuarially
determined, but are communicated to and paid by the County as a percentage of the employees’ annual
earnings. The Retirement Division maintains five independent defined benefit plans and issues its own
publicly available Comprehensive Annual Financial Report (CAFR) which includes financial statements,
required supplementary information and actuarial valuation. A copy of the separately issued CAFR may
be obtained by writing to the South Carolina Public Employee Benefit Authority, P.O. Box 11960,
Columbia, South Carolina 29211-1960.
The County’s total payroll for the year ended June 30, 2013 was approximately $80,141 of which $43,201
and $36,939 were for employees covered by the SCRS and SCPORS, respectively. The County’s total
payroll for the year ended June 30, 2012 was approximately $80,003 of which $39,929 and $35,440 were
for employees covered by the SCRS and SCPORS, respectively. The County’s total payroll for the year
ended June 30, 2011 was approximately $80,697 of which $40,830 and $36,153 were for employees
covered by the SCRS and SCPORS, respectively.
The County’s actual contributions made for the SCRS and SCPORS equaled the required contributions.
The County’s required contributions to the SCRS for employer and employee portions for the year ended
June 30, 2013 expressed as a dollar amount and as a percentage of covered payroll in 2013 were $4,527
and 10.45% and $3,032 and 7.0%, respectively, and the contributions to the SCPORS for the employer
and employee portions were $4,418 and 11.90% and $2,599 and 7.0%, respectively. The County’s
required contributions to the SCRS for employer and employee portions for the year ended June 30, 2012
expressed as a dollar amount and as a percentage of covered payroll in 2012 were $3,977 and 9.38%
and $2,754 and 6.50%, respectively, and the contributions to the SCPORS for the employer and
employee portions were $4,210 and 11.36% and $2,408 and 6.50%, respectively. The County’s required
contributions to the SCRS for employer and employee portions for the year ended June 30, 2011
expressed as a dollar amount and as a percentage of covered payroll in 2011 were $3,982 and 9.39%
and $2,801 and 6.5%, respectively, and the contributions to the SCPORS for the employer and employee
portions were $4,154 and 11.53% and $2,426 and 6.50%, respectively.
In addition to the above rates, the County’s required contributions to the SCRS to provide a group life
insurance benefit for their participants for the year ended June 30, 2013 expressed as a dollar amount
and as a percentage of covered payroll were approximately $65 and 0.15% of annual earnings, and the
contributions to the SCPORS to provide a group life insurance benefit and an accidental death benefit for
their participants expressed as a dollar amount and as a percentage of covered payroll were
approximately $149 and 0.20%.
78
HORRY COUNTY, SOUTH CAROLINA
NOTES TO FINANCIAL STATEMENTS
Note 14. Employee Benefit Plans (continued)
A. South Carolina Retirement and Police Officers' Retirement Systems
(with amounts expressed thousands) (continued)
SBHS:
Employees of SBHS are also members of SCRS. Employer and employee contributions expressed as a
percentage of covered payrolls are 10.45% and 7.0%, respectively. Total payroll for the year ended June
30, 2013 was $1,156 of which $1,123 was for employees covered by SCRS. SBHC’s contributions for
the three most recent fiscal years ended June 30, 2013, 2012 and 2011 were $118, $124 and $122
respectively. SBHS paid employer group-life insurance contributions of $2 for their participants for the
year ended June 30, 2013.
SWA:
Members of the SCRS are required to contribute at the rate of 7.0% of their covered wages. The HCSWA
is required to contribute at an actuarially determined rate, currently 10.6%. The contribution requirements
of plan members and the HCSWA are established and may be amended by the SCRS. The HCSWA’s
contributions for the fiscal year ended June 30, 2013, 2012 and 2011 were $409, $363, and $360,
respectively. The contributions made by the SWA were equal to the required contributions for each year.
On June 26, 2012, South Carolina Governor Nikki Haley signed the Retirement Free Conference Report
on H.4967, the retirement reform legislation, into law. Plan modifications associated with this law become
effective July 1, 2012 and include annual SCRS and PORS retirement allowance increases through July
1, 2014 with certain cap provisions and other changes to retirement benefit calculation factors.
B. Post-Employment Benefits (with amounts expressed in thousands)
Other post employment healthcare benefits –
Plan Description
In addition to providing pension benefits, the County provides certain post-employment health care
benefits for retired employees with a hire date prior to July 1 2011, as per the requirements of a local
ordinance. On June 19, 2012 Horry County approved further modifications to the Retiree Health
Insurance plan through Resolution R-19-42, wherein post employment healthcare benefit changes were
made for two defined groups known as “Grandfathered” and “Non-Grandfathered”.
For grandfathered employees, the following plan modifications apply effective January 1, 2013:
Grandfathered retirees are those who are retirement eligible employees, and current employees who are
either 62 years old or have 23 or more years of County service as of December 31, 2012. Grandfathered
retirees continue to be eligible for health insurance benefits from the age of retirement until they reach the
age of 65, or otherwise become Medicare eligible, at the following coverage levels if they attain age fortysix (46) while working for the County, retire and draw benefits from SCRS or SCPORS system, and have
a minimum of fifteen (15) years service. The County will contribute to SCRS (regular retirees): 50% of
single coverage for employees with 15-22 years of service, 75% of single coverage for employees with
23-27 year of service, and 100% for employees with 28 or more years of service; for SCPORS (police
retirees): 50% of single coverage for employees with 15-21 years, 75% for 22-24 years and 100% for
employees with 25 years or more of service.
79
HORRY COUNTY, SOUTH CAROLINA
NOTES TO FINANCIAL STATEMENTS
Note 14. Employee Benefit Plans (continued)
B. Post-Employment Benefits (with amounts expressed in thousands) (continued)
Other post employment healthcare benefits –
Plan Description (continued)
For non-grandfathered employees, the following plan modifications apply effective January 1,
2013:
Non-Grandfathered retirees are defined as those with a hire date prior to July 1, 2011 who did not meet
the qualifications to be included in the “Grandfathered” group. These retirees will receive County subsidy
of health insurance only from the ages of 62 – 65. Employees can still retire before that age if they are
eligible, but the County will not pay the health insurance premiums until age 62. The retiree can stay on
the County plan and pay the total premiums personally, or opt-out of the plan and obtain coverage
elsewhere, then opt-back in to the plan at age 62 to receive the County funded benefit. The 75% tier is
eliminated. Employees are eligible for the County payment of 50% of the premiums, at 15 years of County
service, and 100% coverage at 28 years (SCRS) or 25 years (SCPORS) of service. The amount of the
County subsidy will not increase by more than 3% over the amount paid by the County in the prior
calendar year. Any increase in cost above 3% will be absorbed by the retiree. Those employees who
separate from County employment for any reason other than retirement and are then are rehired after
June 30, 2011 will be eligible to participate in the retiree health insurance plan upon their retirement;
however, the County will not pay any portion of their retiree health insurance premiums and they will not
be eligible to receive any County subsidy for the purposes of retiree health insurance.
Medicare – Eligible Provisions apply effective December 31, 2012:
County paid health insurance coverage ceases when the retiree becomes Medicare eligible. This change
becomes effective December 31, 2012 at which time the County will begin to contribute $150 on the first
banking day of each month in to a Health Reimbursement Arrangement account for the retiree to
purchase a Medicare supplemental insurance plan or to use for payment of out-of-pocket qualifying
medical expenses. This monthly contribution is pro-rated according to the retiree's years of service with
the County (50%, 75% if grandfathered, or 100%) and will increase annually by the lower of CPI-U (the
Consumer Price Index All Urban Consumers on a September over September basis) or 3% per year. This
is the only change that impacts current retirees and current retiree eligible employees or past employees
with a hire date prior to July 1, 2011.
Retiree Opt-Out
Retirees (employees who meet the retirement criteria eligibility at the time of terminating employment)
who decide to opt-out of health care plan will be eligible to opt back in. Non-grandfathered employees will
receive the County subsidy at age 62 if they choose to opt back in. There is no additional stipend
provided for those who opt-out of retiree health care.
Effective July 1, 2011, new hires of Horry County are no longer eligible to receive other post-employment
benefits. The ordinance reads that should this benefit be reinstated, the effective date would be July 1,
2011.
Deferred Retirement Benefits
Retirement plan vested employees who terminate employment with Horry County before they meet the
eligibility requirements as stated above are generally not eligible for Horry County retiree health care
benefits. The exception to this is that they are eligible for Horry County retiree health care benefits if they
return to Horry County Government and retire from the SCRS or PORS as a Horry County employee.
Employee must have been covered under the State Health Plan for the last five years of employment.
80
HORRY COUNTY, SOUTH CAROLINA
NOTES TO FINANCIAL STATEMENTS
Note 14. Employee Benefit Plans (continued)
B. Post-Employment Benefits (with amounts expressed in thousands) (continued)
Other post employment healthcare benefits –
Plan Description (continued)
Duty and Non-Duty Death in Service and Disability Retirement Benefits
Survivors of employees who die while actively employed are not eligible for retiree health benefits.
However, they are eligible for survivor insurance for one year at no cost to the surviving spouse, after
that, qualifying survivor has the option of selecting other insurance or continuing coverage at surviving
spouse’s expense. Employees who retire under a disability retirement are eligible for retiree health care
benefits based on years of service.
The Airport currently has 127 active employees and 7 retired members are eligible for OPEB as of June
30, 2013. Only one of the retired employees has opted for OPEB from the Airport, and that employee
worked for both the Airport and Horry County. The Airport reimburses Horry County for its share of the
OPEB expense.
Funding Policy
Horry County currently pays for post-employment benefits on a pay-as-you-go basis. The cost of these
benefits is recognized as an expenditure of the general fund as provided for in the annual budget
ordinance. These benefits will cease if funds are not available for appropriation. For fiscal year 2013, the
County contributed $597 for existing retirees, net of the implicit rate subsidy. As of year-end, there were
236 employees that were receiving benefits. These financial statements assume that a pay-as-you-go
funding policy will continue.
HCSWA:
Plan Description
The HCSWA retiree health care plan is a single-employer defined benefit health care plan administered
by the HCSWA. The plan provides medical and dental insurance benefits to eligible retirees. Benefit
provisions and contribution requirements of plan members and HCSWA are established and may be
amended by the HCSWA’s Board of Directors.
Employees retiring with at least twenty years of service as an employee of the HCSWA and receiving
benefits from the South Carolina Retirement System may elect to continue single coverage at a cost
established by PEBA. Employees retiring with at least ten years of service as an employee of the
HCSWA and receiving benefits from the South Carolina Retirement System may elect to continue single
coverage with fifty percent of the cost of coverage provided by the HCSWA and the remaining fifty
percent provided by the retiree. Employees retiring at age sixty five or older with at least five years of
service as an employee of the HCSWA and receiving benefits from the South Carolina Retirement
System may elect to continue single coverage with one hundred percent of the cost of coverage provided
by the retiree. If an eligible retiree accepts employment with another organization that provides health
care benefits, the HCSWA coverage will no longer be provided. During the year ended June 30, 3013,
plan members receiving benefits contributed $40,193 (approximately 64% of total premiums) for the cost
of retiree health insurance coverage.
Funding Policy
HCSWA pays for post-employment health care benefits on a pay-as-you-go basis. During the year ended
June 30, 2013, the HCSWA contributed $23 (approximately 36% of total premiums) for the cost of retiree
health insurance coverage.
81
HORRY COUNTY, SOUTH CAROLINA
NOTES TO FINANCIAL STATEMENTS
Note 14. Employee Benefit Plans (continued)
B. Post-Employment Benefits (continued)
Other post employment healthcare benefits –
SBHS:
Plan Description
Prior to July 1, 2012 Shoreline Behavioral Health Services had agreed to provide qualified retirees all or
part of the health care benefits afforded to regular employees. Effective July 1, 2012 the plan was closed
to new participants and Shoreline Behavioral Health Services discontinued all payments toward the cost
of retiree health insurance premiums for employees. At the time of the policy change, there were two
employees with more than twenty years of consecutive service with the agency who were grandfathered
into the plan. As a result, the following exceptions were made for those two grandfathered staff upon
retirement:
•
•
The agency will pay 100% of the total premium for single employee/retiree coverage
(health/dental). Additional dependent coverage is available but will be paid for by the retiree.
Upon reaching Medicare eligibility, the retiree will have the option to choose Medicare
supplement coverage under the State Health Plan or through other private carriers. Shoreline
BHS will pay premiums through a Health Retirement Account arrangement as listed below:
• State Health Plan $150*
• Private Medicare Supplement 100% of premium for Medicare Supplement plan,
applicable Part D Prescription plan, state of SC basic Dental plan and administrative fee
*The amount of $150 will increase by the lower of the CPI-U or 3% per year.
Retired non-grandfathered staff will have the opportunity to continue on the agency plan and pay the
premiums personally or opt out and obtain coverage elsewhere. See **Special Item – SBHS (below) for
the resulting impact to the financial statements.
Funding Policy
SBHS pays for post-employment health care benefits on a pay-as-you-go basis. During the year ended
June 30, 2013, SBHS contributed $0 towards the cost of retiree health insurance coverage. SBHS has
recorded a post-employment benefit obligation in the amount of $45,380 at June 30, 2013 as SBHS did
not meet its contractually required contribution for the fiscal year.
82
HORRY COUNTY, SOUTH CAROLINA
NOTES TO FINANCIAL STATEMENTS
Note 14. Employee Benefit Plans (continued)
B. Post-Employment Benefits (continued)
Other post employment healthcare benefits –
Annual OPEB costs and Net OPEB Obligation
The County’s annual other postemployment benefit (OPEB) cost is calculated based on the annual
required contribution of the employer (ARC), an amount actuarially determined in accordance with the
parameters of GASB Statement 45. The ARC represents a level of funding that, if paid on an ongoing
basis, is projected to cover normal cost each year and amortize any unfunded actuarial liabilities (or
funding excess) over a period not to exceed thirty years. The following table shows the components of
the County’s annual OPEB cost for the year, the amount actually contributed to the plan, and changes in
the County’s net OPEB obligation:
Businesstype
Governmental
General
Police
Component Units
Airport
Total
HCSWA
SBHS
Employer Normal Costs $
645,298 $
666,073 $ 42,164 $ 1,353,535 $ 125,452 $
Amortization of UAL*
$
399,438 $
641,669 $ 23,823 $ 1,064,931 $
Annual Required
Contribution (ARC)
$ 1,044,736 $ 1,307,743 $ 65,987 $ 2,418,466 $ 190,645 $ 19,696
Interest on Net OPEB
Obligation
$
467,190 $
463,203 $ 28,397 $
958,790 $
47,869 $
1,172
Adjustment to ARC
$
(432,846) $
(429,153) $ (26,310) $
(888,309) $
(5,719) $
(1,530)
Annual OPEB Costs
$ 1,079,080 $ 1,341,793 $ 68,074 $ 2,488,947 $ 232,795 $ 19,338
Contributions made
$
622,946 $
Increase in net OPEB
obligation
$
456,134 $ 1,143,413 $ 50,104 $ 1,649,651 $ 209,699 $ 19,338
Net OPEB Obligationbeginning of year
$ 10,381,992 $ 10,293,398 $ 631,051 $ 21,306,441 $ 1,063,751 $ 328,852
One-time adjustment for
$
plan change **
Net OPEB Obligation –
end of year
-
$
198,380 $ 17,970 $
-
$
-
$
839,296 $
-
$
-
65,193 $ 19,696
23,096 $
-
-
$ (302,810)
$ 10,838,126 $ 11,436,811 $ 681,155 $ 22,956,092 $ 1,273,450 $ 45,380
* Unfunded Actuarial Accrued Liabilities (UAL) were amortized over 30 years; amortizations periods are
open.
** Special Item - SBHS
In the OPEB note above, during the fiscal year ended June 30, 2013, SBHS changed the terms of the
post-employment benefit plan eliminating a significant number of the potentially eligible individuals. As a
result, SBHS recognized a one-time special item in the accounting records as a result in the actuarial
calculation of the associated liability in the amount of $302,810.
83
HORRY COUNTY, SOUTH CAROLINA
NOTES TO FINANCIAL STATEMENTS
Note 14. Employee Benefit Plans (continued)
The County’s annual OPEB cost, the percentage of annual OPEB cost contributed to the plan, and the
net OPEB obligation for 2013 and the preceding year are as follows:
Fiscal Year
Ended
Annual OPEB
Cost
Percentage of Annual OPEB Cost
Contributed
Net OPEB
Obligation
2011
$5,602,291
17.27%
$19,672,757
2012
$2,413,102
32.30%
$21,306,441
2013
$2,488,947
33.72%
$22,956,092
HCSWA and SBHS’s annual OPEB cost, the percentage of annual OPEB cost contributed to the plan,
and the net OPEB obligation for 2013:
Fiscal Year
Ended
Annual OPEB
Cost
Percentage of Annual OPEB Cost
Contributed
Net OPEB
Obligation
2011
$329,268
5.10%
$1,090,534
2012
$323,622
6.66%
$1,392,603
2013
$252,133
9.16%
$1,318,830
Funded Status and Funding Progress
The funded status of the plans as of June 30, 2013, was as follows:
Business-type
Governmental
Actuarial accrued liability
Actuarial value of plan assets
Unfunded actuarial accrued liability
(UAAL)
Funded Ratio
Covered payroll
Unfunded actuarial accrued liability
as a % of covered payroll
General
Police
$ 9,301,650
$14,942,445
-
Component Units
Airport
$
-
571,426
-
$
571,426
HCSWA
SBHS
$1,563,703
$
$
$
-
$ 9,301,650
$14,942,445
$1,563,703
0.00%
0.00%
0.00%
0.00%
$39,433,327
$36,155,619
$ 4,643,862
$3,795,347
23.59%
41.33%
12.30%
41.20%
$
335,270
335,270
0.00%
$
117,915
284.33%
The schedule of funding progress, presented as required supplementary information following the notes
to the financial statements, presents multiyear trend information that shows whether the actuarial value of
plan assets is increasing or decreasing over time relative to the actuarial accrued liabilities for benefits.
84
HORRY COUNTY, SOUTH CAROLINA
NOTES TO FINANCIAL STATEMENTS
Note 14. Employee Benefit Plans (continued)
Actuarial Methods and Assumptions
Actuarial valuations of an ongoing plan involve estimates of the value of reported amounts and
assumptions about the probability of occurrence of events well into the future. Examples would include
assumptions about future employment, rates of retirement, mortality, and health care cost trends.
Actuarially determined amounts are subject to continual revision as actual results are compared to past
expectations and new estimates are made about the future. Projections of benefits for financial reporting
purposes are based on the substantive plan (the plan understood by the employer and plan members)
and include the types of benefits provided at the time of each valuation and the historical pattern of
sharing of benefit costs between the employer and plan members to that point.
In the June 30, 2011, actuarial valuation, the Projected Unit Credit, Level Percent of Payroll actuarial cost
method was used. The UAAL amortization payment is the level percent of payroll (assumed to increase
3%) required to fully amortize the UAAL over a 30 year period or closed basis. The actuarial assumptions
included 4.5% rate of investment return. General inflation is assumed to be 3.0% per year. The valuation
assumes a health care trend inflation rate as follows:
Year
2012
2013
2014
2015
2016
2017
2018
2019
2020
2021
2022
2023
2024 and later
Health Care Trend Inflation Rates
Drug
6.24%
7.25
7.00
6.75
6.50
6.25
6.00
5.75
5.50
5.25
5.00
4.75
4.50
Medical
6.24%
7.25
7.00
6.75
6.50
6.25
6.00
5.75
5.50
5.25
5.00
4.75
4.50
Dental
3.00%
3.00
3.00
3.00
3.00
3.00
3.00
3.00
3.00
3.00
3.00
3.00
3.00
Horry County has not established a trust fund for GASB 45 funding therefore, there is no separate audit
report available.
SBHS:
In the July 1, 2013, actuarial valuation, a discount rate of 4.5% was used for the estimated long-term
investment yield on the investments, and turnover rates are in accordance with the Alternative
Measurement Method. The per capita claims cost and insurance trend inflation assumptions were
obtained from the June 30, 2008 Actuarial GASB 45 Valuation Report for the State of South Carolina
Retiree Health Care Plan and adjusted to 2010.
HCSWA:
In the June 30, 2010, actuarial valuation, the projected unit credit actuarial cost method was used. The
actuarial assumptions included 4.5% rate of investment return and an annual health care cost trend rate
of 7.3% initially, reduced to an ultimate rate of 4.5% after thirteen years. Both rates included a 3.0%
inflation assumption. The actuarial value of assets was determined using techniques that spread the
effects of short-term volatility in the market value over a five-year period. The UAAL is being amortized as
a level percent of active member payroll over a thirty-year period on a closed basis. The remaining
amortization period at June 30, 2010 was twenty seven years.
85
HORRY COUNTY, SOUTH CAROLINA
NOTES TO FINANCIAL STATEMENTS
Note 15. Segment Information
The County has elected to present disaggregated information regarding all enterprise funds in the
proprietary fund, statement of net position, statement of revenue, expenses and changes in net position,
and statement of cash flows.
The Department of Airports Enterprise Fund is responsible for operation, maintenance and development
of the County's Airport System - including Conway, Grand Strand, and Loris general aviation airports and
the Myrtle Beach International Airport (MBIA). The County's discretely presented component units
HCSWA and SBHS were created by the County to develop and implement a solid waste disposal and
resource recovery/recycling system and to provide services to reduce the negative health, social and
economic consequences resulting from the use of alcohol and other drugs, for the County, respectively.
Disaggregated information of the component units is presented in the basic financial statements.
Major Customers and Economic Condition - Department of Airports
Airline revenues, leases, concessions, and rental car activities, generate approximately 80% of the
Airport's revenues or just over $14.8 million of the $18.5 million net operating revenue. Signatory Airlines
generate $4.5 million in revenue after surcharges.
Rates and charges of Signatory Airlines, which serve MYR, represented 24% in fiscal year 2013 and 23%
in fiscal year 2012, of the total operating revenues reported for MYR. Of the leading Signatory Airline
carriers, Spirit Airlines represents 49% of the airline traffic, U.S. Airways represents 26%, Delta Air Lines
(System) 18%, United Airlines 3%.
For the year ended June 30, 2013, there were three customers whose balance represents approximately
41% of the accounts receivable balance. For year ended June 30, 2012, three customers made up
approximately 54% of the accounts receivable balance.
Aviation Trust Funds - Due From Other Governments
Pursuant to certain agreements with the Federal Aviation Administration (FAA), the City of Myrtle Beach,
South Carolina maintains an Airport Trust Fund which holds resources received from leases of certain
parcels of property near the Myrtle Beach International Airport. Funds are to be made available for Airport
purposes through agreement with the FAA. In April 2004, the parties reached a new agreement through
which the Airport received $2,000,000 from the fund on January 1, 2005. Beginning in 2005, and
continuing each and every year thereafter, Horry County shall receive 75% of the proceeds and the City
of Myrtle Beach shall receive 25%. As part of the agreement, the Airport is required to spend $6 million
on Harrelson Blvd (a road that runs near the Airport). The Airport recognized $1,873,612 and
$3,889,880, in non-operating revenues for funds received from this trust fund during the years ended
June 30, 2013 and 2012, respectively.
86
HORRY COUNTY, SOUTH CAROLINA
NOTES TO FINANCIAL STATEMENTS
Note 16. Joint Enterprise - Baseball Stadium
The County entered into various agreements with the City of Myrtle Beach and proportionately shares in
the ongoing financial interest and responsibility for a professional minor-league baseball stadium. A
summary of those agreements are as follows:
Pursuant to a Ballpark Management Agreement dated September 1, 1998 (the "Management
Agreement"), the City of Myrtle Beach, South Carolina and the County collectively agreed to develop, own
and operate a baseball stadium facility in Myrtle Beach, South Carolina (the “Project”). The Management
Agreement provides that the Project shall be jointly owned with the City having an undivided 70%
ownership interest in the Project and the County having a 30% undivided ownership interest, and further
provides that the net profits and losses of the joint enterprise shall be divided in proportionate shares to
the City's and County's respective ownership interests.
Pursuant to an Installment Purchase Agreement, dated September 1, 1998, between the City of Myrtle
Beach, South Carolina and Myrtle Beach Public Facilities Corporation, a South Carolina nonprofit
corporation, $10,295,000 in Certificates of Participation, Series 1998, were issued to defray the cost of
construction of the baseball stadium.
Pursuant to a Hospitality Fee Agreement, dated September 1, 1998, between the County and the City of
Myrtle Beach, South Carolina, the County agreed to make payments of an amount equal to 30% of the
required debt service requirements of the Certificates. The County's proportionate debt service payments
shall be made solely from amounts derived by the County's special revenue fund portion of the County
1% Hospitality Fee and shall not be deemed to be general obligations of the County or payable from the
road fund portion of the County’s 1.5% Hospitality Fee, or from any other source of revenues, fees, or
taxes.
As security for its obligation to make payments under the Hospitality Fee Agreement, the County has
pledged and granted a security interest in the County Hospitality Fees to the extent of the lesser of
$300,000 or the amount due in any bond year pursuant to the Hospitality Fee Agreement. This amount is
shown as part of the committed fund balance in the Special Obligation Debt Service Fund.
While the stadium is under joint control by the City and County, no separate entity or organization of the
baseball stadium exists as of June 30, 2013. Accordingly, the County has reported activities in the
baseball stadium as a special revenue fund. Separate financial statements of the baseball stadium are
presently not available.
87
HORRY COUNTY, SOUTH CAROLINA
NOTES TO FINANCIAL STATEMENTS
Note 17. Intergovernmental Agreements - RIDE Projects
During fiscal years 1998 and 2000, and pursuant to the Horry County Road Improvement and
Development Effort program (the "RIDE Program"), the County adopted and enacted its Ordinances
#105-96 and #7-97 and entered into various long-term loan agreements with the South Carolina
Transportation Infrastructure Bank (the “SIB”) to provide funding for various road construction projects in
Horry County. Pursuant to a certain Master Loan Agreement (as amended), SIB agreed to make available
financial assistance to Horry County in the amounts totaling up to $744,415,526 for the RIDE Tables 1
and 3 projects specified in Intergovernmental Agreements (IGA) #1 and #2.
During fiscal year 2002, the County adopted and enacted Ordinance #45-02 to approve
Intergovernmental Loan Agreement #3, which calls for Horry County to make certain contributions
towards the projects from an existing special revenue fund admissions tax and to amend prior RIDE loan
agreements.
These agreements are summarized as follows:
Intergovernmental Agreement #1- dated March 10, 1998 (as amended)
As amended, SIB agreed to make one or more loans available to Horry County totaling up to $545 million
for Table 1 projects of the RIDE application.
Table 1 Projects and Assignment - The allocation and use of the $545 million in SIB funding between the
RIDE Projects is set forth in Table 1 of the RIDE application, namely $291.3 million for the Conway
Bypass, $209.5 million for the Carolina Bays parkway, and $44.2 million for Highway 544 widening.
Horry County assigned South Carolina Department of Transportation (SCDOT) to be its sole and
exclusive agent for the RIDE Program. In connection with the construction of the Conway Bypass,
SCDOT shall be paid a management fee of $3.0 million, in 36 monthly installments with the first payment
due upon execution of the agreement. SCDOT agreed to provide the County and the SIB $114 million
toward the construction of Table 1 projects.
Horry County further agreed to be responsible for up to $291.3 million under the Assigned Contract with
SCDOT, plus $2.5 million in respect of right-of-way acquisition and utility relocation costs in excess of $15
million.
Term of the Agreement and Repayment By Horry - Horry County shall make payments over 20 years on
IGA Loan #1 as set-forth in amended agreements by paying $15 million per year, for 20 years, ($300
million total) beginning with the first payment due July 1, 1998, at zero (0%) percent interest. All
subsequent payments shall be made in quarterly installments of $3.75 million each, with the first such
quarterly payment due October 1, 1998. Horry County covenants to pay when due all sums owing to the
SIB under the terms of this agreement.
Source of Funds for Repayment - Horry County shall make payments from its Hospitality 1.5% Special
Revenue Fund created by Ordinances #105-96 and #7-97. Horry County shall not be obliged to make
payments from any other source of funds available to Horry County, provided that these Ordinances are
not repealed or amended in any way that would reduce or halt the deposit of hospitality fees into the
Hospitality 1.5% Special Revenue Fund or abolish that Fund.
Maintenance Contribution - Horry County shall pay SCDOT $100,000 per year for 20 years (a total of
$2.0 million) over and above the construction costs amounts of Table 1 projects above, for the purpose of
defraying the costs of maintenance on the RIDE Projects. The first such payment shall be made one year
after the Conway Bypass is opened to traffic (in year 2002), with succeeding payments to be made on the
anniversary dates thereafter.
88
HORRY COUNTY, SOUTH CAROLINA
NOTES TO FINANCIAL STATEMENTS
Note 17. Intergovernmental Agreements - RIDE Projects (continued)
Pursuant to IGA #3, Exhibit B (dated May 21, 2002) the maintenance contribution liability of $2.0 million
was deleted in its entirety.
Intergovernmental Agreement #2 - dated April 21, 1998 (as amended)
As amended, SIB agreed to fund Table 3 projects of the RIDE application by way of loans of up to $199.4
million to Horry County for Table 3 projects, and an additional $48.2 million loan for Table 1 projects in the
RIDE plan, all secured by payments from Horry County.
Term of the Agreement and Repayment by Horry - Horry County shall make payments over 20 years as
set-forth in an attachment to the agreement. The annual loan repayments, as shown on an attachment to
the agreement, are due and payable in equal quarterly installments on March 31, June 30, September 30,
and December 31 of each calendar year, beginning March 31, 2000, and ending December 31, 2016, or
date final repayments on all loans hereunder have been made. From revenues deposited into the Loan
Servicing Account, SIB shall cause the state treasurer to make payments required under IGA Loans # 1
and #2.
Establishment of Loan Servicing Account - The SIB established with the state treasurer a separate
account known as the "Loan Servicing Account". Horry County will thereafter deposit all future receipts of
the 1.5% portion of its Hospitality Fee (net of administrative takedown as described in ordinances #10596 and #9-97) into this account (subject to the establishment of the Loan Reserve Account). SIB will
make transfers from this account to make loan payments under this Agreement and payments under IGA
#1 and #2.
Establishment of Loan Reserve Account - The SIB established a special interest bearing account with the
state treasurer known as the "Loan Reserve Account". For repayment of IGA #1 and #2, Horry County
agreed to transfer the entire current cash balance and all future hospitality fee collections in its special
revenue fund to this account. The state treasurer may invest the funds in its "Local Government
Investment Pool" or such other funds or instruments as state treasurer deems appropriate. All interest
earned on such funds will accrue to the Loan Reserve Account. The balance will remain with the SIB
throughout the term of the IGA Loans and will be used as a reserve and to make up possible shortfalls in
revenues available to make annual loan repayments and to provide credit enhancements. The SIB, at its
sole discretion, may use such funds for the purchase of insurance or other third-party guaranties to
enhance the projected revenues to be received from Horry County.
Hospitality Fees collected by Horry County are forwarded to the SIB monthly. Any annual revenues over
and above the amount necessary to make loan repayments from the Loan Servicing Account are
deposited to the "Loan Reserve Account". At the end of the term of IGA Loan #1 and #2, any balance
held in the Loan Reserve Account will be returned to Horry County.
Amendment to Master Loan Agreement
Pursuant to an amendment to the Master Loan Agreement (dated April 27, 1999), SIB agreed to provide
for $95 million additional loans to Horry County for Phase II of the Conway Bypass Project in Table 1.
SIB's agreement to loan Horry County the additional $95 million under IGA #1 for the Conway Bypass
Project increase requires SCDOT to repay the $95 million loan for Horry County in its entirety.
Intergovernmental Agreement #3 - dated May 21, 2002
Horry County and the SIB agreed to additional funding and construction of an additional phase of the
RIDE Program in Horry County not to exceed $198 million. Accordingly, Horry County pledged revenues
derived from a certain admissions tax totaling $2,279,950, and the funding of other related highway
projects identified in the application in the approximate amount of $20,550,000. SIB agreed to fund the
balance of the construction costs through grants.
89
HORRY COUNTY, SOUTH CAROLINA
NOTES TO FINANCIAL STATEMENTS
Note 17. Intergovernmental Agreements – RIDE Projects (continued)
Term of Agreement and Contribution by Horry
Beginning May 31, 2002, Horry County promises to pay, from any legally available sources or revenues
of Horry County, the sum of $2,279,950 in amounts equal to the collection of revenues derived from a
certain special revenue admissions tax, including all interest or other earnings thereon. Horry County
shall make consecutive quarterly payments until such balance is paid in full.
The agreement further requires Horry County, from its own sources of funds, to fund and complete the
component projects identified in the application totaling $20,550,000. The schedule for completion of
these projects shall be left to the discretion of Horry County in accordance with Ordinance #174-99 (MultiCounty Business Park) and any related ordinances or agreements.
Amendments to Previous Agreements
Exhibit B of IGA #3, amended IGA #1 and #2 (and their amendments) to (1) clarify and conform certain
provisions in those agreements with each other and to the requirements of lenders, credit rating agencies,
or bond insurers involved with the SIB, and (2) to confirm quarterly debt repayment requirements
pursuant to a prioritization schedule - which includes IGA Loan #1 totaling $300 million as first priority due
in quarterly installments of $3.75 million (with zero percent interest) through June 2017, amending IGA
Loan #2 repayment amounts (originally totaling $247,577,644 in loan amounts) to a total repayment
amount of $352,440,172 with $162,100,000 (known as the "insured portion") to be paid in quarterly
installments through the year ended June 30, 2022 and $190,340,172 (known as the "uninsured portion")
to be paid in quarterly installments through the year ended June 30, 2022.
Additionally, Exhibit B calls for the state treasurer to withhold funds allotted or appropriated by the State
to Horry County and apply those funds to make or complete required debt service payments should Horry
County fail to make any payment as required under the RIDE agreements.
On December 18, 2003, the Commission of the South Carolina Department of Transportation (SCDOT),
agreed to replace the County’s $10 million reserve requirement with an SCDOT guarantee of an equal
amount upon the following changes to the loan agreement: Horry County extends its Hospitality Fee
Ordinance for a period not to exceed five (5) years; and the County agrees to restructure its annual loan
payments based upon new financial projections. If Horry County utilizes the $10 million reserve; it will be
repaid to SCDOT at some future time when the County’s funds are sufficient to make the necessary
repayments.
This agreement was paid in full on May 29, 2009.
In June of 2007, the County entered into an intergovernmental agreement with the State Infrastructure
Bank in which the County received a funding commitment for the Widening of 707 of $150 million from the
State Infrastructure Bank. In November of 2007, the County entered into an additional intergovernmental
agreement with the State Infrastructure Bank in which the County received additional funding in the
amount of $85 million for the Widening of 707. $235 million was made available for immediate
distribution by the State Infrastructure Bank. A portion of the local sales tax ($93.6 million) serves as the
local match for the funds contributed by the County for the Widening of 707.
90
HORRY COUNTY, SOUTH CAROLINA
NOTES TO FINANCIAL STATEMENTS
Note 18. Commitments and Contingencies
Litigation - The County is party to various legal proceedings that normally occur in governmental
operations. County officials believe the legal proceedings are not likely to have a material adverse effect
on the County's financial position.
The discretely presented component unit HCSWA is also a defendant in various lawsuits. The outcome of
the lawsuits is not presently determinable; however HCSWA's management does not believe the
settlement of these matters will have a material effect on its financial condition.
Federal and State Assisted Programs
In the normal course of operations, the County participates and receives grant funds from various federal
and state agencies. The grant programs are subject to audit by agents of the granting authority to insure
compliance with conditions precedent to the granting of funds. Such audits could result in the possible
liability for reimbursement or refund of grant monies to the grantor agencies. However, the County's
management believes that any liability for reimbursement which may arise as the result of such audits
would not be material to the financial position of the County.
Commitments
The County has undertaken significant road construction projects to address transportation needs within
the County. The construction program known as Road Improvement and Development Effort (RIDE) is
being implemented in phases and includes a series of interconnected highway construction and road
enhancements that will improve the transportation network in the County.
The participating parties for the RIDE project are the County, the South Carolina Transportation
Infrastructure Bank and the South Carolina Department of Transportation. The role of the South Carolina
Transportation Infrastructure Bank is to provide the necessary financing and funding for the RIDE project.
Major projects in RIDE are the Conway Bypass (Highway 22), a six-lane controlled access highway
between Aynor and Conway at Highway 501 to U.S. 17 near the Myrtle Beach Mall (formerly known as
the Colonial Mall); and Carolina Bays Parkway (Highway 31); a six-lane limited access highway between
S.C. Highway 9 in the North and S.C. Highway 544 in the South; a four-lane bridge spanning the
Intercoastal Waterway at Fantasy Harbour; and the North Myrtle Beach Connector , a four-lane road
connecting S.C. Highway 90 and U.S. 17 to the Carolina Bays Parkway. Other projects resulted in
improvements to S.C. Highway 544, S.C. Highway 501 and U.S. 17. In fiscal year 2007, the County
received approval of a $40 million grant from the South Carolina Transportation Infrastructure Bank Board
for engineering and environmental work and right of way acquisitions for extension of the Carolina Bays
Parkway and the widening of S.C. 707. During fiscal year 2008, the County received notification that the
State Infrastructure Bank approved a commitment to provide funding of $85 million for the continued
extension of Carolina Bays Parkway (Highway 31) to the southern portion of Horry County ending at S.C.
Highway 707; there is no matching requirement on these funds.
The County had a total of $12,576,109 in encumbrances at June 30, 2013. Encumbrances for the major
funds are as follows: $707,693 is encumbered in the General Fund primarily related to public works
maintenance; $1,147,711 is encumbered in the General Capital Improvements Project Fund primarily
related to the capital projects of the boat ramp, appraisal software (CAMA), Manatron software,
toughbooks for Police and the Carolina Forest Library; $4,903,575 is encumbered in the Capital Project
Sales Tax Fund primarily for the repaving, resurfacing and road expansion projects funded by the one
cent capital road sales tax. Other significant encumbrances from non-major funds at June 30, 2013 are:
the Road Maintenance & CTC Fund had $1,390,992 in encumbrances primarily related to multiple road
paving projects; the Economic Development Fund had $626,960 in encumbrances related to performance
agreements to Myrtle Beach Regional Economic Development Corporation; and the CDBG Grant
Program Special Revenue Fund had $983,021 of encumbrances. The Internal Service Fund had
$1,747,373 in encumbrances primarily related to heavy equipment replacement.
91
HORRY COUNTY, SOUTH CAROLINA
NOTES TO FINANCIAL STATEMENTS
Note 18. Commitments and Contingencies (continued)
Grants - During the year ended June 30, 2013, the Airport received grants from the FAA and TSA to fund
certain improvements and expansions. In connection with these grants, the Airport is obligated to
administer the program and spend the grant monies in accordance with regulatory restrictions and is
subject to audit by the grantor agency. In the event of noncompliance, the agency may require the Airport
to refund program awards.
On December 1, 2012, a Revenue Guaranty Agreement was entered into between the County and
WestJet Airlines, a legally separate entity located in Canada. For consideration of the guaranty, WestJet
agrees to operate scheduled airline service between Toronto, Canada and Myrtle Beach International
Airport twice per week for the period May 1, 2013 through October 31, 2013, the guaranty period. The
County shall guarantee that WestJet will receive the minimum 15% operating margin for the scheduled
service during the guaranty period. If the profit margin meets or exceeds 15% during the guaranty period,
then no payment is due to WestJet from the County. If the profit margin fails to reach 15%, the County
shall pay to WestJet the difference between the actual profit margin and the amount of additional total
revenue as would be necessary to result in a 15% profit margin up to a maximum of $1,000,000. WestJet
shall issue and deliver the operational report no later than forty-five (45) days following the close of the
guaranty period. The County shall make payment within thirty (30) days of receipt of the report.
The County provided an irrevocable letter of credit in the amount of $1,000,000 to WestJet to secure the
full and timely payment and performance by the County as required in the Revenue Guaranty Agreement.
The letter of credit was issued by Wells Fargo Bank, NA on April 29, 2013 and will expire on January 30,
2014. The letter of credit agreement required a deposit of $1,000,000 into a restricted account with Wells
Fargo Bank, NA. As of June 30, 2013, the County’s Statement of Net Position includes $1,000,000 in
restricted cash and Net Position - restricted for other purposes.
The County’s potential liability exposure under this Revenue Guaranty Agreement is estimated at
approximately $551,948. This liability exposure will be lowered by third-party funds to the extent
payments to WestJet reimburse out-of-pocket marketing expenses which are estimated at $500,873,
leaving a balance to be paid by the County of $51,075. The County has determined that as of June 30,
2013, the potential liability exposure to WestJet related to this revenue guaranty is fully reimbursable from
third-party funds. Accordingly, no liability is reflected in the statement.
The County Council approved Ordinance No. 81-12 on January 8, 2013 which provides for the issuance
and sale of general obligation bonds in a principal amount not exceeding $850,000 for the purposes of
providing road improvements, drainage improvements and other public works improvements within the
Hidden Woods Special Tax District. Bonds will be marketed after design, engineering, and bidding are
complete.
Department of Airports
Capital Projects Contingency - As of the audit date aggregate unresolved contract claims for payment
made by contractors who performed work on the Terminal Capacity Enhancement Project (TCEP), for
services completed on or before June 30, 2013, were asserted at a combined value of $7,240,195. The
Horry County Department of Airports believes a reasonable estimated settlement of these claims may be
valued at $3,029,722 and has accrued that value to the TCEP assets as of June 30, 2013.
92
HORRY COUNTY, SOUTH CAROLINA
NOTES TO FINANCIAL STATEMENTS
Note 19. Risk Management
The County and its component units are exposed to various risks of loss related to torts; theft of, damage
to and destruction of assets; errors and omissions; workers compensation; and natural disasters for which
commercial insurance is carried. The County and its component units carry commercial insurance to
cover all losses, excluding vehicle comprehensive and collision coverage and including workers'
compensation. During the year ended June 30, 2013, there were no significant reductions in insurance
coverage from the prior year. Insured claims have not exceeded the County's coverage in any of the past
five (5) years.
In management’s opinion, claim losses in excess of insurance coverage, if any, is unlikely and if it
occurred, would not be significant. Therefore, no loss accrual has been made in these financial
statements. Furthermore, there is no evidence of asset impairment or other information to indicate that a
loss expense and liability should be accrued at year-end.
93
HORRY COUNTY, SOUTH CAROLINA
NOTES TO FINANCIAL STATEMENTS
Note 20. Reconciliation of Government-Wide and Fund Financial Statements
A. Explanation of differences between the governmental fund balance sheet and the government-wide
statement of net position
The governmental fund balance sheet includes a reconciliation between fund balance amounts and
net asset-governmental activities. The details of the reconciled amount are as follows:
Total fund balances - governmental funds
$ 414,319,904
Capital assets (exclusive of Internal Service Fund Capital Assets) in
governmental activities are not financial resources and therefore are not
reported in the fund financial statements.
Capital assets
Less, accumulated depreciation
Net amount reported
823,342,803
(133,244,179)
690,098,624
Some of the County's taxes will be collected after year end, but are not
available soon enough to pay for current period expenditures.
Property taxes, net of allowance for collectible
Accomodations Tax
Capital Project Sales Tax
4,559,584
789,567
14,193,188
Net amount reported
19,542,339
Internal service funds are used by management to charge the costs of
fleet services to individual funds. The assets and liabilities of
the internal service fund are included in governmental activities
in the Statement of Net Position.
31,262,864
OPEB costs reported in the statement of activities does not require the use of current
financial resources and therefore is not reported as a liability in the governmental funds
(22,274,937)
Long-term liabilities, including bonds payable that are not due and payable in the curren
period and, therefore, are not reported in these funds.
General obligation bonds
Special obligation bonds & certificates of participation
Capital leases payable
Deferred charges
Bond premium
SC Transportation Infrastructure Bank Loan (SIB)
Less: Net present value adjustment of SIB loan
Compensated Absences
Accrued interest
(109,651,193)
(1,860,000)
(3,868,681)
2,692,938
(2,187,334)
(234,016,659)
3,949,292
(12,453,637)
(1,597,841)
Net amount reported
(358,993,115)
Net Position, end of year - governmental activities
$ 773,955,679
94
HORRY COUNTY, SOUTH CAROLINA
NOTES TO FINANCIAL STATEMENTS
Note 20. Reconciliation of Government-Wide and Fund Financial Statements (continued)
B. Explanation of differences between the governmental statement of revenues, expenses and fund
balances and the government-wide statement of activities
The governmental fund Statement of Revenue, Expenses and Changes in Fund Balances includes a reconciliation
between net changes in fund balance and changes in net position-governmental activities. The details of the reconciled
amounts are as follows:
$
Net change in fund balance - governmental funds
43,577,684
Governmental funds report capital outlays as expenditures. However, in the statement of
activities, the cost of those assets are allocated over their estimated useful lives and reported
as depreciation expense. This is the amount by which capital outlay exceeds depreciation in
the current period.
Capital outlay expenditures
Depreciation expense
Net amount reported
20,287,961
(13,683,074)
6,604,887
Revenues in the Statement of Activities that do not provide current financial resources are
not reported as revenues in these funds.
Property taxes, capital project sales tax & accommodations tax
1,106,697
Contributed property is not reported as revenue in governmental funds. However, in the
statement of activities, the cost of property contributed is reported in the current period. In
the current period, these amounts are:
Donation of capital assets
5,000
Some expenditures reported in the Statement of Activities do not require the use of current
financial resources and, therefore, are not reported as expenditures in the governmental
funds.
Net post employment benefit obligation
Accrued compensated absences
Imputed interest on SIB debt
Other general government expenditure liabilities
Net amount reported
(1,599,547)
947,119
(2,085,044)
550,000
(2,187,472)
The issuance of long-term debt provides current financial resources to governmental funds,
while repayment of principal and interest consumes current financial resources of
governmental funds. This amount is the net effect of these differences in the treatment of
long-term debt and related items.
Repayments of G.O., S.O. bond & Certificates of Participation principal
Repayments of SC Transportation Infrastructure Bank Loan (SIB) principal
Proceeds from capital leases
Repayments of capital leases
Change in accrued interest expense & amortization of bond premium
Net amount reported
11,180,914
26,403,710
(460,300)
1,855,359
(28,058)
38,951,625
The net revenue and transfer of fund balance of certain activities of internal service funds
reported with governmental activities.
Change in Net Position - governmental activities
1,763,597
$
95
89,822,018
HORRY COUNTY, SOUTH CAROLINA
NOTES TO FINANCIAL STATEMENTS
Note 21. Service Concession Arrangement
In August 2011 Horry County and its agent, Horry County Department of Airports, entered into a contract
with Republic Parking System, Inc. to provide a paid parking concession for passengers of the Myrtle
Beach International Airport for a term of 59 months. Per agreement, Republic Parking System, Inc. is to
provide parking services to airport customers, using airport-owned parking lots and airport-owned parking
revenue-management equipment.
Due to the nature of this agreement, whereas Republic Parking System, Inc. is the operator and Horry
County Department of Airports is the transferor, it has been classified as a Service Concession
Arrangement defined in GASB Statement Number 60. The parking lots and the parking revenuemanagement equipment have been classified as a capital asset of the Horry County Department of
Airports. The present value of the guaranteed minimum lease payments for the term of the agreement are
classified as an Asset of the Horry County Department of Airports, with an offsetting Deferred Inflow,
which will be systematically amortized each year as the minimum annual guaranteed revenue and any
auxiliary commissions revenue are recorded.
During fiscal year 2013, parking concessions revenues recorded were $1,806,205. $1,437,557 of revenue
recognized in fiscal year 2013 represents amortization of the service concession agreement during the
fiscal year. $348,648 represents commissions received on operating results in excess of the minimum
annual guarantee. During fiscal year 2012, parking revenues recorded were $1,806,205. $1,214,966
represents amortization of the service concession agreement during the fiscal year. $591,239 represents
commissions received.
Agreement terms do not specify guarantees or commitments required of Horry County Department of
Airports. Accordingly, no liabilities have been recorded in conjunction with this contractual arrangement
for either year presented.
The Horry County Department of Airports fiscal year 2012 Statement of Net Position has been restated to
reflect the valuation of the Service Concession Arrangement as of June 30, 2012. The Statement of Net
Position displays the net present value of the arrangement as Non-Current Assets and also as a Deferred
Inflow of Resources for each year presented. There were no adjustments made to Net Position for either
year as a result of the restatement.
2013
Opening Service Concession Arrangement and Deferred inflow
of resources
Amortization of discounted minimum annual payments
Service Concession Arrangement and Deferred inflow of
resources at June 30,
96
2012
$
6,229,595
(1,437,557)
$
7,444,561
(1,214,966)
$
4,792,038
$
6,229,595
HORRY COUNTY, SOUTH CAROLINA
NOTES TO FINANCIAL STATEMENTS
Note 22. New Accounting Pronouncements
In February of 2009, the GASB issued Statement No. 54, Fund Balance Reporting and Governmental
Fund Type Definitions. This Statement establishes new categories for reporting fund balance and revises
the definitions for governmental fund types. The requirements of this Statement are effective for financial
statements for reporting periods beginning after June 15, 2010. The County implemented GASB 54 with
June 30, 2011 reporting and recategorized June 30, 2010 fund balances for comparative reporting
purposes. With the implementation of GASB 34 and the new definition for Special Revenue Funds, the
County eliminated three previously reported Special Revenue Funds. They are: Hospitality 1.0%,
Hospitality 1.5% and Local Accommodations. These revenues are recorded directly to the funds they
benefit.
In November of 2010, the GASB issued Statement No. 60, Accounting and Financial Reporting for
Service Concession Arrangements. This Statement establishes accounting and financial reporting
guidance for service concession arrangements (SCA), which are a type of public-private or public-public
partnership. These SCA’s may include payments from the operator to the government for the right to
build, operate or collect user fees on infrastructure or other public assets and provide for revenue sharing
between the government and the operator during the term of the arrangement. The requirements of this
Statement are effective for financial statements for reporting periods beginning after December 15, 2011.
This Statement will have an impact with the Airport’s financial statements but the amount has not yet
been determined.
In November of 2010, the GASB issued Statement No. 61, The Financial Reporting Entity: Omnibus and
amendment of GASB Statements No. 14 and No. 34. This Statement is to improve financial reporting for
a governmental financial reporting entity. This statement modifies existing requirements for the
assessment of potential component units in determining what should be included in the financial reporting
entity and financial reporting entity display and disclosure requirements. This statement also amends the
criteria for reporting component units as if they were part of the primary government (blended component
units) in certain circumstances. For component units that are currently blended based on the
“substantively the same governing body” criterion, it additionally requires that 1) the primary government
and the component unit have a financial benefit or burden relationship or 2) management (below the level
of the elected officials) of the primary government have operational responsibility for the activities of the
component unit. The requirements of this Statement are effective for financial statements for reporting
periods beginning after June 15, 2012.
In December 2010, the GASB issued Statement No. 62, Codification of Accounting and Financial
Reporting Guidance Contained in Pre-November 30, 1989 FASB and AICPA Pronouncements. This
statement is to incorporate into the GASB’s authoritative literature certain accounting and financial
reporting guidance that is included in the following pronouncements issued on or before November 30,
1989, which does not conflict with or contradict GASB pronouncements:
1) Financial Accounting Standards Board (FASB) Statement and Interpretations
2) Accounting Principles Board Opinions
3) Accounting Research Bulletins of the American Institute of Certified Public Accountants’ (AICPA)
Committee on Accounting Procedure.
The requirements of this Statement are effective for financial statements for periods beginning after
December 15, 2011.
97
HORRY COUNTY, SOUTH CAROLINA
NOTES TO FINANCIAL STATEMENTS
Note 22. New Accounting Pronouncements (continued)
In March 2012, the GASB issued Statement No. 65, Items Previously Reported as Assets and Liabilities.
This Statement establishes accounting and financial reporting standards that reclassify, as deferred
outflows of resources or deferred inflows of resources, certain items that were previously reported as
assets and liabilities and recognizes, as outflows of resources or inflows of resources, certain items that
were previously reported as assets and liabilities. The requirements of this Statement are effective for
financial statements for periods beginning after December 15, 2012. Earlier application is encouraged.
In March 2012, the GASB issued Statement No. 66, Technical Corrections—2012—an amendment of
GASB Statements No. 10 and No. 62. The objective of this Statement is to improve accounting and
financial reporting for a governmental financial reporting entity by resolving conflicting guidance that
resulted from the issuance of two pronouncements, Statements No. 54, Fund Balance Reporting and
Governmental Fund Type Definitions, and No. 62, Codification of Accounting and Financial Reporting
Guidance Contained in Pre-November 30, 1989 FASB and AICPA Pronouncements. The provisions of
this Statement are effective for financial statements for periods beginning after December 15, 2012.
Earlier application is encouraged.
In June 2012, the GASB issued Statement No. 67, Financial Reporting for Pension Plans—an
amendment of GASB Statement No. 25. The objective of this Statement is to improve financial reporting
by state and local governmental pension plans. This Statement results from a comprehensive review of
the effectiveness of existing standards of accounting and financial reporting for pensions with regard to
providing decision-useful information, supporting assessments of accountability and interperiod equity,
and creating additional transparency. This Statement replaces the requirements of Statements No. 25,
Financial Reporting for Defined Benefit Pension Plans and Note Disclosures for Defined Contribution
Plans, and No. 50, Pension Disclosures, as they relate to pension plans that are administered through
trusts or equivalent arrangements (hereafter jointly referred to as trusts) that meet certain criteria. The
requirements of Statements 25 and 50 remain applicable to pension plans that are not administered
through trusts covered by the scope of this Statement and to defined contribution plans that provide
postemployment benefits other than pensions. The provisions of this Statement are effective for financial
statements for periods beginning after June 15, 2013. Earlier application is encouraged. This Statement is
not expected to have an impact on the County’s financial statements.
In June 2012, the GASB issued Statement No. 68, Accounting and Financial Reporting for Pensions—an
amendment of GASB Statement No. 27. The primary objective of this Statement is to improve accounting
and financial reporting by state and local governments for pensions. It also improves information provided
by state and local governmental employers about financial support for pensions that is provided by other
entities. This Statement results from a comprehensive review of the effectiveness of existing standards of
accounting and financial reporting for pensions with regard to providing decision-useful information,
supporting assessments of accountability and interperiod equity, and creating additional transparency.
The provisions of Statement 68 are effective for fiscal years beginning after June 15, 2014. Earlier
application is encouraged.
In January 2013, the GASB issued Statement No. 69, Summary of Statement No. 69
Government Combinations and Disposals of Government Operations. This Statement establishes
accounting and financial reporting standards related to government combinations and disposals of
government operations. As used in this Statement, the term government combinations includes a variety
of transactions referred to as mergers, acquisitions, and transfers of operations. The provisions of
Statement 69 are effective for fiscal years beginning after December 15, 2013. Earlier application is
encouraged.
98
HORRY COUNTY, SOUTH CAROLINA
NOTES TO FINANCIAL STATEMENTS
Note 22. New Accounting Pronouncements (continued)
In April 2013, the GASB issued Statement No. 70, Accounting and Financial Reporting for Nonexchange
Financial Guarantees. The objective of this Statement is to improve accounting and financial reporting by
state and local governments that extend and receive nonexchange financial guarantees. The provisions
of Statement 70 are effective for fiscal years beginning after June 15, 2013. Earlier application is
encouraged.
Note 23. Subsequent Events
The County Council approved Ordinance No. 40-13 on August 13, 2013 to advance refund or refinance a
portion of the General Obligation Bonds Series 2005A. This refinance will provide for the issuance and
sale of taxable bonds not to exceed $18,000,000. Bonds will be marketed if interest rates decline to
sufficiently realize desired savings.
On September 13, 2013, County Council enacted ordinance 35-13 approving a lease agreement with
PTR Industries, Inc. for property located in the Cool Springs Industrial Park. Associated with this lease,
the County will make improvements totaling $1.85 million which will be funded by $1.1 million in restricted
funds in Economic Development, and $.4 million in new Rural Development Funds, and $.35 million in
new State of South Carolina Grants.
On October 10, 2013, the County entered into a master equipment lease/purchase agreement with Banc
of America Public Capital Corp. in the principal amount of $3.9 million to fund a portion of the costs to
implement an enterprise resource planning and property tax software.
Department of Airports
On February 19, 2013 Horry County Council approved resolution-24-13, authorizing the County to enter
into an asset Purchase Agreement with Grand Strand Aviation, Inc. d/b/a/ Ramp 66, the Fixed Base
Operator at the Grand Strand Airport in North Myrtle Beach, South Carolina. The agreement was
executed and Horry County Department of Airports commenced operations at the Grand Strand Airport
on July 16, 2013. The purchase price was $808,168 and includes transaction costs.
99
REQUIRED SUPPLEMENTARY INFORMATION
HORRY COUNTY, SOUTH CAROLINA
REQUIRED SUPPLEMENTARY INFORMATION FOR GOVERNMENT'S THAT USE A BASIS
OF ACCOUNTING THAT DIFFERS FROM GAAP
FOR THE YEAR ENDED JUNE 30, 2013
A. Basis of Budgeting
The policy established by the County with respect to the Budget is substantially the same as GAAP, with one
exception. The County’s budget basis accounting differs from GAAP in accounting for capital lease financing
transactions. For budgetary basis accounting, these transactions are not recorded as other financing sources
when funded and expenditures when the equipment is acquired, as required by GAAP.
However, there is no difference in fund balance because of this, thus the County considers its budget to be
GAAP basis.
100
HORRY COUNTY, SOUTH CAROLINA
BUDGETARY COMPARISON SCHEDULES
GENERAL FUND
FOR THE YEAR ENDED JUNE 30, 2013
(with comparative actual amounts for for the year ended June 30, 2012)
2013
Budget
Original
Revenues
Real property taxes
Personal property taxes
Vehicle taxes
Intergovernmental
Fees and fines
Documentary stamps
License and permits
Interest on investments
Cost allocation
Other
Total revenues
Expenditures
General Government:
County Council
County Administrator
Administration Division
Finance
Department Overhead
Human Resources
Procurement
IT/GIS
Assessor
Assessor Appeals Board
Registrar of Deeds
Maintenance
Voter Registration and Election
Public Information
Budget and Revenue Management
Treasurer
Auditor
Probate Judge
Master in Equity
Legal
Grant Administration
Delegation
Hospitality
Business License
Total
Less, capital outlay
Net general government
$
1,062,273
503,566
170,482
1,155,258
3,574,937
1,136,945
390,550
6,466,562
3,222,151
8,218
1,050,413
4,643,091
516,362
275,803
188,249
1,821,164
1,409,118
882,553
430,889
849,299
423,797
101,836
256,774
225,474
30,765,764
(1,176,243)
29,589,521
$ 64,584,000
4,728,500
4,350,000
13,016,200
22,046,273
2,285,362
6,402,550
76,894
3,005,488
2,637,335
123,132,602
1,618,704
337,641
169,702
1,369,879
4,744,556
1,136,945
389,010
6,205,212
3,221,691
8,218
1,050,413
4,699,743
523,606
281,803
188,249
1,820,345
1,431,489
882,553
430,889
847,299
249,893
101,836
285,632
224,733
32,220,041
(418,994)
31,801,047
- CONTINUED -
101
Variance
Positive
(Negative)
Actual
Amounts
Final
64,584,000
4,728,500
4,350,000
11,378,966
21,897,225
2,285,362
6,402,550
76,894
3,005,488
2,610,998
121,319,983
2012
$
65,076,726
4,578,270
5,219,154
13,220,699
23,985,655
2,763,904
7,343,942
103,680
2,786,824
3,561,772
128,640,626
939,618
210,096
162,195
1,243,517
3,834,814
1,115,711
305,941
5,945,241
2,966,105
4,657
908,958
4,243,487
635,179
270,366
184,987
1,842,717
1,424,558
900,205
429,526
734,267
37,074
100,760
281,316
217,874
28,939,169
(302,961)
28,636,208
$
492,726
(150,230)
869,154
204,499
1,939,382
478,542
941,392
26,786
(218,664)
924,437
5,508,024
679,086
127,545
7,507
126,362
909,742
21,234
83,069
259,971
255,586
3,561
141,455
456,256
(111,573)
11,437
3,262
(22,372)
6,931
(17,652)
1,363
113,032
212,819
1,076
4,316
6,859
3,280,872
(116,033)
3,164,839
Actual
$ 64,479,022
4,718,300
4,284,754
11,156,116
21,578,879
2,340,425
6,537,417
62,338
3,167,359
2,601,911
120,926,521
826,123
369,089
165,448
1,120,264
3,475,128
1,093,277
352,944
6,444,614
2,927,061
1,971
945,546
4,126,620
528,998
269,537
182,995
1,804,405
1,371,735
873,177
412,995
556,295
44,204
98,834
245,155
206,737
28,443,152
(514,668)
27,928,484
HORRY COUNTY, SOUTH CAROLINA
BUDGETARY COMPARISON SCHEDULES
GENERAL FUND
- CONTINUED -
2012
2013
Budget
Original
Final
Actual
Amounts
Variance
Positive
(Negative)
Actual
Public Safety:
Solicitor
Public Defender
Clerk of Court - Circuit DSS Family
Magistrate No. 1 Conway
Magistrate No. 2 Aynor
Magistrate No. 4 Mt. Olive
Magistrate No. 5 Loris
Magistrate No. 6 Myrtle Beach
Magistrate No. 7 Steven Cross Road
Magistrate No. 11 Surfside
Magistrate at Large No. 1
Magistrate at Large No. 2
Central Summary Court
Communications
Assistant County Administrator
Sheriff
Police
Central Processing - DSS
Emergency Management
Emergency 911 Communications
Coroner
Detention Center
Emergency Medical Services
Animal Care Center
Pre-trial Intervention
Total
Less, capital outlay
Net public safety
5,298,674
1,544,606
2,545,616
263,408
169,087
201,878
200,263
332,364
201,883
175,573
106,981
354,892
560,092
2,088,663
316,813
4,772,261
17,235,611
65,748
445,322
2,863,381
713,451
20,600,376
13,435,769
921,575
668,000
76,082,287
(706,100)
75,376,187
5,298,659
1,544,606
2,565,094
263,408
164,273
200,428
199,363
332,778
202,191
175,573
106,981
355,942
560,491
2,098,441
336,279
4,783,318
17,193,548
60,753
447,649
2,863,367
710,451
20,733,990
13,479,582
944,002
668,000
76,289,167
(524,443)
5,104,091
1,516,627
2,592,854
268,406
162,283
201,887
181,966
338,711
177,948
177,828
116,715
371,793
562,183
2,089,985
333,443
4,839,940
16,714,613
60,901
442,621
2,763,902
679,070
19,618,561
13,404,538
936,647
606,275
74,263,788
(471,185)
75,764,724
73,792,603
- CONTINUED -
102
194,568
27,979
(27,760)
(4,998)
1,990
(1,459)
17,397
(5,933)
24,243
(2,255)
(9,734)
(15,851)
(1,692)
8,456
2,836
(56,622)
478,935
(148)
5,028
99,465
31,381
1,115,429
75,044
7,355
61,725
2,025,379
(53,258)
1,972,121
5,137,942
1,404,519
2,536,603
266,201
165,267
200,150
198,050
310,934
203,643
177,090
108,642
362,311
581,430
1,739,055
335,424
4,834,220
17,060,773
66,078
440,680
2,700,222
665,999
19,677,859
13,182,834
897,167
564,436
73,817,529
(135,884)
73,681,645
HORRY COUNTY, SOUTH CAROLINA
BUDGETARY COMPARISON SCHEDULES
GENERAL FUND
- CONTINUED -
2013
Budget
Original
Expenditures (continued)
Infrastructure and Regulation:
Assistant County Administrator
County Engineer
Public Works
Codes Enforcement
Planning
Total
Less, capital outlay
Net infrastructure and regulation
2012
Actual
Amounts
Final
Variance
Positive
(Negative)
Actual
307,848
1,297,023
8,169,159
2,828,172
1,617,412
14,219,614
(54,900)
14,164,714
306,606
1,317,806
8,940,744
2,828,172
1,617,412
15,010,740
(94,490)
14,916,250
228,408
981,558
7,433,316
2,353,754
1,438,146
12,435,182
(54,485)
12,380,697
Health and Social Services:
Medically Indigent Assistance Program
Health Department
Department of Social Services
Veteran Affairs
Total
Net health and social services
1,266,221
140,000
91,046
260,701
1,757,968
1,757,968
1,266,852
130,940
111,406
265,701
1,774,899
1,774,899
1,266,550
124,335
89,535
254,880
1,735,300
1,735,300
302
6,605
21,871
10,821
39,599
39,599
1,225,211
125,516
83,202
218,584
1,652,513
1,652,513
Culture, Recreation, and Tourism:
Library
Museum
Total
Less, capital outlay
Net culture, recreation and tourism
4,205,246
481,476
4,686,722
4,686,722
4,242,863
504,628
4,747,491
4,747,491
3,836,084
494,679
4,330,763
4,330,763
406,779
9,949
416,728
416,728
3,400,544
327,157
3,727,701
(31,214)
3,696,487
Other:
Other Agencies:
Total other
1,119,308
1,119,308
1,194,308
1,194,308
1,194,308
1,194,308
-
1,906,348
1,906,348
Capital outlay
1,937,243
1,037,927
828,631
209,296
735,454
128,631,663
131,236,646
122,898,510
8,338,136
121,853,363
13,846,160
(926,842)
45,365
6,749
3,961
56,075
93,546
3,714,608
(3,243,535)
564,619
13,902,235
$ 13,902,235
(362,223)
37,063,884
36,701,661
Total expenditures
Excess of revenues over expenditures
(7,311,680)
(8,104,044)
5,742,116
Other Financial Sources (Uses)
Sale of assets
Transfers in
Transfers out
Total other financing sources (uses)
100,000
1,774,090
(2,850,814)
(976,724)
100,000
1,774,090
(4,372,475)
(2,498,385)
145,365
1,780,839
(4,368,514)
(2,442,310)
Net change in fund balance
Fund balance at beginning of year
Fund balance at end of year
(8,288,404)
36,701,661
28,413,257
(10,602,429)
36,701,661
$ 26,099,232
$
103
$
3,299,806
36,701,661
40,001,467
78,198
336,248
1,507,428
474,418
179,266
2,575,558
(40,005)
2,535,553
251,028
1,041,607
7,173,757
2,417,955
1,421,773
12,306,120
(53,688)
12,252,432
$
HORRY COUNTY, SOUTH CAROLINA
REQUIRED SUPPLEMENTARY INFORMATION FOR GOVERNMENTS THAT USE THE
MODIFIED APPROACH FOR INFRASTRUCTURE ASSETS
FOR THE YEAR END JUNE 30, 2013
A. Condition Rating and Actual Maintenance/Preservation of Horry County's Road Infrastructure
Horry County's road system consists of approximately 53.6% paved roads and 46.4% unpaved roads. The condition of the road
pavement is measured using several distress factors found in pavement surfaces. Horry County implemented a Pavement
Management System (MicroPAVER) on July 1, 2010 in an effort to better assess the paved road network in the County. The pavement
management system uses a measurement scale called a Pavement Condition Index (PCI) to rate road condition and the PCI is
correlated to the 1-5 condition ranking. Each road is ranked from 1 for failed pavement to 5 for a pavement in perfect condition. The
condition index is used to classify roads in good or better condition (rating 4 or 5), fair condition (rating 3), and substandard condition
(rating 1 or 2). It is the County's goal to maintain at least 70 percent of its paved road system at fair or better condition level. No more
than 30 percent should be in a substandard condition. Condition assessments are completed every year.
The County created a long-term road improvement program that had been paving at least 16 miles of dirt roads per year from FY04
through FY08. In FY09, as a result of an expected revenue shortfall, this was decreased to 14.5 miles and in FY10 it was further
reduced to 9.7 miles per year. Due to continued revenue shortfalls, it was further reduced to 8.9 miles in FY 11 and 9 miles in FY 12
(which included 1 mile funded by the County Transportation Committee (CTC)). Funding for the dirt road paving program has
stabilized during FY 13 to allow approximately 11 miles of paving per year (including the one mile of CTC-funded improvements). As
the County dirt roads are paved, they become part of the County's paved road network and are added to the MicroPaver pavement
management system.
The actual maintenance of the unpaved roads involves scraping each road every three weeks depending on the weather. At this time,
management believes it is impossible to conduct a meaningful condition assessment for dirt roads because road conditions can
change daily depending on traffic, weather, soils, and the County's maintenance schedule.
The costs of maintaining unpaved roads accounts for an estimated 75% of the Public Works Department annual operating budget.
Several factors that have occurred over the past several years that has affected the County's paved road network are as follows:
1) Since the end of FY 2004, the County's paved roadway network has nearly doubled (96% increase). Approx. 393 paved miles
at the end of FY 2004 compared to 769 paved miles at the end of FY 2013.
2) The current economic conditions, as well as County Council's shifting $1,750,000 in revenue out of Road Fund (34) has resulted
in a reduction in the road improvement fund. This loss of revenue has reduced the paving and resurfacing programs.
3) In May 2007, a one-cent sales tax was passed and is dedicated to specific road projects, included is the paving of 100 miles of
dirt roads and the resurfacing of 67 miles of County maintained roads over a 7 year period.
*4) As stated above, Horry County implemented a MicroPAVER Pavement Management System on July 1, 2010. Each paved road
has been inspected and ranked based on it's condition using the PCI (Pavement Condition Index). This program is much more
accurate when determining the networks condition because each paved road is visited annually and rated. Since the new Pavement
Management Program utilizes a PCI the figures & condition ratings for FY 11 do not correlate to previous numbers. The maintenance
costs needed for roads in substandard condition decreased $5,267,831 primarily due to the new program in FY11. Maintenance costs
needed at June 30, 2013 are $5,845,108.
5) In FY09 County Council increased the road maintenance fee by $10.00 and dedicated it to the resurfacing program.
The following tables depict the condition and maintenance costs of the County's road infrastructure:
Arterial
Collector
Access
Overall system
Arterial
Collector
Access
Overall System
Percentage of Miles in Fair or Better Condition
Condition
2013
2012
2011*
75.9%
81.1%
81.1%
81.3%
76.8%
72.8%
91.8%
89.9%
85.7%
91.0%
88.5%
84.4%
2013
24.1%
18.7%
8.2%
9.0%
Percentage of Miles in Substandard
Condition
2012
18.9%
23.2%
10.1%
11.5%
* Note 4 above
104
2011*
18.9%
27.2%
14.3%
15.6%
HORRY COUNTY, SOUTH CAROLINA
REQUIRED SUPPLEMENTARY INFORMATION FOR GOVERNMENT'S THAT USE THE
MODIFIED APPROACH FOR INFRASTRUCTURE ASSETS
FOR THE YEAR END JUNE 30, 2013
- CONTINUED A. Condition Rating and Actual Maintenance/Preservation of Horry County's Road infrastructure
(continued)
2013
Arterial:
Needed
Actual
$
Comparison of Needed-To-Actual Maintenance/Preservation
2012
2011*
2010
357,000
29,540
$
387,000
-
$
165,965
-
$
376,530
10,721
$
2009
304,911
84,912
Collector:
Needed
Actual
1,181,000
335,773
1,522,000
224,373
779,027
158,357
1,050,433
6,158
871,842
147,800
Access:
Needed
Actual
5,663,000
990,579
6,669,000
2,312,218
3,253,398
1,728,335
8,039,258
1,345,558
6,716,057
1,231,778
7,201,000
1,355,892
$ 5,845,108
8,578,000
2,536,591
$ 6,041,409
4,198,390
1,886,692
$ 2,311,698
9,466,221
1,362,437
$ 8,103,784
7,892,810
1,464,490
$ 6,428,320
Overall System:
Needed
Actual
Difference
* See Note 4 on previous page.
B. Condition Rating and Actual Maintenance/Preservation of Department of Airport's Infrastructure
Infrastructure Assets
Certain elements of the Myrtle Beach International Airport’s runway, aprons, taxiways, drainage systems, etc. which comprise
the “Infrastructure Assets” were obtained in conjunction with the USAF property conveyance described in detail in Note. 1
Summary of Significant Accounting Policies.
Condition assessments for environmental systems are made regularly and in accordance with the Airport’s annual storm water
maintenance plan, which is subject to annual audit by the Department of Health and Environmental Control (“DHEC”). There
were no unfavorable DHEC audits during the fiscal periods covered in this annual report.
The Airport developed a Pavement Management and Maintenance Study (PMMS) in 2000 and again in 2010. The basis for the
condition measurement of airfield systems using the Pavement Condition Index (PCI) are distresses found in the pavement
surfaces. The Airport has a PMMS completed periodically (5-10 years) or as required by the Federal Aviation Administration
(FAA). The Airport has had 2 annual FAA Part 139 inspections since the last formal PMMS, and they were passed successfully.
The PCI scale used to assess and report conditions ranges from zero for a failed pavement to 100 for a pavement in new or
excellent condition. Generally, ratings 71 and above require only routine preventative maintenance. Pavement ratings of 41-70
typically require major rehabilitation. Pavements with PCI values of below 40 require major reconstruction.
In 2010, the Weighted PCI Value for MYR was found to be 65, illustrating the fact that the majority of pavement at MYR was in
need of rehabilitation. The Airport’s goal is a Weighted PCI greater than 71. In 2000, the Weighted PCI for the airport was a 76
exceeding the airport’s goal of greater than 71.
The Airport’s policy has been to comply with all FAA requirements and has placed condition assessment reliance on additional
FAA requirements in evaluating the condition of the Infrastructure assets and in ensuring the safety of the passengers of the
airport.
105
HORRY COUNTY, SOUTH CAROLINA
REQUIRED SUPPLEMENTARY INFORMATION FOR GOVERNMENT'S THAT USE THE
MODIFIED APPROACH FOR INFRASTRUCTURE ASSETS
FOR THE YEAR END JUNE 30, 2013
- CONTINUED B. Condition Rating and Actual Maintenance/Preservation of Department of Airport's Infrastructure (continued)
Because of safety requirements all Airport infrastructure is constantly maintained. FAA 14 CFR Part 139 requires the following activities: (3)
daily assessments of the airfield, which include but are not limited to inspection of the runway and taxiways pavement for wear or repair
needs, painting/striping, signage, etc.
An Inspection log is maintained, resulting in a traceable history of maintenance items addressed. The Airport undergoes a rigorous Part 139
audit annually. Management of the Airport believes it is not cost effective to obtain a complete condition assessment every three years and
believes that the FAA requirements, together with the additional Airport and state regulatory inspection policies, are sufficient to assess the
condition of the Airport infrastructure.
The most recent complete condition assessment of the Airport's infrastructure assets is as follows (year of assessment shown in):
Area Weighted PCI Value
Infrastructure Asset:
Airfield & runway subsystem and roads for:
Myrtle Beach International (MYR) (2010)
Airfield & runway subsystem and roads for:
Myrtle Beach International (MYR) (2000)
65
76
The next complete condition assessment is scheduled for fiscal year 2016.
The following table represents the estimated and actual maintenance costs of the MYR pavement infrastructure. During the past five years,
maintenance and preservation of the infrastructure have been undertaken to prevent further deterioration of pavement condition while the
Airport develops a comprehensive program to raise the average PCI to a level of 71 or greater. HCDA is currently in the preliminary design
phase of the proposed rehabilitation of the MYR Runway which will greatly increase the average PCI for MYR in the future.
Fiscal year ended June 30,
Estimated Cost of Maintenance
Actual Cost of Maintenance
2013
2012
2011
2010
2009
$44,680
$60,400
$44,000
$50,000
$54,000
$60,937
$96,900
$54,600
$43,500
$56,700
Since 2009, the following pavement improvements to increase the capacity of the taxiways and ramps have taken place. While these projects
have increased the capacity of the airfield system, they will also have a positive impact by increasing the weighted PCI for MYR:
·
MYR South Ramp Expansion ($3.6M) - This project expanded the MYR commercial ramp size by nearly 50% in order to
accommodate additional aircraft and the new terminal.
·
MYR “B-2” ($2.8M) - This project included the construction of a new taxiway in order to general aviation and charter aircraft
faster access to and from the runway.
·
MYR Ramp Rehabilitation ($2.8M) - This project removed all remaining asphalt pavement on the Commercial Ramp at
MYR and replaced it with 12 inches of P-501 Concrete over 5 inches of Cement Treated Base.
·
MYR Expansion of Taxiway “A” ($5M) - In order to expand the existing Ramp for the proposed New Terminal, Taxiway “A”
was expanded.
106
HORRY COUNTY, SOUTH CAROLINA
REQUIRED SUPPLEMENTARY INFORMATION FOR GOVERNMENT
SCHEDULE OF FUNDING PROGRESS OTHER
POST EMPLOYMENT BENEFITS PLAN
FOR THE YEAR END JUNE 30, 2013
The County's annual OPEB cost, the percentage of annual OPEB cost contributed to the plan, and the net OPEB obligation are as follows:
Fiscal Year
Ended
2008
2009
2010
2011
2012
2013
Annual OPEB
Cost
$
$
$
$
$
$
Percentage of
Annual OPEB
Cost Contributed
5,510,608
5,692,932
5,425,242
5,602,291
2,413,102
2,488,947
6.71%
7.52%
14.62%
17.27%
32.30%
33.72%
Net OPEB
Obligation
$
$
$
$
$
$
5,140,807
10,405,564
15,037,859
19,672,757
21,306,441
22,956,092
Funded status and Funding Progress
The funded status of the plan as of June 30, 2013 was as follows:
General
Police
Airport
Actuarial
valuation
date
6/30/2007
6/30/2007
6/30/2007
Fiscal Year
Ended
6/30/2008
6/30/2008
6/30/2008
Actuarial value
of plan assets
(a)
$0
$0
$0
General
Police
Airport
6/30/2007
6/30/2007
6/30/2007
6/30/2009
6/30/2009
6/30/2009
General
Police
Airport
6/30/2009
6/30/2009
6/30/2009
General
Police
Airport
Actuarial accrued
liability (AAL) (b)
Funded
ratio
(a/b)
0.00%
0.00%
0.00%
UAAL as a
percentage of
covered
Covered payroll
payroll
(c)
$
38,989,986
77.73%
$
30,483,561
58.99%
$
4,349,632
26.48%
$
$
$
30,307,044
17,983,147
1,151,637
Unfunded AAL
(UAAL) (b-a)
$
30,307,044
$
17,983,147
$
1,151,637
$0
$0
$0
$
$
$
33,737,013
21,214,682
1,366,632
$
$
$
33,737,013
21,214,682
1,366,632
0.00%
0.00%
0.00%
$
$
$
36,659,940
33,011,365
4,352,388
92.03%
64.26%
31.40%
6/30/2010
6/30/2010
6/30/2010
$0
$0
$0
$
$
$
28,891,592
19,629,760
1,135,710
$
$
$
28,891,592
19,629,760
1,135,710
0.00%
0.00%
0.00%
$
$
$
39,413,411
35,285,743
4,202,436
73.30%
55.63%
27.03%
6/30/2009
6/30/2009
6/30/2009
6/30/2011
6/30/2011
6/30/2011
$0
$0
$0
$
$
$
31,626,672
21,695,771
1,257,921
$
$
$
31,626,672
21,695,771
1,257,921
0.00%
0.00%
0.00%
$
$
$
39,864,688
36,307,295
4,465,721
79.34%
59.76%
28.17%
General
Police
Airport
6/30/2011
6/30/2011
6/30/2011
6/30/2012 *
6/30/2012 *
6/30/2012 *
$0
$0
$0
$
$
$
9,301,650
14,942,445
571,426
$
$
$
9,301,650
14,942,445
571,426
0.00%
0.00%
0.00%
$
$
$
39,144,623
36,035,496
4,595,620
23.76%
41.47%
12.43%
General
Police
Airport
6/30/2011
6/30/2011
6/30/2011
6/30/2013
6/30/2013
6/30/2013
$0
$0
$0
$
$
$
9,301,650
14,942,445
571,426
$
$
$
9,301,650
14,942,445
571,426
0.00%
0.00%
0.00%
$
$
$
39,433,327
36,155,619
4,643,862
23.59%
41.33%
12.30%
* Reduction in AAL is a result of other post employment benefit changes as stated in Note 14 B.
Schedule of Employer Contributions
Fiscal Year
Ended
June 30,
Annual
Required
Contribution
(ARC)
Percent of
ARC
Contributed
Actual
Contribution
General
Police
Airport
2008
2008
2008
$
$
$
2,991,110
2,364,135
155,363
$
$
$
266,149
103,652
-
8.90%
4.38%
0.00%
General
Police
Airport
2009
2009
2009
$
$
$
3,080,843
2,435,059
155,363
$
$
$
321,156
107,019
-
10.42%
4.39%
0.00%
General
Police
Airport
General
Police
Airport
2010
2010
2010
2011
2011
2011
$
$
$
$
$
$
555,709
227,143
10,095
20.18%
9.10%
7.21%
$
$
$
2,753,742
2,497,144
139,935
2,836,355
2,572,058
144,133
$
$
$
645,482
304,768
17,143
22.76%
11.85%
11.89%
General
Police
Airport
2012 *
2012 *
2012 *
$
$
$
1,014,307
1,269,653
64,065
$
$
$
591,395
177,852
10,171
58.31%
14.01%
15.88%
General
Police
Airport
2013
2013
2013
$
$
$
1,044,736
1,307,746
65,987
$
$
$
622,946
198,380
17,970
59.63%
15.17%
27.23%
* Reduction in ARC is a result of other post employment benefit changes as stated in Note 14 B.
107
OTHER FINANCIAL INFORMATION
COMBINING NON-MAJOR
GOVERNMENTAL FINANCIAL STATEMENTS
HORRY COUNTY, SOUTH CAROLINA
COMBINING BALANCE SHEETS
NON-MAJOR GOVERNMENTAL FUNDS
JUNE 30, 2013
Non-Major
Special
Revenue
Funds
Assets
Cash and cash equivalents
Pooled cash and investments
Interest receivable
Receivables, net:
Property taxes
Accounts and other
Fees
Due from other funds
Due from other governments
Prepaid items
Restricted assets
Total Assets
Liabilities
Accounts payable - trade
Retainage payable
Accrued salaries and wages
Due to other funds
Due to other governments
Due to component units
Unavailable revenue - fees and other
Unavailable revenue - property taxes
Other liabilities
Total liabilities
$
$
1,430,694
45,043
1,940,629
151,250
3,347,387
19,228
1,040,412
$ 54,960,650
$
$
$
Fund Balances
Nonspendable
Restricted for public safety
Restricted for culture, recreation and tourism
Restricted for infrastructure and regulation
Restricted for economic development
Restricted for health and social services
Restricted for debt service
Committed to public safety
Committed to culture, recreation and tourism
Committed to economic development
Committed to other purposes
Unassigned (deficit)
Total fund balances
Total liabilities and fund balances / (deficits)
100
46,965,598
20,309
Non-Major
Capital
Improvement
Funds
2,146,777
62,437
633,762
627,938
23,050
759,306
1,950,828
1,190,885
13,242
7,408,225
19,228
7,134,839
7,377,355
26,099,681
4,063,755
49,977
158,340
1,156,313
1,960,461
664,823
(1,132,347)
47,552,425
$
54,960,650
108
Non-Major
Debt Service
Funds
238,418
91
$
238,509
423,423
222,600
203,850
$ 13,668,605
1,854,117
45,043
1,940,629
373,850
3,347,387
19,228
1,244,262
$ 68,867,764
$
$
-
43,316
195,193
238,509
$
238,509
12,813,635
5,097
Total NonMajor
Governmental
Funds
337,163
337,163
$
13,331,442
13,331,442
$
13,668,605
100
60,017,651
25,497
2,146,777
62,437
633,762
627,938
23,050
759,306
1,950,828
1,528,048
13,242
7,745,388
19,228
7,134,839
7,420,671
26,294,874
4,063,755
49,977
13,331,442
158,340
1,156,313
1,960,461
664,823
(1,132,347)
61,122,376
$
68,867,764
HORRY COUNTY, SOUTH CAROLINA
COMBINING STATEMENTS OF REVENUES, EXPENDITURES, AND CHANGES IN FUND
BALANCES
NON-MAJOR GOVERNMENTAL FUNDS
FOR THE YEAR ENDED JUNE 30, 2013
Non-Major
Special
Revenue
Funds
Revenues
Real property taxes
Personal property taxes
Vehicle taxes
Intergovernmental
Accomodations tax
Fees and fines
Hospitality fees
Local accommodations tax
Interest on investments
Other
Total revenues
$ 27,463,497
2,139,468
2,713,929
7,849,726
3,858,389
13,496,340
2,975,789
194,152
63,961
1,134,167
61,889,418
Non-Major
Capital
Improvement
Funds
Non-Major
Debt Service
Funds
Total NonMajor
Governmental
Funds
$
$
$
290
4,000
4,290
8,717,399
624,178
705,309
35,026
2,088,342
144,986
12,315,240
36,180,896
2,763,646
3,419,238
7,884,752
3,858,389
13,496,340
5,064,131
194,152
209,237
1,138,167
74,208,948
Expenditures
Current:
General government
Public safety
Infrastructure and regulation
Health and social services
Culture, recreation and tourism
Economic development
TECH and Higher Education Commission
Capital outlay
Debt service
Total expenditures
12,580
18,521,785
15,423,446
796,586
6,191,899
1,752,693
4,635,000
4,602,976
51,936,965
(6,500)
(6,500)
16,076,128
16,076,128
12,580
18,521,785
15,423,446
796,586
6,185,399
1,752,693
4,635,000
4,602,976
16,076,128
68,006,593
Excess (deficiency) of revenues over (under)
expenditures
9,952,453
10,790
(3,760,888)
6,202,355
3,140,343
2,694
(4,613,505)
(1,470,468)
(10,000)
(10,000)
2,144,678
2,144,678
5,285,021
2,694
(4,623,505)
664,210
(1,616,210)
6,866,565
Other Financing Sources (Uses)
Transfers in
Sale of assets
Transfers out
Total other financing sources (uses)
Net change in fund balance
Fund balances at beginning of year
Fund balances at end of year
8,481,985
39,070,440
$ 47,552,425
109
790
$
237,719
238,509
14,947,652
$ 13,331,442
$
54,255,811
61,122,376
INDIVIDUAL FUND FINANCIAL STATEMENTS
GENERAL FUND
The General Fund is the major operating fund of the County’s governmental activities and is used
to account for all financial resources except those required to be accounted for in other funds.
HORRY COUNTY, SOUTH CAROLINA
GENERAL FUND
BALANCE SHEETS
As of June 30, 2013
(with comparative amounts as of June 30, 2012)
2013
Assets
Cash and cash equivalents
Pooled cash and investments
Interest receivable - investments
Receivables, net:
Property taxes
Accounts and other
Fees
Due from other funds
Due from other governments
Inventories
Prepaid items
Restricted cash
Total Assets
$
$
Liabilities:
Accounts payable - trade
Accounts payable - other
Accrued salaries and wages
Due to other funds
Due to component unit
Due to other governments
Proceeds from sales held by Master in Equity
Due to taxpayers for overpayment
Funds held in trust - proceeds from sale of properties
due to delinquent taxes
Other accrued liabilities
Unavailable revenue - fees and other
Unavailable revenue - property taxes
Total Liabilities
$
Fund balances:
Nonspendable
Restricted for other purposes
Committed to public safety
Committed to culture, recreation & tourism
Committed to infrastructure & regulation
Committed to economic development
Committed to stabilization
Committed to other purposes
Committed to OPEB
Assigned to other purposes
Unassigned
Total fund balances
$
Total liabilities and fund balances
110
2,889,077
57,983,556
26,775
3,700,031
4,861,251
682,397
1,364,462
2,450,630
55,655
1,919,245
1,000,034
76,933,113
2,567,919
3,373,981
3,198,598
278,772
102,278
2,175,236
1,322,387
2012
$
$
$
2,904,008
58,334,837
55,687
4,148,238
3,747,604
682,835
1,524,099
2,575,583
39,097
130,158
438,225
74,580,371
2,271,299
1,251,152
3,036,361
293,790
102,278
2,009,386
3,418,120
2,099,951
14,583,249
4,557,572
1,740,118
3,031,536
36,931,646
13,291,522
4,462,423
2,356,422
3,286,006
37,878,710
1,974,900
1,000,000
31,554
565,506
1,069,618
19,326,932
6,393,248
895,661
473,501
8,270,547
40,001,467
76,933,113
169,255
2,437
431,306
759,415
1,037,960
18,479,111
8,371,317
342,785
7,108,075
36,701,661
74,580,371
$
HORRY COUNTY, SOUTH CAROLINA
GENERAL FUND
SCHEDULES OF REVENUES, EXPENDITURES AND CHANGES IN FUND BALANCES GAAP BASIS
FOR THE PERIOD ENDED JUNE 30, 2013
(with comparative actual amounts for the period ended June 30, 2012)
2012
2013
Final
Budget
Revenues
Property taxes:
Real property taxes
Personal property taxes
Vehicle taxes
Total property taxes
$
Variance
Positive
(Negative)
Actual
64,584,000
4,728,500
4,350,000
73,662,500
$
65,076,726
4,578,270
5,219,154
74,874,150
$
492,726
(150,230)
869,154
1,211,650
Actual
$
64,479,022
4,718,300
4,284,754
73,482,076
Intergovernmental:
Federal grants
Prisoner Housing
Inventory tax
State salary supplements
Board of registration
Veteran affairs
State shared
State - Library
Accommodations tax
Other - state
Solicitor
Public Defender
Public Defender - Georgetown
Total intergovernmental
521,000
196,000
306,286
7,875
10,005
6,184
9,904,446
269,291
227,631
412,150
694,040
355,504
105,788
13,016,200
474,587
436,935
306,286
7,875
8,125
6,370
9,906,036
269,291
223,670
467,738
650,613
352,065
111,108
13,220,699
(46,413)
240,935
(1,880)
186
1,590
(3,961)
55,588
(43,427)
(3,439)
5,320
204,499
518,314
84,664
306,286
7,875
6,776
6,184
8,288,962
197,365
211,758
454,065
700,060
283,153
90,654
11,156,116
Fees and Fines:
Planning fees
EMS
RMC fees
Clerk of Court fees and fines
Library
Sheriff fines
Family court fees
Probate court fees
Magistrates' fees and fines
Health department fees
Master in Equity fees
CATV fees
Beach franchise fees
Georgetown Solicitor fees
Hospitality Fees
Local Accommodations Tax
Other
Total fees and fines
235,048
6,256,808
1,965,200
758,958
86,000
58,000
485,600
754,600
2,595,700
65,000
2,525,000
3,195,000
52,000
880,975
1,080,979
748,000
303,405
22,046,273
245,527
6,603,705
2,247,656
704,999
77,272
62,339
441,867
602,553
2,323,779
78,781
2,134,950
5,153,291
52,000
860,988
1,225,346
786,415
384,187
23,985,655
10,479
346,897
282,456
(53,959)
(8,728)
4,339
(43,733)
(152,047)
(271,921)
13,781
(390,050)
1,958,291
(19,987)
144,367
38,415
80,782
1,939,382
77,544
6,266,981
2,129,927
762,261
77,326
67,809
491,036
593,814
2,513,569
70,120
2,766,420
2,524,341
52,000
856,726
111
1,191,523
784,773
352,709
21,578,879
HORRY COUNTY, SOUTH CAROLINA
GENERAL FUND
SCHEDULES OF REVENUES, EXPENDITURES AND CHANGES IN FUND BALANCES GAAP BASIS
- CONTINUED 2013
Final
Budget
Revenue (continued)
RMC Documentary Stamps:
Actual
2012
Variance
Positive
(Negative)
Actual
2,285,362
2,763,904
478,542
2,340,425
3,824,050
2,300,000
63,500
215,000
6,402,550
4,039,609
2,960,873
130,090
213,370
7,343,942
215,559
660,873
66,590
(1,630)
941,392
3,871,803
2,321,424
131,040
213,150
6,537,417
76,894
103,680
Cost allocation:
3,005,488
2,786,824
(218,664)
3,167,359
Other:
Casino Boat
Rent
Other
Pre-Trial Intervention
Total other
600,000
217,250
1,152,085
668,000
2,637,335
1,065,050
320,459
1,579,193
597,070
3,561,772
465,050
103,209
427,108
(70,930)
924,437
720,216
218,700
1,101,358
561,637
2,601,911
123,132,602
128,640,626
5,508,024
120,926,521
Expenditures
Current:
General Government:
County Council:
Personal services
Contractual services
Supplies and material
Business and transportation
Other
Total
511,273
159,000
684,204
141,375
122,852
1,618,704
498,107
112,857
160,130
45,676
122,848
939,618
13,166
46,143
524,074
95,699
4
679,086
503,550
127,496
120,073
75,004
826,123
County Administrator:
Personal services
Contractual services
Supplies and material
Business and transportation
Other
Contingency
Total
274,798
4,130
1,313
10,593
46,807
337,641
197,878
2,991
932
8,295
210,096
76,920
1,139
381
2,298
46,807
127,545
267,393
93,420
1,800
3,697
2,779
369,089
Licenses and Permits:
Business licenses
Building inspection permits
Other permits
Marriage licenses
Total licenses and permits
Interest on investments:
Total revenue
112
26,786
62,338
HORRY COUNTY, SOUTH CAROLINA
GENERAL FUND
SCHEDULES OF REVENUES, EXPENDITURES AND CHANGES IN FUND BALANCES GAAP BASIS
- CONTINUED 2013
Final
Budget
Expenditures (continued)
General Government (cont):
Assistant County Administrator - Administration:
Personal services
164,082
Contractual services
1,565
Supplies and material
2,330
Business and transportation
1,725
Total
169,702
Actual
2012
Variance
Positive
(Negative)
Actual
158,578
1,053
2,009
555
162,195
5,504
512
321
1,170
7,507
160,765
1,246
1,639
1,798
165,448
Finance:
Personal services
Contractual services
Supplies and material
Business and transportation
Capital outlay
Total
1,313,429
25,205
27,370
3,875
1,369,879
1,197,953
21,893
22,397
1,274
1,243,517
115,476
3,312
4,973
2,601
126,362
1,059,627
28,535
24,954
1,003
6,145
1,120,264
Department Overhead:
Personal services
Contractual services
Supplies and material
Business and transportation
Total
1,210,250
2,504,649
821,700
207,957
4,744,556
657,373
2,372,436
804,930
75
3,834,814
552,877
132,213
16,770
207,882
909,742
800,896
1,856,085
816,279
1,868
3,475,128
Human Resources/Risk Management:
Personal services
Contractual services
Supplies and material
Business and transportation
Other
Total
1,020,541
63,030
26,790
9,837
16,747
1,136,945
1,020,540
55,082
25,763
8,182
6,144
1,115,711
1
7,948
1,027
1,655
10,603
21,234
994,706
50,257
25,987
12,369
9,958
1,093,277
374,958
6,099
5,962
1,991
389,010
291,893
6,098
5,960
1,990
305,941
83,065
1
2
1
83,069
338,277
5,363
8,090
1,213
352,943
Procurement:
Personal services
Contractual services
Supplies and material
Business and transportation
Total
113
HORRY COUNTY, SOUTH CAROLINA
GENERAL FUND
SCHEDULES OF REVENUES, EXPENDITURES AND CHANGES IN FUND BALANCES GAAP BASIS
- CONTINUED 2013
Final
Budget
Actual
2012
Variance
Positive
(Negative)
Actual
Expenditures (continued)
General Government (cont):
IT/GIS:
Personal services
Contractual services
Supplies and material
Business and transportation
Capital outlay
Other
Total
2,355,656
2,982,842
286,706
28,757
271,189
280,062
6,205,212
2,351,730
2,859,322
250,524
20,956
182,647
280,062
5,945,241
3,926
123,520
36,182
7,801
88,542
259,971
2,195,388
2,975,506
286,494
25,630
450,223
511,374
6,444,615
Assessor:
Personal services
Contractual services
Supplies and material
Business and transportation
Other
Total
3,102,269
29,280
22,050
30,274
37,818
3,221,691
2,879,001
22,447
15,048
11,859
37,750
2,966,105
223,268
6,833
7,002
18,415
68
255,586
2,827,947
20,014
22,457
19,278
37,365
2,927,061
7,388
305
525
8,218
4,307
350
4,657
3,081
305
175
3,561
1,943
28
1,971
137,077
1,929
1,029
1,402
18
141,455
859,565
43,981
34,732
7,268
945,546
Assessor Appeals Board:
Personal services
Contractual services
Supplies and material
Total
Registrar of Deeds:
Personal services
Contractual services
Supplies and material
Business and transportation
Other
Total
960,196
47,285
36,852
6,080
1,050,413
114
823,119
45,356
35,823
4,678
(18)
908,958
HORRY COUNTY, SOUTH CAROLINA
GENERAL FUND
SCHEDULES OF REVENUES, EXPENDITURES AND CHANGES IN FUND BALANCES GAAP BASIS
- CONTINUED 2013
Final
Budget
Expenditures (continued)
General Government (cont):
Maintenance:
Personal services
Contractual services
Supplies and material
Business and transportation
Capital outlay
Other
Total
Actual
2012
Variance
Positive
(Negative)
3,225,144
423,788
612,174
167,342
147,805
123,490
4,699,743
2,864,886
415,574
589,780
129,443
120,314
123,490
4,243,487
Voter Registration and Election:
Personal services
Contractual services
Supplies and material
Business and transportation
Total
421,654
36,816
59,440
5,696
523,606
537,328
34,732
58,589
4,530
635,179
(115,674)
2,084
851
1,166
(111,573)
462,282
31,368
31,457
3,891
528,998
Public Information:
Personal services
Contractual services
Supplies and material
Business and transportation
Total
236,947
20,620
22,636
1,600
281,803
236,947
14,688
18,168
563
270,366
5,932
4,468
1,037
11,437
232,910
18,294
17,779
554
269,537
Budget and Revenue Management:
Personal services
Contractual services
Supplies and material
Business and transportation
Total
181,449
360
3,838
2,602
188,249
180,329
135
3,678
845
184,987
1,120
225
160
1,757
3,262
178,403
105
3,727
760
182,995
115
360,258
8,214
22,394
37,899
27,491
456,256
Actual
2,805,518
395,043
661,980
144,798
58,300
60,981
4,126,620
HORRY COUNTY, SOUTH CAROLINA
GENERAL FUND
SCHEDULES OF REVENUES, EXPENDITURES AND CHANGES IN FUND BALANCES GAAP BASIS
- CONTINUED 2013
Final
Budget
Actual
2012
Variance
Positive
(Negative)
Actual
Expenditures (continued)
General Government (cont):
Treasurer:
Personal services
Contractual services
Supplies and material
Business and transportation
Other
Total
1,510,557
107,124
186,233
10,946
5,485
1,820,345
1,537,723
106,293
182,792
10,451
5,458
1,842,717
(27,166)
831
3,441
495
27
(22,372)
1,515,200
87,145
179,334
12,027
10,699
1,804,405
Auditor:
Personal services
Contractual services
Supplies and material
Business and transportation
Other
Total
1,275,689
46,293
88,829
15,415
5,263
1,431,489
1,300,905
43,069
62,140
13,181
5,263
1,424,558
(25,216)
3,224
26,689
2,234
6,931
1,255,027
39,017
61,294
11,595
4,802
1,371,735
Probate Judge:
Personal services
Contractual services
Supplies and material
Business and transportation
Total
845,518
10,067
21,937
5,031
882,553
867,172
10,066
19,426
3,541
900,205
(21,654)
1
2,511
1,490
(17,652)
838,642
10,001
21,394
3,140
873,177
Master in Equity:
Personal services
Contractual services
Supplies and material
Business and transportation
Total
381,300
44,290
4,006
1,293
430,889
383,197
41,403
3,977
949
429,526
(1,897)
2,887
29
344
1,363
357,996
49,275
4,242
1,482
412,995
116
HORRY COUNTY, SOUTH CAROLINA
GENERAL FUND
SCHEDULES OF REVENUES, EXPENDITURES AND CHANGES IN FUND BALANCES GAAP BASIS
- CONTINUED 2013
Final
Budget
Actual
2012
Variance
Positive
(Negative)
Actual
Expenditures (continued)
General Government (cont):
Legal:
Personal services
Contractual services
Supplies and material
Business and transportation
Total
490,499
351,098
2,597
3,105
847,299
382,467
346,252
2,444
3,104
734,267
108,032
4,846
153
1
113,032
363,267
185,708
3,675
3,645
556,295
Grants Administration:
Personal services
Contractual services
Supplies and material
Business and transportation
Total
106,622
137,431
4,858
982
249,893
28,567
3,421
4,245
841
37,074
78,055
134,010
613
141
212,819
39,114
3,048
1,766
276
44,204
Delegation:
Personal services
Contractual services
Supplies and material
Business and transportation
Capital outlay
Other
Total
100,512
1,056
7
261
101,836
100,511
115
134
100,760
1
941
7
127
1,076
98,696
138
98,834
Hospitality:
Personal services
Contractual services
Supplies and material
Business and transportation
Other
Total
260,045
6,419
12,308
4,315
2,545
285,632
260,045
5,287
10,094
3,345
2,545
281,316
1,132
2,214
970
4,316
225,923
3,319
8,143
4,170
3,600
245,155
Business License:
Personal services
Contractual services
Supplies and material
Business and transportation
Other
Total
205,590
4,941
9,595
4,607
224,733
204,087
3,147
8,578
2,065
(3)
217,874
1,503
1,794
1,017
2,542
3
6,859
195,187
3,372
5,760
2,414
4
206,737
3,280,872
28,443,152
Total General government
32,220,041
117
28,939,169
HORRY COUNTY, SOUTH CAROLINA
GENERAL FUND
SCHEDULES OF REVENUES, EXPENDITURES AND CHANGES IN FUND BALANCES GAAP BASIS
- CONTINUED 2013
Final
Budget
Actual
2012
Variance
Positive
(Negative)
Actual
Expenditures (continued)
Public Safety:
Solicitor:
Personal services
Contractual services
Supplies and material
Business and transportation
Other
Total
2,715,525
129,152
78,715
50,599
30,410
3,004,401
2,695,357
123,624
71,409
50,399
30,410
2,971,199
Solicitor's Drug Enforcement Unit:
Personal services
Contractual services
Supplies and material
Business and transportation
Other
Total
204,118
44,914
45,884
1,850
20,340
317,106
209,393
42,494
45,884
808
20,340
318,919
(5,275)
2,420
1,042
(1,813)
201,775
44,205
43,000
2,025
18,000
309,005
Solicitor's Drug Court:
Personal services
Contractual services
Supplies and material
Business and transportation
Total
141,681
21,090
47,897
9,694
220,362
136,741
20,350
8,025
214
165,330
4,940
740
39,872
9,480
55,032
129,571
14,868
7,934
3,422
155,795
Solicitor's Worthless Check Unit:
Personal services
Contractual services
Supplies and material
Business and transportation
Total
167,023
8,171
3,781
2,800
181,775
128,923
5,582
2,409
128
137,042
38,100
2,589
1,372
2,672
44,733
118,669
4,924
1,165
65
124,823
1,234,282
50,484
38,880
26,361
1,350,007
1,239,255
34,626
37,945
24,755
1,336,581
Public Defender:
Personal services
Contractual services
Supplies and material
Business and transportation
Total
118
20,168
5,528
7,306
200
33,202
(4,973)
15,858
935
1,606
13,426
2,696,461
140,450
52,718
51,672
50,232
2,991,533
1,092,670
59,043
25,684
20,497
1,197,894
HORRY COUNTY, SOUTH CAROLINA
GENERAL FUND
SCHEDULES OF REVENUES, EXPENDITURES AND CHANGES IN FUND BALANCES GAAP BASIS
- CONTINUED 2013
Final
Budget
Actual
2012
Variance
Positive
(Negative)
Actual
Expenditures (continued)
Public Safety:
Public Defender Georgetown:
Personal services
Contractual services
Supplies and material
Business and transportation
Total
177,611
6,288
7,000
3,700
194,599
171,169
2,195
3,714
2,968
180,046
6,442
4,093
3,286
732
14,553
79,007
120,988
4,471
2,159
206,625
Solicitor Victim Witness Program:
Personal services
Supplies and material
Business and transportation
Total
127,583
2,000
2,000
131,583
99,380
99,380
28,203
2,000
2,000
32,203
96,022
96,022
Solicitor State Appropriations:
Personal services
Total
562,457
562,457
551,233
551,233
11,224
11,224
604,038
604,038
Solicitor Georgetown:
Personal services
Contractual services
Supplies and material
Business and transportation
Contingency
Total
801,955
31,368
22,500
17,887
7,265
880,975
803,414
25,529
16,434
15,611
860,988
(1,459)
5,839
6,066
2,276
7,265
19,987
792,878
22,553
28,853
12,442
856,726
Clerk of Court:
Personal services
Contractual services
Supplies and material
Business and transportation
Total
1,382,801
198,306
87,567
1,950
1,670,624
1,435,836
197,191
71,618
858
1,705,503
(53,035)
1,115
15,949
1,092
(34,879)
1,390,998
189,417
72,787
628
1,653,830
119
HORRY COUNTY, SOUTH CAROLINA
GENERAL FUND
SCHEDULES OF REVENUES, EXPENDITURES AND CHANGES IN FUND BALANCES GAAP BASIS
- CONTINUED 2013
Final
Budget
Actual
2012
Variance
Positive
(Negative)
Actual
Expenditures (continued)
Public Safety:
Clerk of Court - DSS Family Court:
Personal services
Contractual services
Supplies and material
Business and transportation
Total
576,605
13,922
21,750
1,269
613,546
578,621
11,285
8,061
136
598,103
(2,016)
2,637
13,689
1,133
15,443
574,184
11,466
13,965
55
599,670
Clerk of Court - Family Court:
Personal services
Contractual services
Supplies and material
Other
Total
276,656
1,867
2,401
280,924
286,552
1,317
1,026
353
289,248
(9,896)
550
1,375
(353)
(8,324)
278,889
1,726
2,398
90
283,103
Magistrate No. 1 Conway:
Personal services
Contractual services
Supplies and material
Business and transportation
Total
254,858
3,300
4,084
1,166
263,408
262,116
2,054
3,348
888
268,406
(7,258)
1,246
736
278
(4,998)
258,318
2,166
4,135
1,582
266,201
Magistrate No. 2 Aynor:
Personal services
Contractual services
Supplies and material
Business and transportation
Total
146,777
10,640
5,106
1,750
164,273
150,030
7,764
3,197
1,292
162,283
(3,253)
2,876
1,909
458
1,990
150,211
8,436
4,303
2,317
165,267
Magistrate No. 4 Mt. Olive:
Personal services
Contractual services
Supplies and material
Business and transportation
Total
184,003
10,625
3,710
2,090
200,428
189,782
8,140
1,891
2,074
201,887
(5,779)
2,485
1,819
16
(1,459)
187,426
8,600
2,110
2,014
200,150
120
HORRY COUNTY, SOUTH CAROLINA
GENERAL FUND
SCHEDULES OF REVENUES, EXPENDITURES AND CHANGES IN FUND BALANCES GAAP BASIS
- CONTINUED 2013
Final
Budget
Actual
2012
Variance
Positive
(Negative)
Actual
Expenditures (continued)
Public Safety (cont):
Magistrate No. 5 Loris:
Personal services
Contractual services
Supplies and material
Business and transportation
Total
188,613
1,500
6,850
2,400
199,363
175,889
1,380
2,578
2,119
181,966
12,724
120
4,272
281
17,397
191,244
1,600
3,586
1,620
198,050
Magistrate No. 6 Myrtle Beach:
Personal services
Contractual services
Supplies and material
Business and transportation
Total
319,574
2,500
8,914
1,790
332,778
328,669
1,957
7,451
634
338,711
(9,095)
543
1,463
1,156
(5,933)
302,307
1,786
6,281
560
310,934
Magistrate No. 7 Stevens Cross Road:
Personal services
Contractual services
Supplies and material
Business and transportation
Total
185,883
2,847
8,434
5,027
202,191
165,694
2,569
8,207
1,478
177,948
20,189
278
227
3,549
24,243
193,193
3,344
4,378
2,728
203,643
Magistrate No. 11 Surfside:
Personal services
Contractual services
Supplies and material
Business and transportation
Total
169,193
2,280
2,700
1,400
175,573
173,448
1,665
2,287
428
177,828
(4,255)
615
413
972
(2,255)
171,349
1,620
3,256
865
177,090
Magistrate at Large No. 1:
Personal services
Contractual services
Supplies and material
Business and transportation
Total
102,344
237
4,400
106,981
112,398
41
4,276
116,715
(10,054)
196
124
(9,734)
105,238
25
3,379
108,642
121
HORRY COUNTY, SOUTH CAROLINA
GENERAL FUND
SCHEDULES OF REVENUES, EXPENDITURES AND CHANGES IN FUND BALANCES GAAP BASIS
- CONTINUED 2013
Final
Budget
Actual
2012
Variance
Positive
(Negative)
Actual
Expenditures (continued)
Public Safety (cont):
Magistrate at Large No. 2 - Detention:
Personal services
Contractual services
Supplies and material
Business and transportation
Total
338,542
5,530
9,270
2,600
355,942
354,901
5,241
9,183
2,468
371,793
(16,359)
289
87
132
(15,851)
345,931
5,644
7,512
3,224
362,311
Central Summary Court:
Personal services
Contractual services
Supplies and material
Business and transportation
Total
399,592
137,430
21,246
2,223
560,491
401,940
136,826
21,225
2,192
562,183
(2,348)
604
21
31
(1,692)
392,434
168,730
18,366
1,900
581,430
Communications:
Personal services
Contractual services
Supplies and material
Business and transportation
Capital outlay
Other
Total
312,450
1,123,556
320,740
2,167
85,463
254,065
2,098,441
308,330
1,122,898
318,550
2,132
84,010
254,065
2,089,985
4,120
658
2,190
35
1,453
8,456
251,715
1,161,192
129,482
342
46,888
149,436
1,739,055
304,981
8,657
4,925
4,303
13,413
336,279
304,559
8,491
4,913
3,622
11,858
333,443
422
166
12
681
1,555
2,836
300,030
4,095
4,244
6,073
20,982
335,424
4,216,818
75,847
62,591
295,121
40,484
92,457
4,783,318
4,273,576
75,844
62,587
295,012
40,464
92,457
4,839,940
Assistant County Administrator - Public safety:
Personal services
Contractual services
Supplies and material
Business and transportation
Other
Total
Sheriff:
Personal services
Contractual services
Supplies and material
Business and transportation
Capital outlay
Other
Total
122
(56,758)
3
4
109
20
(56,622)
4,338,732
57,383
62,611
298,676
8,547
68,271
4,834,220
HORRY COUNTY, SOUTH CAROLINA
GENERAL FUND
SCHEDULES OF REVENUES, EXPENDITURES AND CHANGES IN FUND BALANCES GAAP BASIS
- CONTINUED 2013
Final
Budget
Expenditures (continued)
Public Safety (cont):
Police:
Personal services
Contractual services
Supplies and material
Business and transportation
Capital outlay
Other
Total
Central Processing:
Personal services
Contractual services
Supplies and material
Total
Emergency Management:
Personal services
Contractual services
Supplies and material
Business and transportation
Other
Total
Emergency 911 Communications:
Personal services
Contractual services
Supplies and material
Business and transportation
Total
Coroner:
Personal services
Contractual services
Supplies and material
Business and transportation
Capital outlay
Other
Total
Actual
2012
Variance
Positive
(Negative)
14,461,254
392,220
444,211
1,361,868
814
533,181
17,193,548
14,035,784
380,373
426,441
1,338,522
314
533,179
16,714,613
60,053
700
60,753
60,265
636
60,901
(212)
64
(148)
60,971
4,530
577
66,078
366,820
21,676
21,860
30,783
6,510
447,649
361,766
21,582
21,823
30,445
7,005
442,621
5,054
94
37
338
(495)
5,028
355,478
22,194
25,920
24,017
13,071
440,680
2,799,216
47,143
13,078
3,930
2,863,367
2,708,407
40,939
10,806
3,750
2,763,902
355,779
289,223
8,750
16,930
30,000
9,769
710,451
363,085
281,594
8,097
16,525
9,769
679,070
123
425,470
11,847
17,770
23,346
500
2
478,935
Actual
90,809
6,204
2,272
180
99,465
(7,306)
7,629
653
405
30,000
31,381
14,165,283
355,746
302,272
1,247,391
990,081
17,060,773
2,648,428
41,789
8,600
1,405
2,700,222
358,153
268,278
7,816
14,285
17,467
665,999
HORRY COUNTY, SOUTH CAROLINA
GENERAL FUND
SCHEDULES OF REVENUES, EXPENDITURES AND CHANGES IN FUND BALANCES GAAP BASIS
- CONTINUED 2013
Final
Budget
Actual
2012
Variance
Positive
(Negative)
Actual
Expenditures (continued)
Public Safety (cont):
Detention Center:
Personal services
Contractual services
Supplies and material
Business and transportation
Capital outlay
Other
Total
14,914,938
3,369,976
1,970,613
244,400
155,000
79,063
20,733,990
14,417,081
2,923,404
1,826,559
238,739
133,715
79,063
19,618,561
497,857
446,572
144,054
5,661
21,285
1,115,429
14,560,445
2,656,985
2,070,464
258,559
49,717
81,689
19,677,859
Emergency Medical Services:
Personal services
Contractual services
Supplies and material
Business and transportation
Capital outlay
Other
Total
11,205,483
488,758
617,081
734,391
212,682
221,187
13,479,582
11,154,722
478,965
611,005
725,977
212,682
221,187
13,404,538
50,761
9,793
6,076
8,414
75,044
10,879,581
393,192
557,019
681,125
30,733
641,184
13,182,834
Animal Care Center:
Personal services
Contractual services
Supplies and material
Business and transportation
Other
Total
709,401
68,650
136,388
21,580
7,983
944,002
703,321
67,975
135,968
21,400
7,983
936,647
6,080
675
420
180
7,355
685,626
59,926
124,555
15,766
11,294
897,167
Pre-Trial Intervention:
Personal services
Contractual services
Business and transportation
Other
Total
Total public safety
661,330
593
407
5,670
668,000
76,289,167
599,877
585
143
5,670
606,275
74,263,788
61,453
8
264
61,725
2,025,379
564,002
292
142
564,436
73,817,529
124
HORRY COUNTY, SOUTH CAROLINA
GENERAL FUND
SCHEDULES OF REVENUES, EXPENDITURES AND CHANGES IN FUND BALANCES GAAP BASIS
- CONTINUED 2013
Final
Budget
Actual
2012
Variance
Positive
(Negative)
Actual
Expenditures (continued)
Infrastructure & Regulation
Assistant County Administrator - Infrastructure and regulation:
Personal services
283,126
Contractual services
17,462
Supplies and material
2,925
Business and transportation
3,093
Total
306,606
216,024
7,220
2,903
2,261
228,408
67,102
10,242
22
832
78,198
235,085
10,411
2,557
2,975
251,028
County Engineer:
Personal services
Contractual services
Supplies and material
Business and transportation
Other
Total
1,053,088
187,889
12,200
43,310
21,319
1,317,806
768,935
146,384
9,708
35,212
21,319
981,558
284,153
41,505
2,492
8,098
336,248
806,533
160,080
12,448
38,773
23,773
1,041,607
Public Works:
Personal services
Contractual services
Supplies and material
Business and transportation
Capital outlay
Other
Total
3,946,313
260,769
1,686,368
1,392,357
94,490
1,560,447
8,940,744
3,404,911
401,774
652,799
1,358,900
54,485
1,560,447
7,433,316
541,402
(141,005)
1,033,569
33,457
40,005
1,507,428
3,313,833
285,166
524,159
1,349,308
53,688
1,647,602
7,173,756
Code Enforcement:
Personal services
Contractual services
Supplies and material
Business and transportation
Other
Total
2,587,664
36,695
34,640
137,565
31,608
2,828,172
2,144,440
34,102
25,192
118,412
31,608
2,353,754
443,224
2,593
9,448
19,153
474,418
2,159,562
27,619
43,608
125,069
62,097
2,417,955
1,545,131
40,010
15,709
13,852
2,710
1,617,412
15,010,740
1,375,179
35,137
12,664
12,456
2,710
1,438,146
12,435,182
169,952
4,873
3,045
1,396
179,266
2,575,558
1,362,867
30,765
11,918
12,403
3,820
1,421,773
12,306,120
Planning:
Personal services
Contractual services
Supplies and material
Business and transportation
Other
Total
Total infrastructure and regulation
125
HORRY COUNTY, SOUTH CAROLINA
GENERAL FUND
SCHEDULES OF REVENUES, EXPENDITURES AND CHANGES IN FUND BALANCES GAAP BASIS
- CONTINUED 2013
Final
Budget
Actual
2012
Variance
Positive
(Negative)
Actual
Expenditures (continued)
Health and Social Services:
Veteran Affairs:
Personal services
Contractual services
Supplies and material
Business and transportation
Total
252,578
5,038
4,485
3,600
265,701
245,443
2,305
3,647
3,485
254,880
7,135
2,733
838
115
10,821
207,588
2,208
4,958
3,830
218,584
Medically Indigent Assistance Program:
Personal services
Contractual services
Supplies and material
Other
Total
59,055
127
648
1,207,022
1,266,852
59,054
127
347
1,207,022
1,266,550
1
301
302
59,371
94
1,301
1,164,445
1,225,211
Health Department
Department of Social Services
Total health and social services
130,940
111,406
1,774,899
124,335
89,535
1,735,300
6,605
21,871
39,599
125,516
83,202
1,652,513
Culture, Recreation and Tourism:
Library:
Personal services
Contractual services
Supplies and material
Business and transportation
Capital outlay
Other
Total
2,884,334
592,543
716,455
40,379
9,152
4,242,863
2,697,034
446,333
655,739
27,826
9,152
3,836,084
187,300
146,210
60,716
12,553
406,779
2,472,580
386,326
477,778
22,866
31,214
9,780
3,400,544
314,567
162,127
18,379
8,076
1,479
504,628
314,566
158,211
15,007
5,416
1,479
494,679
1
3,916
3,372
2,660
9,949
256,223
50,500
15,187
3,155
2,092
327,157
4,747,491
4,330,763
416,728
3,727,701
Museum:
Personal services
Contractual services
Supplies and material
Business and transportation
Other
Total
Total culture, recreation and tourism
126
HORRY COUNTY, SOUTH CAROLINA
GENERAL FUND
SCHEDULES OF REVENUES, EXPENDITURES AND CHANGES IN FUND BALANCES GAAP BASIS
- CONTINUED 2013
Final
Budget
2012
Variance
Positive
(Negative)
Actual
Actual
Expenditures (continued)
Other Agencies:
Total other agencies
Total expenditures
1,194,308
1,194,308
-
1,906,348
131,236,646
122,898,510
8,338,136
121,853,363
13,846,160
(926,842)
45,365
6,749
3,961
56,075
93,546
3,714,608
(3,243,535)
564,619
13,902,235
(362,223)
Excess of revenue over expenditures
(8,104,044)
5,742,116
Other Financing Sources (Uses)
Sale of assets
Transfers in
Transfer out
Total other financing sources (uses)
100,000
1,774,090
(4,372,475)
(2,498,385)
145,365
1,780,839
(4,368,514)
(2,442,310)
(10,602,429)
3,299,806
Net change in fund balance
Fund balance at beginning of year
Fund balance at end of year
$
36,701,661
26,099,232
127
$
36,701,661
40,001,467
$
13,902,235
$
37,063,884
36,701,661
HORRY COUNTY, SOUTH CAROLINA
SPECIAL REVENUE FUNDS
Special revenue funds are used accounts for specific revenue received which are restricted to
expenditures for particular purposes (other than capital projects). The County currently has
established the following special revenue funds:
Fire – accounts for operations of thirty-three (33) stations throughout unincorporated areas of
Horry County. Revenue is collected from 15.2 mills levied on property tax on the unincorporated
area of the County.
Tourism and Promotion – accounts for the revenue derived from a state-wide 2% levied room
tax earmarked for the promotion of tourism in South Carolina.
Waste Management Recycling – accounts for solid waste collection and recycling programs of
Horry County. Revenue is collected from 6.0 mills levied on property tax on the unincorporated
areas of the County.
Higher Education – accounts for revenue collected from 0.7 mills levied on real and personal
property for debt payment requirements of the Higher Education Commission and for the purpose
of providing tuition assistance for students. Presented as a Debt Service Fund in fiscal year
ended 2012.
Horry-Georgetown Tech – accounts for revenue collected from 1.8 mills levied on real and
personal property for debt payment requirements of Horry-Georgetown Technical Education
Center and for the purpose of providing maintenance on the grounds & buildings owned by the
County. Presented as a Debt Service Fund in fiscal year ended 2012.
Watershed – accounts for revenue collected from property taxes for maintenance of the following
watersheds: Cartwheel – 3.4 mills, Crab Tree – 3.2 mills, Todd Swamp – 3.1 mills, Simpson
Creek – 2.9 mills, Buck Creek – 3.2 mills, and Gapway – 3.1 mills.
Mt. Gilead – accounts for revenue collected from 7.0 mills levied on property taxes for road
improvements in the Mt. Gilead Community.
Socastee Recreation – accounts for revenue collected from 1.8 mills levied on property taxes
earmarked for recreation facilities in the Socastee Community.
Road Maintenance & CTC – accounts for revenue derived from a $30 fee on registered vehicles,
intergovernmental revenue, and operating transfers-in earmarked for the maintenance and/or
improvements of the County’s road system and public works operation.
Beach Nourishment – accounts for beach nourishment and re-nourishment projects on the
unincorporated beaches of the County and is funded from Accommodations Tax and the General
Fund.
Grants – accounts for revenue earmarked for all grants.
Admissions Tax – accounts for revenue derived from Admissions Tax District established in the
Waccamaw Pottery area. These funds are earmarked by state law for infrastructure
improvements.
Victim Witness Assistance – accounts for collection of assessments and surcharges imposed
by the courts. These funds are earmarked by State law for the provision of victim services.
SPECIAL REVENUE FUNDS
- CONTINUED Senior Citizen – accounts for revenue collected from 0.4 mills levied on property taxes
earmarked for senior citizen programs.
Arcadian Shores – accounts for revenue collected from 32.3 mills levied on property taxes
associated with the Arcadian Shores Special Tax District. These funds are designated for
infrastructure improvements.
Baseball Stadium – accounts for revenue and expenditures associated with the County’s
undivided 30% ownership in the baseball stadium project.
Economic Development – accounts for revenue and expenditures for the operation, economic
development and property management of the Atlantic Center, Hwy. 701 (Pineridge Business
Center) and the Hwy. 319 (Cool Spring) industrial parks.
Stormwater Management – accounts for revenue derived from a utility fee paid on the
unincorporated areas of the County and expenditures associated with the County’s stormwater
management and mosquito control programs.
Hidden Woods - accounts for revenue collected from 7.0 mills levied on property taxes for road
improvements in the Hidden Woods Community.
GIS/IT – accounts for GIS information sales and intergovernmental mapping revenue and
expenditures associated with maintaining and/or updating the GIS technology and data.
Multi-County Business Park Rollback – accounts for revenue and expenditures associated
with the Multi-County Business Park rollback for infrastructure.
E-911 – accounts for revenue and expenditures of funds for wireless and wireless telephones.
These funds are totally restricted for use in the 911 system.
CDBG Grant Program – accounts for revenue and expenditures of Housing Urban Development
entitlement program. These funds are totally restricted for use only on HUD approved programs.
Recreation – accounts for revenue collected from 1.7 mills levied on property taxes and
expenditures associated with the County’s recreation programs.
HORRY COUNTY, SOUTH CAROLINA
HORRY COUNTY, SOUTH CAROLINA
COMBINING BALANCE SHEET
NON-MAJOR SPECIAL REVENUE FUNDS
June 30, 2013
Non-Major Funds
Fire
Assets
Cash and cash equivalents
Pooled cash and investments
Receivables, net:
Property taxes
Accounts and other
Fees
Interest receivable
Due from other funds
Due from other governments
Prepaid items
Restricted assets
Total assets
Liabilities
Liabilities
Accounts payable-trade
Retainage payable
Accrued salaries and wages
Due to other funds
Due to other governments
Due to component units
Unavailable revenue - fees and other
Unavailable revenue - property taxes
Other liabilities
Total liabilities
$
$
$
Fund Balances
Nonspendable
Restricted for public safety
Restricted for culture, recreation and tourism
Restricted for infrastructure and regulation
Restricted for economic development
Restricted for health and social services
Committed to public safety
Committed to culture, recreation and tourism
Committed to economic development
Committed to other purposes
Unassigned (deficits)
Total fund balances / (deficits)
Total liabilities and fund balances / (deficits)
3,801,845
720,629
647
2,161
4,988
19,228
4,549,498
92,606
358,404
611,301
1,062,311
Tourism &
Promotion
$
$
$
19,228
3,467,959
3,487,187
$
4,549,498
$
35
Waste
Management
Recycling
Higher
Education
Horry
Georgetown
Tech
$
$
$
8,644,830
151,030
73,610
Watersheds
$
5,530
384
644,313
650,262
304,151
3,686
$ 8,952,667
58,652
433
$ 210,115
151,795
490
$ 225,895
$
298,255
46,227
110,743
455,225
$
$
$
$
759,306
255,056
1,014,362
46,609
46,609
120,779
120,779
195,037
195,037
7,938,305
7,938,305
163,506
-
105,116
-
163,506
105,116
650,262
$ 8,952,667
$ 210,115
$ 225,895
128
$
Mt Gilead
850,666
$
5,526
335
856,527
890
161
$ 397,606
4,823
4,823
$
396,555
Road
Maintenance &
CTC
Beach
Nourishment
356,693
$
$
7,120
146
363,959
1,337,590
5,078
677,424
$ 15,746,228
$
$
$
Socastee
Recreation
$
$
13,726,136
2,427
315
2,742
885
5,018
5,903
851,704
851,704
394,864
394,864
358,056
358,056
13,776,171
13,776,171
856,527
$ 397,606
363,959
$ 15,746,228
$
548,023
62,437
17,107
1,342,490
1,970,057
$
Grants
4,340,599
$
35,361
1,562
128,989
4,506,511
171
1,407,345
$ 2,110,726
$
$
$
10,796
10,796
703,210
Admissions
Tax
691,043
52,592
743,635
3,339,402
1,156,313
4,495,715
319,071
56,085
327,112
664,823
1,367,091
4,506,511
$ 2,110,726
$
640,401
261
640,662
-
Victim
Witness
Assistance
$
$
$
640,662
640,662
$
640,662
169,700
34,962
46
204,708
981
18,670
181,985
201,636
3,072
3,072
$
204,708
HORRY COUNTY, SOUTH CAROLINA
COMBINING BALANCE SHEET
NON-MAJOR SPECIAL REVENUE FUNDS
JUNE 30, 2013
Non-Major Funds
Arcadian
Shores
Senior Citizen
Assets
Cash and cash equivalents
Pooled cash and investments
Receivables, net:
Property taxes
Accounts and other
Fees
Interest receivable
Due from other funds
Due from other governments
Prepaid items
Restricted assets
Total assets
Liabilities
Liabilities
Accounts payable-trade
Retainage payable
Accrued salaries and wages
Due to other funds
Due to other governments
Due to component units
Unavailable revenue - fees and other
Unavailable revenue - property taxes
Other liabilities
Total liabilities
$
$
$
Fund Balances
Nonspendable
Restricted for public safety
Restricted for culture, recreation and tourism
Restricted for infrastructure and regulation
Restricted for economic development
Restricted for health and social services
Committed to public safety
Committed to culture, recreation and tourism
Committed to economic development
Committed to other purposes
Unassigned (deficits)
Total fund balances / (deficits)
Total liabilities and fund balances / (deficits)
59,645
33,472
9
93,126
16,557
26,592
43,149
$
$
$
49,977
49,977
$
93,126
68,911
626
27
69,564
1,491
217,108
291
218,890
Baseball
Stadium
$
$
$
(149,326)
(149,326)
$
69,564
253,698
22,261
101,810
377,769
28,326
23,050
51,376
Economic
Development
Stormwater
Management
$
$
$
$
326,393
326,393
$
377,769
3,134,138
1,606
938,602
4,074,346
925
925
$
$
2,112,960
1,960,461
4,073,421
$
4,074,346
2,690,770
466,092
1,301
3,158,163
151,030
46,393
426,353
56
623,832
Hidden
Woods
$
$
$
2,534,331
2,534,331
$
3,158,163
129
$
3,957
78,936
62
$ 167,573
$
$
$
2,159
2,159
167,511
B&C MCBP
74,979
76,777
-
$
GIS/IT
9,233
9,233
76,777
158,340
158,340
78,936
$ 167,573
$
E-911
527,320
209
527,529
-
$
$
$
527,529
527,529
$
527,529
3,202,298
61,094
822
146,383
3,410,597
60,813
5,047
65,860
CDBG
Grant Program
$
$
$
3,344,737
3,344,737
$
3,410,597
-
$
100
2,931,018
$
466,934
466,934
143,876
44,396
1,359
$ 3,120,749
$
159,772
7,075
300,087
466,934
$
$
983,021
(983,021)
$
Total
Non-Major
Funds
Recreation
466,934
73,614
82,247
117,942
13,186
286,989
2,833,760
2,833,760
$ 3,120,749
100
46,965,598
1,430,694
45,043
1,940,629
20,309
151,250
3,347,387
19,228
1,040,412
54,960,650
2,146,777
62,437
633,762
627,938
23,050
759,306
1,950,828
1,190,885
13,242
7,408,225
19,228
7,134,839
7,377,355
26,099,681
4,063,755
49,977
158,340
1,156,313
1,960,461
664,823
(1,132,347)
47,552,425
$
54,960,650
HORRY COUNTY, SOUTH CAROLINA
COMBINING STATEMENT OF REVENUES, EXPENDITURES, AND CHANGES IN FUND BALANCES
NON-MAJOR SPECIAL REVENUE FUNDS
For the Year ended June 30, 2013
Non-Major Funds
Fire
Waste
Management
Recycling
Higher
Education
Horry
Georgetown
Tech
2,838,389
1,382
942
2,840,713
$ 5,651,405
461,545
620,859
11,529
710
6,746,048
$ 1,220,166
87,261
99,045
10,638
1,143
1,418,253
$ 3,137,914
224,601
253,904
13,881
1,608
3,631,908
1,399,917
1,751,868
99,418
3,251,203
5,882,147
228,117
6,110,264
1,150,000
1,150,000
3,485,000
3,485,000
15,977
15,977
22,824
22,824
106,144
24,839
130,983
4,527,158
3,410,068
7,937,226
124,872
124,872
12,580
2,676,246
57,772
4,088
(2,439)
508,535
3,256,782
-
268,253
146,908
231,528
8,321
61,386
4,082,658
1,094,381
(969,956)
852
(202,350)
(202,350)
(203,600)
(203,600)
-
-
65,903
(56,692)
231,528
8,321
Tourism &
Promotion
Watersheds
Socastee
Recreation
Mt Gilead
Road
Maintenance &
CTC
Beach
Nourishment
Grants
Admissions
Tax
Revenues
Real property taxes
Personal property taxes
Vehicle taxes
Intergovernmental
Accommodations tax
Fees and fines
Hospitality fees
Local accommodations tax
Interest
Other
Total revenues
Expenditures
Current:
General government
Public safety
Infrastructure and regulation
Health and social services
Culture, recreation and tourism
Economic development
Capital outlay
Total expenditures
Excess (deficiency) of revenues
over (under) expenditures
Other Financing Sources (Uses)
Transfers in
Sale of Assets
Transfers out
Total other financing sources (uses)
Net change in fund balance
Fund balances (deficits), at beginning of year
Fund balances (deficits), at end of year
$ 12,706,112
1,102,033
1,443,379
26,594
5,943
994
15,285,055
$
12,963,318
67,131
13,030,449
2,254,606
(410,490)
635,784
(2,453,661)
(2,453,661)
(231,414)
(231,414)
-
(199,055)
(641,904)
635,784
3,686,242
$ 3,487,187
$
836,941
195,037
7,302,521
$ 7,938,305
$
97,603
163,506
$
161,808
105,116
130
$
$
93,678
1,093
152,734
247,505
620,176
851,704
$
$
30,627
(7)
525
31,145
386,543
394,864
$
189,862
73
467
1,967
192,369
(20,000)
(20,000)
$
$
1,462,161
7,726,140
2,813,789
16,732
1,062
12,019,884
287,000
(750,000)
(463,000)
$
1,020,000
194,152
5,101
1,219,253
$
2,197,255
589
88,982
2,286,826
$
852
852
309,784
309,784
1,294,617
1,294,617
852
41,386
3,619,658
1,404,165
324,661
316,670
358,056
10,156,513
$ 13,776,171
3,091,550
$ 4,495,715
1,042,430
$ 1,367,091
$
639,810
640,662
HORRY COUNTY, SOUTH CAROLINA
COMBINING STATEMENT OF REVENUES, EXPENDITURES, AND CHANGES IN FUND BALANCE
NON-MAJOR SPECIAL REVENUE FUNDS
For the Year ended June 30, 2013
Non-Major Funds
Victim
Witness
Assistance
Arcadian
Shores
Senior Citizen
Baseball
Stadium
Economic
Development
Stormwater
Management
$
$
Hidden
Woods
GIS/IT
B&C MCBP
E-911
CDBG
Grant Program
Total
Non-Major
Funds
Recreation
Revenues
Real property taxes
Personal property taxes
Vehicle taxes
Intergovernmental
Accommodations tax
Fees and fines
Hospitality fees
Local accommodations tax
Interest
Other
Total revenues
$
437,925
166
89,495
527,586
Expenditures
Current:
General government
Public safety
Infrastructure and regulation
Health and social services
Culture, recreation and tourism
Economic development
Capital outlay
Total expenditures
575,792
575,792
Excess (deficiency) of revenues
over (under) expenditures
(48,206)
Other Financing Sources (Uses)
Transfers in
Sale of Assets
Transfers out
Total other financing sources (uses)
Net change in fund balance
Fund balances (deficits), at beginning of year
Fund balances (deficits), at end of year
$
$
697,225
49,814
56,420
7
803,466
$
64,074
84
64,158
$
11,123
162,000
247
173,370
596,068
69,182
4,817
670,067
4,534,378
3,790
1,953
4,540,121
796,586
796,586
35,589
35,589
62,808
62,808
756,070
756,070
6,880
28,569
110,562
(86,003)
170,982
170,982
-
-
-
1,037,960
1,037,960
122,776
6,880
28,569
110,562
951,957
15,819
3,121,464
4,073,421
2,518,512
$ 2,534,331
(119,704)
3,072
$
43,097
49,977
(177,895)
$ (149,326)
$
215,831
326,393
$
$
91,545
91,545
$
47,282
3,355
205
50,842
$
20,705
680
21,385
$
2,052,457
714,237
2,843
2,769,537
$
2,039,458
2,039,458
$
2,964,116
214,141
240,329
4,158
795,328
4,218,072
$
4,111,141
33,161
4,144,302
14,768
14,768
10,457
10,457
-
896,055
14,109
910,164
1,755,132
20,020
1,775,152
395,819
76,777
40,385
21,385
1,859,373
264,306
(121,625)
9,952,453
-
-
-
(264,306)
(264,306)
40,000
2,694
42,694
3,140,343
2,694
(4,613,505)
(1,470,468)
76,777
40,385
21,385
(78,931)
8,481,985
(380,000)
(380,000)
131
$
76,777
$
117,955
158,340
$
506,144
527,529
(108,174)
(108,174)
1,751,199
$
1,593,538
3,344,737
4,142,119
197,578
4,339,697
27,463,497
2,139,468
2,713,929
7,849,726
3,858,389
13,496,340
2,975,789
194,152
63,961
1,134,167
61,889,418
-
$
-
$
2,912,691
2,833,760
12,580
18,521,785
15,423,446
796,586
10,826,899
1,752,693
4,602,976
51,936,965
$
39,070,440
47,552,425
HORRY COUNTY, SOUTH CAROLINA
FIRE SPECIAL REVENUE FUND
BALANCE SHEETS
June 30, 2013
(with comparative amounts for June 30, 2012)
2013
Assets
Pooled cash and investments
Receivables, net:
Property taxes
Other
Interest receivable
Due from other governments
Prepaid items
Total assets
Liabilities
Accounts payable - trade
Accrued salaries and wages
Unavailable revenue - property taxes
Total liabilities
$
3,801,845
$
720,629
647
2,161
4,988
19,228
4,549,498
$
Fund Balances
Nonspendable
Restricted for public safety
Total fund balances
Total liabilities and fund balances
$
132
92,606
358,404
611,301
1,062,311
19,228
3,467,959
3,487,187
4,549,498
2012
$
3,911,879
$
756,697
3,494
2,349
1,639
19,574
4,695,632
$
$
84,883
303,451
621,056
1,009,390
19,574
3,666,668
3,686,242
4,695,632
HORRY COUNTY, SOUTH CAROLINA
FIRE SPECIAL REVENUE FUND
SCHEDULES OF REVENUES, EXPENDITURES AND CHANGES IN FUND BALANCE BUDGET (GAAP BASIS) AND ACTUAL
For the Year ended June 30, 2013
(with comparative actual amounts For the Year ended June 30, 2012)
2013
Revenues
Real property taxes
Personal property taxes
Vehicle taxes
Intergovernmental
Interest
Other
Total revenues
Expenditures
Current:
Public safety:
Personal services
Contractual services
Supplies and materials
Business and transportation
Capital outlay
Indirect cost allocation
Total expenditures
Excess of revenues
over expenditures
2012
Variance
Positive
(Negative)
Budget
Actual
$ 12,599,726
1,229,500
1,230,000
26,594
2,000
15,087,820
$ 12,706,112
1,102,033
1,443,379
26,594
5,943
994
15,285,055
9,253,446
1,313,290
516,340
873,160
72,000
945,419
12,973,655
9,534,923
1,208,476
449,901
840,907
67,131
929,111
13,030,449
(281,477)
104,814
66,439
32,253
4,869
16,308
(56,794)
9,378,800
1,161,476
429,879
829,678
94,113
945,419
12,839,365
2,114,165
2,254,606
140,441
2,200,319
-
-
-
8,061
$
Actual
106,386
(127,467)
213,379
3,943
994
197,235
$
12,565,244
1,179,247
1,228,483
26,594
3,775
36,341
15,039,684
Other Financing Sources (Uses)
Sale of Assets
Transfers out
Total other financing sources (uses)
Net change in fund balance
Fund balance at beginning of year
Fund balance at end of year
(2,453,722)
(2,453,661)
61
(2,016,442)
(2,453,722)
(2,453,661)
61
(2,008,381)
(339,557)
(199,055)
140,502
191,938
140,502
3,494,304
3,686,242
3,686,242
$ 3,346,685
133
3,686,242
$ 3,487,187
$
$
HORRY COUNTY, SOUTH CAROLINA
TOURISM & PROMOTION SPECIAL REVENUE FUND
BALANCE SHEETS
June 30, 2013
(with comparative amounts for June 30, 2012)
Assets
Pooled cash and investments
Accounts receivable, net:
Fees
Interest receivable
Due from other governments
Total assets
2013
Liabilities
Accounts payable - trade
Accrued salaries and wages
Due to other funds
Unavailable revenue - fees and other
Total liabilities
$
35
$
5,530
384
644,313
650,262
$
Fund Balance
Restricted for culture, recreation and tourism
Total fund balance
Total liabilities and fund balance
$
134
298,255
46,227
110,743
455,225
195,037
195,037
650,262
$
2012
655,969
$
504,968
397
2,282,433
3,443,767
$
$
788,268
39,808
105,458
1,673,292
2,606,826
836,941
836,941
3,443,767
HORRY COUNTY, SOUTH CAROLINA
TOURISM & PROMOTION SPECIAL REVENUE FUND
SCHEDULES OF REVENUES, EXPENDITURES AND CHANGES IN FUND BALANCE BUDGET (GAAP BASIS) AND ACTUAL
For the Year ended June 30, 2013
(with comparative actual amounts For the Year ended June 30, 2012)
2012
2013
Variance
Positive
(Negative)
Budget
Actual
$ 2,830,000
1,100
2,831,100
$ 2,838,389
1,382
942
2,840,713
1,075,254
140,827
69,768
179,843
130,038
132,606
1,728,336
981,737
112,053
49,641
163,880
99,418
92,606
1,499,335
93,517
28,774
20,127
15,963
30,620
40,000
229,001
948,314
103,330
24,483
147,146
1,827
125,494
1,350,594
Contributions to other agencies
1,791,955
1,751,868
40,087
1,478,639
Total culture, recreation and tourism
1,791,955
1,751,868
40,087
1,478,639
3,520,291
3,251,203
269,088
2,829,233
127,265
Revenues
Accommodations tax
Interest
Other
Total revenues
Expenditures
Current:
Public safety
Beach Patrol:
Personal services
Contractual services
Supplies and materials
Business and transportation
Capital outlay
Other
Total beach patrol
$
Actual
8,389
282
942
9,613
$
2,954,735
1,092
671
2,956,498
Culture, recreation and tourism:
Total expenditures
Excess of revenues
over expenditures
(689,191)
(410,490)
278,701
(231,414)
(231,414)
-
(250,000)
Total other financing sources (uses)
(231,414)
(231,414)
-
(250,000)
Net change in fund balance
(920,605)
(641,904)
278,701
(122,735)
Other Financing Sources (Uses)
Transfers out
Fund balance at beginning of year
Fund balance at end of year
$
836,941
(83,664)
135
$
836,941
195,037
$
278,701
$
959,676
836,941
HORRY COUNTY, SOUTH CAROLINA
WASTE MANAGEMENT SPECIAL REVENUE FUND
BALANCE SHEETS
June 30, 2013
(with comparative amounts for June 30, 2012)
Assets
Pooled cash and investments
Receivables, net:
Property taxes
Interest receivable
Total assets
Liabilities
Accounts payable - trade
Due to component unit
Unavailable revenue - property taxes
Total liabilities
Fund Balance
Restricted for infrastructure and regulation
Total fund balance
Total liabilities and fund balance
2013
$ 8,644,830
2012
$ 7,751,725
304,151
3,686
$ 8,952,667
319,103
3,799
$ 8,074,627
$
$
759,306
255,056
1,014,362
7,938,305
7,938,305
$ 8,952,667
136
514,203
257,903
772,106
7,302,521
7,302,521
$ 8,074,627
HORRY COUNTY, SOUTH CAROLINA
WASTE MANAGEMENT RECYCLING SPECIAL REVENUE FUND
SCHEDULES OF REVENUES, EXPENDITURES AND CHANGES IN FUND BALANCE BUDGET (GAAP BASIS) AND ACTUAL
For the Year ended June 30, 2013
(with comparative actual amounts For the Year ended June 30, 2012)
2013
2012
Variance
Positive
(Negative)
Budget
Actual
$ 5,564,050
506,000
530,000
5,050
6,605,100
$ 5,651,405
461,545
620,859
11,529
710
6,746,048
Expenditures
Current:
Infrastructure and regulation:
Contractual services
Capital outlay
Indirect cost allocation
Total expenditures
6,807,069
1,100,000
3,150
7,910,219
5,878,578
228,117
3,569
6,110,264
Excess (deficiency) of revenues
over (under) expenditures
(1,305,119)
635,784
1,940,903
600,487
Net change in fund balance
(1,305,119)
635,784
1,940,903
600,487
Revenues
Real property taxes
Personal property taxes
Vehicle taxes
Interest
Other
Total revenues
Fund balance at beginning of year
Fund balance at end of year
7,302,521
$ 5,997,402
137
7,302,521
$ 7,938,305
$
87,355
(44,455)
90,859
6,479
710
140,948
Actual
$
928,491
871,883
(419)
1,799,955
$
1,940,903
5,582,469
488,464
530,637
5,958
(702)
6,606,826
5,737,475
265,714
3,150
6,006,339
$
6,702,034
7,302,521
HORRY COUNTY, SOUTH CAROLINA
HIGHER EDUCATION SPECIAL REVENUE FUND
BALANCE SHEETS
June 30, 2013
(with comparative amounts for June 30, 2012)
2013
Assets
Pooled cash and investments
Receivables, net:
Property taxes
Interest receivable
$
151,030
2012
$
58,652
433
83,000
63,561
476
Total assets
$
210,115
$
147,037
Liabilities
Unavailable revenue - property taxes
Total liabilities
$
46,609
46,609
$
49,434
49,434
Fund Balance
Restricted for culture, recreation and tourism
Total fund balance
163,506
163,506
$
Total liabilities and fund balance
210,115
Note: This fund was presented as a Debt Service Fund in fiscal year 2012.
138
97,603
97,603
$
147,037
HORRY COUNTY, SOUTH CAROLINA
HIGHER EDUCATION SPECIAL REVENUE FUND
SCHEDULES OF REVENUES, EXPENDITURES AND CHANGES IN FUND BALANCE BUDGET (GAAP BASIS) AND ACTUAL
For the Year ended June 30, 2013
(with comparative actual amounts For the Year ended June 30, 2012)
2012
2013
Variance
Positive
(Negative)
Budget
Actual
$ 1,215,950
92,050
85,550
10,638
220
$ 1,220,166
87,261
99,045
10,638
1,143
1,404,408
1,418,253
13,845
1,395,975
-
-
-
140,000
63,650
425
204,075
Current:
Higher Education Commission
621,633
1,150,000
(528,367)
1,200,000
Total expenditures
621,633
1,150,000
(528,367)
1,404,075
Excess (deficiency) of revenues
over (under) expenditures
782,775
268,253
(514,522)
(782,775)
(782,775)
(202,350)
(202,350)
580,425
580,425
-
65,903
65,903
97,603
97,603
-
Revenues
Real property taxes
Personal property taxes
Vehicle taxes
Intergovernmental
Interest
Total revenues
Expenditures
Debt service:
Principal
Interest
Agents fees
Total Debt service
Other Financing Sources (Uses)
Transfers out
Total other financing sources
Net change in fund balance
Fund balance at beginning of year
Fund balance at end of year
$
97,603
$
163,506
Note: This fund was presented as a Debt Service Fund in fiscal year 2012.
139
$
$
Actual
4,216
(4,789)
13,495
923
65,903
$ 1,209,070
90,184
85,543
10,638
540
(8,100)
(8,100)
105,703
$
97,603
HORRY COUNTY, SOUTH CAROLINA
HORRY GEORGETOWN TECH SPECIAL REVENUE FUND
BALANCE SHEETS
June 30, 2013
(with comparative amounts for June 30, 2012)
2013
Assets
Pooled cash and investments
Receivables, net:
Property taxes
Interest receivable
$
73,610
2012
$
151,795
490
125,282
164,634
147
Total assets
$
225,895
$
290,063
Liabilities
Unavailable revenue - property taxes
Total liabilities
$
120,779
120,779
$
128,255
128,255
Fund Balance
Restricted for culture, recreation and tourism
Total fund balance
Total liabilities and fund balance
105,116
105,116
$
Note: This fund was presented as a Debt Service Fund in fiscal year 2012.
140
225,895
161,808
161,808
$
290,063
HORRY COUNTY, SOUTH CAROLINA
HORRY-GEORGETOWN TECH SPECIAL REVENUE FUND
SCHEDULES OF REVENUES, EXPENDITURES AND CHANGES IN FUND BALANCE BUDGET (GAAP BASIS) AND ACTUAL
For the Year ended June 30, 2013
(with comparative actual amounts For the Year ended June 30, 2012)
2013
Budget
Revenues
Real property taxes
Personal property taxes
Vehicle taxes
Intergovernmental
Interest
Total revenues
Actual
$ 3,125,830
236,780
218,900
13,880
330
3,595,720
Expenditures
Debt service:
Principal
Interest
Agents fees
Bond issuance costs
2012
Variance
Positive
(Negative)
$
3,137,914
224,601
253,904
13,881
1,608
3,631,908
$
Actual
12,084
(12,179)
35,004
1
1,278
36,188
$
3,109,405
232,385
219,235
13,881
10,123
3,585,029
-
-
-
-
-
-
Current:
Horry Georgetown Tech
3,391,720
3,485,000
(93,280)
3,347,000
Total expenditures
3,391,720
3,485,000
(93,280)
3,607,695
204,000
146,908
(57,092)
(204,000)
(204,000)
(203,600)
(203,600)
Excess (deficiency) of revenues
over (under) expenditures
Other Financing Sources (Uses)
Issuance of refunding debt
Bond premium
Payment to refunded bond escrow agent
Transfers out
Total other financing sources (uses)
Net change in fund balance
-
Fund balance at beginning of year
Fund balance at end of year
161,808
Note: This fund was presented as a Debt Service Fund in fiscal year 2012.
141
105,116
2,100,000
68,267
(2,129,062)
39,205
(56,692)
161,808
$
(22,666)
400
400
(56,692)
161,808
$
135,000
76,924
400
48,371
260,695
16,539
$
(56,692)
145,269
$
161,808
HORRY COUNTY, SOUTH CAROLINA
WATERSHED SPECIAL REVENUE FUNDS
BALANCE SHEETS
June 30, 2013
(with comparative amounts for June 30, 2012)
Assets
Pooled cash and investments
Receivables, net:
Property taxes
Interest receivable
Total assets
Liabilities
Unavailable revenue - property taxes
Total liabilities
Fund Balance
Restricted for infrastructure and regulation
Total fund balance
Total liabilities and fund balance
142
2013
2012
$ 850,666
$ 618,983
5,526
335
$ 856,527
6,141
338
$ 625,462
$
$
4,823
4,823
851,704
851,704
$ 856,527
5,286
5,286
620,176
620,176
$ 625,462
HORRY COUNTY, SOUTH CAROLINA
WATERSHED SPECIAL REVENUE FUND
SCHEDULES OF REVENUES, EXPENDITURES AND CHANGES IN FUND BALANCE BUDGET (GAAP BASIS) AND ACTUAL
For the Year ended June 30, 2013
(with comparative actual amounts For the Year ended June 30, 2012)
2012
2013
Actual
Budget
Revenues
Real property taxes
Interest
Other
Total revenues
$
Variance
Positive
(Negative)
91,810
945
92,755
$
93,678
1,093
152,734
247,505
$
1,868
148
152,734
154,750
Actual
$
93,204
613
93,817
Expenditures
Current:
Infrastructure and regulation:
Contractual services
Indirect cost allocation
Total expenditures
88,110
4,645
92,755
7,968
8,009
15,977
Excess (deficiency) of revenues
over (under) expenditures
-
231,528
231,528
82,997
Net change in fund balance
-
231,528
231,528
82,997
Fund balance at beginning of year
Fund balance at end of year
$
620,176
620,176
143
$
620,176
851,704
80,142
(3,364)
76,778
$
231,528
4,644
6,176
10,820
$
537,179
620,176
HORRY COUNTY, SOUTH CAROLINA
MT. GILEAD SPECIAL REVENUE FUND
BALANCE SHEETS
June 30, 2013
(with comparative amounts for June 30, 2012)
Assets
Pooled cash and investments
Receivables, net:
Property taxes
Interest receivable
Total assets
2013
$ 396,555
2012
$ 386,949
890
161
397,606
827
173
387,949
$
Liabilities
Accounts payable - trade
Unavailable revenue - property taxes
Total liabilities
$
Fund Balance
Restricted for infrastructure and regulation
Total fund balance
Total liabilities and fund balance
$
144
2,427
315
2,742
394,864
394,864
397,606
$
$
$
1,087
319
1,406
386,543
386,543
387,949
HORRY COUNTY, SOUTH CAROLINA
MT. GILEAD SPECIAL REVENUE FUND
SCHEDULES OF REVENUES, EXPENDITURES AND CHANGES IN FUND BALANCE BUDGET (GAAP BASIS) AND ACTUAL
For the Year ended June 30, 2013
(with comparative actual amounts For the Year ended June 30, 2012)
2012
2013
Actual
Budget
Revenues
Real property taxes
Vehicle taxes
Interest
Total revenues
$
Variance
Positive
(Negative)
29,998
500
30,498
$
30,627
(7)
525
31,145
$
629
(7)
25
647
Actual
$
30,106
1,509
269
31,884
Expenditures
Current:
Infrastructure and regulation:
Personal services
Contractual services
Supplies and materials
Other
Indirect cost allocation
Total expenditures
602
21,700
7,471
15,000
2,750
47,523
602
18,222
1,250
2,750
22,824
3,478
6,221
15,000
24,699
602
18,190
15,000
2,671
36,463
Excess (deficiency) of revenues
over (under) expenditures
(17,025)
8,321
25,346
(4,579)
Net change in fund balance
(17,025)
8,321
25,346
(4,579)
Fund balance at beginning of year
Fund balance at end of year
386,543
369,518
386,543
394,864
25,346
$
145
$
$
$
391,122
386,543
HORRY COUNTY, SOUTH CAROLINA
SOCASTEE RECREATION SPECIAL REVENUE FUND
BALANCE SHEETS
June 30, 2013
(with comparative amounts for June 30, 2012)
Assets
Pooled cash and investments
Receivables, net:
Property taxes
Other
Interest receivable
Total assets
Liabilities
Accounts payable - trade
Unavailable revenue - property taxes
Total liabilities
Fund Balance
Restricted for culture, recreation and tourism
Total fund balance
Total liabilities and fund balance
146
2013
2012
$ 356,693
$ 315,324
7,120
146
$ 363,959
7,730
152
123
$ 323,329
$
$
885
5,018
5,903
358,056
358,056
$ 363,959
770
5,889
6,659
316,670
316,670
$ 323,329
HORRY COUNTY, SOUTH CAROLINA
SOCASTEE RECREATION SPECIAL REVENUE FUND
SCHEDULES OF REVENUES, EXPENDITURES AND CHANGES IN FUND BALANCE BUDGET (GAAP BASIS) AND ACTUAL
For the Year ended June 30, 2013
(with comparative actual amounts For the Year ended June 30, 2012)
2013
$
184,170
150
184,320
Variance
Positive
(Negative)
Actual
Budget
Revenues
Real property taxes
Personal property taxes
Interest
Other
Total revenues
2012
$
189,862
73
467
1,967
192,369
$
Actual
5,692
73
317
1,967
8,049
$
184,299
304
157,147
341,750
Expenditures
Current:
Culture, recreation and tourism:
Personal services
Contractual services
Supplies and materials
Capital outlay
Other
Indirect cost allocation
Total expenditures
1,932
43,684
10,000
59,614
71,125
10,434
196,789
1,932
24,457
5,158
24,839
64,163
10,434
130,983
19,227
4,842
34,775
6,962
65,806
1,932
24,793
2,000
7,500
58,816
95,041
Excess (deficiency) of revenues
over (under) expenditures
(12,469)
61,386
73,855
246,709
(20,000)
(20,000)
-
(19,611)
Total other financing sources (uses)
(20,000)
(20,000)
-
(19,611)
Net change in fund balance
(32,469)
41,386
73,855
227,098
Fund balance at beginning of year
Fund balance at end of year
316,670
284,201
316,670
358,056
73,855
89,572
316,670
Other Financing Sources (Uses)
Transfers out
$
147
$
$
$
HORRY COUNTY, SOUTH CAROLINA
ROAD MAINTENANCE & CTC SPECIAL REVENUE FUND
BALANCE SHEETS
June 30, 2013
(with comparative amounts for June 30, 2012)
2013
Assets
Pooled cash and investments
Receivables, net:
Fees
Interest receivable
Due from other governments
Total assets
Liabilities
Accounts payable - trade
Retainage payable
Accrued salaries and wages
Unavailable revenue - fees and other
Total liabilities
$
13,726,136
$
$
1,337,590
5,078
677,424
15,746,228
1,348,155
4,658
915,205
$ 12,267,791
$
Fund Balance
Restricted for infrastructure and regulation
Total fund balance
Total liabilities and fund balance
$
148
2012
548,023
62,437
17,107
1,342,490
1,970,057
13,776,171
13,776,171
15,746,228
$
9,999,773
711,274
26,833
20,116
1,353,055
2,111,278
10,156,513
10,156,513
$ 12,267,791
HORRY COUNTY, SOUTH CAROLINA
ROAD MAINTENANCE & CTC SPECIAL REVENUE FUND
SCHEDULES OF REVENUES, EXPENDITURES AND CHANGES IN FUND BALANCE BUDGET (GAAP BASIS) AND ACTUAL
For the Year ended June 30, 2013
(with comparative actual amounts For the Year ended June 30, 2012)
2013
2012
Actual
Variance
Positive
(Negative)
Actual
4,521,478
7,550,000
2,746,563
20,000
3,500
14,841,541
$ 1,462,161
7,726,140
2,813,789
16,732
1,062
12,019,884
$ (3,059,317)
176,140
67,226
(3,268)
(2,438)
(2,821,657)
$ 1,156,903
7,411,645
2,766,296
5,507
2,431
11,342,782
38,537
1,508,510
7,541,326
487,707
9,576,080
21,059
1,508,510
388,478
1,918,047
17,478
7,541,326
99,229
7,658,033
31,833
690,581
2,881,883
427,707
4,032,004
614,040
46,951
15,182
170,960
9,025,677
1,901,558
1,489,399
276,900
75,479
13,616,146
575,721
33,513
11,141
78,151
1,525,351
1,901,558
1,541,365
276,900
75,479
6,019,179
38,319
13,438
4,041
92,809
7,500,326
(51,966)
7,596,967
551,480
36,361
14,288
142,296
92,296
3,716,573
1,494,460
344,266
74,651
6,466,671
Total expenditures
23,192,226
7,937,226
15,255,000
10,498,675
Excess (deficiency) of revenues
over (under) expenditures
(8,350,685)
4,082,658
12,433,343
844,107
287,000
287,000
-
153,300
(750,000)
(750,000)
-
(2,225,000)
(463,000)
(463,000)
-
(2,071,700)
3,619,658
12,433,343
(1,227,593)
10,156,513
$ 13,776,171
$ 12,433,343
Budget
Revenues
Intergovernmental
Fees
Hospitality fees
Interest
Other
Total revenues
$
Expenditures
Current:
Engineer:
Contractual services
Capital outlay-infrastructure
Construction contracts
Indirect cost allocation
Total engineer
Operations:
Personal services
Contractual services
Supplies and materials
Business and transportation
Construction contracts
Capital outlay
Capital outlay-infrastructure
Distributions to municipalities
Other
Indirect cost allocation
Total operations
Other Financing Sources (Uses)
Transfers in
Transfers out
Total other financing sources (uses)
Net change in fund balance
Fund balance at beginning of year
Fund balance at end of year
(8,813,685)
$
10,156,513
1,342,828
149
11,384,106
$ 10,156,513
HORRY COUNTY, SOUTH CAROLINA
BEACH NOURISHMENT SPECIAL REVENUE FUND
BALANCE SHEETS
June 30, 2013
(with comparative amounts for June 30, 2012)
2013
Assets
Pooled cash and investments
Receivables, net:
Fees
Interest receivable
Due from other funds
Total assets
Liabilities
Accounts payable
Due to other funds
Total liabilities
$
4,340,599
$
35,361
1,562
128,989
4,506,511
$
Fund Balances
Restricted for culture, recreation and tourism
Committed to culture,recreation and tourism
Total fund balances
Total liabilities and fund balances
150
$
10,796
10,796
3,339,402
1,156,313
4,495,715
4,506,511
2012
$
3,055,142
$
35,750
1,363
141,921
3,234,176
$
$
1,062
141,564
142,626
2,250,122
841,428
3,091,550
3,234,176
HORRY COUNTY, SOUTH CAROLINA
BEACH NOURISHMENT SPECIAL REVENUE FUND
SCHEDULES OF REVENUES, EXPENDITURES AND CHANGES IN FUND BALANCE BUDGET (GAAP BASIS) AND ACTUAL
For the Year ended June 30, 2013
(with comparative actual amounts For the Year ended June 30, 2012)
2012
2013
Revenues
State accommodations tax
Local accommodations tax
Interest
Other
Total revenues
Expenditures
Current:
Culture, recreation and tourism:
Contractual services
Other
Total expenditures
Excess (deficiency) of revenues
over (under) expenditures
Variance
Positive
(Negative)
Budget
Actual
$ 1,020,000
187,000
1,207,000
$ 1,020,000
194,152
5,101
1,219,253
273,209
1,307,797
1,581,006
124,872
124,872
148,337
1,307,797
1,456,134
123,057
123,057
1,094,381
1,468,387
636,795
(374,006)
$
7,152
5,101
12,253
Actual
$
510,000
193,746
2,773
53,333
759,852
Other Financing Sources (Uses)
Transfers in
313,745
309,784
(3,961)
186,758
Total other financing sources (uses)
313,745
309,784
(3,961)
186,758
Net change in fund balance
(60,261)
Fund balance at beginning of year
Fund balance at end of year
3,091,550
$ 3,031,289
151
1,404,165
1,464,426
823,553
3,091,550
$ 4,495,715
1,464,426
2,267,997
3,091,550
$
$
HORRY COUNTY, SOUTH CAROLINA
GRANTS SPECIAL REVENUE FUND
BALANCE SHEETS
June 30, 2013
(with comparative amounts for June 30, 2012)
2013
Assets
Pooled cash and investments
Interest receivable
Due from other governments
Total assets
$
Liabilities
Accounts payable - trade
Accrued salaries and wages
Retainage payable
Due to other funds
Total liabilities
Fund Balances
Restricted for public safety
Restricted for culture, recreation and tourism
Restricted for economic development
Committed to other purposes
Total fund balances
Total liabilities and fund balances
152
2012
703,210
171
1,407,345
$ 2,110,726
$
$
$
691,043
52,592
743,635
319,071
56,085
327,112
664,823
1,367,091
$ 2,110,726
6,430
91
1,200,979
$ 1,207,500
55,380
50,366
52,089
7,235
165,070
397,360
5,094
28,692
611,284
1,042,430
$ 1,207,500
HORRY COUNTY, SOUTH CAROLINA
GRANTS SPECIAL REVENUE FUND
SCHEDULES OF REVENUES, EXPENDITURES AND CHANGES IN FUND BALANCE BUDGET (GAAP BASIS) AND ACTUAL
For the Year ended June 30, 2013
(with comparative actual amounts For the Year ended June 30, 2012)
2013
Revenues
Intergovernmental
Interest
Other
Total revenues
2012
Budget
Actual
Variance
Positive
(Negative)
$ 3,478,454
99,220
3,577,674
$ 2,197,255
589
88,982
2,286,826
$ (1,281,199)
589
(10,238)
(1,290,848)
11,124
58,640
69,764
1,456
11,124
57,184
69,764
(1,456)
1,456
-
1,831,741
498,018
1,340,707
44,411
499,064
148,888
4,362,829
1,287,415
357,449
905,606
26,549
423,687
99,227
3,099,933
544,326
140,569
435,101
17,862
75,377
49,661
1,262,896
1,278,147
288,833
433,966
37,029
228,375
43,560
2,309,910
136,913
136,913
57,772
57,772
79,141
79,141
-
73
27,296
37
188
27,594
4,088
4,088
73
23,208
37
188
23,506
1,889
2,931
66
4,886
3,488
344,501
358,348
706,337
2,885
27,664
(5,324)
25,225
603
316,837
363,672
681,112
1,706
18,149
19,855
2,046,655
3,488,931
Expenditures
Current:
General government:
Personal services
Contractual services
Supplies and materials
Grant projects
Capital outlay
Total general government
Public safety:
Personal services
Contractual services
Supplies and materials
Business and transportation
Capital outlay
Other
Total public safety
Infrastructure and regulation:
Grant projects
Total infrastructure and regulation
Culture, recreation and tourism
Contractual services
Supplies and materials
Grant projects
Other
Total culture, recreation and tourism
Economic development:
Supplies and materials
Capital outlay
Grant projects
Total economic development
Total expenditures
5,303,437
Excess (deficiency) of revenues
over (under) expenditures
(1,725,763)
3,256,782
(969,956)
Actual
$
3,036,608
137
20,350
3,057,095
20,911
43,920
1,400
214,974
873,075
1,154,280
755,807
(431,836)
Other Financing Sources (Uses)
Transfers in
Total other financing sources (uses)
Net change in fund balance
Fund balance at beginning of year
Fund balance at end of year
1,294,617
1,294,617
-
277,904
1,294,617
1,294,617
-
277,904
324,661
755,807
(431,146)
$
1,042,430
611,284
153
1,042,430
$ 1,367,091
$
755,807
(153,932)
$
1,196,362
1,042,430
HORRY COUNTY, SOUTH CAROLINA
ADMISSIONS TAX SPECIAL REVENUE FUND
BALANCE SHEETS
June 30, 2013
(with comparative amounts for June 30, 2012)
Assets
Pooled cash and investments
Interest receivable
Total assets
2013
$ 640,401
261
$ 640,662
2012
$ 639,525
285
$ 639,810
Fund Balance
Restricted for economic development
Total fund balance
$ 640,662
$ 640,662
$ 639,810
$ 639,810
154
HORRY COUNTY, SOUTH CAROLINA
ADMISSIONS TAX SPECIAL REVENUE FUND
SCHEDULES OF REVENUES, EXPENDITURES AND CHANGES IN FUND BALANCE BUDGET (GAAP BASIS) AND ACTUAL
For the Year ended June 30, 2013
(with comparative actual amounts For the Year ended June 30, 2012)
2012
2013
Actual
Budget
Revenues
Interest
Total revenues
$
Expenditures
Total expenditures
Variance
Positive
(Negative)
-
$
852
852
$
Actual
852
852
$
540
540
-
-
-
-
over (under) expenditures
-
852
852
540
Net change in fund balance
-
852
852
540
Excess (deficiency) of revenues
Fund balance at beginning of year
Fund balance at end of year
$
639,810
639,810
155
$
639,810
640,662
$
852
$
639,270
639,810
HORRY COUNTY, SOUTH CAROLINA
VICTIM WITNESS ASSISTANCE SPECIAL REVENUE FUND
BALANCE SHEETS
June 30, 2013
(with comparative amounts for June 30, 2012)
2013
Assets
Pooled cash and investments
Receivables, net:
Fees
Interest receivable
Total assets
$ 169,700
Liabilities
Accounts payable
Accrued salaries and wages
Due to other funds
Unavailable revenue-special assessments
Total liabilities
Fund Balance
Restricted for Public safety
Unassigned
Total fund balance (deficit)
Total liabilities and fund balance (deficit)
$
-
34,962
46
$ 204,708
$
32,376
32,376
$
$
981
18,670
181,985
201,636
3,072
3,072
$ 204,708
156
2012
3,286
15,770
22,655
110,369
152,080
(119,704)
(119,704)
$ 32,376
HORRY COUNTY, SOUTH CAROLINA
VICTIM WITNESS ASSISTANCE SPECIAL REVENUE FUND
SCHEDULES OF REVENUES, EXPENDITURES AND CHANGES IN FUND BALANCE BUDGET (GAAP BASIS) AND ACTUAL
For the Year ended June 30, 2013
(with comparative actual amounts For the Year ended June 30, 2012)
2013
Budget
Revenues
Fees and fines
Interest
Other
Total revenues
$
2012
Variance
Positive
(Negative)
Actual
408,900
89,495
498,395
$
437,925
166
89,495
527,586
$
Actual
29,025
166
29,191
$
432,825
432,825
Expenditures
Current:
Public safety
Detention:
Personal services
Contractual services
Supplies and materials
Business and transportation
Other
Total detention
218,674
5,550
3,750
7,100
76,388
311,462
212,011
3,414
3,429
862
219,716
6,663
2,136
321
6,238
76,388
91,746
211,287
3,721
3,790
2,187
220,985
Victim Witness:
Personal services
Contractual services
Supplies and materials
Business and transportation
Total victim witness
57,615
585
797
3,903
62,900
55,444
585
523
3,809
60,361
2,171
274
94
2,539
55,432
585
866
2,673
59,556
Solicitor:
Personal services
Contractual services
Supplies and materials
Business and transportation
Total solicitor
282,677
2,376
5,417
4,545
295,015
287,747
1,900
3,546
2,522
295,715
(5,070)
476
1,871
2,023
(700)
195,790
2,234
5,656
203,680
669,377
575,792
93,585
484,221
(170,982)
(48,206)
122,776
(51,396)
170,982
170,982
-
8,080
170,982
170,982
-
8,080
-
122,776
122,776
Total expenditures
Excess (deficiency) of revenues
over (under) expenditures
Other Financing Sources (Uses)
Transfers in
Total other financing sources (uses)
Net change in fund balance
Fund balance (deficit) at beginning of year
Fund balance (deficit) at end of year
$
(119,704)
(119,704)
157
$
(119,704)
3,072
$
122,776
(43,316)
$
(76,388)
(119,704)
HORRY COUNTY, SOUTH CAROLINA
SENIOR CITIZEN SPECIAL REVENUE FUND
BALANCE SHEETS
June 30, 2013
(with comparative amounts for June 30, 2012)
2013
Assets
Pooled cash and investments
Receivables, net:
Property taxes
Interest receivable
Total assets
Liabilities
Accounts payable
Unavailable revenue - property taxes
Total liabilities
$
59,645
$
33,472
9
93,126
$
Fund balance
Restricted for health and social services
Total fund balance
Total liabilities and fund balance
$
158
16,557
26,592
43,149
49,977
49,977
93,126
2012
$
47,778
$
36,278
57
84,113
$
$
12,812
28,204
41,016
43,097
43,097
84,113
HORRY COUNTY, SOUTH CAROLINA
SENIOR CITIZEN SPECIAL REVENUE FUND
SCHEDULES OF REVENUES, EXPENDITURES AND CHANGES IN FUND BALANCE BUDGET (GAAP BASIS) AND ACTUAL
For the Year ended June 30, 2013
(with comparative actual amounts For the Year ended June 30, 2012)
2013
Budget
Revenues
Real property taxes
Personal property taxes
Vehicle taxes
Interest
Total revenues
$
Expenditures
Current:
Health and social services:
Contractual services
Indirect cost allocation
Total expenditures
2012
Variance
Positive
(Negative)
Actual
696,350
52,550
48,900
40
797,840
$
697,225
49,814
56,420
7
803,466
$
875
(2,736)
7,520
(33)
5,626
Actual
$
795,972
1,868
797,840
793,536
3,050
796,586
Excess of revenues
over expenditures
-
6,880
6,880
8,087
Net change in fund balance
-
6,880
6,880
8,087
Fund balance at beginning of year
Fund balance at end of year
$
43,097
43,097
159
$
43,097
49,977
2,436
(1,182)
1,254
690,886
51,488
48,720
24
791,118
$
6,880
781,163
1,868
783,031
$
35,010
43,097
HORRY COUNTY, SOUTH CAROLINA
ARCADIAN SHORES SPECIAL REVENUE FUND
BALANCE SHEETS
June 30, 2013
(with comparative amounts for June 30, 2012)
Assets
Pooled cash and investments
Receivables, net:
Property taxes
Interest receivable
Total assets
Liabilities
Accounts payable - trade
Due to other funds
Unavailable revenue - property taxes
Total liabilities
Fund Balance
Unassigned
Total fund balance (deficit)
Total liabilities and fund balance (deficit)
2013
2012
$ 68,911
$ 65,011
626
27
$ 69,564
430
28
$ 65,469
$
$
1,491
217,108
291
218,890
(149,326)
(149,326)
$ 69,564
160
971
242,491
(98)
243,364
(177,895)
(177,895)
$ 65,469
HORRY COUNTY, SOUTH CAROLINA
ARCADIAN SHORES SPECIAL REVENUE FUND
SCHEDULES OF REVENUES, EXPENDITURES AND CHANGES IN FUND BALANCE BUDGET (GAAP BASIS) AND ACTUAL
For the Year ended June 30, 2013
(with comparative actual amounts For the Year ended June 30, 2012)
2012
2013
Budget
Revenues
Real property taxes
Interest
Other
Total revenues
$
Expenditures
Current:
Infrastructure and regulation:
Personal Services
Contractual services
Supplies and materials
Indirect cost allocation
Other
Total expenditures
Variance
Positive
(Negative)
Actual
63,174
75
63,249
$
64,074
84
64,158
$
900
9
909
Actual
$
63,942
51
2,500
66,493
602
12,166
10,688
2,715
37,078
63,249
602
12,106
8,472
2,715
11,694
35,589
60
2,216
25,384
27,660
602
11,422
5,815
2,442
12,905
33,186
Excess of revenues
over expenditures
-
28,569
28,569
33,307
Net change in fund balance
-
28,569
28,569
33,307
Fund balance (deficit) at beginning of year
Fund balance (deficit) at end of year
$
(177,895)
(177,895)
161
$
(177,895)
(149,326)
$
28,569
$
(211,202)
(177,895)
HORRY COUNTY, SOUTH CAROLINA
BASEBALL STADIUM SPECIAL REVENUE FUND
BALANCE SHEETS
June 30, 2013
(with comparative amounts for June 30, 2012)
2013
2012
Assets
Pooled cash and investments
Restricted assets
Due from other funds
Total assets
$ 253,698
101,810
22,261
$ 377,769
$ 152,340
101,563
8,646
$ 262,549
Liabilities
Accounts payable - trade
Due to other governments
Total liabilities
$ 28,326
23,050
$ 51,376
$
Fund Balance
Restricted for culture, recreation and tourism
Total fund balance
Total liabilities and fund balance
$ 326,393
326,393
$ 377,769
$ 215,831
215,831
$ 262,549
162
46,718
$ 46,718
HORRY COUNTY, SOUTH CAROLINA
BASEBALL STADIUM SPECIAL REVENUE FUND
SCHEDULES OF REVENUES, EXPENDITURES AND CHANGES IN FUND BALANCE BUDGET (GAAP BASIS) AND ACTUAL
For the Year ended June 30, 2013
(with comparative actual amounts For the Year ended June 30, 2012)
2013
Budget
Revenues
Fees and fines
Hospitality fees
Interest
Total revenues
$
Expenditures
Current:
Culture, recreation and tourism:
Personal services
Contractual services
Supplies and materials
Construction contracts
Other
Total expenditures
2012
Variance
Positive
(Negative)
Actual
12,500
162,000
174,500
$
11,123
162,000
247
173,370
$
Actual
(1,377)
247
(1,130)
$
15,851
75,000
669
91,520
102,000
72,500
174,500
14,808
19,068
28,326
606
62,808
(14,808)
(19,068)
73,674
71,894
111,692
14,341
18,016
24,621
210,518
5,346
272,842
-
110,562
110,562
(181,322)
-
-
-
231,057
Total other financing sources (uses)
-
-
-
231,057
Net change in fund balance
-
110,562
110,562
49,735
Excess (deficiency) of revenues
over (under) expenditures
Other Financing Sources (Uses)
Transfers in
Fund balance at beginning of year
Fund balance at end of year
$
215,831
215,831
163
$
215,831
326,393
$
110,562
$
166,096
215,831
HORRY COUNTY, SOUTH CAROLINA
ECONOMIC DEVELOPMENT SPECIAL REVENUE FUND
BALANCE SHEETS
June 30, 2013
(with comparative amounts for June 30, 2012)
Assets
Pooled cash and investments
Interest receivable
Restricted assets
Total assets
Liabilities
Accounts payable - trade
Total liabilities
Fund Balances
Restricted for economic development
Committed to economic development
Total fund balance
Total liabilities and fund balances
2013
2012
$ 3,134,138
1,606
938,602
$ 4,074,346
$ 3,120,207
1,436
$ 3,121,643
$
$
925
925
2,112,960
1,960,461
4,073,421
$ 4,074,346
3,121,464
3,121,464
$ 3,121,643
This fund was named Industrial Parks Special Revenue Fund in prior year
164
179
179
HORRY COUNTY, SOUTH CAROLINA
ECONOMIC DEVELOPMENT SPECIAL REVENUE FUND
SCHEDULES OF REVENUES, EXPENDITURES AND CHANGES IN FUND BALANCE BUDGET (GAAP BASIS) AND ACTUAL
For the Year ended June 30, 2013
(with comparative actual amounts For the Year ended June 30, 2012)
2013
$
640,482
69,182
3,150
300,000
1,012,814
Variance
Positive
(Negative)
Actual
Budget
Revenues
Real property taxes - FILOT
Fees
Interest
Rural Development Act contribution
Total revenues
2012
$
596,068
69,182
4,817
670,067
$
Actual
(44,414)
1,667
(300,000)
(342,747)
$
642,862
68,805
1,239
712,906
Expenditures
Current:
Infrastructure and regulation:
Contractual services
Capital outlay
Indirect cost allocation
Other
2,862,385
55,505
300,000
739,120
16,950
-
2,123,265
38,555
300,000
16,601
48,116
55,505
382
Total expenditures
3,217,890
756,070
2,461,820
120,604
(2,205,076)
(86,003)
2,119,073
592,302
Excess (deficiency) of revenues
over (under) expenditures
Other Financing Sources (Uses)
Transfers in
Transfers out
Total other financing sources (uses)
$
Net change in fund balance
Fund balance at beginning of year
Fund balance at end of year
1,037,960
1,037,960
$
(1,167,116)
$
3,121,464
1,954,348
1,037,960
1,037,960
$
951,957
$
3,121,464
4,073,421
-
$
2,119,073
(500,000)
(500,000)
92,302
2,119,073
This fund was named Industrial Parks Special Revenue Fund in prior year
165
$
$
3,029,162
3,121,464
HORRY COUNTY, SOUTH CAROLINA
STORMWATER MANAGEMENT SPECIAL REVENUE FUND
BALANCE SHEETS
June 30, 2013
(with comparative amounts for June 30, 2012)
Assets
Pooled cash and investments
Receivables, net:
Fees
Accounts receivable
Interest receivable
Total assets
Liabilities and Fund Balance
Liabilities:
Accounts payable - trade
Accrued salaries and wages
Unavailable revenue - fees and other
Other liabilities
Total liabilities
Fund Balance
Restricted for infrastructure and regulation
Total fund balance
Total liabilities and fund balance
2013
2012
$ 2,690,770
$ 2,910,425
466,092
1,301
$ 3,158,163
65,741
7,136
1,529
$ 2,984,831
$
$
151,030
46,393
426,353
56
623,832
2,534,331
2,534,331
$ 3,158,163
166
385,925
46,403
33,951
40
466,319
2,518,512
2,518,512
$ 2,984,831
HORRY COUNTY, SOUTH CAROLINA
STORMWATER MANAGEMENT SPECIAL REVENUE FUND
SCHEDULES OF REVENUES, EXPENDITURES AND CHANGES IN FUND BALANCE BUDGET (GAAP BASIS) AND ACTUAL
For the Year ended June 30, 2013
(with comparative actual amounts For the Year ended June 30, 2012)
2012
2013
Variance
Positive
(Negative)
Budget
Actual
$ 4,450,000
3,500
4,453,500
$ 4,534,378
3,790
1,953
4,540,121
1,786,064
1,400,374
356,496
267,615
424,628
33,161
310,150
205,950
4,784,438
1,602,431
1,085,624
315,121
262,697
336,330
33,161
302,988
205,950
4,144,302
183,633
314,750
41,375
4,918
88,298
7,162
640,136
1,570,521
1,435,292
241,773
278,310
387,577
44,031
322,900
193,380
4,473,784
(330,938)
395,819
726,757
39,875
(380,000)
(380,000)
-
(240,000)
Total other financing sources (uses)
(380,000)
(380,000)
-
(240,000)
Net change in fund balance
(710,938)
15,819
726,757
(200,125)
Revenues
Fees
Interest
Other
Total revenues
Expenditures
Current:
Infrastructure and regulation:
Personal services
Contractual services
Supplies and materials
Business and transportation
Construction contracts
Capital outlay
Indirect cost allocation
Other
Total expenditures
Excess (deficiency) of revenues
over (under) expenditures
$
Actual
84,378
290
1,953
86,621
$
4,510,946
1,313
1,400
4,513,659
Other Financing Sources (Uses)
Transfers out
Fund balance at beginning of year
Fund balance at end of year
2,518,512
$ 1,807,574
167
2,518,512
$ 2,534,331
$
726,757
$
2,718,637
2,518,512
HORRY COUNTY, SOUTH CAROLINA
HIDDEN WOODS SPECIAL REVENUE FUND
BALANCE SHEETS
June 30, 2013
(with comparative amounts for June 30, 2012)
2013
Assets
Pooled cash and investments
Receivables, net:
Property taxes
Interest receivable
Total assets
Liabilities
Unavailable revenue - property taxes
Total liabliltites
$
74,979
$
3,957
78,936
$
Fund Balance
Restricted for infrastructure and regulation
Total fund balance
Total liabilities and fund balance
168
$
2,159
2,159
76,777
76,777
78,936
2012
$
-
$
-
$
$
-
-
HORRY COUNTY, SOUTH CAROLINA
HIDDEN WOODS SPECIAL REVENUE FUND
SCHEDULES OF REVENUES, EXPENDITURES AND CHANGES IN FUND BALANCE BUDGET (GAAP BASIS) AND ACTUAL
For the Year ended June 30, 2013
(with comparative actual amounts For the Year ended June 30, 2012)
2012
2013
Actual
Budget
Revenues
Real property taxes
Total revenues
$
Variance
Positive
(Negative)
94,930
94,930
$
91,545
91,545
$
(3,385)
(3,385)
Actual
$
-
Expenditures
Current:
Infrastructure and regulation:
Personal services
Contractual services
Supplies and materials
Other
Indirect cost allocation
Total expenditures
1,300
50,793
500
37,590
4,747
94,930
602
14,166
14,768
698
36,627
500
37,590
4,747
80,162
-
Excess (deficiency) of revenues
over (under) expenditures
-
76,777
76,777
-
Net change in fund balance
-
76,777
76,777
-
Fund balance at beginning of year
Fund balance at end of year
-
76,777
76,777
-
$
169
$
$
$
HORRY COUNTY, SOUTH CAROLINA
GIS/IT SPECIAL REVENUE FUND
BALANCE SHEETS
June 30, 2013
(with comparative amounts for June 30, 2012)
Assets
Pooled cash and investments
Interest receivable
Total assets
Liabilities
Accounts payable - trade
Total liabilities
Fund Balance
Committed to public safety
Total fund balance
Total liabilities and fund balance
2013
2012
$ 167,511
62
$ 167,573
$ 118,079
44
$ 118,123
$
$
9,233
9,233
158,340
158,340
$ 167,573
170
168
168
117,955
117,955
$ 118,123
HORRY COUNTY, SOUTH CAROLINA
GIS/IT SPECIAL REVENUE FUND
SCHEDULES OF REVENUES, EXPENDITURES AND CHANGES IN FUND BALANCE BUDGET (GAAP BASIS) AND ACTUAL
For the Year ended June 30, 2013
(with comparative actual amounts For the Year ended June 30, 2012)
2013
$
47,281
47,281
Variance
Positive
(Negative)
Actual
Budget
Revenues
Fees and fines
Intergovernmental
Interest
Total revenues
2012
$
3,355
47,282
205
50,842
$
3,355
1
205
3,561
Actual
$
5,131
77,871
98
83,100
Expenditures
Current:
Public safety:
Contractual services
Materials and supplies
Other
Total expenditures
123,554
1,598
125,152
9,167
1,290
10,457
114,387
308
114,695
10,000
17,454
1,598
29,052
Excess (deficiency) of revenues
over (under) expenditures
(77,871)
40,385
118,256
54,048
Net change in fund balance
(77,871)
40,385
118,256
54,048
Fund balance at beginning of year
Fund balance at end of year
$
117,955
40,084
171
$
117,955
158,340
$
118,256
$
63,907
117,955
HORRY COUNTY, SOUTH CAROLINA
MULTI-COUNTY BUSINESS PARK ROLLBACK SPECIAL REVENUE FUND
BALANCE SHEETS
June 30, 2013
(with comparative amounts for June 30, 2012)
2013
Assets
Pooled cash and investments
Interest receivable
Total assets
$
$
Fund Balance
Restricted for infrastructure and regulation
Total fund balance
Total liabilities and fund balance
$
$
172
527,320
209
527,529
527,529
527,529
527,529
2012
$
$
$
$
505,909
235
506,144
506,144
506,144
506,144
HORRY COUNTY, SOUTH CAROLINA
MULTI-COUNTY BUSINESS PARK ROLLBACK SPECIAL REVENUE FUND
SCHEDULES OF REVENUES, EXPENDITURES AND CHANGES IN FUND BALANCE BUDGET (GAAP BASIS) AND ACTUAL
For the Year ended June 30, 2013
(with comparative actual amounts For the Year ended June 30, 2012)
2012
2013
Actual
Budget
Revenues
Property taxes
Interest
Total revenues
$
Variance
Positive
(Negative)
-
$
20,705
680
21,385
$
Actual
20,705
680
21,385
$
(872)
(872)
Expenditures
Current:
Infrastructure and regulation:
Construction contracts
Total expenditures
-
-
-
Excess (deficiency) of revenues
over (under) expenditures
-
21,385
21,385
(393,149)
Net change in fund balance
-
21,385
21,385
(393,149)
Fund balance at beginning of year
Fund balance at end of year
$
506,144
506,144
173
$
506,144
527,529
$
21,385
392,277
392,277
$
899,293
506,144
HORRY COUNTY, SOUTH CAROLINA
E-911 SPECIAL REVENUE FUND
BALANCE SHEETS
June 30, 2013
(with comparative amounts for June 30, 2012)
2013
Assets
Pooled cash and investments
Receivables, net:
Fees
Due from other governments
Interest receivable
Total assets
Liabilities
Accounts payable - trade
Accrued salaries and wages
Total liabilities
Fund Balance
Restricted for public safety
Total fund balance
Total liabilities and fund balance
$ 3,202,298
$
61,094
146,383
822
$ 3,410,597
72,308
1,322,869
187
$ 1,599,428
$
$
60,813
5,047
65,860
3,344,737
3,344,737
$ 3,410,597
174
2012
204,064
532
5,358
5,890
1,593,538
1,593,538
$ 1,599,428
HORRY COUNTY, SOUTH CAROLINA
E-911 SPECIAL REVENUE FUND
SCHEDULES OF REVENUES, EXPENDITURES AND CHANGES IN FUND BALANCE BUDGET (GAAP BASIS) AND ACTUAL
For the Year ended June 30, 2013
(with comparative actual amounts For the Year ended June 30, 2012)
2013
Budget
Revenues
Intergovernmental
Fees and fines
Interest
Total revenues
Expenditures
Current:
Public safety:
Personal services
Contractual services
Supplies and materials
Business and transportation
Capital outlay
Other
Total expenditures
Excess (deficiency) of revenues
over (under) expenditures
$
2012
Variance
Positive
(Negative)
Actual
$
Actual
920,000
745,000
1,665,000
$ 2,052,457
714,237
2,843
2,769,537
1,132,457
(30,763)
2,843
1,104,537
$
1,931,425
739,641
1,411
2,672,477
241,705
928,100
5,650
14,650
14,500
352,221
1,556,826
152,761
732,179
360
10,755
14,109
910,164
88,944
195,921
5,290
3,895
391
352,221
646,662
145,229
678,600
2,252
2,681
108,174
1,859,373
1,751,199
1,843,715
828,762
Other Financing Sources (Uses)
Transfers out
(108,174)
Net change in fund balance
Fund balance at beginning of year
Fund balance at end of year
(108,174)
-
1,751,199
1,593,538
$ 1,593,538
1,593,538
$ 3,344,737
175
$
-
(2,800,000)
1,751,199
(956,285)
1,751,199
$
2,549,823
1,593,538
HORRY COUNTY, SOUTH CAROLINA
CDBG GRANT PROGRAM SPECIAL REVENUE FUND
BALANCE SHEETS
June 30, 2013
(with comparative amounts for June 30, 2012)
2013
Assets
Due from other governments
Total assets
Liabilities
Accounts payable - trade
Due to other funds
Accrued salaries and wages
Total liabilities
Fund Balances
Restricted for economic development
Unassigned
Total fund balances
Total liabilities and fund balances
$
$
466,934
466,934
$
$
281,905
281,905
$
159,772
300,087
7,075
466,934
$
68,334
206,987
6,584
281,905
$
176
2012
983,021
(983,021)
466,934
$
836,222
(836,222)
281,905
HORRY COUNTY, SOUTH CAROLINA
CDBG GRANT PROGRAM SPECIAL REVENUE FUND
SCHEDULES OF REVENUES, EXPENDITURES AND CHANGES IN FUND BALANCE BUDGET (GAAP BASIS) AND ACTUAL
For the Year ended June 30, 2013
(with comparative actual amounts For the Year ended June 30, 2012)
2013
Revenues
Intergovernmental
Total revenues
2012
Budget
Actual
Variance
Positive
(Negative)
$ 3,068,237
3,068,237
$ 2,039,458
2,039,458
$ (1,028,779)
(1,028,779)
248,908
2,432,962
32,246
23,629
46,166
20,020
2,803,931
218,752
1,464,895
12,614
12,705
46,166
20,020
1,775,152
30,156
968,067
19,632
10,924
1,028,779
186,816
1,469,574
11,360
9,858
6,608
95,705
1,779,921
264,306
264,306
-
10,000
(264,306)
(264,306)
-
(10,000)
(264,306)
(264,306)
-
(10,000)
Expenditures
Current:
Economic development:
Personal services
Contractual services
Supplies and materials
Business and transportation
Construction contracts
Indirect cost allocation
Capital outlay
Total expenditures
Excess (deficiency) of revenues
over (under) expenditures
Actual
$
1,789,921
1,789,921
Other Financing Sources (Uses)
Transfers out
Total other financing sources (uses)
Net change in fund balance
-
-
-
-
Fund balance at beginning of year
Fund balance at end of year
-
-
-
-
$
177
$
$
$
HORRY COUNTY, SOUTH CAROLINA
RECREATION SPECIAL REVENUE FUND
BALANCE SHEETS
June 30, 2013
(with comparative amounts for June 30, 2012)
2013
Assets
Cash
Pooled cash and investments
Receivables, net:
Property taxes
Other
Interest receivable
Total assets
$
Liabilities
Accounts payable - trade
Accrued salaries and wages
Unavailable revenue - property taxes
Other Liabilities
Total liabilities
Fund Balance
Restricted for culture, recreation and tourism
Total fund balance
Total liabilities and fund balance
178
100
2,931,018
2012
$
100
3,018,199
143,876
44,396
1,359
$ 3,120,749
160,427
35,672
1,556
$ 3,215,954
$
$
73,614
82,247
117,942
13,186
286,989
2,833,760
2,833,760
$ 3,120,749
93,018
84,031
126,214
303,263
2,912,691
2,912,691
$ 3,215,954
HORRY COUNTY, SOUTH CAROLINA
RECREATION SPECIAL REVENUE FUND
SCHEDULES OF REVENUES, EXPENDITURES AND CHANGES IN FUND BALANCE BUDGET (GAAP BASIS) AND ACTUAL
For the Year ended June 30, 2013
(with comparative actual amounts For the Year ended June 30, 2012)
2012
2013
Revenues
Real property taxes
Personal property taxes
Vehicle taxes
Interest
Other
Total revenues
Expenditures
Current:
Culture, recreation and tourism:
Personal services
Contractual services
Supplies and materials
Business and transportation
Construction contracts
Capital outlay
Indirect cost allocation
Distributions to municipalities
Programs
Other
Total expenditures
Excess (deficiency) of revenues
over (under) expenditures
Budget
Actual
$ 2,986,300
227,500
210,000
4,000
705,466
4,133,266
$ 2,964,116
214,141
240,329
4,158
795,328
4,218,072
1,978,318
379,411
149,134
123,224
279,983
197,578
681,393
200,000
871,011
83,907
4,943,959
1,853,111
369,539
146,489
105,656
100,432
197,578
681,393
200,000
638,464
47,035
4,339,697
(810,693)
(121,625)
40,000
40,000
2,694
40,000
42,694
(770,693)
(78,931)
Variance
Positive
(Negative)
$
(22,184)
(13,359)
30,329
158
89,862
84,806
Actual
$
125,207
9,872
2,645
17,568
179,551
232,547
36,872
604,262
2,959,399
223,569
238,993
2,197
674,036
4,098,194
1,794,793
341,065
229,872
132,165
196,652
572,788
619,902
200,000
539,419
38,711
4,665,367
689,068
(567,173)
Other Financing Sources (Uses)
Sale of Assets
Transfers in
Total other financing sources (uses)
Net change in fund balance
Fund balance at beginning of year
Fund balance at end of year
2,912,691
$ 2,141,998
179
2,912,691
$ 2,833,760
154,011
154,011
(2,694)
(2,694)
686,374
$
686,374
(413,162)
$
3,325,853
2,912,691
HORRY COUNTY, SOUTH CAROLINA
CAPITAL PROJECTS FUNDS
Capital projects funds are used to account for all financial resources to be used for the
acquisition and/or construction of major capital facilities (other than those financed by
proprietary funds). The primary sources of money in this fund are the proceeds from general
obligation bond issues, Federal and state grants and interest earnings.
General Improvement – accounts for financial resources and contribution of major capital
facilities and equipment of the County.
Capital Project Sales Tax – accounts for the one cent sales tax increase that is to be used
to upgrade specific roads over a seven year period beginning May 1, 2007.
Voluntary Developer Contributions – accounts for the monies donated by the developers
to help offset the impact to the community because of increased housing and development in
certain areas of the County. These contributions have designated uses as stated in the
agreements. These designated uses can range from park developments/improvements, road
improvements or support for fire protection in the developed area.
HORRY COUNTY, SOUTH CAROLINA
MAJOR CAPITAL PROJECTS FUNDS
COMBINING BALANCE SHEET
June 30, 2013
Major Funds
General
Improvement Capital
Projects
Capital Projects
Sales Tax
$
7,136,957
$
242,824,439
$
65,939
22,761
1,332,460
751,808
9,309,925
$
7,793
15,700,808
258,533,040
Total Major Funds
Assets
Pooled cash and investments
Receivables, net:
Accounts and other
Interest receivable
Due from other governments
Restricted assets
Total assets
$
249,961,396
$
65,939
30,554
17,033,268
751,808
267,842,965
Liabilities and Fund Balance
Liabilities:
Accounts payable - trade
Retainage payable
$
465,781
91,089
Total liabilities
$
2,015,707
68,774
$
2,481,488
159,863
556,870
2,084,481
2,641,351
Fund balance :
Restricted for capital projects
Restricted for infrastructure and regulation
Committed to public safety
Committed to culture, recreation and tourism
Committed to infrastructure and regulation
Committed to other capital projects
939,481
499,237
1,951,719
1,699,343
3,663,275
256,448,559
-
939,481
256,448,559
499,237
1,951,719
1,699,343
3,663,275
Total fund balance
8,753,055
256,448,559
265,201,614
Total liabilities and fund balance
$
9,309,925
Note: Separation is for presentation purposes only.
180
$
258,533,040
$
267,842,965
HORRY COUNTY, SOUTH CAROLINA
MAJOR CAPITAL PROJECTS FUNDS
COMBINING STATEMENT OF REVENUES, EXPENDITURES AND CHANGES IN FUND BALANCE
FOR THE YEAR ENDED JUNE 30, 2013
Major Funds
Revenues
Intergovernmental
Sales Tax
Disposal fee
Interest
Other - donations
Total revenues
General
Improvement
Capital Projects
Capital Projects
Sales Tax
Total Major Funds
$
$
$
Expenditures
Capital outlay:
Supplies and materials
Construction contracts
Capital outlay
Total economic development
1,509,543
707,889
84,261
200,000
2,501,693
65,731,883
515,872
66,247,755
1,509,543
65,731,883
707,889
600,133
200,000
68,749,448
210
1,765,996
3,844,141
5,610,347
-
210
1,765,996
3,844,141
5,610,347
-
25,118,162
3,557,407
3,916,071
32,591,640
25,118,162
3,557,407
3,916,071
32,591,640
5,610,347
32,591,640
38,201,987
Excess (deficiency) of revenue
over expenditures
(3,108,654)
33,656,115
30,547,461
Other Financing Sources (Uses)
Capital lease
Transfers in
Transfers out
Total other financing sources (uses)
460,300
2,626,999
(1,670,186)
1,417,113
-
Net change in fund balance
(1,691,541)
33,656,115
31,964,574
Fund balance at beginning of year
10,444,596
222,792,444
233,237,040
Infrastructure and regulation:
Construction contracts
Capital outlay
Capital outlay - infrastructure
Total infrastructure & regulation
Total expenditures
Fund balance at end of year
$
8,753,055
Note: Separation is for presentation purposes only.
181
$
256,448,559
460,300
2,626,999
(1,670,186)
1,417,113
$
265,201,614
HORRY COUNTY, SOUTH CAROLINA
GENERAL IMPROVEMENT CAPITAL PROJECTS FUND
BALANCE SHEETS
June 30, 2013
(with comparative amounts for June 30, 2012)
2013
2012
Assets
Pooled cash and investments
Receivables, net:
Accounts and other
Interest receivable
Due from other governments
Restricted assets
$
7,136,957
$
Total assets
$
9,309,925
$
11,245,412
$
465,781
91,089
$
712,989
87,827
65,939
22,761
1,332,460
751,808
10,157,609
67,361
37,209
337,480
645,753
Liabilities and Fund Balance
Liabilities:
Accounts payable - trade
Retainage payable
Total liabilities
556,870
800,816
Fund balance :
Restricted for capital projects
Committed to public safety
Committed to culture, recreation and tourism
Committed to infrastructure and regulation
Committed to other capital projects
939,481
499,237
1,951,719
1,699,343
3,663,275
1,724,121
848,779
2,214,793
2,859,493
2,797,410
Total fund balance
8,753,055
10,444,596
Total liabilities and fund balance
$
182
9,309,925
$
11,245,412
HORRY COUNTY, SOUTH CAROLINA
GENERAL IMPROVEMENTS CAPITAL PROJECTS FUND
STATEMENTS OF REVENUES, EXPENDITURES AND CHANGES IN FUND BALANCE -
FOR THE YEAR ENDED JUNE 30, 2013
(With comparative actual amounts for the year ended June 30, 2012)
2013
Revenues
Disposal fee
Intergovernmental
Interest
Other - donations
$
707,889
1,509,543
84,261
200,000
2012
$
681,639
567,750
135,228
125,000
Total revenues
2,501,693
1,509,617
Expenditures
Capital outlay:
Supplies and materials
Construction contracts
Capital outlay
Total expenditures
210
1,765,996
3,844,141
5,610,347
8,687,969
12,038,999
20,726,968
Excess (deficiency) of revenue
over expenditures
(3,108,654)
(19,217,351)
Other Financing Sources (Uses)
Capital lease
Transfers in
Transfers out
Total other financing sources (uses)
460,300
2,626,999
(1,670,186)
1,417,113
2,602,861
5,245,836
(1,139,368)
6,709,329
Net change in fund balance
(1,691,541)
(12,508,022)
Fund balance at beginning of year
10,444,596
22,952,618
Fund balance at end of year
$
183
8,753,055
$
10,444,596
HORRY COUNTY, SOUTH CAROLINA
CAPITAL PROJECTS SALES TAX FUND
BALANCE SHEETS
June 30, 2013
(with comparative amounts for June 30, 2012)
2013
2012
Assets
Pooled cash and investments
$
Interest receivable
Due from other governments
Total assets
242,824,439
$
208,423,237
7,793
-
15,700,808
16,093,808
$
258,533,040
$
224,517,045
$
2,015,707
$
1,724,601
Liabilities and Fund Balance
Liabilities:
Accounts payable - trade
Retainage payable
68,774
-
2,084,481
1,724,601
Fund balance :
Restricted for infrastructure and regulation
256,448,559
222,792,444
Total fund balance
256,448,559
222,792,444
Total liabilities
Total liabilities and fund balance
$
184
258,533,040
$
224,517,045
HORRY COUNTY, SOUTH CAROLINA
CAPITAL PROJECTS SALES TAX FUND
STATEMENTS OF REVENUES, EXPENDITURES AND CHANGES IN FUND BALANCE -
FOR THE YEAR ENDED JUNE 30, 2013
(With comparative actual amounts for the year ended June 30, 2012)
2012
2013
Revenues
Intergovernmental:
Sales tax
Other
Interest
Total revenues
$
65,731,883
515,872
66,247,755
$
64,801,867
15,000,000
679,052
80,480,919
Expenditures
Infrastructure and regulation:
Construction contracts
Capital outlay
Capital outlay - infrastructure
Total expenditures
25,118,162
3,557,407
3,916,071
32,591,640
30,722,276
9,880,494
40,602,770
Excess (deficiency) of revenue
over expenditures
33,656,115
39,878,149
Net change in fund balance
33,656,115
39,878,149
222,792,444
182,914,295
Fund balance at beginning of year
Fund balance at end of year
$
185
256,448,559
$
222,792,444
HORRY COUNTY, SOUTH CAROLINA
VOLUNTARY DEVELOPER CONTRIBUTIONS CAPITAL PROJECTS FUND
BALANCE SHEETS
June 30, 2013
(with comparative amounts for June 30, 2012)
2013
2012
Assets
Pooled cash and investments
Interest receivable
Total assets
$
$
238,418
91
238,509
$
$
249,913
117
250,030
Liabilities and Fund Balance
Liabilities:
Accounts payable - trade
Total liabilities
$
-
$
12,311
12,311
Fund balance :
Restricted for culture, recreation and tourism
Restricted for infrastructure and regulation
43,316
195,193
46,779
190,940
Total fund balance
238,509
237,719
Total liabilities and fund balance
$
186
238,509
$
250,030
HORRY COUNTY, SOUTH CAROLINA
VOLUNTARY DEVELOPER CONTRIBUTIONS CAPITAL PROJECTS FUND
STATEMENTS OF REVENUES, EXPENDITURES AND CHANGES IN FUND BALANCE -
FOR THE YEAR ENDED JUNE 30, 2013
(With comparative actual amounts for the year ended June 30, 2012)
2013
Revenues
Interest
Other
Total revenues
$
Expenditures
Culture, recreation and tourism:
Construction contracts
Capital outlay
Total expenditures
2012
290
10,500
10,790
-
Excess of revenue over expenditures
10,790
Other Financing Sources (Uses)
Transfers out
Total other financing sources (uses)
(10,000)
(10,000)
Net change in fund balance
(32,081)
(32,081)
237,719
$
187
238,509
230
9,500
9,730
29,499
12,312
41,811
790
Fund balance at beginning of year
Fund balance at end of year
$
269,800
$
237,719
HORRY COUNTY, SOUTH CAROLINA
DEBT SERVICE FUNDS
Debt service funds are used to account for fund accumulated for, and payment of, all general
long-term debt principal, interest and fees, exclusive of those relating to propriety funds. The
County currently has established the following debt service funds:
RIDE Program – accounts for the funds accumulated for, and payment of principal, insured
and uninsured portions, interest, and fees on intergovernmental loan agreements with the
South Carolina Transportation Infrastructure Bank for the Horry County Road Improvement
Development Efforts (RIDE) projects.
General Debt – accounts for revenue collected from 5.0 mills levied on real and personal
property and the funds accumulated for, and payment of, all general obligation long-term debt
principal, interest and fees other than those accounted for in other funds.
Special Obligation Debt – accounts for the funds accumulated for, and payment of, all
special obligation debt principal, interest and fees other than those accounted for in other
funds.
Note: Higher Education and Horry-Georgetown Tech funds previously presented as a Debt Service
Funds in fiscal year ended 2012 are presented as Special Revenue Funds for fiscal year ended 2013.
HORRY COUNTY, SOUTH CAROLINA
RIDE PROGRAM DEBT SERVICE FUND - MAJOR FUND
BALANCE SHEETS
June 30, 2013
(with comparative amounts for June 30, 2012)
2013
Assets
Pooled cash and investments
Receivables (net):
Fees receivable
Interest Receivable
Funds held in trust (restricted):
Loan reserve account
Total assets
$
$
Liabilities
Due to other funds
Unavailable revenue - fees and other
Total liabilities
$
Fund Balance
Restricted for debt service
Total fund balance
Total liabilities and fund balance
$
188
2,906,502
2012
$
2,738,801
4,798,230
794
4,963,223
782
40,336,129
48,041,655
39,144,551
$ 46,847,357
47,208
47,208
47,994,447
47,994,447
48,041,655
$
46,427
253,222
299,649
46,547,708
46,547,708
$ 46,847,357
HORRY COUNTY, SOUTH CAROLINA
RIDE PROGRAM DEBT SERVICE FUND- MAJOR FUND
SCHEDULES OF REVENUES, EXPENDITURES AND CHANGES IN FUND BALANCE BUDGET (GAAP BASIS) AND ACTUAL
FOR THE YEAR ENDED JUNE 30, 2013
(with comparative actual amounts for the year ended June 30, 2012)
2012
2013
Budget
Revenues
Hospitality Fees
Interest
$
Total revenues
Expenditures
Debt Service:
Principal
Insured
Uninsured
Interest
Insured
Uninsured
Contingency
Total debt service
Excess of revenue over expenditures
Variance
Positive
(Negative)
Actual
$
Actual
32,048,500
893,500
$ 32,646,978
857,140
598,478
(36,360)
$
32,283,711
929,976
32,942,000
33,504,118
562,118
33,213,687
12,914,956
11,403,711
12,914,956
11,403,711
-
12,503,609
9,875,466
2,085,044
5,334,419
891,370
2,085,044
5,334,419
-
891,370
2,496,391
5,641,966
-
32,629,500
31,738,130
891,370
30,517,432
312,500
1,765,988
1,453,488
2,696,255
Other Financing Sources (Uses)
Transfers out
(312,500)
(319,249)
(6,749)
(315,240)
Total other financing sources (uses)
(312,500)
(319,249)
(6,749)
(315,240)
Net change in fund balance
Fund balance, beginning of year
Fund balance, end of year
$
-
1,446,739
1,446,739
2,381,015
46,547,708
46,547,708
-
44,166,693
46,547,708
$ 47,994,447
189
$
1,446,739
$
46,547,708
HORRY COUNTY, SOUTH CAROLINA
COMBINING BALANCE SHEET
NON-MAJOR DEBT SERVICE FUNDS
June 30, 2013
General
Debt
Assets
Pooled cash and investments
Receivables, net:
Taxes
Due from other funds
Interest receivable
Restricted assets
Total Assets
Liabilities
Unavailable revenue-property taxes
Total liabilities
Fund Balance
Restricted for debt service
Total Fund Balance
Total liabilities and fund balance
$ 10,929,897
Non-Major Funds
Special
Obligation
Debt
$
1,883,738
423,423
5,097
$ 11,358,417
$
222,600
203,850
2,310,188
$
$
337,163
337,163
11,021,254
11,021,254
$ 11,358,417
190
$
-
2,310,188
2,310,188
2,310,188
Total
Non-Major
Funds
$
12,813,635
$
423,423
222,600
5,097
203,850
13,668,605
$
$
337,163
337,163
13,331,442
13,331,442
13,668,605
HORRY COUNTY, SOUTH CAROLINA
COMBINING STATEMENT OF REVENUES, EXPENDITURES, AND CHANGES IN FUND BALANCES
NON-MAJOR DEBT SERVICE FUNDS
FOR THE YEAR ENDED JUNE 30, 2013
Non- Major Funds
Special
General
Obligation
Debt
Debt
Revenues
Real property taxes
Personal property taxes
Vehicle taxes
Intergovernmental
Hospitality fees
Interest
Total revenues
Expenditures
Debt service:
Principal
Interest
Agents fees
$
8,717,399
624,178
705,309
35,026
144,845
10,226,757
$
Total
Non-Major
Funds
2,088,342
141
2,088,483
$
8,717,399
624,178
705,309
35,026
2,088,342
144,986
12,315,240
9,194,414
4,714,820
3,410
1,986,632
176,327
525
11,181,046
4,891,147
3,935
13,912,644
2,163,484
16,076,128
Total expenditures
13,912,644
2,163,484
16,076,128
Excess (deficiency) of revenues
over (under) expenditures
(3,685,887)
Total debt service
(75,001)
(3,760,888)
Other Financing Sources (Uses)
Transfers in
2,144,678
-
2,144,678
Total other financing sources (uses)
2,144,678
-
2,144,678
Net change in fund balance
(1,541,209)
Fund balance at beginning of year
12,562,463
Fund balance at end of year
$ 11,021,254
191
(75,001)
(1,616,210)
2,385,189
$
2,310,188
14,947,652
$
13,331,442
HORRY COUNTY, SOUTH CAROLINA
GENERAL DEBT SERVICE FUND
BALANCE SHEETS
June 30, 2013
(with comparative total amounts for June 30, 2012)
2013
Assets
Pooled cash and investments
Receivables, net:
Property taxes
Interest receivable
$
10,929,897
$ 12,455,411
423,423
5,097
460,450
5,964
$ 12,921,825
Total assets
$
11,358,417
Liabilities
Unavailable revenue-property taxes
Total Liabilities
$
337,163
337,163
Fund Balance
Restricted for debt service
Total fund balance
$
Total liabilities and fund balance
192
2012
$
359,362
359,362
11,021,254
11,021,254
12,562,463
12,562,463
11,358,417
$ 12,921,825
HORRY COUNTY, SOUTH CAROLINA
GENERAL DEBT SERVICE FUND
SCHEDULES OF REVENUES, EXPENDITURES AND CHANGES IN FUND BALANCE BUDGET (GAAP BASIS) AND ACTUAL
FOR THE YEAR ENDED JUNE 30, 2013
(with comparative actual amounts for the year ended June 30, 2012)
2013
Budget
Revenues
Real property taxes
Personal property taxes
Vehicle taxes
Intergovernmental
Interest
Total revenues
$
8,685,440
658,300
609,000
35,026
9,825
Actual
$
8,717,399
624,178
705,309
35,026
144,845
2012
Variance
Positive
(Negative)
$
31,959
(34,122)
96,309
135,020
Actual
$
8,638,087
645,771
609,032
35,026
169,695
9,997,591
10,226,757
229,166
10,097,611
Expenditures
Debt Service:
Principal
Interest
Agents fees
Bond issuance costs
Other
Total expenditures
9,206,665
5,282,573
6,030
14,495,268
9,194,414
4,714,820
3,410
13,912,644
12,251
567,753
2,620
582,624
8,727,530
4,977,184
4,405
135,339
1,572
13,846,030
Excess (deficiency) of revenues
over (under) expenditures
(4,497,677)
(3,685,887)
811,790
(3,748,419)
2,725,563
-
2,144,678
-
(580,885)
-
1,761,642
6,640,000
216,874
2,725,563
2,144,678
(580,885)
(6,752,219)
1,866,297
Net change in fund balance
(1,772,114)
(1,541,209)
230,905
(1,882,122)
Fund balance at beginning of year
12,562,463
12,562,463
$ 10,790,349
$ 11,021,254
Other Financing Sources (Uses)
Transfers in
Issuance of refunding debt
Bond Premium
Payment to refunded bond
escrow agent
Total other financing sources
Fund balance at end of year
193
$
-
14,444,585
230,905
$ 12,562,463
HORRY COUNTY, SOUTH CAROLINA
SPECIAL OBLIGATION DEBT SERVICE FUND
BALANCE SHEETS
June 30, 2013
(with comparative total amounts for June 30, 2012)
2013
Assets
Equity in pooled cash and investments
Due from other funds
Restricted assets
2012
$
1,883,738
222,600
203,850
$ 1,911,498
248,680
225,011
Total assets
$
2,310,188
$ 2,385,189
Fund Balance
Restricted for debt service
Total fund balance
$
2,310,188
2,310,188
$ 2,385,189
2,385,189
Total liabilities and fund balance
$
2,310,188
$ 2,385,189
194
HORRY COUNTY, SOUTH CAROLINA
SPECIAL OBLIGATION DEBT SERVICE FUND
SCHEDULES OF REVENUES, EXPENDITURES AND CHANGES IN FUND BALANCE BUDGET (GAAP BASIS) AND ACTUAL
FOR THE YEAR ENDED JUNE 30, 2013
(with comparative actual amounts for the year ended June 30, 2012)
2013
Budget
Actual
$ 2,162,959
-
$ 2,088,342
141
-
Total revenues
2,162,959
Expenditures
Debt Service:
Principal
Interest
Agents fees
Total debt service
1,986,500
176,459
2,162,959
2012
Variance
Positive
(Negative)
Actual
Revenues
Hospitality fees
Interest
Other
$
(74,617)
141
-
$ 2,157,032
141
21,161
2,088,483
(74,476)
2,178,334
1,986,632
176,327
525
2,163,484
(132)
132
(525)
(525)
1,917,500
239,532
525
2,157,557
Excess of revenues over expenditures
-
(75,001)
(75,001)
20,777
Net change in fund balance
-
(75,001)
(75,001)
20,777
Fund balance at beginning of year
Fund balance at end of year
2,385,189
2,385,189
$ 2,385,189
$ 2,310,188
195
$
(75,001)
2,364,412
$ 2,385,189
HORRY COUNTY, SOUTH CAROLINA
PROPRIETARY (ENTERPRISE) FUND
Proprietary (enterprise) funds account for operations that are financed and operated in a
manner similar to private business enterprises. In a proprietary fund the intent is that costs
(expenses, including depreciation) of providing goods or services to the general public on a
continuing basis be financed primarily through user charges.
Department of Airports – accounts for revenue and expenses for the operations of the
Conway, Loris, Grand Strand general aviation airports, and the Myrtle Beach International
Airport.
HORRY COUNTY, SOUTH CAROLINA
DEPARTMENT OF AIRPORTS ENTERPRISE FUND
STATEMENTS OF NET POSITION
JUNE 30, 2013
(with comparative amounts for June 30, 2012)
2013
Assets
Current assets:
Cash and cash equivalents
Investments
Accounts receivable (net of allowance of
$270,020 in 2013 and $455,792 in 2012)
Accrued interest on investments
Due from other governments
Inventories
Prepaid items
Total current assets
Noncurrent assets:
Restricted assets:
Cash and cash equivalents
Investments
Receivables - PFC's and CFC's
Total restricted assets
Capital assets:
Land, easements and infrastructure
Depreciable buildings, runways, taxiways,
aprons, machinery and equipment, net
Construction-in-progress
Total capital assets, net
Service concession arrangement (SCA)
Bond issuance costs, net
Total assets
- CONTINUED -
196
$
2012
31,596,962
19,156,277
$ 44,855,831
5,578,187
848,911
74,145
5,789,146
957,498
69,231
58,492,170
549,786
118,245
2,682,778
427,725
63,940
54,276,492
6,297,807
27,624,875
1,025,051
34,947,733
20,240,191
40,981,897
812,766
62,034,854
32,455,493
32,474,793
195,077,396
1,683,619
229,216,508
83,723,983
70,158,313
186,357,089
4,792,038
6,229,595
918,936
951,755
$ 328,367,385
$ 309,849,785
HORRY COUNTY, SOUTH CAROLINA
DEPARTMENT OF AIRPORTS ENTERPRISE FUND
STATEMENTS OF NET POSITION
- CONTINUED 2013
Liabilities
Current liabilities:
Accounts payable-trade
Construction accounts and retainage payable
Accrued salaries, wages and compensated absences
Other accrued expenses
Unearned revenue
Due to other funds
Capital leases payable - current portion
Amounts due to tenants, airlines, car rentals
Current liabilities payable from restricted assets:
Accrued interest payable
Total current liabilities payable from restricted assets
Total current liabilities
Noncurrent liabilities:
Revenue bonds payable
Compensated absences - long term
Net other post-employment benefits obligation
Capital leases
Total non-current liabilities
Total liabilities
Deferred Inflows of Resources
Unavailable Revenue from
Service Concession Arrangement
Net position
Net investment in capital assets
Restricted for:
Debt service
Capital projects
Unrestricted
Total net position
Total liabilities, deferred inflows of resources and net position
197
$
326,391
10,900,728
565,499
648,445
107,153
784,394
99,499
478,168
13,910,277
2012
$
260,070
10,521,498
519,627
880,743
240,975
856,741
44,792
586,709
13,911,155
1,543,097
1,543,097
1,543,097
1,543,097
15,453,374
15,454,252
60,396,745
905,253
681,155
585,979
62,569,132
78,022,506
60,389,843
900,288
631,051
135,624
62,056,806
77,511,058
4,792,038
6,229,595
169,529,044
138,122,942
16,926,018
16,002,795
43,094,984
245,552,841
14,297,502
30,740,353
42,948,335
226,109,132
$ 328,367,385
$ 309,849,785
HORRY COUNTY, SOUTH CAROLINA
DEPARTMENT OF AIRPORTS ENTERPRISE FUND
STATEMENTS OF REVENUES, EXPENSES AND CHANGES IN NET POSITION
FOR THE YEAR ENDED JUNE 30, 2013
(with comparative amounts for the year ended June 30, 2012)
Operating Revenues
Landing fees
Airline terminal rents
Concessions and rentals
Security fees
Leases
Fuel sales - FBO
Other airline services
Federal revenue- TSA LEO reimbursement program
Other
Total operating revenues
Less, signatory airline rebate and incentive fee waivers
Net operating revenues
Operating Expenses
Salaries and benefits
Utilities
Receivables - PFC's and CFC's
Maintenance and supplies
Fuel cost of sales
Vehicle and equipment (non-capital) expense
Insurance
Dues, memberships, and travel
Office supplies
Horry County administrative costs
Depreciation and amortization
Bad debt expense
Total operating expenses
Operating income (loss)
- CONTINUED -
198
2013
2012
$ 1,425,463
4,961,141
6,920,652
182,358
791,511
3,754,998
540,066
119,007
442,580
19,137,776
(606,587)
18,531,189
$ 1,341,027
4,163,986
6,835,508
211,928
808,922
3,912,198
580,038
113,906
422,599
18,390,112
(358,439)
18,031,673
6,766,679
1,146,519
951,361
772,028
2,884,229
454,085
327,776
245,362
39,800
200,000
7,365,755
21,153,594
(2,622,405)
6,204,976
952,819
889,242
744,036
2,987,205
401,698
292,752
213,502
32,439
350,000
5,960,358
189,972
19,218,999
(1,187,326)
HORRY COUNTY, SOUTH CAROLINA
DEPARTMENT OF AIRPORTS ENTERPRISE FUND
STATEMENTS OF REVENUES, EXPENSES AND CHANGES IN NET POSITION
- CONTINUED 2013
Non-Operating Revenues (Expenses)
Passenger Facility Charges (PFC's)
Contract Facility Charges (CFC's)
Intergovernmental revenues
Gain (loss) on disposal/sale of capital assets
Redevelopment Authority grant revenue
Revenue - Utility Companies for ITAP
Other expense
Tree removal
Interest income
Interest expense
Legal settlement
Interest subsidy on Recovery Zone Economic Bonds
Net non-operating revenues (expenses)
Income before capital contributions
Capital Contributions
State grants - capital projects
Federal grants - capital projects
Change in net position
Net position, beginning of year
Net position, end of year
199
2012
3,202,752
2,505,421
1,873,612
193,775
150,000
400,000
(9,200)
198,082
(1,319,640)
306,584
7,501,386
3,175,514
2,612,106
3,889,880
2,021,946
205,000
625,000
(71,612)
282,184
(507,403)
(36,000)
320,527
12,517,142
4,878,981
11,329,816
14,564,728
19,443,709
226,109,132
$ 245,552,841
600,269
12,348,927
24,279,012
201,830,120
$ 226,109,132
HORRY COUNTY, SOUTH CAROLINA
DEPARTMENT OF AIRPORTS ENTERPRISE FUND
STATEMENTS OF CASH FLOWS
FOR THE YEAR ENDED JUNE 30, 2013
(with comparative amounts for the year ended June 30, 2012)
Cash flows from operating activities
Cash received for:
Landing fees, terminal rents, and concessions leases
FBO sales and airline services
Other
Cash paid for:
Salaries and benefits
Maintenance, supplies, fuel, utilities and equipment
Net cash provided by operating activities
2013
2012
$ 13,075,350
4,484,674
429,675
$ 13,270,082
4,401,699
420,881
(6,665,738)
(7,794,546)
3,529,415
(6,043,654)
(6,592,299)
5,456,709
(9,200)
(9,200)
(36,000)
(36,000)
Cash flows from capital and related financing activities
Receipt of passenger and contract facility charges
Acquisition and construction of capital assets
Sale of capital assets
Interest paid on bonds and notes
Receipt of Federal subsidy on Recovery Zone Economic Bonds
Principal payments on capital lease obligation
Receipt of intergovernmental and private grants
Proceeds from Airport Improvement Program and State grants
Net cash provided by (used in) capital and related financing activities
5,495,888
(50,253,665)
193,775
(313,549)
306,584
(53,589)
2,788,046
11,093,927
(30,742,583)
5,804,969
(53,897,948)
1,950,334
(366,617)
320,527
(43,275)
4,727,567
16,339,286
(25,165,157)
Cash flows from investing activities
Investment purchases
Investment sales
Interest on investments
Net cash provided by investing activities
(46,781,152)
46,560,085
242,182
21,115
(46,560,085)
46,218,934
341,188
37
(27,201,253)
(19,744,411)
44,855,831
20,240,191
65,096,022
39,610,679
45,229,754
84,840,433
31,596,962
6,297,807
$ 37,894,769
44,855,831
20,240,191
$ 65,096,022
Cash flows from non-capital financing activities
Tree removal
Legal settlement
Net cash (used in) non-capital financing activities
Net increase (decrease) in cash and cash equivalents
Cash and cash equivalents, beginning of year
Unrestricted
Restricted
Cash and cash equivalents, end of year
Unrestricted
Restricted
- CONTINUED -
200
HORRY COUNTY, SOUTH CAROLINA
DEPARTMENT OF AIRPORTS ENTERPRISE FUND
STATEMENTS OF CASH FLOWS
- CONTINUED 2013
Reconciliation of operating income (loss) to cash
flows from operating activities
Operating loss
$ (2,622,405)
Adjustments to reconcile operating
income to net cash provided by:
Depreciation and amortization
7,365,755
Bad debt expense
(Increase) decrease in certain assets:
Accounts receivable
(299,125)
Prepaid items
(5,291)
Inventories
(529,773)
(Decrease) increase in certain liabilities:
Accounts payable
66,321
Accrued salaries, wages and
compensated absences
50,837
Net other post-employment benefit
obligation
50,104
Other accrued expenses
(232,298)
Due to other funds
(72,347)
Unearned Revenue
(133,822)
Receivables - PFC's and CFC's
car rental companies
(108,541)
Net cash provided by operating activities
$ 3,529,415
201
2012
$ (1,187,326)
5,960,358
189,972
309,744
35,471
(63,535)
34,170
105,525
55,797
179,921
85,367
1,836
(250,591)
$ 5,456,709
HORRY COUNTY, SOUTH CAROLINA
INTERNAL SERVICE FUND
Internal service funds account for the financing of goods and services provided by one
department to other departments of the government and to other units, on a cost
reimbursement basis.
Fleet Service – accounts for the maintenance and replacement of County vehicles including
heavy and light equipment.
HORRY COUNTY, SOUTH CAROLINA
FLEET SERVICE INTERNAL SERVICE FUND
STATEMENTS OF NET POSITION
June 30, 2013
(with comparative amounts for June 30, 2012)
2013
Assets
Current assets:
Cash and cash equivalents
Pooled cash and investments
Interest receivable
Inventory
Total current assets
$
Non-current assets:
Capital assets:
Machinery and equipment
Less, accumulated depreciation
Net capital assets
100
18,406,004
7,531
367,425
18,781,060
2012
$
29,846,084
(16,398,018)
13,448,066
100
16,727,103
20,185
387,384
17,134,772
27,610,238
(15,083,827)
12,526,411
Total assets
$ 32,229,126
$ 29,661,183
Liabilities and Net Position
Current liabilities:
Accounts payable-trade
Accrued salaries, wages and compensated absences
Total current liabilities
$
$
Net position:
Net investment in capital assets
Restricted for capital
Total net position
Total liabilities and net position
202
938,231
28,031
966,262
135,151
26,765
161,916
13,448,066
17,814,798
31,262,864
12,526,411
16,972,856
29,499,267
$ 32,229,126
$ 29,661,183
HORRY COUNTY, SOUTH CAROLINA
FLEET SERVICE INTERNAL SERVICE FUND
STATEMENTS OF REVENUES, EXPENSES AND CHANGES IN NET POSITION
FOR THE YEAR ENDED JUNE 30, 2013
(with comparative actual amounts for the year ended June 30, 2012)
2013
Operating Revenues
Charges for services
Other
$
5,878,736
207,835
2012
$
6,817,986
121,242
Total operating revenues
6,086,571
6,939,228
Operating Expenses
Personal services
Contractual services
Supplies and materials
Business and transportation
Indirect cost allocation plan
Depreciation
Other
Total operating expenses
868,284
33,974
35,846
1,265,789
4,947
3,414,309
226,003
5,849,152
820,052
33,640
31,873
1,307,390
1,830
3,169,585
21,534
5,385,904
Operating income
237,419
1,553,324
Nonoperating revenues (expenses)
Gain (loss) on disposal of assets
Interest
Net non-operating revenues (expenses)
212,677
24,905
237,582
1,019,169
16,948
1,036,117
Income before transfers
475,001
2,589,441
Transfers in
1,288,596
1,026,000
Change in net position
1,763,597
3,615,441
29,499,267
25,883,826
Net position, beginning of year
Net position, end of year
$
203
31,262,864
$
29,499,267
HORRY COUNTY, SOUTH CAROLINA
FLEET SERVICE INTERNAL SERVICE FUND
STATEMENTS OF CASH FLOWS
FOR THE YEAR ENDED JUNE 30, 2013
(with comparative actual amounts for the year ended June 30, 2012)
2013
Cash flows from operating activities
Cash received from:
Services
Miscellaneous charges
Cash paid for:
Fleet maintenance
Other supplies and miscellaneous costs
Net cash provided by operating activities
$ 5,878,736
207,835
Cash flows from non-capital and related financing activities
Transfers in
Net cash provided by non-capital and related financing activities
Cash flows from capital and related financing activities
Purchase of capital assets
Proceeds from disposition of capital assets
Net cash used in capital and other related financing activities
Cash flows from investing activities
Interest income
Net cash provided by investing activities
Net change in cash and cash equivalents
Cash and cash equivalents, beginning of year
Cash and cash equivalents, end of year
Reconciliation of operating income to net cash
provided (used) by operating activities
Operating income
Adjustments to reconcile operating income to net
cash provided by operating activities:
Depreciation
(Increase) decrease in assets:
Inventories
Increase (decrease) in liabilities:
Accounts payable
Accrued salaries, wages and compensated absences
Net cash provided by operating activities
204
2012
$
6,817,986
121,242
(1,574,692)
(35,846)
4,476,033
(2,110,454)
(31,873)
4,796,901
1,288,596
1,288,596
1,026,000
1,026,000
(4,481,586)
358,299
(4,123,287)
(5,309,305)
1,411,346
(3,897,959)
37,559
37,559
11,982
11,982
1,678,901
16,727,203
$ 18,406,104
1,936,924
14,790,279
$ 16,727,203
$
$
237,419
3,414,309
3,169,585
19,959
803,080
1,266
$ 4,476,033
1,553,324
(27,466)
$
96,605
4,853
4,796,901
FIDUCIARY (AGENCY) FUNDS
Fiduciary (agency) funds account for assets held by the County as an agent for other taxing
units or other entities. Agency funds are custodial in nature; assets equal liabilities, and do
not measure the results of operations. Interest earned on agency fund investments is
credited and received by the General Fund unless an agreement provides otherwise.
HORRY COUNTY, SOUTH CAROLINA
COMBINING STATEMENT OF CHANGES IN ASSETS AND LIABILITIES
ALL AGENCY FUNDS
FOR THE YEAR ENDED JUNE 30, 2013
Balance
June 30,
2012
Totals-Agency Funds
Assets:
Cash and investments
Pooled cash and investments
Interest receivable
Taxes receivable
Total assets
Liabilities:
Due to others
Total liabilities
$
Additions
Balance
June 30,
2013
Deductions
$
22,261,325
507,984,297
1,704
557,353,174
$ 1,087,600,500
$
21,257,960
505,268,241
19,559
510,269,146
$ 1,036,814,906
$
$
15,060,858
207,350,329
19,559
133,670,856
356,101,602
$
$
356,101,602
356,101,602
$ 1,087,600,500
$ 1,087,600,500
$ 1,036,814,906
$ 1,036,814,906
$ 406,887,196
$ 406,887,196
205
16,064,223
210,066,385
1,704
180,754,884
$ 406,887,196
HORRY COUNTY, SOUTH CAROLINA
COMBINING STATEMENT OF CHANGES IN ASSETS AND LIABILITIES
ALL AGENCY FUNDS
-CONTINUEDBalance
June 30,
2012
City of Conway
Assets:
Pooled cash and investments
Taxes receivable
Total
Liabilities:
Due to others
City of Myrtle Beach
Assets:
Pooled cash and investments
Taxes receivable
Total
Liabilities:
Due to others
Town of Loris
Assets:
Pooled cash and investments
Taxes receivable
Total
Liabilities:
Due to others
City of North Myrtle Beach
Assets:
Pooled cash and investments
Taxes receivable
Total
Liabilities:
Due to others
Town of Surfside
Assets:
Pooled cash and investments
Taxes receivable
Total
Liabilities:
Due to others
Town of Atlantic Beach
Assets:
Pooled cash and investments
Taxes receivable
Total
Liabilities:
Due to others
$
$
72,202
1,250,026
1,322,228
$
$
Additions
$
$
5,001,419
5,015,326
10,016,745
1,322,228
$
$
$
290,009
5,725,597
6,015,606
$
$
Balance
June 30,
2013
Deductions
$
4,971,704
5,001,419
9,973,123
$
101,917
1,263,933
1,365,850
10,016,745
$
9,973,123
$
1,365,850
$
$
25,697,553
25,860,279
51,557,832
$
$
25,860,279
25,474,114
51,334,393
$
452,735
5,339,432
5,792,167
6,015,606
$
51,334,393
$
51,557,832
$
5,792,167
$
$
1,010,202
1,012,378
2,022,580
$
$
1,012,378
959,643
1,972,021
$
$
14,864
357,644
372,508
$
17,040
304,909
321,949
$
372,508
$
1,972,021
$
2,022,580
$
321,949
$
$
$
14,017,023
14,012,775
28,029,798
$
$
14,012,775
13,926,717
27,939,492
$
$
96,535
1,619,140
1,715,675
$
92,287
1,533,082
1,625,369
$
1,715,675
$
27,939,492
$
28,029,798
$
1,625,369
$
$
$
2,447,549
2,452,841
4,900,390
$
$
2,452,841
2,422,003
4,874,844
$
$
11,187
335,099
346,286
$
16,479
304,261
320,740
$
346,286
$
4,874,844
$
4,900,390
$
320,740
$
$
$
248,047
248,062
496,109
$
$
248,062
234,620
482,682
$
$
2,466
54,774
57,240
$
2,481
41,332
43,813
$
57,240
$
482,682
$
496,109
$
43,813
206
$
$
HORRY COUNTY, SOUTH CAROLINA
COMBINING STATEMENT OF CHANGES IN ASSETS AND LIABILITIES
ALL AGENCY FUNDS
-CONTINUEDBalance
June 30,
2012
Town of Aynor
Assets:
Pooled cash and investments
Taxes receivable
Total
$
$
2,001
49,249
51,250
335,432
$
337,582
$
51,250
$
$
295,462
296,184
591,646
$
$
296,184
287,096
583,280
$
3,280
27,126
30,406
38,772
$
583,280
$
591,646
$
30,406
$
$
205,401,737
123,871,558
329,273,295
$
457,510,862
505,194,049
962,704,911
$ 454,899,391
457,510,862
$ 912,410,253
$ 208,013,208
171,554,745
$ 379,567,953
$
329,273,295
$
962,704,911
$ 912,410,253
$ 379,567,953
$
$
$
1,371,614
1,372,521
2,744,135
$
$
1,372,521
1,368,069
2,740,590
$
$
19,535
135,092
154,627
$
20,442
130,640
151,082
$
154,627
$
2,740,590
$
2,744,135
$
151,082
$
$
$
7,161
7,001
14,162
$
$
7,001
7,715
14,716
$
$
375
8,279
8,654
$
215
8,993
9,208
Liabilities:
Due to others
$
8,654
$
14,716
$
14,162
$
9,208
Fireman's Fund
Assets:
Cash
$
141,983
$
1,419,307
$
1,464,770
$
96,520
Liabilities:
Due to others
$
141,983
$
1,419,307
$
1,464,770
$
96,520
Town of Briarcliff
Assets:
Pooled cash and investments
Taxes receivable
Total
Liabilities:
Due to others
Horry County School District
Operations/Debt
Assets:
Pooled cash and investments
Taxes receivable
Total
Liabilities:
Due to others
Murrells Inlet-Garden City
Operation/Debt Fire District
Assets:
Pooled cash and investments
Taxes receivable
Total
Liabilities:
Due to others
Grand Strand Water and Sewer Authority
Assets:
Pooled cash and investments
Front footage assessment
Total
$
2,775
50,625
53,400
$
$
$
$
168,404
167,028
335,432
53,400
$
$
$
2,558
36,214
38,772
$
$
Deductions
169,178
168,404
337,582
Liabilities:
Due to others
$
Additions
Balance
June 30,
2013
207
$
$
HORRY COUNTY, SOUTH CAROLINA
COMBINING STATEMENT OF CHANGES IN ASSETS AND LIABILITIES
ALL AGENCY FUNDS
-CONTINUEDBalance
June 30,
2012
Police Asset Forfeiture Fund
Assets:
Cash
Liabilities:
Due to others
Police Fund
Assets:
Cash
Liabilities:
Due to others
Police Federal Forfeiture Fund
Assets:
Cash
Liabilities:
Due to others
Environmental Services
Assets:
Cash
Liabilities:
Due to others
Library Endowment
Assets:
Cash
Liabilities:
Due to others
Inmate Trust
Assets:
Cash
Liabilities:
Due to others
Solicitor DEU
Assets:
Cash
Liabilities:
Due to others
Solicitor DEU Forfeiture
Assets:
Cash
Liabilities:
Due to others
Additions
Balance
June 30,
2013
Deductions
$
73,998
$
103,238
$
72,668
$
104,568
$
73,998
$
103,238
$
72,668
$
104,568
$
30
$
80,259
$
75,146
$
5,143
$
30
$
80,259
$
75,146
$
5,143
$
18,379
$
28,770
$
4,310
$
42,839
$
18,379
$
28,770
$
4,310
$
42,839
$
45,687
$
137
$
-
$
45,824
$
45,687
$
137
$
-
$
45,824
$
42,492
$
2,028
$
2,522
$
41,998
$
42,492
$
2,028
$
2,522
$
41,998
$
118,361
$
108,412
$
118,361
$
108,412
$
118,361
$
108,412
$
118,361
$
108,412
$
41,096
$
163,915
$
150,386
$
54,625
$
41,096
$
163,915
$
150,386
$
54,625
$
87,704
$
262,464
$
234,457
$
115,711
$
87,704
$
262,464
$
234,457
$
115,711
208
HORRY COUNTY, SOUTH CAROLINA
COMBINING STATEMENT OF CHANGES IN ASSETS AND LIABILITIES
ALL AGENCY FUNDS
-CONTINUEDBalance
June 30,
2012
Police Flower Fund
Assets:
Cash
Liabilities:
Due to others
B&C MCBP- Infrastructure
Assets:
Pooled cash and investments
Cash
Taxes receivable
Total
Liabilities:
Due to others
Developer LOC
Assets:
Pooled cash and investments
Total
Liabilities:
Due to others
Magistrates & Clerk of Court
Assets:
Cash and investments
Interest Receivable
Total
Liabilities:
Due to others
Additions
Balance
June 30,
2013
Deductions
$
473
$
2,312
$
1,416
$
1,369
$
473
$
2,312
$
1,416
$
1,369
$
$
$
$
1,801,320
2,326,420
4,127,740
$
23,558
7,215,947
197,182
7,436,687
$
$
(1,603)
6,690,847
226,808
6,916,052
$
25,161
2,326,420
2,296,794
4,648,375
$
6,916,052
$
4,648,375
$
4,127,740
$
7,436,687
$
$
1,437,689
1,437,689
$
$
16,410
16,410
$
$
133,357
133,357
$
$
1,320,742
1,320,742
$
1,437,689
$
16,410
$
133,357
$
1,320,742
$
$
$
17,332,604
19,559
17,352,163
$
$
17,764,063
1,704
17,765,767
$
$
7,799,808
19,559
7,819,367
$
8,231,267
1,704
8,232,971
$
7,819,367
$
17,765,767
$
17,352,163
$
8,232,971
209
CAPITAL ASSETS USED IN THE OPERATION OF GOVERNMENT FUNDS
These schedules present only the capital asset balances (which include land, buildings,
betterments, and equipment owned by the County) related to governmental-type funds.
Accordingly, the capital assets reported in proprietary-type funds (enterprise and internal
service funds) and excluded from these amounts. Infrastructure capital assets represent
actual costs of construction, and/or estimated values of deeded properties by developers.
HORRY COUNTY, SOUTH CAROLINA
SCHEDULES OF CAPITAL ASSETS USED IN THE OPERATION OF
GOVERNMENTAL FUNDS BY SOURCE
June 30, 2013
(With comparative amounts for June 30, 2012)
Governmental funds - capital assets
Land
Buildings
Furniture and equipment
Vehicles
Intangible assets
Infrastructure
Construction-in-progress
$
Total governmental funds capital assets
Investment in governmental funds capital assets by source
General Obligations Bonds
General Fund Revenue
Special Revenue Fund Revenue
Certificates of Participation
Capital Projects Fund
Total investment in governmental funds capital assets
210
2013
29,656,534
226,673,379
56,980,544
24,802,273
552,070
462,133,714
22,544,329
$
2012
28,270,943
218,029,915
54,601,102
25,217,551
552,070
451,269,079
26,666,027
$
823,342,843
$
804,606,687
$
186,073,753
105,913,260
41,634,980
10,050,303
479,670,547
$
179,596,099
104,103,619
37,929,045
10,050,303
472,927,621
$
823,342,843
$
804,606,687
HORRY COUNTY, SOUTH CAROLINA
SCHEDULE OF CAPITAL ASSETS USED IN THE OPERATION OF GOVERNMENTAL FUNDS
BY FUNCTION AND ACTIVITY
JUNE 30, 2013
Land
Function and Activity:
General government
Public safety
Infrastructure and regulation
Health and social services
Cultural, recreation and tourism
Construction-in-progress
Total governmental funds capital assets
Furniture
and
Equipment
Buildings
Intangible
Assets
Vehicles
Construction
in
Progress
Infrastructure
Totals
$
14,257,859
2,489,722
1,517,942
90,000
11,301,011
-
$
72,238,257
97,310,247
4,529,838
8,240,378
44,354,658
-
$
20,905,027
32,691,330
688,793
20,910
2,674,485
-
$
422,186
19,865,605
4,123,592
390,890
-
$
552,070
-
$
462,133,714
-
$
22,544,329
$ 108,375,399
152,356,904
472,993,879
8,351,288
58,721,044
22,544,329
$
29,656,534
$ 226,673,378
$
56,980,545
$
24,802,273
$
552,070
$ 462,133,714
$
22,544,329
$ 823,342,843
211
HORRY COUNTY, SOUTH CAROLINA
SCHEDULES OF CHANGES IN CAPITAL ASSETS USED IN THE OPERATION OF
GOVERNMENTAL FUNDS BY FUNCTION AND ACTIVITY
FOR THE YEAR ENDED JUNE 30, 2013
Balances
Balances
June 30, 2012
Functions and Activity:
General government
Public safety
Infrastructure and regulation
Health and social services
Cultural, recreation and tourism
Construction-in-progress
Total governmental funds capital assets
Class:
Land
Buildings
Furniture and equipment
Vehicles
Intangible assets
Infrastructure
Construction-in-progress
Total governmental funds capital assets
Deletions/
Transfers
Additions
June 30, 2013
$
107,327,159
149,912,502
462,801,617
8,351,288
49,548,094
26,666,027
$
1,069,334
3,000,481
11,960,147
9,210,913
11,466,446
$
(21,094)
(556,079)
(1,767,885)
(37,963)
(15,588,144)
$
108,375,399
152,356,904
472,993,879
8,351,288
58,721,044
22,544,329
$
804,606,687
$
36,707,321
$ (17,971,165)
$
823,342,843
$
28,270,943
218,029,915
54,601,102
25,217,551
552,070
451,269,079
26,666,027
$
19,640
65,136
899,361
971,898
7,637,238
11,545,426
$
1,365,951
8,578,327
1,480,082
(1,387,176)
3,227,397
(15,667,124)
$
29,656,534
226,673,378
56,980,545
24,802,273
552,070
462,133,714
22,544,329
$
804,606,687
$
21,138,699
$
(2,402,543)
$
823,342,843
212
VICTIM’S RIGHTS
HORRY COUNTY, SOUTH CAROLINA
VICTIM'S RIGHTS
SCHEDULE OF COURT FINES, ASSESSMENTS AND SURCHARGES
FOR THE YEAR ENDED JUNE 30, 2013
(with comparison for the year ended June 30, 2012)
Fines collected
Assessments collected
Surcharges collect
Total fines and assessments collected
Clerk of Court
$ 2,151,304
93,991
111,564
Magistrate
$ 3,576,407
512,474
968,624
Probate
$
73,740
-
Total 2013
$ 5,801,451
606,465
1,080,188
Total 2012
$ 6,291,124
607,840
1,133,332
$
$
$
73,740
$ 7,488,104
$ 8,032,296
-
2,841,608
203,359
172,697
3,092,820
213,027
163,517
-
$ 3,217,664
$ 3,469,364
73,740
-
2,959,843
403,106
907,491
3,198,304
394,813
969,815
73,740
$ 4,270,440
$ 4,562,932
Fines retained by County
Assessments retained by County
Surcharges retained by County
Total fines and assessments retained by County
576,365
32,901
87,799
$
Fines remitted to State Treasurer
Assessments remitted to State Treasurer
Surcharges remitted to State Treasurer
Total fines and assessments remitted to State Treasurer
2,356,859
697,065
2,265,243
170,458
84,898
$
1,574,939
61,090
23,765
$
1,659,794
213
5,057,505
2,520,599
$
1,311,164
342,016
883,726
$
2,536,906
$
CAPITAL PROJECTS SALES TAX
HORRY COUNTY, SOUTH CAROLINA
BUDGETARY COMPARISON SCHEDULES
CAPITAL PROJECTS SALES TAX
FOR THE YEAR ENDED JUNE 30, 2013
Projects
Project Title
Original
Project
Budget
Current
Project
Budget
Project
Actual
Variance
Project #1
Pave 20 miles - DR
$ 19,600,000
$ 19,600,000
$ 11,362,166
Project #2
Resurface 12 miles
945,000
945,000
839,421
105,579
Project #3
Backgate Interchange
49,500,000
121,700,000
70,243,077
51,456,923
Project #4
Widen 707
132,250,000
103,410,000
14,988,507
88,421,493
Project #5
Pave 25 miles - DR
25,750,000
25,750,000
10,536,367
15,213,633
Project #6
Resurface 12 miles
990,000
990,000
1,095,579
(105,579)
Project #7
Aynor Overpass
46,000,000
15,970,000
15,867,534
102,466
Project #8
Resurface 12 miles
1,035,000
1,035,000
1,421,055
(386,055)
Project #9
Widen Glenns Bay
76,000,000
80,100,000
5,789,521
74,310,479
Project #10
Resurface 12 miles
1,080,000
1,349,358
578,937
770,421
Project #11
Pave 25 miles - DR
27,750,000
20,942,123
6,158,478
14,783,645
Project #12
Resurface 12 miles
1,125,000
1,125,000
Project #13
International Dr
6,500,000
15,500,000
Project #14
Resurface 7 miles
682,500
682,500
-
682,500
Project #15
Pave 30 miles - DR
36,100,000
36,100,000
-
36,100,000
$ 425,307,500
$ 445,198,981
Total
¹
550,156
¹ $ 139,430,798
¹ Includes SCDOT Funding of $15,000,000 for Project #3.
DR = Dirt Road
Note: From inception through June 30, 2013.
214
$
8,237,834
1,125,000
14,949,844
$ 305,768,183
GENERAL IMPROVEMENTS CAPITAL PROJECTS FUND
HORRY COUNTY, SOUTH CAROLINA
GENERAL IMPROVEMENTS CAPITAL PROJECTS FUND
SCHEDULES OF REVENUES, EXPENDITURES AND CHANGES IN FUND BALANCE BUDGET (GAAP BASIS) AND ACTUAL
FOR THE YEAR ENDED JUNE 30, 2013
(With comparative actual amounts for the year ended June 30, 2012)
2013
2012
Budget
Original
Revenues
Intergovernmental
Disposal fee
Interest
Other-donations
Total revenues
$
Expenditures
Capital outlay:
Contractual Services
Supplies and materials
Construction contracts
Capital outlay
Other
Total expenditures
704,250
704,250
$
Final
Actual Amounts
Variance Positive
(Negative)
1,466,530
704,250
2,230,000
4,400,780
$
$
1,509,543
707,889
84,261
200,000
2,501,693
43,013
3,639
84,261
(2,030,000)
(1,899,087)
Actual
$
567,750
681,639
135,228
125,000
1,509,617
1,735,375
1,242,660
2,978,035
15,746
210
8,437,744
3,470,062
2,669,424
14,593,186
210
1,765,996
3,844,141
5,610,347
15,746
6,671,748
(374,079)
2,669,424
8,982,839
8,687,969
12,038,999
20,726,968
Excess (deficiency) of revenue
over expenditures
(2,273,785)
(10,192,406)
(3,108,654)
7,083,752
(19,217,351)
Other Financing Sources (Uses)
Sale of assets
Capital lease
Transfers in
Transfers out
Total other financing sources (uses)
2,485,375
(1,670,186)
815,189
460,300
2,626,999
(1,670,186)
1,417,113
460,300
2,626,999
(1,670,186)
1,417,113
-
2,602,861
5,245,836
(1,139,368)
6,709,329
Net change in fund balance
(1,458,596)
(8,775,293)
(1,691,541)
7,083,752
(12,508,022)
Fund balance at beginning of year
10,444,596
10,444,596
10,444,596
Fund balance at end of year
$
8,986,000
$
1,669,303
215
$
8,753,055
$
7,083,752
22,952,618
$
10,444,596
STATISTICAL SECTION
This part of Horry County’s comprehensive annual financial report presents
detailed information as a context for understanding what the information in the
financial statements, note disclosures, and required supplementary
information says about the government’s overall financial health.
Contents
Financial Trends
These schedules contain trend information to help the reader
understand how the government’s financial performance and well-being have
changed over time.
Revenue Capacity
These schedules contain information to help the reader assess the
government’s most significant local revenue source, the property tax.
Debt Capacity
These schedules present information to help the reader assess the
affordability of the government’s current levels of outstanding debt and the
government’s ability to issue additional debt in the future.
Demographic and Economic Information
These schedules offer demographic and economic indicators to
help the reader understand the environment within which the government’s
financial activities take place.
Operating Information
These schedules contain service and infrastructure data to help the
reader understand how the information in the government’s financial report
relates to the services the government provides and the activities it performs.
Sources: Unless otherwise noted, the information in these schedules is derived from
the comprehensive annual financial reports for the relevant year.
HORRY COUNTY, SOUTH CAROLINA
NET POSITION BY COMPONENT
LAST TEN FISCAL YEARS
(ACCRUAL BASIS OF ACCOUNTING)
(AMOUNTS EXPRESSED IN THOUSANDS)
2004
Governmental activities
Net investment in capital assets
Restricted
Unrestricted
Total governmental activities net position
Business-type activities
Net investment in capital assets
Restricted
Unrestricted
Total business-type activities net position
Primary government
Net investment in capital assets
Restricted
Unrestricted (deficit)
Total primary government net position
$
2005
2006
as restated
2007
For the Fiscal Year Ended June 30
2008
2009
as restated
as restated
2010
2011
2012
2013
360,367
41,368
(346,365)
$
55,370
$
364,396
27,465
(298,109)
$
93,752
$
387,935
38,317
(264,451)
$ 161,801
$
406,013
64,674
(251,630)
$ 219,057
$
386,522
186,578
(241,001)
$ 332,099
$
488,550
206,516
(255,722)
$ 439,344
$
532,927
231,335
(218,404)
$ 545,858
$
551,832
309,063
(256,844)
$ 604,051
$
576,387
348,119
(240,372)
$ 684,134
$
$
$
$
$
$
$
$
$
$
$
$
$
73,877
20,955
27,395
122,227
434,244
62,323
(318,970)
$ 177,597
$
$
81,247
24,705
33,920
139,872
445,643
52,170
(264,189)
$ 233,624
$
$
84,760
29,635
36,054
150,449
472,695
67,952
(228,397)
$ 312,250
$
72,687
34,046
32,682
139,415
$
478,700
98,719
(218,948)
$ 358,471
Source: Horry County Finance Department
216
$
$
80,109
26,679
41,020
147,808
466,631
213,257
(199,981)
$ 479,907
$
$
87,137
26,894
45,253
159,284
575,687
233,410
(210,469)
$ 598,628
$
$
104,452
30,469
41,989
176,910
637,378
261,804
(176,415)
$ 722,767
$
$
116,287
42,403
43,140
201,830
668,119
351,466
(213,704)
$ 805,881
$
$
138,123
45,038
42,948
226,109
714,510
393,157
(197,424)
$ 910,243
593,157
343,178
(162,379)
$ 773,956
$
$
169,529
32,929
43,095
245,553
762,686
376,107
(119,284)
$ 1,019,509
HORRY COUNTY, SOUTH CAROLINA
CHANGES IN NET POSITION
LAST TEN FISCAL YEARS
(ACCRUAL BASIS OF ACCOUNTING)
(AMOUNTS EXPRESSED IN THOUSANDS)
2004
2005
Expenses
Governmental activies:
General government
Public safety
Health and social services
Infrastructure and regulation
Improvements to state roadways
Culture, recreation and tourism
Economic development
Conservation/natural resources
Other
Debt service
Horry-Georgetown TECH
Higher Education Commission
Total governmental activities expenses
$ 27,978
54,201
1,987
23,631
6,497
209
342
11,480
1,950
290
128,565
$ 25,724
63,171
2,089
25,797
8,211
58
213
16,180
2,154
303
143,900
Business-type activities:
Airport
Industrial Parks
Baseball Stadium
Total business-type activities expenses
Total primary government expenses
14,978
612
365
15,955
144,520
7,702
4,733
5,546
688
1,384
20,053
Program Revenues
Governmental activities:
Charges for services:
General government
Public safety
Health and social services
Infrastructure and regulation
Culture, recreation and tourism
Economic Development
Operating grants and contributions
Capital grants and contributions
Total governmental activities program revenues
2006
as restated
$
2007
For the Fiscal Year Ended June 30
2008
2009
as restated
as restated
27,960
68,799
920
30,145
8,534
843
561
4,077
15,454
2,591
500
160,384
$ 40,691
72,570
980
14,126
9,133
312
1
16,193
2,800
410
157,216
18,190
1,400
369
19,959
163,859
18,483
334
18,817
179,201
7,822
4,807
12,729
2,462
1,344
29,164
20,635
4,002
10,596
1,991
2,400
39,624
217
$
2010
2011
2012
2013
38,239
98,133
2,542
18,910
10,836
383
47
16,767
3,000
910
189,767
$ 37,914
101,642
2,432
23,492
9,426
2,292
7,530
3,000
1,170
188,898
$ 34,971
91,214
2,354
31,037
4,629
2,019
8,964
3,973
1,140
180,301
$ 34,962
101,668
2,504
34,998
35,731
9,307
1,366
11,970
3,415
1,325
237,246
$ 33,091
106,451
2,659
28,236
15,722
10,523
3,555
9,652
3,347
1,200
214,436
$
33,488
99,823
2,753
27,786
25,118
11,376
2,882
10,485
3,485
1,150
218,346
26,663
376
27,039
184,255
19,714
19,714
209,481
17,440
17,440
206,338
17,264
17,264
197,565
19,818
19,818
257,064
19,834
19,834
234,270
22,482
22,482
240,828
2,206
12,559
101
11,936
97
641
358
27,898
12,295
15,687
49
4,177
593
597
666
34,064
10,203
16,918
71
4,387
99
5,196
317
37,191
11,899
17,875
70
11,666
108
4,800
1,908
48,326
12,346
17,988
69
12,165
91
2,769
10,702
56,130
12,595
16,787
70
12,634
93
2,368
6,726
51,273
20,979
12,811
79
12,261
88
69
4,207
4,899
55,393
HORRY COUNTY, SOUTH CAROLINA
CHANGES IN NET POSITION (continued)
LAST TEN FISCAL YEARS
(ACCRUAL BASIS OF ACCOUNTING)
(AMOUNTS EXPRESSED IN THOUSANDS)
2005
Business-type activities:
Charges for services:
Airport
Industrial Parks
Baseball Stadium
Operating grants and contributions
Capital grants and contributions
Total business-type activies program revenues
Total primary government program revenues
14,790
174
7
9,203
24,174
44,227
21,394
265
9
8,731
30,399
59,563
23,403
7,031
30,434
70,058
26,539
9
26,548
54,446
24,634
24,634
58,698
19,726
2,992
22,718
59,909
18,902
3,217
12,486
34,605
82,931
24,661
7,310
12,115
44,086
100,216
25,841
4,720
12,949
43,510
94,783
24,433
2,424
14,565
41,422
96,815
Net (Expense)/Revenues
Governmental activities
Business-type activities
Total primary government program net expense
(108,512)
8,219
(100,293)
(114,736)
10,440
(104,296)
(120,760)
11,617
(109,143)
(129,318)
(491)
(129,809)
(155,703)
4,920
(150,783)
(151,707)
5,278
(146,429)
(131,975)
17,341
(114,634)
(181,116)
24,268
(156,848)
(163,163)
23,676
(139,487)
(162,953)
18,940
(144,013)
73,217
1,847
61,930
(237)
136,757
81,679
2,945
68,756
(262)
153,118
86,459
5,676
75,504
(313)
167,326
105,141
8,030
73,707
(305)
186,573
104,702
7,880
156,476
(312)
268,746
117,673
6,717
145,733
(500)
269,623
115,546
4,656
118,287
238,489
165,944
2,382
69,863
1,120
239,309
173,342
2,014
67,890
243,246
180,833
1,770
70,172
252,775
1,664
591
237
2,492
139,249
5,940
1,003
262
7,205
160,323
2,224
2,350
313
4,887
172,213
(14,474)
3,626
305
(10,543)
176,030
3,161
312
3,473
272,219
4,091
1,607
500
6,198
275,821
(446)
731
285
238,774
453
199
652
239,961
282
321
603
243,849
198
306
504
253,279
28,245
10,711
$ 38,956
38,382
17,645
$ 56,027
46,566
16,504
63,070
57,255
(11,034)
$ 46,221
113,043
8,393
$ 121,436
117,916
11,476
$129,392
58,193
24,920
$ 83,113
80,083
24,279
$ 104,362
89,822
19,444
$ 109,266
General Revenues and Other Changes in
Net Position
Governmental activities:
Taxes
Property taxes and Fees-in-lieu of taxes
Investment earnings
Other
Transfers
Extraordinary item
Total governmental activities
Business-type activities:
Other
Investment earnings
Transfers
Total business-type activities
Total primary government
Change in Net Position
Governmental activities:
Business-type activities:
Total primary government
2006
as restated
$
2007
For the Fiscal Year Ended June 30
2008
2009
as restated
as restated
2004
2010
106,514
17,626
$ 124,140
(1) The Industrial Park and Baseball Stadium has been moved from a Business-type activity to a Governmental activity in the Special Revenue Funds.
Source: Horry County Finance Department
218
2011
2012
2013
HORRY COUNTY, SOUTH CAROLINA
FUND BALANCES OF GOVERNMENTAL FUNDS
LAST TEN FISCAL YEARS
(MODIFIED ACCRUAL BASIS OF ACCOUNTING)
(AMOUNTS EXPRESSED IN THOUSANDS)
2004
General fund
Reserved
Unreserved/designated
Unreserved/undesignated
Nonspendable
Restricted
Committed
Assigned
Unassigned
Total general fund
$
All other governmental funds
Reserved
Unreserved for:
Special revenue funds
Capital project funds (deficit)
Nonspendable
Restricted
Committed
Unassigned
Total all other governmental funds
Total governmental fund balances
$
620
5,758
19,832
26,210
2005
$
482
10,910
18,962
30,354
2006
$
2,395
13,547
19,102
35,044
2007
$
1,273
3,567
22,089
26,929
For the Fiscal Year Ended June 30
2008
2009
as restated
as restated
$
1,250
3,254
24,579
29,083
$
1,174
5,309
24,341
30,824
2010
$
3,649
8,375
24,739
36,763
50,819
44,791
56,734
70,700
196,056
272,586
256,012
22,970
73,789
22,985
6,347
74,123
23,092
7,944
87,770
33,671
19,080
123,451
33,327
12,415
241,798
3,721
(7,235)
269,072
38,972
2,016
297,000
99,999
$
104,477
$
122,814
$
150,380
*As of June 30, 2011, fund balance classifications changed with the implementation of GASB 54.
Source: Horry County Finance Department
219
$
270,881
$
299,896
$
333,763
2011*
$
2012
1,532
25,392
343
9,797
37,064
$
-
344,589
169
29,082
343
7,108
36,702
$
-
857
291,148
16,719
(1,199)
307,525
$
2013
-
20
321,734
13,420
(1,134)
334,040
$
370,742
1,975
1,000
28,282
473
8,271
40,001
19
363,678
11,754
(1,132)
374,319
$
414,320
HORRY COUNTY, SOUTH CAROLINA
CHANGES IN FUND BALANCES OF GOVERNMENTAL FUNDS
LAST TEN FISCAL YEARS
(MODIFIED ACCRUAL BASIS OF ACCOUNTING)
(AMOUNTS EXPRESSED IN THOUSANDS)
2004
2005
2006
2007
For the Fiscal Year Ended June 30
2008
2009
as restated
2010
2011
2012
2013
Revenues
Property Taxes
Licenses and permits
Intergovernmental
Sales Tax Major Capital Projects (3)
Fees and fines
Hospitality & Local Accommodations fees (4)
Charges for services
Interest on investments
Accomodation tax (1)
Cost allocation
Other
Total revenues
$
75,519
6,434
18,010
51,030
3,889
1,847
834
2,115
1,749
161,427
$
78,844
9,348
18,093
54,003
6,472
2,945
861
1,142
1,652
173,360
$
87,680
13,841
18,913
58,817
8,962
5,650
969
1,697
2,368
198,897
$
93,557
12,128
22,570
61,679
6,966
8,030
1,014
1,426
3,553
210,923
$
104,607
9,999
21,210
63,537
64,570
4,356
7,880
996
1,685
5,585
284,425
$ 114,821
7,551
22,296
63,549
65,709
2,406
7,834
865
2,100
4,617
291,748
$ 118,249
6,572
24,025
58,070
66,446
2,469
4,658
845
3,077
4,018
288,429
$
115,241
6,272
19,701
61,477
34,081
36,867
2,305
2,383
3,835
3,055
3,864
289,081
$
114,481
6,537
34,545
64,802
33,301
39,452
2,340
2,015
3,677
3,167
4,448
308,765
$
117,238
7,344
22,391
65,732
36,178
39,917
2,764
1,770
4,082
2,787
4,900
305,103
Expenditures
General government
Public safety
Public works
Infrastructure and regulation (2)
Economic development
Health and social services
Culture and recreation
Capital outlay
Conservation and natural resources
Horry-Georgetown Tech
Higher Education
Debt service:
Principal
Interest and fees
Other charges
Total expenditures
Excess of revenues
over (under) expenditures
20,102
56,573
23,631
208
1,987
6,497
8,780
342
1,950
290
20,866
60,478
28,367
58
2,069
7,825
20,563
517
2,153
303
23,570
67,878
29,028
774
894
8,033
13,544
561
2,591
500
27,254
73,533
31,078
312
861
8,387
11,175
1
2,800
410
30,143
79,117
32,898
383
822
8,699
28,822
47
3,000
910
30,810
84,810
29,208
2,292
867
8,821
50,118
3,000
1,170
28,070
87,461
31,611
2,019
2,232
9,807
56,796
3,973
1,140
28,687
93,942
54,990
1,423
2,382
8,863
37,060
3,415
1,325
28,210
99,887
59,689
1,800
2,436
9,786
29,302
3,347
1,200
29,673
92,996
52,922
1,753
2,532
10,577
16,749
3,485
1,150
30,391
4,680
1,356
156,787
18,798
16,597
1,371
179,965
20,150
15,659
1,457
184,639
19,455
15,377
6,419
197,062
21,704
14,477
10,925
231,947
28,130
16,075
5,008
260,309
27,675
17,359
1,025
269,168
31,198
14,605
44
277,934
33,299
13,687
1,906
284,549
26,305
21,509
1,194
260,845
14,258
13,861
52,478
31,439
19,261
11,147
24,216
44,258
4,640
(6,605)
220
HORRY COUNTY, SOUTH CAROLINA
CHANGES IN FUND BALANCES OF GOVERNMENTAL FUNDS (Continued)
LAST TEN FISCAL YEARS
(MODIFIED ACCRUAL BASIS OF ACCOUNTING)
(AMOUNTS EXPRESSED IN THOUSANDS)
2004
Transfers in
Transfers out
Refunding bonds issued
Issuance of debt
Premium on bonds issued
Payments to refunded bond escrow agent
Capital leases
Sale of assets
Other
Total other financing
sources (uses)
Extraordinary item
Net change in fund balances (3)
Debt service as a percentage of noncapital
expenditures
$
2005
2006
2007
For the Fiscal Year Ended June 30
2008
2009
as restated
2010
2011
2012
2013
41,013
(41,470)
14,000
47
1,032
89
-
47,638
(48,087)
11,606
176
(250)
57,682
(57,995)
35,326
(439)
(34,883)
7,488
101
(3,111)
55,044
(55,349)
11,000
44
-
50,686
(50,997)
62,000
1,496
4,442
330
-
48,717
(49,221)
8,155
(10,671)
400
-
45,103
(45,103)
26,040
1,151
(13,260)
94
580
16,176
(19,967)
259
2,091
11,733
(12,759)
8,740
285
(8,881)
216
2,603
14,711
11,083
4,169
10,739
67,957
(2,620)
14,605
(1,441)
1,937
-
-
-
-
-
19,351
23.7%
$
4,478
22.2%
$
18,427
$
24,600
20.9%
18.7%
$
120,435
17.6%
(1) Accommodation taxes are considered Special Assessments.
(2) Prior to fiscal year ended June 30, 2004, expenses for Infrastructure and Regulation were classified as Public Works.
(3) Major Capital Projects Sales Tax added 2008.
(4) Prior to fiscal year ended June 30, 2011, Hospitality and Local Accommodations fees were classified as Intergovernmental.
Source: Horry County Finance Department
221
$
28,819
21.0%
$
33,866
21.2%
1,120
$
10,826
16.9%
9,693
(10,981)
148
460
(680)
$
26,153
20.0%
$
43,578
19.9%
HORRY COUNTY, SOUTH CAROLINA
ASSESSED VALUE AND ESTIMATED ACTUAL VALUE OF TAXABLE PROPERTY
LAST TEN FISCAL YEARS
(IN THOUSANDS OF DOLLARS)
TAX
YEAR
FOR THE
FISCAL YEAR
ENDED
JUNE 30
2003
2004
2005
2006
2007
2008
2009
2010
2011
2012
2004
2005
2006
2007
2008
2009
2010
2011
2012
2013
REAL PROPERTY (1) (2) (3)
RESIDENTIAL
COMMERCIAL
PROPERTY
PROPERTY
FARM
PERSONAL PROPERTY (2) (4)
MOTOR
VEHICLES
OTHER
TOTAL TAXABLE
ASSESSED
VALUE (2) (7)
$
$
$
238,038
249,986
309,446
326,176
354,361
394,601
419,503
465,852
478,287
489,498
$
663,391
681,439
888,857
980,924
1,107,275
1,264,297
1,278,502
1,282,410
1,283,108
1,269,741
$
4,953
4,919
5,068
5,031
5,167
5,088
5,162
5,524
5,552
5,597
146,019
144,584
146,222
148,820
142,105
133,789
128,942
109,872
120,615
134,214
$
115,338
116,445
132,501
145,614
160,068
172,811
174,070
165,332
157,156
154,820
1,167,739
1,197,373
1,482,094
1,606,565
1,768,976
1,970,586
2,006,179
2,028,990
2,044,718
2,053,870
Notes:
(1) Property in the County is reassessed every five years.
(2) Tax-exempt property has already been deducted.
(3) The County assesses real property at either 4% or 6% of estimated market value at the time of reassessment.
(4) The County assessed personal property at 6.0%, 6.75% or 10.5% of estimated taxable market value for FY2007.
(5) Estimated actual taxable value = appraised value.
(6) Direct tax rates are per $1,000 of assessed value.
(7) Property that is exempt from the County portion of taxes have been subtracted from Assessed Value and Estimated Actual Taxable Value.
(8) General Note: Taxes for each tax year are due and payable the following fiscal year.
Source/s:
Horry County Finance Department
Horry County Assessor
Horry County Auditor
222
TOTAL
DIRECT
TAX
RATE (6) (7)
50.9
50.9
46.3
46.3
47.3
47.3
47.3
44.9
45.2
45.2
ESTIMATED
ACTUAL
TAXABLE
VALUE (5) (7)
$
19,882,193
20,592,643
25,877,845
28,190,764
31,163,189
34,797,636
35,591,828
36,448,278
36,851,012
37,099,739
ASSESSED
VALUE (2) AS A
PERCENTAGE OF
ESTIMATED
ACTUAL
TAXABLE
VALUE (5)
5.87%
5.81%
5.73%
5.70%
5.68%
5.66%
5.64%
5.57%
5.55%
5.54%
HORRY COUNTY, SOUTH CAROLINA
PROPERTY TAX RATES
DIRECT AND OVERLAPPING GOVERNMENTS
LAST TEN FISCAL YEARS
Tax Year (1)
2003
2004
2005
2006
2007
2008
2009
2010
2011
2012
County Direct Rates (2)
General Fund
Debt Retirement
Senior Citizens Fund
Horry Georgetown Tech
Higher Education
Recreation
Total Direct Rate
40.2
6.2
0.4
1.9
0.7
1.5
50.9
40.2
6.2
0.4
1.9
0.7
1.5
50.9
36.7
5.3
0.4
1.9
0.7
1.3
46.3
36.7
5.3
0.4
1.9
0.7
1.3
46.3
36.7
5.3
0.4
1.9
0.7
2.3
47.3
36.7
5.3
0.4
1.9
0.7
2.3
47.3
36.7
5.3
0.4
1.9
0.7
2.3
47.3
34.8
5.0
0.4
1.8
0.7
2.2
44.9
35.6
5.0
0.4
1.8
0.7
1.7
45.2
35.6
5.0
0.4
1.8
0.7
1.7
45.2
Unincorp. County Rates (2)
Rural Fire
Waste Management
18.3
5.1
18.3
7.1
16.3
6.4
16.3
6.4
16.3
6.4
16.3
6.4
16.3
6.4
15.2
6.0
15.2
6.0
15.2
6.0
130.4
130.4
129.7
135.3
143.3
143.3
139.3
132.2
130.2
130.2
18.3
18.3
10.0
18.3
18.3
10.0
16.3
16.3
10.0
16.3
16.3
10.0
16.3
16.3
10.0
16.3
16.3
10.0
16.3
16.3
10.0
15.2
15.2
10.0
15.2
15.2
10.0
15.2
15.2
10.0
90.0
90.0
57.0
93.9
115.0
63.2
35.7
55.0
90.0
90.0
56.0
96.7
115.0
63.2
35.7
55.0
90.0
70.8
47.0
86.6
105.0
61.4
30.5
44.0
90.0
70.8
50.0
86.6
105.0
61.4
30.5
44.0
94.5
72.2
52.8
86.6
105.0
61.4
30.5
44.0
94.5
72.2
55.6
86.6
105.0
64.4
32.2
44.0
94.5
72.2
55.6
86.6
105.0
62.9
32.2
44.0
94.5
60.8
50.8
79.3
103.7
66.1
32.0
40.0
84.5
60.8
50.8
79.3
103.7
66.1
38.0
40.0
84.5
60.8
50.8
79.3
111.7
66.1
38.0
40.0
School District Rates (2)
Other Fire Districts Rates (2)
Aynor Fire Contract
Atlantic Beach Fire Contract
Murrells Inlet /Garden City Contract
City Rates (2)
Town of Atlantic Beach
Town of Aynor
Town of Briarcliff Acres
City of Conway
City of Loris
City of Myrtle Beach
City of N. Myrtle Beach
City of Surfide Beach
223
HORRY COUNTY, SOUTH CAROLINA
PROPERTY TAX RATES
DIRECT AND OVERLAPPING GOVERNMENTS
LAST TEN FISCAL YEARS
Tax Year (1)
2003
Special District Rates (2)
Conway
Crabtree
Loris
Todd Swamp
Buck Creek
Simpson Creek
Green Sea
Aynor
Little River
Socastee
Mt Gilead
Socastee Rec
Murrells Inlet/G.C.
Floyds
Cartwheel
Gapway
Myrtle Beach
Arcadian Shores
Hidden Woods (Began in TY 2012)
River Grande (Began in TY 2012)
2004
23.4
27.7
23.4
27.7
27.7
27.7
23.4
23.4
23.4
23.4
39.1
25.4
15.1
23.4
27.7
27.7
23.4
58.4
-
2005
25.4
29.7
25.4
29.7
29.7
29.7
25.4
25.4
25.4
25.4
41.1
27.4
17.1
25.4
29.7
29.7
25.4
60.4
-
2006
22.7
26.3
22.7
26.2
26.5
26.1
22.7
22.7
22.7
22.7
33.8
24.7
16.4
22.7
26.6
26.5
22.7
57.7
-
2007
22.7
26.3
22.7
26.2
26.5
26.1
22.7
22.7
22.7
22.7
33.8
24.7
16.4
22.7
26.6
26.5
22.7
57.7
-
2008
22.7
26.3
22.7
26.2
26.5
26.1
22.7
22.7
22.7
22.7
33.8
24.7
16.4
22.7
26.6
26.5
22.7
57.7
-
2009
22.7
26.3
22.7
26.2
26.5
26.1
22.7
22.7
22.7
22.7
23.8
24.7
16.4
22.7
26.6
26.5
22.7
57.7
-
2010
22.7
26.3
22.7
26.2
26.5
26.1
22.7
22.7
22.7
22.7
23.8
24.7
16.4
22.7
26.6
26.5
22.7
57.7
-
2011
21.2
24.4
21.2
24.3
24.4
24.1
21.2
21.2
21.2
21.2
23.0
23.0
16.0
21.2
24.6
24.3
21.2
53.5
-
21.2
24.4
21.2
24.3
24.4
24.1
21.2
21.2
21.2
21.2
23.0
23.0
16.0
21.2
24.6
24.3
21.2
53.5
-
Notes:
(1) Taxes for each tax year are due and payable the following fiscal year.
(2) Rates are per $1,000 of assessed value.
(3) A property reappraisal was performed in Tax Year 2005. This reappraisal was delayed by one (1) tax year.
(4) A property reappraisal was performed in Tax Year 2010. This reappraisal was delayed by one (1) tax year.
(5) A reappraisal is performed every five years. The County's next scheduled reappraisal date is Tax Year 2014 due to the prior one (1) year delay of reappraisal in Tax Year 2010.
Source/s: Horry County Assessor and Horry County Finance Department
224
2012
21.2
24.4
21.2
24.3
24.4
24.1
21.2
21.2
21.2
21.2
23.0
23.0
16.0
21.2
24.6
24.3
21.2
53.5
84.6
21.2
HORRY COUNTY, SOUTH CAROLINA
PRINCIPAL PROPERTY TAXPAYERS
CURRENT YEAR AND NINE YEARS AGO
Fiscal Year 2013 (Tax Year 2012)
TAXPAYER
Burroughs & Chapin Inc. & Subsidiaries (2)(3)
Horry Electric Co-operative
Wal-Mart Real Estate Business Trust/Wal-Mart Stores East LP
Lawyers Title Insurance Corp.
Bluegreen Vacations Unlimited Inc.
100 North Beach Blvd LLC
Marriott Ownership Resorts Inc.
Frontier Communications of the Carolinas
HRP Myrtle Beach Operations LLC (4)
Time Warner Ent.- Advance/Newhouse
Horry Telephone Coop./HTC Communications Inc.
Verizon South, Inc.
Broadway At The Beach (3)
AVX Corporation
Ocean Lakes Family Campground
Totals
TAXABLE
ASSESSED
VALUE
RANK
PERCENTAGE
OF TOTAL
ASSESSED
VALUE (1)
$ 22,531,164
19,312,847
6,788,178
5,713,926
5,165,830
4,766,875
4,606,110
4,366,530
3,929,950
3,352,860
1
2
3
4
5
6
7
8
9
10
$ 80,534,270
Fiscal Year 2004 (Tax Year 2003)
TAXABLE
ASSESSED
VALUE
RANK
PERCENTAGE
OF TOTAL
ASSESSED
VALUE (1)
1.10%
0.94%
0.33%
0.28%
0.25%
0.23%
0.22%
0.21%
0.19%
0.16%
$ 26,634,128
10,285,790
2,792,262
2,784,450
1
2
7
8
2.29%
0.89%
0.24%
0.24%
2,636,900
7,394,143
7,751,890
4,212,904
4,545,182
2,526,317
10
3
4
5
6
9
0.23%
0.64%
0.67%
0.36%
0.39%
0.22%
3.92%
$ 71,563,966
Notes:
(1) Property that is exempt from the County portion of taxes have been subtracted from Total Assessed Value.
(2) 2013 data for Burroughs & Chapin Inc. & Subsidiaries includes Myrtle Beach Farms and Broadway At The Beach.
(3) 2004 data for Burroughs & Chapin Inc. & Subsidiaries includes Myrtle Beach Farms but does not include Broadway at the Beach.
(4) HRP Myrtle Beach Operatins LLC - The Hard Rock Park property is currently under bankruptcy protection.
Source: Horry County Treasurer
225
6.13%
HORRY COUNTY, SOUTH CAROLINA
PROPERTY TAX LEVIES AND COLLECTIONS
LAST TEN FISCAL YEARS
(AMOUNTS EXPRESSED IN THOUSANDS )
TAX YEAR
FOR THE
FISCAL YEAR
ENDED JUNE 30
2003
2004
2005
2006
2007
2008
2009
2010
2011
2012
2004
2005
2006
2007
2008
2009
2010
2011
2012
2013
COLLECTED WITHIN THE
FISCAL YEAR OF THE LEVY
PERCENTAGE
OF LEVY
AMOUNT
TOTAL TAX
LEVY FOR
FISCAL YEAR (2)
$
75,275
78,218
88,247
94,430
105,439
116,989
118,465
114,725
116,051
116,926
$
71,564
74,822
84,444
90,362
100,398
109,276
110,643
108,446
108,611
110,447
95.07%
95.66%
95.69%
95.69%
95.22%
93.41%
93.40%
94.53%
93.59%
94.46%
COLLECTIONS IN
SUBSEQUENT
YEARS (2)
$
1,623
1,488
1,462
1,768
2,155
4,561
4,670
2,817
3,365
-
Notes:
(1) Taxes for each tax year are due and payable the following fiscal year.
(2) Amounts for property tax collections of vehicle taxes, interest and penalty have been reclassified in prior years
Sources:
Horry County property tax database
226
TOTAL COLLECTIONS TO DATE
PERCENTAGE
OF LEVY
AMOUNT
$
73,187
76,310
85,906
92,130
102,553
113,837
115,313
111,263
111,976
110,447
97.23%
97.56%
97.35%
97.56%
97.26%
97.31%
97.34%
96.98%
96.49%
94.46%
HORRY COUNTY, SOUTH CAROLINA
RATIOS OF OUTSTANDING DEBT BY TYPE
LAST TEN FISCAL YEARS
(AMOUNTS EXPRESSED IN THOUSANDS, EXCEPT PER CAPITA AMOUNT )
FOR THE
FISCAL
YEAR
ENDED
JUNE 30
2004
2005
2006
2007
2008
2009
2010
2011
2012
2013
GENERAL
OBLIGATION
BONDS
GOVERNMENTAL ACTIVITIES
SPECIAL
RIDE
ASSESSMENT
IGA
CAPITAL
BONDS
LOANS
LEASES
$
$
81,950
76,435
72,920
80,120
137,920
129,840
134,670
125,967
117,794
108,095
16,340
15,190
13,985
12,725
11,405
10,035
7,105
5,410
3,665
1,860
$
387,234
376,159
364,791
350,132
334,103
315,760
297,308
276,765
254,386
234,017
$
2,402
10,872
14,722
12,027
13,115
9,828
6,726
4,908
5,264
3,869
BUSINESS-TYPE ACTIVITIES
BASEBALL
STADIUM COPS
BONDS
$
2,546
2,423
2,295
2,162
2,024
1,880
1,570
1,405
1,233
1,051
REVENUE
BONDS
$
29,355
$
27,765
26,080
24,300
11,140
10,620
10,075
60,590 (3)
60,590
60,590
Notes:
(1) See the schedule of Demographic and Economic Statistics for personal income and population data.
(2) Percentage of Personal Income and Per Capita data have been updated based on new data for 2007, 2008 and 2009
from the U.S. Census Bureau and the Bureau of Economic Analysis
(3) Series 1997 and Series 2000 Bonds were fully redeemed in FY2011 and Series 2010 Bonds were issued.
Source: Horry County Finance Department
227
CAPITAL
LEASES
30
9
426
383
345
306
266
224
180
685
PRIMARY
GOVERNMENT
TOTAL
OUTSTANDING
DEBT
$
519,857
508,853
495,219
481,849
510,052
478,269
457,720
475,269
443,112
410,167
PERCENTAGE
DEBT
OF PERSONAL
PER
INCOME (1) (2) CAPITA (1) (2)
9.13%
8.37%
7.47%
6.39%
6.53%
6.41%
5.93%
5.90%
not available
not available
$
2,389
2,242
2,076
1,909
1,957
1,800
1,691
1,720
1,570
not available
HORRY COUNTY, SOUTH CAROLINA
RATIOS OF GENERAL BONDED DEBT OUTSTANDING
LAST TEN FISCAL YEARS
(AMOUNTS EXPRESSED IN THOUSANDS, EXCEPT PER CAPITA AMOUNT )
FOR THE
FISCAL
YEAR
ENDED
JUNE 30
2004
2005
2006
2007
2008
2009
2010
2011
2012
2013
GENERAL
OBLIGATION
BONDS (4)
$
81,950
76,435
72,920
63,915
122,890
116,050
122,175
114,797
104,999
95,340
LESS:
AMOUNTS
AVAILABLE
IN DEBT
SERVICE FUND
$
4,249
4,417
6,107
9,306
15,441
14,129
13,226
12,310
10,647
8,978
TOTAL
$
77,701
72,018
66,813
54,609
107,449
101,921
108,949
102,487
94,352
86,362
PERCENTAGE OF
ESTIMATED
ACTUAL TAXABLE
VALUE OF
PROPERTY (2)
0.39%
0.35%
0.26%
0.19%
0.34%
0.29%
0.31%
0.28%
0.26%
0.23%
NET
BONDED
DEBT
PER
CAPITA (3)
$
370
330
294
229
426
391
410
378
342
306
Notes:
(1) The restricted for debt service principal column has not been inlcuded because there are no restricted assets
for general obligation bonds.
(2) Percentage Estimated Actual Taxable Value of Property = Total Column (above) / the Estimated Actual Taxable Value
(see the schedule of Assessed Value and Estimated Actual Value of Taxable Property for Est. Actual Taxable Value).
(3) Net Bonded Debt per capita = Total column (above) / the prior year's (rounded) County Population (revised 2007-2011)
(see the schedule of Demographic and Economic Statistics for population data).
(4) General obligation bonds includes all general obligation bonds other than:
(a) Fire District G.O. Bonds of $8,990 as they have their own designated millage (fire millage is assessed only to
unincorporated areas of the County and municipalities with a contract for fire protection)
(b) Higher Education G.O. Bonds of $3,765 as they have their own designated millage
(Special Purpose Districts)
Source: Horry County Finance Department
228
HORRY COUNTY, SOUTH CAROLINA
DIRECT AND OVERLAPPING GOVERNMENTAL ACTIVITIES DEBT
AS OF JUNE 30, 2013
(AMOUNTS EXPRESSED IN THOUSANDS)
ENTITY
School District
City of Myrtle Beach
City of Conway
City of North Myrtle Beach
City of Loris
Town of Surfside
DEBT
OUTSTANDING
$
357,575
49,197
2,362
23,686
1,447
585
ESTIMATED
PERCENTAGE
APPLICABLE
100.00%
100.00%
100.00%
100.00%
100.00%
100.00%
ESTIMATED
SHARE OF
OVERLAPPING
DEBT
$
Subtotal, overlapping debt
Horry County direct debt (1)(2)(3)
357,575
49,197
2,362
23,686
1,447
585
434,852
347,635
100.00%
100.00%
Total direct and overlapping debt
347,635
$
782,487
Notes:
(1) Horry County direct debt outstanding includes all general obligation long-term bonds including:
(a) Fire District G.O. Bonds of $8,990 have their own designated millage (fire millage is assessed only to
unincorporated areas of the County and municipalities with a contract for fire protection, added beginning in FY 2013)
(b) Higher Education G.O. Bonds of $3,765 have their own designated millage
(Special Purpose Districts, added beginning in FY 2013)
Amounts
(2) Horry County direct debt outstanding also includes:
(a) All general obligation long-term bonds (excluding item # 1 above)
$ 95,845
(b) 2009 Hospitality Bonds (added beginning in FY 2013)
1,860
(c) Certificates of Participation (added beginning in FY 2013)
1,051
(d) Ride IGA #1 & #2 (added beginning in FY 2013)
230,067
(e) Capitalized Leases (added beginning in FY 2012)
3,869
2,188
(f) Debt Outstanding includes the unamortized premiums (beginning in FY 2012)
Source: Finance Department of each entity.
229
HORRY COUNTY, SOUTH CAROLINA
LEGAL DEBT MARGIN INFORMATION
LAST TEN FISCAL YEARS
(AMOUNTS EXPRESSED IN THOUSANDS)
2004
Debt limit
$
Total net debt applicable to limit
Legal debt margin
Total net debt applicable to the limit
as a percentage of debt limit
94,790
2005
$
63,315
$
31,475
66.80%
$
2006
97,281
$ 119,413
58,178
55,565
39,103
59.80%
$
63,848
46.53%
2007
For the Fiscal Year Ended June 30,
2008
2009
$ 129,371 (2) $ 142,364
63,915 (2)
$
$ 158,493
122,890 (2)
2010
2011
2012
$ 161,340
$ 163,165
$ 164,423
122,175
114,797
104,999
116,050 (2)
65,456 (2) $
19,474 (2) $
42,443 (2) $
39,165
49.40%
86.32%
73.22%
75.73%
$
48,368
70.36%
$
59,424
2013
$
165,155
95,845
$
69,310
63.86%
58.03%
Legal Debt Margin Calculation for Fiscal Year 2013
Assessed value (1)
Less: Exempt industrial personal and real property (1)
Plus: Assessed value - Merchant's inventory
Total assessed value
$ 2,056,677
(2,807)
10,572
$ 2,064,442
Debt limit(8% of total assessed value)
Debt application to limit:
General obligation bonds (3a) (3b)
Legal debt margin
$
165,155
$
95,845
69,310
Notes:
(1) Assessed value includes exempt industrial personal and real property
(2) Total net debt applicable to limit and Legal Debt Margin are restated for fiscal years 2007, 2008 and 2009 and the Debt Limit is restated for fiscal year 2007.
(3) General obligation bonds includes all general obligation bonds other than:
(a) Fire District G.O. Bonds as they have their own designated millage (fire millage is assessed only to unincorporated areas of the County and municipalities with a contract for fire protection)
(b) Higher Education G.O. Bonds (beginning in FY 2012) as they have their own designated millage (Special Purpose Districts)
Source: Horry County Finance Department
230
HORRY COUNTY, SOUTH CAROLINA
PLEDGED-REVENUE COVERAGE
LAST TEN FISCAL YEARS
FOR THE
FISCAL
YEAR
ENDED
JUNE 30
2004
2005
2006
2007 (3)
2008 (2) (3)
2009 (3)
2010 (3)
2011(3)
2012
2013
AIRPORT REVENUE BONDS
AIRPORT
CHARGES
AND OTHER
$
17,279
19,596
22,239
22,219
21,363
18,002
16,678
18,557
17,937
20,300
HOSPITALITY FEE SPECIAL OBLIGATION BONDS
(AMOUNTS EXPRESSED IN THOUSANDS )
LESS:
NET
DEBT SERVICE
OPERATING
AVAILABLE
EXPENSES
REVENUE
PRINCIPAL
INTEREST
$
8,620
9,968
11,526
9,748
10,186
9,541
9,316
10,680
11,163
11,249
$
8,659
9,628
10,713
12,471
11,177
8,461
7,362
7,878
6,774
9,051
$
1,590
1,685
1,780
1,890
520
545
575
-
$
1,773
1,678
1,576
380
816
577
551
41
228
1,790
COVERAGE
2.57
2.86
3.19
5.49
8.36
7.54
6.54
192.51
29.64
5.06
(AMOUNTS EXPRESSED IN THOUSANDS )
HOSPITALITY FEE
DEBT SERVICE
ASSESSMENT
COLLECTIONS (1)
PRINCIPAL
INTEREST
$
5,351
5,642
6,159
6,638
6,632
6,179
5,847
6,101
6,401
6,495
$
1,100
1,150
1,205
1,260
1,320
1,390
1,050
1,695
1,745
1,805
$
COVERAGE
927
876
823
766
707
641
230
223
170
115
Notes:
(1) Does not include interest, fund balance usage or transfers in.
(2) On January 9, 2008, Horry County Redeemed $11,270,000 of Airport Revenue Bonds
(3) Calculations based on 2010 Airport Bond Ordinance (all Airport Revenue Bond numbers are restated for FY 2007 through FY 2010), Series 1997 and 2000 Bonds were redeemed in FY 2011.
Source: Horry County Department of Airports and Horry County Finance Department
231
2.64
2.78
3.04
3.28
3.27
3.04
4.57
3.18
3.34
3.38
HORRY COUNTY, SOUTH CAROLINA
DEMOGRAPHIC AND ECONOMIC STATISTICS
LAST TEN CALENDAR YEARS
PERSONAL
INCOME (2A)
YEAR
2003
2004
2005
2006
2007
2008
2009
2010
2011
2012
COUNTY
POPULATION (5B)
210,757
217,608
226,992
238,493
252,464
260,609
265,640
270,644
276,340
282,285
(AMOUNTS EXPRESSED
IN THOUSANDS)
$
5,324,986
5,694,801
6,080,889
6,632,252
7,545,657
7,816,768
7,460,776
7,721,872
8,054,854
not available
PER
CAPITA
PERSONAL
INCOME
$
25,266
26,170
26,789
27,809
29,888
29,994
28,086
28,531
29,148
not available
(2B)
(3B)
(3B)
(3B)
(3B)
(3B)
(3B)
(3B)
(3B)
(3B)
SCHOOL
ENROLLMENT
(1A) (4B) (7B)
LABOR
FORCE (6B)
EMPLOYMENT
(2B) (6B)
31,018
32,840
34,480
36,068
36,068
37,735
37,421
38,206
38,665
not available
111,541
115,957
120,996
127,974
130,490
130,946
130,177
129,520
129,407
129,445
105,203
109,090
113,984
120,985
124,021
121,733
114,616
113,726
114,225
116,202
H
H
H
E
E
E
H
H
H
E
E
E
COUNTY
% UNEMP.
(6B)
STATE
% UNEMP.
(5A) (6B)
5.7
5.9
5.8
5.5
5.0
7.0
12.0
12.2
11.7
10.2
6.7
6.8
6.8
6.4
5.6
6.8
11.3
11.2
10.4
9.1
H
H
H
E
E
E
Notes (A):
(1) Enrollment is as of Spring of that year.
(2) Personal Income = County Population (above) x Per Capita Personal Income (above).
(3) County Population, Personal Income and Per Capita Personal Income have been revised to incorporate updated information (2007 - 2011) from the Bureau of
Economic Analysis.
(4) Labor Force, Employment and County Unemployment are averaged on a calendar year basis and have been revised to incorporate updated information.
(5) State Unemployment Rates are an annual average and have been revised to incorporate updated population controls and re-estimation.
Sources (B):
(1) S. C. Statistical Abstract
(2) S. C. Employment Security Commission, Labor Market Research Division
(3) Bureau of Economic Analysis
(4) Horry County Schools website
(5) U.S. Census Bureau
(6) U.S. Department of Labor
H: Reflects controlling to new statewide totals
E: Reflects revised inputs, reestimation, and controlling to new statewide totals.
P: Preliminary
(7) Horry County Schools
232
HORRY COUNTY, SOUTH CAROLINA
PRINCIPAL EMPLOYERS
CURRENT YEAR AND NINE YEARS AGO
2013 (A2)
EMPLOYER
Horry County School District
Wal-Mart
Horry County Government (B5)
Grand Strand Regional Medical Center
Coastal Carolina University
Conway Medical Center
Food Lion
McLeod Health (Loris & Seacoast)
Blue Cross Blue Sheild
City of Myrtle Beach
Burroughs & Chapin
AVX Corporation
Myrtle Beach National
Totals
2004 (B4)
PERCENTAGE
OF TOTAL
EMPLOYEES (B6) RANK (B6) EMPLOYMENT (B3)
5,394
2,348
2,069
1,400
1,363
1,250
919
900
826
825
1
2
3
4
5
6
7
8
9
10
4.17%
1.81%
1.60%
1.08%
1.05%
0.97%
0.71%
0.70%
0.64%
0.64%
17,294
13.37%
RANK
PERCENTAGE
OF TOTAL
EMPLOYMENT
4,000
1,885
1,606
970
909
1,000
1
2
4
9
10
8
3.62%
1.71%
1.45%
0.88%
0.82%
0.91%
1,000
7
0.91%
1,824
1,290
1,000
3
5
6
1.65%
1.17%
0.91%
EMPLOYEES
15,484
Notes (A):
(1) The Total Employment is as of June of that year
(2) Percentage of Total Employment = Total Employees (above) / prior year's Total Labor Force on an annual basis
(see Demographic and Economic Statistics)
Sources (B):
(1) Mytle Beach Regional Economic Development
(2) SC Employment Security Commission
(3) U.S Department of Labor Bureau of Labor Statistics
(4) 2004 Horry County Comprehensive Annual Financial Report
(5) Horry County Human Resources Department
(6) Myrtle Beach Chamber of Commerce - January, 2013
233
14.03%
HORRY COUNTY, SOUTH CAROLINA
GROSS RETAIL SALES FIGURES
LAST TEN YEARS
$10.00
(in billions)
$9.00
2000
$8.00
2001
2002
$7.00
2003
$6.00
2004
2005
$5.00
2006
2007
$4.00
2008
2009
$3.00
2010
2011
$2.00
2012
$6.06
$6.03
$6.13
$6.18
$7.39
$8.28
$9.14
$9.26
$9.06
$8.21
$7.86
$8.29
$8.75
$9.01
2013
$1.00
$0.00
2004
2005
2006
2007
2008
2009
2010
2011
YEAR
GROSS
SALES
(in Billions)
PERCENTAGE
CHANGE
2003
2004
2005
2006
2007
2008
2009
2010
2011
2012
2013
$6.18
$7.39
$8.28
$9.14
$9.26
$9.06
$8.21
$7.86
$8.29
$8.75
$9.01
1.0
19.5
12.0
10.4
1.3
(2.2)
(9.4)
(4.3)
5.5
5.5
3.0
2012
2013
Notes:
(1) Gross Sales information is reported on a Fiscal Year basis from 2008 forward due to
accounting method, software and tracking changes at The Department of Revenue.
Sources:
S. C. Statistical Abstract
234
HORRY COUNTY, SOUTH CAROLINA
FULL-TIME EQUIVALENT GOVERNMENT EMPLOYEES BY FUNCTION
LAST TEN FISCAL YEARS
Full-time Equivalent Employees as of June 30,
2004
2005
2006
2007
2008
831
865
921
940
964
2009 (2)
2010
2011
2012
2013
341
340
307
309
Functions and Programs
Governmental Activities:
General government
354
Public safety
Police
299
320
337
342
347
263
261
262
226
236
Fire (1)
273
272
279
291
288
136
151
151
150
147
EMS (1)
-
-
-
-
-
171
185
182
179
179
Sheriff & Detention Center
-
-
-
-
-
274
320
347
346
348
Courts
-
-
-
-
-
196
203
201
205
211
Other
-
-
-
-
-
98
100
110
143
155
-
-
-
-
-
3
3
5
6
6
Public Works
122
121
122
136
127
79
79
81
79
84
Code Enforcement
-
-
-
-
-
47
44
42
41
39
Health and social services
Infrastructure and regulation
Fleet
Other
17
-
17
-
17
-
17
-
15
-
16
15
14
16
17
79
68
62
61
59
Culture, recreation and tourism
Libraries
47
48
48
57
50
54
62
60
65
79
Parks (3)
15
18
18
18
18
40
55
57
62
62
Other
-
-
-
-
-
5
4
4
5
5
-
-
-
-
-
2
3
3
3
3
132
131
132
133
118
112
105
104
109
130
1,736
1,792
1,874
1,934
1,927
1,929
1,999
2,025
2,003
2,069
Economic development
CDBG
Business-type Activities:
Airports
Total Primary Government
Source: Horry County Human Resources Department
(1) Fire/EMS was combined prior to FY2009 for reporting only.
(2) Increased detail level of functional staffing; prior actual comparisons not available.
(3) FY 2013 - 40 of the 62 Full-time equivalent employees are Regular Part-time employees, total Regular Part-time employees equal 80.
(4) Regular Part-time employees are defined as working 20 hours or less or less than 6 months and are calculated at 0.5 of Full-time employee.
235
HORRY COUNTY, SOUTH CAROLINA
OPERATING INDICATORS BY FUNCTION
LAST TEN FISCAL YEARS
For the Fiscal Year Ended June 30,
Functions and Programs
2004
2005
2006
2007
2008
2009
2010
2011
2012
2013
187,924
35
199,653
52
210,710
81
218,282
98
227,572
98
231,344
123
232,551
103
233,563
100
234,576
75
236,046
55
176,586
196,108
209,675
184,043
177,261
150,260
130,657
128,533
142,085
153,410
9,235
23,434
184,466
11,314
26,206
189,956
13,561
22,998
203,304
16,630
19,391
207,221
15,294
21,054
226,799
12,854
17,507
237,276
10,228
10,346
241,974
9,835
10,566
244,624
8,506
10,255
248,050
7,269
8,143
246,240
6,456
5,637
7,500
8,735
7,392
8,322
4,777
12,209
14,701
15,170
Governmental Activities:
General government
Information Technology/GIS:
# of GIS Parcels Maintained
# of Servers Maintained (7)
Register of Deeds:
Total Documents Filed
Assessor:
Assessments of Building Permits
Special Assessments
Real Property Parcels
Human Rosources:
# of Applications Taken
Public safety
Police:
# of Calls for Service
# of Index Crimes (1) (6)
Index Crime Clearance Rate (1) (6)
# of Call Responsive Officers Per Shift
Fire:
# of Calls for Service
# of Structure Fires
# of Ambulance Transports
# of Career Fire Fighters Per Shift
Emergency 911:
# of 911 Calls (8)
# of Radio Dispatches
# of Telecommunicators per shift
Sheriff's Office/Jail:
# of Bookings
Average daily population
Infrastructure and regulation
Code Enforcement:
# Building Permits
Public Works:
Miles of Dirt Road Scraped
Dirt Roads Paved
Signage Replaced/Installed (6)
Miles of Ditches Cleaned
100,389
8,374
22.30%
17
114,269
9,312
24.70%
17
117,079
N/A
N/A
18
132,328
8,586
16.85%
18
139,302
9,752
20.45%
18
134,514
9,164
19.00%
20
129,909
10,045
19.50%
20
130,532
9,539
19.75%
16
129,109
9,174
18.15%
18
120,796
9,559
23.98%
23
33,597
620
14,989
61
35,210
617
16,171
73
38,424
667
18,138
73
40,910
654
21,478
81
43,188
721
20,510
85
42,594
674
20,961
93
42,612
651
20,982
97
40,631
581
23,600
93
46,468
586
23,831
93
48,454
436
23,967
96
222,345
162,576
9
204,195
173,537
10
212,511
177,758
10
228,418
170,482
10
225,530
189,244
10
221,693
190,962
10
214,880
187,323
10
234,944
189,471
10
249,786
224,520
11
363,390
223,386
11
12,782
525
13,934
550
13,867
619
14,804
650
16,172
632
15,880
632
13,400
641
13,380
579
13,013
635
13,290
629
8,070
9,647
11,981
9,909
8,459
6,673
7,397
7,258
7,250
8,082
843
16.00
N/A
2,660
843
1.76
802
2,666
900
11.13
849
2,666
880
11.63
968
2,666
793
2.69
1,364
2,700
779
1.77
1,421
1,123
748
13.99
1,500
268
701
13.71
1,887
252
682
5.74
1,324
240
667
4.03
1,186
219
236
HORRY COUNTY, SOUTH CAROLINA
OPERATING INDICATORS BY FUNCTION
LAST TEN FISCAL YEARS
For the Fiscal Year Ended June 30,
Functions and Programs
2005
2004
2006
2007
2008
2009
2010
2011
2012
2013
Governmental Activities (Continued):
Engineering:
Dirt Roads Paved
Fleet:
# Vehicles Maintained
# Heavy Equipment Vehicles Maintained
# Vehicles Repaired or Work Orders
Culture, recreation and tourism
Library:
Circulation
Patron Traffic Count
New Patrons Registered
Parks & Recreation:
# Programs
Baseball Stadium:
Paid Tickets (2)
4.05
11.07
4.30
9.19
9.07
9.72
19.01
28.47
6.01
9.23
573
223
7,284
608
223
8,190
649
306
7,849
659
310
8,236
695
259
8,501
700
270
8,277
824
229
8,111
831
266
7,872
822
272
7,835
830
310
7,592
824,341
561,870
21,757
903,583
653,643
24,371
943,501
652,584
25,125
969,542
662,494
28,487
1,041,436
758,719
28,780
1,141,871
772,354
26,572
1,095,571
749,652
23,555
1,182,823
716,092
15,764
939,393
656,379
12,290
973,605
785,768
15,318
84
91
141
153
161
180
187
193
216
223
176,659
167,293
170,285
163,056
187,009
183,094
167,334
155,076
160,062
154,633
748,225
777,936
719,744
783,241
835,496
740,602
772,733
901,080
818,477
777,998
"
"
"
"
"
"
"
"
"
"
"
"
Business-type Activities:
Airports
Deplanements
Industrial parks - (Three Parks) (3) (4) (5) (6)
Atlantic Business Center - Leased/Sold/Transferred (acres)
Atlantic Business Center - % of County owned acres
Cool Springs Business Pk. - Sold/Transferred (acres)
Cool Springs Business Pk. - % of County owned acres
Pineridge Business Center - Sold/Transferred (acres)
Pineridge Business Center - % of County owned acres
Total Land Sold / Transferred (acres)
Total % of County owned acres in three parks
"
"
"
"
"
"
N/A
N/A
"
"
"
"
"
"
N/A
N/A
16.18
17.60%
0.00%
4.63
6.71%
20.81
7.77%
0.00%
12.98
14.81%
2.00
2.90%
14.98
5.59%
55.80
60.70%
0.00%
4.00
5.79%
59.80
22.32%
0.00%
0.00%
17.80
25.78%
17.80
6.64%
0.00%
0.00%
0.00%
0.00%
0.00%
0.00%
0.00%
0.00%
0.00%
0.00%
0.00%
0.00%
Notes:
(1) # of Index Crimes & Clearance Rates not available due to software migration issues.
(2) Fiscal Year is January through December. Revenue months are April through September.
(3) Operating indicators are not available for the Industrial Parks prior to FY2006.
(4) Operating indicators were changed and restated in FY2009 for FY2006 - FY2009 to accommodate and illustrate Owners changing needs.
(5) The beginning balance of total acreage owned by the County (used in the calculation of % of County owned acres) is as of July 1, 2005 and does not include unusable property such as roads.
(6) Operating Indicators that are not available are indicated with N/A
(7) The reduction of the "# of Servers maintained" is a direct result of the use of virtual technology; which is the configuration of one physical server into multiple "virtual" servers.
This reduction in the number of physical servers has resulted in improved efficiencies in heating and cooling, electricity, and a greater utilization of the actual physical servers themselves.
(8) The 45% increase in 911 calls, this fiscal year (2012-2013), is due primarily to the implementation of a new system that replaced an old system with less accuracy.
This new system utilizes a different reporting mechanism thereby increasing the accuracy of tracking 911 calls. The County implemented this new system in March 2012.
Source: Various County Departments
237
0.00%
0.00%
0.00%
0.00%
HORRY COUNTY, SOUTH CAROLINA
CAPITAL ASSET STATISTICS BY FUNCTION
LAST TEN FISCAL YEARS
For the Fiscal Year Ended June 30,
2005 (1)
2006
2007
2008
2009
2010
2011
2012
2013
4
4
4
4
4
4
4
4
4
213
315
351
368
352
320
299
279
285
102
97
106
Functions and Programs
Governmental Activities:
General government
Building Complexes
Public safety
Police:
Patrol units
Sheriff/Detention Center(2):
Transport Vehicles
Fire/Rescue:
Stations
Trucks(Fire/Pumpers)
Ambulances
40
59
21
40
61
27
40
67
33
41
66
32
41
66
36
39
67
36
39
68
28
39
68
29
35
66
29
3
1
3
1
3
1
4
1
4
1
3
1
3
1
3
1
3
1
1,281
1,271
1,369
1,334
1,413
1,426
1,431
1,429
1,436
23
20
87
23
23
92
25
22
133
25
21
139
25
24
206
24
17
173
21
26
155
15
23
109
17
19
148
1
9
1
1
9
1
1
9
1
1
9
1
1
9
1
2
9
1
2
9
1
2
9
1
2
10
1
20
15
28
15
20
15
28
15
20
15
28
15
20
15
28
15
2
35
7
34
19
2
35
7
34
20
4
35
13
35
22
4
35
13
38
21
6
35
13
38
21
6
27
6
27
6
27
6
27
6
27
6
27
6
27
6
27
6
28
6
Airports
Locations
Runways
4
4
4
4
4
4
4
4
4
4
4
4
4
4
4
4
4
4
Industrial parks
Locations
4
4
4
4
4
4
4
4
4
Baseball stadium
Baseball field (30% ownership)
1
1
1
1
1
1
1
1
1
Health and social services
Health Departments (bldg)
Social Services (bldg)
Infrastructure and regulation
Highways and streets:
Roads (miles)
Heavy equipment:
Motorgraders
Dump trucks
Other
Culture, recreation and tourism
Museums
Libraries
Bookmobile
Parks:
Parks
Tennis Courts
Ball Fields
Soccer Fields
Recreation Centers/Headquarters
Conservation/Natural Resources
Off Site Facilities:
Boat Landings
Watersheds
Business-type Activities:
Notes:
(1) Capital Asset data is not available prior to FY2005; however, ten years of data will be accumulated over time.
(2) Added the Sheriff department vehicle count in FY11.
Source: Horry County Finance Department
238
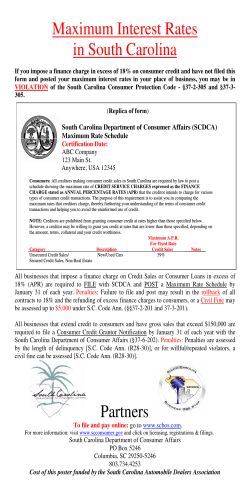


© Copyright 2026