
The EnzymeTracker: an open-source laboratory information management system for sample tracking
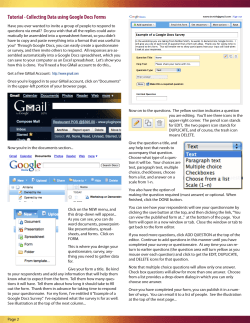
Triplet and Butler BMC Bioinformatics 2012, 13:15
http://www.biomedcentral.com/1471-2105/13/15
SOFTWARE
Open Access
The EnzymeTracker: an open-source laboratory
information management system for sample
tracking
Thomas Triplet1,2 and Gregory Butler1,2*
Abstract
Background: In many laboratories, researchers store experimental data on their own workstation using
spreadsheets. However, this approach poses a number of problems, ranging from sharing issues to inefficient datamining. Standard spreadsheets are also error-prone, as data do not undergo any validation process. To overcome
spreadsheets inherent limitations, a number of proprietary systems have been developed, which laboratories need
to pay expensive license fees for. Those costs are usually prohibitive for most laboratories and prevent scientists
from benefiting from more sophisticated data management systems.
Results: In this paper, we propose the EnzymeTracker, a web-based laboratory information management system
for sample tracking, as an open-source and flexible alternative that aims at facilitating entry, mining and sharing of
experimental biological data. The EnzymeTracker features online spreadsheets and tools for monitoring numerous
experiments conducted by several collaborators to identify and characterize samples. It also provides libraries of
shared data such as protocols, and administration tools for data access control using OpenID and user/team
management. Our system relies on a database management system for efficient data indexing and management
and a user-friendly AJAX interface that can be accessed over the Internet. The EnzymeTracker facilitates data entry
by dynamically suggesting entries and providing smart data-mining tools to effectively retrieve data. Our system
features a number of tools to visualize and annotate experimental data, and export highly customizable reports. It
also supports QR matrix barcoding to facilitate sample tracking.
Conclusions: The EnzymeTracker was designed to be easy to use and offers many benefits over spreadsheets, thus
presenting the characteristics required to facilitate acceptance by the scientific community. It has been successfully
used for 20 months on a daily basis by over 50 scientists. The EnzymeTracker is freely available online at http://
cubique.fungalgenomics.ca/enzymedb/index.html under the GNU GPLv3 license.
Background
Spreadsheets are broadly used by the scientific community. Their intuitive and easily understandable user interface is a significant advantage. They are also visually
appealing and feature a number of tools to visualize data
using charts. Hence, spreadsheets are currently the primary means to store both experimental and manually
curated genomic/proteomic data in most laboratories.
* Correspondence: [email protected]
1
Department of Computer Science and Software Engineering, Concordia
University, 1455 De Maisonneuve Blvd. West, Montreal, Quebec, H3G 1M8,
Canada
Full list of author information is available at the end of the article
Spreadsheet/Database Paradigm
Scalability
Spreadsheets might be sufficient when one needs to organize simple data. However, this approach raises a number
of problems as spreadsheets present numerous wellknown deficiencies compared to databases when dealing
with involved data. As reported in previous studies [1-4],
spreadsheets do not scale up well and, as the spreadsheet
will expand to accommodate a growing number of
records of increasing complexity, data handling – from
data entry to data mining and analysis – will become
increasingly cumbersome, hence reducing the utility of
potentially valuable information.
© 2012 Triplet and Butler; licensee BioMed Central Ltd. This is an Open Access article distributed under the terms of the Creative
Commons Attribution License (http://creativecommons.org/licenses/by/2.0), which permits unrestricted use, distribution, and
reproduction in any medium, provided the original work is properly cited.
Triplet and Butler BMC Bioinformatics 2012, 13:15
http://www.biomedcentral.com/1471-2105/13/15
Spreadsheets are also inefficient to handle sparse data,
both in terms of storage and performance. Storage is
less of a concern nowadays as costs have dramatically
decreased in the past few years. However, it should still
be taken into consideration when handling millions of
records, as is often the case in bioinformatics and largescale studies in general. In contrast, optimized databases
lead to speed improvements.
Quality Control
Page 2 of 12
Neither waiting for a user to complete his work or duplicating resources is a practical satisfactory solution.
Finally, spreadsheets provide little – if any – security or
access control mechanisms. Spreadsheets can be password-protected. However, the password of the spreadsheet is unique and known by many users, and they do
not offer the possibility to select what users or groups of
users can see/edit in the document: once opened, any
record can be displayed by the user. The password is also
embedded within the document and it is therefore not
possible to revoke access remotely. Databases on the
other hand provide advanced access control mechanisms,
and enable system administrators to precisely grant or
revoke permissions to users or groups of users to create,
view, update or delete resources as needed.
Besides the scalability issue, spreadsheets are subject to
data redundancy and consequently data integrity loss. For
example, if protein annotations should be displayed in different spreadsheets, they will most likely be duplicated in
each document. When an annotation is updated in one
place, all occurrences elsewhere may not be updated,
which will result in multiple inconsistent versions of the
same data. In some cases, determining which versions are
obsolete and which version is correct is challenging as different sections of the spreadsheet may have been updated
at different times, which can lead to data consolidation
issues. Moreover, unlike databases, spreadsheets do not
enforce referential integrity: they do not check that
resources referenced somewhere in the spreadsheet are
still valid, which may be critical, in particular when those
resources are frequently updated or deleted.
Spreadsheets are also error-prone and do not facilitate
data entry. Typically, any cell can contain any type of data
and validation is optional at best. Spreadsheets may even
incorrectly infer a data type based on the data, in particular numbers and dates in Excel. For example, the pH
range 5 - 6 is interpreted by Excel as the date May 6th,
and automatically modified and displayed as such when
the user types the value in a cell, without even notifying
the user.
Despite their deficiencies, spreadsheets have been heavily
used by biologists because they offer an intuitive and generic user interface that is applicable to most of their projects. Upgrading from spreadsheets to a more sophisticated
LIMS is not trivial. To be broadly accepted by the scientific
community as a valuable replacement for spreadsheets,
LIMS need to present the five acceptance characteristics
defined by Rogers [8]:
• relative advantage: the extent to which the LIMS
offers improvements over spreadsheets,
• compatibility: its consistency with social practices
and norms among its users,
• complexity: its ease of use or learning,
• trialability: the opportunity to try an innovation
before committing to use it,
• observability: the extent to which the technology’s
gains are clear to see.
Data Sharing and Access Control
Related Work
Over the past few years, the scientific community has
shifted its focus from research project conducted by a single investigator to collaborations among teams of investigators. Projects have effectively become increasingly
complex and require more resources to be successful [5,6].
While collaborative research is not new, it raises a number
of sharing issues that need to be addressed to maximize
the impact of collaborations. One of the keys to successful
collaborative research is the development of a centralized
system that manages all project data and serves as a
unique entry point for the integration of data for data
exploration and analysis for all collaborators [7].
However, sharing data using spreadsheets as is commonly done in small groups, proved to be difficult, when
possible. For example, a shared Excel spreadsheet can be
checked-out and edited by only one user at a time. Other
collaborators can only display a read-only copy of the
document until changes are committed by the first user.
To overcome spreadsheets limited capabilities, a number
of proprietary LIMS have been developed, for example
LABVANTAGE® SAPPHIRE [9], Exemplar LIMS [10] or
STARLIMS [11]. However, their licenses fees are usually
prohibitive, even for a single user. Moreover, extra features
- or modules - usually come at additional costs. As an
example, LABVANTAGE is charging a 87,954.75USDa fee
to enable the “Advanced Storage and Logistics” features.
STARLIMS is charging an extra 9,571.25USDa per user
for the basic edition of the document management module, 9,571.25USD a per user for batch processing and
33,499.38USDa for their Web services framework. Those
license fees were obtained on GSA on September 19, 2011
and represent the lowest possible prices negotiated with
the U.S. government and may not even be available to
non-governmental companies or organizations.
Such costs are clearly prohibitive for most laboratories
and therefore restrict the intended audience of these
Technology Acceptance Issue
Triplet and Butler BMC Bioinformatics 2012, 13:15
http://www.biomedcentral.com/1471-2105/13/15
tools to bigger laboratories or to the industry. While
numerous open-source LIMS have been developed [12],
a large number of existing systems focus on stock inventory and order management and were not designed to
track experimental biological results. In addition, many
projects were still in very early development stages, not
supported any more, or not stable enough to run properly (see Additional File 1 for details). As a consequence,
very few systems [13,14] are effectively available to the
general scientific community. The main goal of the
EnzymeTracker is to provide a free and simple opensource alternative.
Cloud-based Services
Cloud-based solutions, such as Google Docs [15], Microsoft Office Web Apps [16] or Zoho Office Suite [17], have
recently emerged and partially address the limitations of
traditional spreadsheets. Those solutions offer a group the
possibility to create, edit and save spreadsheets online.
They improve access control and versioning mechanisms.
Another benefit over traditional spreadsheets is that a
unique copy of the spreadsheet is created, which can be
accessed and edited online at the same time by many collaborators, thereby solving some of the data consolidation
issues.
However, they suffer from the same limitations as traditional spreadsheets in terms of scalability and data quality
control as they offer no means to validate data upon entry
and no specific features for biological projects. Storage
capacity is limited to a few gigabytes at most, which make
those solutions inappropriate for large projects. Their graphical web-based user interfaces are dynamic, they are
also less sophisticated that typical desktop applications
and raised numerous complaints from our collaborators
when first introduced. In addition, it should be noted that
data are stored on the servers of the service provider,
which can raise a number of issues if data confidentially is
critical as is often the case in the biomedical field. The
reliability of infrastructures supporting could services has
been questioned lately, as all of the major service providers
have recently experienced at least some glitches, from
service outage [18] to data losses [19].
iLAP
Stocker et al. [13] recently developed iLAP, a workflowdriven software for experimental protocol development,
data acquisition and analysis. iLAP relies on a relational
database and a web-based interface to effectively manage
complex workflows derived from biological experimental
protocols. Integration of external programs using Java
Applets is also possible, in particular the popular image
processing library ImageJ [20]. However, iLAP does not
manage biological data directly, as data remain in files
that should be uploaded and associated with a specific
experiment or protocol. It is therefore not possible to
search for a particular piece of biological data. iLAP
Page 3 of 12
does not provide tools for annotating pictures from
experimental results such as SDS-PAGE (Sodium Dodecyl Sulfate PolyAcrylamide Gel Electrophoresis) gels or
micro-plates, nor does it provides facilities to generate
reports.
SLIMS
Daley et al. [14] developed SLIMS, a Sample-based
Laboratory Information Management System. SLIMS is
a web application that provides members of a laboratory
with an interface to view, edit, and create sample information. Unlike iLAP, SLIMS leverages the relational
database to store and manage biological data. However,
its web-interface does not utilize recent advances in web
technologies. For example, most data are displayed to
the user as static HTML tables, which cannot be dynamically mined nor customized. SLIMS also features a
micro-plate annotation tool. Micro-plate pictures,
though, cannot be uploaded nor visualized along with
their annotations. Similarly, SLIMS supports SDS-PAGE
gels, which can be downloaded as plain text files, but
may not be properly visualized using the picture of the
gel. Reports can be generated and exported, but cannot
be customized.
In this paper, we propose the EnzymeTracker, an
open-source web-based laboratory information management system for sample tracking, as an efficient and
user-friendly alternative that aims at facilitating entry,
mining and sharing of samples and experimental biological data. Our system facilitates sample tracking by
using QR matrix barcodes and features advanced yet
intuitive biological data annotation and visualization
tools as well as a flexible and customizable report
designer.
Implementation
Architecture Overview
Despite their numerous benefits over spreadsheets, database management systems still lack satisfactory user
interfaces for data analysis [21] whereas Excel spreadsheets do provide intuitive and well-known graphical
interfaces for data analysis and consolidation, provided
the issues mentioned above are addressed.
Web-based applications are dynamic and interactive
websites that offer a rich user interface comparable to
standard desktop programs [22,23]. They can be executed
on any connected workstation, without software installation or specific requirements besides a recent web-browser and an active Internet connection to remotely access
data. Most importantly, web applications have the major
advantage of being always up-to-date wherever they are
being accessed, thereby eluding the need for multiples
copies of the same document on different workstations,
effectively solving synchronization issues between local
copies.
Triplet and Butler BMC Bioinformatics 2012, 13:15
http://www.biomedcentral.com/1471-2105/13/15
The EnzymeTracker was designed to present the acceptance characteristics (see above section ) to maximize its
utility. It consists of an integrated and interactive collection of online spreadsheets accessible over the Internet
and backed-up by a relational database for efficient data
management. Spreadsheets are organized to follow the
typical workflow in experimental biology and can be used
to track preliminary bioinformatics analyses of potential
targets of interests, cloning experiments, screening and
expression data (Figure 1). It features a number of novel
online tools to facilitate data entry and visualization. The
EnzymeTracker also provides a library of shared records
such as experimental protocols for sample assays and a
comprehensive set of reporting and system administration
tools. Unlike commercial LIMS, the EnzymeTracker is
open-source. The main benefit for laboratories is that they
can extend our system and implement new features to suit
their specific needs at no additional cost. With minimal
programming skills, it is possible for example to add a
simple spreadsheet to accommodate new types of data in a
few hours.
We implemented the online spreadsheets as a set of
highly dynamic web pages implemented using Asynchronous JavaScript and XML (AJAX) web technologies
[23], which enable a web application to communicate
with a server in the background using JavaScript and
XMLHttpRequest objects, without interfering with the
current state of the page. AJAX technologies provide an
effective means to create dynamic web pages that can
interact with the user.
Existing open-source solutions (see section above)
were designed using a fixed layout. Fixed layouts stay
the same width and float on the background regardless
of the size of the monitor. It is thus possible for the
designer to fine control the parameters of a fixed layout.
However, a major downside of fixed pages is that the
Page 4 of 12
layout does not accommodate well larger monitors as
the layout must accommodate smaller screens as well.
For example, at the Full-HD definition (1920*1080),
nearly half of the screen is blank when using iLAP,
which may be frustrating. To make the EnzymeTracker
more accessible, we implemented our system using a
fluid layout that automatically fits the content to the
screen definition of the user. We successfully tested the
EnzymeTracker on various screen definitions up to
3840*1080 (dual Full-HD configuration). Our fluid
approach will become increasingly beneficial for users as
the sizes of monitors have significantly increased in the
past few years and large definitions (> 1024*728) now
account for over 85% [24].
The implementation of the EnzymeTracker also relies
on a number of open-source programming libraries. The
web user interface (see section below for an overview) of
the EnzymeTracker was implemented using ExtJS v3.0
[25], the general open-source AJAX framework from
Sencha. It is backed-up by the freely available MySQL v5.0
relational database management system [26]. The serverside code was implemented using PHP v5.1 [27]. The
OpenID authentication relies on the LightOpenID implementation [28]. The visual annotation tools were build
using the wz_jsgraphics v3.05 Javascript graphics library
[29].
Reporting
In order to facilitate reporting and data sharing data
among collaborators, the EnzymeTracker provides a
flexible and user-friendly web interface for designing
report templates. A report template is similar to other
tables within the EnzymeTracker, except that the user
can dynamically select the pieces of information to
include in the report. It is also valuable to aggregate
data from various tables or consolidate statistical data.
Figure 1 Overview of the functionalities of the EnzymeTracker. The EnzymeTracker features a collection of online spreadsheets and tools
covering bioinformatics, cloning, screening and characterization. It also provides libraries of shared data such as protocols, and administration
tools for data access control using OpenID and user/team management.
Triplet and Butler BMC Bioinformatics 2012, 13:15
http://www.biomedcentral.com/1471-2105/13/15
For instance, one can easily create a report template
to display the percentage of transformants that were
successfully assayed or the molecular weight of a
protein.
Our report designer is particularly useful for more
complex queries, such as non-trivial joins when two
pieces of information from two tables are not directly
related and a number of intermediate tables must be
used in order to join the two tables. For example, consider the case when the user needs to list the plate assays
performed on clones related to cellulase. Figure 2, which
illustrates a simplified Entity-Relationship diagram of
tables relevant to generate this report, shows that plate
assays are performed on transformants, not on clones
directly. Fortunately, transformants are related to clones,
hence it is possible to define an implicit relation between
clones and plates assays using transformants. However,
manually writing the corresponding SQL query requires
a deep understanding of the underlying database structure and more advanced database skills. It is therefore
not a viable solution in most biological laboratory.
Instead, we designed Algorithm 1 to automatically compute the optimal implicit joins to relate two tables: when a
report is designed, the corresponding SQL query is automatically generated based on the report configuration.
Page 5 of 12
In other words, the designer enables scientists with no
database expertise to effectively design complex SQL
queries using our user-friendly interface and generate fully
customized reports that will fit their needs in a few clicks
(see section “Report designer” for details about the report
designer).
More formally, our algorithm relies on the findShortestPath() method derived from Dijkstra’s shortest path algorithm [30]. The optimal join is defined as the path
between the two tables with the lowest cost. The cost of a
join between two tables is defined as the length of the
shortest path between the two tables in the undirected
weighted graph implied by the database structure, where
the nodes represent tables and edges, foreign keys. Using
the above example, the cost of the join between clones
and plate assays is 2.
Input: Explicitly listed tables tabs
Input: Graph representation of the database dbGraph
Output: List of tables needed for the join out
1 out, checked ¬ array();
2 out[0] ¬ array (table ⇒ tabs[0], from ⇒ null);
3 checked[0] ¬ tabs[0];
4 for i ¬ 1 to count(tabs) do
5
tA ¬ tabs[i – 1];
6
tB ¬ tabs[i];
Figure 2 Simplified Entity-Relationship diagram to illustrate reporting mechanisms. Foreign keys are marked with solid bullets. Shaded
tables are explicitly listed in the configuration of the report. The transformants table (white) is not listed but is implicitly required to perform the
join query.
Triplet and Butler BMC Bioinformatics 2012, 13:15
http://www.biomedcentral.com/1471-2105/13/15
7
if tB not in out then
8
path ¬ findShortestPath(tA,tB);
9
end
10 end
Algorithm 1: List of tables needed for the optimal
join
Edges were weighted based on the biological significance of the foreign keys. For instance, because of the
normalization of the database, a number of intermediate
joining tables are created to define the relationships
between real biological entities – in particular in m : n
relations – which incorrectly increases the cost of the
relationship as the path between the two biologically
meaningful tables is longer. The cost of edges in m : n
relations was therefore reduced to avoid the bias
induced by the normalization process during the database design.
When the configuration of the report template is
updated, it is sent to the server as an XMLHttpRequest
object and the optimal join is computed and executed
by the SQL engine. The results of the query are finally
used to build the configuration of the ExtJS spreadsheet
used to dynamically preview the report as the template
is being built. Report templates are saved in the underlying database as views.
Page 6 of 12
Results
User Interface Overview
Figure 3 gives an overview of the graphical user interface
(GUI). Most pages are composed of three panels: the
main menu (A) on the left, a spreadsheet (B), which is
the primary means to enter to enter data, and a panel at
the bottom (C), whose content depends on the data to
display. Others data entry means such as those for visual
annotations are presented later in this section. Panels A
and C can be dynamically collapsed and resized to customize the workspace as needed and the spreadsheets can
be displayed in full screen mode to maximize the usable
working space thanks to the fluid-layout of our system.
Spreadsheets may also be customized by displaying, hiding, reordering and resizing columns as needed so that
only the most relevant data are displayed.
The content of the lower panel (C) varies with the data
being shown. On most pages, the panel displays the record
selected in the spreadsheet in a more readable format.
Depending on the spreadsheet, it can provide links to
cross-referenced databases such as the Gene Ontology
[31] or the Clusters of Orthologous Groups of proteins
(COG) database [32]. It also automatically fetches complete references from the literature using PubMed’s public
API [33] given the PMID of an article (G) and jobs for
Figure 3 Overview of the web-based user interface of the EnzymeTracker. The main menu (A) is on the left. The main panel is usually
composed of a spreadsheet (B) and a panel at the bottom to display the entry selected in the spreadsheet using a more readable layout (C).
Cross-references to other tables are associated with a combo box, whose content is dynamically generated after the content of the referenced
table (D). Cells are automatically computed whenever possible. For example, the length of a protein sequence and its molecular weight (E).
References from the literature are automatically fetched given the PubMed ID of an article (G) and jobs for nucleotide or protein sequence
alignment can be submitted to NCBI’s BLAST server in one click (F). A QR Code that summarizes the record is displayed (H) and may be printed
on the sample container for future reference.
Triplet and Butler BMC Bioinformatics 2012, 13:15
http://www.biomedcentral.com/1471-2105/13/15
nucleotide or protein sequence alignment can be submitted to NCBI’s BLAST server in one click (F). A QR
Code (matrix barcode) also summarizes the current record
and may be printed on the sample container for future
reference (see more details below).
Data Entry
The spreadsheet (Figure 3B) is the primary means of
entering data in the EnzymeTracker. Each cell is associated with an editor whose format depends on the data
within the cell. Most cell editors are simple text fields.
More advanced editors are provided where needed. In particular, cross-references to other tables are typically associated with a combo box, whose content is dynamically
generated after the content of the referenced table. Figure
3D illustrates the utilization of a combo box to select a
clone in the page for Annotations. Combo boxes facilitate
data entry by suggesting entries as the user types. They
also have the added benefit of limiting data entry mistakes,
in particular when users enter data that do not exist in the
referenced table. Specific editors are also available for Boolean flags and dates. The EnzymeTracker also supports
rich text editors with text formatting capabilities, which
are mainly used for comments and free-text cells. Endusers also have the possibility to undo modifications made
in the active spreadsheet using the GUI before saving data,
so that typos can be quickly corrected without triggering
the versioning and backup mechanism.
Data integrity and validation
To further reduce entry errors, each cell editor can be
associated with a validator. Validators check the correctness of data types and send immediate feedback to the
user in case of an error. They are usually based on regular
expressions or more advanced customized functions as
needed. Validators are also useful to enforce data entry
conventions and consistency within a group of users.
In addition, to minimize data entry, cells are automatically computed whenever possible. For example, the
length of a protein sequence and its molecular weight (E)
are automatically calculated when one enters a protein
sequence. Calculated fields are also used to reduce data
redundancy compared to standard spreadsheets. For
instance, the name of a protein should appear on several
related spreadsheets. Using standard spreadsheets, the
user needs to copy/paste the name of the protein wherever needed. This will lead to inconsistencies between
spreadsheets during their update. In the EnzymeTracker,
the underlying relational database is leveraged to display
the name of the protein in all tables where it is needed.
The first benefit is that the protein name is automatically
displayed whenever there exists a relation between proteins and the current spreadsheet. Second, changes to the
protein data are automatically reflected in all tables. Data
Page 7 of 12
in the various online tables are therefore always consistent and up-to-date.
Data importation/exportation
In some cases, the different enzyme assays and characterization of samples were already being recorded using Excel
spreadsheets. We therefore implemented importation routines to facilitate the migration process to the EnzymeTracker. From experience, basic data importation by
uploading and parsing files is error-prone, as files formats
and layouts tend to vary between files. For example, one
column may be missing in one file, which will shift other
columns and lead the parser to import the wrong data.
Instead, we implemented a drag-and-drop importation
mechanism where appropriate. The user selects the data
to import in the Excel file and drags and drops the selection into the browser’s window. The major benefit of this
semi-automatic approach is that it makes it easier for the
users to review the data before importation, hence reducing the number of errors made. It also gives more flexibility as only specific records can be selected and imported.
Finally, users have the possibility to export EnzymeTracker
spreadsheets to Excel documents in one click. Data may
also be imported programmatically, using JavaScript and
RESTful requests.
Versioning and backups
Our system is supported by a relational database, which
efficiently handles versioning and backups. Unlike in standard spreadsheets, when a user updates or deletes a record
in the EnzymeTracker, existing data are always backed-up
and flagged as obsolete so that is it not displayed in the
web GUI. The modifications are also logged for future
reference as part of the record’s history, which is displayed
in the lower panel of the interface (Figure 3C). The history
of the record is also accessible when generating customized reports (see Section Reporting). As a consequence,
while updating a spreadsheet is always possible, no data
are ever deleted and restoring a record to a previous state
or accessing the complete data modification log in case an
error is made while updating a spreadsheet is always
possible.
Visualization tools
Most data in the EnzymeTracker can be viewed using
tables. In a number of cases however, tables may be
improved to give the user a more visual perspective of
the data. To enhance the utility of experimental screening data, the EnzymeTracker integrates a number of
annotation and visualization tools. The following sections describe how the bottom panel of a spreadsheet
(Figure 3C) can be customized to accommodate plate
assays and E-PAGETM 48 gels from Invitrogen respectively. While the EnzymeTracker does not natively
Triplet and Butler BMC Bioinformatics 2012, 13:15
http://www.biomedcentral.com/1471-2105/13/15
support other techniques, new functionalities and new
tools that suit the specificities of each laboratory can be
easily implemented with minimal web development
skills.
Micro-plate assays
Micro-plate assays are widely used in molecular biology
and high-throughput screening to simultaneously test
multiple samples for their responses to chemicals, living
organisms or antibodies or to detect the presence of particular proteins or gene sequences. Those responses are
typically quantified by measuring the fluorescence or
color changes in markers associated with compounds on
the plates. The plate assay is usually repeated twice, at
two different sample dilution factors.
The EnzymeTracker enables users to upload the two
micro-plate pictures for the two dilutions of each experiment (Figure 4). The tables describing clones and transformants are leveraged to automatically annotate the
plate. A “virtual plate” representing the 96 wells can also
be layered over the original picture (A) or hidden (B) as
needed. The virtual plate is also convenient to quickly
visualize and identify most active wells by simply clicking
on the desired wells directly on the picture.
SDS-PAGE gels
E-PAGE TM 48 gels are improved SDS-PAGE (Sodium
Dodecyl Sulfate PolyAcrylamide Gel Electrophoresis) gels
broadly used for high-throughput protein separation and
analysis. Each gel comprises 48 lanes for samples and 4
marker lanes, which define the ladder of the molecular
weights of the proteins on the gel. Similarly to plate
assays, the picture of the gel can be uploaded and annotated within the user interface (Figure 5). Each sample
lane in the gel (A) can be annotated using a form (B) that
is displayed upon click. A tool-tip summarizing annotations of a lane is displayed when hovered by the cursor
(orange). The dropdown menus in (B) to select the clone
and the transformation plate loaded in each lane are
dynamically built based on their respective tables. In
Page 8 of 12
addition, specific bands can be highlighted (green arrows)
and annotated. Finally, the ladder (red) can be easily
setup by clicking on one of the four outer marker lanes.
The EnzymeTracker thus reduces the need for external tools and leverages data from other spreadsheet to
facilitate the annotations of hundreds of experimental
data and to reduce data entry errors.
Chart visualization
In many cases, the experiments aim at characterizing
the evolution of a variable given a set of parameters.
Representing the data using charts is then is suitable
alternative to tables for data presentation.
Figure 6 illustrates the use of charts in the EnzymeTracker, using the example of the characterization of the
activity of a sample as a function of its temperature. Each
chart panel is a composite of three sub-panels: the graph
itself (A), the underlying data in an editable table (B) and
a free-text field for comments and additional information
regarding the chart (not shown). Graphs are usually
represented using curves although histograms and pie
charts are also supported. The graph is dynamically
updated when the underlying data is edited within the
interface or imported from Excel as described above.
Graphs are also used in the administration console, in
particular to display connection and data logs.
Sample tracking with QR Code
For each record, a Quick Response (QR) Code is generated using Google Chart API [34] and displayed on
screen. QR Code is a type of matrix barcode that can be
used to encode up to 4,296 alphanumeric characters. Its
specifications were disclosed and it was published as an
ISO standard (ISO/IEC 18004:2006). The EnzymeTracker
uses QR Codes to summarize the content of the record.
The pictogram can be downloaded at a higher resolution
and printed on the sample container for future reference.
It can then be read as needed by inexpensive scanners or
Figure 4 Graphical user interface for the annotations of plate assays. Pictures of the micro-plates for the two dilutions can be uploaded
and automatically annotated based on the content from the tables describing clones and transformants. High-activity wells can be selected
within the web interface by clicking on picture. Annotations can be laid over the picture (A) or hidden (B) as needed.
Triplet and Butler BMC Bioinformatics 2012, 13:15
http://www.biomedcentral.com/1471-2105/13/15
Page 9 of 12
Figure 5 Graphical user interface for the annotations of E-PAGE™48 gels from Invitrogen. Pictures of the gels can be uploaded and
annotated within the web interface of the EnzymeTracker.
any reasonably recent smartphone, useful in laboratories,
as space on the bench is often limited.
Data-Mining and Reporting
As of June 2011, over 55,000 entries have been saved within
the EnzymeTracker and a growing number are being
recorded on a daily basis. While the EnzymeTracker should
not be considered as a complete framework for data warehousing and data integration of complex biological types, it
features user-friendly tools that enable scientists to easily
mine for specific pieces of information among large
amounts of heterogeneous data. For example, a principal
investigator may look for “all enzymatic activities detected
during liquid assays performed by his assistants in the past
two months on clones from S. thermophile“.
Context-dependent filtering
Each table in the EnzymeTracker is fully searchable and
each column is associated with a flexible filter that
depends on the type of data the column represents. Five
different types of filters can be configured as shown on
Figure 7: textual (A), multi-selection (B), numerical (C),
calendar (D) and Boolean (not shown). Numerical filters
let the user query for values above, below or equal to a
given threshold. They are most useful to query biochemical properties of enzymes and samples, for example protein sequence length or molecular weight, or the
temperature stability of a molecule. Boolean filters are
typically used to retrieve records when given a flag. For
instance, this filter is convenient to list all assays where a
strong activity has been reported. Calendar filters are
helpful to search for records given a time frame. The
multi-selection filter is most effective for searching for
one or more items in a given list. The list may be static
or may be dynamically generated by the server based on
data from other tables. For example, it is possible to
search for samples from a given organism, the list of
Figure 6 Visualization of experimental data using charts. The EnzymeTracker can use charts to visually represent characterization data. Each
chart panel includes a tab for the graph (A), the underlying data in a table (B) and free text to comment on the chart (not shown). Data may
be imported in the table (B) from Excel or edited within the interface.
Triplet and Butler BMC Bioinformatics 2012, 13:15
http://www.biomedcentral.com/1471-2105/13/15
Page 10 of 12
Figure 7 Data mining. Spreadsheets within the EnzymeTracker are fully searchable. Each column is associated with a filter that depends on the
type of data the column represents. Five kinds of filters are available: textual (A), multi-selection (B), numerical (C), calendar (D) and Boolean (not
shown).
organisms being automatically generated by the database
server.
Report designer
The web-based user interface for designing report templates is shown in Figure 8 and comprises three main
panels. The right panel (B) lists all items that can be
included in a report. Items are grouped based on the
spreadsheet where they can originally be found. The list
is searchable so that relevant pieces of information can
quickly be assembled together. To create a report, one
needs to drag-and-drop the desired items from the list
to the lower configuration panel (C). A preview of the
report can be automatically displayed in the central
panel (A) when the configuration of the report changes.
The report can also be refined using flags, for example
to decide whether to display only current values of a
record or its modification log also.
Once a template is created, it can be shared and displayed like other tables. In particular, the report can be
further refined using filters as described in the previous
section. In addition, reports are automatically updated
as more data is added to the EnzymeTracker: there is
therefore no need to re-design a report to display up-todate data. Finally, reports can be easily shared with collaborators or saved as standard Excel files for further
analysis.
Conclusions
The EnzymeTracker was designed to be flexible, easy to
use and offers many benefits over spreadsheets, thus
presenting the characteristics required to facilitate
acceptance by the scientific community. Unlike expensive commercial software, the open-source license of the
EnzymeTracker allows laboratories to easily extend the
EnzymeTracker as needed to fit their specific needs.
Our system has been successfully used for 20 months
on a daily basis by over 50 scientists to monitor protocols and experiments conducted to identify, annotate
and fully characterize thousands of samples from 20+
fungal species.
The initial implementation of the EnzymeTracker has
focused on facilitating sample tracking and experimental
data annotation and visualization. The future development of the EnzymeTracker will focus on the implementation of widgets based on the online spreadsheets,
which will facilitate data sharing as widgets can be
embedded in virtually any web page. Widgets will also
facilitate the development and sharing of new functionalities to support additional data types and material or
protocols by the community. We will also enhance
reporting by allowing chart generation in addition to
tabular data.
Availability and requirements
The EnzymeTracker and its documentation are available
at http://cubique.fungalgenomics.ca/enzymedb/index.
html under the GNU General Public License v3.
• Project name: EnzymeTracker
• Project home page: http://cubique.fungalgenomics.ca/enzymedb/index.html
• Operating systems: Platform independent
Triplet and Butler BMC Bioinformatics 2012, 13:15
http://www.biomedcentral.com/1471-2105/13/15
Page 11 of 12
Figure 8 User interface for the report designer. The central panel (A) displays a preview of the report. The right-most panel (B) shows a
searchable list of items that can be dragged and dropped in the configuration panel (C). The configuration of the report template can be
further refined by filtering data, applying various functions or aggregating data. A number of flags to fine tune SQL queries are available for
advanced users. A preview of the report can be automatically generated when the configuration is updated to facilitate the creation of the
report. Once created, reports are automatically updated and may be further mined.
• Server requirements: Apache 2, MySQL 5.0, PHP
5.1.6
• Web browser requirements: Chrome, Firefox 3.5
+, Safari 4+
• Programming languages: HTML, Javascript, PHP
• License: GNU GPL3
• Any restrictions to use by non-academics: None
Endnotes
a: Licence fees were obtained on GSA on September 19,
2011 at: http://www.gsaadvantage.gov/. These prices
represent the lowest possible prices negotiated with the
U.S. government and may not be available to non-governmental companies or organizations.
Additional material
Additional file 1: Brief review of 15 open-source LIMS referenced by
goomedic.com. Practical and free LIMS are extremely limited. We briefly
reviewed a few open-source projects referenced by goomedic.com. First,
it should be noted that open-source projects are not necessarily free to
use: 2 of the systems were not 100% free for the end-user. More than
half of the projects (53%) are not practical solutions because they are still
in early development stages or not stable enough to run without
crashing (including 3 projects which are not supported any more). 6
projects were simple clinical trials or inventory/order management
systems and were not designed to track experimental biological results.
One system was even designed to reduce travel expenses related
paperwork. While lightweight and functional, ms lims was designed for
the tracking and analysis mass spectrometry data only.
List of abbreviations
AJAX: Asynchronous JavaScript and XML; API: Application Programming
Interface; BLAST: Basic Local Alignment Search Tool; GNU: “GNU” is Not Unix
(recursive acronym); GPL: General Public License; GUI: Graphical User
Interface; ISO: International Organization for Standards; LIMS: Laboratory
Information Management System; QR Code: Quick Response Code; REST:
REpresentational State Transfer; SDS-PAGE: Sodium Dodecyl Sulfate
PolyAcrylamide Gel Electrophoresis; SQL: Structured Query Language; XML:
Extensible Markup Language;
Acknowledgements
We thank Adrian Tsang, Justin Powlowski, Annie Bellemare, Noutcheka StFelix, David Taylor and their teams for providing data, beta-testing and their
valuable feedback. This work was part of the Cellulosic Bio-fuel Network
Triplet and Butler BMC Bioinformatics 2012, 13:15
http://www.biomedcentral.com/1471-2105/13/15
project and was supported by the Agricultural Bioproducts Innovation
Program of Agriculture and Agri-Food Canada.
Author details
1
Department of Computer Science and Software Engineering, Concordia
University, 1455 De Maisonneuve Blvd. West, Montreal, Quebec, H3G 1M8,
Canada. 2Centre for Structural and Functional Genomics, 7141 Sherbrooke
Street West, Montreal, Quebec, H4B 1R6, Canada.
Authors’ contributions
TT designed and implemented the system. GB defined the requirements of
the system and devised the backup and versioning mechanisms. TT and GB
drafted and approved the final manuscript.
Received: 26 September 2011 Accepted: 26 January 2012
Published: 26 January 2012
References
1. Gordon KJ: Spreadsheet or database: Which makes more sense? Journal
of Computing in Higher Education 1999, 10(2):111-116.
2. Pemberton J, Robson A: Spreadsheets in business. Industrial Management
& Data Systems 2000, 100(8):379-388.
3. Denardo EV: The Science of Decision Making: A Problem-Based
Approach Using Excel. OR/MS Today 2001, 28(4).
4. Gansel BB: About the Limitations of Spreadsheet Applications in Business
Venturing. In Operations Research Proceedings, Volume 2007 of Operations
Research Proceedings. Edited by: Kalcsics J, Nickel S, Berlin. Heidelberg:
Springer; 2008:219-223.
5. Wuchty S, Jones BF, Uzzi B: The increasing dominance of teams in
production of knowledge. Science 2007, 316(5827):1036-9.
6. Bennett LM, Gadlin H, Levine-Finley S: Collaboration and Team Science: A
Field Guide. Tech. rep., National Institutes of Health; 2010.
7. Schmitt CP, Burchinal M: Data management practices for collaborative
research. Frontiers in psychiatry/Frontiers Research Foundation 2011, 2:47.
8. Rogers E: Diffusion of Innovations. 5 edition. New York, NY, USA: Free Press;
2003.
9. LABVANTAGE Solutions Inc: How differences in technology affect LIMS
functionality, cost & ROI. Tech. rep; 2011.
10. Sapio Sciences: Examplar LIMS. 2010 [http://www.sapiosciences.com/LIMS/
index.html].
11. Wood S: Comprehensive Laboratory Informatics: A Multilayer Approach.
American Laboratory 2007.
12. Goomedic: 15 Free and Open source LIMS: Laboratory information
management system programs and projects. 2010 [http://www.
goomedic.com/15-free-and-open-source-lims-laboratory-informationmanagement-system-programs-and-projects.html].
13. Stocker G, Fischer M, Rieder D, Bindea G, Kainz S, Oberstolz M, McNally JG,
Trajanoski Z: iLAP a workflow-driven software for experimental protocol
development, data acquisition and analysis. BMC bioinformatics 2009,
10:390.
14. Daley D, Lemire M, Akhabir L, Chan-Yeung M, He JQ, McDonald T,
Sandford A, Stefanowicz D, Tripp B, Zamar D, Bosse Y, Ferretti V,
Montpetit A, Tessier MC, Becker A, Kozyrskyj AL, Beilby J, McCaskie PA,
Musk B, Warrington N, James A, Laprise C, Palmer LJ, Paré PD, Hudson TJ:
Analyses of associations with asthma in four asthma population samples
from Canada and Australia. Human genetics 2009, 125(4):445-59.
15. Google Inc: Google Docs. 2011 [http://docs.google.com].
16. Microsoft Corporation: Office Web Apps. 2011 [http://office.microsoft.com/
en-us/web-apps].
17. Corporation ZOHO: Office Suite. 2011 [http://www.zoho.com].
18. Kniskern K: Microsoft explains the DNS service outage of. 2011 [http://
www.liveside.net/2011/09/20/microsoft-explains-the-dns-service-outage-ofseptember-8/].
19. Krane : The Reasons For Google’s Data Loss. 2011 [http://www.dataloss.
com/?p=67].
20. Rasband W: ImageJ. 2010 [http://imagej.nih.gov/ij/].
21. Codd E, Codd S, Salley C: Providing OLAP to User-Analysts: An IT
Mandate. Tech. rep., Codd & Date, Inc, San Jose, CA, USA; 1993.
22. Garrett JJ: The Elements of User Experience: User-Centered Design for the Web
Berkeley, CA: Peachpit Press; 2002.
Page 12 of 12
23. Garrett JJ: Ajax: A New Approach to Web Applications. 2005 [http://www.
adaptivepath.com/ideas/essays/archives/000385.php].
24. W3schools: Browser Display Statistics. 2011 [http://www.w3schools.com/
BROWSERS/browsers_display.asp].
25. Sencha Inc: ExtJS 3.0. 2009 [http://www.sencha.com/products/extjs3/].
26. Oracle Inc: MySQL: The world’s most popular open source database.
2011 [http://www.mysql.com/].
27. The PHP Group: PHP: Hypertext Preprocessor. 2006 [http://www.php.net/].
28. Mewp: LightOpenID. 2010 [http://gitorious.org/lightopenid].
29. Zorn W: High Performance JavaScript Vector Graphics Library. 2009
[http://www.walterzorn.de/en/jsgraphics/jsgraphics_e.htm].
30. Dijkstra EW: A note on two problems in connexion with graphs.
Numerische Mathematik 1959, 1:269-271.
31. The Gene Ontology Consortium: The Gene Ontology (GO) project in
2006. Nucleic Acids Research 2006, 34:D322-D326.
32. Tatusov RL, Fedorova ND, Jackson JD, Jacobs AR, Kiryutin B, Koonin EV,
Krylov DM, Mazumder R, Mekhedov SL, Nikolskaya AN, Rao BS, Smirnov S,
Sverdlov AV, Vasudevan S, Wolf YI, Yin JJ, Natale DA: The COG database:
an updated version includes eukaryotes. BMC Bioinformatics 2003, 4:41.
33. National Center for Biotechnology Information: Entrez Utilities Web
Service. 2009 [http://www.ncbi.nlm.nih.gov/entrez/query/static/esoap_help.
html].
34. Google Inc: Chart Tools. 2011 [http://code.google.com/apis/chart/].
doi:10.1186/1471-2105-13-15
Cite this article as: Triplet and Butler: The EnzymeTracker: an opensource laboratory information management system for sample tracking.
BMC Bioinformatics 2012 13:15.
Submit your next manuscript to BioMed Central
and take full advantage of:
• Convenient online submission
• Thorough peer review
• No space constraints or color figure charges
• Immediate publication on acceptance
• Inclusion in PubMed, CAS, Scopus and Google Scholar
• Research which is freely available for redistribution
Submit your manuscript at
www.biomedcentral.com/submit


© Copyright 2026