
Document 286651
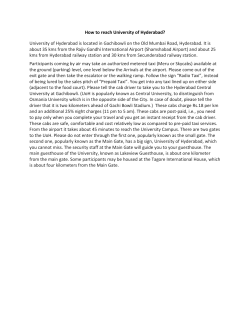
Device Design for Sub 90nm MOSFETs
for Sample and Hold Circuits
Mayank Gupta and Jason Woo
Department. of Electrical Engineering
University of California Los Angeles
Los Angeles, CA 90095, USA.
2.
In this paper we have extensively studied how different
device parameters affect the constituents of sampling circuit performance metrics. As the MOSFET is scaled into
sub-90nm regime for ADCs using moderate sampling rate
and high resolutions, the gate tunneling current will not
only severely degrade the droop rate but also affect the
nonlinearity adversely. The effect of scaling on various
trade-offs that exist among the metric constituents is also
presented. These device guidelines can be used to improve
the sample and hold operation to a fairly general degree.
1.
Introduction
One of the key limitations of future CMOS technologies
remains the restricted supply voltage, limited primarily by the
thin gate oxide that is prone to voltage stress (reliability) and
excessive leakage current [1]. One class of circuits strongly
affected by this trend is switched-capacitor (SC) circuits, that
are used in many analog signal processing applications including a majority of CMOS data converters. This leakage current
not only affects the magnitude of the voltage on the storage
capacitor, but also the linearity of the sampled voltage. Device
parameter effect circuit parameters like the acquisition time,
the droop rate of the sampled voltage and nonlinearity of the
pass gate.
According to the ITRS, effective oxide thickness
(EOT) of 1.2-1.5nm will be required for sub-90nm CMOS [2].
Current research works have identified several physical limiting factors associated with the ultra thin gate oxides. Among
them, the tunneling current is the one most sensitive to the
oxide thickness. As the thickness of the oxide layer decreases,
the tunneling current increases exponentially. This increased
current, not only adversely affects the MOS device performance but also significantly increases the standby power consumption of a highly integrated circuit [3]. Unlike other analog
circuits, the gate leakage current has a very important effect on
the sample and hold circuit. When a high clock is applied at
the gates of the FETs in the S-H circuit, the Igate can be very
high. This is unlike the case of an amplifier circuit where the
FETs are biased near the threshold voltage. All these issues
necessitate a comprehensive study, on the merits and demerits
of scaling the channel length for analog application in
switched capacitors circuits.
Simulation Setup
For the purpose of this study we used the device simulator,
Medici [4]. Accurate self-consistent model was used to calculate the gate current and experimental data from [5] was used
to calibrate the gate direct tunneling current through silicon
oxide of varying thickness. These devices have large gate
lengths, so as to minimize the effect of process induced variations that would otherwise corrupt the validity of the model.
A simple Sample and Hold (S-H) circuit is designed
by a sampling CMOS switch followed by a hold capacitor, as
shown in the Fig 1(a). Devices with a fixed gate length of
50nm and varying device parameters were considered. These
range of parameters were chosen to probe the range of device
dimensions and dopings around the values specified by ITRS
for a 50nm gate length. Oxide thickness, Tox, in the range of
0.8nm to 1.8nm were considered. Variations in the SDE
length, LSDE, would lead to devices with varying short channel
effects (SCE). The variation in SCE will be used to explain the
characteristics of different devices in the later sections. For the
purpose of this study we have chosen doped poly Si as the gate
electrode material as they are still the industry standard. Substrate doping is varied such that both N and P MOSFETs have
a Vt of |0.25| V. SDE doping of 1.15x10¹⁹/cm3, deep source/
drain depth of 30nm and doping of 1x10²⁰/cm3 are kept constant for all NMOS and PMOS devices for respective carrier
types. We have assumed uniform doping profiles and abrupt
junctions for all the devices. The widths of the NMOS and the
PMOS were 10µm and 20µm respectively. Such an arrangement compensates for the mobility difference between the
electrons and the holes.
Clock
Drain
Source
AC
DC
Bias
This is a pre-publication copy. Please do not distribute
Vin
Clock
(a)
Vout
Load
Cap
Vout (Volts)
Abstract
Clock
1.1
Clock
0.9
Input
Output
0.7
0.5
0.3 (S) (H)
(S)
0.1
(H)
-0.1
0.0 2x10⁻⁷ 4x10⁻⁷ 6x10⁻⁷
Time (sec.)
(b)
Fig 1(a) A basic sample and hold circuit, with NFET
and the PFET. (b) Input and output voltages of the
sample and hold circuit. The sample and the hold
clock cycles are indicated by (S) and (H) respectively.
Results and Discussions
In order to characterize sampling circuit thoroughly, the following performance metrics were evaluated: acquisition time,
Tacq, the droop rate during the hold cycle and the Integrated
Nonlinearity (INL).
3.1
505
6
490
4
475
2
0
460
8 9 10 11 12 13 14 15 16 17 18
Gate Oxide Thickness (Å)
Droop Rate (Volts/sec.)
104
Without gate
tunneling model
With gate
tunneling model
103
102
8 9 10 11 12 13 14 15 16 17 18
Gate Oxide Thickness (Å)
Fig 2(a): Acquisition time as a function of the Tox
(b) Hold voltage droop rate as a function of the Tox
Figure 3, shows the affect of Tox scaling on the Integral Nonlinearity (INL) introduced on to the sampled voltage.
The points are obtained by measuring the maximum difference
between the sampled voltage and the applied source voltage at
the end of a clock cycle, for various source potentials.
5.0
Effect of Gate Oxide Thickness Tox.
Reducing the oxide thickness of the device leads to better gate
control of the channel. As the drain current is proportional to
Cox to the first order, this means that the time taken to charge
up the capacitor should reduce with the scaling up of Cox.
However, the mobility of the device is degraded due to
increase in the vertical electric fields and the increase in the
drain current is not linear [6]. In this study since all the devices
were tailored to have a Vt of |0.25V|, the substrate doping of
the FETs were increased as the gate oxide thickness was
reduced. This introduces further degradation in the mobility,
and hence it degrades the drive current as well. Figure 2(a)
shows the variation of Tacq, with gate oxide thickness, Tox.
Tacq is the time taken for the sampled voltage to reach 99.99%
of its maximum value. Reduction in the EOT increases the
drain current and thus the Tacq decreases. The rate at which the
Tacq decreases, actually degrades with the scaling down of the
EOT due to the reasons mentioned above.
Figure 2(b) shows the droop rate for different oxide
thickness, with the gate tunneling model on and off. With the
8
520
105
(b)
10
535
Tacq Acquisition Time (ps)
(a)
Integral Nonlinearity (mvolts)
3.
gate tunneling model switched off in simulations, the characteristics show a marked improvement (smaller droop rates)
with the reduction in Tox. The real picture (grey curve) however is quite different. Since the gate tunneling current
increases exponentially with the decrease in the Tox, the
charge on the storage capacitor finds a leakage path via the
gate electrode. The droop rate increases by orders of magnitude and any sampling architecture would be severely limited
by this problem.
% Degradation in Tacq
The clock voltage applied at the gate of MOSFETs has
a peak value of 1V. The voltage to be sampled, applied at the
source of the MOSFET is a 0.5V peak to peak sinusoid in
series with a 0.5V DC signal, Figure 1(a). This was done in
order to probe the on-off regimes of both the PMOS and the
NMOS. The load capacitor is 0.53pF, this is approximately 10
times the total gate capacitance (Cox) of the NFET and PFET.
For a Tox of 10Å, this value of capacitance was kept fixed for
all the simulated devices. The frequency of the AC signal
applied to the input of the pass is gate is 2Mhz, which is sufficiently high to ensure that the overlap and junction displacement currents also form an important part of the entire
analysis. Similar to actual circuit conditions, the substrate of
the NMOS and the PMOS are connected to the GND and
VDD respectively. The clock used for all the simulations has a
period of 300ns (3.33Mhz) and a realistic droop rate of 5ns.
The duty cycle of the clock was 50%.
Figure 1(b) shows the input sinusoid and output voltage vs. time for the sample and hold circuit. The sample and
hold instance are explicitly shown by (S) and (H). Vout for the
hold cycle has a slope associated with it, which is due to a
leakage current flowing out of the sampling capacitor. The
leakage paths for the charge on the storage capacitor are via
the subthreshold current, the junction leakage of the reverse
biased body-drain junction, the displacement current flowing
via the parasitic capacitors and, finally, the gate leakage current flowing via the gate oxide. For this study, by turning off
and on the gate tunneling current in simulations, we are able to
identify the effect of the gate current of the S-H circuit performance.
Gate tunneling model Off
Gate tunneling model Off
Gate tunneling model On
Gate tunneling model On
4.5
4.0
INL measured at t=7.5ns
INL measured at t=0.0ns
3.5
3.0
2.5
2.0
8
9
10 11 12 13 14 15 16 17 18
Tox Gate Oxide Thickness (Å)
Fig 3: INL as a function of the Tox. The two time instances
correspond to immediately after and 7.5ns after the clock
falls to zero.
The plots with and without the gate tunneling current
are shown to compare the effect of the gate leakage current.
The plots measured at t2=7.5ns after the clock goes to zero,
show enhanced nonlinearity due the gate tunneling current
effect. As can be seen, reducing the gate oxide thickness
increases the non-linearity in the sampled voltages. t2 is cho-
This is a pre-publication copy. Please do not distribute
3.2
Effect of Source Drain Extension Length, LSDE:
700
650
60
Tacq for different SDE
50
600
40
550
30
500
20
450
10
% Degradation in Tacq
(a)
Tacq Acquisition Time (ps)
Recent studies have shown that Ion degradation with small
gate overlap mainly comes from the SDE region under the
sidewall spacer due to its graded low doping. For box like S/D
junctions, as applicable to this simulation study, SDE-to-gate
overlap can be eliminated to a great extent without the degradation of Ion with correct S/D design [7]. We define the SDE
length, LSDE, length of the low doped shallow junction, to be
zero for the point where the gate electrode and the side wall
spacer meet. For a positive LSDE we have an overlap condition
and vice versa for an underlapped case. In all these devices,
Tox was fixed at 10Å and the SDE junction depth was kept
fixed at 13nm, as specified by the ITRS, for a 50nm gate
length.
Figure 4(a) shows the variation of the Tacq with LSDE.
Reducing LSDE increases the channel to source and channel to
drain resistances, RSD. Of the various components of the channel to electrode resistance, like the accumulation resistance
(Rac), the spreading resistance (Rsp), and the contact resistance (Rco), it is the Rac that is being modulated in this case.
The decrease in LSDE increases the resistance as well as
reduces the drive voltage (VDS) and thus Tacq degradation with
reduction in LSDE is very rapid for negative values of LSDE.
400
00
-5 -4 -3 -2 -1 0 1 2 3 4 5
LSDE Source Drain Extension (nm)
(b)
Droop Rate (volts/sec)
106
105
104
103
102
Without Gate
tunneling model
With Gate
tunneling model
-5 -4 -3 -2 -1 0 1 2 3 4 5
LSDE Source Drain Extension (nm)
Figure 4 (a): Acquisition time as a function of the SDE length.
(b) Hold voltage droop rate as a function of the SDE length.
If we concentrate on the variation of the hold state
voltage droop rate (Fig 4(b)), we realize that the gate tunneling
has a very severe effect on it. The droop rate is extremely high
(≈106V/sec.) for the case of LSDE=5nm, this is much larger
than the observed values for the case of minimum oxide thickness (Tox=8Å). Also the slope of droop rate vs. LSDE is very
high, indicating that the droop rate is a strong function of
LSDE. The reason behind such high sensitivity of the gate tunneling current on the SDE length is explained in Fig 5, where
it is shown that the predominant gate tunneling current path
during the hold mode is via the gate-source overlap region
(Edge Direct Tunneling (EDT)). The increase in the SDE
length reduces the source drain resistance, increases the overlap region (area for gate tunneling current), the overlap capacitance and also increases the potential difference between the
drain and gate, due to reduced voltage drop across the RSD
(Igate is exponential function of this potential). Thus the gate
tunneling current increases very rapidly when LSDE is
increased [8].
Ec
Ef
EV
Ec
Ef
Gate
Electrode
p-doped
Channel region
Ec
Ef
Gate
Electrode
Ec
Ef
EV
Ec
Ef
Gate
Electrode
n+ S/D
Extension
(b)
(a)
Ec
Ef
EV
p-doped
Channel region
Ec
Ef
Gate
Electrode
Ec
Ef
EV
n+ S/D
Extension
(c)
(d)
Fig 5: The Si-SiO2 interface at various gate biases. The gate
tunneling current in positive for the cases (a), (b) and (c), and
is negative for the case (d). The gate tunneling current in (a)
and (c) flows via the channel and that in (b) and (d) is the Edge
Direct Tunneling (EDT) current flowing in the gate-source/
drain overlap region.
Figure 6, shows the variation of the INL with the
LSDE. We observe that the INL increases with increase in the
LSDE. Since the overlap capacitance increases with LSDE, the
charge deposited on the sampling capacitor increases and
hence the nonlinearity increases. The nonlinear junction
capacitance and the overlap capacitance resulting from the
5.0
Integral Nonlinearity (mVolts)
sen such that all transient effects have died out (Tacq‹0.8ns
always). This can be attributed to the increase in the channel
charge injected on the sampling capacitor as the gate oxide
thickness is reduced. Nonlinearity is certainly a very critical
issue for sample and hold circuits, since unlike the offset and
the gain errors that can be corrected using differential circuits
and amplifier topologies, the nonlinearity error is hard to compensate.
4.5
4.0
Gate tunneling model Off
Gate tunneling model Off
Gate tunneling model On
Gate tunneling model On
3.5
3.0
2.5
2.0
-5
INL measured at t=7.5ns
INL measured at t=0.0ns
-4 -3 -2 -1 0 1 2 3 4
LSDE Source Drain Extension (nm)
5
Fig 6: INL as a function of the LSDE. All the devices had
a Vt =|0.25V| with Tox=10Å and Xj=13nm. The two
time instances correspond to immediately after and
7.5ns after the clock falls to zero.
This is a pre-publication copy. Please do not distribute
source/drain and gate electrode overlap of the pass gate leads
to a nonlinear charge-to-voltage conversion. In this case there
is a marked increase in the INL for the case of nonlinearity
measured 7.5ns after the hold cycle. The extremely high gate
tunneling currents are responsible for the high INL at these
SDE lengths. Unlike the previous case (Figure 3) when there
was little difference between the INL with and without the
gate leakage for t=0ns, in Figure 6, we observe that there is a
visible degradation in the INL even at t=0ns. This again is due
to the high EDT current that flows through the overlap region,
for long SDE lengths.
The LSDE plays a critical role in the design of the sample and hold circuit. For a moderate decrease in the Ion (13%)
with the reduction in LSDE from (5nm to 0nm), we can achieve
a reduction in the gate leakage current of the order of 83%.
This would not only reduce the droop rate by an order of magnitude (from ≈5x10⁶ to ≈5x10⁵) but also reduce the injected
charge and the nonlinearity, circuit parameters that are very
hard to compensate otherwise. This reduction in LSDE would
certainly increase the acquisition time (11% increase), but this
can be traded-off with the benefits that are obtained otherwise.
3.3
Gate Length Scaling:
Given the analysis in the previous sections, the reasons to scale FETs in a pass gate must be re-evaluated. If we
are able to achieve better S-H circuits performance, with larger
gate lengths and with thicker gate oxides, there is certainly no
merit in using scaled MOSFETs. To test this hypothesis, the SH circuit performance of the CMOS pass gate for different
gate lengths is evaluated.
Figure 7 shows the acquisition time, Tacq, for three dif700
Tox=13Å
Tox=15Å
Tox=18Å
600
500
400
50 60 70 80 90 100
Gate length (nm)
Fig 7: Tacq vs. the gate length
for devices with scaled Tox
and a fixed Tox of 15Å.
4.0
INL (mVolts)
Acquisition Time (ps)
800
3.5
3.0
2.5
2.0
1.5
Tox=13Å
Tox=15Å
Tox=18Å
50 60 70 80 90 100
Gate length (nm)
Fig 8: INL vs. the gate length
for devices with scaled Tox
and a fixed Tox of 15Å.
ferent gate lengths with the gate oxide and junction depths
scaled in accordance to the ITRS guidelines for corresponding
gate lengths. The operating voltage and the threshold voltage
were kept fixed at 1.0V and |0.25V| respectively. The storage
capacitor was kept fixed at 0.53pF for all the devices. Also
shown in the plot is the gate length scaling trend for a fixed
Tox of 15Å but with other device parameters scaled appropriately. We can see that the scaling reduces the acquisition time,
which means that the channel RC delay does play a significant
part in the charging of the storage capacitor. The improvement
in the Tacq with the scaling of Tox for a particular gate length
is not significant as is evident from the marginal improvement
obtained by using Tox=13Å instead of 15Å for a 50nm gate
length and by using a 15Å gate oxide instead of 18Å for a
100nm gate length.
Scaling of the gate length also leads to improvement in
the INL of the pass gate. Figure 8, shows the behavior of the
INL for the pass gate for different gate lengths. These plots
were obtained with the gate tunneling model on and the nonlinearity is measured at the instant the clock voltage falls to
zero. Plots with the Tox scaled in accordance with the gate
length and a fixed Tox of 15Å are illustrated. We observe that
the nonlinearity reduces with the scaling of the gate length.
Since the nonlinearity is related to the channel charge deposited on to the storage capacitor, small channel lengths devices
inject smaller amount of charge on the storage capacitor
(smaller Lgate/Tox) than longer gate lengths devices, leading
to lower nonlinearity.
4
Conclusion:
In this paper we looked into how the various device
parameters of the MOSFET can influence the circuit parameters of the sample and hold circuit. The effects of the gate tunneling current can be reduced by choosing a suitably large
storage capacitor (low frequency) but since they can not be
completely nullified, an understanding of the these effects is
very important. We realize that the scaling of the gate oxide,
leading to the high leakage currents, would be severely limited
by the droop rate of the sampled voltage and the non-linearity
introduced. The SDE length is very critical to the design of the
sample and hold circuit. Any amount of unnecessary overlap
will increase the gate tunneling quadratically and has cascading effects on the injected charge, droop rate and the nonlinearity of the S-H circuit. With uniform box like profiles, best
performance would be obtained for the SDE length equal to
the spacer thickness. It was also shown that devices with small
gate lengths can operate at a higher frequencies (lower Tacq)
and still have lower nonlinearity, when compared to longer
gate length devices. Thus correct device design can reduce the
gate leakage without sacrificing on circuit metrics.
Acknowledgement
The work is supported by the Semiconductor Research Corporation.
References
[1] Leland Chang et.al, IEEE TED, 49(12), 2002, pp.2288-95.
[2] Int'l Tech Roadmap for Semiconductor 2001.
[3] Yang N et.al, IEEE TED, 47(8), 2000, pp.1636-44.
[4] Synopsys TCAD, MEDICI Version 2002.2, July 2002.
[5]Chang-Hoon Choi et.al, IEEE TED, 48(12), ’01, pp.2823-9.
[6] C.G. Sodini et.al, IEEE TED, 31(10), 1984, pp.1386-1393.
[7] Jun Yuan et.al, ESSDERC 2002, pp.503-6.
[8] Yang KN et.al, IEEE TED, 48(6), 2001, pp.1159-64.
This is a pre-publication copy. Please do not distribute


© Copyright 2026