
2 Traits and Individual Difference Variables Scales Related to Interpersonal Orientation,
2 Traits and Individual Difference Variables Scales Related to Interpersonal Orientation, Needs/Preferences, and Self-Concept Ten-Item and Five-Item Personality Inventories (Gosling, Rentfrow, and Swann 2003) Construct: The Brief Measure of the Big-Five Personality is designed to succinctly capture the BigFive personality dimensions, including Extraversion, Agreeableness, Conscientiousness, Emotional Stability, and Openness to Experience. While longer measures are associated with more sound psychometric properties, Gosling et al. (2003) argue for and demonstrate the usefulness of a much shorter personality assessment. Description: Two versions of a brief personality measure are offered: a Ten-Item Personality Inventory (TIPI) and a Five-Item version (FIPI). Each item has two brief descriptions that are related to each other. In addition, the FIPI includes some explanation of each set of descriptors. All items in the scales are answered on a 7-point scale, where 1 = strongly disagree and 7 = strongly agree. Development: To develop items for inclusion in both the TIPI and the FIPI measures, the focus was on optimizing content validity. This led to developing descriptors for each of the five personality dimensions and then selecting descriptors best representing each dimension. This process involved drawing from previous Big Five measures and carefully selecting items. Researchers developed two instruments that they could test. One was a five-item personality test, and the other was a ten-item personality test. Note that the FIPI is not a condensed version of the TIPI. Samples: Study 1 had a sample of 1,704 undergraduate students, and Study 2 involved 1,813 undergraduate students. A subset of participants from Study 1 (n = 118) were used to assess test-retest reliability over a 2-week period. Additional samples of 60 and 83 were used in an observer-report and peer-report format, respectively. A subset from Study 2 (n = 180) was used to assess test-retest reliability over a 6-week period. Validity: Validity tests were focused on comparing the FIPI and TIPI to well-known longer measures of personality. The primary instrument used for comparison was the 44 Big-Five 15 16 HANDBOOK OF MARKETING SCALES Inventory (BFI) developed by John and Srivastava (1999). In Study 1, the convergence between the measures of each personality dimension for the FIPI and BFI were as follows: Extraversion, 0.80; Agreeableness, 0.58; Conscientiousness, 0.65; Emotional Stability, 0.69; and Openness to Experience, 0.48. The subsample used for test-retest purposes in Study 1 indicated that although test-retest was higher for the BFI than for the FIPI, the FIPI had on average a test-retest reliability of 0.68 across the five dimensions. Further, the FIPI compared favorably with relationships between the BFI and other personality measures. While the FIPI is somewhat inferior to the standard BFI, it displayed adequate levels of convergent and discriminant validity, test-retest reliability, relationships with other constructs, and convergence between self-ratings and observer ratings. However, the shortcomings of this scale led to the creation of a second measure with 10 items. In Study 2, the convergence between the measures of each personality dimension for the TIPI and BFI were as follows: Extraversion, 0.87; Agreeableness, 0.70; Conscientiousness, 0.75; Emotional Stability, 0.81; and Openness to Experience, 0.65. Although test-retest reliability is argued to be more important for assessing the reliability of a two-item measure than is coefficient alpha, alphas are reported for the five dimensions as follows: Extraversion, 0.68; Agreeableness, 0.40; Conscientiousness, 0.50; Emotional Stability, 0.73; and Openness to Experience, 0.45. The same set of test-retest reliabilities were 0.77, 0.71, 0.76, 0.70, 0.62, and 0.72. The TIPI compared favorably in tests for convergent and discriminant validity using other personality measures and additional correlates. Although both the FIPI and TIPI are suggested to be reasonable methods for assessing Big-Five personality dimensions, the authors recommend the TIPI for its superior psychometric properties and usefulness in latent variable modeling and other methodological tests. Scores: Neither mean nor percentage scores were reported. Source: Gosling, Samuel D., Peter J. Rentfrow, and William B. Swann Jr. (2003), “A Very Brief Measure of the Big-Five Personality Domains,” Journal of Research in Personality, 37 (December), 504–28. Reference: John, Oliver P. and Sanjay Srivastava (1999), “The Big Five Personality Trait Taxonomy: History, Measurement, and Theoretical Perspectives,” in Handbook of Personality: Theory and Research, eds. L. A. Pervin and O. P. John, New York: Guilford, 102–38. Chapter 2 Traits and Individual Difference Variables 17 Ten-Item and Five-Item Personality Inventories (Gosling, Rentfrow, and Swann 2003) Instructions: Here are a number of personality traits that may or may not apply to you. Please choose a response to indicate the extent to which you agree or disagree with that statement. You should rate the extent to which the pair of traits applies to you, even if one characteristic applies more strongly than the other. Ten-Item Version (TIPI) (recommended by Gosling et al. 2003) I see myself as: 1. Extraverted, enthusiastic 2. Critical, quarrelsome 3. Dependable, self-disciplined 4. Anxious, easily upset 5. Open to new experiences, complex 6. Reserved, quiet 7. Sympathetic, warm 8. Disorganized, careless 9. Calm, emotionally stable 10. Conventional, uncreative Five-Item Version (FIPI) I see myself as: 1. Extraverted, enthusiastic (that is, sociable, assertive, talkative, active, NOT reserved or shy) 2. Agreeable, kind (that is, trusting, generous, sympathetic, cooperative, NOT aggressive or cold) 3. Dependable, organized (that is, hard-working, responsible, self-disciplined, thorough, NOT careless or impulsive) 4. Emotionally stable, calm (that is, relaxed, self-confident, NOT anxious, moody, easily upset, or easily stressed) 5. Open to experience, imaginative (that is, curious, reflective, creative, deep, open-minded, NOT conventional) Notes: Responses are as follows: 1 = disagree strongly, 2 = disagree moderately, 3 = disagree a little, 4 = neither agree nor disagree, 5 = agree a little, 6 = agree moderately, 7 = agree strongly. Scoring for the TIPI (“R” indicated reverse scoring): Extraversion - 1, 6R; Agreeableness - 2R, 7; Conscientiousness - 3, 8R; Emotional Stability - 4R, 9; Openness to Experiences - 5, 10R. 18 HANDBOOK OF MARKETING SCALES Consumer Self-Confidence: CSC (Bearden, Hardesty, and Rose 2001) Construct: Consumer self-confidence (CSC) is defined as the extent to which an individual feels capable and assured with respect to his or her marketplace decisions and behaviors. The concept reflects the subjective evaluations of one’s ability to generate positive experiences as a consumer in the marketplace (Bearden et al. 2001, p. 122). The final measure consists of six dimensions: information acquisition (IA), consideration set formation (CSF), personal outcomes decision making (PO), social outcomes decision making (SO), persuasion knowledge (PK), and marketplace interfaces self-confidence (MI). The first four factors are grouped under “decision making self-confidence”; the fifth and sixth factors are grouped as “protection self-confidence.” Description: CSC consists of 31 items. All the subdimensions consist of five items except for PK, which is assessed using six items. Participants were asked to rate the extent to which each of the scale items was characteristic of them on a five-point scale labeled 1 = extremely uncharacteristic, 2 = somewhat uncharacteristic, 3 = uncertain, 4 = somewhat characteristic, and 5 = extremely characteristic. Scale responses are averaged to form scores for each of the six subdimensions. Development: An initial pool of 145 items was generated from a convenience sample of 43 adults. After deleting redundant, leading, and ambiguous items, judgmental screening for item representativeness, as described by Bearden et al. (2001), resulted in a pool of 97 items. This set of items was subjected to a series of item purification procedures using the data from studies 1 and 2. Specifically, corrected item-to-total correlations, average factor loadings, and interitem correlations were used to reduce the pool to 39 items. Extensive confirmatory factor analyses of the data collected in Study 3 resulted in a six-factor correlated model. Construct reliability estimates from Study 3 ranged from 0.81 to 0.88. Other estimates of reliability are also presented. Intercorrelations among the six measures, as well as estimates of average variance extracted for each scale, are summarized in the study write-ups. Samples: In addition to the item generation sample of 43 adults, seven studies were reported. Studies 1 and 2 were based on nonstudent adult samples of 221 and 204 respondents, respectively. Studies 3 and 4 comprised 252 and 59 undergraduates. Study 5 was based on the responses of 60 married couples; the data for Study 6 were collected by mail survey from 100 members of the American Council on Consumer Interests. The application Study 7 was based on information obtained from 106 university faculty and staff. Validity: Extensive evidence of validity is summarized by Bearden et al. (2001). As part of this evidence, estimated correlations from data obtained in Studies 1 and 2 with related constructs (e.g., self-esteem, susceptibility to normative influence, product specific self-confidence, information processing confidence) are described. Tests for impression management, as well as tests of relative predictive validity, are also presented. From Study 4, test-retest correlations ranged from 0.60 to 0.84 across the six dimensions. Evidence of convergent validity was provided in Study 4 from correlations with single-item self-rating scales (Bagozzi 1993). Additional evidence of convergent validity was obtained in Study 5. Specifically, correlations reflecting convergence of husband and wife responses using dyadic data from pairs of husbands and wives ranged from 0.24 to 0.63 across the six dimensions reported. Evidence of known group validity was provided by comparisons of mean scores from a Chapter 2 Traits and Individual Difference Variables 19 sample of the American Council on Consumer Interests to the adult Study 1 and Study 2 samples. The relative predictive validity, as well as the ability of the measures to moderate theoretical relationships (i.e., between price-quality schema and choice), were demonstrated in Study 7. Scores: From Study 6, summed mean scores were reported in the known group comparisons. For the decision-making higher order factor, the mean scores for the American Council on Consumer Interests and adult Study 1 sample, the means were 83.72 and 78.32, respectively. Corresponding means for the protection higher order factor were 49.08 and 44.96. Source: Bearden, William O., David M. Hardesty, and Randall L. Rose (2001), “Consumer SelfConfidence: Refinements in Conceptualization and Measurement,” Journal of Consumer Research, 28 (June), 121–34. Reference: Bagozzi, Richard P. (1993), “Assessing Construct Validity in Personality Research: Applications to Measures of Self-Esteem,” Journal of Research in Personality, 27 (March), 49–87. 20 HANDBOOK OF MARKETING SCALES Consumer Self-Confidence: CSC (Bearden, Hardesty, and Rose 2001) Information Acquisition (IA) 1. I know where to find the information I need prior to making a purchase. 2. I know where to look to find the product information I need. 3. I am confident in my ability to research important purchases. 4. I know the right questions to ask when shopping. 5. I have the skills required to obtain needed information before making important purchases. Consideration-Set Formation (CSF) 1. I am confident in my ability to recognize a brand worth considering. 2. I can tell which brands meet my expectations. 3. I trust my own judgment when deciding which brands to consider. 4. I know which stores to shop. 5. I can focus easily on a few good brands when making a decision. Personal Outcomes Decision Making (PO) 1. I often have doubts about the purchase decisions I make. 2. I frequently agonize over what to buy. 3. I often wonder if I’ve made the right purchase selection. 4. I never seem to buy the right thing for me. 5. Too often, the things I buy are not satisfying. Social Outcomes Decision Making (SO) 1. My friends are impressed with my ability to make satisfying purchases. 2. I impress people with the purchases I make. 3. My neighbors admire my decorating ability. 4. I have the ability to give good presents. 5. I get compliments from others on my purchase decisions. Persuasion Knowledge (PK) 1. I know when an offer is “too good to be true.” 2. I can tell when an offer has strings attached. 3. I have no trouble understanding the bargaining tactics used by salespersons. 4. I know when a marketer is pressuring me to buy. Chapter 2 Traits and Individual Difference Variables 21 5. I can see through sales gimmicks used to get consumers to buy. 6. I can separate fact from fantasy in advertising. Marketplace Interfaces (MI) 1. I am afraid to ask “to speak to the manager.” 2. I don’t like to tell a salesperson something is wrong in the store. 3. I have a hard time saying no to a salesperson. 4. I am too timid when problems arise while shopping. 5. I am hesitant to complain when shopping. Notes: Participants were asked to rate the extent to which each of the scale items was characteristic of them on a 5-point scale labeled 1 = extremely uncharacteristic, 2 = somewhat uncharacteristic, 3 = uncertain, 4 = somewhat characteristic, and 5 = extremely characteristic. 22 HANDBOOK OF MARKETING SCALES Interpersonal Orientation: CAD Scale (Cohen 1967) Construct: The CAD scale is designed to measure a person’s interpersonal orientation. The instrument was derived from Horney’s (1945) tripartite model. Specifically, the scale is designed to assess compliant, aggressive, and detached interpersonal orientations. Compliant oriented persons are those who desire to be a part of the activities of others (i.e., who move toward others). Aggressive persons are those who want to excel, to achieve success, prestige, and admiration. Detached individuals desire to put emotional distance between themselves and others (i.e., they move away from others) (Cohen 1967, pp. 270–71). The impetus for the scale is based on the expected effects of varying interpersonal orientations on consumer decision making. Description: The scale consists of 35 items each operationalized using 6-point scales labeled extremely undesirable to extremely desirable. Ten items each are used to represent the compliant and detached factors. The remaining 15 items reflect the aggressive dimension. Total scores for each subscale are formed by summing item scores within each dimension. Development: The exact procedures used to develop the initial set of items were not described in Cohen (1967). However, a number of separate analyses were conducted in evaluation of the 35-item, three-factor scale. In support of the measures, seven expert judges agreed that the items demonstrated face validity and reflected their respective dimensions. Several tests for evidence of convergent and predictive validity were performed. Samples: A series of different undergraduate and graduate student samples was used in the initial development and validation of the CAD scales. For example, the final validation efforts involving the study of a wide range of consumer decisions were based on the responses of 157 undergraduate business students. Validity: Evidence of convergent validity was provided by correlations of the CAD scale with measures of occupational interpersonal relations. For example, the correlation between the compliant CAD factor and the occupational interpersonal compliant factor was 0.48 (p < 0.01). As predicted, less aggressive and more compliant subjects exhibited greater “change” in a study of susceptibility to interpersonal influence (Cohen 1967, p. 273). In addition to the validity evidence cited above, the CAD scale factors were further examined for differences across a number of product and brand purchase decisions. The results indicate that “some products and brands appear to express either compliant, aggressive, or detached responses to life” (Cohen 1967, p. 277). Some of the specific findings include the following: High aggressives exhibited differential brand preferences for deodorant, beer, and dress shirts. Both high and low aggressive and high and low detached students differed in their television viewing preferences. Scores: Cohen (1967) reports a series of mean scores for each factor. However, in his Appendix, it is noted that “Studies reported in this article have used an earlier 4-point response format” (Cohen 1967, p. 277). Hence, mean scores from the original article are not reproduced here since the final version reported by Cohen (1967) recommends a wider 6-point response format. Source: Cohen, Joel B. (1967), “An Interpersonal Orientation to the Study of Consumer Behavior,” Journal of Marketing Research, 4, 270–78. 1967 by the American Marketing Association. Scale items taken from p. 277. Reprinted with permission from the American Marketing Association. Chapter 2 Traits and Individual Difference Variables 23 Other evidence: A number of studies have either employed or reevaluated the CAD scale(s). Three of these are cited below. Ryan and Becherer (1976) reported internal consistency reliability estimates for the three factors as follows: compliant, 0.72; aggressive, 0.68; and detached, 0.51. Though the results of a factor analysis with varimax rotation produced a four-factor solution, most of the items did load on three factors that appeared to represent aggressive, compliant, and detached orientations. In addition, these were the first three factors of the four-factor solution. Tyagi (1983) reported coefficient alpha estimates of internal consistency of 0.72, 0.62, and 0.63 for the compliant, aggressive, and detached factors, respectively. Intercorrelations among the three factors ranged from –0.31 to 0.25. The results of an MTMM analysis using measures of nurturance, aggression, and autonomy provided mixed but generally positive support for the convergent and discriminant validity of the measures. Noerager (1979) provided less supportive results. Specifically, the coefficient alpha estimates of internal consistency reliability for the compliant, aggressive, and detached factors were 0.60, 0.36, and 0.43, respectively. The results of a factor analysis of the 35 items did not reveal a pattern of simple structure along the lines predicted by the theoretical justification for the measures (i.e., a three-factor model). Other sources: Noerager, Jon P. (1979), “An Assessment of CAD: A Personality Instrument Developed Specifically for Marketing Research,” Journal of Marketing Research, 16, 53–9. Ryan, Michael J. and Richard C. Becherer (1976), “A Multivariate Test of CAD Instrument Construct Validity,” in Advances in Consumer Research, Vol. 3, ed. Beverly B. Anderson, Cincinnati, OH: Association for Consumer Research, pp. 149–54. Tyagi, Pradeep K. (1983), “Validation of the CAD Instrument: A Replication,” in Advances in Consumer Research, Vol. 10, eds. Richard P. Bagozzi and Alice M. Tybout, Ann Arbor, MI: Association for Consumer Research, pp. 112–14. Reference: Horney, Karen (1945), Our Inner Conflicts, New York: W. W. Norton. 24 HANDBOOK OF MARKETING SCALES Interpersonal Orientation: CAD Scale (Cohen 1967) 1. Being free of emotional ties with others is: 2. Giving comfort to those in need of friends is: 3. The knowledge that most people would be fond of me at all times would be: 4. To refuse to give in to others in an argument seems: 5. Enjoying a good movie by myself is: 6. For me to pay little attention to what others think of me seems: 7. For me to be able to own an item before most of my friends are able to buy it would be: 8. Knowing that others are somewhat envious of me is: 9. To feel that I like everyone I know would be: 10. To be able to work hard while others elsewhere are having fun is: 11. Using pull to get ahead would be: 12. For me to have enough money or power to impress self-styled “big-shots” would be: 13. Basing my life on duty to others is: 14. To be able to work under tension would be: 15. If I could live all alone in a cabin in the woods or mountains it would be: 16. Pushing those who insult my honor is: 17. To give aid to the poor and underprivileged is: 18. Standing in the way of people who are too sure of themselves is: 19. Being free of social obligations is: 20. To have something good to say about everybody seems: 21. Telling a waiter when you have received inferior food is: 22. Planning to get along without others is: 23. To be able to spot and exploit weaknesses in others is: 24. A strong desire to surpass others’ achievements seems: 25. Sharing my personal feelings with others would be: 26. To have the ability to blame others for their mistakes is: 27. For me to avoid situations where others can influence me would be: 28. Wanting to repay others’ thoughtless actions with friendship is: 29. Having to compete with others for various rewards is: Chapter 2 Traits and Individual Difference Variables 30. If I knew that others paid very little attention to my affairs it would be: 31. To defend my rights by force would be: 32. Putting myself out to be considerate to others’ feelings is: 33. Correcting people who express an ignorant belief is: 34. For me to work alone would be: 35. To be fair to people who do things which I consider wrong seems: Notes: The items belonging to the factors are arranged as follows: Compliant: 2, 3, 9, 13, 17, 20, 25, 28, 32, 35; Aggressive: 4, 7, 8, 11, 12, 14, 16, 18, 21, 23, 24, 26, 29, 31, 33; Detached: 1, 5, 6, 10, 15, 19, 22, 27, 30, 34. Items scored on 6-point Likert type scales from (1) extremely undesirable to (6) extremely desirable. 25 26 HANDBOOK OF MARKETING SCALES Long-Term Orientation: LTO (Bearden, Money, and Nevins 2006) Construct: Long-term orientation (LTO) is defined by Bearden et al. (2006, p. 457) in their research as the cultural value of viewing time holistically, valuing both the past and the future rather than deeming actions important only for their effects in the here-and-now or the short term. Individuals scoring high in LTO value planning, tradition, hard work, and perseverance (Bearden et al. 2006). Description: The scale comprises eight items designed to assess tradition (four items) and planning (four items) dimensions of long-term orientation. Participants rated agreement with the eight statements using seven-point, bipolar, agree–disagree scales. Average item scores can be used to operationalize the tradition and planning dimensions of LTO. Development: An initial pool of 59 items was generated from 292 responses from MBA graduates of a nationally known international business program. These statements were supplemented with items from similar measures used in prior research involving cultural values. The pool of items was edited to delete double-barrel, redundant, ambiguous, and misleading statements. Marketing faculty members in the Global Sig of the AMA were used to judge items against a general definition of national culture. This process resulted in nine remaining LTO items. Study 1 data across the four country convenience samples were subjected to a series of factor analysis procedures. The results of these analyses revealed eight items, with four items each across the planning and tradition LTO factors. The average coefficient alpha estimates of reliability across the four samples were 0.77 and 0.60 for the tradition and planning factors, respectively. The intercorrelations between the two factors ranged from 0.28 to 0.44 across the four country samples. Samples: Four convenience samples of undergraduate business students were used in Study 1: Argentina (n = 311), Austria (n = 407), Japan (n = 360), and the United States (n = 408). Study 2 involved two convenience adult samples from Japan (n = 253) and the United States (n = 339). Studies 3 and 4 were based on the responses of 30 nonstudent adults (test-retest) and 38 student-nonstudent dyads (convergent validity), respectively. Studies 5 and 6 comprised information obtained from a convenience sample of 54 undergraduate business students (Study 5) and 73 MBA students (Study 6). Validity: The eight items were reexamined using data from the two-country Study 2. Confirmatory factor analyses confirmed the two-factor structure, as well as offering evidence of construct validity. Coefficient alpha estimates of reliability for the United States (Japanese) samples were 0.83 (0.78) and 0.71 (0.62) for the tradition and planning factors. Evidence of measurement equivalence across countries and samples are also provided from the data for both Study 1 and Study 2. Evidence of convergent validity from comparison singleitem measures, as well as known group validity (i.e., younger student groups vs. older adult samples), is also reported as part of the results for studies 1 and 2. In Study 3, testretest correlations across 3-week administrations were 0.78 and 0.69 for the tradition and planning subscales, respectively. MTMM procedures employing dyadic data were used to generate additional evidence of convergent validity (see Table 4, Bearden et al. 2006, p. 462). In Study 5, the LTO planning measure moderated as predicted the relationship between consumer frugality and the number of credit cards owned. In Study 6, a scenariobased managerial study, the results demonstrated predictive validity through correlations with a complex decision outcome measure. Last, additional evidence of validity was provided through a series of path analyses in which the two planning factors were found to Chapter 2 Traits and Individual Difference Variables 27 be related as hypothesized to measures of consumer frugality (Lastovicka et al. 1999), compulsive buying (Valence, d’Astous, and Fortier 1988), and personal ethics (Vitell, Rallapalli, and Singhapakdi 1993). Scores: Mean scores were not reported directly. However, predicted differences in means were observed in a series of known group comparisons between younger and older respondents and United States versus Japanese respondents. Source: Bearden, William O., R. Bruce Money, and Jennifer L. Nevins (2006), “A Measure of Long-Term Orientation: Development and Validation,” Journal of the Academy of Marketing Science, 34 (June), 456–67. References: Lastovicka, John L., Lance A. Bettencourt, Renee Shaw Hughner, and Ronald J. Kuntze (1999), “Lifestyle of the Tight and Frugal: Theory and Measurement,” Journal of Consumer Research, 26 (June), 85–98. Valence, Giles, Alain d’Astous, and Louis Fortier (1988), “Compulsive Buying: Concept and Measurement,” Journal of Consumer Policy, 11 (4), 419–33. Vitell, Scott J., Kumar C. Rallapalli, and Anusorn Singhapakdi (1993), “Marketing Norms: The Influence of Personal Moral Philosophies and Organizational Ethical Culture,” Journal of the Academy of Marketing Science, 21, 331–37. 28 HANDBOOK OF MARKETING SCALES Long-Term Orientation: LTO (Bearden, Money, and Nevins 2006) 1. Respect for tradition is important to me. 2. I plan for the long term. 3. Family heritage is important to me. 4. I value a strong link to my past. 5. I work hard for success in the future. 6. I don’t mind giving up today’s fun for success in the future. 7. Traditional values are important to me. 8. Persistence is important to me. Notes: Items 1, 3, 4, and 7 reflect tradition aspects of LTO, while items 2, 5, 6, and 8 reflect the planning dimension of LTO. Participants rated agreement with the statements using seven-point, bipolar, agree–disagree scales. Chapter 2 Traits and Individual Difference Variables 29 Maximization (Schwartz et al. 2002; Nenkov et al. 2008) Construct: While humans have been viewed as trying to maximize or optimize outcomes in any given decision scenario, the complexities of life and the limitations of information processing make maximization unattainable. Therefore, in many choice situations, consumers have the goal of satisficing rather than maximizing, which entails choosing an option that surpasses a threshold of acceptability. In other words, satisficing involves pursuing a good enough option rather than the best option. The emphasis on maximizing versus satisficing in choice situations is demonstrated to be an individual difference among people. Description: Schwartz et al. (2002) developed the Maximization Scale and a Regret Scale, and Nenkov et al. (2008) recommend a shortened version of the Maximization Scale. Responses are based on a 7-point Likert-type scale where 1 = completely disagree and 7 = completely agree. The Maximization Scale has three dimensions, including Alternative Search, Decision Difficulty, and High Standards, and each dimension can be viewed as an average score of the relevant items. Development: For Schwartz et al.’s (2002) original scales, 42 items were initially generated to measure maximization (33 items) and regret (9 items). Based on assessments of reliability and face validity from Sample 1 data, the item set was reduced to 22. These 22 items were assessed by a panel of 11 expert judges, and all were judged to have face validity (17 for maximization and 5 for regret). Principal component factor analysis of Samples 1 through 7 (n = 1,747) was used to examine the items. This process led to the elimination of more items, leaving a final set of 13 maximization and 5 regret items. These 18 items loaded on four different factors—the regret factor, choice difficulty, difficulty with a large option set, and high standards. More formal examination of the factor structure of maximization, as well as a shortened scale, was provided by Nenkov et al. (2008). The six-item version of the Maximization Scale was developed by reanalyzing previous data sets and choosing the items that perform best in a series of tests of reliability and validity. This set was also verified in new samples. Samples: Seven samples were used both independently and collectively to establish the Maximization and Regret Scales (Schwartz et al. 2002). Samples 1 through 4 consisted of undergraduate students, with sample sizes of 82, 72, 100, and 401, respectively. Sample 5 (n = 752) contained health care professionals, Sample 6 respondents (n = 220) were passengers waiting at an urban bus station, and Sample 7 (n = 120) consisted of individuals awaiting jury duty. Nenkov et al. (2008) use the samples from Schwartz et al. as well as new samples to test the validity of the shortened form of the Maximization Scale. Validity: Coefficient alphas across the combined Samples 1 through 7 was 0.71 for maximization and 0.67 for regret. Other analyses demonstrated the validity of the Maximization and Regret Scales. Being a maximizer was related to a tendency to experience more regret and depression, be less optimistic and happy, and be more sensitive to information about social comparison. Although three factors were suggested, no formal validation of the three-factor structure was provided. Further studies examined various outcomes of maximization, providing evidence of its validity. Nenkov and colleagues (2008), including some of the original authors of the 13-item Maximization Scale, demonstrate that a condensed, 6-item version of the Maximization Scale actually outperforms the original 13-item measure. Results from both existing and new data sets showed that the three-factor structure of maximization was not always 30 HANDBOOK OF MARKETING SCALES supported, although three factors typically emerged and were labeled as Alternative Search, Decision Difficulty, and High Standards. Coefficient alphas for the 13-item scale ranged from 0.54 to 0.75. Confirmatory factor analysis revealed several problematic items in terms of low factor loadings. Further analysis was used to develop and evaluate three-, six-, and nine-item versions of the scale, and confirmatory factor analysis suggested that a six-item scale provided the best fit to the data. Coefficient alphas for the six-item version ranged from 0.36 to 0.60 across the samples and varied the most of the Alternate Search dimension (0.22 to 0.58). Additional samples verified that the six-item scale maintained the three-factor structure of the longer scale while possessing superior model fit. Further, the pattern of correlations between the six-item scale and other related constructs previously tested by Schwartz et al. (2002) were as expected. As such, the six-item scale is recommended for future use. Scores: Across the seven samples in Schwartz et al. (2002), maximization scores ranged from 1.15 to 6.62 with a mean of 3.88. Evidence was mixed regarding gender differences in maximization with Samples 1 through 3 and 5 showing no association, and Samples 4, 6, and 7 showing that males were more likely to be maximizers than females (e.g., 4.33 vs. 3.91 in Sample 7). Sources: Schwartz, Barry, Andrew Ward, John Monterosso, Sonja Lyubomirsky, Katherine White, and Darrin R. Lehman (2002), “Maximizing Versus Satisficing: Happiness Is a Matter of Choice,” Journal of Personality and Social Psychology, 83 (5), 1178–97. Nenkov, Gergana Y., Maureen Morrin, Andrew Ward, Barry Schwartz, and John Hulland (2008), “A Short Form of the Maximization Scale: Factor Structure, Reliability, and Validity Studies,” Judgment and Decision Making, 3 (5), 371–88. Chapter 2 Traits and Individual Difference Variables 31 Maximization (Schwartz et al. 2002; Nenkov et al. 2008) Maximization Alternative Search 1. When I watch TV, I channel surf, often scanning through the available options even while attempting to watch one program. 2. When I am in the car listening to the radio, I often check other stations to see if something better is playing, even if I’m relatively satisfied with what I’m listening to.* 3. I treat relationships like clothing: I expect to try a lot on before I get the perfect fit. 4. No matter how satisfied I am with my job, it’s only right for me to be on the lookout for better opportunities.* 5. I often fantasize about living in ways that are quite different from my actual life. 6. I’m a big fan of lists that attempt to rank things (the best movies, the best singers, the best athletes, the best novels, etc.) Decision Difficulty 1. I often find it difficult to shop for a gift for a friend.* 2. When shopping, I have a hard time finding clothing that I really love. 3. Renting videos is really difficult. I’m always struggling to pick the best one.* 4. I find that writing is very difficult, even if it’s just writing a letter to a friend, because it’s so hard to word things just right. I often do several drafts of even simple things. High Standards 1. No matter what I do, I have the highest standards for myself.* 2. I never settle for second best.* 3. Whenever I’m faced with a choice, I try to imagine what all the other possibilities are, even ones that aren’t present at the moment. Notes: *indicates items included in the recommended six-item, shortened Maximization Scale. Responses are based on a 7-point Likert-type scale where 1 = completely disagree and 7 = completely agree. Regret 1. Whenever I make a choice, I’m curious about what would have happened if I had chosen differently. 2. Whenever I make a choice, I try to get information about how the other alternatives turned out. 3. If I make a choice and it turns out well, I still feel like something of a failure if I find out that another choice would have turned out better. 4. When I think about how I’m doing in life, I often assess opportunities I have passed up. 5. Once I made a decision, I don’t look back. (Reverse scored) 32 HANDBOOK OF MARKETING SCALES Need for Cognition: NFC (Cacioppo and Petty 1982) Construct: Need for cognition (NFC) represents the tendency for individuals to engage in and enjoy thinking (Cacioppo and Petty 1982). Cohen, Stotland, and Wolfe (1955) originally described the need for cognition as a need to structure relevant situations in meaningful, integrated ways and a need to understand and make reasonable the experiential world. The scale has been frequently used in consumer research in examining the effects of persuasive arguments. Among these applications, the concept has been shown to be useful in understanding how argument strength and endorser attractiveness in advertisements may influence consumer attitudes (e.g., individuals high in need for cognition are more influenced by the quality of arguments in an advertisement) (Haugtvedt et al. 1988). In addition, it has been shown that individuals low in need for cognition react to the simple presence of a price promotion signal whether or not the price of the promoted brand is reduced (Inman, McAlister, and Hoyer 1990). Description: The original scale is composed of 34 items each scored –4 to +4 as follows: +4, very strong agreement; +3, strong agreement; +2, moderate agreement; +1, slight agreement; 0, neither agreement nor disagreement; –1, slight disagreement; –2, moderate disagreement; –3, strong disagreement; and –4, very strong disagreement. An 18-item short form for assessing need for cognition has been proposed by Cacioppo, Petty, and Kao (1984). The items included in both versions are presented here. Some of the items are varied in direction to inhibit response bias. Item scores are summed for an overall index. Development: An unspecified pool of items was edited (i.e., deleted or revised) for ambiguity. The remaining pool of 45 items was administered to the faculty of a large midwestern university (i.e., a high need for cognition group) and a group of factory line workers from the same community (Cacioppo and Petty 1982, p. 118). The initial sample (combining both groups) included a total of 96 respondents; 84 of the respondents were included in these initial analyses. A series of 2 x 2 (gender by high and low cognition; i.e., gender by faculty/factory line worker) analysis of variance tests were used to delete items that did not discriminate between the high and low groups. Tests for the overall sum for the initial 45 items and the final 34 items revealed a significant main effect for need for cognition but nonsignificant effects for gender and the interaction. Remaining items that failed to correlate significantly with the total score were also eliminated. Samples: As explained above, 84 university professors and factory workers were used in the Study 1 development of the 34-item NFC measure. The sample was composed of approximately equal numbers of males and females. Participants in Study 2 were 419 introductory psychology students. Study 3 involved 104 (35 males and 69 females) students from the University of Iowa, and 97 student subjects participated in Study 4. Validity: A single dominant factor from a principal components analysis was interpreted as support for a unidimensional scale composed of 34 items. The correlation between factor loadings in Studies 1 and 2 was 0.76 (n = 34, p = 0.01). Multiple sources of validity evidence are described in Cacioppo and Petty (1982). For example, evidence of discriminant validity was found in Study 2 from low correlations with measures of cognitive style and test anxiety. In Study 3, correlations with intelligence (r = 0.39), social desirability (r = 0.08), and dogmatism (r = –0.27) were provided as evidence of the scale’s validity. In Study 4, a significant hypothesized interaction revealed that high NFC subjects reported enjoying a complex task more than a simple task, while low NFC subjects enjoyed a simple task more than a complex task. Also in Study 4, a modest negative Chapter 2 Traits and Individual Difference Variables 33 correlation with dogmatism was found (r = –0.23); however, a significant correlation with a measure of social desirability was revealed (r = 0.21). Scores: Means and standard deviations were not provided in the cited manuscripts. Source: Cacioppo, John T. and Richard E. Petty (1982), “The Need for Cognition,” Journal of Personality and Social Psychology, 42 (1), 116–31. 1982 by the American Psychological Association. Scale items taken from Table 1 (pp. 120–21). Reprinted with permission. Other evidence: In the development of the short form, Cacioppo et al. (1984) reported coefficient alpha estimates of internal consistency reliability of 0.90 and 0.91 for the 18-item and 34-item versions, respectively. Substantial evidence of the validity of the construct and the measures described here has been provided by a number of studies which have successfully used the Cacioppo and Petty (1982) need for cognition scale. As recent examples, the two studies by Haugtvedt et al. (1988) showed, as predicted from the theory underlying the construct, that individuals high in need for cognition were more influenced by the quality of arguments in advertisements and that individuals low in NFC were influenced more by the peripheral cue endorser attractiveness. Similarly, Inman et al. (1990) used the NFC measure to successfully predict the effects of price signals (i.e., price messages without actual price information). Wood and Swait (2002) offer a five-item version of NFC. Other sources: Cacioppo, John T., Richard E. Petty, and Kao Feng Chuan (1984), “The Efficient Assessment of Need for Cognition,” Journal of Personality Assessment, 48 (3), 306–7. Haugtvedt, Curt, Richard E. Petty, John T. Cacioppo, and Theresa Steidley (1988), “Personality and Ad Effectiveness: Exploring the Utility of Need for Cognition,” in Advances in Consumer Research, Vol. 15, ed. Michael J. Houston, Provo, UT: Association for Consumer Research, pp. 209–12. Inman, J. Jeffrey, Leigh McAlister, and Wayne D. Hoyer (1990), “Promotion Signal: Proxy for a Price Cut,” Journal of Consumer Research, 17 (June), 74–81. Wood, Stacy L. and Joffre Swait (2002), “Psychological Indicators of Innovation Adoption: Cross-Classification Based on Need for Cognition and Need for Change,” Journal of Consumer Psychology, 12 (January), 1–13. References: Cohen, Arthur R., Ezra Stotland, and Donald M. Wolfe (1955), “An Experimental Investigation of Need for Cognition,” Journal of Abnormal and Social Psychology, 51, 291–94. Epstein, Seymour, Rosemary Pacini, Veronika Denes-Raj, and Harriet Heier (1996), “Individual Differences in Intuitive-Experiential and Analytical-Rational Thinking Styles,” Journal of Personality and Social Psychology, 71 (2), 390–505. 34 HANDBOOK OF MARKETING SCALES Need for Cognition: NFC (Cacioppo and Petty 1982) 1. I really enjoy a task that involves coming up with solutions to problems. (b) 2. I would prefer a task that is intellectual, difficult, and important to one that is somewhat important but does not require much thought. (b) 3. I tend to set goals that can be accomplished only by expending considerable mental effort. 4. I am usually tempted to put more thought into a task than the job minimally requires. 5. Learning new ways to think doesn’t excite me very much. (a, b) 6. I am hesitant about making important decisions after thinking about them. (a) 7. I usually end up deliberating about issues even when they do not affect me personally. (b) 8. I prefer to let things happen rather than try to understand why they turned out that way. (a) 9. I have difficulty in thinking in new and unfamiliar situations. (a) 10. The idea of relying on thought to get my way to the top does not appeal to me. (a, b) 11. The notion of thinking abstractly is not appealing to me. (a, b) 12. I am an intellectual. 13. I only think as hard as I have to. (a, b) 14. I don’t reason well under pressure. (a) 15. 1 like tasks that require little thought once I’ve learned them. (a, b) 16. I prefer to think about small daily projects to long-term ones. (a, b) 17. I would rather do something that requires little thought than something that is sure to challenge my thinking abilities. (b) 18. I find little satisfaction in deliberating hard and for long hours. (a, b) 19. I more often talk with other people about the reasons for and possible solutions to international problems than about gossip of tidbits of what famous people are doing. 20. These days, I see little chance for performing well, even in “intellectual” jobs, unless one knows the right people. (a) 21. More often than not, more thinking just leads to more errors. (a) 22. I don’t like to have the responsibility of handling a situation that requires a lot of thinking. (a, b) 23. I appreciate opportunities to discover the strengths and weaknesses of my own reasoning. 24. I feel relief rather than satisfaction after completing a task that required a lot of mental effort. (a, b) 25. Thinking is not my idea of fun. (a, b) 26. I try to anticipate and avoid situations where there is a likely chance I’ll have to think in depth about something. (a, b) Chapter 2 Traits and Individual Difference Variables 35 27. I prefer watching educational to entertainment programs. 28. I think best when those around me are very intelligent. 29. I prefer my life to be filled with puzzles that I must solve. (b) 30. I would prefer complex to simple problems. (b) 31. Simply knowing the answer rather than understanding the reasons or the answer to a problem is fine with me. (a) 32. It’s enough for me that something gets the job done, I don’t care how or why it works. (a, b) 33. Ignorance is bliss. (a) 34. I enjoy thinking about an issue even when the results of my thoughts will have no outcome on the issue. Notes: “a” denotes items requiring reverse scoring; “b” denotes items included in the short form; “c” indicates an item in the 5-item short form offered by Wood and Swait (2002). There were slight wording variations for some items in both versions. Items scored –4 to +4 as follows: +4, very strong agreement; +3, strong agreement; +2, moderate agreement; +1, slight agreement; 0, neither agreement nor disagreement; −1, slight disagreement; −2, moderate disagreement; −3, strong disagreement; and –4, very strong disagreement. 36 HANDBOOK OF MARKETING SCALES Need to Evaluate: NES (Jarvis and Petty 1996) Construct: Evaluation is defined as the assessment of the positive and/or negative qualities of an object. The need to evaluate is assumed to be one of the most pervasive and dominant of human responses. In accordance with this view, Jarvis and Petty (1996, p. 172) view the need to evaluate as the chronic tendency for individuals to engage in evaluative responding. Furthermore, the need to evaluate is believed to be an individual difference variable that affects, and is affected by, numerous socially based attitudes. Thus, the Need to Evaluate Scale (NES) assesses individual differences in the propensity to engage in evaluation. Description: The NES is composed of 16 items scored on 5-point scales where 1 = extremely uncharacteristic, 2 = somewhat characteristic, 3 = uncertain, 4 = somewhat characteristic, and 5 = extremely characteristic. Item scores are summed to form an overall NES score that can range from 16 to 80. The NES is considered a single-factor, unidimensional measure. Development: Numerous recommended scaling procedures were used to derive the final form of the scale and to test for reliability and construct validity. Five studies encompassing numerous samples were used. After generating 46 initial items to reflect the construct, the 16item NES was derived via inspection of item-to-total correlations, intercorrelations among items, item mean (standard deviation) scores, and face validity from four pilot studies. Study 1 then examined the structure and internal consistency of the NES via principal and confirmatory factor analyses, item analyses, and coefficient alpha. Study 2 examined the validity of the NES by correlating it with related constructs. Study 3 looked at the NES’s relation to social and political attitudes, and Study 4 examined the relation to “spontaneous evaluative thoughts.” Finally, Study 5 examined the validity of the NES within the context of recalling “autobiographical narratives” from the previous day. All in all, consistent evidence for the dimensionality, internal consistency, and validity of the NES was found. Samples: The “pilot” studies were composed of n = 357 undergraduate psychology students. Three samples of n = 131, n = 160, and n = 266 (all undergraduate psychology students) were used in Study 1. Study 2 used n = 600 students, Study 3 used n = 52 students; Study 4 used n = 35 students (females only), and Study 5 used n = 93 students. Validity: By comparing four different factor structures, including two structures that included the presence of “methods” factors, it was determined that the NES could be reasonably represented by a single, unidimensional 16-item factor (although a two-factor solution offered a better “fit” to the data). (See “Notes” to actual scale items below.) For the three samples of Study 1, coefficient alphas ranged from 0.82 to 0.87 for the 16-item NES. Test-retest reliability for a subsample of n = 70 over a 10-week period was 0.84. For Study 2, the coefficient alpha estimate of the NES was 0.84. As evidence of discriminant validity, the NES was correlated with nine other constructs and a measure of social desirability. The correlations between the NES and affective intensity, desire for control, and need for cognition were 0.17, 0.22, and 0.35 (p < 0.05), respectively. All other correlations were not significant. In support of predictive validity, regression analyses in Study 2 showed significant relations with attitudes toward social and political issues. Finally, Studies 4 and 5 showed that actual evaluative responding behavior could be predicted by NES scores. Chapter 2 Traits and Individual Difference Variables 37 Scores: Mean scores were consistently reported by male and female subsamples. For the most part, men scored slightly higher on the NES than did women; however, some of these differences were not significant. Some of the mean scores were 53.21 and 51.05, and 53.20 and 51.05, for males and females, respectively, from Study 1. For Study 2, the mean NES score was 52.80 for males and 50.88 for females (p < 0.05). Study 3 reported an overall mean score of 53.0, and Study 4 reported an overall mean of 53.6. Individual item means were also reported. Also, the NES was split at the median, or tertiary splits were used, to create high/low or high/medium/low NES groups for purposes of analysis. Source: Jarvis, W. Blair G. and Richard E. Petty (1996), “The Need to Evaluate,” Journal of Personality and Social Psychology, 70 (1), 172–94. 1996 by the American Psychological Association. Scale items taken from Table 1 (p. 176). Reprinted with permission. 38 HANDBOOK OF MARKETING SCALES Need to Evaluate: NES (Jarvis and Petty 1996) 1. I form opinions about everything. 2. I prefer to avoid taking extreme opinions. 3. It is very important to me to hold strong opinions. 4. I want to know exactly what is good and bad about everything. 5. I often prefer to remain neutral about complex issues. 6. If something does not affect me, I do not usually determine if it is good or bad. 7. I enjoy strongly liking and disliking new things. 8. There are many things for which I do not have a preference. 9. It bothers me to remain neutral. 10. I like to have strong opinions even when I am not personally involved. 11. I have many more opinions than the average person. 12. I would rather have a strong opinion than no opinion at all. 13. I pay a lot of attention to whether things are good or bad. 14. I only form strong opinions when I have to. 15. I like to decide that new things are really good or really bad. 16. I am pretty much indifferent to many important issues. Notes: Items 2, 5, 6, 8, 9, 14, and 16 require reverse scoring and were labeled as a NEVAL(–) or “Preference for Neutrality” factor in a two-factor solution. The remaining items were labeled as a NEVAL(+) or “Need to Evaluate” factor in a two-factor solution. Items scored on 5-point scales where 1 = extremely uncharacteristic, 2 = somewhat uncharacteristic, 3 = uncertain, 4 = somewhat characteristic, and 5 = extremely characteristic Chapter 2 Traits and Individual Difference Variables 39 Need for Touch: NFT (Peck and Childers 2003) Construct: Need for touch (NFT) is defined as “a preference for the extraction and utilization of information obtained through the haptic system” (Peck and Childers 2003, p. 431). NFT is considered a motivational-based construct, rather than an ability-based construct, and comprises two dimensions or factors: 1) an instrumental factor reflecting aspects of prepurchase touch with a salient purchase goal and 2) an autotelic factor that views touch as an end unto itself, hedonic in nature (i.e., touching is fun, sensory stimulating, arousing, and enjoyable). Description: As noted above, NFT is a two-factor scale. Both factors, instrumental and autotelic, comprise six items each, scored on –3 to +3 strongly disagree to strongly agree (7-point) scales. Item scores can be summed within factors to create separate instrumental and autotelic scores, or can be summed across all 12 items, creating an overall NFT score ranging from –36 to +36. Development: Using recommended scaling procedures, the authors conducted seven studies plus an initial item development/screening study to develop and validate the final form(s) of the NFT factors. With the initial item development/screening study, 135 undergraduate students were given conceptual definitions of NFT and its factors and were then asked to develop a pool of 50 items. Twelve more students then judged the items, trimming this pool down to 22 instrumental items and 18 autotelic items. Seven more studies, both survey and experimental, were then used to derive and validate the final-form NFT scale. Samples: Study 1, n = 135 undergraduate students; Study 2, n = 276 university staff members; Study 3, n = 555 university staff members; Study 4, n = 418 university students; Study 5, n = 175 undergraduate students; Study 6, n = 100 university students; and Study 7, n = 58 subjects. Validity: Studies 1 and 2 were used to further trim NFT items and purify the NFT scale. Initial estimates from these studies generally supported the hypothesized two-factor structure of instrumental and autotelic NFT. In Studies 3 and 4, the final 12-item scale, 6 for instrumental and 6 for autotelic, was derived. Confirmatory factor analyses (CFA) supported the two-factor structure of instrumental and autotelic NFT. Coefficient alpha estimates were 0.89 (autotelic) and 0.87 (instrumental). Average variance extracted estimates exceeded 0.70 for both factors, and the correlation among the two factors was 0.64. To assess convergent, discriminant, and nomological validity, the full 12-item NFT and its 6-item factors were modeled in a structural equations framework with the need for tactile input (NTI) scale, need for cognition (NFC), need to evaluate (NTE), experiential shopping, impulse buying, catalogue purchasing, phone purchasing, Internet purchasing, and social desirability bias. The pattern of coefficients (Table 1, p. 433) suggests a valid NFT scale. For example, the overall NFT scale, the autotelic factor, and the instrumental factor showed beta coefficients of 0.75, 0.59, and 0.88, respectively, with NTI, offering evidence of convergent validity; the overall NFT scale, the autotelic factor, and the instrumental factor showed nonsignificant beta coefficients with NFC and NTE, supporting discriminant validity; and the overall NFT scale, the autotelic factor, and the instrumental factor showed mostly significant negative beta coefficients with purchasing from catalogues, phone, or Internet, offering evidence of nomological validity. The NFT and its factors were free of social desirability bias as well. 40 HANDBOOK OF MARKETING SCALES Studies 5, 6, and 7 were experiments that further demonstrated the validity of the NFT scale. In summary, and as predicted, Studies 5 and 6 showed that individuals high in NFT are more likely to chronically access haptic (touch) information than those low in NFT. Study 7 showed the hypothesized interaction between NFT and the opportunity to obtain haptic information through direct experience. Across these three studies, coefficient alpha for the overall NFT and its factors ranged from 0.89 to 0.95. Correlations among the instrumental and autotelic factors ranged from 0.63 to 0.74. Scores: Though scores on the overall 12-item NFT can range from –36 to +36, mean scores were not reported. In Study 5, a median score of 11.5 was reported for the overall NFT; in Study 6, median scores of 3 and 4 were reported for the autotelic and instrumental factors, respectively; and in Study 7, a median score of 1 for the overall NFT was reported based on summing and then averaging over all 12 items in the scale. Source: Peck, Joann and Terry L. Childers (2003), “Individual Differences in Haptic Information Processing: The ‘Need for Touch’ Scale,” Journal of Consumer Research, 30 (December), 430–42. Chapter 2 Traits and Individual Difference Variables Need for Touch: NFT (Peck and Childers 2003) Instrumental Factor Items 1. I place more trust in products that can be touched before purchase. 2. I feel more comfortable purchasing a product after physically examining it. 3. If I can’t touch a product in the store, I am reluctant to purchase the product. 4. I feel more confident making a purchase after touching a product. 5. The only way to make sure a product is worth buying is to actually touch it. 6. There are many products that I would only buy if I could handle them before purchase. Autotelic Factor Items 1. Walking through stores, I can’t help touching all kinds of products. 2. Touching products can be fun. 3. When browsing in stores, it is important for me to handle all kinds of products. 4. I like to touch products even if I have no intention of buying them. 5. When browsing in stores, I like to touch lots of products. 6. I find myself touching all kinds of products in stores. Notes: Items are scored on –3 to +3 strongly disagree to strongly agree (7-point) scales. 41 42 HANDBOOK OF MARKETING SCALES Consumer’s Need for Uniqueness: CNFU (Tian, Bearden, and Hunter 2001) Construct: Consumers’ need for uniqueness (CNFU) is defined as the trait of pursuing differentness relative to others through the acquisition, utilization, and disposition of consumer goods for the purpose of developing and enhancing one’s self-image and social image (Tian et al. 2001, p. 52). CNFU is conceptualized as consisting of three manifestations or dimensions: creative choice counterconformity, unpopular choice counterconformity, and avoidance of similarity. The latent structure is a higher-order factor model in which each of the three dimensions are first order factors that are collectively accounted for by a higher-order factor, CNFU (Tian et al. 2001, p. 54). Description: The measure consists of 31 items distributed as follows: creative choice counterconformity (11), unpopular choice counterconformity (11), and avoidance of similarity (9). Responses were provided on a 5-point (strongly agree to strongly disagree) Likert-type scale. Average item scores were used to develop an overall measure of CNFU. The items are interspersed throughout the scale, as shown in Table 1 (Tian et al. 2001). All the validation studies were designed to validate the overall CNFU measure rather than the three dimensions. Development: An initial pool of 93 items was developed from descriptions of unique individuals, exploratory qualitative data, and related measures (e.g., Snyder and Fromkin 1977). Two stages of judging for content validity were used: 1) allocations to the three categories (n = 5) and 2) representativeness of the items for the three factors (n = 4). Sixty-two items remained after the judging stages. The elimination of redundant items resulted in 15 items remaining per dimension. The student sample was used to refine the item set to the final group of 31 items. Items with corrected item-to-total correlations below 0.50 and with correlations higher with the other two factors than the item’s intended factor were deleted, leaving the final set of 31 items. The estimates of internal consistency reliability were 0.94 and 0.95 in the student and consumer mail samples, respectively. Using subsamples drawn from the consumer mail surveys (1 and 2 years later) revealed test-retest correlations 0.81 (n = 84) and 0.73 (n = 346), respectively. Samples: The first large sample comprises 273 undergraduate business students. A second large sample of 621 adult consumers was collected via mail survey after being pre-contacted by telephone. Tests of trait antecedents and situational moderators of consequential effects were based on a sample of 121 students. Tests of consequential effects were based on the responses of 235 students from two universities. A total of five known group comparison samples were also described: tattoo artists (n = 39), owners of low-rider autos (n = 22), members of a medievalist reenactment group (n = 21), student art majors (n = 22), and student purchasers of unique art (n = 78). Validity: The hypothesized factor structure was verified using the two large initial samples in a series of confirmatory factor models. As part of these analyses, measurement invariance tests supported the appropriateness of the three-factor structure. The correlations among the factors ranged from 0.56 to 0.67 in the adult mail survey. The evidence offered in support of the CNFU measure is extensive and is described in detail by Tian et al. (2001). The following examples are representative of the authors’ validation efforts. Using the adult and student samples for comparison, known group differences were examined in five different samples: tattoo artists (n = 39), owners of lowrider autos (n = 22), members of a medievalist reenactment group (n = 21), student art majors (n = 22) and student purchasers of unique art (n = 78). CNFU was not correlated Chapter 2 Traits and Individual Difference Variables 43 with measures of response bias (e.g., Paulhus 1993, r = 0.01). Evidence of discriminant validity was offered in a series of comparisons with NFU (Snyder and Fromkin 1977), as well as in tests of correlations with CNFU, NFU, and other measures. A large number of additional construct validity test results are summarized in Table 4 (Tian et al. 2001, p. 59). Tests of trait antecedents revealed that CNFU operates in the manner posited for counterconformity motivation, while competing trait measures do not. For example, CNFU exhibited a significantly stronger correlation with desire for unique consumer products. Likewise, CNFU correlated significantly and more strongly with the outcome measure of preferences for unique exterior product designs. Lastly, CNFU moderated relationships as predicted in several experiments in which the potential popularization of a differentiating offer was manipulated, as well as in an experiment in which a differentiating offer possessed a higher versus a lower price. Again, details regarding these antecedent, outcome, and moderator studies can be found in Tian et al. (2001). Scores: The mean score (standard deviation) for CNFU in the consumer mail survey sample (n = 621) was 2.60 (0.56), with a range of 1.06 to 4.55. Using the same data, CNFU was not related to education or gender but was negatively correlated with age (r = –0.19). Additional mean scores and standard deviations are presented for five known group comparisons in Table 3 (Tian et al. 2001, p. 58). Source: Tian, Kelly Tepper, William O. Bearden, and Gary L. Hunter (2001), “Consumers’ Need for Uniqueness: Scale Development and Validation,” Journal of Consumer Research, 28 (June), 50–66. References: Paulhus, Delroy L. (1993), “The Balanced Inventory of Desirable Responding: Reference Manual for the BIDR Version 6,” unpublished manuscript, University of British Columbia. Snyder, C. R. and Howard L. Fromkin (1977), “Abnormality as a Positive Characteristic: The Development and Validation of a Scale Measuring Need for Uniqueness,” Journal of Abnormal Psychology, 86 (October), 518–27. 44 HANDBOOK OF MARKETING SCALES Consumer’s Need for Uniqueness: CNFU (Tian, Bearden, and Hunter 2001) Creative Choice/Counterconformity 1. I collect unusual products as a way of telling people I’m different. 2. I have sometimes purchased unusual products or brands as a way to create a more distinctive personal image. 3. I often look for one-of-a-kind products or brands so that I create a style that is all my own. 4. Often when buying merchandise, an important goal is to find something that communicates my uniqueness. 5. I often combine possessions in such a way that I create a personal image for myself that can’t be duplicated. 6. I often try to find a more interesting version of run-of-the-mill products because I enjoy being original. 7. I actively seek to develop my personal uniqueness by buying special products or brands. 8. Having an eye for products that are interesting and unusual assists me in establishing a distinctive image. 9. The products and brands that I like best are the ones that express my individuality. 10. I often think of the things I buy and do in terms of how I can use them to shape a more unusual personal image. 11. I’m often on the lookout for new products or brands that will add to my personal uniqueness. Unpopular Choice/Counterconformity 1. When dressing, I have sometimes dared to be different in ways that others are likely to disapprove. 2. As far as I’m concerned, when it comes to the products I buy and the situations in which I use them, customs and rules are made to be broken. 3. I often dress unconventionally, even when it’s likely to offend others. 4. I rarely act in agreement with what others think are the right things to buy. 5. Concern for being out of place doesn’t prevent me from wearing what I want to wear. 6. When it comes to the products I buy and the situations in which I use them, I have often broken customs and rules. 7. I have often violated the understood rules of my social group regarding what to buy or own. 8. I have often gone against the understood rules of my social group regarding when and how certain products are properly used. 9. I enjoy challenging the prevailing taste of people I know by buying something they wouldn’t seem to accept. 10. If someone hinted that I had been dressing inappropriately for a social situation, I would continue dressing in the same manner. 11. When I dress differently, I’m often aware that others think I’m peculiar, but I don’t care. Chapter 2 Traits and Individual Difference Variables 45 Avoidance of Similarity 1. When products or brands I like become extremely popular, I lose interest in them. 2. I avoid products or brands that have already been accepted and purchased by the average consumer. 3. When a product I own becomes popular among the general population, I begin using it less. 4. I often try to avoid products or brands that I know are bought by the general population. 5. As a rule, I dislike products or brands that are customarily purchased by everyone. 6. I give up wearing fashions I’ve purchased once they become popular among the general public. 7. The more commonplace a product or brand is among the general population, the less interested I am in buying it. 8. Products don’t seem to hold much value for me when they are purchased regularly by everyone. 9. When a style of clothing I own becomes too commonplace, I usually quit wearing it. Notes: Responses were provided on a 5-point (strongly agree to strongly disagree) Likert-type scale. The recommended mixed order of items is depicted in Table 1 (Tian et al. 2001, pp. 55–6). 46 HANDBOOK OF MARKETING SCALES Preference for Consistency: PFC (Cialdini, Trost, and Newsom 1995) Construct: Preference for consistency (PFC) is viewed as “a tendency to base one’s responses to incoming stimuli on the implications of existing (prior entry) variables, such as previous expectancies, commitments, and choices” (Cialdini et al. 1995, p. 318). PFC represents a dispositional preference for or against consistent responding that can be manifested in three domains: (a) the desire to be consistent with one’s own responses (internal consistency), (b) the desire to appear consistent to others (public consistency), and (c) the desire that others be consistent (others’ consistency). Description: The PFC has 18 items scored on 9-point Likert-type scales ranging from strongly disagree (1) to strongly agree (9). A 9-item short form of the scale is also available. Though three domains of the construct were identified, items scores are summed and then divided by the number of items in the scale, to form average PFC scores for both the 18- and 9-item versions. (In scale development, the authors found that the three domains alluded to above were highly correlated, 0.73 to 0.87, and thus could be treated as one overall scale.) Development: An initial pool of 72 items was generated by the authors and other faculty members at Arizona State University. Elimination of redundant items and/or those that lacked face validity trimmed this pool to 60. The 60 items were then further assessed via item-tototal correlations and other distributional properties (sample of n = 567) to derive the final forms of the 18- and 9-item versions of the PFC. Numerous estimates of reliability and validity were offered over three more survey-based studies and three experimental studies. Samples: Four samples of undergraduate psychology students were used to develop and test the reliability and validity of the PFC: n = 567 (the initial developmental sample), n = 230, n = 452, and n = 224. The scale was further validated in three experimental studies encompassing samples of n = 50, n = 357, and n = 47 (all college students). Validity: Estimates of internal consistency were offered in terms of an average over three samples. For the 18-item version, the average coefficient alpha estimate was 0.89; for the 9-item version, the average coefficient alpha estimate was 0.84. The average correlation between the 18- and 9-item versions was 0.95. The PFC showed adequate evidence of discriminant and nomological validity via correlations with related (or hypothesized not to be related) constructs. For example, the correlation of PFC with a measure of “rigidity,” personal need for structure, self-consciousness, and the extroversion and openness factors of the Big Five personality dimensions were 0.48, 0.47, 0.25, –0.22, and –0.38 (p < 0.05), respectively. The PFC was not significantly correlated with measures of social desirability, self-monitoring, locus of control, agreeableness, and neuroticism. Three experiments consistent with balance theory, the foot-in-the-door effect, and cognitive dissonance theory also showed consistent support for the validity of the PFC scale. Scores: Means scores are reported as averages across the three survey-based studies. For the 18-item version, the mean (std. dev.) was 5.43 (1.19). Median and mode scores of 5.50 and 5.44 were also reported. For the 9-item version, the mean (std. dev.) was 5.36 (1.31). Median Chapter 2 Traits and Individual Difference Variables 47 and mode scores of 5.39 and 5.17 were also reported. Scores based on median splits in the experimental studies were also reported. Source: Cialdini, Robert B., Melanie R. Trost, and Jason Newsom (1995), “Preference for Consistency: The Development of a Valid Measure and the Discovery of Surprising Behavioral Implications,” Journal of Personality and Social Psychology, 69 (2), 318–28. 1995 by the American Psychological Association. Scale items taken from Appendix (p. 328). Reprinted with permission. 48 HANDBOOK OF MARKETING SCALES Preference for Consistency: PFC (Cialdini, Trost, and Newsom 1995) 1. I prefer to be around people whose reactions I can anticipate. 2. It is important to me that my actions are consistent with my beliefs. 3. Even if my attitudes and actions seemed consistent with one another to me, it would bother me if they did not seem consistent in the eyes of others. 4. It is important to me that those who know me can predict what I will do. 5. I want to be described by others as a stable, predictable person. 6. Admirable people are consistent and predictable. 7. The appearance of consistency is an important part of the image I present to the world. 8. It bothers me when someone I depend on is unpredictable. 9. I don’t like to appear as if I am inconsistent. 10. I get uncomfortable when I find my behavior contradicts my beliefs. 11. An important requirement for any friend of mine is personal consistency. 12. I typically prefer to do things the same way. 13. I dislike people who are constantly changing their opinion. 14. I want my close friends to be predictable. 15. It is important to me that others view me as a stable person. 16. I make an effort to appear consistent to others. 17. I’m uncomfortable holding two beliefs that are inconsistent. 18. It doesn’t bother me much if my actions are inconsistent. Notes: Items 4, 5, 7, 11, 12, 14, 15, 16, and 18 compose the 9-item short form of the PFC scale. Item 18 requires reverse scoring. Items scored on 9-point Likert-type scales ranging from strongly disagree (1) to strongly agree (9). Chapter 2 Traits and Individual Difference Variables 49 Independent and Interdependent Self-Construals (Singelis 1994) Construct: Independent self-construal is defined as a “bounded, unitary, stable” self that is separate from social context. The constellation of elements composing an independent self-construal includes an emphasis on (a) internal abilities, thoughts, and feelings, (b) being unique and expressing the self, (c) realizing internal attributes and promoting one’s own goals, and (d) being direct in communication. An interdependent self-construal is defined as a “flexible, variable” self that emphasizes (a) external, public features such as statuses, roles, and relationships, (b) belonging and fitting in, (c) occupying one’s proper place and engaging in appropriate action, and (d) being indirect in communication and “reading others’ minds” (Singelis 1994, p. 581). The focus then is on the degree to which individuals see themselves as separate or connected with others (Markus and Kitayama 1991). As Singelis (1994, p. 582) summarizes, collectivist cultures encourage development of cognitions that refer to groups as collective, whereas individualist cultures nurture cognitions that refer to the individual’s traits and states. These constructs have been used frequently in consumer research (e.g., Escalas and Bettman 2005; Ferraro, Bettman, and Chatrand 2009; Zhang and Khare 2009). Description: The combined factors are labeled the self-construal scale (SCS). The measures of interdependent and independent self-construals consist of 12 items for each construct. Respondents were asked to indicate their agreement with the items in a 7-point Likert scale format (1 = strongly disagree; 7 = strongly agree). Item scores are averaged to represent scores for the measures of interdependent and independent self-construals. Development: Forty-five items designed to be appropriate for normal student experiences were developed from a review of prior related measures and by the author. Multiple factor analysis results and the interpretation of factor loadings were used to select the final scale items. Items were selected if loadings from tests of varimax and oblique two-factor solutions were below 0.35 and/or loaded equally on the two factors (Singelis 1994, p. 584). The coefficient alpha estimates of internal consistency reliability for the interdependent and independent self-construal measures were 0.73 and 0.69 for the Sample 1 set of responses, respectively. The corresponding estimates for Sample 2 were 0.74 and 0.70. The correlations between the two scales were –0.04 for Sample 1 and 0.16 for Sample 2. Samples: Sample 1 consisted of 364 undergraduate students from the University of Hawaii (57% female). Sample 2 consisted of 160 students from the same university. Validity: Confirmatory factor analysis was used to confirm the two-factor model structure. Evidence of acceptable fit was presented for a two-factor almost orthogonal structure. As explained briefly below, a series of mean scores between ethnic groups offered evidence of validity. That is, group mean scores were consistent with Markus and Kitayama’s (1991) characterizations of Asians as interdependent and North Americans as independent (Singelis 1994, p. 587). Other group comparisons provided support for the measures. Evidence from the minimal correlations between the two factors in both studies was offered as support for minimal concerns regarding acquiescence bias. Evidence of predictive validity was provided from a series of correlations with scenario analyses in which the scales predicted better than ethnic group alone. Other supportive results regarding predictions of situational attributions were also reported. For example, Asian Americans and those with higher interdependence scores tended to attribute more influence to situational effects than Caucasian Americans and those with lower independence (Singelis 1994, p. 587). 50 HANDBOOK OF MARKETING SCALES Scores: Each dimension was said to be normally distributed in both samples. In Sample 1, the means (and standard deviations) for the independent and interdependent dimensions were 4.68 (0.73) and 4.79 (0.76), respectively. For Sample 2, the corresponding estimates were 4.83 (0.75) and 4.84 (0.80). In both samples, Asian Americans were more interdependent than Caucasian Americans. The reverse pattern of means occurred for the independence measure of self-construal. Other mean scores across ethnic groups are reported as well. Source: Singelis, Theodore (1994), “The Measurement of Independent and Interdependent SelfConstruals,” Personality and Social Psychology Bulletin, 20 (May), 580–91. References: Escalas, Jennifer Edson and James R. Bettman (2005), “Self Construal, Reference Groups, and Brand Meaning,” Journal of Consumer Research, 32 (3), 378–89. Ferraro, Rosellina, James R. Bettman, and Tanya L. Chartrand (2009), “The Power of Strangers: The Effect of Incidental Consumer Brand Encounters on Brand Choice,” Journal of Consumer Research, 35 (5), 729–41. Markus, H. R. and S. Kitayama (1991), “Culture and the Self: Implications for Cognition, Emotion, and Motivation,” Psychological Review, 98, 224–53. Zhang, Yinlong and Adwait Khare (2009), “The Impact of Accessible Identities on the Evaluation of Global Versus Local Products,” Journal of Consumer Research, 36 (3), 524–37. Chapter 2 Traits and Individual Difference Variables 51 Independent and Interdependent Self-Construals (Singelis 1994) Interdependent 1. I have respect for the authority figures with whom I interact. 2. It is important for me to maintain harmony within my group. 3. My happiness depends on the happiness of those around me. 4. I would offer my seat in a bus to my professor. 5. I respect people who are modest about themselves. 6. I will sacrifice my self-interest for the benefit of the group I am in. 7. I often have the feeling that my relationships with others are more important than my own accomplishments. 8. I should take into consideration my parents’ advice when making education/career plans. 9. It is important for me to respect decisions made by the group. 10. I will stay in a group if they need me, even when I’m not happy with the group. 11. If my brother or sister fails, I feel responsible. 12. Even when I strongly disagree with group members, I avoid an argument. Independent 1. I’d rather say “no” directly than risk being misunderstood. 2. Speaking up during class is not a problem for me. 3. Having a lively imagination is important to me. 4. I am comfortable being singled out for praise or rewards. 5. I am the same person at home that I am at school. 6. Being able to take care of myself is a primary concern for me. 7. I act the same way no matter who I am with. 8. I feel comfortable using someone’s first name soon after I meet them, even when they are much older than I am. 9. I prefer to be direct and forthright when dealing with people I’ve just met. 10. I enjoy being unique and different from others in many respects. 11. My personal identity, independent of others, is very important to me. 12. I value being in good health above everything. Notes: Respondents were asked to indicate their agreement with the items in a 7-point Likert scale format (1 = strongly disagree; 7 = strongly agree). 52 HANDBOOK OF MARKETING SCALES Horizontal and Vertical Individualism and Collectivism (Singelis et al. 1995; Triandis and Gelfand 1998) Construct: The concepts of individualism and collectivism are extended to incorporate the premise that both individualism and collectivism can be horizontal (emphasizing equality) or vertical (emphasizing hierarchy) (Triandis and Gelfand 1998, p. 118). Four constructs are then defined: horizontal individualism (HI), vertical individualism (VI), horizontal collectivism (HC), and vertical collectivism (VC). As Triandis (1996, p. 411) notes, in all cultures, individuals are capable of using all four patterns in responding. Description: There are various versions of the measures of individualism and collectivism, originally stemming from Singelis et al. (1995). Their measure included 32 items with 8 items each for HI, VI, HC, and VC (pp. 225–56). Triandis and Gelfand (1998, p. 120) offered a different version and also used portions of the Singelis et al. (1995) scale. Further, Sividas, Bruvold, and Nelson (2008) provide a 14-item reduced form as indicated below. (Other items are included in the references cited below.) Thirty items are used as described by Singelis et al. (1995, pp. 255–56). Twenty-seven items developed by Singelis et al. (1995) are employed in Study 4 by Triandis and Gelfand (1998). The allocation of the 27 items across the four constructs is as follows: HI, 5 items; VI, 8 items; HC, 8 items; and VC, 6 items. Items were answered on 9-point scales, where 1 = never or definitely no and 9 = always or definitely yes (Singelis et al. 1995, p. 250). Development: Given the number of different versions of the measures, we briefly report some of the evidence from Triandis and Gelfand (1998), although some of the development work and conceptual underpinnings for these measures of horizontal and vertical individualism and collectivism are described in Singelis et al. (1995) and Triandis (1996). Triandis and Gelfand (1998) report beginning with 27 items (Singelis et al. 1995). Factor analysis of the student data in Study 1 (n = 326) was used to select 16 items. Singelis et al. (1995) reported reliabilities for eight-item versions of the four scales as follows: HI, 0.67; VI, 0.74; HC, 0.74; and VC, 0.68. Samples: For Study 1, 326 South Korean students participated. In Study 2 and Study 3, 127 undergraduates participated. In Study 4, 90 undergraduates from a psychology subject pool participated. Validity: In Study 2, the measures were combined with scenario-based versions of the four concepts in multitrait-multimethod matrices. Evidence of convergent validity was offered for HC, VI, and VC (Triandis and Gelfand 1998, p. 121). Evidence of divergent validity was offered as well. For example, and considering the individualism constructs, differentiation occurred by the horizontal and vertical aspects. In Study 3, the four constructs were related, and generally as predicted, to measures of self-reliance, interdependence and sociability, family integrity, competition, and hedonism. In Study 4, the four measures were related to measures developed by others. For the 27 items, the reliabilities were HI, 0.81; VI, 0.82; HC, 0.80; and VC, 0.73. Also, from Study 4, the items developed by Singelis et al. (1995) converged with similar measures developed by other researchers, particularly for the horizontal aspects of the constructs. VC was captured by some of the other constructs; VI, which stresses competition, is not measured by any of the scales developed by other researchers (Triandis and Gelfand 1998, p. 125). Scores: Means and standard deviations were not reported by Triandis and Gelfand (1998). Mean scores were used by the authors, however, to categorize individuals into groups in Study 3. Chapter 2 Traits and Individual Difference Variables 53 Source: Triandis, Harry C. and Michele J. Gelfand (1998), “Converging Measurement of Horizontal and Vertical Individualism and Collectivism,” Journal of Personality and Social Psychology, 74 (1), 118–28. References: Singelis, Theodore M., Harry C. Triandis, Dharm P. S. Bhawuk, and Michele J. Gelfand (1995), “Horizontal and Vertical Dimensions of Individualism and Collectivism: A Theoretical and Measurement Refinement,” Cross-Cultural Research, 29 (August), 240–75. Sivadas, Eugene, Norman T. Bruvold, and Michelle R. Nelson (2008), “A reduced version of the horizontal and vertical individualism and collectivism scale: A four-country assessment,” Journal of Business Research, 61, 201–10. Triandis, Harry C. (1996), “The Psychological Measurement of Cultural Syndromes,” American Psychologist, 51 (April), 407–15. 54 HANDBOOK OF MARKETING SCALES Horizontal and Vertical Individualism and Collectivism (Singelis et al. 1995; Triandis and Gelfand 1998) Individualism Horizontal (HI) 1. I often do “my own thing.”a,b 2. One should live one’s life independently of others. 3. I like my privacy. 4. I prefer to be direct and forthright when discussing with people. 5. I am a unique individual.a 6. What happens to me is my own doing. 7. When I succeed, it is usually because of my abilities. 8. I enjoy being unique and different from others in many ways.a Vertical (VI) 1. It annoys me when other people perform better than I do. 2. Competition is the law of nature.a,b 3. When another person does better than I do, I get tense and aroused.b 4. Without competition, it is not possible to have a good society.a 5. Winning is everything.b 6. It is important that I do my job better than others.b 7. I enjoy working in situations involving competition with others.a 8. Some people emphasize winning; I’m not one of them. (reverse coded) Chapter 2 Traits and Individual Difference Variables 55 Horizontal and Vertical Individualism and Collectivism (Singelis et al. 1995; Triandis and Gelfand 1998) Collectivism Horizontal (HC) 1. The well-being of my coworkers is important to me.a,b 2. If a coworker gets a prize, I would feel proud.a,b 3. If a relative were in financial difficulty, I would help within my means. 4. It is important to maintain harmony within my group. 5. I like sharing little things with my neighbors. 6. I feel good when I cooperate with others.a,b 7. My happiness depends very much on the happiness of those around me.a 8. To me, pleasure is spending time with others.b Vertical (VC) 1. I would sacrifice an activity that I enjoy very much if my family did not approve of it.a 2. I would do what would please my family, even if I detested that activity.a 3. Before taking a major trip, I consult with most members of my family and many friends. 4. I usually sacrifice my self-interest for the benefit of the group.a 5. Children should be taught to place duty before pleasure. 6. I hate to disagree with others in my group. 7. We should keep our aging parents with us at home. 8. Children should feel honored if their parents receive a distinguished award.a Note: Items were answered on 9-point scales, where 1 = never or definitely no and 9 = always or definitely yes. a indicates an item that is also in the Sivadas et al. (2008) reduced version. b indicates that the item is in common with Triandis and Gelfand (1998). 56 HANDBOOK OF MARKETING SCALES Self-Concept Clarity: SCC (Campbell et al. 1996) Construct: Self-concept clarity (SCC) is defined as the “extent to which the contents of an individual’s self-concept (e.g., perceived personal attributes) are clearly and confidently defined, internally consistent, and temporally stable” (Campbell et al. 1996, p. 141). SCC is considered related to, yet distinct from, aspects of self-identity (i.e., achievement, status, self-esteem). SCC is a perceptual, belief-based variable. As such, these beliefs may not necessarily be accurate relative to one’s behavior. Description: The SCC scale has 12 items scored on 5-point Likert-type scales ranging from strongly disagree to strongly agree. Item scores are summed to form an SCC scale score that ranges from 12 to 60. The scale represents a single factor and can be considered unidimensional. Development: Three studies, encompassing four large samples and three international subsamples, were conducted to derive the final form of the SCC scale and examine dimensionality, reliability, and validity. A pool of 40 items was culled from other sources and/or generated by the authors. Twenty of these items were then selected based on initial internal consistency and item redundancy estimates. Then, 12 items that loaded most highly on a single factor were retained (using three samples in Study 1). Both principal components and maximum likelihood factor analyses were used to assess dimensionality. Numerous estimates of reliability and validity followed across two more studies. Samples: In Study 1, three samples of undergraduate students were used: n = 471, n = 608, and n = 465. A subset of n = 155 of the first sample was used in Study 2. In Study 3, samples of n = 80, n = 196, and n = 100 Japanese students from the University of British Columbia or from two Japanese universities were compared to samples of n = 112, n = 90, and n = 82 Canadian students at the University of British Columbia. Validity: Across the three samples of Study 1, coefficient alpha estimates of internal consistency were 0.86, 0.86, and 0.85 for the final 12-item SCC scale. Inter-item correlations ranged from 0.10 to 0.58, and item-to-total correlations ranged from 0.35 to 0.66 (on average) across the three samples. Test-retest reliability correlations over 4- and 5-month intervals for subsamples of Sample 1 and Sample 3 (i.e., n = 155 and n = 61) were 0.79 and 0.70, respectively. Factor analyses (both principal components and maximum likelihood) showed evidence of a single dimension underlying the 12 items. Numerous correlations with related variables showed evidence of discriminant and nomological validity for the SCC scale. For example, across the three samples of Study 1, the SCC scale showed correlations of 0.67, 0.62, and, 0.60 with a measure of selfesteem. The SCC showed correlations of –0.51, –0.50, and –0.49 with a measure of negative affectivity. Significant nomological correlations were also found between the SCC scale and measures of self-consciousness, extroversion, and openness. The scale did show modest correlations to social desirability (0.32–0.33). Study 2 showed a similar pattern of results in terms of the validity of the SCC scale. In Study 3, hypothesized mean-level differences between Canadian (Western Culture) and Japanese (Eastern Culture) students were found. As predicted, the mean SCC scale scores for the Canadian students were higher than the mean SCC scale scores for the Japanese students for all three samples of Study 3 (p < 0.01). In sum, across samples and studies, the SCC scale showed consistent evidence of reliability and validity. Chapter 2 Traits and Individual Difference Variables 57 Scores: Several mean scores were reported. For the overall SCC scale, Study 1 means (std. devs.) were 42.12 (8.19), 39.68 (8.16), and 38.86 (8.06). Means were also reported for males and females separately (see Table 2, p. 145 of Campbell et al. 1996). Means for the Canadian subsamples of Study 3 were 41.72, 39.30, and 38.02. Means for the Japanese subsamples of Study 3 were 34.41, 35.01, and 34.35. Individual item means (std. devs.) are offered in Table 1 of Campbell et al. (1996, p. 145). Source: Campbell, Jennifer, Paul D. Trapnell, Steven J. Heine, Liana M. Katz, Loraine F. Lavallee, and Darrin R. Lehman (1996), “Self-Concept Clarity: Measurement, Personality Correlates, and Cultural Boundaries,” Journal of Personality and Social Psychology, 70 (1), 141–56. 1996 by the American Psychological Association. Scale items taken from Table 1 (p. 145). Reprinted with permission. 58 HANDBOOK OF MARKETING SCALES Self-Concept Clarity: SCC (Campbell et al. 1996) 1. My beliefs about myself often conflict with one another. 2. On one day I might have one opinion of myself and on another day I might have a different opinion. 3. I spend a lot of time wondering about what kind of person I really am. 4. Sometimes I feel that I am not really the person that I appear to be. 5. When I think about the kind of person I have been in the past, I’m not sure what I was really like. 6. I seldom experience conflict between the different aspects of my personality. 7. Sometimes I think I know other people better than I know myself. 8. My beliefs about myself seem to change very frequently. 9. If I were asked to describe my personality, my description might end up being different from one day to another day. 10. Even if I wanted to, I don’t think I could tell someone what I’m really like. 11. In general, I have a clear sense of who I am and what I am. 12. It is often hard for me to make up my mind about things because I don’t really know what I want. Notes: Items scored on 5-point Likert-type scales ranging from strongly disagree to strongly agree. Items 1 through 5, 7 through 10, and 12 require reverse scoring. Chapter 2 Traits and Individual Difference Variables 59 Self-Concepts, Person Concepts, and Product Concepts (Malhotra 1981) Construct: Measures are derived for evaluating self-concepts, person concepts, and product concepts. The specific concepts chosen for study were automobiles and actors. (The objective of the research on which the measures are based was to describe the construction of the scales rather than the development of a generalized scale for measuring self-concepts, person concepts, and product concepts [Malhotra 1981, p. 456].) The measure is said to be applicable for coordinating the image of a product with the self-concept(s) of a target market and image of a spokesperson that might be used in testimonial for that product. Description: The final scale includes 15 semantic differential items anchoring seven-place response formats. The scale is multidimensional and, hence, summed scores are not appropriate. Item scores can be summed within dimensions. Development: A beginning pool of 70 items was developed from pretest data generated from free associations, repertory grid procedures, and the studies of Osgood, Suci, and Tannenbaum (1957). A panel of four judges was used to reduce the item pool to 27. These items included at least two semantic differential scales for eight factors: evaluative, potency, activity, stability, tautness, novelty, receptivity, and aggressiveness. Based on analysis of the two student surveys described below, the 15-item final scale was developed as follows. First, a series of factor analyses (i.e., principal factoring with iterations followed by varimax rotation) was conducted and examined for stability, loading patterns, uniqueness, and explained variance. Second, hierarchical clustering procedures supported the factor analysis results. As summarized by Malhotra (1981, p, 460), the 15 items were selected using the following criteria: high loadings on the factor they represent; high correlations with other items representing the same factor or cluster; low correlations with items representing other factors or clusters; high stability across self-concepts, auto brands, or actors; uniqueness in the cluster solutions; and high coefficients of multiple correlation with multidimensional space coordinates. Six of the factors are represented by two items each. The tautness and aggressiveness factors are not reflected in the final scale. Samples: Two surveys were used in the development of the measures. The first survey involved 167 student subjects for three self-concepts (i.e., “ideal,” “actual,” and “social”) and nine brands of automobiles. The second survey involved 187 students (of which 135 had participated in the first survey) for the same three self-concepts and nine actors (i.e., “persons”). Validity: Test-retest estimates were obtained from 135 subjects over a 4-week delay for the ideal, actual, and social self ratings. All correlations were significant. Evidence of stability was also provided through individual level correlations. Coefficient alpha estimates for appropriate factor sub-scales ranged from 0.50 to 0.70 (with a single exception). Evidence provided by the expert panel judgments was cited as support for face validity. Evidence of convergent and discriminant validity was provided from a multitrait-multimethod analysis in which the actors and brands served as traits and the semantic differentials and similarity ratings served as methods. For example, validity coefficients for the autos and actors were. 0.38 and 0.49, respectively (Malhotra 1981, p. 463). Scores: Neither overall nor item mean scores were reported. 60 HANDBOOK OF MARKETING SCALES Source: Malhotra, Naresh K. (1981), “A Scale to Measure Self-Concepts, Person Concepts, and Product Concepts,” Journal of Marketing Research, 16, 456–64. 1981 by the American Marketing Association. Scale items taken from Table 3 (p. 462). Reprinted with permission. Reference: Osgood, C. E., George J. Suci, and Percy M. Tannenbaum (1957), Measurement of Meaning, Urbana: University of Illinois Free Press. Chapter 2 Traits and Individual Difference Variables 61 Self-Concepts, Person Concepts, and Product Concepts (Malhotra 1981) Rugged Delicate Excitable Calm Uncomfortable Comfortable Dominating Submissive Thrifty Indulgent Pleasant Unpleasant Contemporary Noncontemporary Organized Unorganized Rational Emotional Youthful Mature Formal Informal Orthodox Liberal Complex Simple Colorless Colorful Modest Vain Note: Items scored on a 7-point semantic differential scale. Though the scale is considered multidimensional, items belonging to specific dimensions were not explicitly given, nor was the directionality of the items (i.e., the specification of reverse coding) stated by Malhotra (1981). 62 HANDBOOK OF MARKETING SCALES Vanity: Trait Aspects of Vanity (Netemeyer, Burton, and Lichtenstein 1995) Construct: “Vanity,” as delineated by Netemeyer et al. (1995), has four trait aspects: (a) an excessive concern for physical appearance, (b) a positive (and perhaps inflated) view of one’s physical appearance, (c) an excessive concern for personal achievements, and (d) a positive (and perhaps inflated) view of one’s personal achievements. Description: The vanity scales are viewed as four distinct dimensions. The excessive concern for physical appearance dimension is composed of five items, the positive (and perhaps inflated) view of one’s physical appearance is composed of six items, and the excessive concern for personal achievements and the positive (and perhaps inflated) view of one’s personal achievements dimensions are composed of five items each. All items are scored on 7-point Likert-type scales from strongly disagree to strongly agree. Item scores are summed within dimensions to form composite scores for each dimension. Development: Via a review of the literature, formal definitions of the four vanity dimensions were formulated. Numerous items were generated by the authors or culled from various sources to represent the dimensions. Items were judged for representativeness by “experts.” A total of 100 items were initially retained for numerous data collection and developmental procedures. Four studies were used to develop the scales, and three more studies were used in further validation procedures. Factor-analytic techniques and reliability analyses were used to assess dimensionality and internal consistency. Correlational and mean difference testing procedures were used to check validity. Samples: As stated above, a total of seven samples was used in the development and validation of the four vanity dimensions. The first four samples were combinations of students and nonstudents (n = 277, n = 145, n = 186, and n = 264). Three other samples were taken from a Who’s Who directory (n = 267), an NCAA Division I football team (n = 27), and a fashion model agency (n = 43 females). Validity: Confirmatory factor analyses was used to assess the dimensionality and discriminant validity of the four vanity dimensions. Across samples (where the sample size was large enough), evidence of four distinct vanity dimensions was found. Across the first four samples, internal consistency estimates (i.e., coefficient alpha and composite reliability via LISREL) ranged from 0.80 to 0.92 across the four vanity dimensions. For the last three samples, estimates of internal consistency ranged from 0.77 to 0.92. Numerous estimates of nomological validity were offered, including significant correlations of the vanity dimensions with narcissism, grandiosity, status concern, materialism, the List of Values (i.e., LOV), clothing concern, dieting behavior, use of cosmetics, and others. Mean-level difference tests also showed evidence of known-group validity, as fashion models scored higher on the “physical” aspects of vanity than did other samples, and the Who’s Who sample scored higher on the “achievement” aspects of vanity than did other samples. Scores: Means and standard deviations for the summed composites of the vanity dimensions are offered in Netemeyer et al. (1995, p. 624). Across the seven samples, the mean (and standard deviation) for the concern for physical appearance dimension ranged from 21.32 (6.16) to 25.44 (6.08), the mean (and standard deviation) for the view of physical appearance dimension ranged from 20.60 (7.08) to 26.90 (6.49), the mean (and standard deviation) for the concern for personal achievement dimension ranged from 19.26 (6.81) to 23.14 (6.37), and the mean (and standard deviation) for the view of personal achievement dimension ranged from 20.96 (6.20) to 26.25 (4.68). Chapter 2 Source: Traits and Individual Difference Variables 63 Netemeyer, Richard G., Scot Burton, and Donald R. Lichtenstein (1995), “Trait Aspects of Vanity: Measurement and Relevance to Consumer Behavior,” Journal of Consumer Research, 21, 612–26. 1995 by University of Chicago Press. Scale items taken from Appendix (p. 624). Reprinted with permission. 64 HANDBOOK OF MARKETING SCALES Vanity: Trait Aspects of Vanity (Netemeyer, Burton, and Lichtenstein 1995) Concern for Physical Appearance Items 1. The way I look is extremely important to me. 2. I am very concerned about my appearance. 3. I would feel embarrassed if I was around people and did not look my best. 4. Looking my best is worth the effort. 5. It is important that I always look good. View of Physical Appearance Items 1. People notice how attractive I am. 2. My looks are very appealing to others. 3. People are envious of my good looks. 4. I am a very good-looking individual. 5. My body is sexually appealing. 6. I have the type of body that people want to look at. Concern for Achievement Items 1. Professional achievements are an obsession with me. 2. I want others to look up to me for my accomplishments. 3. I am more concerned with professional success than most people I know. 4. Achieving greater success than my peers is important to me. 5. I want my achievements to be recognized by others. View of Achievement Items 1. In a professional sense, I am a very successful person. 2. My achievements are highly regarded by others. 3. I am an accomplished person. 4. I am a good example of professional success. 5. Others wish they were as successful as me. Note: Items scored on 7-point Likert-type scales from strongly disagree to strongly agree. Chapter 2 Traits and Individual Difference Variables 65 Scales Related to Consumer Compulsiveness and Impulsiveness Compulsive Buying Index (CBI): An Expanded Measure (Ridgway, Kukar-Kinney, and Monroe 2008) Construct: Ridgway et al. (2008) define compulsive buying (CB) as “a tendency to be preoccupied with buying that is revealed through repetitive buying and a lack of impulse control over buying” (p. 622). This definition conceptualizes compulsive buying as a two-dimensional construct encompassing an obsessive-compulsive buying dimension and an impulsive buying dimension. Description: The CBI (compulsive buying index) comprises six items covering the two dimensions noted above. Three items each form the obsessive-compulsive buying and the impulsive buying dimensions. Four of the items are scored on 7-point strongly disagree to strongly agree scales, and two items are scored on 7-point never to very often scales. Though conceptualized as a two-dimensional construct, scores on all scale items can be summed to create an overall CBI score ranging from 6 to 42. Development: Development of the CBI followed recommended scaling procedures. Based on the two dimensions noted above and a thorough literature review examining several other measures of compulsive buying, the authors generated a pool of 121 potential CB items. Item judging by three consumer behavior researchers trimmed the pool to 15 items. Then, a sample of 352 undergraduate students responded to the 15 items and other measures in Study 1. Via factor and item analyses, the final six-item version of the scale was derived. Two more studies (Studies 2 and 3) were then conducted that further validated the psychometric properties (e.g., dimensionality, reliability, and the various forms of validity) of the CBI. Samples: The Study 1 sample was composed of n = 352 undergraduate students; the Study 2 sample was composed of n = 555 university staff members; and the Study 3 sample was composed of n = 309 customers of an Internet women’s clothing retailer. Validity: Across studies, a two-factor model representing a three-item obsessive-compulsive buying dimension and a three-item impulsive buying dimension fit the date well. Correlations among these two factors were 0.77, 0.62, and 0.72 in Studies 1, 2, and 3, respectively. Coefficient alpha estimates for the overall six-item CBI scale were 0.84, 0.81, and 0.84. For the three-item obsessive-compulsive buying dimension, alpha was 0.75, 0.77, and 0.78; and for the three-item impulsive buying dimension, alpha was 0.80, 0.78, and 0.84. Numerous estimates of validity were assessed in Studies 2 and 3. Study 2 showed that CBI was correlated with gender (i.e., women more likely to be compulsive buyers than men), age (r = –0.17), and education (r = –0.11). In terms of nomological validity, the overall six-item CBI was positively correlated with materialism (r = 0.51), depression (r = 0.21), anxiety (r = 0.31), and stress (r = 0.26). The overall six-item CBI was also positively correlated with measures of positive feelings of buying (r = 0.59), hiding purchases (r = 0.59), returning purchases (r = 0.13), frequency of buying (r = 0.37), and family arguments about spending (r = 0.44). The CBI scale showed discriminant validity from a general measure of obsessive-compulsive disorder (r = 0.29) and convergent validity with Faber and O’Guinn’s (1992) CB screener (r = 0.62). Further, the six-item CBI scale, on average, showed stronger predictive validity across an array of measures (see Table 5, p. 632) over that of Faber and O’Guinn’s CB screener. The CBI scale did show some evidence of social desirability bias though (r = –0.21). 66 HANDBOOK OF MARKETING SCALES Study 3 showed that the six-item CBI scale was positively correlated with actual purchase data (correlations ranging from r = 0.18 to r = 0.27). Further, a CBI scale cutoff score of 25 (established in Study 2) successfully discriminated between consumers classified as potential compulsive buyers (CBI score of 25 to 42) and those not being potential compulsive buyers (CBI score of 6 to 24). Based on this cutoff, about 9% of Study 2 respondents and 16% of Study 3 respondents were classified as compulsive buyers. Note that the Study 3 sample was 98.5% female, a group with higher CBI scores in general. Scores: For Study 2, the average six-item CBI scale score was 15.39 (SD = 6.44). For Study 3, the average six-item CBI scale score was 17.13 (SD = 7.27). Source: Ridgway, Nancy, Monica Kukar-Kinney, and Kent B. Monroe (2008), “An Expanded Conceptualization and Measure of Compulsive Buying,” Journal of Consumer Research, 35 (December), 622–39. Reference: Faber, Ronald J. and Thomas C. O’Guinn (1992), “A Clinical Screener for Compulsive Buying,” Journal of Consumer Research, 19 (December), 459–69. Chapter 2 Traits and Individual Difference Variables 67 Compulsive Buying Index (CBI): An Expanded Measure (Ridgway, Kukar-Kinney, and Monroe 2008) 1. My closet has unopened shopping bags in it. 2. Others might consider me a shopaholic. 3. Much of my life centers around buying things. 4. I buy things I don’t need. 5. I buy things I did not plan to buy. 6. I consider myself an impulse purchaser. Notes: Items 1 to 3 compose the obsessive-compulsive buying dimension; items 4 to 6 compose the impulsive buying dimension. Items 1, 2, 3, and 6 are scored on strongly disagree to strongly agree scales; items 4 and 5 are scored on never to very often scales. 68 HANDBOOK OF MARKETING SCALES Compulsive Consumption: A Diagnostic Tool/Clinical Screener for Classifying Compulsive Consumers (Faber and O’Guinn 1989, 1992) Construct: This abnormal form of consumer behavior is typified by chronic buying episodes of a somewhat stereotyped fashion in which the consumer feels unable to stop or significantly moderate the behavior(s). Although compulsive buying may produce some shortterm positive feelings for the individual, it ultimately is disruptive to normal life functioning and produces significant negative consequences (Faber and O’Guinn 1989). As such, compulsive buying shares similarities with other types of compulsive and addictive behaviors. Faber and O’Guinn (1989) and Faber and O’Guinn (1992, p. 459) formally define compulsive buying as “a chronic, repetitive purchasing that becomes a primary response to negative events or feelings.” Description: The measure represents a screening instrument designed to identify compulsive consumers. The initial instrument was composed of the unweighted sum of scores of 14 items (Faber and O’Guinn 1989). Each item was operationalized using 5-point Likerttype scales. The range of the measure is 14 to 76. Lower scores reflect greater agreement or compulsivity. The refined instrument is composed of seven items scored on 5-point scales, and a weighted algorithm-based score is derived as a “screener” to classify individuals as potential compulsive buyers (Faber and O’Guinn 1992). Development: Development of the initial scale began with a set of 32 variables that assessed psychological, motivational, and behavioral aspects of buying. These items were developed from the literature on other compulsive behaviors, the authors’ previous experiences, and a pilot test with a small group of compulsive consumers (Faber and O’Guinn 1989), Those 14 items discriminating (p < 0.10) between two groups (i.e., the two samples described below) were selected for inclusion in the measure. Using a general population sample, factor analysis of these 14 items revealed only one viable factor. The refined scale employed the items from the initial scale as well as other items that reflected the construct definition. A total of 29 items were selected as potential candidates for the screening instrument. These items were carefully generated from both the existing literature and judgments of therapists and trained observers. Using samples of both selfidentified compulsive buyers and respondents from the general population, the final form of the screener was derived. Numerous procedures consistent with scale development as a “classification” tool were employed, including logistic regression, test-retest reliability (via a c coefficient), internal consistency, and principal component analyses. Several validity tests were also performed that assessed the degree to which the screener “correctly” classified compulsive buyers, as well as mean-level difference tests on various psychological variables between compulsive buyers and “general consumers.” Samples: The samples for the initial instrument (Faber and O’Guinn 1989) and the refined screener (Faber and O’Guinn 1992) employed many of the same respondents. As such, these samples will be described (briefly) in tandem. A sample of 388 respondents to a mail survey specifically designed to contact potential “compulsive buyers” was obtained. These individuals were in contact (but not in therapy) with a self-help group for problem consumers. A comparison sample of 292 individuals was obtained after three mailings to a sample of 800 drawn from three Illinois cities of varying sizes. From these samples, smaller samples (n = 22) based on classification results from the refined screener as well as randomly generated samples from the general population and selfidentified compulsive buyers were compared. Samples of 53 and 54 responding either to a “compulsive buyer ad” or “control ad” (both were newspaper ads) were used to assess the classification rate of the refined screener (Faber and O’Guinn 1992). Chapter 2 Traits and Individual Difference Variables 69 Validity: The coefficient alpha estimate of internal consistency reliability for the 14-item initial scale (Faber and O’Guinn 1989) was 0.83. The refined seven-item version showed a coefficient alpha estimate of 0.95 (Faber and O’Guinn 1992). In Faber and O’Guinn (1989), the distributions of the screening measure were examined for both groups. The intersections of the distributions were examined to determine a threshold score (i.e., two standard deviations below the mean for the general distribution) of 42, which also was the modal value for the compulsive sample. Approximately 6% of the general sample was identified as compulsives. Tests of mean differences were made between the 16 compulsives in the general sample and 16 individuals drawn from the compulsive group. These comparisons revealed that the screener measure is capable of identifying compulsives in the general population similar to individuals in the compulsive group but quite different from other members of the general population. Differences were examined for measures of self-esteem, payments for past purchases, general compulsivity, envy, and fantasy. In Faber and O’Guinn (1992), mean-level difference tests showed that compulsive buyers exhibited lower levels of self-esteem, higher levels of obsessive-compulsiveness, high levels of fantasy, higher levels of remorse (guilt), and higher levels of materialism than did a “general consumer” sample. In addition, using rigorous criteria, as a clinical screening instrument, the refined scale was able to correctly classify about 88% of respondents as “compulsive buyers” or “noncompulsive buyers” in the samples used. Scores: Mean scores are reported for both a “comparison strata” and a “compulsive strata” in Faber and O’Guinn (1989). The mean scores (and standard deviations) were 37.44 (10.74) and 57.33 (7.51) for the compulsive and comparison strata, respectively. The corresponding modal values were 42 and 58. Sources: Faber, Ronald J. and Thomas C. O’Guinn (1989), “Classifying Compulsive Consumers: Advances in the Development of a Diagnostic Tool,” in Advances in Consumer Research, Vol. 16, ed. Thomas K. Srull, Provo, UT: Association for Consumer Research, pp. 738–44. 1989 by the Association for Consumer Research. Scale items taken from Table 1 (p. 741). Reprinted with permission. Faber, Ronald J. and Thomas C. O’Guinn (1992), “A Clinical Screener for Compulsive Buying,” Journal of Consumer Research, 19, 459–69. Scale items taken from Appendix (p. 468). Other evidence: In two studies, Faber et al. (1995) found evidence for a “comorbid” link between compulsive buying and binge eating as 24 compulsive buyers (as classified Faber and O’Guinn’s, 1992, clinical screener) showed higher levels of binge eating, substance abuse, and impulse control disorders than did a matched noncompulsive buying sample (n = 24). In another study, Rindfleisch, Burroughs, and Denton (1997) report a coefficient alpha estimate for the seven-item compulsive buying clinical screener of 0.80. They report correlations of 0.25, –0.26, 0.24, and 0.36 with family structure, family resources, family stressors, and material values, respectively, with the compulsive buying screener. They also report results from moderation and mediation analyses showing that compulsive buying is affected by family resources, family structure, and family stressors. Other sources: Faber, Ronald J., Gary Christenson, Martina De Zwaan, and James Mitchell (1995), “Two Forms of Compulsive Consumption: Comorbidity of Compulsive Buying and Binge Eating,” Journal of Consumer Research, 22, 296–304. Rindfleisch, Aric, James E. Burroughs, and Frank Denton (1997), “Family Structure, Materialism, and Compulsive Buying,” Journal of Consumer Research, 23, 312–25. Reference: O’Guinn, Thomas C. and Ronald R. Faber (1989), “Compulsive Buying: A Phenomenological Exploration,” Journal of Consumer Research, 16, 147–57. 70 HANDBOOK OF MARKETING SCALES Compulsive Consumption: A Diagnostic Tool/Clinical Screener for Classifying Compulsive Consumers (Faber and O’Guinn 1989, 1992) 1. Bought things even though I couldn’t afford them. 2. Felt others would be horrified if they knew of my spending habits. 3. If I have any money left at the end of the pay period, I just have to spend it. 4. Made only the minimum payments on my credit cards. 5. Bought myself something in order to make myself feel better. 6. Wrote a check when I knew I didn’t have enough money in the bank to cover it. 7. Just wanted to buy things and didn’t care what I bought. 8. I often buy things simply because they are on sale. 9. Felt anxious or nervous on days I didn’t go shopping. 10. Shopping is fun. 11. Felt depressed after shopping. 12. Bought something and when I got home I wasn’t sure why I had bought it. 13. Went on a buying binge and wasn’t able to stop. 14. 1 really believe that having more money would solve most of my problems. Notes: The items above are as they originally appeared in Faber and O’Guinn (1989). These 14 items composed the initial instrument. Items that compose the 1992 Faber and O’Guinn clinical screener (i.e., the refined instrument) are items 1 through 6, and 9. Items 1, 2, 4, 5, 6, and 9 are scored on very often to never scales, and item 3 is scored on a strongly agree to strongly disagree scale. These .tern scores can be summed to form an overall scale score, or they can be used to construct the Faber and O’Guinn weighted algorithm for classification purposes, which is as follows: −9.69 + (Q3 × 0.33) + (Q2 × 0.34) + (Q1 × 0.50) + (Q6 × 0.47) + (Q5 × 0.33) + (Q9 × 0.38) + (Q4 × 0.31) If a score on the above algorithm is ≤ –1.34, a subject is classified as a compulsive buyer. Chapter 2 Traits and Individual Difference Variables 71 Hyperopia (Haws and Poynor 2008) Construct: Hyperopia refers to an overall aversion to luxury. While past research tended to refer to hyperopia as “excessive self-control” (Kivetz and Simonson 2002), Haws and Poynor demonstrate hyperopia’s distinction from extreme levels of self-control. In doing so, they emphasize three key aspects in order to fully define hyperopia. First, hyperopia lowers a consumer’s present likelihood of indulging. Second, hyperopic individuals acknowledge their difficulty with indulgence and therefore should be capable of reporting these tendencies. Third, the hyperopic tendency to forgo indulgence can lead to retrospective regret and a sense of missing out on life (Kivetz and Keinan 2006). Consumers expressing high levels of hyperopia have trouble allowing themselves to enjoy the pleasures that life has to offer. Description: The scale consists of six statements that are all assessed on 7-point scales labeled strongly disagree to strongly agree. Item scores are averaged to form an overall score, and the range of the scale is 1 to 7. All items are worded such that greater agreement results in a larger total score (i.e., a greater propensity to be hyperopic). Development: An initial pool of 11 items was generated based on the concept definition and insights from previous research (Kivetz and Keinan 2006; Kivetz and Simonson 2002). Using responses from 109 undergraduate students, six items were retained that all had a factor loading of at least 0.65 on the single factor. Exploratory and confirmatory factor analyses examined the properties of hyperopia and confirmed its unidimensional structure. Samples: Sample 1 (n = 109), Sample 2a (n = 164; n = 35 for test-retest reliability check), and Sample 2b (n = 280) included undergraduate student participants. Sample 2c (n = 41) included students from a professional MBA program. Validity: Coefficient alpha was reported in some studies, including Sample 1 (0.86) and Sample 2a (0.90). Test-retest ability was assessed with a subsample of Sample 2a participants and was 0.80 with a 2-week time period between measurements. Hyperopia was discriminated from self-control in all studies. Further discriminant validity tests distinguished hyperopia from frugality, materialism, tightwad propensity, conscientiousness, and impulsive buying, while also providing evidence of nomological validity through demonstrating proposed relationships between hyperopia and these constructs. Scores: Sample 2c showed that neither gender nor age predicted hyperopia. No means are reported. Source: Haws, Kelly L. and Cait Poynor (2008), “Seize the Day! Encouraging Indulgence for the Hyperopic Consumer,” Journal of Consumer Research, 35 (December), 680–91. References: Kivetz, Ran and Anat Keinan (2006), “Repenting Hyperopia: An Analysis of Self-Control Regrets,” Journal of Consumer Research, 33 (September), 273–82. Kivetz, Ran and Itamar Simonson (2002), “Self-Control for the Righteous: Toward a Theory of Precommitment to Indulgence,” Journal of Consumer Research, 29 (September), 199–217. 72 HANDBOOK OF MARKETING SCALES Hyperopia (Haws and Poynor 2008) 1. I often fail to enjoy attractive opportunities. 2. It’s hard for me to make myself indulge. 3. I regret missed opportunities to enjoy rich experiences in the past. 4. I have difficulty pampering myself. 5. “Seizing the day” is difficult for me. 6. I rarely enjoy the luxuries life has to offer. Note: 1 to 7 strongly disagree to strongly agree scale, no reverse coding. Chapter 2 Traits and Individual Difference Variables 73 Impulsiveness: Buying Impulsiveness Scale (Rook and Fisher 1995) Construct: Rook and Fisher (1995, p. 306) define buying impulsiveness as “a consumer’s tendency to buy spontaneously, unreflectively, immediately, and kinetically.” High impulse buyers are more likely to have more “open” shopping lists, are more likely to be receptive to sudden and unexpected buying ideas, and are more apt to experience spontaneous buying stimuli. They tend to be motivated by immediate gratification and are more likely to act on a whim in purchase situations. Also, the high impulse buyer is likely to be prompted by the physical proximity of a desired product and dominated by an emotional attraction to it. In extreme cases, the behavior may by totally stimulus driven—translating into and yielding to a physical response or consumer “spasm” (Rook and Fisher 1995, p. 306). Description: The buying impulsiveness scale is composed of nine items scored on 5-point Likert-type scales from strongly disagree to strongly agree. Item scores are summed to form an overall index score than can range from 9 to 45. Development: A total of 35 items were first generated to reflect the constructs definition. These items were pretested with a sample of 281 students and tested again with a sample 212 undergraduate students. Via numerous recommended scaling procedures, including exploratory and confirmatory factor analyses, reliability analyses, and other correlationbased tests, the final nine-item form of the scale was derived. Several validity checks via mean-level difference testing and correlations with the buying impulsiveness scale and other constructs were performed. Samples: Three samples were reported on in Rook and Fisher (1995). Two samples were composed of 281 and 212 undergraduate students. A third sample was composed of 104 respondents from a field study conducted in a mall record store. Validity: Confirmatory factor analytic fit indices showed evidence of unidimensionality for the nine-item scale with one of the undergraduate samples (n = 212). Factor loadings were significant and ranged from 0.60 to 0.81 across items, and the coefficient alpha estimate of internal consistency was reported to be 0.88. Hypothesized relationships between “normative evaluation” and the buying impulsiveness scale were also supported. The mall record store sample also showed evidence of a unidimensional scale via confirmatory factor analyses, as well as adequate internal consistency (alpha = 0.82). Correlations of the buying impulsiveness scale with measures of normative evaluation and actual impulse-related buying behavior were 0.10, 0.21, 0.53, and 0.21. With the exception of the 0.10 correlation, all correlations were significant. Numerous other mean-level difference tests also support the validity of the scale. Scores: Throughout the Rook and Fisher (1995) article, various mean scores on splits of their scale or moderating variable measures were reported. In addition, overall mean scores were reported. For the n = 212 sample, the mean (std. dev.) was 25.1 (7.4); and for the n = 104 sample, the mean (std. dev.) was 21.5 (7.1). Source: Rook, Dennis and Robert J. Fisher (1995), “Normative Influences on Impulsive Buying Behavior,” Journal of Consumer Research, 22, 305–13. 1995 by the University of Chicago. Scale items taken from Table 1 (p. 308). Reprinted with permission. 74 HANDBOOK OF MARKETING SCALES Impulsiveness: Buying Impulsiveness Scale (Rook and Fisher 1995) 1. I often buy things spontaneously. 2. “Just do it” describes the way I buy things. 3. I often buy things without thinking. 4. “I see it, I buy it” describes me. 5. “Buy now, think about it later” describes me. 6. Sometimes I feel like buying things on the spur of the moment. 7. I buy things according to how I feel at the moment. 8. I carefully plan most of my purchases. 9. Sometimes I am a bit reckless about what I buy. Notes: Item 8 requires reverse scoring. Items scored on 5-point Likert-type scales from strongly disagree to strongly agree. Chapter 2 Traits and Individual Difference Variables 75 Impulsiveness: Consumer Impulsiveness Scale: CIS (Puri 1996) Construct: Puri (1996) offers the consumer impulsiveness scale (CIS) to “measure people’s chronic values toward impulsiveness” (p. 89). Impulsive behavior results in the choice of an option that offers immediate hedonic benefits but serious long-term consequences. Consistent with existing literature (e.g., Rook 1987), impulsive behavior is viewed as “consumer preference for a smaller, immediate reward over a much larger, later reward, even though they would generally prefer the larger reward” (p. 88). Puri proposes a two-factor framework where the accessibility of the costs versus the benefits of impulsiveness—determined by chronic values or situational characteristics—will influence if consumers behave impulsively or in a controlled manner. Description: The CIS is a two-factor measure composed of a “prudence” subscale and a “hedonic” subscale. The prudence subscale has seven items, and the hedonic subscale has five. All items are represented by a single adjective where respondents indicate the degree to which each adjective describes them on 7-point scales. Item scores are summed within subscales to form two independent, yet related, indices of prudence and hedonism. Development: Twenty-five adjectives were originally judged by two doctoral students and one faculty member. Via this procedure, 13 ambiguous items were deleted. The remaining 12 items that compose the final versions of the prudence and hedonic subscales were then subjected to exploratory and confirmatory factor analyses, reliability analyses, and numerous validity checks with three samples. Three experiments were then conducted that supported Puri’s two-factor framework of consumer impulsiveness, as well as the validity of the CIS subscales. Samples: The three samples used in initial scale development were composed of n = 93 MBA students, n = 90 MBA and PhD students, and n = 127 respondents from India. The three experimental samples were n = 60 undergraduate students, n = 134 undergraduate students, and n = 73 MBA and PhD students. Validity: Via exploratory and then confirmatory factor analyses, it was found that a two-factor model, representing the prudence and hedonic subdimensions, fit the data well. Item-tofactor loadings for these two subdimensions ranged from 0.53 to 0.82 within the respective subdimensions. Though the prudence and hedonic subdimensions are considered separate, a coefficient alpha estimate for all 12 items combined was reported to be 0.82 (n = 93 sample). Split-halves reliability was reported to be 0.83 for all 12 items (n = 90 sample). Evidence of discriminant validity was provided via correlations of the two subscales with Market Mavenism, a measure of Social Desirability, and a measure of Internal-External Locus of Control. These correlations were 0.15, 0.13, and –0.04, respectively, for the hedonic subscale; and 0.02, 0.11, and –0.08, respectively, for the prudence subscale (p > 0.25 for all correlations using the n = 93 sample). Convergent validity was assessed via a correlation of 0.50 between all 12 items of the CIS and a measure of future orientation and willpower. Numerous mean-level difference tests conducted with the three experimental samples also show support for the validity of the CIS. Scores: Throughout the text and tables of the Puri (1996) article, mean scores are reported, primarily based on experimental results. It seems that these mean scores are the result of summing the item scores within each of the subdimensions of the CIS and then dividing by the number of scale items per dimension. 76 HANDBOOK OF MARKETING SCALES Source: Puri, Radhika (1996), “Measuring and Modifying Consumer Impulsiveness: A CostBenefit Accessibility Framework,” Journal of Consumer Psychology, 5 (2), 87–113. 1996 by Lawrence Erlbaum Associates, Inc. Scale items taken from Appendix A (p. 112). Reprinted with permission. Reference: Rook, Dennis W. (1987), “The Buying Impulse,” Journal of Consumer Research, 14, 189–98. Chapter 2 Traits and Individual Difference Variables 77 Impulsiveness: Consumer Impulsiveness Scale: CIS (Puri 1996) Read each of the following adjectives carefully and indicate how well they would describe you. Circle the number on the scale next to the adjective. Numbers near 1 indicate that the adjective would usually describe you, numbers near 4 indicate that it would sometimes describe you, and numbers near 7 indicate that it would seldom describe you. Usually would describe me 1. impulsive 1 Sometimes would describe me 2 3 4 Seldom would describe me 5 6 7 2. careless 3. self-controlled 4. extravagant 5. farsighted 6. responsible 7. restrained 8. easily tempered 9. rational 10. methodical 11. enjoy spending 12. a planner Notes: Items 3, 5, 6, 7, 9, 10, and 12 compose the “prudence” subscale. These items also require reverse scoring. Items 1, 2, 4, 8, and 11 compose the “hedonic” subscale. According to the author, respondents scoring above (below) the median on the reverse-scored prudence subscale are classified as prudents (hedonics). All others are classified as moderates (p. 112). 78 HANDBOOK OF MARKETING SCALES General Self-Control (Tangney, Baumeister, and Boone 2004) Construct: The self-control scale (SCS) is designed to capture differences in general self-control as expressed through control over thoughts, impulse control, emotional control, habit breaking, and performance regulation. Description: The SCS scale consists of 36 items, although a brief self-control scale (BSCS) with 13 items is also offered. Items are scored on a 5-point scale where 1 = not at all and 5 = very much. Items are coded such that higher scores indicated greater ability to exercise selfcontrol, and the scale features a large number of reverse-worded items. The items for both the SCS and BSCS scale are summed to form a single measure of self-control, with possible ranges from 36 to 180 and 13 to 65, respectively. Both scales are presented as onefactor models. Development: Based on a review of previous research, an initial pool of 93 items was generated. Using a combination of empirical analysis with Study 1 data and conceptually based review, the set of items was reduced to 36. In addition, a 13-item brief self-control scale is suggested. The correlation between the 36-item SCS and the 13-item BSCS was 0.93 and 0.92 in Studies 1 and 2, respectively. Samples: Two samples of undergraduate students were used in the scale development process. Study 1 involved 351 students and Study 2 included 255 different students, all of whom were from a large East Coast state university. From Study 2, 233 completed the SCS scale again approximately 3 weeks later to assess test-retest reliability. Validity: Exploratory factor analysis suggested the potential for various factors, but since these factors were correlated, the scale is treated as unidimensional throughout. Coefficient alphas in Study 1 (Study 2) were 0.89 (0.89) for the SCS and 0.83 (0.85) for the BSCS. Test-retest reliability in Study 2 was 0.89 for the SCS and 0.87 for the BSCS. Relationships between SCS and a wide range of other constructs was examined, including social desirability, eating disorders, alcoholism, impulse control, psychological adjustment, interpersonal relationships, moral emotions, and a number of personality traits. The potential for socially desirable responding was somewhat strong, therefore all analysis of relationships was conducted after partialling out these effects. Higher SCS scores are correlated with a higher grade point average, better adjustment, less binge eating and alcohol abuse, better relationships and interpersonal skills, secure attachment, and more optimal emotional responses. Scores: Mean scores (standard deviations) for the SCS were 114.47 (18.81) and 102.66 (18.19) for Studies 1 and 2, while the same estimates for the BSCS were 39.22 (8.58) and 39.85 (8.61). As such, it appears that responses lean toward demonstrating higher self-control. Source: Tangney, June P., Roy F. Baumeister, and Angie Luzio Boone (2004), “High Self-Control Predicts Good Adjustment, Less Pathology, Better Grades, and Interpersonal Success,” Journal of Personality, 72 (April), 271–322. Chapter 2 Traits and Individual Difference Variables 79 General Self-Control (Tangney, Baumeister, and Boone 2004) 1. I am good at resisting temptation.* 2. I have a hard time breaking bad habits.* (R) 3. I am lazy.* (R) 4. I say inappropriate things.* (R) 5. I do certain things that are bad for me, if they are fun.* (R) 6. I refuse things that are bad for me.* 7. People would say that I have iron self-discipline.* 8. Pleasure and fun sometimes keep me from getting work done.* (R) 9. I have trouble concentrating.* (R) 10. I am able to work effectively toward long-term goals.* 11. Sometimes I can’t stop myself from doing something, even if I know it is wrong.* (R) 12. I often act without thinking through the alternatives.* (R) 13. I wish I had more self discipline.* (R) 14. I never allow myself to lose control. 15. People can count on me to keep on schedule. 16. Getting up in the morning is hard for me. (R) 17. I have trouble saying no. (R) 18. I change my mind fairly often. (R) 19. I blurt out whatever is on my mind. (R) 20. People would describe me as impulsive. (R) 21. I spend too much money. 22. I keep everything neat. 23. I am self-indulgent at times. (R) 24. I am reliable. 25. I get carried away by my feelings. (R) 26. I do many things on the spur of the moment. (R) 27. I don’t keep secrets very well. (R) 28. I have worked or studied all night at the last minute. (R) 29. I’m not easily discouraged. 30. I’d be better off if I stopped to think before acting. (R) 31. I engage in healthy practices. 32. I eat healthy foods. 33. I lose my temper too often. (R) 34. I often interrupt people. (R) 35. I sometimes drink or use drugs to excess. (R) 36. I am always on time. Note: Items are scored on a 5-point scale where 1 = not at all and 5 = very much. The items are presented above with the first 13 items as the short-form scale (indicated by an *), and the additional 23 items presented subsequent to that. An (R) indicates items that should be reverse scored. 80 HANDBOOK OF MARKETING SCALES Consumer Spending Self-Control: CSSC (Haws and Bearden 2010) Construct: Consumer Spending Self-Control (CSSC) is defined as the ability to monitor and regulate one’s spending-related thoughts, emotions, and decisions in accordance with self-imposed standards. CSSC provides a more specific construct and measurement of a consumer’s self-control in terms of spending decision making. Description: The CSSC scale consists of 10 items that are assessed on a 7-point Likert-type scale, where 1 = strongly disagree and 7 = strongly agree. The items are averaged to form a single value that represents one’s spending self-control, with higher scores indicating a greater control over one’s spending. Development: An initial pool of 66 items was generated by the authors based on a literature review and openended input from 12 adult consumers. Expert judges were used to reduce the set of items based on their content validity to 32. Responses from Sample 1 were used to reduce the set of items from 32 to 19 based on corrected item-to-total correlations of at least 0.45 or above. In Sample 2, confirmatory factor analysis was used to analyze and refine the measure, resulting in a wellfitting unidimensional model containing 10 items representing monitoring, regulation, and standards. Other samples provided additional evidence of the validity and reliability of CSSC. Samples: Sample 1 consisted of 164 adult consumers, Sample 2 consisted of 176 adult consumers, and Sample 3 consisted of 224 adult consumers. All three of these samples were obtained through student recruiters. An additional sample of 163 student subjects was used to assess test-retest reliability. Study 1 consisted of 173 adult respondents. Study 2 was conducted in two parts separated by 4 weeks and included 204 undergraduate students. Finally, Study 3 had 110 student participants, and Study 4 had 136. Validity: Coefficient alphas were reported as follows: Sample 3 = 0.93, Study 1 = 0.91, Study 2 = 0.93, and Study 4 = 0.90. Test-retest reliability was assessed using a separate sample of 163 and showed a reliability of 0.78 over a 4-week period. The construct reliability and average variance extracted estimates for the CSSC measure for Sample 2 (Sample 1) were 0.93 (0.91) and 0.58 (0.52). Sample 3 assessed both the convergent and discriminant validity between CSSC and general self-control (r = 0.48) and assessed the potential for socially desirable responding. Testing from confirmatory factor analyses provided further support for the unidimensional structure of CSSC and showed the distinction between CSSC and general self-control using the procedures described by Gerbing and Anderson (1988). Additional studies provided support for the nomological network for CSSC by demonstrating relationships with related variables including frugality, impulsive buying, compulsive buying, tightwad-spendthrift, and others. Each of these scales was demonstrated to be related to but distinct from CSSC. Predictive validity was assessed through collecting a variety of outcome variables, including use of credit, shopping decision, investment decisions, and actual purchase behaviors. Scores: Mean scores (standard deviations) were 5.00 (1.13) and 5.06 (1.20) for Samples 1 and 2. Mean scores across all adult samples (total n = 737) are reported overall as 5.16 and based on gender, with mean scores for men at 5.20 and for women at 5.12, which were not statistically different. The mean score from Study 1, which used student participants, was 5.39. Source: Haws, Kelly L. and William O. Bearden (2010), “Spending Self-Control and Consumption Behavior,” working paper, Texas A&M University, College Station, TX 77843. Reference: Gerbing, David W. and James C. Anderson (1988), “An Updated Paradigm for Scale Development Incorporating Unidimensionality and Its Assessment,” Journal of Marketing Research, 25 (May), 186–92. Chapter 2 Traits and Individual Difference Variables 81 Consumer Spending Self-Control: CSSC (Haws and Bearden 2010) 1. I closely monitor my spending behavior. 2. I am able to work effectively toward long-term financial goals. 3. I carefully consider my needs before making purchases. 4. I often delay taking action until I have carefully considered the consequences of my purchase decisions. 5. When I go out with friends, I keep track of what I am spending. 6. I am able to resist temptation in order to achieve my budget goals. 7. I know when to say when regarding how much I spend. 8. In social situations, I am generally aware of what I am spending. 9. Having objectives related to spending is important to me. 10. I am responsible when it comes to how much I spend. Notes: Scored on a 1- to 7-point strongly disagree to strongly agree scale. No reverse coding. 82 HANDBOOK OF MARKETING SCALES Scales Related to Country Image and Affiliation Country Image Scale (Martin and Eroglu 1993) Construct: Country image is defined as “the total of all descriptive, inferential, and informational beliefs about a particular country” (Martin and Eroglu 1993, p. 193). Country image is conceptualized as different from attitude toward the products from a given country. Country image can be affected by direct experience with a country, outside sources of information such as advertising or word of mouth, or inferences (correct or incorrect) from past experience with products from a given country. Description: Although four dimensions of country image were originally conceptualized (i.e., political, economic, technological, and social desirability), the final form of the scale has three dimensions, composed of a five-item political factor, a five-item economic factor, and a four-item technological factor. (It was concluded that the social desirability aspect of the construct was adequately reflected in the three dimensions that were retained.) All items are scored on 7-point semantic differential scales. Item scores can be summed within dimension (factor) to form separate indices for the economic, political, and technological factors, or all 14 item scores can be summed to form one overall country image composite. Development: Via a two-phase procedure, 60 items were originally generated to reflect the four originally conceptualized dimensions of the construct. In the first phase, students and faculty members were used to generate items, and in the second phase eight doctoral students with varying international backgrounds were used. This pool of 60 items was then trimmed to 29 via expert judging of the representativeness of the items to the construct. Then, with six samples, the final form of the scale was derived and validated using principal component analyses, reliability and item analyses, and other correlational techniques. With these samples, the countries of Japan, the United States, India, and West Germany were used as the focal countries of interest in responding to the scales. Samples: A sample of 200 undergraduate and graduate students was used to derive the final form of the scale. Samples of 230, 80, 80, 79, and 79 (all students) were used for further reliability and validity checks. Validity: For the sample n = 200, coefficient alpha was reported to be 0.950 for the entire 14-item country image scale. Alpha estimates for the economic, political, and technological dimensions ranged from 0.56 to 0.71. For the n = 230 sample, coefficient alpha for the entire 14-item scale was 0.925. A split-halves coefficient of 0.78 was also reported for the entire 14-item scale. For the first n = 80 sample, coefficient alpha for the entire 14-item scale was 0.895, with alphas ranging from 0.686 to 0.887 for the three country image dimensions (factors). For the second n = 80 sample, alpha was 0.928 for the entire 14-item scale, with alphas ranging from 0.581 to 0.761 across the three dimensions. As a test of discriminant validity, the three dimensions of country image were correlated with a measure of an image of products with foreign country of origin using the two n = 79 samples. Across all three dimensions, these correlations ranged from 0.18 to 0.51 (p > 0.19 for all). Chapter 2 Traits and Individual Difference Variables 83 Scores: Neither mean nor percentage scores were reported. Source: Martin, Ingrid and Sevgin Eroglu (1993), “Measuring a Multi-Dimensional Construct: Country Image,” Journal of Business Research, 28, 191–210. 1993 by Elsevier Science. Scale items taken from Appendix C (pp. 206–7). Reprinted with permission from Elsevier Science. 84 HANDBOOK OF MARKETING SCALES Country Image Scale (Martin and Eroglu 1993) This is a survey to find out what a person thinks about a certain country. To measure this, we will ask you to rate the country that appears at the top of the page against a series of descriptors by placing a check (X) on the scale from one to seven that best reflects your judgment. There are no right or wrong answers. We are only interested in how YOU perceive the country. (Country Name) 1. Economically developed : 1 : 2 : 3 : 4 : 5 : 6 7 Economically underdeveloped 2. Democratic system Dictatorial system 3. Mass-produced products Handcrafted products 4. Civilian government Military government 5. Predominantly industrialized Predominantly non-industrialized 6. High labor costs Low labor costs 7. High literacy rates Low literacy rates 8. Free market system Centrally planned system 9. Existence of welfare system Lack of a welfare system 10. Stable economic environment Unstable economic environment 11. Exporter of agricultural products Importer of agricultural products 12. Production of high-quality products Production of low-quality products 13. High standard of living Low standard of living 14. High level of technological research Low level of technological research Notes: From Tables 2 through 4 in the Martin and Eroglu (1993) article, it is a bit unclear as to which items pertain to which dimensions. Specifically, table descriptor items differ slightly from Appendix C (the source of the actual scale items) descriptor items. Also, with the exception of items 6 and 9, it would seem that all items require reverse coding such that higher scores reflect higher levels of the construct. Chapter 2 Traits and Individual Difference Variables 85 Country-of-Origin Scale (Parameswaran and Pisharodi 1994; Pisharodi and Parameswaran 1992) Construct: According to Pisharodi and Parameswaran (1992), country of origin is an evolving construct which states that people attach stereotypical “made in” perceptions to products from specific countries and this influences purchase and consumption behaviors in multinational markets. Furthermore, the construct encompasses perceptions of a sourcing country’s economic, political, and cultural characteristics, as well as specific product image perceptions (i.e., in the 1992 study automobiles were the focal product, and in the 1994 study Korean and German brands of automobiles and blenders were the focal products). Description: The final version of the 1992 scale is composed of 24 items scored on 10-point scales ranging from not at all appropriate (1) to most appropriate (10). The scale has six factors; three relate to general product attitudes (GPA), two relate to general country attitudes (GCA), and one relates to specific product attributes (SPA). The first five factors are applicable across product attitudes and country attitudes (i.e., the GPA and GCA factors), and the last factor (SPA) is specific to automobiles. Item scores can be summed within factors to form factor indices. The scale is considered multidimensional, but items within the factors reflect unidimensional measurement. The final versions of the 1994 scale are composed of 35 items scored on 10-point scales ranging from not at all appropriate (1) to most appropriate (10). Depending on the product category (autos vs. blenders) and the country of origin (Korea vs. Germany), scale content in terms of items-to-factors differ slightly. The scale has eight factors; three relate to general product attitudes (GPA), two relate to general country attitudes (GCA), and three relate to specific product attributes (SPA). Item scores can be summed within factors to form factor indices, and the scale is considered multidimensional. Items within the factors reflect unidimensional measurement. Development: In the 1992 chapter, via an extensive review of the literature, 40 items were generated to reflect the GPA, GCA, and SPA factors. Initially, it was felt that the construct would be best represented by just a three-factor solution (i.e., one factor each for GPA, GCA, and SPA). Responses from a large sample were then used to trim the number of items and assess dimensionality and internal consistency. Using confirmatory factor analysis (via LISREL) and the ITAN package (Gerbing and Hunter 1988), an iterative process that examines inter-item correlations, item-factor loadings, and dimensionality derived the final form of the scale. The final form reflected three factors relating to GPA. Two of the GPA factors stress positive attributes (i.e., labeled GPA2 and GPA3), and one reflects negative attributes (i.e., labeled GPA1). The final form of the 1992 scale also contains one factor relating to SPA (positive attributes). In the 1994 study, similar procedures were followed in deriving the final form of the Scale. Samples: A total of 678 adults from a large midwestern metropolitan area responded to the numerous items in the original questionnaire for both the 1992 and 1994 studies. Validity: For the 1992 study, the fit of the six-factor model, representing the final form of the scale, indicated unidimensionality of items in each of the six factors. Coefficient alpha estimates for the factors were 0.872, 0.849, 0.918, 0.735, 0.796, and 0.819 for GCA1, GCA2, GPA1, GPA2, GPA3, and SPA, respectively. For the 1994 study, the fit of the eight-factor model, representing the final form of the scale, indicated adequate fit to the data in terms of items to the factors. Coefficient 86 HANDBOOK OF MARKETING SCALES alpha estimates of the factors for the German brands ranged from a low 0.609 for a three-item SPA2 factor (i.e., blender) to a high of 0.943 for an eight-item SPA1 factor (i.e., blender). Coefficient alpha estimates of the factors for the Korean brands ranged from a low 0.586 for a three-item SPA2 factor (i.e., blender) to a high of 0.924 for an eight-item SPA1 factor (i.e., blender). Scores: Neither mean nor percentage scores were reported in the 1992 or 1994 studies. Sources: Parameswaran, Ravi and Mohan R. Pisharodi (1994), “Facets of Country-of-Origin Image: An Empirical Assessment,” Journal of Advertising, 23, 44–56. 1994 by Publisher. Scale items taken from Table 1 (pp. 47–8). Pisharodi, R. Mohan and Ravi Parameswaran. (1992), “Confirmatory Factor Analysis of a Country-of-Origin Scale: Initial Results,” in Advances in Consumer Research, Vol. 19, eds. John Sherry and Brian Sternthal, Provo, UT: Association for Consumer Research, pp. 706–14. 1992 by the Association for Consumer Research. Scale items taken from Table 1 (p. 708). Reprinted with permission. Reference: Gerbing, David W. and John E. Hunter (1988), ITAN: A Statistical Package for Item Analysis With Correlational Data Including Multiple Groups Factor Analysis, Portland, OR: Portland State University. Chapter 2 Traits and Individual Difference Variables Country-of-Origin Scale (Pisharodi and Parameswaran 1992) General Country Attitudes: GCA1 Items 1. Well educated 2. Hard-working 3. Achieving high standards 4. Raised standards of living 5. Technical skills General Country Attitudes: GCA2 Items 1. Similar political views 2. Economically similar 3. Culturally similar General Product Attitudes: GPA1 Items 1. Unreasonably expensive 2. Imitations 3. Not attractive 4. Frequent repairs 5. Cheaply put together General Product Attitudes: GPA2 Items 1. Sold in many countries 2. Intensely advertised 3. Advertising information 4. Easily available General Product Attitudes: GPA3 Items 1. Long lasting 2. Good value 3. Prestigious products Specific Product Attitudes: SPA Items 1. Workmanship good 2. Handles well 3. Little maintenance 4. Made to last 87 88 HANDBOOK OF MARKETING SCALES Country-of-Origin Scale (Parameswaran and Pisharodi 1994) General Country Attitudes: GCA Items C1. Friendly & likable C2. Artistic & creative C3. Well educated C4. Hard-working C5. Technical education C6. Achieving high standards C7. Raised standards of living C8. Technical skills C9. Similar political views C10. Economically similar C11. Culturally similar C12. Participates in international affairs General Product Attitudes: GPA Items P1. Unreasonably expensive P2. Luxury products P3. Meticulous workmanship P4. Imitations P5. Known mainly for industrial products P6. Sold in many countries P7. Not attractive P8. Intensely advertised P9. Frequent repairs P10. Wide range of models P11. Long lasting P12. Advertising informative P13. Difficult to service P14. Cheaply put together P15. High technology P16. Good value P17. Easily available P18. Prestigious product Chapter 2 Traits and Individual Difference Variables 89 Specific Product Attitudes: SPA Items (Cars) S1. Good fuel economy S2. Exterior styling attractive S3. Workmanship good S4. Handles well S5. Little maintenance S6. Very comfortable S7. Difficult to get parts S8. Quality service S9. Made to last S10. Overall excellent Specific Product Attitudes: SPA Items (Blenders) S1. High quality S2. Very good workmanship S3. Exterior design attractive S4. Difficult to find spares S5. Compact S6. Versatile S7. Operate very quickly S8. Not durable S9. Not safe S10. Good value for the money S11. Overall excellent Notes: For both 1992 and 1994 versions, items scored on 10-point scales ranging from not at all appropriate to most appropriate. For this 1994 version, for German brands items C3, C4, and C6 through C8 compose the GCA1 factor (i.e., “people facet”); C9 to C11 compose the GCA2 factor (i.e., the “interaction facet”); items P4, P7, P9, P13, and P14 compose the GPA1 factor (i.e., “undesirable product attributes”); items P6, P7, P12, and P17 compose the GPA2 factor (i.e., “distribution-promotion-based desirable attributes”); items P11, P16, and P18 compose the GPA3 factor (i.e., “product-based general desirable attributes”); items S3, S4, S5, and S9 compose the SPA-Car factor; items S1 to S3, S5 to S7, S10, and S11 compose the SPA1-Blender factor; and items S4, S8, and S9 compose the SPA2-Blender factor. For Korean brands items C1 to C3 and C6 to C8 compose the GCA1 factor (i.e., “people facet”); C9 to C11 compose the GCA2 factor (i.e., the “interaction facet”); items P4, P7, P9, P13, and P14 compose the GPA 1 factor (i.e., “undesirable product attributes”); items P6, P7, and P17 compose the GPA2 factor (i.e., “distribution-promotionbased desirable attributes”); items P11, P15, and P18 compose the GPA3 factor (i.e., “product-based general desirable attributes”); items S3, S4, S5, and S9 compose the SPA-Car factor; items S1 to S3, S5 to S7, S10, and S11 compose the SPAl-Blender factor; and items S4, S8, and S9 compose the SPA2-Blender factor. 90 HANDBOOK OF MARKETING SCALES Ethnocentrism: Consumer Ethnocentrism: CETSCALE (Shimp and Sharma 1987) Construct: The CETSCALE is designed to measure consumers’ ethnocentric tendencies (i.e., disposition to act in a consistent fashion) related to purchasing foreign- versus Americanmade products. Consumer ethnocentrism represents the beliefs held by consumer about the appropriateness, indeed morality, of purchasing foreign-made products (Shimp and Sharma 1987, p. 280). The purchase of foreign-made products, in the minds of ethnocentric consumers, is wrong because it hurts the domestic economy, causes loss of jobs, and is unpatriotic. Description: The scale consists of 17 items scored on 7-point Likert-type formats (strongly agree = 7, strongly disagree = 1). Item scores are summed to form an overall score ranging from 17 to 119. In its original form, the scale was designed for use on American subjects, as most items contain reference to America or the United States. (A shortened 10-item version using a 5-place response format was also tested in the national consumer goods study described below.) Both versions are considered unidimensional. Development: Recommended scaling procedures were used in scale development. The CETSCALE was developed using an initial pool of 180 nonredundant items based on the common wording of responses from an open-ended elicitation study of 800 consumers. Following a judgmental screening of items by a panel of six academics, two purification studies were conducted to develop the final form of the scale. Initially, the development phase addressed seven facets of consumers’ orientations toward foreign products. Common factor analysis of the data obtained in the first purification study reduced the item pool to 25 items reflecting the ethnocentrism dimension. From the second purification study, 17 items consistently demonstrated satisfactory reliability in a series of confirmatory factor analyses. Samples The respondents were 407 households in the first study, The second study included approximately 320 households from each of three metropolitan areas (Detroit, Denver, Los Angeles) and 575 households from the Carolinas. Using some of these same data, four additional studies were conducted to assess reliability and validity of the scale: (a) four area studies, n = 1,535; (b) Carolinas study, n = 47; (c) national consumer goods study involving student subjects. Validity: The assessment of reliability and validity of the CETSCALE in the original article was stringent and extensive. Only a brief summary is provided here. Interested readers are advised to refer to Shimp and Sharma (1987) for details. Internal consistency estimates of reliability ranged from 0.94 to 0.96; test-retest was estimated at 0.77. Evidence of convergent and discriminant validity was provided by significant and positive correlations of the CETSCALE and measures of patriotism and political-economic conservatism. Extensive tests of nomological validity (in one instance over a 2-year delay) were also presented in support of the scale. Briefly, scale scores were found, as predicted, negatively correlated with varying measures of consumers’ beliefs, attitudes, and intentions toward foreign-made products. Other data revealed that origin of manufacturer was more important for high scorers and that higher scorers were biased in favor of American products and in opposition to European and Asian products. Finally, tests of mean differences revealed that scores were highest among individuals whose quality of life and economic situation (and hardships) are threatened by foreign competition (i.e., lower social classes, Detroit respondents). Chapter 2 Traits and Individual Difference Variables 91 Scores: Mean scores (std. dev.) for the CETSCALE for the four geographic areas followed a predicted pattern: (a) Detroit, 68.58 (25.96); (b) Carolinas, 61.28 (24.41); (c) Denver, 57.84 (26.10); (d) Los Angeles, 56.62 (26.37). The mean scores for the two-phase student sample used in the crafted-with-pride study resulted in mean scores of 51.92 (16.37) and 53.39 (16.52). Scores also were found to decline predictably across three social classes: upper-lower, 73.63; lower-middle, 64.01; and upper-middle, 51.91. Source: Shimp, Terence A. and Subhash Sharma (1987), “Consumer Ethnocentrism: Construction and Validation of the CETSCALE.” Journal of Marketing Research, 24, 280–89. 1987 by the American Marketing Association. Scale items taken from Table 1 (p. 282). Reprinted with permission. Other evidence: In a validation study, Netemeyer, Durvasula, and Lichtenstein (1991) used student samples of 71, 73, 70, and 76 from colleges in the United States, Germany, France, and Japan, respectively. Netemeyer et al. (1991) reported alpha levels ranging from 0.91 to 0.95 across the four countries studied. In addition, the CETSCALE was correlated with a number of behavioral measures reflecting a consumer ethnocentric bias. Across countries, these correlations offered evidence of nomological validity for the scale. In a more recent study by Sharma, Shimp, and Shin (1995), the 17-item CETSCALE showed an internal consistency estimate of 0.91. The CETSCALE also showed significant correlations with the social-psychological constructs of openness, r = –0.21; patriotism/conservatism, r = 0.53; and collectivism, r = 0.18 and r = –0.23, and with the demographic characteristics of education, r = –0.25, and income, r = –0.15. The CETSCALE was also shown to be a significant predictor of attitude toward importing various products and perceived economic threat (in regression analyses). The Sharma et al. (1995) study used a sample of 667 Korean consumers. Other sources: Netemeyer, Richard G., Srinivas Durvasula, and Donald R. Lichtenstein (1991), “A Cross-National Assessment of the Reliability and Validity of the CETSCALE,” Journal of Marketing Research, 28, 320–27. Sharma, Subhash, Terence A. Shimp, and Jeongshin Shin (1995), “Consumer Ethnocentrism: A Test of Antecedents and Moderators,” Journal of the Academy of Marketing Science, 25 (1), 26–37. 92 HANDBOOK OF MARKETING SCALES Ethnocentrism: Consumer Ethnocentrism: CETSCALE (Shimp and Sharma 1987) 1. American people should always buy American-made products instead of imports. 2. Only those products that are unavailable in the U.S. should be imported. 3. Buy American-made products. Keep America working. 4. American products, first, last and foremost. 5. Purchasing foreign-made products is un-American. 6. It is not right to purchase foreign products. 7. A real American should always buy American-made products. 8. We should purchase products manufactured in America instead of letting other countries get rich off us. 9. It is always best to purchase American products. 10. There should be very little trading or purchasing of goods from other countries unless out of necessity. 11. Americans should not buy foreign products, because this hurts American business and causes unemployment. 12. Curbs should be put on all imports. 13. It may cost me in the long run but I prefer to support American products. 14. Foreigners should not be allowed to put their products on our markets. 15. Foreign products should be taxed heavily to reduce their entry into the U.S. 16. We should buy from foreign countries only those products that we cannot obtain within our own country. 17. American consumers who purchase products made in other countries are responsible for putting their fellow Americans out of work. Note: Items composing the 10-item reduced version are items 2, 4 through 8, 11, 13, 16, and 17. Items scored on 7-point Likert-type scales from strongly agree to strongly disagree. Chapter 2 Traits and Individual Difference Variables 93 Scales Related to Consumer Opinion Leadership and Opinion Seeking Market Maven: Propensity to Provide Marketplace and Shopping Information (Feick and Price 1987) Construct: The “market maven” refers to individual consumers with a propensity to provide general shopping and marketplace information. Market mavens are defined formally as “individuals who have information about many kinds of products, places to shop, and other facets of markets, and initiate discussions with consumers and respond to requests from consumers for market information” (Feick and Price 1987, p. 85). The definition is comparable with the definition of opinion leaders in that influence derives from knowledge and expertise, but differs in that the expertise is not product specific (i.e., a more general knowledge of markets). Mavens obtain information because they think it will be useful to others or because it will provide a basis for conversations. Description: The scale consists of six statements, five of which are operationalized as 7-place scales labeled strongly disagree to strongly agree. The sixth item has a 7-point response format of the description does not fit me well at all to the description fits me very well. Item scores are summed to form an overall score, and the range of the scale is from 6 to 42. All items are worded such that greater agreement results in a larger total score (i.e., a greater propensity to provide marketplace information). Development: An initial pool of 40 items was generated based on the concept definition. This set was reduced to 19 by a panel of marketing academics and practitioners. Using the responses of a pilot sample of 265 MBAs, factor analysis, item-to-total correlations, and coefficient alpha were used to reduce the final scale to six items. Samples: The main study for which the final instrument was administered involved nationwide telephone interviews (selected by random digit dialing) with 1,531 adult household heads. Sixty-four percent of the sample was female. Subjects were randomly assigned to subsamples; 771 were in the food subsample and 760 in the drug subsample (Feick and Price 1987, p. 87). In addition, 265 part-time MBA students participated in an earlier scale development study. A probability sample of 303 heads of households from a large northeastern city also participated in a study of the discriminant validity of the scale in relation to measures of opinion leadership. Validity: For the pilot study, coefficient alpha was 0.84; item-to-total correlations ranged from 0.51 to 0.67. For the main study, the estimate of internal consistency reliability was 0.82, and item-to-total correlations ranged from 0.48 to 0.65. Validity evidence regarding the concept was provided from responses to queries regarding knowledge of individuals fitting the market maven description (46%) and the importance of those persons in making purchase decisions. Discriminant validity was examined (and supported) through factor analysis of the market maven items and a series of opinion leadership items. The correlation between the maven scale and a measure of opinion leadership was 0.22. Correlations between the market maven measure and a series of innovativeness variables were positive and significant. For example, the correlations for the food sample ranged from 0.31 to 0.34. Discriminant validity evidence was also provided from confirmatory factor analysis of the main study sample. 94 HANDBOOK OF MARKETING SCALES Substantial correlational evidence of the scale’s validity was provided by a series of proposition tests in which the scale was used to form low, medium, and high groups across which a series of difference tests were performed. In addition, the market maven scale was found correlated as predicted with a series of shopping and individual characteristics. These results confirm expectations regarding the construct and, hence, support the validity of the measure. For example, Feick and Price (1987, p. 94) conclude that market mavens exist, and consumers can identify them and use them in making purchase decisions. Furthermore, the concept was found related to early awareness of new products, provision of information, extensive use of information sources, and market activities such as couponing and reading advertising. Scores: The mean score and standard deviation based on the sample of 1,531 interviews were 25.6 and 8.5, respectively. Source: Feick, Lawrence R. and Linda L. Price (1987), “The Market Maven: A Diffuser of Marketplace Information,” Journal of Marketing, 51, 83–97. 1987 by the American Marketing Association. Scale items taken from Appendix (p. 95). Reprinted with permission. Other evidence: Price, Feick, and Guskey-Federouch (1988) report a telephone interview of 213 subjects. Difference tests across groups revealed evidence for the scale’s validity, as mavens were more likely to engage in smart shopping behaviors (i.e., use of coupons, designing grocery budgets) than nonmavens. Other sources: Price, Linda L., Lawrence F. Feick, and Audrey Guskey-Federouch (1988), “Couponing Behaviors of the Market Maven: Profile of a Super Shopper,” in Advances in Consumer Research, Vol. 15, ed. Michael J. Houston, Provo, UT: Association for Consumer Research, pp. 354–49. Chapter 2 Traits and Individual Difference Variables 95 Market Maven: Propensity to Provide Marketplace and Shopping Information (Feick and Price 1987) 1. I like introducing new brands and products to my friends. 2. I like helping people by providing them with information about many kinds of products. 3. People ask me for information about products, places to shop, or sales. 4. If someone asked where to get the best buy on several types of products, I could tell him or her where to shop. 5. My friends think of me as a good source of information when it comes to new products or sales. 6. Think about a person who has information about a variety of products and likes to share this information with others. This person knows about new products, sales, stores, and so on, but does not necessarily feel he or she is an expert on one particular product. How well would you say this description fits you? Note: Items 1 through 5 are scored on 7-place scales labeled strongly disagree to strongly agree. Item 6 is scored from the description does not fit me well at all to the description fits me very well. 96 HANDBOOK OF MARKETING SCALES Opinion Leadership (Childers 1986; King and Summers 1970) Construct: The King and Summers (1970) measure of opinion leadership summarized here is actually an adaptation of an earlier measure presented by Rogers and Cartano (1962). A more recent revision of the scale by Childers (1986) is also summarized. In King and Summers’s (1970) original study of opinion leadership generalization across product categories, a product- or issue-specific seven-item opinion leadership scale was offered. As originally conceptualized, opinion leadership reflects the extent to which individuals give information about a topic and the extent to which information is sought by others from those individuals. Opinion leadership is thought to be a critical determinant of word-of-mouth communication and interpersonal influences affecting the diffusion of new products, concepts, and services. Description: The original King and Summers scale consists of seven items; five are operationalized using a dichotomous response format while the remaining items have three response possibilities. The total range of the scale is from 7 to 16. The items are worded such that alternative product categories can be inserted into each statement. For example, the first item reads as follows: “In general, do you like to talk about ____ with your friends? Yes___ –1 No___ –2.” The revised Opinion Leadership Scale (Childers 1986) also contains seven items adaptable to different product categories. However, the revised measure contains a modified set of items which are each operationalized via 5-place bipolar response formats. Item scores are summed to form a range of 7 to 35. (Both the King and Summers and the Childers versions are included below.) Childers eventually recommends that item 5 be deleted, resulting in a potential range of 6 to 30. Development: The scale was developed by modifying an already existing self-designating measure of opinion leadership (Rogers 1961; Rogers and Cartano 1962). The modifications to the Rogers measure included (a) omitting the word “new” in each of six questions to remove bias in favor of innovators, (b) adding a question, and (c) changing the order of questions (King and Summers 1970, p. 46). Childers (1986) reported two studies in his efforts to investigate the King and Summers measure. The first was designed to evaluate the original scale. His second study was designed to evaluate a revised version in which the response format for all items was changed to 1- to 5-place scales anchored by bipolar adjectives or adjective sets. Samples: The data on which the King and Summers (1970) measure were evaluated reflected the responses of 1,000 housewives interviewed in 1967. Participants were residents of Marion County, Indiana. Responses were obtained for six product categories (i.e., packaged food products, women’s clothing, household cleansers and detergents, cosmetics, large appliances, and small appliances). Respondents were categorized as leaders or nonleaders in a proportion designed to achieve comparability with the opinion leader categorizations of Katz and Lazarfield (1965). Childers’s (1986) initial analysis of the King and Summers scale was based on the responses of 110 respondents to a mail survey. His second study, conducted to examine the revised scale, involved the responses of 176 households either adopting or refusing subscription to a cable service. Validity: Little evidence of validity was offered in the original King and Summers (1970) article. Childers (1986), however, offers several estimates of reliability and validity. An internal consistency reliability estimate of 0.66 was reported by Childers as well as an average itemto-total correlation of 0.43. (Deletion of item 7 increased the reliability estimate to 0.68.) Chapter 2 Traits and Individual Difference Variables 97 The Childers version was found to correlate with measures of product ownership, productspecific risk, multiple use potential, and creativity/curiosity and to differ as expected across known groups (Childers 1986). For example, a correlation of 0.28 with a product-specific measure of perceived risk was found. Other results revealed an internal consistency estimate of 0.83 after deletion of item 5. The average item-to-total correlation improved to 0.62 (after an r to z transformation). Correlations with four of five validity measures were significant as predicted. Mean scores were found to differ across groups as expected (i.e., the means for premium cable subscribers, basic-only subscribers, and refusers were 20.0, 19.5, and 15.2, respectively). Scores: Means and standard deviations were not reported in King and Summers (1970). The means for premium cable subscribers, basic-only subscribers, and refusers in Childers’s second study were 20.0, 19.5, and 15.2, respectively. Sources: Childers, Terry L. (1986), “Assessment of the Psychometric Properties of an Opinion Leadership Scale,” Journal of Marketing Research, 23, 184–88. 1986 by the American Marketing Association. Scale items taken from Table 1 (p. 186). Reprinted with permission. King, Charles W. and John O. Summers (1970), “Overlap of Opinion Leadership Across Product Categories,” Journal of Marketing Research, 7, 43–50. 1970 by the American Marketing Association. Scale items taken from p. 45. Reprinted with permission. Other evidence: A number of studies have used and/or evaluated some form of the opinion leadership scale. Three of these are briefly described here. Darden and Reynolds’s (1972) administration of a modified (five-item) instrument assessed the opinion leadership of suburban males (n = 104) in addition to fraternity (n = 76) and nonfraternity (n = 102) undergraduate students. They report a split-half reliability estimate of 0.79. Riecken and Yavas (1983) report KR-20 estimates of reliability ranging from 0.50 to 0.82 across five samples for the King and Summers version. Their mean scores ranged from 11.59 to 14.99. Goldsmith and Desborde (1991) provide some recent and extensive tests for the revised scale (cf. Childers 1986) (based on the responses of 187 undergraduate business students). Record albums were the domain of study. Goldsmith and Desborde (1991) found significant correlations between the revised scale and measures of awareness (r = 0.46), purchase (r = 0.32), and innovativeness (r = 0.22). The overall mean reported by Goldsmith and Desborde (1991) was 19.3 (SD = 5.66) for Childers’s version. The means for males and females were 20.8 and 17.6, respectively. Flynn, Goldsmith, and Eastman (1994) also examined the psychometric properties of the Childers’s (1986) version of the scale over several products (e.g., jeans, professional clothing, and rock music) and four samples (i.e., n = 172, 128, 247, and 185). They concluded that a six-item version of the scale (i.e., deletion of item 5 below) showed adequate levels of unidimensionality (via structural equation modeling) and internal consistency. Coefficient alpha estimates for this six-item version ranged from 0.78 to 0.88 across the four samples. Other sources: Darden, William R. and Fred D. Reynolds (1972), “Predicting Opinion Leadership for Men’s Apparel Fashions,” Journal of Marketing Research, 9, 324–28. Flynn, Leisa Reinecke, Ronald E. Goldsmith, and Jacqueline K. Eastman (1994), “The King and Summers Opinion Leadership Scale: Revision and Refinement,” Journal of Business Research, 31, 55–64. 98 HANDBOOK OF MARKETING SCALES Goldsmith, Ronald E. and Rene Desborde (1991), “A Validity Study of a Measure of Opinion Leadership,” Journal of Business Research, 22, 11–19. Riecken, Glen and Ugur Yavas (1983), “Internal Consistency of King and Summers’ Opinion Leadership Scale: Further Evidence,” Journal of Marketing Research, 20, 325–26. References: Katz, Elihu and Paul Lazarfield (1965), Personal Influence, Glencoe, IL: Free Press. Rogers, Everett (1961), Characteristics of Agricultural Innovators and Other Adopter Categories (Research Bulletin 882), Wooster: Ohio Experiment Station. Rogers, Everett and David G. Cartano (1962), “Methods of Measuring Opinion Leadership,” Public Opinion Quarterly, 26, 435–41. Chapter 2 Traits and Individual Difference Variables 99 Opinion Leadership (King and Summers 1970) 1. In general, do you like to talk about _______ with your friends? Yes___–1 No___–2 2. Would you say you give very little information, an average amount of information, or a great deal of information about _______ to your friends? You give very little information ____–1 You give an average amount of information ____–2 You give a great deal of information ____–3 3. During the past six months, have you told anyone about some_________? Yes____–1 No____ –2 4. Compared with your circle of friends, are you less likely to be asked, about as likely to be asked, or more likely to be asked about_________? Less likely to be asked ____–1 About as likely to be asked ____ –2 More likely to be asked ____ –3 5. If you and your friends were to discuss_________, what part would you be most likely to play? Would you mainly listen to your friends’ ideas or would you try to convince them of your ideas? You mainly listen to your friends’ ideas ____ –1 You try to convince them of your ideas ____ –2 6. Which of these happens more often? Do you tell your friends about some_________, or do they tell you about some________? You tell them about__________. ____ –1 They tell you about some_________. ____ –2 7. Do you have the feeling that you are generally regarded by your friends and neighbors as a good source of advice about_________? Yes____ –1 No____ –2 Notes: Although not explicitly stated in the original article, it appears that items 1, 3, 6, and 7 require recoding. Items 1, 3, 5, 6, and 7 are operationalized using a dichotomous response format while items 2 and 4 have three response possibilities. 100 HANDBOOK OF MARKETING SCALES Opinion Leadership (Childers 1986) 1. In general, do you talk to your friends and neighbors about cable television: very often 5 never 4 3 2 1 2. When you talk to your friends and neighbors about cable television do you: give a great deal of information 5 4 give very little information 3 2 1 3. During the past six months, how many people have you told about cable television? told a number of people 5 4 told no one 3 2 1 4. Compared with your circle of friends, how likely are you to be asked about cablevision? very likely to be asked 5 4 not at all likely to be asked 3 2 1 5. In a discussion of cablevision, would you be most likely to: listen to your friends’ ideas 5 4 convince your friends of your ideas 3 2 1 6. In discussions of cable television, which of the following happens most often? you tell your friends about cable 5 4 3 your friends tell you about cable 2 1 7. Overall in all of your discussions with friends and neighbors, are you: often used as a source of advice 5 4 not used as a source of advice 3 2 1 Note: Childers (1986) and Flynn et al. (1994) recommend deletion of item 5 (which also apparently requires reverse coding). Items scored using 5-place bipolar response formats shown above. Chapter 2 Traits and Individual Difference Variables 101 Opinion Leadership and Information Seeking (Reynolds and Darden 1971) Construct: Reynolds and Darden’s (1971) view of opinion leadership is similar to that of King and Summers’s (1970) conceptualization in that opinion leadership is felt to reflect the extent to which individuals give information about a topic and the extent to which information is sought by others from those individuals. In operationalizing opinion leadership, though, Reynolds and Darden measured an information seeking factor as well because it is thought to be a critical determinant of word-of-mouth communication and interpersonal influences affecting the diffusion of new products, concepts, and services. Reynolds and Darden used clothing as the focal product in their study. Description: Reynolds and Darden’s (1971) opinion leadership scale is composed of five 5-point Likert-type items scored from strongly disagree to strongly agree. Item scores are summed to form an index of opinion leadership. Their information seeking scale is composed of three 5-point Likert-type items, and scores on these items are also summed to form an overall index of information seeking. Development: Items for both scales were generated from other published sources. The appropriateness of these items was then examined through factor, reliability, and validity analyses on a large sample. Samples: A sample of 300 housewives was used in the study. Validity: Split-halves reliabilities were 0.79 and 0.73 for the opinion leadership and information seeking scales, respectively. Factor analysis revealed that the hypothesized two-factor structure (opinion leadership and information seeking) was confirmed. A number of chi-square tests showed support for the validity of both scales. Source: Reynolds, Fred D. and William R. Darden (1971), “Mutually Adaptive Effects of Interpersonal Communication,” Journal of Marketing Research, 8, 449–54. 1971 by the American Marketing Association. Scale items taken from Appendix (p. 453). Reprinted with permission. Reference: King, Charles W. and John O. Summers (1970), “Overlap of Opinion Leadership Across Product Categories,” Journal of Marketing Research, 7, 43–50. 102 HANDBOOK OF MARKETING SCALES Opinion Leadership and Information Seeking (Reynolds and Darden 1971) Opinion leadership 1. My friends and neighbors often ask my advice about clothing fashions. 2. I sometimes influence the types of clothes my friends buy. 3. My friends come to me more often than I go to them for information about clothes. 4. I feel that I am generally regarded by my friends and neighbors as a good source of advice about clothing fashions. 5. I can think of at least two people whom I have told about some clothing fashion in the last six months. Information seeking 1. I often seek out the advice of my friends regarding which clothes I buy. 2. I spend a lot of time talking with my friends about clothing fashions. 3. My friends or neighbors usually give me good advice on what brands of clothes to buy. Notes: Items scored on 5-point Likert-type scales from strongly disagree to strongly agree. Chapter 2 Traits and Individual Difference Variables 103 Opinion Leaders and Opinion Seekers: OL and OS (Flynn, Goldsmith, and Eastman 1996) Construct: The opinion leader and opinion seeker constructs of Flynn, Goldsmith, and Eastman (1996) are considered domain specific, and not global, patterns of behavior. Opinion leadership occurs when individuals try to influence the purchase behavior of other consumers in specific product fields. Opinion seeking happens when individuals search out advice from others when making a purchase decision. As such, opinion leaders give advice and opinion seekers ask for it (Flynn et al. 1996, p. 138). Description: The opinion leadership scale is composed of six items, and the opinion seeker scale is composed of six items. All items are scored on 7-point scales ranging from strongly disagree to strongly agree. Item scores are summed with the each scale to form indices of opinion leadership (OL) and opinion seeking (OS). Thus, total scores on the scales can range from 6 to 42. Development: Across five studies, using recommended scaling procedures, the two scales were developed and validated. Twenty-one items were originally generated to tap the definitions of the constructs. Six Ph.D. students judged the items for representativeness, trimming the pool to 19 items. Then, over five studies employing 1,128 respondents, the scales were developed and validated using several product categories (e.g., rock music, fashionable clothing, “green” purchases). Procedures used included exploratory and confirmatory factor analyses, item and reliability analyses, and correlations with various related constructs to establish validity. Samples: The first sample was composed of n = 224 undergraduate students, the second sample was composed of n = 263 students, the third sample was composed of n = 391 students, the fourth sample was composed of n = 99 women attending a chamber of commerce professional women’s luncheon, and the fifth sample was composed of n = 162 students. Validity: With the first sample, the final forms of the six-item scales were derived via item analyses. Coefficient alpha estimates of internal consistency were reported to be 0.86 for OL and 0.87 for OS. With the second sample, scale dimensionality was assessed via confirmatory factor analyses (EQS). Various indices of fit indicted that both OS and OL were unidimensional measures. Alphas for the two scales were 0.78 and 0.88 for OL and OS, respectively. The third study also found support for scale unidimensionality (via EQS confirmatory factor analysis), and the internal consistency estimates were 0.87 for OL and 0.88 for OS. The fourth and fifth studies used similar procedures and again found evidence for unidimensional and reliable scales (coefficient alphas of 0.80 and 0.86 for OL, and 0.81 and 0.93 for OS). Test-retest reliability for a large subsample of Study 5 (n = 127) showed test-retest correlations of 0.82 for OL and 0.75 for OS. Numerous correlational-based validity checks were done (see Tables 4, 5, and 6 of Flynn et al. 1996). For example, significant, or where hypothesized nonsignificant, correlations were found in the predicted direction between OL and OS and perceived knowledge, innovativeness, enduring involvement with the product category of interest, fashion shopping, status consumption, and “green behavior.” Correlations between OS and OL ranged from 0.15 to 0.35 across the studies. Furthermore, a convergent validity correlation of 0.72 was reported between OL and King and Summers’s modified opinion leadership scale (Flynn et al. 1994). 104 HANDBOOK OF MARKETING SCALES Scores: Means (std. dev.) were reported for four of the five studies. These scores were 22.1 (7.1) and 23.8 (8.8) for OL and OS in Study 2, 24.8 (7.2) and 24.0 (8.0) for OL and OS in Study 3, 21.6 (6.6) and 19.9 (7.1) for OL and OS in Study 4, and 20.3 (7.5) and 20.5 (9.6) for OL and OS in Study 5. Source: Flynn, Leisa Reinecke, Ronald E. Goldsmith, and Jacqueline K. Eastman (1996), “Opinion Leaders and Opinion Seekers: Two New Measurement Scales,” Journal of the Academy of Marketing Science, 24 (2), 137–47. 1996 by Sage Publications. Scale items taken from Appendix (p. 146). Reprinted with permission. Reference: Flynn, Leisa Reinecke, Ronald E. Goldsmith, and Jacqueline K. Eastman (1994), “The King and Summers Opinion Leadership Scale: Revision and Refinement,” Journal of Business Research, 31, 55–64. Chapter 2 Traits and Individual Difference Variables 105 Opinion Leaders and Opinion Seekers: OL and OS (Flynn, Goldsmith, and Eastman 1996) Opinion Leadership (OL) Items: 1. My opinion on (PRODUCT CATEGORY) seems not to count with other people. 2. When they choose a (PRODUCT CATEGORY), other people do not turn to me for advice. 3. Other people [rarely] come to me for advice about choosing (PRODUCT CATEGORY). 4. People that I know pick (PRODUCT CATEGORY) based on what I have told them. 5. I often persuade others to buy the (PRODUCT CATEGORY) that I like. 6. I often influence people’s opinions about (PRODUCT CATEGORY). Opinion Seeking (OS) Items: 1. When I consider buying a (PRODUCT CATEGORY), I ask other people for advice. 2. I don’t like to talk to others before I buy (PRODUCT CATEGORY). 3. I rarely ask other people what (PRODUCT CATEGORY) to buy. 4. I like to get others’ opinions before I buy a (PRODUCT CATEGORY). 5. I feel more comfortable buying a (PRODUCT CATEGORY) when I have gotten other people’s opinions on it. 6. When choosing (PRODUCT CATEGORY), other people’s opinions are not important to me. Notes: Items 1 through 3 of OL require reverse scoring, and items 2, 3, and 6 of OS require reverse scoring. Items scored on 7-point scales ranging from strongly disagree to strongly agree. 106 HANDBOOK OF MARKETING SCALES Scales Related to Innovativeness Cognitive and Sensory Innovativeness (Venkatraman and Price 1990) Construct: Cognitive (sensory) innovativeness is the preference for engaging in new experiences with the objective of stimulating the mind (senses). Venkatraman and Price (1990) assume that consumer innovativeness is not an undifferentiated construct and that cognitive and sensory innovativeness are differentiated by unique demographic and personality profiles and are related differently to adoption behaviors. Cognitive innovators enjoy thinking for its own sake and have a propensity to devote a great deal of mental energy to solving problems they encounter. Sensory innovators enjoy fantasy and daydreaming and adventurous activities such as skydiving. Description: The final form of the measure(s) includes eight items for both the cognitive and sensory innovativeness scales. Each scale also includes four internal and four external items. The scores are computed by averaging the scores across the internal and external items within each scale. Development: The scales included here represent refinement of the 80-item Novelty Experiencing Scale (NES) (Pearson 1970). Details regarding the specifics of item deletion and selection were not presented. The developmental procedures included tests of alternative factor structures (for the final sets of two eight-item scales) using confirmatory factor analysis. (In the second validity study involving nonstudent subjects, a higher-order factor model provided the best fit to the data.) Prior to these LISREL analyses, item correlations with measures of sensation seeking and cognition seeking apparently were used to select items for the final scale versions (Venkatraman and Price 1990). Several other estimates of reliability and validity were gathered. Samples: The NES items were first examined using a sample of 200 undergraduate students. Participating in the first validation study were 326 undergraduate students; 240 respondents to a mail survey (from an initial sample of 450) participated in the product innovation and demographic characteristic validation study. Of this sample, 59% was male; the average age was 37.2 years. Validity: Coefficient alpha estimates of reliability (based on the initial sample of 200) were 0.73 and 0.69 for the cognitive and sensory scales, respectively. Two follow-up studies were conducted to evaluate the validity of the measures. In the first study (n = 326), the two scales were correlated with a series of related measures. Evidence for support of the hypothesized relationships was found. For example, a significant positive correlation (r = 0.26, p < 0.01) was found between the cognitive innovativeness measure and need for cognition (Cacioppo and Petty 1982). Other correlations in support of the measures include r = 0.41 (p < 0.01) between sensory innovativeness and arousal-seeking tendency (Mehrabian and Russell 1974) and r = 0.22 (p < 0.01) between a measure of impulsivity and sensory innovativeness. A second validity study (n = 245) was conducted to demonstrate that cognitive and sensory innovators differ in their responses to innovations and demographically. The alpha coefficients of reliability for this study were 0.64 and 0.70 for the cognitive and sensory scales, respectively. Hypothesized differences with product purchase behavior across products selected to vary in hedonic value were not found. However, partial support for the demographic predictions were observed: Men scored higher on sensory Chapter 2 Traits and Individual Difference Variables 107 innovativeness, younger respondents scored higher on sensory innovativeness, and higher education was associated with higher cognitive scores. Scores: Some scale mean scores were presented in Table 6 across demographic groups (Venkatraman and Price 1990, p. 309). Source: Venkatraman, Meera P. and Linda L. Price (1990), “Differentiating Between Cognitive and Sensory Innovativeness: Concepts, Measurement, and Implications,” Journal of Business Research, 20, 293–315. 1990 by Elsevier Science. Scale items taken from Table 1 (p. 297). Reprinted with permission from Elsevier Science. References: Cacioppo, John T. and Richard E. Petty (1982), “The Need for Cognition,” Journal of Personality and Social Psychology, 42, 116–31. Mehrabian, Albert and James A. Russell (1974), An Approach to Environmental Psychology, Cambridge: MIT Press. Pearson, Pamela H. (1970), “Relationships Between Global and Specific Measures of Novelty Seeking,” Journal of Consulting and Clinical Psychology, 34, 199–204. 108 HANDBOOK OF MARKETING SCALES Cognitive and Sensory Innovativeness (Venkatraman and Price 1990) Cognitive Innovativeness 1. Finding out the meaning of words I don’t know. 2. Trying to figure out the meaning of unusual statements. 3. Thinking about different ways to explain the same thing. 4. Figuring out the shortest distance from one city to another. 5. Analyzing my own feelings and reactions. 6. Discussing unusual ideas. 7. Thinking about why the world is in the shape it is in. 8. Figuring out how many bricks it would take to build a fireplace. Sensory Innovativeness 1. Being on a raft in the middle of the Colorado River. 2. Having a vivid dream with strange colors and sounds. 3. Riding the rapids in a swift moving stream. 4. Having a strange new feeling as I awake in the morning. 5. Steering a sled down a steep hill covered with trees. 6. Dreaming that I was lying on the beach with the waves running all over me. 7. Walking across a swinging bridge over a deep canyon. 8. Having vivid and unusual daydreams as I was riding along. Notes: Each scale includes four internal and four external items. Scores are computed by averaging the scores across the internal and external items within each scale. Chapter 2 Traits and Individual Difference Variables 109 Domain-Specific Innovativeness: DSI (Goldsmith and Hofacker 1991) Construct: Domain- or product category-specific innovativeness (DSI) reflects the tendency to learn about and adopt innovations (new products) within a specific domain of interest (Goldsmith and Hofacker 1991, p. 211). This definition is consistent with the contention that innovativeness must be identified and characterized on a product category or domain basis (Gatignon and Robertson 1985). Description: The DSI is a six-item scale where the items are scored on 5-point disagree–agree formats. Item scores are summed to form an overall DSI score, and the DSI is considered unidimensional. There are two versions of the DSI. Each version has three positively worded items and three negatively worded items. Therefore, versions can be used interchangeably and are considered applicable to a wide number of product domains. Development: Six studies were used in the development and validation of the DSI. In Study 1, an initial pool of 11 items was generated based on the construct’s definition and a literature review. (Rock music records/tapes was used as the product of interest.) After a pretest of the items on a small sample, a larger sample responded to the items. Via item analysis, coefficient alpha, and preliminary criterion validity checks, the final six items representing the two versions of the DSI were derived. Study 2 further examined the reliability, validity, and factor structure of the two versions of the DSI (again with rock music as the domain). Studies 3 and 4 used fashion and household entertainment equipment as domains and again looked at the psychometric properties of the scales. Study 5 examined the scale’s test-retest reliability, predictive validity, and possible confounds (again with rock music). Finally, Study 6 assessed convergent and discriminant validity using rock music recordings, fashions, and cosmetics as the product categories. Samples: The samples from each of the above six studies were composed of the following. The pretest sample of Study 1 was 27 students, and the large sample of Study 1 was composed of 309 students. Study 2 was composed of 274 students, and Study 3 used 97 female students. Study 4 used 462 nonstudent adults. A sample of 70 students was used in Study 5, and a sample of 306 (students and nonstudents) was used in Study 6. Validity: In Study 1, the correlations of the six items with four measures of criterion validity ranged from 0.26 to 0.40 across items. Coefficient alpha for Study 2 was 0.86, and confirmatory factor analysis (via EQS) supported the scales’ unidimensionality. Correlations of the DSI with seven criterion validity measures ranged from 0.07 to 0.78. In Study 3, alpha for the scale was 0.82, and the positive and negative halves of the scale had a correlation of –0.71. Unidimensionality again was confirmed, and the correlations between the DSI and seven criterion measures ranged from 0.11 to 0.80. Study 4 reported an alpha of 0.81, a unidimensional factor structure, and predictive validity correlations of 0.41 and 0.46. Test-retest reliability in Study 5 was 0.86 (over 15 weeks), and the internal consistency, dimensionality, and predictive validity of the scale were supported. The scale also exhibited low correlations with a measure of social desirability bias (i.e., –0.13 to 0.12). Finally, multitrait-multimethod analysis supported the convergent and discriminant validity of the DSI, and alpha was reported to be 0.85, 0.83, and 0.83 across three different product categories. Scores: Mean scores were reported for several of the studies. In Study 2, the overall mean was 15.8 (SD –5.20). In Study 3, the mean score was 19.4 (SD = 4.64). In Study 4, means of 16.5 (SD = 4.80) and 17.3 (SD = 4.80) were reported for two product categories. 110 HANDBOOK OF MARKETING SCALES Source: Goldsmith, Ronald E. and Charles Hofacker (1991), “Measuring Consumer Innovativeness,” Journal of the Academy of Marketing Science, 19, 209–21. 1991 by Sage Publications. Scale items taken from Table 1 (p. 212). Reprinted with permission. Other evidence: Using a sample of n = 135 adult women, Goldsmith and Flynn (1992) report a coefficient alpha estimate for the innovativeness scale of 0.73. Numerous mean-level difference tests and correlations with related constructs show further evidence for the scales’ validity. For example, those respondents scoring 21 or greater on the DSI (i.e., the top 14% of the sample) showed higher mean scores on measures of fashion interest, fashion media habits, fashion shopping, and other fashion-related constructs than did those respondents scoring 20 or less on the DSI. (“Fashionable clothing” was the focal product of the study.) The DSI was also significantly correlated, in the predicted direction, with 15 different fashion-related attitudinal and behavioral statements. These correlations ranged from 0.24 to 0.59 (p < 0.01). The overall mean score (std. dev.) for the DSI was 16.6 (4.3). Other source: Goldsmith, Ronald and Leisa Reinecke Flynn (1992), “Identifying Innovators in Consumer Product Markets,” European Journal of Marketing, 26 (12), 42–55. Reference: Gatignon, Hubert and Thomas R. Robertson (1985), “A Propositional Inventory for New Diffusion Research,” Journal of Consumer Research, 11, 849–67. Chapter 2 Traits and Individual Difference Variables 111 Domain-Specific Innovativeness: DSI (Goldsmith and Hofacker 1991) 1. In general, I am among the first (last) in my circle of friends to buy a new________when it appears. 2. If I heard that a new________was available in the store, I would (not) be interested enough to buy it. 3. Compared to my friends I own a few of (a lot of)______. 4. In general, I am the last (first) in my circle of friends to know the titles/brands of the latest_______. 5. I will not buy a new______if I haven’t heard/tried it yet. (I will buy a new________if I haven’t heard/tried it yet.) 6. __________I (do/do not) like to buy before other people do. Notes: Items 1, 3, and 4 constitute the negative items in Version 1, and items 2, 5, and 6 constitute the positive items in Version 1. Conversely, items 1, 3, and 4 constitute the positive items in Version 2, and items 2, 5, and 6 constitute the negative items in Version 2. Words/sentences in parentheses denote the positive and negative wording for individual items. Items are scored on 5-point disagree–agree formats. 112 HANDBOOK OF MARKETING SCALES High in Emergent Nature Consumers (Hoffman, Kopalle, and Novak 2010) Construct: The focus of this research is on the right consumers to use when developing new product concepts. These consumers are said to possess an emergent nature, defined as the unique capability to imagine or envision how concepts might be further developed so that they will be successful in the mainstream marketplace (Hoffman et al. 2010). This ability is argued to arise from a unique set of personality traits and processing abilities. For example, emergent consumers exhibit openness to new experiences and ideas, are able to experientially explore and rationally investigate unique alternatives in new product development contexts, and possess the ability to process information both experientially and rationally (Hoffman et al. 2010). Description: The scale consists of eight items, which compose a single unidimensional measure. All items were measured on a 7-point strongly disagree–strongly agree scale response format. Summed versions of the scale were apparently used in the analyses. (As shown below, similar procedures were also used to develop a domain-specific lead user scale as a competing or comparative measure.) Development: Item analyses reduced an initial set of items to 17. The first estimate of reliability for the eight-item scale was 0.93. The same estimate of reliability is reported for the combined sample of 1,124. Confirmatory factor analyses revealed that the measure is distinct but correlated with dispositional innovativeness (r = 0.37) (Steenkamp and Gielens 2003) and the domain-specific lead user measure (r = 0.39). Additional details regarding the scale’s development are provided in a series of web appendices. Overall, the scale was based heavily on psychological theories of information processing and trait-based personality. Samples: Study 1 is based on the responses of 1,124 English-speaking adults and members of a global online panel. The sample was split into a calibration sample (n = 754) and validation sample (n = 370). Study 2a participants were drawn from the Study 1 sample. In Study 2b, 631 English-speaking adults were selected from an online global panel. Study 2c was composed of 97 and 95 individuals from a global online panel. Study 3a and 3b involved the responses of 185 adults and 207 adults purchased from a commercial research panel. Validity: Evidence of scale validation was extensive. To begin, the coefficient alpha estimate was 0.94 in the validation sample. Moderate correlations were again observed with the related constructs. Regression analyses demonstrated that the emergent nature measure added predictive value beyond innovativeness and lead user status regarding a series of personality and information processing scales (Hoffman et al. 2010). As summarized by the authors, multiple studies in both group and individual settings and across the home delivery and oral care product categories demonstrated that emergent consumers are able to develop product concepts that mainstream consumers will find significantly more appealing than concepts developed by typical, lead user, or innovative consumers. Example results include the following. The emergent nature scale was found positively related as predicted with openness to experience, verbal and visual processing, experiential and rational thinking style, creativity, and optimism (Hoffman et al. 2010). Moreover, lead status did not enhance prediction beyond emergent nature in any of these validation scales. Based on a sample of 631 adult consumers from a global online panel (Study 2), results reveal that a new product concept developed in a group setting by emergent consumers was rated significantly higher than similar concepts developed by lead users, innovative consumers, and control participants. In a follow-up study, the high Chapter 2 Traits and Individual Difference Variables 113 emergent concept as found rated higher than the lead user concept on 11 product attributes. Similar results were found for an oral care category product (Study 3) developed in individual settings. Overall, the concepts were found more appealing and associated with higher purchase intent when developed by high emergent nature consumers. Interestingly, the emergent nature consumers tended to emphasize utilitarian attributes relative to the lead user study participants. Scores: From the article web appendix, the range of the scale was reported as 8 to 56 with a mean of 36.88 and a standard deviation of 9.78 for the combined sample of 1,124. Source: Hoffman, Donna L., Praveen K. Kopalle, and Thomas P. Novak (2010), “The ‘Right’ Consumers for Better Concepts: Identifying and Using Consumers High in Emergent Nature to Further Develop New Product Concepts,” Journal of Marketing Research, forthcoming. Reference: Steenkamp, Jan-Benedict E.M. and Katrijn Gielens (2003), “Consumer and Market Drivers of the Trial Rate of New Consumer Products,” Journal of Consumer Research, 30 (December), 368–84. 114 HANDBOOK OF MARKETING SCALES High in Emergent Nature Consumers (Hoffman, Kopalle, and Novak 2010) Emergent Nature 1. When I hear about a new product or service idea, it is easy to imagine how it might be developed into an actual product or service. 2. Even if I don’t see an immediate use for a new product or service, I like to think about how I might use it in the future. 3. When I see a new product or service idea, it is easy to visualize how it might fit into the life of an average person in the future. 4. If someone gave me a new product or service idea with no clear application, I could “fill in the blanks” so someone else would know what to do with it. 5. Even if I don’t see an immediate use for a new product or service, I like to imagine how people in general might use it in the future. 6. I like to experiment with new ideas for how to use products and services. 7. I like to find patterns in complexity. 8. I can picture how products and services of today could be improved to make them more appealing to the average person. Domain-Specific Lead User 1. Other people consider me as “leading edge” with respect to home delivery of goods. 2. I have pioneered some new and different ways for home delivery of goods. 3. I have suggested to stores and delivery services some new and different ways to deliver goods at home. 4. I have participated in offers by stores to deliver goods to my home in new and different ways. 5. I have come up with some new and different solutions to meet my needs for the home delivery of goods. Note: All items were measured on a 7-point Likert scale with strongly disagree and strongly agree as endpoints. Chapter 2 Traits and Individual Difference Variables 115 Innovativeness: Consumer Innovativeness (Manning, Bearden, and Madden 1995) Construct: Consistent with the work of Midgley and Dowling (1978) and Hirschman (1980), Manning, Bearden, and Madden (1995) define and measure two aspects of consumer innovativeness: (a) consumer independent judgment-making (CIJM), which is defined as the degree to which an individual makes innovation decisions independently of the communicated experience of others; and (b) consumer novelty seeking (CNS), which is defined as the desire to seek out new product information. Description: The CIJM scale is composed of six items, and the CNS scale is composed of eight items. All items are 7-point scales ranging from strongly disagree to strongly agree. Item scores are summed within each scale to form overall index scores that can range from 6 to 42 for CIJM, and from 8 to 56 for CNS. Development: Numerous recommended scaling procedures were used to develop and validate the CIJM and CNS scales. After construct definition, 74 items and 60 items were generated by the authors or culled from other sources to reflect CIJM and CNS, respectively. Items were further judged (by the authors) for content validity, retaining 31 items for CIJM and 30 for CNS. Five doctoral students then judged these items for representativeness, trimming the pool of items to 16 each for CIJM and CNS. Three studies, using factor analysis, reliability and item analyses, and numerous validity-related tests, were then conducted to refine and validate the scales. Samples: The first sample was composed of n = 141 adults, the second sample was composed of a combination of university staff members and MBA students (n = 117), and the third sample was composed of n = 71 adult consumers. Validity: Using the n = 141 sample, via exploratory and then confirmatory factor analyses, the final eight- and six-item forms of the scales were derived. Confirmatory factor fit indices offered evidence of unidimensional scales for both the CIJM and the CNS. Coefficient alpha estimates of internal consistency were 0.86 and 0.92, construct reliability estimates (via LISREL) were 0.85 and 0.88, and variance extracted estimates (also via LISREL) were 0.52 and 0.59 for CIJM and CNS, respectively. Factor loadings ranged from 0.58 to 0.89 across the two measures. A hypothesized two-factor solution of CIJM and CNS as separate factors was estimated and fit the data well. The correlation between CIJM and CNS was –0.11 (p > 0.10). The n = 117 sample also showed evidence of unidimensionality and internal consistency for the scales. Coefficient alpha estimates of internal consistency were 0.87 and 0.92, construct reliability estimates (via LISREL) were 0.87 and 0.91, and variance extracted estimates (also via LISREL) were 0.53 and 0.59 for CIJM and CNS, respectively. Factor loading items to constructs ranged from 0.47 to 0.88 for the two scales. Numerous alternative models of the CIJM and CNS scales were estimated, but none fit the data as well as the hypothesized two-factor CIJM-CNS solution. (The correlation between CIJM and CNS was –0.07, p > 0.10). The n = 71 sample also showed unidimensionality and strong evidence of internal consistency for the CIJM and CNS scales (alphas = 0.84 for both scales, and the correlation between CIJM and CNS was 0.15, p < 0.01). As evidence of validity, CNS was found to be correlated with age (r = –0.24, p < 0.05). Also, CNS showed a standardized path estimate of 0.40 (p < 0.01) to “actualized novelty seeking,” and CIJM showed a path estimate of 0.19 (p < 0.05) to “new product trial.” 116 HANDBOOK OF MARKETING SCALES Scores: Mean scores (std. dev.) are offered for the first two samples. For the n = 141 sample, these scores were 22.44 (8.02) and 32.54 (11.22) for CIJM and CNS, respectively. For the n = 117 sample, the scores were 16.94 (6.94) and 32.97 (9.68) for CIJM and CNS, respectively. Source: Manning, Kenneth C., William O. Bearden, and Thomas J. Madden (1995), “Consumer Innovativeness and the Adoption Process,” Journal of Consumer Psychology, 4 (4), 329–45. 1995 by Lawrence Erlbaum Associates, Inc. Scale items taken from Table 1 (p. 334). Reprinted with permission. References: Hirschman, Elizabeth C. (1980), “Innovativeness, Novelty Seeking, and Consumer Creativity,” Journal of Consumer Research, 7, 283–95. Midgley, D. F. and G. R. Dowling (1978), “Innovativeness: The Concept and Its Measurement,” Journal of Consumer Research, 4, 229–42. Chapter 2 Traits and Individual Difference Variables 117 Innovativeness: Consumer Innovativeness (Manning, Bearden, and Madden 1995) CIJM Items 1. Prior to purchasing a new brand, I prefer to consult a friend that has experience with the new brand. 2. When it comes to deciding whether to purchase a new service, I do not rely on experienced friends or family members for advice. 3. I seldom ask a friend about his or her experiences with a new product before I buy the new product. 4. I decide to buy new products and services without relying on the opinions of friends who have already tried them. 5. When I am interested in purchasing a new service, I do not rely on my friends or close acquaintances that have already used the new service to give me information as to whether I should try it. 6. I do not rely on experienced friends for information about new products prior to making up my mind about whether or not to purchase. CNS Items 1. I often seek out information about new products and brands. 2. I like to go to places where I will be exposed to information about new products and brands. 3. I like magazines that introduce new brands. 4. I frequently look for new products and services. 5. I seek out situations in which I will be exposed to new and different sources of product information. 6. I am continually seeking new product experiences. 7. When I go shopping, I find myself spending very little time checking out new products and brands. 8. I take advantage of the first available opportunity to find out about new and different products Notes: Item 1 of CIJM and item 5 of CNS require reverse scoring. Items scored on 7-point scales ranging from strongly disagree to strongly agree. 118 HANDBOOK OF MARKETING SCALES Innovativeness: Use Innovativeness (Price and Ridgway 1983) Construct: Use innovativeness (or variety seeking in product use) involves the use of previously adopted products in novel ways (Price and Ridgway 1983, p. 679). The concept was initially introduced by Hirschman (1980). As conceptualized by Price and Ridgway, use innovativeness encompasses five factors: creativity/curiosity, risk preferences, voluntary simplicity, creative reuse, and multiple use potential. Description: The scale consists of 44 items designed to reflect the five factors. Each item was operationalized using a 7-place, Likert-type format. The factor labels and corresponding number of items are as follows: (a) creativity/curiosity, 13; (b) risk preferences, 9; (c) voluntary simplicity, 5; (d) creative reuse, 10; and (e) multiple use potential, 7. Item scores can be summed within factors for factor indices and can be summed overall for an overall use innovativeness measure. Development: An initial set of 70 items was generated to reflect the five factors assumed to underlie use innovativeness. This set also included five voluntary simplicity items from LeonardBarton (1981). The set of 70 items was reduced to 60 “based on the judgment of several experts.” These 60 items were administered to 358 student subjects along with six questions about calculator usage. The final 44 items were selected using the following criteria: high loadings on the anticipated factor, high item-to-total correlations for each subscale or factor, and high item-to-total correlations for the combined scale. These analyses resulted in 4 items being reassigned to another factor and 16 items (predominantly risk-taking and multiple use measures) being eliminated. Samples: The developmental and validation analyses were performed on a sample of 358 undergraduate student subjects. Validity: Factor analysis was performed to verify the structure of the scale. A four-factor solution was said to be superior; however, five factors are reported. The inclusion of the five items as a voluntary simplicity factor may have accounted for the inconsistency between the reported results and the final scale depicted in Table 1 (Price and Ridgway 1983, pp. 681–82). Estimates of internal consistency for the subscales were 0.86 for creativity/curiosity, 0.70 for risk preferences, 0.64 for voluntary simplicity, 0.82 for creative reuse, and 0.56 for multiple use potential. Again, intercorrelations among the factors range from 0.14 to 0.65. Using scores for the total scale, the sample was partitioned into upper, middle, and lower thirds. Analysis of variance tests of mean differences across groups revealed that the calculator usage scores behaved in a predictable pattern. That is, subjects scoring higher on the scale exhibited greater variety in their use of calculators. Scores: The mean use innovativeness score for the entire scale summed as a whole was 199, varying from a low of 112 to a high of 299 (Price and Ridgway 1983, p. 681). Source: Price, Linda L. and Nancy M. Ridgway (1983), “Development of a Scale to Measure Use Innovativeness,” in Advances in Consumer Research, Vol. 10, eds. Richard P. Bagozzi and Alice M. Tybout, Ann Arbor, MI: Association for Consumer Research, pp. 679–84. 1983 by the Association for Consumer Research. Scale items taken from Table 1 (pp. 681–82). Reprinted with permission. References: Hirschman, Elizabeth C. (1980), “Innovativeness, Novelty Seeking, and Consumer Creativity,” Journal of Consumer Research, 7, 283–95. Leonard-Barton, Dorothy (1981), “Voluntary Simplicity Lifestyles and Energy Conservation,” Journal of Consumer Research, 8, 243–52. Chapter 2 Traits and Individual Difference Variables 119 Innovativeness: Use Innovativeness (Price and Ridgway 1983) Creativity/Curiosity 1. Knowing how a product works offers almost as much pleasure as knowing that the product works well. 2. I am very creative when using products. 3. I am less interested in the appearance of an item than in what makes it tick. 4. As a child, I really enjoyed taking things apart and putting them back together again. 5. As long as a product works well, I don’t really care how it works. 6. Curiosity is one of the permanent and certain characteristics of a vigorous intellect. 7. I am very curious about how things work. 8. I like to build things for my home. 9. If I can’t figure out how something works, I would rather tinker with it than ask for help. 10. I never take anything apart because I know I’ll never be able to put it back together again. 11. I like to fix things around the house. 12. I have gotten instruction in self-reliance skills (e.g., carpentry, car tune-up, etc.). 13. I would rather fix something myself than take it to someone to fix. Risk Preferences 1. When I try to do projects on my own, I’m afraid I will make a worse mess of them than if I had just left them alone. 2. I always follow manufacturer’s warnings against removing the backplates on products. 3. When I try to do projects on my own, without exact directions, they usually work out really well. 4. I find very little instruction is needed to use a product similar to one I’m already familiar with. 5. I’m afraid to buy a product I don’t know how to use. 6. I’m uncomfortable working on projects different from types I’m accustomed to. 7. I always follow manufacturer’s warnings regarding how to use a product. 8. If a product comes in an assembled and an unassembled form, I always buy the assembled form, even though it costs a little more. 9. I like to improvise when I cook. Voluntary Simplicity 1. I like to make clothing or furniture for myself and my family. 2. I often buy clothing at second hand stores. 3. I often make gifts instead of buying them. 4. When building something, it is better to use things already around the house than to buy materials. 5. I often buy items such as furniture at garage sales. 120 HANDBOOK OF MARKETING SCALES Creative Reuse 1. I save broken appliances because I might fix them someday. 2. I save broken appliances because I might be able to use the parts from them. 3. I enjoy thinking of new ways to use old things around the house. 4. I find myself saving packaging on products to use in other ways (e.g., egg cartons, L’eggs pantyhose eggs, plastic shopping bags, etc.). 5. When I build something, I can often make do with things I’ve already got around the house. 6. Even if I don’t have the right tool for the job, I can usually improvise. 7. I never throw something away that I might use later. 8. I take great pleasure in adapting products to new uses that the manufacturer never intended. 9. In general, I would rather alter an old product to work in a new situation than purchase a new product specifically for that purpose. 10. After the useful life of a product, I can often think of ways to use the parts of it for other purposes. Multiple Use Potential 1. I do not enjoy a product unless I can use it to its fullest capacity. 2. I use products in more ways than most people. 3. I often buy a food item for a particular recipe but end up using it for something else. 4. A product’s value is directly related to the ways that it can be used. 5. It’s always impossible to improve on a project by adding new features. 6. After purchase of a product such as a stereo or camera, I try to keep track of new accessories that come out into the market. 7. I enjoy expanding and adding onto projects that I’m involved in on a continuing basis. Notes: Although not explicitly stated by the authors, it would seem that items 5 and 10 of the “creativity/curiosity” factor would require recoding to reflect a higher level of this factor. It would also seem that items 3, 4, and 9 of the “risk preference” factor require recoding to reflect a risk aversion preference, and item 5 of the “multiple use potential” factor requires recoding to reflect a higher level of multiple use potential. Each item was operationalized using a 7-place, Likert-type format. Chapter 2 Traits and Individual Difference Variables 121 The Technology Readiness Index (or Techqual™) (Parasuraman 2000) Construct: Technology readiness refers to people’s propensity to embrace and use technologies for accomplishing goals in home life and at work. The construct is viewed as an overall state of mind resulting from a gestalt of mental enablers and inhibitors that collectively determine a person’s predisposition to use technologies (Parasuraman 2000, p. 308). Description: The technology readiness index (labeled TRI in the article by Parasuraman) is copyrighted by Rockbridge Associates and Parasuraman; its use requires written permission. To request permission, contact Charles Colby (president of Rockbridge Associates) at ccolby@rock research.com or Parasuraman at [email protected]. The final TRI has 36 items grouped into four dimensions: Optimism, Innovativeness, Discomfort, and Insecurity. These items are the ones that have statement labels on the left-hand side of Table 1 (Parasuraman 2000, p. 312)—specifically, OPT1-OPT10 (10 items), INN1-INN7 (7 items), DIS1-DIS10 (10 items), and INS1-INS9 (9 items). See also technoreadymarketing.com. Questions were answered on a 5-point scale, where 1 = strongly disagree, 2 = somewhat disagree, 3 = neutral, 4 = somewhat agree, and 5 = strongly agree. Development: The scale development was a joint effort by the author and Rockbridge Associates of Virginia. The process was an iterative, multiyear, multiphase process in which items were added after an initial scale draft deemed too focused on online issues. The extensive details regarding scale development are described by Parasuraman (2000). Briefly, and as an example, a series of focus groups and review of the literature resulted in an initial pool of 44 items. This set of items was reduced to 28 using a review of coefficient alpha estimates, corrected item-to-total correlations, and exploratory factor analyses. Subsequently, 38 items were added to the preliminary 28-item reduced set. Subsequent analyses on new data resulted in the final 36-item scale composed of four factors. The reliability estimates for the four factors following determination of the final set of items were as follows: optimism, 0.81; innovativeness, 0.80; discomfort, 0.75; and insecurity, 0.74. Confirmatory factor analysis was used to verify the factor structure. Samples: Mail and online responses were obtained from 1,200 college students and young professionals in the Sallie Mae study. In the NTRS study, 1,000 telephone surveys were completed. Validity: Data collected as part of the NTRS study were used to provide additional evidence of validity. The evidence of validity largely involved tests of mean differences across various categories, including the following: ownership of various services, questions about the use of specific technology-based services, and questions about the perceived desirability of engaging in a variety of technology-based services (Parasuraman 2000, p. 315). Examination of the means across categories (e.g., used in past 12 months, plan to use in next 12 months, and no plan to use) revealed that the TRI scores varied as predicted. Scores: Mean scores for the overall TRI scale are reported in Table 4 of Parasuraman (2000, p. 316) for eight different technology services distributed across three ownership categories. For example, TRI means (and sample sizes used to estimate the category means) using a 1 to 5 scale for Internet service at home were reported as follows: currently have, 3.12 (n = 454); plan to get, 2.84 (n = 184); and no plan to get, 2.57 (n = 284). Additional means scores are summarized in Table 5 regarding the relationship between technology readiness and use of technology-based services (Parasuraman 2000, p. 317). Source: Parasuraman, A. (2000), “Technology Readiness Index (TRI): A Multiple-Item Scale to Measure Readiness to Embrace New Technologies,” Journal of Service Research, 2 (May), 307–20. 122 HANDBOOK OF MARKETING SCALES The Technology Readiness Index (or Techqual™) (Parasuraman 2000) Optimism (OPT) 1. Technology gives people more control over their daily lives. 2. Products and services that use the newest technologies are much more convenient to use. 3. You like the idea of doing business via computers because you are not limited to regular business hours. 4. You prefer to use the most advanced technology available. 5. You like computer programs that allow you to tailor things to fit your own needs. 6. Technology makes you more efficient in your occupation. 7. You find new technologies to be mentally stimulating. 8. Technology gives you more freedom of mobility. 9. Learning about technology can be as rewarding as the technology itself. 10. You feel confident that machines will follow through with what you instructed them to do. Innovativeness (INN) 1. Other people come to you for advice on new technologies. 2. It seems your friends are learning more about the newest technologies than you are. (reverse coded) 3. In general, you are among the first in your circle of friends to acquire new technology when it appears. 4. You can usually figure out new high-tech products and services without help from others. 5. You keep up with the latest technological developments in your areas of interest. 6. You enjoy the challenge of figuring out high-tech gadgets. 7. You find you have fewer problems than other people in making technology work for you. Discomfort (DIS) 1. Technical support lines are not helpful because they don’t explain things in terms you understand. 2. Sometimes, you think that technology systems are not designed for use by ordinary people. 3. There is no such thing as a manual for a high-tech product or service that’s written in plain language. 4. When you get technical support from a provider of a high-tech product or service, you sometimes feel as if you are being taken advantage of by someone who knows more than you do. 5. If you buy a high-tech product or service, you prefer to have the basic model over one with a lot of extra features. 6. It is embarrassing when you have trouble with a high-tech gadget while people are watching. 7. There should be caution in replacing important people-tasks with technology because new technology can break down or get disconnected. Chapter 2 Traits and Individual Difference Variables 123 8. Many new technologies have health or safety risks that are not discovered until after people have used them. 9. New technology makes it too easy for governments and companies to spy on people. 10. Technology always seems to fail at the worst possible time. Insecurity (INS) 1. You do not consider it safe giving out a credit card number over a computer. 2. You do not consider it safe to do any kind of financial business online. 3. You worry that information you send over the Internet will be seen by other people. 4. You do not feel confident doing business with a place that can only be reached online. 5. Any business transaction you do electronically should be confirmed later with something in writing. 6. Whenever something gets automated, you need to check carefully that the machine or computer is not making mistakes. 7. The human touch is very important when doing business with a company. 8. When you call a business, you prefer to talk to a person rather than a machine. 9. If you provide information to a machine or over the Internet, you can never be sure it really gets to the right place. Notes: Questions were answered on a 5-point scale, where 1 = strongly disagree, 2 = somewhat disagree, 3 = neutral, 4 = somewhat agree, and 5 = strongly agree. The TRI is copyrighted by Rockbridge Associates and Parasuraman; its use requires written permission. To request permission, contact Charles Colby (president of Rockbridge Associates) at [email protected] or Parasuraman at [email protected]. For more information, please see the website technoreadymarketing.com. 124 HANDBOOK OF MARKETING SCALES Uniqueness: Desire for Unique Consumer Products: DUCP (Lynn and Harris 1997) Construct: The Desire for Unique Consumer Products (DUCP) measures the extent to which consumers hold as a personal goal the acquisition and possession of consumer goods, services, and experiences that few others possess (Lynn and Harris 1997). Antecedents of differences in DUCP include individual differences in the need for uniqueness (Snyder and Fromkin 1980) as well as status aspiration and materialism. Specific consequences of a high DUCP include an increased tendency to acquire and use products that are scarce, innovative, customized, and/or outmoded, as well as a desire to shop at small, unique retail outlets. Description: The scale consists of eight items designed to load on a single factor. Each item was operationalized using a 5-place bipolar scale ranging from strongly disagree to strongly agree. Item scores are summed to create the DUCP score. Development: An initial set of 33 nonredundant items that prima facie appeared to tap a broad array of behaviors and dispositions related to DUCP was generated. The items were administered to 240 business students. A principal components factor analysis was performed, and the eight items that loaded most highly on the first unrotated factor were retained. These items were selected because they had high factor loadings (above 0.50) and represented several different manifestations of the desire for unique consumer products. A maximum likelihood confirmatory analysis on these eight items indicated that a single factor model fit the data well. The consistency and generalizability of the scale were assessed by administering it to 106 working adults. A maximum likelihood confirmatory analysis indicated that a single factor model fit the data well. Samples: The developmental analyses were conducted on convenience samples of (a) 240 business students and (b) 106 working adults. Test-retest reliability was assessed with a sample of 50 business students, correlation with theoretically relevant constructs was assessed using a sample of 337 business and psychology students, and the relationship between DUCP and a behavioral correlate was assessed using a sample of 119 theater patrons. Validity: Coefficient alpha estimates for both the student and nonstudent samples were 0.78. The test-retest reliability (assessed by administering the scale to a new sample of 50 business students, 2 weeks apart) was 0.85. The validity of the measure was first assessed by measuring its relationship with theoretically related personality scales. Based on a sample of 337 students, the scale is significantly correlated with status aspiration, need for uniqueness, acquisitiveness, power-prestige, competitiveness, informational influence, normative influence, and possessiveness. In addition, the validity of the scale was assessed using an actual consumer behavior and a nonstudent sample of consumers. In one study, the scale was administered to 60 patrons of an “artistic” theater showing unusual movies and 59 patrons of a “second-run” theater showing popular movies. DUCP scores of patrons at the artistic theater were significantly higher than scores of patrons at the second-run theater. Scores: Mean scores of DUCP for the student samples were 24.8 and 26.2. Mean scores for the nonstudent samples were 26.2 and 25.25. The authors found no correlation with DUCP scores and sex but did find a correlation with age in some studies, such that younger subjects tended to have higher scores. Chapter 2 Source: Traits and Individual Difference Variables 125 Lynn, Michael and Judy Harris (1997), “The Desire for Unique Consumer Products: A New Individual Differences Scale,” Psychology & Marketing, 14, 601–16. 1997 by John Wiley & Sons, Inc. Scale items taken from Table 1 (p. 608). Adapted by permission of John Wiley & Sons, Inc. Reference: Snyder, C. R. and H. L. Fromkin (1980), Uniqueness: The Human Pursuit of Difference, New York: Plenum. 126 HANDBOOK OF MARKETING SCALES Uniqueness: Desire for Unique Consumer Products: DUCP (Lynn and Harris 1997) 1. I am very attracted to rare objects. 2. I tend to be a fashion leader rather than a fashion follower. 3. I am more likely to buy a product if it is scarce. 4. I would prefer to have things custom-made than to have them ready-made. 5. I enjoy having things that others do not. 6. I rarely pass up the opportunity to order custom features on the products I buy. 7. I like to try new products and services before others do. 8. I enjoy shopping at stores that carry merchandise that is different and unusual. Note: Items scored using 5-place bipolar scales ranging from strongly disagree to strongly agree. Chapter 2 Traits and Individual Difference Variables 127 Scales Related to Consumer Social Influence Attention to Social Comparison Information: ATSCI (Lennox and Wolfe 1984) Construct: Attention to social comparison information (ATSCI) assesses the extent to which one is aware of the reactions of others to one’s behavior and is concerned about or sensitive to the nature of those reactions. These individuals care what other people think about them and look for clues as to the nature of others’ reactions toward them (Lennox and Wolfe 1984). Description: The ATSCI is a 13-item scale where the items are scored from 0 (always false) to 5 (always true). Item scores are summed to form an index. Development: Three studies were performed to arrive at the final 13-item ATSCI. Each study contained Snyder’s (1974) self-monitoring scale, from which the ATSCI is derived. (The items were adjusted to 6-point formats, as Snyder’s scale was originally scored in a dichotomous format.) Also included in the studies were several other items and measures hypothesized to be related to various aspects of ATSCI and self-monitoring. Via factor analysis, reliability, and validity checks, the final form of the ATSCI was derived. Samples: Three student samples (n = 128, 224, and 201) were used to develop the ATSCI across the three studies. Validity: For the third study reported by Lennox and Wolfe (n = 224), the ATSCI had an alpha of 0.83 and was correlated with other measures reflecting concern for the opinions of others: ability to modify self-presentation (r = 0.40), fear of negative evaluation (r = 0.64), and cross-situational variability (r = 0.42). Scores: Mean scores per item are reported by Lennox and Wolfe (1984, p. 1362) for their n = 224 sample. Source: Lennox, Richard D. and Raymond N. Wolfe (1984), “Revision of the Self-Monitoring Scale,” Journal of Personality and Social Psychology, 46, 1349–64. 1984 by the American Psychological Association. Scale items taken from Table 10 (p. 1362). Reprinted with permission. Other evidence: In a consumer behavior context, the ATSCI was examined using student samples of 62, 99, 63, and 85 (Bearden and Rose 1990). Bearden and Rose report alpha estimates for the ATSCI of 0.85, 0.83, 0.88, and 0.89 across their four studies. Furthermore, correlations of the ATSCI with a number of variables reflecting concern for the opinion of others (e.g., public self-consciousness, r = 0.60, 0.40, and 0.46; fear of negative evaluation, r = 0.50; and consumer behavior measures) show strong support for the validity of the ATSCI. Other source: Bearden, William O. and Randall L. Rose (1990), “Attention to Social Comparison Information: An Individual Difference Factor Affecting Consumer Conformity,” Journal of Consumer Research, 76, 461–71. Reference: Snyder, Mark (1974), “The Self-Monitoring of Expressive Behavior,” Journal of Personality and Social Psychology, 30, 526–37. 128 HANDBOOK OF MARKETING SCALES Attention to Social Comparison Information: ATSCI (Lennox and Wolfe 1984) 1. It is my feeling that if everyone else in a group is behaving in a certain manner, this must be the proper way to behave. 2. I actively avoid wearing clothes that are not in style. 3. At parties I usually try to behave in a manner that makes me fit in. 4. When I am uncertain how to act in a social situation, I look to the behavior of others for clues. 5. I try to pay attention to the reactions of others to my behavior in order to avoid being out of place. 6. I find that I tend to pick up slang expressions from others and use them as a part of my own vocabulary. 7. I tend to pay attention to what others are wearing. 8. The slightest look of disapproval in the eyes of a person with whom I am interacting is enough to make me change my approach. 9. It’s important to me to fit into the group I’m with. 10. My behavior often depends on how I feel others wish me to behave. 11. If I am the least bit uncertain as to how to act in a social situation, I look to the behavior of others for cues. 12. I usually keep up with clothing style changes by watching what others wear. 13. When in a social situation, I tend not to follow the crowd, but instead to behave in a manner that suits my particular mood at the time.* Notes: * Denotes item that is reverse scored. Items are scored from 0 (always false) to 5 (always true). Item scores are summed to form an index. Chapter 2 Traits and Individual Difference Variables 129 Balanced Inventory of Desirable Responding: BIDR (Paulhus 1993) Construct: The balanced inventory of desirable responding (BIDR) scale captures the tendency to respond to questions in a manner that makes oneself look good. Two constructs included in the BIDR are self-deceptive enhancement and impression management. Self-deceptive enhancement (SDE) focuses on exaggerated claims of positive attributes that one might possess, while impression management (IM) captures the tendency to overreport good behaviors and underreport less desirable behaviors. As such, SDE is the “tendency to give self-reports that are honest but positively biased,” and IM is “deliberate self-presentation to an audience” (Paulhus 1991, p. 37). Such measures of socially desirable responding are often used when the subject area of one’s research is likely to be one for which subjects may not provide truthful answers. Description: The BIDR consists of 40 items, 20 of which represent SDE and 20 of which represent IM. All items are assessed on a 7-point scale where 1 = Not true, 4 = Somewhat true, and 7 = Very true. Separate scores are created for the two components by assigning one point for each extreme response by the respondent. As such, scale scores range from 0 to 20 for each dimension. Although generally viewed separately and suggested to be separate by Paulhus (1991), the scores from SDE and IM may be combined to represent an overall socially desirable responding tendency. Also, note that a 5-point scale can be used, in which case extreme responses (after reverse coding) are 5 for SDE and 4 or 5 for IM. Note that there are various versions of this scale, some of which are proprietary. We present the BIDR 6. The full normed version is available only from Multi-Health Systems, and users need to purchase it directly from them (see mhs.com). Development: The BIDR 6 was developed to overcome shortcomings of the previous versions, including high correlations between SDE and IM and issues with reverse-coded items. The items are developed as propositions, and the set of items has transitioned over time to reflect updates in the theories distinguishing SDE from IM. Samples: Study 1 included 180 undergraduate respondents. Additional samples are presented (in Table 2), including a sample of 568 undergraduate students and 844 religious adults, among others. A group of 83 undergraduate students was used in a test-retest reliability study. Some of these samples came from other sources. Validity: First, we note that the evidence related to the BIDR is extensive and only a portion is summarized here. Study 1 demonstrated that a two-factor, uncorrelated model fit the data best, indicating the relative independence of SDE and IM. This factor structure was confirmed on a number of additional samples reported by Paulhus (1993). Coefficient alphas from all samples ranged from 0.70 to 0.82 for the SDE and 0.80 to 0.86 for the IM scale. Alphas when the 40 items are considered together ranged from 0.83 to 0.85. Test-retest reliability results from a sample of 83 students showed reliabilities of 0.69 and 0.65 for SDE and IM, respectively, over a 5-week period. The BIDR Version 6 was also compared to other measures of socially desirable responding, including Crowne and Marlowe (1960), which it was highly correlated with at 0.71. The BIDR was also assessed relative to the Big-Five personality dimensions, which demonstrated some of the unique differences between SDE and IM. For example, Extraversion was positively related to SDE but not IM, and Neuroticism was negatively correlated with SDE but not IM. IM was more strongly correlated with Agreeableness than was SDE. 130 HANDBOOK OF MARKETING SCALES Scores: Mean scores are provided for each sample based on gender. Students told to “respond honestly” had the following means (standard deviations): Males, SDE 7.5 (3.2), IM 4.3 (3.1); Females, SDE 6.8 (3.1), IM 4.9 (3.2). In a sample of religious adults, the means were Males, SDE 7.6 (3.1), IM 7.3 (3.1); Females, SDE 7.3 (3.1), IM 8.9 (3.2). These mean scores were calculated using the procedures described under “Notes” following the scale items presented next. Sources: Paulhus, Delroy L. (1991), “Measurement and Control of Response Bias,” Measures of Personality and Social Psychological Attitudes, Academic Press, 17–59. Paulhus, Delroy L. (1993), “The Balanced Inventory of Desirable Responding,” Reference Manual for BIDR Version 6, University of British Columbia, also published by Multi-Health Systems. Reference: Crowne, D. P. and Marlowe, D. A. (1960), “A New Scale of Social Desirability Independent of Psychopathology,” Journal of Consulting Psychology, 24, 349–54. Chapter 2 Traits and Individual Difference Variables Balanced Inventory of Desirable Responding: BIDR (Paulhus 1993) Self-Deceptive Enhancement (SDE) 1. My first impressions of people usually turn out to be right. 2. It would be hard for me to break any of my bad habits. (R) 3. I don’t care to know what other people really think of me. 4. I have not always been honest with myself. (R) 5. I always know why I like things. 6. When my emotions are aroused, it biases my thinking. (R) 7. Once I’ve made up my mind, other people can seldom change my opinion. 8. I am not a safe driver when I exceed the speed limit. (R) 9. I am fully in control of my own fate. 10. It’s hard for me to shut off a disturbing thought. (R) 11. I never regret my decisions. 12. I sometimes lose out on things because I can’t make up my mind soon enough. (R) 13. The reason I vote is because my vote can make a difference. 14. My parents were not always fair when they punished me. (R) 15. I am a completely rational person. 16. I rarely appreciate criticism. (R) 17. I am very confident of my judgments. 18. I have sometimes doubted my ability as a lover. (R) 19. It’s all right with me if some people happen to dislike me. 20. I don’t always know the reasons why I do the things I do. (R) Impression Management (IM) 1. I sometimes tell lies if I have to. (R) 2. I never cover up my mistakes. 3. There have been occasions when I have taken advantage of someone. (R) 4. I never swear. 5. I sometimes try to get even rather than forgive and forget. (R) 6. I always obey laws, even if I’m unlikely to get caught. 7. I have said something bad about a friend behind his or her back. (R) 8. When I hear people talking privately, I avoid listening. 9. I have received too much change from a salesperson without telling him or her. (R) 131 132 HANDBOOK OF MARKETING SCALES 10. I always declare everything at customs. 11. When I was young, I sometime stole things. (R) 12. I have never dropped litter on the street. 13. I sometimes drive faster than the speed limit. (R) 14. I never read sexy books or magazines. 15. I have done things that I don’t tell other people about. (R) 16. I never take things that don’t belong to me. 17. I have taken sick-leave from work or school even though I wasn’t really sick. (R) 18. I have never damaged a library book or store merchandise without reporting it. 19. I have some pretty awful habits. (R) 20. I don’t gossip about other people’s business. Notes: Uses a 7-point scale where 1 = Not true, 4 = Somewhat true, and 7 = Very true. (R) indicates items requiring reverse coding. Once reverse coding is complete, 1 point is assigned for each question that was rated as a 6 or 7 by the respondent. Points are then added separately across the 20 SDE and the 20 IM statements to compute the overall SDE or IM of each respondent. The two scores may also be combined for an overall measure of socially desirable responding. Chapter 2 Traits and Individual Difference Variables 133 Intergenerational Communication and Influence on Consumption: IGEN Scales (Viswanathan, Childers, and Moore 2000) Construct: The authors posit three dimensions of intergenerational communication and influence on consumption: consumer skills—cognitions held with respect to the basic, rational aspects of consumption, such as budgeting, product evaluation, and selection of purchase criteria; consumption-related preferences—perceptions of parent’s preferences at the brand, store, or firm level; and consumer attitude—cognitive and affective orientations toward marketplace stimuli, such as advertising, salespeople, and pricing information (Viswanathan et al. 2000, pp. 408–9). As noted by the authors, each dimension focuses on information conveyed from parents to their children relevant to consumption. Each dimension is also represented separately within two domains of the construct: communication and influence. Description: The IGEN scale(s) has multiple dimensions within each of the construct’s two domains, communication and influence, resulting in six separate scales or dimensions: consumer skills, consumption-related preferences, and consumer attitude scales within the influence domain; and consumer skills, consumption-related preferences, and consumer attitude scales within the communication domain. There are four items within each dimension. All items within the influence domain are scored on 7-point scales ranging from 1 = not at all to 7 = to a large extent. All items within the communication domain are scored on 7-point scales ranging from 1 = never to 7 = very often. Item scores are summed and averaged within dimension to form IGEN dimension scores ranging from 1 to 7. In addition, all consumer skills, consumption-related preferences, and consumer attitude items within the influence domain can be summed and averaged to form one overall influence score ranging from 1 to 7; and all consumer skills, consumption-related preferences, and consumer attitude items within the communication domain can be summed and averaged to form one overall communication score ranging from 1 to 7. Development: Using recommended scaling procedures, the authors conducted three studies, plus initial item development/screening procedures and a pretest to develop and validate the final form of the IGEN scales. Based on a thorough review of the literature, the authors generated a pool of 37 items to tap the IGEN domains/dimensions. A pretest using 100 undergraduate marketing students was then conducted. Via exploratory factor analyses (EFA), reliability analyses, and author judgment, this pool was reduced to the final 12 items encompassing the three IGEN dimensions per construct domain. Three studies were then conducted to assess IGEN factor structure, reliability, and validity. Samples: Study 1, a U.S. sample of n = 196 MBI alumni; Study 2, Thailand sample of n =149 MBI alumni; Study 3, n = 150 undergraduate students and n = 75 parents of those undergraduate students. Validity: Numerous estimates of dimensionality, reliability, and validity were assessed. In Studies 1 and 2, confirmatory factor analyses (CFA) indicated that a three-factor model consistent with the three IGEN dimensions within the influence and communication domains fit the data well. Correlations among the IGEN dimensions across both influence and communication domains ranged from 0.44 to 0.88 across Studies 1 and 2 (U.S. and Thai samples). Coefficient alpha estimates ranged from 0.65 to 0.85 for the IGEN dimensions and ranged from 0.87 to 0.92 for the overall IGEN scale within the influence and communication domains (see Table 2, p. 413). As evidence of validity, the authors examined the relations between parent-child similarity in purchase behavior and family closeness. For both studies, the pattern of correlations showed strong evidence for validity of the 134 HANDBOOK OF MARKETING SCALES IGEN dimensions, with all correlations being positive and 59 of 64 correlations being significant, as hypothesized. Further, the Thai sample (Study 2) showed a pattern of correlations different from the U.S. sample (Study 1) for some of the IGEN dimensions, as anticipated. In Study 3, the IGEN dimensions were further validated. CFA again indicated that a three-factor model within the influence and communication domains fit the data well. Correlations among the IGEN dimensions across both influence and communication mirrored those of Studies 1 and 2. Coefficient alpha estimates ranged from 0.64 to 0.80 for the IGEN dimensions and ranged from 0.84 to 0.90 for the overall IGEN scale within the influence and communication domains. The IGEN dimensions were shown to have discriminant validity from related constructs (e.g., materialism, value consciousness, coupon proneness, choice rules, consumer sentiment toward marketing), and nomological validity was demonstrated by positive correlations with susceptibility to interpersonal influence and parent-child affection (among others). Dyadic analyses (Table 7, p. 420) between matched pairs of students and their parents in Study 3 also showed evidence for the validity of the IGEN dimensions. Scores: Table 2 (p. 413) offers mean scores (SDs) for all dimensions and for the total IGEN scale. The overall 12-item IGEN communication scale had a mean of 4.28 (SD = 0.66), and the overall 12-item IGEN influence scale had a mean of 3.74 (SD = 0.76 in Study 1 [U.S. sample]). In Study 2 (Thai sample), the overall 12-item IGEN communication scale had a mean of 3.66 (SD = 0.47), and the overall 12-item IGEN influence scale had a mean of 3.19 (SD = 0.52). Likewise, the overall 12-item IGEN communication scale had a mean of 4.71 (SD = 0.82), and the overall 12-item IGEN influence scale had a mean of 4.29 (SD = 0.79 in Study 3—young adult sample). Study 3 also showed a parent sample 12item IGEN communication scale mean of 5.09 (SD = 0.64), and the overall 12-item IGEN influence scale had a mean of 4.50 (SD = 0.57). Source: Viswanathan, Madhubalan, Terry L. Childers, and Elizabeth S. Moore (2000), “The Measurement of Intergenerational Communication and Influence on Consumption: Development, Validation, and Cross-Cultural Comparison of the IGEN Scale,” Journal of the Academy of Marketing Science, 28 (3), 406–24. Chapter 2 Traits and Individual Difference Variables 135 Intergenerational Communication and Influence on Consumption: IGEN Scales (Viswanathan, Childers, and Moore 2000) Consumer Skills 1. It is advantageous to be good at money saving, planning future finances, budgeting regularly, paying bills on time, and keeping periodic track of accounts. 2. Their views on “how to choose between products and brands” while shopping. 3. Their views on “how to evaluate information related to a product, its price, its advertisements, and the stores where it is sold.” 4. The best way to shop is to compare two or more brands carefully on several features such as price, quality, and expected life and buy the one that gives the best value overall. Consumption-Related Preferences 1. Why they buy the brands or products they purchase. 2. Their preferences for shopping at different types of stores. 3. Their preferences for different styles of products. 4. Their preferences for different companies and the products/brands made by these different companies. Consumer Attitudes 1. Their views about product information provided by different types of advertising. 2. The role that advertising plays in purchasing decisions (i.e., whether it helps or hinders purchase decisions). 3. Their view on whether price should be used as an indicator of product quality. 4. Whether to rely on salespeople to educate you when making a purchase decision. Notes: For the influence content domain, all items above are followed by the phrase “How much were you influenced by their [your parents] opinions on this issue?” (7-point scales ranging from 1 = not at all to 7 = a large extent). For the communications content domain, all items above are followed by the phrase “Have your parents communicated this to you?” (7-point scales ranging from 1 = never to 7 = very often). 136 HANDBOOK OF MARKETING SCALES Interpersonal Influence: Consumer Susceptibility to Interpersonal Influence (Bearden, Netemeyer, and Teel 1989) Construct: Consumer susceptibility to interpersonal influence is assumed to be a general trait that varies across individuals and is related to other individual traits and characteristics. The construct is defined as the need to identify with or enhance one’s image in the opinion of significant others through the acquisition and use of products and brands, the willingness to conform to the expectations of others regarding purchase decisions, and/or the tendency to learn about products and services by observing others or seeking information from others (Bearden et al. 1989, p. 474), That is, the construct is multidimensional in that both normative influences (e.g., value expressive and utilitarian) and informational influences are considered (e.g., Burnkrant and Cousineau 1975; Deutsch and Gerard 1955). Description: The scale consists of 12 items each operationalized as a Likert, 7-place rating scale ranging from strongly agree to strongly disagree. All items are positively worded. The 12 items reflect two correlated dimensions of susceptibility to interpersonal influence. Item scores are summed within each dimension to form normative and informational indices, and they can be summed overall for an overall susceptibility to interpersonal influence score ranging from 12 to 84. Development: An original pool of 166 items was developed from a review of prior research. The number was reduced to 135 after deletion of ambiguous items and items with essentially identical meaning. Five judges were then used to assign items to categories based on definitions provided for the three factors. Items that did not receive consistent classification by four of the five judges were eliminated. This process reduced the number of items to 86. The pool of items was further reduced to 62 using a second judgmental procedure. That is, those items not classified as clearly representative of each of the three factors by four marketing faculty judges were eliminated. The remaining 62 items were interspersed across the three factors and then administered to a convenience sample of 220 adults. Corrected item-to-total correlations for each factor and oblique factor analysis (restricting the solution to three factors) were used to reduce the set of items to 18. Those items with item-to-total correlations below 0.50 were first deleted. Items not exhibiting simple structure were then eliminated. The remaining 18 items were examined using confirmatory factor analysis which revealed three items with low reliabilities. For the five items remaining as indicators of informational, utilitarian, and value expressiveness influences, the respective construct reliabilities were 0.86, 0.87, and 0.83. Subsequent tests of convergent and discriminant validity revealed, however, that the value expressiveness and utilitarian factors were not discrete. This finding resulted in a 10-item normative factor. Estimates of construct reliability and shared variance for this factor were 0.91 and 0.52. These 15 items were subsequently examined on a student sample of 141 subjects. Confirmatory factor analysis then supported (after the deletion of three additional items) a 12-item scale reflecting informational (four items) and normative influences (eight items). Samples: The first administration obtained responses from a convenience sample of 220 adult (nonstudent) subjects. The second administration involved a survey of 141 student subjects. The validity of the scale was then evaluated on separate samples of 47 students in a correlational study involving measures of self-esteem and attention to social comparison information, 35 and 43 students in a two-phase behavioral index study, 72 fraternity and sorority subjects in the external judges study, and a group of 143 students in a study of motivations to comply. Chapter 2 Traits and Individual Difference Variables 137 Validity: Coefficient alpha estimates for the informational and normative factors were 0.82 and 0.88 (n = 220). A small sample of 35 subjects resulted in corresponding test-retest estimates of 0.75 and 0.79. Confirmatory factor analysis tests of invariant structure across the two samples also supported the stability of the measures. The validity of the measures was further examined in five separate studies (see Bearden et al. 1989, pp. 477–79 for details). First, correlations between the two factors and measures of self-esteem and attention to social comparison information provided some evidence of construct validity in that the correlations were in the direction and pattern as expected. The evidence here was strongest for the normative factor. Second, the correlations between the informational factor and the normative factor and a series of selfreported behavioral indices were 0.37 (p < 0.05) and 0.15, respectively. Third and fourth, two external judgmental rating procedures also supported the ability of the scale to explain susceptibility to interpersonal influences. Lastly, the normative and informational factor measures were correlated with measures of motivations to comply as predicted. These estimates were 0.39 and 0.59 for the informational and normative scales, respectively. Scores: Mean scores were not reported in the studies cited below. The authors did find that students scored significantly higher than nonstudents. Source: Bearden, William O., Richard G. Netemeyer, and Jesse E. Teel (1989), “Measurement of Consumer Susceptibility to Interpersonal Influence,” Journal of Consumer Research, 15, 473–81. 1989 by University of Chicago Press. Scale items taken from Table 2 (p. 477). Reprinted with permission. Other evidence: The dimensionality and validity of the scales were further examined by the same authors (Bearden, Netemeyer, and Teel 1990) in a series of follow-up tests on new data and reanalyses of the data presented above. The results of correlating the susceptibility to interpersonal influence measures with a number of personality traits were reported. For the normative factor, example measures and significant correlations include the following: consumer confidence, r = –0.53; interpersonal orientation, r = 0.38; inner-other directedness, r = 0.37; and extroversion, r = 0.16. In addition, the SUSCEP measures were shown to be more highly correlated with ATSCI and self-esteem than comparable measures developed from Park and Lessig (1977). Confirmatory factor analyses revealed that the two-factor solution was superior to both null and single-factor model solutions in terms of model fit and that the construct reliabilities were similar to those reported by Bearden et al. (1989). In another study, Wooten and Reed (2004) used the eight-item susceptibility to normative social influence scale (α = 0.90) and found that those who scored higher on this scale (M = 31.34) responded more favorably to protective messages pertaining to conspicuous product benefits (e.g., mouthwash prevents bad breath and soap prevents acne) than did those scoring low on the scale (M = 15.62). Wooten and Reed (2004) also examined the relationship between susceptibility to normative social influence and two dimensions of self presentation. Self-presentation reflects the individual’s tendency to make unrealistic favorable self-portrayals by attributing positive, but unlikely attributes to themselves (the attributive dimension), or denying negative traits that probably do apply to them (the repudiative dimension). As hypothesized, susceptibility to normative social influence was negatively related to the attributive dimension (r = –.35) and negatively related to the repudiative dimension (r = –.53). These results collectively suggest further evidence of validity for the eight-item susceptibility to normative social influence scale of Bearden et al. (1989). 138 HANDBOOK OF MARKETING SCALES Other sources: Bearden, William O., Richard G. Netemeyer, and Jesse E. Teel (1990), “Further Validation of the Consumer Susceptibility to Interpersonal Influence Scale,” in Advances in Consumer Research, Vol. 17, eds. Marvin E. Goldberg, Gerald Gorn, and Richard W. Pollay, Provo, UT: Association for Consumer Research, pp. 770–76. Wooten, David B. and Americus Reed II (2004), “Playing It Safe: Susceptibility to Normative Social Influence and Protective Self-Presentation,” Journal of Consumer Research, 31 (December), 551–56. References: Burnkrant, Robert E. and Alain Cousineau (1975), “Informational and Normative Influence in Buyer Behavior,” Journal of Consumer Research, 2, 206–15. Deutsch, Morton and Harold B. Gerard (1955), “A Study of Normative and Informational Influence Upon Individual Judgment,” Journal of Abnormal and Social Psychology, 7 (November), 1–15. Park, C. Whan and Parker V. Lessig (1977), “Students and Housewives: Differences in Susceptibility to Reference Group Influence,” Journal of Consumer Research, 4, 102–10. Chapter 2 Traits and Individual Difference Variables 139 Interpersonal Influence: Consumer Susceptibility to Interpersonal Influence (Bearden, Netemeyer, and Teel 1989) 1. I often consult other people to help choose the best alternative available from a product class. 2. If I want to be like someone, I often try to buy the same brands that they buy. 3. It is important that others like the products and brands I buy. 4. To make sure I buy the right product or brand, I often observe what others are buying and using. 5. I rarely purchase the latest fashion styles until I am sure my friends approve of them. 6. I often identify with other people by purchasing the same products and brands they purchase. 7. If I have little experience with a product, I often ask my friends about the product. 8. When buying products, I generally purchase those brands that I think others will approve of. 9. I like to know what brands and products make good impressions on others. 10. I frequently gather information from friends or family about a product before I buy. 11. If other people can see me using a product, I often purchase the brand they expect me to buy. 12. I achieve a sense of belonging by purchasing the same products and brands that others purchase. Notes: Normative factor items are 2, 3, 5, 6, 8, 9, 11, and 12; informational factor items are 1, 4, 7, and 10. Items are scored using a Likert, 7-place rating scale ranging from strongly agree to strongly disagree. 140 HANDBOOK OF MARKETING SCALES Reference Group Influence: Consumer Susceptibility to Reference Group Influence (Park and Lessig 1977) Construct: Reference group influence is defined as the influence from an actual or imaginary individual or group conceived of having significant relevance on an individual’s evaluations, aspirations, or behavior. Furthermore, reference group influence has three motivational components (Park and Lessig 1977, p. 102): informational, utilitarian, and value expressive. Informational influence is accepted from others for its informational content because it enhances the individual’s knowledge of his/her environment or his/her ability to cope with some aspect of the environment (e.g., a product purchase). Utilitarian influence is based on compliance with others. An individual complies because he/she perceives that significant others can mediate rewards or punishments, because the individual’s behavior is known or visible to others, or because the individual is motivated to realize a reward or avoid punishment. Value expressive influence relates to the individual’s desire to enhance his/her self-concept in the eyes of others (i.e., the individual identifies with positive referents and dissociates him/herself from negative referents). Description: The reference group scale is composed of 14 statements each measured along 4-point scales in regard to one’s consumer behavior (i.e., highly relevant = 4, medium relevance = 3, low relevance = 2, and not relevant = 1). There are five items each for the informational and value expressive dimensions, and four items for the utilitarian dimension. Item scores are summed within dimensions and then divided by the number of items within each dimension to form indices for each dimension. Development: Informal interviews and author judgment were used to generate 18 items that tapped the three dimensions of reference group influence. These items were pretested with a student sample and then trimmed to the final 14-item scale. A number of reliability and validity tests were then performed on new samples over 20 different product categories. Samples: A sample of 22 students was used to trim the pool of 18 statements down to 14. A sample of 42 consumers was used in a validity check study, and samples of 100 housewives and 51 and 37 students also participated in validation studies. Validity: Test-retest reliabilities for the three dimensions ranged from 0.43 to 0.78 (for a subsample of 20 of the housewife sample of 100) and 0.56 to 0.96 (for a subsample of 13 from one of the student samples). Multitrait-multimethod analyses supported the convergent and discriminant validity of the measures, as across products, the correlations among measures of the same trait were high, and correlations with different traits were low. (Beyond this, little detail was provided by Park and Lessig on their MTMM analyses.) Also, a number of mean difference tests between the housewife and student samples supported the scale’s validity. That is, students were more susceptible to reference group influence for products like beer and cigarettes, and housewives were more susceptible to influence for products like furniture. Scores: A number of mean scores are reported by Park and Lessig (1977, Tables 1, 2, 3, and 4, pp. 106–8). Across the 20 products studied, mean scores ranged from 2.46 to 4.00 for informational influence, 2.33 to 3.95 for utilitarian influence, and 1.93 to 3.97 for value expressive influence. Chapter 2 Source: Traits and Individual Difference Variables 141 Park, C. Whan and V. Parker Lessig (1977), “Students and Housewives: Differences in Susceptibility of Reference Group Influence,” Journal of Consumer Research, 4, 102–10. 1977 by University of Chicago Press. Scale items taken from Exhibit (p. 105). Reprinted with permission. Other evidence: Bearden and Etzel (1982) used a slightly modified version of the Park and Lessig measures. Thirteen of the items were used with slight wording changes and measures on 6-point disagree–agree statements (i.e., four items for informational, five for value expressive, and four for utilitarian). Across several product decisions, alphas for the dimensions were 0.63, 0.88, and 0.71 for the informational, value expressive, and utilitarian subscales, respectively. Across several brand decisions, alphas were 0.70, 0.80, and 0.77 for the three dimensions. Average test-retest reliabilities over a 3-week period ranged from 0.53 to 0.68 for the dimensions. A number of mean difference tests showed hypothesized differences between the three influence types. Other source: Bearden, William O. and Michael J. Etzel (1982), “Reference Group Influence on Product and Brand Purchase Decisions,” Journal of Consumer Research, 9, 183–94. 142 HANDBOOK OF MARKETING SCALES Reference Group Influence: Consumer Susceptibility to Reference Group Influence (Park and Lessig 1977) Informational Influence 1. The individual seeks information about various brands and products from an association of professionals or independent group of experts. 2. The individual seeks information from those who work with the products as a profession. 3. The individual seeks brand-related knowledge and experience (such as how Brand A’s performance compares to Brand B’s) from those friends, neighbors, relatives, or work associates who have reliable information about the brands. 4. The brand which the individual selects is influenced by observing a seal of approval of an independent testing agency (such as Good Housekeeping). 5. The individual’s observation of what experts do influences his choice of a brand (such as observing the type of car which police drive or the brand of TV which repairmen buy). Utilitarian Influence 1. To satisfy the expectations of fellow work associates, the individual’s decision to purchase a particular brand is influenced by their preferences. 2. The individual’s decision to purchase a particular brand is influenced by the preferences of people with whom he has social interaction. 3. The individual’s decision to purchase a particular brand is influenced by the preferences of family members. 4. The desire to satisfy the expectations that others have of him has an impact on the individual’s brand choice. Value Expressive Influence 1. The individual feels that the purchase or use of a particular brand will enhance the image which others will have of him. 2. The individual feels that those who purchase or use a particular brand possess the characteristics which he would like to have. 3. The individual sometimes feels that it would be nice to be like the type of person which advertisements show using a particular brand. 4. The individual feels that the people who purchase a particular brand are admired or respected by others. 5. The individual feels that the purchase of a particular brand helps him show others what he is, or would like to be (such as an athlete, successful businessman, good father, etc.). Notes: Each statement is measured along 4-point scales in regard to one’s consumer behavior (i.e., highly relevant = 4, medium relevance = 3, low relevance = 2, and not relevant = 1). Item scores are summed within dimensions and then divided by the number of items within each dimension to form indices for each dimension. Chapter 2 Traits and Individual Difference Variables 143 Self-Monitoring Scale (Snyder 1974) Construct: Self-monitoring of expressive behavior and self-presentation were defined originally by Snyder (1974) as self-observation and self-control guided by situational cues to social appropriateness. An instrument was designed to discriminate individual differences in concern for social appropriateness, sensitivity to the expression and self-presentation of others in social situations as cues to social appropriateness of self-expression, and use of these cues as guidelines for monitoring and managing self-presentation and expressive behavior (Snyder 1974). The self-monitoring scale has generated a substantial body of research that continues to develop. The research includes a number of evaluations of the scale that include both supportive and critical evaluations. The scale has been used successfully in a number of consumer behavior studies (e.g., Becherer and Richard 1978) and has implications for salesperson behavior as well. Description: The scale consists of 25 true-false items. Negatively worded items are reverse scored such that higher scores reflect higher self-monitoring. Labels for each item or situation were “True or Mostly True” and “False or Not Usually True.” Five factors were assumed to underlie the original development of items: (a) concern with the social appropriateness of one’s self-presentation, (b) attention to social comparison information as cues to appropriate self-expression, (c) the ability to control and modify one’s self-presentation and expressive behavior, (d) the use of this ability in particular situations, and (e) the extent to which the person’s self-presentation is cross-situationally consistent or variable (Snyder 1974, p. 529), Items are scored 0 or 1 and summed such that scores range from 0 to 25. Development: A beginning set of 41 true-false items was first administered to 192 Stanford undergraduates. This set included items designed to reflect the above five factors. Items in the final scale were selected based on their contribution to internal consistency and their ability to discriminate between low and high scorers on the original set. Samples: Student samples of 192 and 146 from Stanford and Minnesota were used in the initial development of the scale. Subsamples of actors (n = 24) and psychiatric patients (n = 31) also were used in validity testing. Validity: The KR-20 and test-retest estimates of reliability were 0.70 and 0.83, respectively. The KR-20 estimate reliability for a separate sample of 146 undergraduates was 0.63. Evidence of discriminant validity was provided by a –0.19 (p < 0.05) correlation with the Marlowe-Crowne Social Desirability Scale. Modest correlations with measures of Machiavellianism (r = –0.09) and inner-other directedness (r = –0.19), among others, were also cited as evidence of discriminant validity. A series of other studies were conducted to validate the measure. First, 16 fraternity members participated in a peer rating study of other fraternity members which found the SM measure to be related to external peer ratings of self-monitoring, r = 0.45, p < 0.05. Second, differences in mean scores were obtained between a sample of actors, the Stanford student sample, and a sample of psychiatric patients. Third, in a study of taped expressions, high self-monitors were better able than low self-monitors to express arbitrary emotional states in facial and vocal behavior. Also, in a study in which subjects were allowed to look or not to look at social comparison information (i.e., normative social comparison information) prior to an anticipated task, high self-monitors were more likely than low self-monitors to seek out social comparison information. 144 HANDBOOK OF MARKETING SCALES Scores: The mean scores for the actor and psychiatric patient samples were 18.41 and 10.19, respectively. These means were also said to be significantly above and below the Stanford student sample. Source: Snyder, Mark (1974), “Self-Monitoring of Expressive Behavior,” Journal of Personality and Social Psychology, 30 (4), 526–37. 1974 by the American Psychological Association. Scale items taken from Table 1 (p. 531). Reprinted with permission. Other evidence: Snyder and Gangestad (1986) also offer an 18-item reduced version of Snyder’s (1974) original scale. This version exhibited alpha estimates in excess of 0.70, and the first unrotated factor accounted for 62% of the scale variance. As noted above, the research stimulated by Snyder’s (1974) self-monitoring concept, measure, and related work has been extensive. For an excellent review of this work see Snyder and Gangestad (1986). For consumer behavior purposes, only the manuscript by Becherer and Richard (1978), which reproduces the original scale in their Journal of Consumer Research article, is referenced here. In that research, self-monitoring was shown to moderate the effects on consumer decisions. Specifically, as expected from the theory underlying the self-monitoring construct, situational factors (as opposed to personal dispositions or personality traits) were suggested as being most related to consumption for high self-monitors. In addition, the data indicated that, among the low self-monitoring group, the relationship between a series of personality measures (e.g., tolerance) and private brand proneness was significant for both social and nonsocial products. Other sources: Becherer, Richard C. and Lawrence M. Richard (1978), “Self-Monitoring as a Moderating Variable in Consumer Behavior,” Journal of Consumer Research, 5, 159–62. Snyder, Mark and Steve Gangestad (1986), “On the Nature of Self-Monitoring: Matters of Assessment, Matters of Validity,” Journal of Personality and Social Psychology, 51, 125–39. Chapter 2 Traits and Individual Difference Variables 145 Self-Monitoring Scale (Snyder 1974) 1. I find it hard to imitate the behavior of other people. 2. My behavior is usually an expression of my true inner feelings, attitudes, and beliefs. 3. At parties and social gatherings, I do not attempt to do or say things that others will like. 4. I only argue for ideas which I already believe. 5. I can make impromptu speeches on topics about which I have almost no information. 6. I guess I put on a show to impress or entertain people. 7. When I am uncertain how to act in a social situation, I look to the behavior of others for cues. 8. I would probably make a good actor. 9. I rarely need the advice of my friends to choose books, movies, or music. 10. I sometimes appear to others to be experiencing deeper emotions than I am. 11. I laugh more when I watch a comedy with others than I do when I watch alone. 12. In a group of people, I am rarely the center of attention. 13. In different situations with different people, I often act like very different people. 14. I am not particularly good at making other people like me. 15. Even if I am not enjoying myself, I often pretend to be having a good time. 16. I am not always the person I appear to be. 17. I would not change my opinions (or the way I do things) in order to please someone else or to win their favor. 18. I have considered being an entertainer. 19. In order to get along and be liked, I tend to be what people expect me to be rather than anything else. 20. I have never been good at games like charades or improvisational acting. 21. I have trouble changing my behavior to suit different people and different situations. 22. At a party I let others keep the jokes and stories going. 23. I feel a bit awkward in company and do not show up quite so well as I should. 24. I can look anyone in the eye and tell a lie with straight face (if for a right end). 25. I may deceive people by being friendly when I really dislike them. Notes: A “TRUE” response for items 5 through 8, 10, 11, 13, 15, 16, 18, 19, 24, and 25 reflects high self-monitoring. A “FALSE” response for items 1 through 4, 9, 12, 14, 17, and 20 through 23 also reflects high self-monitoring. Items 1, 3, 4, 5, 6, 8, 12, 13, 14, 16, 17, 18, and 20 through 25 represent Snyder and Gangestad’s 18-item version. The scale consists of 25 true-false items. Items are scored 0 or 1. 146 HANDBOOK OF MARKETING SCALES Self-Monitoring Scale: Revised Form (Lennox and Wolfe 1984) Construct: Lennox and Wolfe (1984) restrict the concept of self-monitoring to the ability to modify self-presentation and sensitivity to the expressive behavior of others. This more narrow definition of the construct is felt to be more reflective of the forte of the high self-monitor (Lennox and Wolfe 1984). Description: The Lennox and Wolfe version of the scale is composed of 13 items each scored on 6-point scales. Subjects are asked to indicate the degree to which each item is reflective of their own behavior: 0 = certainly, always false; 1 = generally false; 2 = somewhat false, but with exceptions; 3 = somewhat true, but with exceptions; 4 = generally true; and 5 = certainly, always true. Seven items represent ability to modify self-presentation, and six items represent sensitivity to the expressive behavior of others. Item scores can be summed within these two factors to form factor indices, or overall to form an overall measure of selfmonitoring (Lennox and Wolfe 1984). Development: Over four studies, Lennox and Wolfe administered and factor-analyzed Snyder’s (1974) original scale and items they generated to measure the construct. In Study 1, they factor-analyzed the original scale and found that several items did not load as hypothesized. In Study 2, they retained 19 of Snyder’s original items, added 28 of their own, and factor-analyzed them using the previously described 6-point scoring system. From these 28 items, a four-factor structure was retained. Studies 3 and 4 further analyzed the scale and resulted in the final two-factor scale to measure self-monitoring. Coefficient alpha and a number of validity checks were performed on the final scale. Samples: The four samples used for the four studies were all composed of student subjects. Samples sizes were 179, 128, 224, and 201 for the four studies, respectively. Validity: The final scale had a coefficient alpha of 0.75 for the total scale (all 13 items), 0.77 for the seven-item ability to modify self-presentation factor, and 0.70 for the sixitem sensitivity to the expressive behavior of others (n = 201). Correlations with related constructs revealed evidence of construct validity. For example, the overall scale had a correlation of 0.30 with a measure of individuation and of 0.17 with private self-consciousness. Scores: Mean scores for the total scale and subscales were not provided. Table 9 of Lennox and Wolfe (1984, p. 1361) provides item means and standard deviations. Source: Lennox, Richard D. and Raymond N. Wolfe (1984), “Revision of the Self-Monitoring Scale,” Journal of Personality and Social Psychology, 46, 1349–64. 1984 by the American Psychological Association. Scale items taken from Table 9 (p. 1361). Reprinted with permission. Reference: Snyder, Mark (1974), “The Self-Monitoring of Expressive Behavior,” Journal of Personality and Social Psychology, 30 (4), 526–37. Chapter 2 Traits and Individual Difference Variables 147 Self-Monitoring Scale: Revised Form (Lennox and Wolfe 1984) Ability to Modify Self-Presentation 1. In social situations, I have the ability to alter my behavior if I feel that something else is called for. 2. I have the ability to control the way I come across to people, depending on the impression I wish to give them. 3. When I feel that the image I am portraying isn’t working, I can readily change it to something that does. 4. I have trouble changing my behavior to suit different people and different situations.* 5. I have found that I can adjust my behavior to meet the requirements of any situation I find myself in. 6. Even when it might be to my advantage, I have difficulty putting up a good front.* 7. Once I know what the situation calls for, it’s easy for me to regulate my actions accordingly. Sensitivity to the Expressive Behaviors of Others 1. I am often able to read people’s true emotions correctly through their eyes. 2. In conversations, I am sensitive to even the slightest change in the facial expression of the person I’m conversing with. 3. My powers of intuition are quite good when it comes to understanding others’ emotions and motives. 4. I can usually tell when others consider a joke to be in bad taste, even though they may laugh convincingly. 5. I can usually tell when I’ve said something inappropriate by reading it in the listener’s eyes. 6. If someone is lying to me, I usually know it at once from that person’s manner of expression. Note: * Denotes items that require reverse coding. Items scored on 6-point scales (0 = certainly, always false; 1 = generally false; 2 = somewhat false, but with exceptions; 3 = somewhat true, but with exceptions; 4 = generally true; and 5 = certainly, always true). 148 HANDBOOK OF MARKETING SCALES TV Program Connectedness Scale (Russell, Norman, and Heckler 2004) Construct: TV program connectedness is defined as “the level of intensity of the relationship(s) that a viewer develops with the characters and contextual settings of a program in the parasocial television environment (Russell et al. 2004, p. 152). Description: The scale is composed of sixteen 5-point Likert scales encompassing six factors. The six factors are considered first-order factors of an overall higher-order construct, and item scores are summed and then averaged over the 16 items to create an overall construct score ranging from 1 to 5. The “Escape” factor (three items) assesses a cathartic element that connects a viewer to a TV program. The “Modeling” factor (three items) measures a social learning process by capturing the degree to which individuals relate their own lives to the lives of the characters in the show. The “Fashion” factor (three items) measures how extensively a viewer is influenced by a character’s appearance. The “Imitation” factor (three items) measures the inclination for people to imitate the show’s characters, likely due to the emotional stimulation of taking on another role. The “Aspiration” factor (two items) identifies how people become so identified with a program that they aspire to be the characters on the show, and the “Paraphernalia” factor (two items) measures the degree to which people collect items to bring the program and characters into their own world. Development: Multiple focus groups were used to generate an 85-item pool based on the construct definition and descriptions of the factors described above. Via author judgment, this pool was trimmed to 45 items. An initial study of 175 students covering 20 TV shows was used to derive the final form of the scale. Via exploratory factor analysis, 16 items encompassing the six factors emerged with an overall coefficient alpha of 0.84. A confirmation study of 613 students tested multiple factor structures that showed a higher-order factor, with the six first-order factors described above fitting the data well. The scale was then tested for various forms of validity via a web-based and mailbased survey (n = 11,000 complete responses). Two more studies, one experimental (n = 104) and one a survey-based recall study (n = 99), were further used to examine the scale’s validity. Samples: As noted above, several samples were used to develop and validate the scale: 1) n = 175 students; 2) n = 613 students; 3) n = 11,000 largely nonstudents; 4) n = 104; and 5) n = 99. Validity: Coefficient alpha across all 16 items was reported for the n = 175 student study (alpha = 0.84). Standardized item loadings on their respective first-order factors ranged from 0.66 to 0.86. For the n = 613 study, unstandardized first-order factor loadings to the higher-order factor ranged from 0.32 to 1.16. Correlations among the first-order factors ranged from 0.15 to 0.62. Using the n = 11,000 sample looking at eight genres of TV shows, discriminant validity was assessed. The correlation between the TV connectedness scale and attitude toward the TV show was 0.26; the correlation between the TV connectedness scale and involvement with the TV show was 0.53; the correlation between the TV connectedness scale and actual viewing of the TV show was 0.15. As evidence of predictive validity, the TV connectedness scale was used as a regression-based independent variable in the prediction of long-term recall of product placements in a show, brand community (with the show), social interaction with the show, and size of a social network with the show. Across all Chapter 2 Traits and Individual Difference Variables 149 regressions, the TV connectedness scale was a significant predictor while accounting for the effects of involvement with the show, attitude toward the show, and overall viewing of the show (standardized beta coefficients ranging from 0.09 to 0.66). Via the n = 104 study, high TV connected individuals were shown to recall more audio and visual elements of a show than low TV connected individuals, and the n = 99 study showed that high TV connected individuals were shown to recall more brands shown in the show than low TV connected individuals. Scores: One mean score was reported for the scale. For the n = 11,000 study, the mean was 2.64 (SD = 0.68). Source: Russell, Cristel A., Andrew T. Norman, and Susan E. Heckler (2004), “The Consumption of Television Programming: Development and Validation of the Connectedness Scale,” Journal of Consumer Research, 31 (June), 150–61. 150 HANDBOOK OF MARKETING SCALES TV Program Connectedness Scale (Russell, Norman, and Heckler 2004) Escape 1. Watching _________ is an escape for me. 2. _______ helps me forget about the day’s problems. 3. If I am in a bad mood, watching ________puts me in a better mood. Fashion 1. I like the clothes they wear on ________. 2. I like the hairstyles on ________. 3. I often buy the clothing that I’ve seen on _______. Imitation 1. I imitate the gestures and facial expressions from the characters in _______. 2. I find myself saying phrases from ______ when I interact with other people. 3. I try to speak like the characters in ______. Modeling 1. I learn to handle real-life situations by watching ______. 2. I get ideas from ______ about how to interact in my own life. 3. I relate what happens in ______ to my own life. Aspiration 1. I would love to be an actor in _______. 2. I would love to meet the characters of ________. Paraphernalia 1. I have objects that relate to _______ (badge, book, picture, etc.) 2. I read books if they are related to _______. Note: All items are scored on 5-point Likert scales.

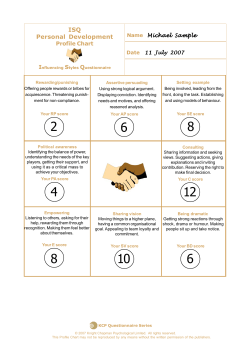


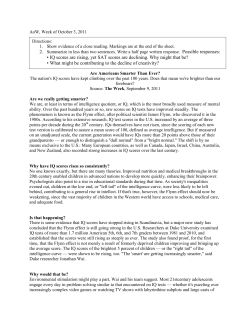


© Copyright 2026