
JProfiler Manual © 2014 ej-technologies GmbH. All rights reserved.
JProfiler Manual
© 2014 ej-technologies GmbH. All rights reserved.
Index
JProfiler help .......................................................................................................................................... 8
How to order ......................................................................................................................................... 9
A Help topics ........................................................................................................................................ 10
A.1 Profiling ...................................................................................................................................... 10
A.1.1 Profiling modes .................................................................................................................. 10
A.1.2 Remote profiling ................................................................................................................ 12
A.1.3 Behind the scenes ............................................................................................................. 16
A.2 Configuration ............................................................................................................................ 20
A.2.1 Session settings ................................................................................................................. 20
A.2.2 Method call recording ....................................................................................................... 23
A.2.3 Configuring filters .............................................................................................................. 25
A.2.4 Offline profiling and triggers ............................................................................................ 29
A.3 Memory profiling ...................................................................................................................... 31
A.3.1 Recording objects .............................................................................................................. 31
A.3.2 Using the difference columns .......................................................................................... 33
A.3.3 Finding a memory leak ...................................................................................................... 35
A.4 CPU profiling ............................................................................................................................. 40
A.4.1 Time measurements ......................................................................................................... 40
A.4.2 Hot spots and filters .......................................................................................................... 42
A.4.3 Request tracking ................................................................................................................ 45
A.4.4 Removing finalizers ........................................................................................................... 48
A.5 Probes ........................................................................................................................................ 50
A.5.1 Probes explained ............................................................................................................... 50
A.5.2 Custom probes ................................................................................................................... 55
B Reference ......................................................................................................................................... 60
B.1 Getting started .......................................................................................................................... 60
B.1.1 Quickstart dialog ................................................................................................................ 60
B.1.2 Running the demo sessions ............................................................................................. 60
B.1.3 Overview of features ......................................................................................................... 60
B.1.4 JProfiler's start center ........................................................................................................ 62
B.1.5 Application server integration .......................................................................................... 63
B.1.6 IDE integration ................................................................................................................... 63
B.1.7 JProfiler licensing ............................................................................................................... 64
B.2 IDE integrations ........................................................................................................................ 65
B.2.1 Overview ............................................................................................................................. 65
B.2.2 IntelliJ IDEA .......................................................................................................................... 65
B.2.3 Eclipse ................................................................................................................................. 69
B.2.4 JDeveloper .......................................................................................................................... 71
B.2.5 Netbeans ............................................................................................................................. 73
B.3 Managing sessions ................................................................................................................... 76
B.3.1 Overview ............................................................................................................................. 76
B.3.2 Application settings ........................................................................................................... 77
B.3.2.1 Overview ...................................................................................................................... 77
B.3.2.2 Attach to local JVM session ........................................................................................ 79
B.3.2.3 Attach to profiled JVM session ................................................................................... 79
B.3.2.4 Launched application session ................................................................................... 80
B.3.2.5 Launched applet session ........................................................................................... 81
B.3.2.6 Launched Java Web Start session ............................................................................. 82
B.3.2.7 Code editor settings ................................................................................................... 82
B.3.3 Filter settings ...................................................................................................................... 82
B.3.3.1 Overview ...................................................................................................................... 82
B.3.3.2 Define filters ................................................................................................................ 83
B.3.3.3 View filter tree ............................................................................................................. 84
B.3.3.4 Filter templates ........................................................................................................... 84
B.3.3.5 Exceptional methods .................................................................................................. 85
B.3.3.6 Ignored methods ........................................................................................................ 86
B.3.4 Profiling settings ................................................................................................................ 87
B.3.4.1 Overview ...................................................................................................................... 87
B.3.4.2 Method call recording ................................................................................................ 88
B.3.4.3 CPU profiling ................................................................................................................ 89
B.3.4.4 Probes & JEE ................................................................................................................ 90
B.3.4.5 Memory profiling ........................................................................................................ 91
B.3.4.6 Thread profiling ........................................................................................................... 92
B.3.4.7 Miscellaneous settings ............................................................................................... 92
B.3.4.8 Profiling settings templates ....................................................................................... 94
B.3.5 Trigger settings ................................................................................................................... 94
B.3.5.1 Overview ...................................................................................................................... 94
B.3.5.2 Trigger wizard .............................................................................................................. 95
B.3.5.3 Trigger event types ..................................................................................................... 95
B.3.5.4 Trigger actions ............................................................................................................. 98
B.3.5.5 Trigger sets ................................................................................................................ 101
B.3.5.6 Adding triggers from call trees ................................................................................ 102
B.3.5.7 Enabling and disabling ............................................................................................. 102
B.3.6 Probe settings .................................................................................................................. 102
B.3.6.1 Overview .................................................................................................................... 102
B.3.6.2 Databases .................................................................................................................. 103
B.3.6.3 Built-in probes ........................................................................................................... 104
B.3.6.4 Custom probes .......................................................................................................... 105
B.3.7 Open session dialog ........................................................................................................ 107
B.3.8 Session startup dialog ..................................................................................................... 107
B.3.9 Recording profiles ............................................................................................................ 108
B.3.10 Attaching to JVMs ........................................................................................................... 109
B.3.11 Starting remote sessions .............................................................................................. 110
B.3.12 Profiling agent configuration ....................................................................................... 111
B.3.13 Saving live sessions to disk ........................................................................................... 113
B.3.14 Config synchronization ................................................................................................. 115
B.3.15 Session importing and export ...................................................................................... 115
B.4 General settings ...................................................................................................................... 117
B.4.1 Overview ........................................................................................................................... 117
B.4.2 Java VMs ............................................................................................................................ 117
B.4.3 JREs for launching sessions ............................................................................................ 117
B.4.4 JDKs for code editor ........................................................................................................ 118
B.4.5 Session defaults ............................................................................................................... 119
B.4.6 Snapshots ......................................................................................................................... 119
B.4.7 IDE integrations ............................................................................................................... 120
B.4.8 Miscellaneous options .................................................................................................... 120
B.5 Scripts ...................................................................................................................................... 122
B.5.1 Script editor ...................................................................................................................... 122
B.5.2 Editor settings .................................................................................................................. 124
B.5.3 Key map ............................................................................................................................ 124
B.6 Profiling views ......................................................................................................................... 126
B.6.1 Overview ........................................................................................................................... 126
B.6.2 Menu ................................................................................................................................. 127
B.6.3 Common topics ................................................................................................................ 132
B.6.3.1 Exporting views to HTML ......................................................................................... 132
B.6.3.2 Quick search in views ............................................................................................... 132
B.6.3.3 Undocking views ....................................................................................................... 132
B.6.3.4 Sorting tables ............................................................................................................ 133
B.6.3.5 Using graphs .............................................................................................................. 134
B.6.3.6 Bookmarks ................................................................................................................ 134
B.6.3.7 Editing bookmarks .................................................................................................... 135
B.6.3.8 Source and bytecode viewer ................................................................................... 136
B.6.3.9 Dynamic view filters ................................................................................................. 136
B.6.3.10 Tree maps ................................................................................................................ 137
B.6.3.11 Graphs with a time axis ......................................................................................... 138
B.6.4 Memory views .................................................................................................................. 139
B.6.4.1 Overview .................................................................................................................... 139
B.6.4.2 All objects ................................................................................................................... 140
B.6.4.2.1 Overview ............................................................................................................. 140
B.6.4.2.2 Settings dialog .................................................................................................... 141
B.6.4.3 Recorded objects ...................................................................................................... 142
B.6.4.3.1 Overview ............................................................................................................. 142
B.6.4.3.2 Settings dialog .................................................................................................... 143
B.6.4.4 Allocation call tree .................................................................................................... 145
B.6.4.4.1 Overview ............................................................................................................. 145
B.6.4.4.2 Settings dialog .................................................................................................... 148
B.6.4.5 Allocation hot spots view ......................................................................................... 150
B.6.4.5.1 Overview ............................................................................................................. 150
B.6.4.5.2 Settings dialog .................................................................................................... 154
B.6.4.6 Class tracker .............................................................................................................. 156
B.6.4.6.1 Overview ............................................................................................................. 156
B.6.4.6.2 Class tracker options dialog ............................................................................. 156
B.6.4.6.3 View settings dialog ........................................................................................... 156
B.6.4.7 Allocation options dialog ......................................................................................... 157
B.6.4.8 Class and package selection dialog ........................................................................ 157
B.6.5 Heap walker ..................................................................................................................... 159
B.6.5.1 Overview .................................................................................................................... 159
B.6.5.2 Option dialog ............................................................................................................. 161
B.6.5.3 View layout ................................................................................................................ 162
B.6.5.4 Classes view ............................................................................................................... 164
B.6.5.4.1 Overview ............................................................................................................. 164
B.6.5.5 Allocation view .......................................................................................................... 166
B.6.5.5.1 Overview ............................................................................................................. 166
B.6.5.5.2 Allocation tree .................................................................................................... 166
B.6.5.5.3 Allocation tree map ........................................................................................... 166
B.6.5.5.4 Allocation hotspots ............................................................................................ 167
B.6.5.6 Biggest objects view ................................................................................................. 168
B.6.5.6.1 Biggest objects view .......................................................................................... 168
B.6.5.6.2 Dependency on retained size calculation ....................................................... 170
B.6.5.7 Reference view .......................................................................................................... 171
B.6.5.7.1 Overview ............................................................................................................. 171
B.6.5.7.2 Outgoing references .......................................................................................... 171
B.6.5.7.3 Incoming references .......................................................................................... 173
B.6.5.7.4 Cumulated incoming references ...................................................................... 176
B.6.5.7.5 Cumulated outgoing references ...................................................................... 178
B.6.5.7.6 Path to root options .......................................................................................... 179
B.6.5.7.7 Restricted availability ........................................................................................ 180
B.6.5.8 Time view ................................................................................................................... 181
B.6.5.8.1 Overview ............................................................................................................. 181
B.6.5.8.2 Restricted availability ........................................................................................ 181
B.6.5.9 Inspections view ........................................................................................................ 182
B.6.5.9.1 Overview ............................................................................................................. 182
B.6.5.9.2 Inspections ......................................................................................................... 182
B.6.5.10 Graph ....................................................................................................................... 187
B.6.5.10.1 Overview ........................................................................................................... 187
B.6.5.10.2 Path search options ......................................................................................... 190
B.6.5.11 View helper dialog .................................................................................................. 191
B.6.5.12 Settings dialog ......................................................................................................... 191
B.6.5.13 HPROF snapshots ................................................................................................... 192
B.6.6 CPU views ......................................................................................................................... 193
B.6.6.1 Overview .................................................................................................................... 193
B.6.6.2 Call tree view ............................................................................................................. 195
B.6.6.2.1 Overview ............................................................................................................. 195
B.6.6.2.2 Show hidden elements dialog .......................................................................... 198
B.6.6.2.3 Settings dialog .................................................................................................... 198
B.6.6.3 Hot spot view ............................................................................................................. 200
B.6.6.3.1 Overview ............................................................................................................. 200
B.6.6.3.2 Settings dialog .................................................................................................... 203
B.6.6.4 Call graph ................................................................................................................... 205
B.6.6.4.1 Overview ............................................................................................................. 205
B.6.6.4.2 Call graph wizard ............................................................................................... 206
B.6.6.4.3 Node selection dialog ........................................................................................ 207
B.6.6.4.4 Settings dialog .................................................................................................... 207
B.6.6.5 Method statistics ....................................................................................................... 209
B.6.6.5.1 Overview ............................................................................................................. 209
B.6.6.5.2 Settings dialog .................................................................................................... 210
B.6.6.6 Call tracer ................................................................................................................... 211
B.6.6.6.1 Overview ............................................................................................................. 211
B.6.6.6.2 Show hidden elements dialog .......................................................................... 212
B.6.6.6.3 Settings dialog .................................................................................................... 212
B.6.6.7 Request tracking ....................................................................................................... 214
B.6.7 Threads views ................................................................................................................... 217
B.6.7.1 Overview .................................................................................................................... 217
B.6.7.2 Thread history view .................................................................................................. 218
B.6.7.2.1 Overview ............................................................................................................. 218
B.6.7.2.2 Settings dialog .................................................................................................... 219
B.6.7.3 Thread monitor view ................................................................................................ 220
B.6.7.3.1 Overview ............................................................................................................. 220
B.6.7.3.2 Settings dialog .................................................................................................... 220
B.6.7.4 Thread dumps view .................................................................................................. 222
B.6.7.4.1 Overview ............................................................................................................. 222
B.6.8 Monitor views ................................................................................................................... 223
B.6.8.1 Overview .................................................................................................................... 223
B.6.8.2 Locking graphs .......................................................................................................... 224
B.6.8.2.1 Overview ............................................................................................................. 224
B.6.8.2.2 Current locking graph ........................................................................................ 225
B.6.8.2.3 Locking history graph ........................................................................................ 225
B.6.8.2.4 Settings dialog .................................................................................................... 226
B.6.8.3 Monitor views ............................................................................................................ 228
B.6.8.3.1 Overview ............................................................................................................. 228
B.6.8.3.2 Current monitors ............................................................................................... 228
B.6.8.3.3 Monitor history .................................................................................................. 229
B.6.8.3.4 Monitor history settings .................................................................................... 229
B.6.8.4 Monitor usage statistics ........................................................................................... 230
B.6.8.4.1 Overview ............................................................................................................. 230
B.6.8.4.2 Option dialog ...................................................................................................... 230
B.6.9 VM telemetry views ......................................................................................................... 231
B.6.9.1 Overview .................................................................................................................... 231
B.6.9.2 Settings dialog ........................................................................................................... 232
B.6.10 Probes ............................................................................................................................. 233
B.6.10.1 Overview .................................................................................................................. 233
B.6.10.2 Databases ................................................................................................................ 233
B.6.10.3 JEE & probes ............................................................................................................ 236
B.6.10.4 Time line .................................................................................................................. 239
B.6.10.5 Control objects ........................................................................................................ 239
B.6.10.6 Hot spots ................................................................................................................. 241
B.6.10.7 Telemetries .............................................................................................................. 242
B.6.10.8 Events ....................................................................................................................... 243
B.6.10.9 Tracker ..................................................................................................................... 244
B.7 Snapshot comparisons .......................................................................................................... 246
B.7.1 Overview ........................................................................................................................... 246
B.7.2 Memory comparisons ..................................................................................................... 249
B.7.2.1 Overview .................................................................................................................... 249
B.7.2.2 Objects comparison ................................................................................................. 249
B.7.2.2.1 Overview ............................................................................................................. 249
B.7.2.2.2 Settings dialog .................................................................................................... 250
B.7.2.3 Allocation hot spot comparison .............................................................................. 251
B.7.2.3.1 Overview ............................................................................................................. 251
B.7.2.3.2 Settings dialog .................................................................................................... 252
B.7.2.4 Allocation tree comparison ..................................................................................... 252
B.7.2.4.1 Overview ............................................................................................................. 252
B.7.2.4.2 Settings dialog .................................................................................................... 253
B.7.3 CPU comparisons ............................................................................................................ 255
B.7.3.1 Overview .................................................................................................................... 255
B.7.3.2 Hot spot comparison ................................................................................................ 255
B.7.3.2.1 Overview ............................................................................................................. 255
B.7.3.2.2 Settings dialog .................................................................................................... 256
B.7.3.3 Call tree comparison ................................................................................................ 257
B.7.3.3.1 Overview ............................................................................................................. 257
B.7.3.3.2 Settings dialog .................................................................................................... 257
B.7.4 VM telemetry comparisons ............................................................................................ 259
B.7.4.1 Overview .................................................................................................................... 259
B.7.4.2 Settings dialog ........................................................................................................... 260
B.7.5 Probe comparisons ......................................................................................................... 261
B.7.5.1 Overview .................................................................................................................... 261
B.7.5.2 Hot spot comparison ................................................................................................ 261
B.7.5.2.1 Overview ............................................................................................................. 261
B.7.5.2.2 Settings dialog .................................................................................................... 262
B.7.5.3 Telemetry comparison ............................................................................................. 263
B.7.5.3.1 Overview ............................................................................................................. 263
B.7.5.3.2 Settings dialog .................................................................................................... 264
B.8 Offline profiling ....................................................................................................................... 265
B.8.1 Overview ........................................................................................................................... 265
B.8.2 Command line controller ................................................................................................ 268
B.8.3 Ant task ............................................................................................................................. 269
B.8.4 Profiling API ...................................................................................................................... 271
B.9 Command line export ............................................................................................................ 272
B.9.1 Snapshots ......................................................................................................................... 272
B.9.1.1 Overview .................................................................................................................... 272
B.9.1.2 Command line executable ....................................................................................... 273
B.9.1.3 Ant task ...................................................................................................................... 280
B.9.2 Comparisons .................................................................................................................... 281
B.9.2.1 Overview .................................................................................................................... 281
B.9.2.2 Command line executable ....................................................................................... 282
B.9.2.3 Ant task ...................................................................................................................... 287
Welcome To JProfiler
Thank you for choosing JProfiler. To help you get acquainted with JProfiler's features, this manual
is divided into two sections:
• Help topics [p. 10]
Help topics present important concepts in JProfiler. They are not necessarily tied to a single
view. Help topics are recommended reading for all JProfiler users.
The help topics section does not cover all aspects of JProfiler. Please turn to the reference
section for an exhaustive explanation of all features that can be found in JProfiler.
• Reference [p. 60]
The reference section covers all views, all dialogs and all features of JProfiler. It is highly
hierarchical and not optimized for systematic reading.
The reference section is the basis for JProfiler's context sensitive help system. Each view and
each dialog have one or more corresponding items in the reference section.
We appreciate your feedback. If you feel that there's a lack of documentation in a certain area
or if you find inaccuracies in the documentation, please don't hesitate to contact us at
[email protected].
8
How To Order
JProfiler licenses can be purchased easily and securely online. We accept credit cards from Visa,
MasterCard, American Express, JCB and Diners Club. You can also pay via bank transfer, via check
or in cash.
For pricing information and to order JProfiler please visit our shop.
For large quantities or site licenses please contact [email protected].
9
A Help Topics
A.1 Profiling
A.1.1 Profiling Modes
Introduction
There are four different profiling modes in JProfiler. Three of them involve a connection with the
JProfiler GUI so you can see and analyze data immediately.
The three GUI modes result from trade-offs between convenience and efficiency. It is most
convenient to simply attach the JProfiler GUI to any running JVM ("Attach mode"), but it is most
efficient to load the profiling agent and startup and tell it about the profiling settings immediately
("Profile at startup"). A compromise is to load the profiling agent at startup and tell it later on
what the profiling settings should be ("Prepare for profiling").
The fourth mode is used when the use of a JProfiler GUI is not desired or technically possible
("Offline mode").
Attach mode
For profiling Java 1.6 or higher, JProfiler supports attaching to a running JVM [p. 109] and loading
the profiling agent on the fly.
Attach mode has some drawbacks since some capabilities of the profiling interface are not
available that way. JProfiler notifies you in the GUI where this is the case. Also, to instrument
classes, JProfiler has to retransform them, which takes more time and resources compared to
the "Profile at startup" mode.
To attach to a remote JVM that has not been prepared for profiling, JProfiler offers a command
line tool jpenable that loads the profiling agent and makes it possible to connect with a remote
session from another computer.
Profile at startup
To profile an application at startup, the profiling agent has to be activated before the JVM is
created. This is achieved by adding the special JVM parameter
10
-agentpath:[path to jprofilerti library]
You rarely need to add this JVM parameter manually. For launched sessions [p. 76] and IDE
integrations [p. 63] JProfiler does this automatically, for other cases, there are integration wizards
[p. 63] . They also take care of potential other VM parameters that are required for profiling.
By default, the profiling agent listens on port 8849. You can change that port by appending
=port=8849 to the above VM parameter. Except for remote sessions [p. 110] , you do not have
to choose a port explicitly.
The profiling agent pauses the JVM at startup and waits for a connection from the GUI to receive
information about profiled classes and other profiling settings. After the connection, the normal
execution in the JVM is continued. This is the most efficient way to profile an application, since
no retransforming of already loaded class files has to be performed.
Prepare for profiling
Alternatively, it is possible to let the application start up immediately and connect with the JProfiler
GUI at a later time. In that case, the instrumented classes have to be retransformed after the
JProfiler GUI tells the profiling agent about the profiled classes.
This mode is activated by appending [p. 111] ,nowait to the -agentpath VM parameter. In
most cases, this is handled by the integration wizard. For maximum efficiency, it's also possible
to append ,config=[config file] and ,id=[id] parameters to instruct the profiling agent
to take the profiling settings from a particular session in a particular config file. If you connect
with the same profiling settings, no classes will have to be retransformed.
In any case, this mode is more efficient than attach mode since a lot of instrumentations are
independent of the profiling settings. Those instrumentations are performed as the classes are
loaded and the number of retransformed classes is lower. Also, all capabilities of the profiling
interface of the JVM are available in this mode.
Offline profiling
For automated profiling or for situations where it is not possible to attach a JProfiler GUI due to
network restrictions, you can profile without a profiling GUI. In that case, you need to instruct
the profiling agent when to record data, what data should be recorded and when snapshots
should be saved. This is done with triggers [p. 29] which are activated for certain events and
can execute a series of configurable actions.
This mode is activated by appending [p. 111] ,offline,config=[config file],id=[id] to
the -agentpath VM parameter. Usually this is handled by the integration wizard. Similar to the
"Prepare for profiling" mode, the selected session in the specified config file will be used for the
profiling settings. The trigger configuration from that session controls recording and saving.
The profiling results are only saved to snapshot files, it is not possible to attach a JProfiler GUI
in offline mode. However, you can control data recording and snapshot saving manually with
the jpcontroller [p. 268] command line controller. If the JVM was not configured for offline profiling
at startup, you can use the jpenable command line utility to start offline profiling at any time.
11
A.1.2 Remote Profiling - Application Servers And Standalone Applications
Introduction
Although it is easiest to profile applications and application servers that are running on your
local machine, sometimes it is not possible to replicate the execution environment on your
computer. If you have no physical access to the remote machine or if the remote machine has
no GUI where you could run JProfiler, you have to set up remote profiling.
Remote profiling means that the profiling agent is running on the remote machine and the
JProfiler GUI is running on your local machine. Profiling agent and JProfiler GUI communicate
with each other through a socket. This situation is fundamentally the same as running a session
that is launched on the local machine, except that the communication socket connects between
different machines. The main difference for you is that for sessions launched by JProfiler you
don't have to worry about the location of native libraries and that the startup sequence can be
managed by JProfiler.
The jpenable command line utility
To avoid running an integration wizard or modifying the VM parameters of the profiled application,
just extract the JProfiler archive from the download page on the remote machine. You do not
have to enter a license key there. Run the bin/jpenable command line application on the
remote machine. You will be able to select a JVM and load the profiling agent into it so that it
listens on a specific profiling port. In your local JProfiler GUI, you can then connect with an "Attach
to profiled JVM (local or remote)" session.
This only works with a Java VM of version 1.6 or higher and has the drawback that array allocations
are not recorded, i.e. stack trace information for array allocations is not available. Also, if you're
profiling regularly, it might be more convenient to prepare a permanent setup that does not
require you to run the jpenable executable every time.
To avoid the use of the JProfiler GUI, jpenable also offers an offline mode where you specify a
config file with the desired session settings. Session settings can be exported from the JProfiler
GUI. Either the session settings contain triggers that record data and save snapshots or you use
the bin/jpcontroller command line application to control data recording and to save
snapshots.
The remote integration wizard
All integration wizards in JProfiler can help you with setting up remote profiling. After choosing
the integration type or application server, the wizard asks you where the profiled application is
located. If you choose the remote option, there will be additional questions regarding the remote
machine.
12
When the remote integration wizard asks you for startup scripts or other files of the application
server on the remote machine it brings up a standard file selector. If the file system of the remote
machine is accessible as a network drive or mounted into your file system, you can select those
files and JProfiler will directly write modified files to the right location.
If you do not have direct access to the file system of the remote machine, you have two options:
You can use the console integration wizard by executing bin/jpintegrate on the remote
machine. Alternatively, you can copy the required files to the local machine and use the "remote"
option in the integration wizard. However, you must then transfer the modified or new files back
to the remote machine after the integration wizard has completed.
Requirements for remote profiling
Although the integration wizards in JProfiler give you all required information, it's always a good
idea to have a little more inside knowledge about the mechanics and the requirements of remote
profiling. When trouble-shooting a failed integration, you should check that the requirements
below are fulfilled correctly.
The following requirements have to be satisfied for remote profiling:
1. JProfiler has to be installed on the local machine and on the remote machine. If the remote
machine is a Unix machine, you might not be able to run the GUI installer of JProfiler. In this
case, please use the .tar.gz archive to install JProfiler.
Unless you specified the "nowait" parameter on the command line together with a "config"
argument, (only necessary for pre 1.6 JVMs), you do not have to enter a license key on the
remote machine. The license key is always provided by the JProfiler GUI. Because of that, it is
sufficient to unpack JProfiler to any directory where you have write permission.
2. The operating system and the architecture of the remote machine must be explicitly supported
by JProfiler. Please see the list of supported platforms for more information. JProfiler is not a
pure Java application, it contains a lot of native code which is not easily portable to unsupported
platforms.
13
3. On the remote machine, you have to add a number of VM parameters to the java invocation
of your application server or your standalone application. The fundamental VM parameter is
-agentpath:[path to jprofilerti library] which tells the JVM to load the native
profiling agent. The help page on remote sessions [p. 110] in the reference section tells you
the corresponding path to the jprofilerti library for all platforms.
Depending on your JVM and your platform, you have to add further VM parameters to your
java invocation. The remote session invocation table [p. 111] in the reference section gives
you the exact parameter sequence for your configuration.
This is all that is required to profile a modern JVM (Java 1.5 and later).
4. On the local machine, you have to define a "Attach to profiled JVM" session whose "host" entry
points to the remote machine.
Starting remote profiling
If you run the integration wizard for a local application server, JProfiler will be able to start it and
connect to it. JProfiler has no way to start the application server if it is located on a remote
machine. For remote applications and application servers, you have to perform two actions to
start the profiling session:
1. Execute the modified start script on the remote machine. Depending on what option you have
chosen in the remote profiling wizard, there are two startup sequences: either the application
or application server starts up completely, or it prints a few lines of information and tells you
that it is waiting for a connection. With Java 1.6.0 and later, the profiling options will be sent
to the profiling agent when the GUI connects and you don't have to copy your config file to
the server.
With Java 1.5.0 and earlier, changing profiling settings at runtime is not possible. In the case
where the application does not wait for a connection from the JProfiler GUI, the profiling agent
loads the profiling configuration from the config.xml file you have copied to the server as
instructed by the integration wizard.
2. Start the "Attach to profiled JVM" session in the JProfiler GUI on the local machine. The session
will connect to the remote computer and the remote application or application server will
then start up if it waited for the GUI connection.
Trouble-shooting
When things don't work out as expected, please have a look at the terminal output of the profiled
application or application server on the remote machine. For application servers, the stderr
stream might be written to a log file. Depending on the content of the stderr output, the search
for the problem takes different directions:
• If stderr contains "Waiting for connection ...", the configuration of the remote machine
is ok. The problem might then be related to the following questions:
• Did you forget to start the "Attach to profiled JVM" session in the JProfiler GUI on your local
machine?
• Is the host name or the IP address correctly configured in the "Attach to profiled JVM"
session?
• Is there a firewall between the local machine and the remote machine?
• If stderr contains an error message about not being able to bind a socket, the port is already
in use. The problem might then be related to the following questions:
14
• Did you start JProfiler multiple times on the remote machine? Each profiled application
needs a separate communication port. Please see below on how to change that port.
• Are there any zombie java processes of previous profiling runs that are blocking the port?
In this case please kill these processes.
• Is there a different application on the remote machine that is using the JProfiler port? Please
see below on how to change the port for JProfiler.
The communication port is defined as a parameter to the profiling agent VM parameter. To
define a communication port of 25000, please change this VM parameter to
-agentpath:[path to jprofilerti library]=port=25000. Also, please make sure
that the same port is configured in the "Attach to profiled JVM" session in the JProfiler GUI on
your local machine. Please note that this port has nothing to do with HTTP or other standard
port numbers and must not be the same as any port that's already in use on the remote
machine.
• If there are no lines in stderr that are prefixed with JProfiler> and your application or
application server starts up normally, the -agentpath:[path to jprofilerti library]
VM parameter has not been included in the Java call. Please find out which java call in your
startup script is actually executed and add the VM parameters there.
15
A.1.3 Behind The Scenes - How Profiling Actually Works
Introduction
Although it is not necessary to know about the internals of profiling to successfully profile your
application, it can help you to interpret data that is produced by JProfiler, be more confident
when setting up application servers and remote applications for profiling and analyzing problems
with profiling in general. You might also just be curious to know what's going on under the hood.
Time, memory and thread profiling
There are three basic aspects to a profiler: A "time profiling" measures the execution paths of
your application on the method level whereas "memory profiling" gives you insight into the
development of the heap, such as which methods allocate most memory. Most applications are
multi-threaded, and "thread profiling" analyzes thread synchronization issues.
Because it often makes sense to compare and correlate data from all three domains, JProfiler
combines time, memory and thread profilers in a single application.
Most profilers are "post-mortem" profilers where the profiling wrapper or profiling agent writes
out a snapshot file on an explicit instruction or when the profiled application exits. While JProfiler
does have this capability, it is also an interactive profiler that shows you data while it is being
measured.
Probes
Sometimes information on the basic operations in the JVM is not sufficient to tackle a problem
and higher-level analysis is required. With "probes", specific subsystems of the JVM, such as
file I/O or network I/O or domain-specific subsystems such as JDBC, JMS or JNDI are measured
and presented in a concise and useful way.
Apart from the built-in probes [p. 50] , it is possible to create your own probes [p. 55] that
measure other subsystems.
How profilers collect data
A profiler must have some means to collect the data it displays. Profiling data can come from
an interface in the execution environment or it can be generated by instrumenting the
classes of the application.
One of the most basic common profilers, the Unix shell command time, acts as a wrapper to
the profiled executable and retrieves post-mortem information about the process from the
kernel. Profilers for native applications on Microsoft Windows can attach to running applications
and receive available debug information to calculate their profiling data. These are examples of
interfaces in the execution environment where the the binary of your application is not modified
by the profiler.
The gprof Unix profiler (part of Unix since 4.2bsd UNIX in 1983) can be hooked into the
compilation process by specifying an additional argument to the compiler (-pg). In this way,
profiling code is added to your application. When the application exits, a data file is written to
disk that contains call trees and execution times to be viewed with the gprof application. gprof
is an example of a profiler that instruments your application.
JProfiler takes a mixed approach. It uses the profiling interface of the JVM and instruments classes
at load time for tasks where the profiling interface of the JVM doesn't provide any data or adequate
performance.
The profiling interface of the JVM
The profiling interface of the JVM is intended for profiling agents that are written in C or C++. If
you open the include directory in your JDK, you will see a number of files with the extension
16
.h. Those are the header files that tell a C/C++ library about the interface that is offered by the
JVM. The basis for all communication between a native library and the JVM is the Java Native
Interface (JNI), defined in jni.h.
The JNI allows Java code to call methods in the native library and vice versa. From Java code, you
can use the System.load() call to load a native library into the same memory space. When
you call a method whose declaration contains the "native" modifier, such as public native
String getName();, a function in the list of loaded native libraries is searched for. The required
name pattern of the corresponding C-function contains the package, the class and the method
of the declaration in Java code. JNI also defines how Java data types are represented in a C/C++
library. When the native C-function is called, it gets a "JNI environment" interface as an additional
parameter. With this environment interface, it can call Java methods, convert between C and
Java data types, and perform other JVM specific operation such as creating Java threads and
synchronizing on a Java monitor.
Until Java 1.5, the JVM offered an ad-hoc profiling interface for tool vendors, the Java Virtual
Machine Profiling Interface (JVMPI). The JVMPI was not standardized and its behavior varied
considerably across different JVMs. In addition, the JVMPI was not able to run with modern
garbage collectors and had problems when profiling very large heaps. With Java 1.5, the JVM
Tool Interface (JVMTI) was added to the Java platform to overcome these problems. Since Java
1.6, the JVMPI has been removed. Current versions of JProfiler only supports the JVMTI. To
profile Java 1.4, you can use JProfiler 7.2, the last version that had support for profiling JVMPI.
The JVMTI is defined in the header file jvmti.h. It utilizes the JNI for communication with the
JVM, but provides an additional interface to configure profiling options. JVMTI is an event-based
system. The profiling agent library can register handler functions for different events. It can then
enable or disable selected events.
Disabling events is important for reducing the overhead of the profiler. For example, in JProfiler,
object allocation call stack recording is switched off by default. When you switch on allocation
call stack recording in the GUI, the profiling agent tells the JVMTI interface that several events
for recording object allocations should be enabled. If a lot of objects are created, this can produce
a considerable overhead, both in the JVM itself as well as in the profiling agent that has to perform
bookkeeping operations for each event. During the startup phase of an application server, a lot
of objects are created that you're most likely not interested in. Consequently, it's a good idea to
leave object call stack allocation recording switched off during that time. It increases the
performance of the profiled application and reduces clutter in the generated data. The same
goes for the measurement of method calls, called "CPU profiling" in JProfiler.
The JVMTI offers the following types of events:
• Events for the life-cycle of the JVM
The profiling agent is active before the JVM has been fully initialized. It can monitor how core
classes are loaded and what method calls are executed during the initialization phase. When
the JVM is initialized just before the main method is called, the profiling agent is notified.
Similarly, the impending shutdown of the JVM is reported.
• Events for the life-cycle of classes
When a class is loaded and when it is unloaded, the profiling agent can be notified by the
JVMTI. All other events, like the object allocation events or the method call events use the
integer class ids and the method ids that are reported with this event. Before a class is loaded,
the profiling agent gets a chance to inspect and modify the content of the class file. This is the
basis for "dynamic instrumentation" where bytecode is injected into the class file before it is
actually loaded by the JVM.
• Events for the life-cycle of threads
To be able to show separate call trees for separate threads as well as to analyze monitor
contention, the profiling agent must be aware of when threads are created and destroyed.
17
When a thread is started, its identity is established. All other JVMTI events have a pointer that
identifies the originating thread.
• Events for for the life-cycle of objects
The profiling agent can be notified of when objects are allocated, freed and moved in memory
by the garbage collector. At this point, the call stack of the allocation spot can be recorded by
the profiling agent. If the object allocation event is switched off, the allocation spot will not be
available for the object later on. Such objects show up as "unrecorded objects" in the heap
walker.
• Events for monitor contention
Whenever you call synchronized methods, use the synchronize keyword or call
Object.wait(), the JVM uses Java monitors. Events that concern these monitors, such as
trying to enter a monitor, entering a monitor, exiting a monitor or waiting on a monitor are
reported to the profiling agent. From this data, the deadlock graph and the monitor contention
views are generated in JProfiler.
• Events for the garbage collector
Garbage collector activity is reported to the profiling agent. The garbage collector telemetry
view in JProfiler is based on these events.
Some information, like references between objects as well as the data in objects, are not available
from the events that the JVMTI fires. To get exhaustive information on all objects on the heap,
the profiling agent can trigger a "heap dump". This command is invoked when you take a
snapshot in the heap walker. While the old profiling interface JVMPI packed all the objects on
the heap and the references between them into a single byte array and passed it to the profiling
agent, the situation with JVMTI (>= 1.5) is much improved, since JProfiler can incrementally
enumerate all existing references in the heap and build up its own data structures.
How the profiling agent is activated
Unlike a JNI library that you load and invoke from Java code, the profiling agent has to be activated
at the very beginning of the JVM startup. This is achieved by adding the special JVM parameters
-agentpath:[path to jprofilerti library]
to the Java command line. The -agentpath: part tell the JVM that a JVMTI profiling agent should
be loaded.
Parameters can be passed to the native profiling library by appending an equal sign to the
profiling interface VM parameter and placing the parameter string behind it. If you pass
-agentpath:[path to jprofilerti library]=port=10000 on the Java command line,
the parameter port=10000 will be passed to the profiling agent.
If the JVM cannot load the specified native library, it quits with an error message. If it succeeds
in loading the library, it calls a special function in the library to give the profiling agent a chance
to initialize itself.
Since Java 1.6, another way to load a profiling agent is via the attach API. The jvmstat mechanism
allows JProfiler to discover JVMs that are running on the local computer and the attach API makes
it possible to inject the profiling agent into a selected JVM.
Profiling agent and profiling GUI
Unlike profilers that only write out a snapshot file to disk, an interactive profiler like JProfiler can
display the profiling data at runtime. Although it would be possible to start the GUI directly from
the profiling agent, it would be a bad idea to do so, since the profiled process would be disturbed
by the secondary application and remote profiling would not be possible. Because of this, the
18
JProfiler GUI is started separately and runs in a separate JVM. The communication between the
profiling agent and the GUI is via a TCP/IP network socket.
The recorded profiling data resides in the internal data structures of the profiling agent. Only a
small part of the recorded data is actually transferred to the GUI. For example, if you open the
call tree or the back-traces in the hot spots views, only the next few levels are transferred from
the agent to the GUI. If the entire call tree were transferred to the GUI, potentially big amounts
of data would have to be transmitted through the socket. This would make the profiled process
slower and remote profiling between different computers would not be feasible. In essence, you
could say that the profiling agent keeps a database of the recorded profiling data while the GUI
is a client that sends user-initiated queries to the database.
19
A.2 Configuration
A.2.1 Configuring Session Settings
Introduction
Apart from the application settings which control how a JVM is launched or how a connection is
made to a profiled JVM, session settings mostly deal with the way profiling data is recorded.
Session settings can be shown by editing a session in the start center or by invoking
Session->Session Settings from the main menu for the currently running session. Every
time a session is started, a startup dialog is displayed that allows you to change the session
settings.
On older JVMs (1.5 and earlier), these settings must be adjusted according to your personal needs
before the session is started. For modern JVMs (1.6 and later), JProfiler is able to change session
settings at runtime. Any change in the session settings clears all recorded data. View settings
can be changed during a running session without loss of recorded data. The primary distinction
between session settings and view settings is that session settings determine how much data
is recorded.
20
Limiting the recorded profiling data
Why doesn't JProfiler just record everything it can and show it to the user? The answer is twofold:
• There's a trade-off between information depth and runtime overhead
Profiling adds overhead to the profiled application. It runs more slowly and consumes more
memory. As an example, consider the call tree. JProfiler records separate call trees for each
thread. If all method calls in all classes are recorded, the profiling agent has to do a lot of
bookkeeping operations and its internal data structures use a lot of memory.
• You want to reduce clutter in the recorded data
Maximum detail doesn't lead to maximum insight. On the contrary, excessive detail will often
be in the way. If there's too much information available, you're likely to get lost in it. Let's
continue the above example: most of the time, you're not interested in the internal call tree
of framework classes. Say, if you call HashMap#get(), the sufficiently detailed information
will be the duration of this call. When you're not familiar with an implementation or if you're
not in control of it, the internal call structure is not helpful information, but rather just clutter,
that you can ignore.
In principle, reducing the information depth can be done after recording. The view filters in the
CPU views are such an example: the internal call structure of all classes that do not match the
selected view filter is removed from the call tree. However, especially the increased memory
consumption of profiling is critical: if you do not have enough physical memory available, the
profiled JVM might become unstable or even crash. So in practice, you should record as little
data as possible. With appropriate profiling settings you choose the required detail while retaining
an acceptable runtime performance.
Profiling settings templates
Except for application, filter, trigger and probe settings, all other session settings are grouped
into the "profiling settings" tab of the session settings dialog. Most of those settings are advanced
settings and do not need to be adjusted under normal circumstances.
JProfiler offers templates for profiling settings. When you start a new session, JProfiler asks
you whether you want to start with the "Sampling" or "Instrumentation" template. On the startup
dialog, overhead meters for CPU and memory overhead help you in judging whether the current
profiling settings are acceptable for you. Please note that the overhead meters do not represent
any absolute values, because JProfiler has no way of knowing the runtime characteristics of your
application. Rather, they are hints that allow you to compare different profiling settings.
Each profiling settings template defines certain values for the profiling settings that can be viewed
and modified by clicking the [Customize Profiling Settings] button on the profiling settings tab
of the session settings dialog. When you modify and save those settings, the template combo
box displays that the profiling settings are "Customized".
Important session settings
The most important profiling settings are:
• the method call recording type
This profiling setting determines performance overhead and informational detail in the CPU
and memory views that show call trees. A detailed presentation of the various method call
recording types is available in a separate article [p. 23] .
• the filter settings
The filter settings determine the detail that is shown in any call tree or call stack in JProfiler.
In brief, they define the set of classes whose internal call structure is shown while method
21
calls into all other classes are treated as opaque. Please see the article on filters for method
call recording [p. 25] for a thorough discussion.
22
A.2.2 Method Call Recording - Influence On Performance And Accuracy
Introduction
At first glance, it might seem that the method call recording settings only influence the CPU
section of JProfiler. However, the memory section as well as the thread and monitor sections
show information that originates from the call tree that is built by the profiling agent of JProfiler:
the call tree view, the allocation call tree, the stack traces in the monitor views and locking graphs
as well as many other views all depend on the current call stack which is always recorded, even
if "CPU recording" is switched off in JProfiler.
Selecting the right method call recording type is crucial for a successful profiling run. As explained
in the article on session settings [p. 20] , the aim is to get the best runtime performance while
retaining an acceptable level of informational detail. While the most important profiling setting
in this regard is the filter configuration [p. 25] , the method call recording type complements this
choice. Each method call recording type has various limitations that you should bear in mind
when configuring filter settings.
Dynamic instrumentation
For instrumentation, JProfiler injects bytecode into the methods of profiled classes that report
the entry and exit of a method as well as the invocation of methods in unprofiled classes.
Unprofiled classes are not touched and run without overhead.
If most classes are unprofiled, this mode causes low overhead while providing highly detailed
measurements. Typically, the entire JRE and any framework classes are unprofiled so that dynamic
instrumentation is most often the best choice. Since there are some classes in the java.* and
sun.* packages that the profiling agent does not get a chance to modify, the internal calls of
these packages cannot be resolved with dynamic instrumentation. However, for most applications
this is not a problem.
23
Sampling
"Sampling" means to periodically take measurements that are called "samples". In the case of
profiling, an additional thread periodically halts the entire JVM and inspects the call stack of
each thread. The period is typically 5 ms, so that a large number of method calls can occur
between two samples.
The advantage of sampling is that its performance overhead is not very sensitive to the filter
settings. Even without any filters, sampling is still fast since it operates with big granularity in
time. You might ask why it is not possible to decrease the sampling time into the microsecond
range to achieve a better resolution. The answer is that the process of sampling is a very expensive
operation. Halting the entire JVM and querying the call stacks of all threads takes a lot of time.
If you do this too often, sampling will actually become slower than dynamic instrumentation.
Sampling has two other important informational deficiencies: Since sampling does not monitor
the entry and the exit of method calls, there's no invocation count in the CPU views of JProfiler.
Furthermore, the allocation spots for objects are only approximate. The actual call stack
might always be deeper than the reported one. In addition, this informational deficiency is not
systematic, but statistical: Objects allocated by the same method may be recorded to be spread
out among methods that are called shortly before or after it.
To get around this deficiency for probes, JProfiler has an option to record the exact allocation
spots for payloads. In this case, the profiling agent does not rely on the call tree as recorded by
the sampler. Rather, after each probe event that should be associated with a call stack, it queries
the JVMTI for the call stack of the current thread. However, this is an expensive operation and if
there are a lot of probe events, the overhead will be increased considerably.
To conclude, sampling is best suited for performance bottleneck searches with all filters turned
off and for profiling with broad or no filters.
24
A.2.3 Filters For Method Call Recording - How They Work And How They Are Configured
Introduction
Filter settings determine the detail level that JProfiler uses when recording call sequences in the
profiled application. Filtering helps to eliminate clutter and decrease the profiling overhead for
the profiled application. Also see the article on profiling settings [p. 20] for a discussion of
profiling settings in general.
Since the internal data storage of CPU data in JProfiler is similar to the invocation tree, method
call recording filters are most easily explained while looking at the call tree view [p. 195] . As an
example, we profile the "Animated Bezier Curve" demo session that comes with JProfiler. When
talking about filters, it is important to define the distinction between your code and framework
or library code. Your classes should be profiled, framework or library code should not be profiled.
In our example, the BezierAnim class is code written by you and the JRE is library code.
What are method call recording filters?
The call tree shows call sequences. Each node and each leaf of the call tree corresponds to a
certain call stack that has existed one or multiple times while CPU recording was switched on.
You will notice that there are different icons for nodes in the tree. Among other things, these
icons serve to highlight if classes are filtered or not.
The methods of an unprofiled class (alternatively the class or containing package itself, depending
on the aggregation level) are endpoints in the call tree, i.e. their internal call structure will not
be displayed. Also, any methods in other unprofiled classes that are called subsequently, are
not resolved. If, at any later point in the call sequence, the method of a profiled class is called,
it will be displayed normally. In that case, the call tree shows the icon of the unprofiled parent
method with a red top-left corner that indicates that it is from an unprofiled class and that there
may be other intermediate method calls in between. The inherent time of those missing methods
is added to the time of the unprofiled parent method.
Example with and without filters
The image below illustrates the different node types for a profiling run of the BezierAnim class:
In the above call tree, the java.* and javax.* packages are filtered, so only the first method
in the AWT event dispatch thread is shown. However, the AWT is a complex system and the
InvocationEvent#dispatch() method does not call BezierAnim$Demo#paint() directly.
If we add javax.swing in the filter settings, the call tree looks like this:
25
Now, the entry method into your code - BezierAnim$Demo#paint() - is substantially more
difficult to find. In cases where events are propagated through a complex container hierarchy,
the call tree can become many hundreds of levels deep and it becomes next to impossible to
interpret the data. In addition, calls like java.awt.Graphics2D#setPaint() show their internal
structure and implementation classes. As a Java programmer who is not working on the JRE itself,
you probably do not know or care that the implementation class is actually
sun.java2d.SunGraphics2D. Also, the internal call structure is most likely not relevant for
you, since you have no control over the implementation. It just distracts from the main goal:
how to improve the performance of your code.
Not only is it easier to interpret a call tree that has been recorded with proper filter settings, but
also the profiling overhead of the profiled application is much lower. Recording the entire call
tree without filters uses a lot of memory and measuring each call takes a lot of time. Both these
considerations especially apply to application servers, where the surrounding framework is often
extremely complex and the proportion of executed framework code to your own code might be
very big.
Configuring filter settings
Filter settings are part of the session settings. Please see the article on session settings [p. 20]
for more information. The help on sessions [p. 76] explains under what circumstances changes
in the session settings can be applied to an active session.
26
There are two ways in JProfiler to specify the profiled classes:
• by defining exclusive filters
An "exclusive filters" means that you specify a package or class (manual entry for single classes)
that should not be profiled. New sessions have a default list of exclusive filters that work for
many applications.
If the first filter is an exclusive filter, all packages except for the following excluded packages
will be profiled. Further inclusive filters can be used to add back some sub-packages.
• by defining inclusive filters
An "inclusive filters" means that you specify a package or class that should be profiled.
If the first filter is an inclusive filter, only the following included packages will be profiled.
Further exclusive filters can be used to remove some sub-packages.
For sessions where JProfiler attaches to a running JVM, you can select filters from a package
browser that tells you how many classes will be profiled based on your selection.
27
View filters
In addition to the method call recording filters, there is a view filters control at the bottom of all
views that display call trees. View filters are similar to inclusive filters and can be changed during
a session. However, they can only reduce the recorded information by taking out classes that
do not correspond to the selected view filter.
In the call tree, they have a similar behavior like the method call recording filters. In the hot spots
views, they simply hide all hot spots that do not correspond to the filter selection. This is very
different from method call recording filters, where the hot spots themselves change with different
filter settings.
28
A.2.4 Offline Profiling And Triggers
Introduction
There are two fundamentally different ways to profile an application with JProfiler: By default,
you profile with the JProfiler GUI attached. The JProfiler GUI provides you with buttons to start
and stop recording and shows you all profiling data. However, there are situations where you
would like to profile without the JProfiler GUI and analyze the results later on. For this scenario,
JProfiler offers offline profiling. Offline profiling allows you to start the profiled application with
the profiling agent but without the need to connect with a JProfiler GUI.
However, offline profiling still requires some actions to be performed. At least one snapshot has
to be saved, otherwise no profiling data will be available for analysis later on. Also, to see CPU
or allocation data, you have to start recording at some point. Similarly, if you wish to be able to
use the heap walker in the saved snapshot, you have to trigger a heap dump at some point.
Profiling API
The first solution to this problem is the offline profiling API [p. 265] . With the offline profiling API,
you can programmatically invoke all profiling actions in your code.
The drawback of this approach is that you have to add the JProfiler agent library to the class path
of your application during development, add temporary profiling code to your source code and
recompile your code each time you make a change to the programmatic profiling actions.
Triggers
With triggers [p. 94] , you can specify all profiling actions in the JProfiler GUI without modifying
your source code. Triggers are saved in the JProfiler config file. The config file and the session id
are passed to the profiling agent on the command line when you start with offline profiling
enabled, so the profiling agent can read those trigger definitions.
In contrast to the profiling API use case where you add calls to your source code, triggers are
activated when a certain event occurs in the JVM. For example, if you would have added a call
to a certain profiling action at the beginning or at the end of a method when using the profiling
29
API, you can use a method invocation trigger instead. Instead of creating your own timer thread
to periodically save a snapshot, you can use a timer trigger.
Each trigger has a list of actions that are performed when the associated event occurs. Some of
these actions correspond to profiling actions in the offline profiling API. In addition there are
other actions that go beyond the controller functions such as the action to print method calls
with parameters and return values or the action to invoke an interceptor for a method.
30
A.3 Memory Profiling
A.3.1 Recording Allocation Call Stacks
Introduction
By default, JProfiler does not track the creation of all objects. This reduces the runtime overhead
of the profiling agent regarding execution speed as well as memory consumption.
However, selective allocation call stack recording is not only a way to increase runtime
performance, it also helps you to focus on important parts of your application and to reduce
clutter in the dynamic memory views ("dynamic" is intended in contrast to the heap walker, which
shows a static snapshot of the heap). Imagine you have a web application that's started in the
framework of an application server. The server allocates a huge number of objects in a great
number of classes. If you want to focus on the objects created by your web application, the
objects from the server startup will be in the way. In JProfiler, you can start allocation call stack
recording before you perform a certain action and so reduce the displayed objects to those that
are allocated as a direct consequence of that action.
Starting and stopping allocation call stack recording
The profiling menu as well as the toolbar allow you to start and stop allocation call stack recording.
If no allocations have ever been recorded, the dynamic memory views show placeholders with
the corresponding "record" button. If you wish to enable allocation call stack recording for the
entire application run, you can do so in the profiling settings dialog
When you stop allocation call stack recording, the garbage collection of the recorded objects will
still be tracked by the dynamic memory views. In this way you can observe if the objects created
during a certain period of time are actually garbage collected at some point. Please note that
the manual garbage collection button in JProfiler just invokes the System.gc() method. This
leads to a full GC in 1.3 JREs where the garbage collector makes the best effort to remove all
unreferenced objects. However, 1.4 and 1.5 JREs perform incremental garbage collection, so full
garbage collection is not available when working with such a recent JRE. To check if the remaining
objects are really referenced, or if the garbage collector just doesn't feel like collecting them yet,
you can take a heap snapshot. The heap walker offers the option "Remove unreferenced and
weakly referenced objects" which is the equivalent of a full GC.
JProfiler also keeps statistics on garbage collected objects. All dynamic memory views have a
mode selector where you can choose whether to display only live objects on the heap, only
garbage collected objects, or both of them.
When you have stopped allocation call stack recording and you restart it, the previous contents
of the dynamic memory views will be deleted. In this way, allocation call stack recording gives
you the ability to do differencing of the heap between two points in time.
If you have very specific requirements as to where allocation call stack recording should start
and stop, you can use the offline profiling API [p. 271] to control allocation call stack recording
programmatically.
Implications of unrecorded objects
For "unrecorded" objects there are the following implications:
• JProfiler does not know the allocation spot for an unrecorded object. This becomes apparent
in the heap walker. The heap walker takes a heap snapshot and is able to show all objects on
the heap, however, the allocation information is not available from the JVMTI and the
"Allocations" view will contain top-level method nodes that are labeled as "unrecorded objects".
31
• JProfiler does not know the class name for an unrecorded object. This influences the monitor
views and locking graphs where JProfiler is only able to display the name of a monitor object
if the object has been recorded.
The "Memory" graph in the VM telemetry views is not affected by allocation call stack recording.
Allocation call stack recording and the heap walker
In the heap walker options dialog that is displayed before a heap snapshot is taken, the first
option is labeled "Select recorded objects". This allows you to work with a set of objects that has
been created during a certain period of time. This is just an initial selection step and does not
mean that the heap walker will discard all unrecorded objects. In the references view you can
still reach all referenced and referencing objects and create a new object set with unrecorded
objects.
If you use the "show selection in heap walker" action in the dynamic memory views, the number
of selected objects will only match approximately. If "Select recorded objects" is checked and
"Remove unreferenced and weakly referenced objects" is not checked in the heap walker options
dialog, the numbers might still not match exactly since the dynamic memory views can change
in time while a heap snapshot is fixed.
32
A.3.2 Using The Difference Column In The Memory Views
Introduction
In contrast to allocation call stack recording [p. 31] , where you can restrict the displayed objects
to a certain period of time, a common situation is that you want to retain all recorded objects
but still see the difference of object allocations with respect to a certain point in time. In particular,
you might be interested in which classes have a decreasing allocation count, something that
would not be possible with allocation call stack recording.
Memory views with differencing
By default the difference column is not displayed. Only when you choose View->Mark Current
Values or the corresponding toolbar button, the difference column is shown as the next-to-last
column. The following views in JProfiler have an optional difference column:
• all objects view and recorded objects view
In the all objects view and the recorded objects view, the difference column displays the
number of currently allocated objects of a class minus the number at the point when the
values were marked.
• allocation hotspot view
In the allocation hot spots view, the difference column is similar to the recorded objects view,
just that the number of allocations in a method are measured. If you select a class in the
"Allocation options" dialog that is shown after clicking the "Calculate" button, the number of
allocations is for a single package or class only.
33
In most cases you'll be interested in sorting the view by the values in the difference column.
There are two sort modes that can be adjusted in the view settings dialog. By default, sorting is
done for object counts ("sort by values"), but you can switch to "sort by percentages", if you want
to focus on relative changes.
In addition, you can choose to sort by absolute values. With absolute ordering, the absolute
value of the difference will be used for sorting. This is appropriate if you're interested in the
biggest changes. With normal ordering, you'll have positive differences at the top, then a usually
long list of zero differences and finally the negative differences. This is the right setting if you're
looking for a memory leak and are only interested in positive differences.
Differencing and the heap walker
The difference column only shows a calculation, there's no fixed set of objects behind this number.
Because of that, it is not possible to select the "difference objects" and work with them in the
heap walker. To select objects based on their time of creation, please see the article on allocation
call stack recording [p. 31] .
The class tracker
The class tracker view provides a way to capture the history of instance counts over time for
selected classes or packages in the form of a graph. However, you have to select the tracked
classes or packages in advance, so the class tracker is best used on classes or packages that
appear suspicious from the differencing in the all objects or recorded objects view.
34
A.3.3 Finding A Memory Leak
Introduction
Unlike C/C++, Java has a garbage collector that eventually frees all unreferenced instances. This
means that there are no classic memory leaks in Java where you forget to delete an object or a
memory region. However, in Java you can forget something else: to remove all references to an
instance so that the object can be garbage collected. If an object is only ever held in a single
location, this may seem simple, but in many complex systems objects are passed around through
many layers, each of which can add a permanent reference to the object.
Sometimes it appears to be clear that an object should be garbage collected when looking at
the local environment of where the object is created and discarded. However, any call to a
different part of a system that passes the object as a parameter can cause the object to "escape"
if the receiver intentionally or by mistake continues to hold a reference to the object after the
call has completed. Often, over-eager caching with the intention to improve performance or
design mistakes where parallel access structures are built are the reason for memory leaks.
Recognizing a memory leak
The first step when suspecting a memory leak is to look at the "Memory" and "Recorded objects"
telemetry views. When you have a memory leak in your application, these graphs must show a
linear positive trend with possible oscillations on top.
If there's no such linear trend, your application probably simply consumes a lot of memory. This
is not a memory leak and the strategy for that case is straightforward: Find out which classes or
arrays use a lot of memory and try to reduce their size or number or instances.
Using differencing to narrow down a memory leak
The first stop when looking for the origin of a memory leak is the differencing action [p. 33] of
the all objects view and the recorded objects view. Simple memory leaks can sometimes be
tracked down with the differencing function alone.
First, you observe the differences in the all objects view or the recorded objects view and find
out which class is causing the problems. Then you switch to the allocation hot spots view, select
the problematic class and observe in the difference column in which method the problematic
instances are allocated. Now you know the method in which these instances were created.
An analysis of the code for this method and the methods to which these instances are passed
may already yield the solution to the memory leak. If not, you have to continue with the heap
walker.
Another tool to observe instance counts that also presents a history of values is the class tracker.
The class tracker shows graphs of instance counts versus time for selected classes and packages.
When the difference columns in the "all objects" or "recorded objects" views identify suspicious
classes, the class tracker can often generate further insight into the evolution of these instance
counts since you can correlate jumps or increases in the allocation rate with other telemetry
views or bookmarks.
The heap walker and memory leaks
When you take a heap snapshot, you first have to create an object set with those object instances
or arrays that should be freed by the garbage collector but are still referenced somewhere. If
you've already narrowed down the origin of the memory leak in the dynamic memory views, you
can use the "show selection in heap walker" action to save you some work and to start in the
heap walker right at the point where you left off in the dynamic memory views.
By default, the heap walker cleans a heap snapshot from objects that are unreferenced but are
still not collected by the garbage collector. This behavior can be controlled by the "Remove weakly
35
referenced objects" option in the heap walker options dialog. When searching for a memory
leak, this "full garbage collection" is desirable, since unreferenced objects are a temporary
phenomenon without any connection to a memory leak.
If necessary, you can now further narrow down the memory leak by adding additional selection
steps. For example, you can go to the outgoing references view and look at the instance data to
find out a number of instances that definitely should have been freed. By flagging these instances
and creating a new set of objects you can reduce the number of objects that are in your focus.
Using the biggest objects view to find the reason for a memory leak
Many memory leaks can be traced to object clusters that should be freed but are erroneously
held alive through a single string reference. This will lead to a number of objects that have a very
large retained size. "Retained size" is the memory that would be freed by the garbage collector
if an object were to be removed from the heap. The biggest objects view lists the objects with
the biggest retained sizes together with the tree of retained objects. You can use that tree to
drill down to find the erroneous references.
Using the reference graph to find the reason for a memory leak
The core instrument for finding memory leaks is the reference graph in the heap walker. Here
you can find out how single objects are referenced and why they're not garbage collected. By
successively opening incoming references you may spot a "wrong" reference immediately. In
complex systems this is often not possible. In that case you have to find one or multiple "garbage
collector roots". Garbage collector roots are points in the JVM that are not subject to garbage
collection. These roots emanate strong references, any object that is linked by a chain of
references to such a root cannot be garbage collected.
36
When you select an object in the incoming references or the graph, the [Show path to GC root]
button at the top is enabled.
Potentially there are very many garbage collector roots and displaying them all can lead to the
situation that a sizable fraction of the entire heap has to be shown in the reference graph. Also,
looking for garbage collector roots is computationally quite expensive, and if thousands of roots
can be found, the computation can take very long and use a lot of memory. In order to prevent
this, it is recommended to start with a single garbage collector root and search for more roots
if required. An option dialog is displayed after you trigger the search:
As you can see in this example, the chain to a garbage collector root can be quite long:
37
The reason for a memory leak can be anywhere along this chain. It is of a semantic nature and
cannot be found out by JProfiler, but only by the programmer. Once you have found the faulty
reference, you can work on your code to remove it. Unless there are other references, the memory
leak will be gone.
Using the cumulated references views to find the reason for a memory leak
In some cases, you might not succeed in narrowing down the object set to a reasonable size.
Your object set might still contain a large number of instances that are OK and using the reference
graph might not provide any insight in this situation.
If such a situation arises, the cumulated reference tables available in the references view of the
heap walker can be of help. The cumulated incoming reference table shows all possible reference
types into the current object set:
38
From the reference type, you may be able to narrow down the object set. For example, you may
know that one type of reference is OK, but another is not. As a hypothetical example, the reference
from HashMap$Entry in the table above might be suspicious. By selecting the 31 objects which
are referenced in this way, you can discard the other 19 instances and use the reference graph
to show the path to a garbage collector root.
39
A.4 CPU Profiling
A.4.1 Time Measurements In Different CPU Views
Wall clock time and CPU time
When the duration of a method call is measured, there are two different possibilities to measure
it:
• Most likely you'll be interested in the wall clock time, that is the duration between the entry
and the exit of a method as measured with a clock. For the profiling agent this is a
straightforward measurement. While it might seem at first glance that measuring times should
not have any significant overhead, this is not so if you need a high resolution measurement.
Operating systems offer different timers with different performance overheads.
For example, on Microsoft Windows, the standard timer with a granularity of 10 milliseconds
is very fast, because the operating system "caches" the current time. However, the duration
of method calls can be as low as a few nanoseconds, so a high resolution timer is needed. A
high resolution timer works directly with a special hardware device and carries a noticeable
performance overhead. In JProfiler, CPU recording is disabled by default. If you compare the
duration of the startup sequence of an application server with and without CPU recording,
you will notice the difference.
Wall clock time is measured separately for each thread. In CPU views where the thread selection
includes multiple threads, the displayed times can be larger than the total execution time of
the application. If you have 10 parallel threads of the same class MyThreadClass whose
run() method takes 1 second and "All threads" is selected in the call tree, the
MyThreadClass.run() node in the call tree will display 10 seconds, even though only one
second has passed.
• Since the CPU might be handling many threads with different priorities, the wall clock time is
not the time the CPU has actually spent in that method. The scheduler of the operating system
can interrupt the execution of a method multiple times and perform other tasks. The real
time that was spent in the method by the CPU is called the CPU time. In extreme cases, the
CPU time and the wall clock time can differ by a large factor, especially if the executing thread
has a low priority.
The standard time measurement in JProfiler is wall clock time. If you wish to see the CPU time
in the CPU views, you can change the measurement type in the profiling settings. The problem
with CPU time measurements is that most operating systems provide this information with
the granularity of the standard timer - high resolution measurements would carry too much
overhead. This means the CPU times are only statistically valid for methods that have a CPU
time bigger than the typical granularity of 10 milliseconds.
Thread statuses
The notion of time measurement must be refined further, since not all times are equally
interesting. Imagine a server application with a pool of threads waiting to perform a task. Most
of the time would then be spent in the method that keeps the threads waiting while the actual
task will only get a small part of the overall time and will be hard to spot. The necessary refinement
is done with the concept of thread status. There are 4 different thread statuses in JProfiler:
• Runnable
In this case the thread is ready to execute code. The reason that this is not called "Running"
is that it may actually not be running due to the scheduler of the operating system. However,
if given a chance, the thread will execute instructions.
40
• Waiting
This means that the thread has deliberately decided to enter into hibernation until a certain
event occurs. This happens when you call Object.wait() and the current thread will only
become runnable again when some other thread calls Object.notify() on the same object.
• Blocking
Whenever synchronized blocks of code or synchronized methods occur, there can be monitor
contention. If one thread is in the synchronized area all other threads trying to enter it will be
blocked. Frequent blocking can reduce the liveness of your application.
• Net I/O
During network operations, many calls in the Java standard libraries can block because they're
waiting for more data. This kind of blocking is called "Net I/O" in JProfiler. JProfiler knows the
list of methods in the JRE that lead to blocked net I/O and instruments them at load time.
When looking for performance bottlenecks, you're mostly interested in the "Runnable" thread
state although it's always a good idea to have a look at the "Net I/O" and "Blocking" thread states
in order to check if the network or synchronization issues are reducing the performance of your
application.
Times in the call tree
Nodes in the call tree (methods, classes, packages or Java EE components, depending on the
selected aggregation level) are sorted by total time. This is the sum of all execution times of
this node on the particular call path as given by the ancestor nodes. Only threads in the current
thread selection are considered and only measurements with the currently selected thread status
are shown.
Optionally, the call tree offers the possibility to show the inherent time of a node. The inherent
time is defined as the total time of a method minus the time of its child nodes. Since child nodes
can only be in unfiltered classes, calls into filtered classes go into the inherent time. If you change
your method call recording filters [p. 23] , the inherent times in the call tree can change.
Times in the hot spots view
While the call tree view shows all call stacks in your application, the hot spots view shows the
methods that take most of the time. Each method can potentially be called through many different
call stacks, so the invocation counts in the call tree and the hot spots view do not have to match.
The hot spots view shows the inherent time rather than the total time. In addition, the hot spots
view offers the option to include calls to filtered classes into the inherent time. Please see the
article on hot spots and filters [p. 42] for a thorough discussion of this topic.
When you open a hot spot node, you see a reverse call tree. However, the times that are displayed
in those backtraces do not have the same meaning as those in the call tree, since they do not
express a time measurement for the corresponding node. Rather, the time displayed at each
node indicates how much time that particular call tree contributes to the hot spot. If there is
only one backtrace, you will see the hot spot time at each node.
Times in the call graph
The times that are shown for nodes (methods, classes, packages or Java EE components,
depending on the selected aggregation level) in the call graph are the same as those in the hot
spots view. The times that are associated with the incoming arrows are the same as those in
the first level of the hot spot backtrace, since they show all calling nodes and the cumulated
duration of their calls. The time on the outgoing arrows is a measurement that cannot be found
in the call tree. It shows the cumulated duration of calls from this node, while the call tree shows
the cumulated duration of calls from the current call stack.
41
A.4.2 The Influence Of Method Call Recording Filters On Hot Spots
Introduction
The notion of a performance hot spot is not absolute but relative to your point of view. The total
execution time of a method is not the right measure, since in that case your main method or
the run() methods of your threads would be the biggest hot spots in most cases. Such a definition
of a hot spot would not be very useful. Clearly, we somehow must use the inherent time of
methods to determine what a hot spot is.
As an extreme case, one could use the inherent time of all executed methods in the JVM for the
ranking of hot spots. This would not be very useful either, since the biggest hot spots will most
likely always be core methods in the JRE, like string manipulation, I/O classes or core drawing
routines in obscure implementation classes of the AWT.
As the above considerations make clear, the definition of a hot spot is not trivial and must be
carefully considered.
Definition of a hot spot
Only with method call recording filters [p. 25] is it possible to come up with a useful definition
of a hot spot. Usually, your filter settings will exclude all library classes and framework classes
by restricting the profiled classes to your top-level packages.
In order to be useful to you, a hot spot must be
• a method in your own classes
These are the classes that you can actually modify to solve a performance problem.
• a method in a library class that you call directly
This gives you a more fine-grained resolution of the activities of your own methods. While not
directly under your control, you can sometimes choose to call libraries less frequently or in a
different way.
Sometimes, you will want to eliminate hot spots in unprofiled classes by adding their time to the
inherent time of the calling method, which is definitely in a profiled class. In that way, only profiled
methods can appear as hot spots. JProfiler's hot spots view offers both modes with the "Filtered
classes" drop-down list in the top-right corner. The allocation hot spots view also offers this
mechanism of adjusting the definition of a hot spot.
Example
In the following example, a simple program with the main class misc.JdomTest is shown that
reads an XML file with the help of the JDOM library. First, we set the filter settings to include
misc. and org.jdom2..
42
Since we profile the JDOM classes, all the hot spots are in the JDOM subsystem, and not in our
own class. This may be useful if you are a JDOM developer, but otherwise you just see confusing
and useless information. None of the listed org.jdom2.* classes are ever called by our code.
While we could open the back traces and check how they have been invoked, this is cumbersome
and produces no insight into any performance problems that we might be able to solve.
In the next step, we change our filter settings so that only the misc. package is profiled.
We see the SAXBuilder class in JDOM that is actually constructed and called by our code to
read the XML file. No other internal JDOM classes are shown. The readDocument method that
calls the JDOM library is not a significant hot spot.
If you want to fully concentrate on your own classes, the remaining JDOM hot spots might be
unwanted. You can quickly change the hot spot definition by setting "Filtered classes handing"
to "Add to calling class".
43
Now, the list of hot spots just includes the method that reads the XML file, as expected for our
trivial example.
From the above example, you can see how important the filter settings and the filtered classes
handling are for the actual results in the hot spots view. The same considerations apply to the
allocation hot spots view.
44
A.4.3 Request Tracking
Introduction
It is a standard practice of most applications to handle certain tasks on dedicated threads. The
execution may be asynchronous to avoid blocking on the calling thread or synchronous because
certain operations may only be performed on one particular thread. For debugging and profiling,
this thread change presents two problems: On the one hand, it is not clear how expensive an
invoked operation is. On the other hand, an expensive operation cannot be traced to the code
that caused its execution.
JProfiler's solution to this problem is request tracking: Call sites and execution sites in
multi-threaded programming are hyperlinked in the call tree [p. 195] , so you can seamlessly
navigate both ways.
Request Tracking Types
Inter-thread communication can be implemented in various ways and the semantics of starting
tasks on a separate thread cannot be detected in a generic way. JProfiler explicitly supports
several common asynchronous systems. You can enable or disable them in the request tracking
settings [p. 214] . By default, request tracking is not enabled.
The simplest way to offload a task on another thread is to start a new thread. JProfiler supports
this "Thread start" request tracking type. However, threads are heavy-weight objects and are
usually reused for repeated invocations, so this request tracking type is more useful for debugging
purposes.
The most important and generic way to start tasks on other threads uses executors in the
java.util.concurrent package. Executors are also the basis for many higher-level third party
libraries that deal with asynchronous execution. By supporting executors, JProfiler supports a
whole class of libraries that deal with multi-threaded and parallel programming.
Apart from the generic cases above, JProfiler also supports the two most popular GUI toolkits
for the JVM: AWT and SWT. Both toolkits are single-threaded, which means that there is one
special event dispatch thread that can manipulate GUI widgets and perform drawing operations.
In order not to block the GUI, long-running tasks have to be performed on background threads.
However, background threads often need to update the GUI to indicate progress or completion.
This is done with special methods that schedule a Runnable to be executed on the event dispatch
thread.
45
In GUI programming, you often have to follow multiple thread changes in order to connect cause
and effect: The user initiates an action on the event dispatch thread, which in turn starts a
background operation via an executor. After completion, that executor pushes an operation to
the event dispatch thread. If that last operation creates a performance problem, it's two thread
changes away from the originating event.
Call Sites
A call site in JProfiler is the last profiled method call before a recorded thread change is
performed. It starts a task at an execution site which is located on a different thread. If request
tracking is enabled for the appropriate request tracking type, JProfiler allows you to jump from
a call site to an execution site by using hyperlinks that are shown in the call tree view.
Call sites and execution sites are in a 1:n relationship. A call site can start tasks on several
execution sites, such as different threads in a thread pool. If a call site calls more than one
execution site, you can choose one of them in a dialog.
Execution Sites
An execution site is a synthetic node in the call tree that contains all executions that were started
by one particular call site. JProfiler allows you to jump back to the call site by using the hyperlink
in the execution site node.
46
In principle, call sites and execution sites could be implemented in an n:m relationship. However,
it is often important to separately analyze the execution site depending on the call site. For
example, the same executor thread can handle tasks submitted from different methods, but
they will probably be of a different nature and so merging them would not be advantageous.
That's why JProfiler creates a new execution site for every call site.
However, if the same call site invokes the same execution site repeatedly, the execution site will
show the merged call tree of all its invocations. If that is not desired, you can use the exceptional
methods [p. 85] feature to split the call tree further, as shown in the screen shot below.
Because several execution sites can refer to the same call site, call sites have a numeric ID. In
that way you can recognize the same call site if you see it referenced from different execution
sites. Execution sites are only referenced from a single call site and so they do not need a separate
ID.
47
A.4.4 Replacing Finalizers With Phantom References
Why finalizers are bad
Sometimes one must perform pre-garbage collection actions such as freeing resources. In a
JDBC driver, for example, a database connection may be held by a connection object. Before the
connection object is garbage collected, the actual database connection must be closed. In such
a case, one typically cannot rely on the close() method being called by the user application
code.
Most often, finalizers are used to solve this problem. A finalizer is created by overriding the
finalize() method of java.lang.Object. In that case, before the object is garbage collected,
this finalize method will be called. Unfortunately, there are severe problems with the design of
this finalizer mechanism. Using finalizers has a negative impact on the performance of the
garbage collector and can break data integrity of your application if you're not very careful since
the "finalizer" is invoked in a random thread, at a random time. If you use a lot of finalizers, the
finalizer system may be completely overwhelmed which can lead to OutOfMemoryErrors. In
addition, you have no control about when a finalizer will be run, so it can create problems with
locking, the shutdown of the JVM and other exceptional circumstances.
Because the random execution of the finalizers break the call tree, JProfiler eliminates them from
the profiling results.
The solution for all these problems is to eliminate finalizers where they are not strictly required
and replace the necessary ones with phantom references.
What are phantom references?
Phantom references can be used to perform actions before an object is garbage collected in a
safe way. In the constructor of a java.lang.ref.PhantomReference, you specify a
java.lang.ref.ReferenceQueue where the phantom reference will be enqueued once the
referenced object becomes "phantom reachable". Phantom reachable means unreachable other
than through the phantom reference. The initially confusing thing is that although the phantom
reference continues to hold the referenced object in a private field (unlike soft or weak references),
its getReference() method always returns null. This is so that you cannot make the object
strongly reachable again.
From time to time, you can poll the reference queue and check if there are any new phantom
references whose referenced objects have become phantom reachable. In order to be able to
do anything useful, one can for example derive a class from java.lang.ref.PhantomReference
that references resources that should be freed before garbage collection. The referenced object
is only garbage collected once the phantom reference becomes unreachable itself.
How to replace finalizers with phantom references
Let's continue with the example of the JDBC driver above: Before a connection object is garbage
collected, the actual database connection must be closed. The following steps are necessary to
achieve this with phantom references:
• Add data structure that holds phantom references
The JDBC driver class gets a data structure that holds phantom references to the connection
objects. A private field
private LinkedList phantomReferences = new LinkedList();
would be appropriate. This is necessary to ensure that phantom references are not garbage
collected as long as they have not been handled by the reference queue.
48
• Create reference queue
Before a connection object will be garbage collected, its phantom reference will be enqueued
into the associated reference queue. The JDBC driver thus gets an additional private field
private ReferenceQueue queue = new ReferenceQueue();
• Derive a class from PhantomReference that references resources
You will not be able to access the original object from a phantom reference. Therefore, you
have to add the resources that must be freed to the phantom reference itself. In our example
JDBC driver this could be a class named DatabaseConnection. The phantom reference class
will thus look like:
public class ConnectionPhantomReference extends PhantomReference {
private DatabaseConnection databaseConnection;
public MyPhantomReference(ConnectionImpl connection, ReferenceQueue queue) {
super(connection, queue);
databaseConnection = connection.getDatabaseConnection();
}
public void cleanup() {
databaseConnection.close();
}
}
The custom phantom reference extracts the resource object from the implementation class
of the connection and saves it in a private field. It additionally provides a cleanup() method
that can be invoked once after the phantom reference is taken out of the reference queue.
• Create and remember phantom references when objects are created
When a connection object is created, a corresponding ConnectionPhantomReference must
be created as well and added to the phantomReferences list:
phantomReferences.add(new ConnectionPhantomReference(connection, queue));
• Create reference queue handler thread
When a phantom reference is added to the queue by the garbage collector, no further action
is taken. You have to handle and empty the reference queue yourself. It's best to create a
separate daemon thread that removes phantom references from the queue and invokes the
cleanup method:
Thread referenceThread = new Thread() {
public void run() {
while (true) {
try {
ConnectionPhantomReference ref =
(ConnectionPhantomReference)queue.remove();
ref.close();
phantomReferences.remove(ref);
} catch (Exception ex) {
// log exception, continue
}
}
}
};
referenceThread.setDaemon(true);
referenceThread.start();
The phantom reference is removed from the phantomReferences list. Now the phantom
reference is unreferenced itself and the referenced object can be garbage collected.
49
A.5 Probes
A.5.1 Probes Explained
Introduction
Most functionality in a Java profiler revolves around the basic operations in the JVM which mainly
concern memory allocations, CPU usage and threading operations. In addition, JProfiler offers
a higher-level analysis of common Java subsystems that are used by many applications. For JSE,
they are file I/O, network I/O and process execution. For JEE, JProfiler can collect data on servlets
as well as JDBC, JMS and JNDI. Each such subsystem is handled by a single "probe".
The probes facility in JProfiler is exposed through an API, so you can write your own custom
probe [p. 55] to capture information on other subsystems as well. Because JProfiler allows you
to enter scripts directly in the JProfiler GUI, custom probes can also be configured and deployed
without using your IDE and without modifying the profiled application.
Events
Probes intercept selected methods to collect data. At method entry, a probe will usually extract
semantic data from the method arguments and store it for later use. Some method invocations
will be intercepted just for collecting information, other method invocations define time-consuming
operations that are measured by the probe. When such methods exit (either via a return or
through an exception), the probe will retrieve the stored data, determine how long the method
execution has taken, and publish an event.
An event contains the following information: a start time, an optional duration, the associated
thread and a description that is constructed by the probe to describe the event. Also, an event
has an event type that distinguishes various classes of events. For example, the JDBC probe
publishes different events for statement, prepared statement and batch execution. In addition,
an event can have an associated stack trace.
From these basic events, JProfiler calculates more aggregated data as explained below. After an
event has been processed, it can either be discarded or retained for inspection in the probe
events view [p. 243] . You can make this decision yourself in the probe settings [p. 102] by choosing
whether or not to record single events. By default, only the JEE probes are configured to record
single events. In other probes, a lot of events can be generated very quickly. File I/O, for example
produces a lot of events. To prevent excessive memory usage when single events are recorded,
JProfiler consolidates events. The event cap is configured in the profiling settings [p. 90] and
50
applies to all probes. Only the most recent events are retained, older events are discarded. This
consolidation does not affect the higher-level views.
Payload
For events that have an associated stack trace, the probe can publish the event description as
payload into the recorded call tree. The event description then becomes the payload name. If
you record CPU data, you can open the call tree view in the CPU section and locate a call trace
where a probe intercepts data, for example, a database connection executing JDBC statements.
You will see a payload container node that contains the payload names that have been published,
in our example the SQL strings.
In the call tree, events with the same payload names and stack traces are aggregated. This means
that at each stack trace, a particular payload name can occur only once. The number of invocations
and the total times are displayed. Payload names are consolidated on a per-call stack basis,
with oldest entries being aggregated into an "Earlier calls" node. By default, the maximum number
of recorded payload names per call stack is 50.
If CPU data is not being recorded, payload information is still collected, just without the associated
stack trace. Often you will use the "Sampling" mode for CPU profiling to reduce the overhead.
This works fine for performance problems, but for probes you usually need exact stack trace
information. This is why JProfiler by default determines the exact stack traces even if "Sampling"
is chosen.
Hot Spots
From the payload information, JProfiler calculates payload hot spots, similar to the CPU hot spots.
Payload names are aggregated over the entire call tree and sorted by their execution times.
JProfiler calculates a tree of back traces that show you which call stacks have contributed how
much time and how many invocations to the hot spot.
51
If no CPU data is recorded, the back traces will only contain a "No CPU data was recorded" node.
If CPU data was only partially recorded, there may be a mixture of these nodes with actual back
traces.
Control Objects
An important concept in JProfiler's probes are control objects. Events are often bound to
particular long-lived Java objects. For example, JDBC statements are associated with a JDBC
connection and file I/O is associated with instances of java.io.File. These probe-specific
control objects can be opened and closed via special event types.
Control objects are displayed in a separate view together with aggregated information from the
associated events. For each event type, control objects show the aggregated event count and
event duration. For events that measure throughput in bytes, the aggregated throughput is
displayed as well. Furthermore, the probe can publish additional data for control objects that
will help you with identifying and debugging control objects. For example, the processes probe
publishes the command line parameters, the working directory, the special environment variables
and the exit code of the process.
Since control objects have a start and an end time, JProfiler shows them on a time line as
horizontal bars. The events that are associated with a control object are shown in different colors
on the bar in the time line. For example, read and write events in the socket probe are shown
as different colors. If no event has taken place at a particular time, the probe is shown as idle.
For example, a JDBC connection is idle, unless a JDBC statement is being executed. This status
data is not taken from the list of events, which may be consolidated or not even available, but
it is sampled every 100 ms from the last status.
52
Telemetries
As an even more aggregated form of data, probes can publish telemetries that show graphs of
arbitrary measurements on a time axis. Telemetry data is determined once per second.
Most telemetries of built-in probes in JProfiler are canonical aggregations, such as the number
of open control objects, event counts per second or throughputs per second. Some telemetries
are probe-specific such as the "Average statement execution time" telemetry of the JDBC probe.
Tracking
Telemetries concern the summed up state of everything that is measured by a probe. More
fine-grained telemetries for selected control objects or hot spots are available in the probe
tracker.
53
Depending on the capabilities of the probe, you can track different measurements for different
elements. For selected control objects, you can track event durations, event counts and event
throughputs, for selected hot spots you can track execution times split into thread states and
invocation counts.
54
A.5.2 Custom Probes
Introduction
If you want to collect information on a subsystem that is not covered by the built-in probes,
JProfiler offers an API to write your own custom probes. There are two ways to develop and
deploy a custom probe into the profiled application. You can write your custom probe in your
IDE, add the compiled classes to the classpath, and add a special VM parameter to the invocation
of the profiled application. Alternatively, you can create the probe directly in the JProfiler GUI by
configuring the scripts in the custom probe wizard. In the latter case, no modification of the
profiled application is necessary.
For an overview of the basic probe concepts, please see the corresponding help topic [p. 50] .
An example of a custom probe is given in the api/samples/probe directory.
Probe Configuration
A probe is a Java class that implements one or both of the interfaces
com.jprofiler.api.agent.probe.InterceptorProbe
and
com.jprofiler.api.agent.probe.TelemetryProbe. Both interfaces extend the base
com.jprofiler.api.agent.probe.Probe interface which in itself is not sufficient to develop
a useful probe.
Each probe is configured at startup when its getMetaData() method is called by the profiling
agent.
To
get
a
meta
data
instance,
call
com.jprofiler.api.agent.probe.ProbeMetaData#create(String name) and continue
calling configuration methods on the returned object. ProbeMetaData is a fluent interface, so
you can append calls to its methods on the same line. The information you provide at
configuration time via the ProbeMetaData is relevant when using the
com.jprofiler.api.agent.probe.ProbeContext that is passed to you during data-collection
time.
Several configuration methods determine the capabilities of the probe. For example,
metaData.payload(true).telemetry(true).events(true).controlObjectsView(true)
configures a probe that publishes data for all available views.
An
easy
way
to
c o n f i g u re
an
automatic
telemetry
is
to
call
ProbeMetaData#addOpenControlObjectTelemetry(String name). Custom telemetries
can be configured with ProbeMetaData#addCustomTelemetry(String name, Unit unit,
float factor).
Importantly for the time line and events views, you can configure custom event types with
ProbeMetaData#customTypeNames(String[] names) and assign custom colors to them
with ProbeMetaData#customColors(String[] names).
Events and control objects can receive additional data, which is configured with
ProbeMetaData#addAdditionalData(String name, DataType dataType) for events and
ProbeMetaData#addAdditionalControlObjectData(String name, DataType dataType,
boolean nested) for control objects.
Interceptor Probes
An interceptor probe gets the opportunity to intercept selected methods. It is queried at startup
for the methods that should be instrumented and notified each time one of those methods is
called.
To
the
interception
methods
an
instance
of
com.jprofiler.api.agent.probe.InterceptorContext is passed which contains methods
for publishing payload information and creating events.
55
Because
methods
can
be
intercepted
recursively,
you
should
use
InterceptorContext#push(PayloadInfo) to save a payload at method entry and
InterceptorContext#pop() to retrieve it at method exit. The payload stack is thread-local,
so it also works in multi-threaded situations. Finally you can call calculateTime() on the
payload info object and publish it with InterceptorContext#addPayloadInfo(PayloadInfo).
Control
objects
are
registered
by
creating
an
open
event
with
ProbeContext#createOpenEvent(String description, Object controlObject) and
are closed by creating a close event with ProbeContext#createCloseEvent(String
description, Object controlObject). If you have configured additional data for control
objects, you create the open event with ProbeContext#createOpenEvent(String
description, Object controlObject, Object[] controlObjectData) instead.
Custom
events
for
particular
control
objects
are
created
with
ProbeContext#createCustomEvent(String
description,
int
type,
Object
controlObject). If you do not use control objects, just pass null as the last parameter of this
method. The type ID is the index in the array argument that was passed to
ProbeMetaData#customTypeNames(String[] names) at configuration time. If you have
configured
additional
data
for
events,
you
supply
it
by
calling
ProbeEvent#additionalData(Object[] additionalData) on the event.
Note
that
all
created
events
ProbeContext#addEvent(ProbeEvent).
have
to
be
published
by
calling
Telemetry Probes
A telemetry probe is called via its fillTelemetryData(ProbeContext probeContext,
int[] data, int duration) method and thus periodically gets a chance to publish its
telemetry data. The indices in the data array correspond to the invocations of
ProbeMetaData#addCustomTelemetry(String name, Unit unit, float factor) in
the meta-data configuration.
Since telemetry information is not related to payloads, to telemetry probes an instance of
com.jprofiler.api.agent.probe.ProbeContext is passed rather than an instance of the
derived com.jprofiler.api.agent.probe.InterceptorContext that is passed to the
interception methods of telemetry probes. A probe can take both roles and implement both the
interface for an interceptor probe and the interface for a telemetry probe.
Manual Probe Registration
To manually register a probe in the profiled application, you have to create a class that implements
com.jprofiler.api.agent.probe.ProbeProvider. Its getProbes() method can return
one
or
several
probes.
Then,
you
have
to
pass
the
VM
parameter
-Djprofiler.probeProvider=[fully-qualified-class] to the profiled JVM. The probe
provider is instantiated at startup.
Custom Probe Wizard
Developing probes in an IDE, compiling them against the JProfiler API and deploying them to the
profiled application together with the modification of the java command can be quite inconvenient.
JProfiler offers an easier way to quickly develop and deploy custom probes without the need to
use an IDE or modify the profiled application. The custom probe wizard [p. 105] leads you step
by step through the creation of a custom probe.
56
First, you define the meta data script, to which an instance of
com.jprofiler.api.agent.probe.ProbeMetaData is already passed. The script editor in
JProfiler offers code analysis, code completion and context-sensitive Javadoc.
Custom probes defined in the JProfiler GUI are both interceptor and telemetry probes. You can
optionally define a telemetry script in the custom probe wizard that will be called every second.
57
Selecting methods for interception is also much easier in the JProfiler GUI compared to writing
probes manually. You just choose the methods from a list of all methods found in the profiled
JVM.
There are three interception scripts for method entry, exit and exception exit. You configure
them for different groups of methods with the same signature. The method arguments of the
intercepted method are passed to the method entry script together with the interceptor context
and the current object.
58
Custom Probe Vs. Trigger
If you just want to intercept a method and invoke your own code there without collecting any
data, it is recommended to use a method trigger [p. 95] with a "Run interceptor script" action.
In this way you do not have to provide the probe meta data. Also, method triggers can be added
conveniently via the context menu in the call tree view.
59
B Reference
B.1 Getting Started
B.1.1 Quickstart Dialog
By default, the quickstart dialog is shown when JProfiler is started. It contains a number of
shortcuts that help to to get started with profiling your application. The manual configuration
dialog as well as all integration wizards are also available on the "New session" tab of the start
center [p. 62] . Once you're familiar with JProfiler you can turn off the quickstart dialog by
deselecting the check box show quickstart at startup at the bottom.
You can access the quickstart dialog at at any later time by pressing SHIFT-F1 or by choosing
Help->Show Quickstart Dialog from JProfiler's main menu.
B.1.2 Running The Demo Sessions
For a quick tour of JProfiler's features, please run the demo sessions:
1. Start up JProfiler and wait for the start center [p. 62] to appear.
2. Choose one of the demo sessions from the list of available sessions.
3. Click [OK].
4. The profiling settings dialog appears. To accept the default settings, just click [OK].
5. A terminal window is opened for the demo process and the main window of JProfiler starts
displaying profiling information [p. 126] .
The Java source code for the demo sessions can be found in "{JProfiler install
directory}/demo/">
B.1.3 Overview Of Features
JProfiler's features are ordered into view sections. A view section can be made visible by selecting
in JProfiler's sidebar. JProfiler offers the following view sections:
60
• Memory profiling [p. 139]
Keep track of your objects and find out where the problem spots are.
• The heap walker [p. 159]
Use the drill down capabilities of JProfiler's unique heap walker to find memory leaks.
• CPU profiling [p. 193]
Find out where your CPU time is going and zero in on performance bottlenecks.
• Thread profiling [p. 217]
Check the activity of your threads, resolve deadlocks and get detailed information on your
application's monitor usage.
• VM telemetry information [p. 231]
Unfold the statistical history of your application with JProfiler's virtual machine telemetry
monitors.
• JEE & probes [p. 233]
Measure higher-level subsystems of the JVM, like JDBC calls or file I/O, as well as own
subsystems with custom probes.
In order to help you find JProfiler's features which are most important to you, we present a
situational overview. There are two types of uses for a profiler which arise from different
motivations:
• Problem solving
If you turn to a profiler with a problem in your application, it most likely falls into one of the
following three categories:
• Performance problem
To find performance related problem spots in your application, turn to JProfiler's CPU
section [p. 193] . Often, performance problems are caused by excessive creation of temporary
objects. For that case, the recorded objects views [p. 142] with its view mode set to "garbage
collected objects" will show you where efforts to reduce allocations make sense.
For I/O or any other subsystem that is measured by a probe, the probe views [p. 233] show
you higher-level information on what operations take a lot of time.
• Excessive memory consumption
If your application consumes too much memory, the memory views [p. 139] will show you
where the memory consumption comes from. With the reference views [p. 171] in the heap
walker [p. 159] you can find out which objects are unnecessarily kept alive in the heap.
• Memory leak
If your application's memory consumption goes up linearly with time, you likely have a
memory leak which is show stopper especially for application servers. The "mark current
values and show differences" feature in the memory section [p. 139] and the heap walker
[p. 159] will help you to find the cause.
• Deadlock
If you experience a deadlock, JProfiler's current monitor graph [p. 225] will help you to find
the cause even for complex locking situations.
• Hard to find bug
A often overlooked but highly profitable use of a profiler is that of debugging. Many kinds
of bugs are exceptionally hard to find by hand or by using a traditional debugger. Some
61
bugs revolve around complex call stack scenarios (have a look at the CPU section [p. 193] ),
others around entangled object reference graphs (have a look at the heap walker section
[p. 159] ), both of which are not easy to keep track of.
Particularly JProfiler's thread views [p. 217] are of great help in multi-threaded situations,
where race-conditions and deadlocks are hard to track down.
• Quality assurance
During a development process, it's a good idea to regularly run a profiler on your application
to assess potential problem spots. Even though an application may prove to be "good enough"
in test cases, an awareness for performance and memory bottlenecks enables you adapt your
design decisions as the project evolves. In this way you avoid costly re-engineering when
real-world needs are not met. Use the information presented in JProfiler's telemetry section
[p. 231] to keep an eye on the evolution of your application. The ability to save profiling
snapshots [p. 113] enables you to keep track of your project's evolution. The offline profiling
[p. 265] capability allows you to perform automated profiling runs on your application.
B.1.4 JProfiler's Start Center
When JProfiler is started, the start center window appears. The start center is composed of
three tabs:
• Open session
All sessions configured by you or the pre-configured demo sessions can be started by double
clicking on a session or by selecting a session and clicking [OK] at the bottom of the start
center. In addition, sessions can be edited [p. 76] , copied or deleted by using the buttons on
the right hand side of the dialog or by invoking the context menu.
• New session
Sessions can be created in several ways:
• By manual configuration
Use the [New Session] button to manually configure [p. 77] a new session. After you finish
configuring your session, it will be started.
• By attaching to an already running process
Use the [Quick Attach] button to profile a JVM that is already running [p. 109] . After the
session is finished, JProfiler will ask you whether you want to save the session permanently.
• Through an integration wizard
Use the [New server integration] button to invoke the integration wizard [p. 63] selector.
The [New remote integration] and [New applet integration] buttons are convenience
shortcuts. After you finish configuring your session, you can either start the session
immediately or the "open session" tab will be displayed with the new session selected.
• Convert session
Here, you can convert existing launched application sessions to remote sessions or offline
profiling sessions [p. 265] or prepare a launched application session for redistribution to other
computers. The latter will also collect all files for the agent that are necessary to get the agent
running on remote machines. The existing launched application session that is chosen for
conversion will not be modified.
62
• Open snapshot
Previously saved sessions [p. 113] can be opened from this tab by selecting Open a single
saved snapshot and selecting the desired *.jps file. Also, you can select "Compare multiple
snapshots" to create snapshot comparisons [p. 246] .
When you choose not to open a profiling session for an empty window and exit the start center
by clicking the [Cancel] button, all of JProfiler's views are disabled and only the general settings
(Session->General Settings) and the Session and Help menus are enabled.
The start center can be invoked at any later time
• by choosing Session->Start Center or clicking on the corresponding
toolbar button.
If a session is currently active upon opening a session, it will be stopped after a confirmation
dialog and the new session will replace all profiling data of the old session.
• by choosing Session->New Window. A new main window of JProfiler will be opened, other
active sessions will not be affected.
B.1.5 Application Server Integration
JProfiler's application server integration wizard makes profiling application servers especially
easy. It can be invoked in one of two ways:
• from the start center [p. 62] on the "new session" tab.
• by selecting Session->New Server Integration from JProfiler's main menu.
During the first step of the wizard you are asked to specify the product which is to be integrated.
The second step asks you whether the profiled application or application server is running on
the local computer or on a remote machine. In the third step you choose the desired startup
mode which is one of "Wait for connection", "Startup immediately" and "Offline profiling". The
"Wait for connection" is recommended at first. Only choose the other modes later on once you
are familiar with JProfiler.
The subsequent steps depend on this choice. Please follow the instructions presented by the
wizard.
If you miss support for a particular product, please don't hesitate to contact us through the
support request form
If no GUI is available on the remote machine you can use the jpintegrate executable in the
bin directory for the console integration wizard.
The console integration wizard will create a config file that can be imported [p. 115] in a JProfiler
GUI installation to connect zo the profiled application server without any further configuration.
B.1.6 IDE Integration
JProfiler integrates seamlessly into several popular IDEs [p. 65] . To bring up the integration
dialog, please select Session->IDE Integrations from JProfiler's main menu.
Select the desired IDE from the drop down list and click on [Integrate]. After completing the
instructions, you can invoke JProfiler from the integrated IDE without having to specify class path,
main class, working directory, used JVM and other options again. Also, source code navigation
will be performed in the IDE where possible.
See here [p. 65] for specific explanations regarding each IDE integration.
63
B.1.7 JProfiler Licensing
Without a valid license, JProfiler cannot be started. When JProfiler is installed for the first time,
it offers you an option to get an evaluation key through an internet connect. If that method does
not work, visit ej-technologies.com to get an evaluation key or to buy a license. If you have already
obtained an evaluation key and were not able to evaluate JProfiler, please write to
[email protected] to request a new key. JProfiler does not work with license keys that
were issued for previous major versions.
You can enter your license key in one of two ways:
• In JProfiler's setup wizard
• Through JProfiler's main menu: Help->Enter License Key
Together with your license key, you are asked for your name and - if applicable - for the name
of your company.
Please read the included file license.html to learn about the scope of the license.
To make it easier for you to enter the license key, you can use the [Paste from clipboard] button,
after copying any text fragment which contains the license key to your system clipboard. If a
valid license key can be found in the clipboard content, it is extracted and displayed in the dialog.
64
B.2 IDE Integrations
B.2.1 JProfiler IDE Integrations
JProfiler can be integrated into the IDEs listed here [p. 65] . Installation is done either
• Automatically (recommended)
Select Session->IDE Integrations from JProfiler's main menu or go to the IDE integrations
tab [p. 120] in the general settings dialog [p. 117] . Now select the desired IDE from the drop
down list, click on [Integrate] and follow the instructions [p. 120] .
• Manually
The directory integrations in the JProfiler install directory holds a number of archives which
can be used for manually integrating JProfiler with any of the supported IDEs. See the file
README.txt in the above directory for detailed instructions.
After completing the instructions, you can invoke JProfiler from the integrated IDE without having
to specify class path, main class, working directory, used JVM and other options again.
All integrations insert toolbar buttons and menu entries into the respective IDE that run the
application in the IDE with profiling enabled. On Windows and Mac OS X, the IDE reuses an
already running instance of JProfiler to present profiling data. If JProfiler is not running, it will be
started automatically.
Navigation to source code from JProfiler will be performed in the IDE, i.e. if you choose the "Show
source" action for a class or a method, it will be displayed in the IDE and not in JProfiler's integrated
source code viewer.
B.2.2 JProfiler As An IntelliJ IDEA Plugin
With JProfiler integrated into JetBrain's IntelliJ IDEA, JProfiler can be invoked from within the IDE
without any further need for session configuration.
Requirements: IDEA 6.x, 7.x., 8.x, 9.x, 10.x, 11.x or 12.x
For newly released versions of IntelliJ IDEA, download the JProfiler plugin from the IDEA plugin
manager.
The installation of the IntelliJ IDEA plugin is started by selecting "IntelliJ IDEA [your version]" on
the
• IDE integration tab of JProfiler's setup wizard
• miscellaneous options tab [p. 120] of JProfiler's general settings [p. 117] (use Session->IDE
integrations in JProfiler's main menu as a shortcut).
and clicking on [Integrate]
Reminder: Please close IntelliJ IDEA while performing the plugin installation. If you are performing
the installation from JProfiler's setup wizard, please complete the entire setup first before starting
IntelliJ IDEA.
A file selector will then prompt you to locate the installation directory of IntelliJ IDEA.
After acknowledging the completion message, you can start IntelliJ IDEA and check whether the
installation was successful. You should now see a menu entry Run->Profile in IDEA's main
menu.
To profile your application from IntelliJ IDEA, choose one of the profiling commands in the Run
menu, the context menu in the editor, or click on the corresponding toolbar button.
65
Main toolbar with "Profile" button
"Run" menu with "Profile" action
66
Editor context menu with "Profile" action
JProfiler can profile all run configuration types from IDEA, also applications servers. To configure
further settings, please edit the run configuration, choose the "Startup/Connection" tab, and
select the "Profile" entry. The screen shot below shows the startup settings for a local server
configuration. Depending on the run configuration type, you can adjust JVM options or retrieve
profiling parameters for remote profiling.
67
Startup settings for profiling of a local server configuration
For all run configuration types you can decide whether you want to open a new window in JProfiler
for the profiling session or if you wish to reuse the last window to accommodate the profiling
session.
The profiled application is then started just as with the usual "Run" commands. If no instance of
JProfiler is currently running, JProfiler is also started, otherwise the running instance of JProfiler
will be used for presenting profiling data.
When JProfiler is started from IntelliJ IDEA, the "Show source" action for a class or a method in
one of JProfiler's view will show the source element in IDEA and not in JProfiler's integrated source
code viewer.
You can also open JProfiler snapshots from IDEA, either from the project window or the open
file dialog in order to get source code navigation into IDEA.
With the Run->Attach JProfiler to JVM menu item, you can attach JProfiler to any locally
started JVM and get source code navigation in the IDE. Please see the help on attaching to JVMs
[p. 109] for more information on attach mode.
In order to change the used JProfiler installation from IntelliJ IDEA, please do the following:
1. Select "Edit Configurations" from the "Run" drop down menu
2. Select "Application" under "Defaults" in the dialog box (or any existing run configuration)
3. Select the "Startup/Connection" tab
4. Select "JProfiler" in the list
5. Click on the "Select JProfiler Executable" button
6. Choose the JProfiler executable, which is
68
• [JProfiler installation directory]\bin\jprofiler.exe on Windows
• [JProfiler installation directory]/bin/jprofiler on Linux/Unix
• [JProfiler installation directory]/bin/macos/jprofiler.sh on Mac OS X
B.2.3 JProfiler As An Eclipse Plugin
When JProfiler is integrated into the eclipse IDE, JProfiler can be invoked from within the IDE
without any further need for session configuration. Profiling WTP run configurations is supported
by the JProfiler plugin.
Requirements: . eclipse 3.3+ or eclipse 4.x. The eclipse plugins work with the full SDKs for
eclipse. The JProfiler integration does not work with partial installations of the eclipse framework.
The installation of the eclipse plugin is started by selecting "eclipse [your version]; on the
• IDE integration tab of JProfiler's setup wizard
• miscellaneous options tab [p. 120] of JProfiler's general settings [p. 117] (use Session->IDE
integrations in JProfiler's main menu as a shortcut).
and clicking on [Integrate]
Reminder: Please close eclipse while performing the plugin installation. If you are performing
the installation from JProfiler's setup wizard, please complete the entire setup first before starting
eclipse.
A file selector will then prompt you to locate the installation directory of eclipse.
After acknowledging the completion message, you can start eclipse and check whether the
installation was successful. If the menu item Run->Profile ... does not exist in the Java
perspective, please enable the "Profile" actions for this perspective under Window->Customize
Perspective by bringing the Command tab to front and selecting the "Profile" checkbox.
eclipse provides shared infrastructure for profiling plugins that allows only one active profiler
at a time. If another profiler has registered itself in eclipse, JProfiler will show a collision message
dialog at startup. Please go to the plugin directory in your eclipse installation and delete the
plugins that are specified in the warning message in order to guarantee that JProfiler will be used
when you click on one of the profiling actions.
To profile your application from eclipse, choose one of the profiling commands in the Run menu
or click on the corresponding toolbar button. The profile commands are equivalent to the debug
and run commands in eclipse and are part of eclipse's infrastructure.
Main eclipse toolbar with "Profile" button
69
eclipse "Run" menu with "Profile" actions
The profiled application is then started just as with the usual "Run" commands. If no instance of
JProfiler is currently running, JProfiler is also started, otherwise the running instance of JProfiler
will be used for presenting profiling data.
Every time a run configuration is profiled, a dialog box is brought up that asks you whether a
new window should be opened in JProfiler. To get rid of this dialog, you can select the "Don't ask
me again" checkbox. The window policy can subsequently be configured in the JProfiler settings
in eclipse (see below).
All profiling settings and view settings changes are persistent across session restarts.
When JProfiler is used with the eclipse integration, the "Show source" action for a class or a
method in one of JProfiler's view will show the source element in eclipse and not in JProfiler's
integrated source code viewer.
You can also open JProfiler snapshots from eclipse, either from the project window or the open
file dialog in order to get source code navigation into eclipse.
With the Run->Attach JProfiler to JVM menu item, you can attach JProfiler to any locally
started JVM and get source code navigation in the IDE. Please see the help on attaching to JVMs
[p. 109] for more information on attach mode.
70
Several
JProfiler-related
settings
Window->Preferences->JProfiler:
can
be
adjusted
in
eclipse
under
• The used JProfiler installation can be changed by repeating the integration from JProfiler or
by adjusting the JProfiler executable in the corresponding text field. When you upgrade to a
newer version of JProfiler, make sure to repeat the integration, since the plugin has to be
updated, too.
• The window policy can be configured as
• Ask each time
Every time you profile a run configuration, a dialog box will ask you whether a new window
should be opened in JProfiler. This is the default setting.
• Always new window
Every time you profile a run configuration, a new window will be opened in JProfiler.
• Reuse last window
Every time you profile a run configuration, the last window will be reused in JProfiler.
• You can manually repeat the collision detection that is performed at startup. With the
corresponding checkbox, you can also switch off collision detection at startup.
B.2.4 JProfiler As A JDeveloper Addin
With JProfiler integrated into Oracle's JDeveloper, JProfiler can be invoked from within the IDE
without any further need for session configuration.
Requirements: JProfiler requires JDeveloper 10.1.3 or JDeveloper 11g.
The installation of the JDeveloper addin is started by selecting "JDeveloper [your version]" on
the
• IDE integration tab of JProfiler's setup wizard
• miscellaneous options tab [p. 120] of JProfiler's general settings [p. 117] (use Session->IDE
integrations in JProfiler's main menu as a shortcut).
and clicking on [Integrate]
Reminder: Please close JDeveloper while performing the addin installation. If you are performing
the installation from JProfiler's setup wizard, please complete the entire setup first before starting
JDeveloper.
A file selection box will then prompt you to locate the installation directory of JDeveloper.
After acknowledging the completion message, you can start JDeveloper and check whether the
installation was successful. You should now see a menu entry Run->Profile with JProfiler
in JDeveloper's main menu.
To profile your application from JDeveloper, choose one of the profiling commands in the Run
menu or click on the corresponding toolbar button.
Main toolbar with "JProfiler" button
71
"Run" menu with "JProfiler" actions
Project explorer context menu with "JProfiler" action
The profiled application is then started just as with the usual "Run" commands. If no instance of
JProfiler is currently running, JProfiler is also started, otherwise the running instance of JProfiler
will be used for presenting profiling data.
Every time a run configuration is profiled, a dialog box is brought up that asks you whether a
new window should be opened in JProfiler. To get rid of this dialog, you can select the "Don't ask
me again" checkbox. The window policy can subsequently be configured in the "JProfiler" node
in the settings dialog of JDeveloper (see below).
All profiling settings and view settings changes are persistent across session restarts.
When JProfiler is started from JDeveloper, the "Show source" action for a class or a method in
one of JProfiler's view will show the source element in JDeveloper and not in JProfiler's integrated
source code viewer.
72
Several
JProfiler-related
settings
Tools->Preferences->JProfiler:
can
be
adjusted
in
JDeveloper
under
• The used JProfiler installation can be changed by repeating the integration from JProfiler or
by adjusting the JProfiler executable in the corresponding text field. When you upgrade to a
newer version of JProfiler, make sure to repeat the integration, since the addin has to be
updated, too.
• The window policy can be configured as
• Ask each time
Every time you profile a run configuration, a dialog box will ask you whether a new window
should be opened in JProfiler. This is the default setting.
• Always new window
Every time you profile a run configuration, a new window will be opened in JProfiler.
• Reuse last window
Every time you profile a run configuration, the last window will be reused in JProfiler.
B.2.5 JProfiler As A NetBeans Module
With JProfiler integrated into Oracle's NetBeans(TM), JProfiler can be invoked from within the
IDE without any further need for session configuration.
Requirements: NetBeans 6.x, 7.x or 8.x.
The installation of the NetBeans plugin is started by selecting "NetBeans IDE [your version]" on
the
• IDE integration tab of JProfiler's setup wizard
• miscellaneous options tab [p. 120] of JProfiler's general settings [p. 117] (use Session->IDE
integrations in JProfiler's main menu as a shortcut).
and clicking on [Integrate]
Reminder: Please close NetBeans while performing the plugin installation. If you are performing
the installation from JProfiler's setup wizard, please complete the entire setup first before starting
NetBeans.
A file selection box will then prompt you to locate the installation directory of NetBeans. In the
next step, you are asked whether the installation should be performed globally, or for a single
user only. A single user installation is mostly of interest in network installations where the user
cannot write to the NetBeans installation directory. If you decide for a single user installation,
another file selection box will then prompt you to locate your NetBeans user directory. This is a
version-specific directory under .netbeans in your user home directory.
The NetBeans updater is then invoked and the plugin is installed. After acknowledging the
completion message, you can start NetBeans and check whether the installation was successful.
You should now see a menu entry Profile->Profile Main Project With JProfiler in
NetBeans' main menu.
You can profile standard and free form projects in NetBeans. For free form projects, you have
to debug your application once before trying to profile it, since the required file
nbproject/ide-targets.xml is set up by the debug action. JProfiler will add a target named
"profile-jprofiler" to it with the same contents as the debug target and will try to modify the VM
73
parameters as needed. If you have problems profiling a free form project, please check the
implementation of this target.
You can profile web applications with the integrated Tomcat or with any other Tomcat server
configured in NetBeans. When your main project is a web project, selecting "Profile main project
with JProfiler" (see below) starts the Tomcat server with profiling enabled. Please make sure to
stop the Tomcat server before trying to profile it.
If you use NetBeans with the bundled GlassFish Server, you can transparently profile Java EE
applications with it. When your main project is set up to use GlassFish Server, selecting "Profile
main project with JProfiler" (see below) starts the application server with profiling enabled. Please
make sure to stop the application server before trying to profile it.
To profile your application from NetBeans, choose one of the profiling commands in the Run
menu or click on the corresponding toolbar button.
Main toolbar with "JProfiler" button
"JProfiler" menu
74
Explorer context menu with "JProfiler" action
The profiled application is then started just as with the usual "Run" commands. If no instance of
JProfiler is currently running, JProfiler is also started, otherwise the running instance of JProfiler
will be used for presenting profiling data.
When JProfiler is used with the NetBeans integration, the "Show source" action for a class or a
method in one of JProfiler's view will show the source element in NetBeans and not in JProfiler's
integrated source code viewer.
You can also open JProfiler snapshots from NetBeans, either from the project window or the
open file dialog in order to get source code navigation into NetBeans.
75
B.3 Managing Sessions
B.3.1 Sessions Overview
The information required to start a profiling run is called a session. Sessions are saved in the
file {User home directory}/.jprofiler8/config.xml and can be easily migrated to a
different computer by importing this file in the setup wizard. When upgrading JProfiler, your
settings of older installations are imported automatically.
Sessions are created
• on the "New Session" tab of JProfiler's start center [p. 62] .
• by selecting Session->New Session from JProfiler's main menu.
• automatically by JProfiler's application server integration wizard [p. 63] .
• by importing them [p. 63] . from an external config file.
• closing a session that was created by invoking quick attach [p. 109] with Session->Quick
Attach. In that case, you will be asked whether to save a new session or not.
Sessions are edited, deleted and opened
• in JProfiler's start center [p. 62] .
• through the open session dialog [p. 107] which is accessible from JProfiler's main menu via
Session->Open Session.
The session settings dialog can be invoked from
• the open session dialog [p. 107] or the start center [p. 62] .
• the the session startup dialog [p. 107] that is displayed just before a session is started.
• JProfiler's main menu and the toolbar. The
toolbar button and the menu item
Session->Session Settings open the session settings dialog.
The session settings dialog is divided into 5 sections:
• Application settings
The application settings section [p. 77] collects all information that is required to start your
application with profiling enabled or to connect to a running JVM. If you use an IDE integration
[p. 65] , this information will be provided by the IDE.
This section also includes the code editor & compilation settings [p. 82] which are important
for code completion [p. 122] and compilation of scripts.
• Filter settings
In the filter settings section [p. 82] , you define which classes should be considered when
recording call-stack information. Defining appropriate filters will help you to reduce data
overload and minimizing CPU profiling overhead. By default, JProfiler adds an exclusion list
• Profiling settings
In the profiling settings section [p. 87] you can configure the way your application is profiled
and change the focus of a profiling run toward performance or accuracy, CPU or memory
profiling.
76
• Trigger settings
In the trigger settings section [p. 82] you can optionally define a list of triggers. With triggers,
you can tell the profiling agent to execute specific actions when certain events occur in the
JVM. The actions are also executed during offline profiling [p. 265] .
• Databases
In the Databases settings section [p. 103] you can configure the built-in database probes such
as JDBC or MongoDB.
• JEE & probes
In the JEE & probes section [p. 102] you can configure built-in probes and optionally define a
list of custom probes. Probes capture higher-level information on specific subsystems such
as servlet requests, file I/O or launcher processes.
If you change filter, profiling, trigger or probe settings for an active session, the new settings can
be applied immediately if you profile a 1.6+ JRE. Apart from telemetry data, all recorded data
including the heap dump in the heap walker will be discarded in that case. When profiling settings
are updated, a bookmark [p. 134] will be added to views with a time-line, such as the telemetry
views. The application of the new profiling settings may take some time, especially if filter settings
are changed and the method call recording type is set to dynamic instrumentation. In this case,
changes in the instrumentation requires that classes have to be retransformed to reflect the
new filter settings.
If you profile a pre-1.6 JRE, you have to restart the session.
View settings on the other hand, are always adjustable during a running session and are saved
separately for each session.
B.3.2 Application Settings
B.3.2.1 Application Settings
The application settings section of the session settings dialog [p. 76] collects all information that
is required to start your application with profiling enabled. If you use an IDE integration [p. 65]
, this information will be provided by the IDE.
• Session name
Every session has a unique name that is presented in the "Open session" pane of the start
center [p. 62] and in the open session dialog [p. 107] . It is also used for the title of the main
window and the terminal window. Next to the name text field you see an ID which is used for
choosing the session in offline profiling [p. 265] or for remote profiling with the "nowait" option
[p. 111] (in the latter case only relevant if the profiled JVM has a version of 1.5 or earlier).
• Session type
There are five different session types. Depending on this choice, the middle part of the tab
will display different options. The available sessions are grouped into two categories: attach
sessions that attach to a JVM that is already running and launch sessions that launch a new
JVM for profiling.
• Attach to local JVM session [p. 79]
With this session type, you can connect to any locally started JVM with a minimum version
of Java 1.6. The profiling agent is loaded on the fly. This is the easiest and most convenient
way to profile.
77
• Attach to profiled JVM session [p. 79]
With this session type, you can connect to a running application which has been started
with JProfiler's profiling agent [p. 110] . The profiling agent listens on the default port of 8849
which can be changed in the agent's initialization parameters. Remote sessions are most
convenient for profiling server applications on remote machines and application servers.
• Launched application session [p. 80]
A launched application session starts your application when the session is opened. You
have to specify the virtual machine, as well as your application's class path, main class,
parameters and working directory. Your application will be started in a separate terminal
window. Application sessions are most convenient for profiling GUI and console applications
where you have written the main class yourself.
• Launched applet session [p. 81]
Applet sessions are used for profiling applets with Sun's applet viewer which is shipped
with every JDK. You only have to supply the URL to a HTML page containing the applet.
Note: If the applet viewer is too restrictive for your applet, please use the Java plugin
integration wizard available on the New session tab of the start center [p. 62] to profile
the applet directly in the browser.
• Launched Java Web Start session [p. 82]
JProfiler can profile Java Web Start applications. You only have to supply the URL for the
JNLP file or select a cached application.
• Java file path
With the radio buttons on the left you can switch between the
• Class path
The class path consists of directories and jar files that are used for the -classpath VM
argument. The class path is also used by the bytecode viewer [p. 136] to find class files for
display.
• Source path
The source path optionally lists archives and directories that contain source code for some
or all of the entries in the class path. Note that the sources of the selected JDK contained
in src.jar or src.zip will be automatically appended if they are installed. The source
path is is used by the source code viewer [p. 136] to display Java sources.
• Native library path
The native library path consists of directories that are added to the native library
envrironment variable. The name of the native library envrironment variable depends on
the operating system. You only have to specify the native library path when you load native
libraries by calling java.lang.System.loadLibrary() or for resolving dependent libraries
that have to be dynamically loaded by your native libraries.
When clicking the add button you can select multiple path entries to the path list in one go
from the file chooser. Alternatively, to quickly add a list of path entries defined elsewhere, you
can copy a path from the system clipboard by clicking copy button. The path must consist
of either
• a single path entry
78
• or multiple path entries separated by the standard path separator (";" on Windows, ":" on
UNIX) or by line breaks.
Each path entry can be
• absolute
The path entry is added as it is.
• relative
On the first occurrence of a relative path, JProfiler brings up a directory chooser and asks
for the root directory against which relative paths should be interpreted. All subsequent
relative paths will be interpreted against this root directory.
JProfiler will only add unique path entries into the list. If no new path entry could be found, a
corresponding error message is displayed.
Note: Adjusting the class and source path during an active session is effective for the source
code and bytecode viewer [p. 136] only.
B.3.2.2 Attach To Local JVM Session
If the session type in the application settings [p. 77] is set to "Select from all local JVMs", the
middle part of the dialog allows you to configure filter settings for the dialog that shows all local
JVMs.
When the session is started, a dialog with all locally running JVMs with a minimum version of 1.6
is displayed. Some JVMs are marked with special backgrounds, either as
• Profiled
if the profiling agent has already been loaded. This may be because the profiling agent was
specified on the command line or because you have already attached to that JVM before.
• Offline
if the application is already profiled in offline mode. To start and stop recording as well as
save snapshots in offline profiling mode, use the jpcontroller [p. 268] command line executable.
• Connected
if the JVM is already connected to by another JProfiler GUI.
You can select any JVM that is not marked as offline or connected and start profiling.
Above the list of JVMs, you find a selector that allows you to modify the filter settings for the
displayed JVMs. The list of JVMs supports quick search (just type into it), alternatively you can
use the filter field at the bottom to restrict the displayed JVMs.
On Windows, only JVMs that are started by the currently logged in users are shown by default.
Often it is required to profile a service that is started by the "Local System" account. In that case,
you have to select the toggle button in the upper right corner to add the service JVMs to the list.
On Windows Vista and higher, a UAC dialog will be shown to elevate permissions (unless UAC
has been disabled). This is required because otherwise those JVMs cannot be discovered and
profiled.
Please see the help on attaching to JVMs [p. 109] for more information.
B.3.2.3 Attach To Profiled JVM Session
If the session type in the application settings [p. 77] is set to "Attach to profiled JVM (local or
remote)", the following settings are displayed in the middle part of the dialog:
79
• Host
Enter the host on which the application you want to profile is running either as a DNS name
or as an IP address. If this is your local computer, you may enter localhost.
• Port
Choose the port on which the profiling agent is listening. If you have not supplied a port
parameter [p. 111] , the default port 8849 is the correct choice. This default can be restored by
clicking the [Default] button on the right side of the text field.
• Timeout
Choose the timeout in seconds after which JProfiler will give up trying to connect to the profiled
application.
• Start command
If you enable the "start command" checkbox and enter the path to an executable in the text
field to the right, JProfiler will execute this command before trying to connect to the profiled
application. The output of that command will be displayed in a terminal window similar to the
"local" session type [p. 77] . In this case JProfiler has full control over the life cycle of the profiled
application. If the terminal window is closed, the stop button is clicked or JProfiler is exited,
the process will be killed if it is still alive.
The application server integration wizard uses start commands to make it easy to profile
application servers. should you want to take control of the launching of the application server
you can temporarily uncheck the "start command" checkbox while preserving the suitable
start command.
• Stop command
If you enable the "stop command" checkbox and enter the path to an executable in the text
field to the right, JProfiler will execute this command when disconnecting from the profiled
application, i.e. when the terminal window is closed, the stop button is clicked or JProfiler is
exited.
The application server integration wizard uses stop commands where possible.
• Open browser with URL
If you would like to open a browser window along with the session, please select this checkbox
and enter the URL in the adjacent text field. JProfiler polls this URL until it becomes available,
only then is the browser opened. Please set the browser start command [p. 120] if you're
working on a UNIX platform.
The [config synchronization options] button brings up the config synchronization options
dialog [p. 115] .
B.3.2.4 Launched Application Session
If the session type in the application settings [p. 77] is set to "Application", the following settings
are displayed in the middle part of the dialog:
• Java VM
Choose the Java VM to run your application. Java VMs are configured on the "Java VMs" tab
[p. 117] of JProfiler's general settings [p. 117] which are accessible by clicking the [General
settings] button on the bottom of the dialog.
• Working directory
Choose the directory in which your java process will be started either manually or by clicking
on the [...] button to bring up a file chooser. As long as you have not selected a particular
80
directory, this option is set to [startup directory] which means that JProfiler's startup
directory will also be your application's working directory.
• VM arguments
If your application needs virtual machine arguments of the form -Dproperty=value, you
can enter them here. Parameters that contain spaces must be surrounded with double quotes
(like "-Dparam=a parameter with spaces").
• Main class or executable JAR
Enter the fully qualified name of your main class or the path to an executable JAR file here. If
you enter a main class, it has to be contained in class path (see above).
Clicking on the [...] button brings up menu that lets you
• Search the classpath
If you have already configured your classpath, this option will search for classes with a main
method and present them in the main class selection dialog.
• Browse for an executable JAR file
This brings up a file chooser where you can select an executable JAR file. If the JAR file has
a Class-Path manifest entry, you will be asked whether the class path should be replaced
with the contents of that attribute. Also, the working directory will be set to the parent
directory of the executable JAR file after a confirmation.
• Browser for a .class file
This brings up a file chooser where you can select the *.class file of the desired main
class. A dialog box will ask you whether to add the associated class path root directory to
the class path.
• Arguments
This is the place to enter any arguments you want to supply to the main class of your
application. Arguments that contain spaces must be surrounded with double quotes (like "a
parameter with spaces").
• Open browser with URL
If you would like to open a browser window along with the session, please select this checkbox
and enter the URL in the adjacent text field. JProfiler polls this URL until it becomes available,
only then is the browser opened. Please set the browser start command [p. 120] if you're
working on a UNIX platform.
B.3.2.5 Launched Applet Session
If the session type in the application settings [p. 77] is set to "Applet", the following settings are
displayed in the middle part of the dialog:
• Java VM
Choose the Java VM to run your applet. The main class sun.applet.AppletViewer from
the tools.jar of the selected JVM will be used to show the applet. Java VMs are configured
on the "Java VMs" tab [p. 117] of JProfiler's general settings [p. 117] which are accessible by
clicking the [General settings] button on the bottom of the dialog.
• URL
Enter a URL pointing to an HTML page which contains the applet. By clicking on the [...] button
you can bring up a file chooser to select an HTML file on your file system.
81
Note: If the applet view is too restrictive for your applet, please use the Java plugin integration
wizard available on the New session tab of the start center [p. 62] to profile the applet directly
in the browser.
B.3.2.6 Launched Java Web Start Session
If the session type in the application settings [p. 77] is set to "Web Start", the following settings
are displayed in the middle part of the dialog:
• URL of the JNLP file
Every Web Start application is launched by means of a launch descriptor called a JNLP file.
Enter the URL of the JNLP file in the text field. By clicking on the [...] button you can bring up
a dialog which shows the JNLP URLs of all applications which have already been downloaded
by Java Web Start. Choose one in the list and press [OK] to transfer the URL to the text field.
• Java VM
Choose the Java VM to run Java Web Start and the profiled web start application.
Note: Java VMs are configured on the "Java VMs" tab [p. 117] of JProfiler's general settings [p. 117]
which are accessible by clicking the [General settings] button on the bottom of the dialog.
B.3.2.7 Code Editor & Compilation Settings
The choice of a JDK can be changed on a per session basis. By default, the JDK that you configure
in the general settings [p. 117] is used. You can select a different JDK on this tab that will only be
used for this session.
The selected JDK will be used for code completion in the script editor [p. 122] and scripts will be
compiled against this JDK. It is recommended that the JDK is compatible with the JRE of the
profiled application, otherwise you might accidentally use methods that are not available in the
profiled application.
When you profile a JVM with the JProfiler GUI, JProfiler compiles scripts on the fly according to
the auto-detected Java version in the profiled JVM.
For scripts in the session settings, such as the custom probe configuration [p. 105] , scripts are
compiled when you save the session. In that case, the version of the selected JDK configuration
is taken.
Here, a problem arises if the configured JDK has a different version than the actually profiled
JRE. Apart from selecting a wrong JDK for the session, this may also be the case in remote profiling,
when you do not have a suitable JDK at hand. Once you connect to the profiled JVM, the scripts
will be recompiled in the appropriate class file format. This recompilation is not necessary if you
adjust the target JRE version explicitly on this tab.
An accurate selection is critical for offline profiling, where no recompilation can be performed
in the case of a mismatch between the class file format of the pre-compiled script classes and
the version of the profiled JVM.
B.3.3 Filter Settings
B.3.3.1 Filter Settings
The filter settings section of the session settings dialog [p. 76] allows you to define the filters
that will be used for recording method calls. For background information on filters, please see
the help topic on method call recording filters [p. 25] .
82
One exception where the filters configured in this section will not be used is if the "Disable all
filters for sampling" setting is activated on the method call recording [p. 88] tab of the profiling
settings dialog [p. 87] .
The filter settings section is grouped into several tabs:
• Define filters [p. 83]
Define exclusive and inclusive filter rules for packages and classes.
• Exceptional methods [p. 85]
Configure methods whose slow invocations are shown separately in the call tree.
• Ignored methods [p. 86]
Displays methods with excessive instrumentation overhead that were removed by auto-tuning.
B.3.3.2 Define Filters For Method Recording
On this tab of the filter settings [p. 82] , you define filter rules for packages and classes that will
be applied to method call recording [p. 88] .
There are two types of filter rules:
•
Included packages or classes are profiled and will be shown in the call tree. If the first
filter is inclusive, no classes are profiled by default.
•
Excluded packages or classes are not profiled and will not be shown in the call tree. If the
first filter is exclusive, all other classes are profiled by default.
All calls from profiled classes are shown in the call tree regardless of whether the called class is
profiled or not. For example, if you only have one inclusive filter for the com.mycorp. packages,
and if your class com.mycorp.MyClass calls a method in java core classes, all those calls will
be measured, but their internal call structure will not be resolved. In the call tree view [p. 195] ,
such method calls are opaque and will be labeled with a red corner.
Package filters include all sub-packages. For example, if you have one inclusive filter with the
name com.mycorp., it includes all classes directly in the com.mycorp. package as well as the
com.mycorp.test and the com.mycorp.test.detail packages.
Filter rules are evaluated from top to bottom, the last matching rule is applied. For example, if
you add an exclusive filter for the com.mycorp. packages, but further down add an inclusive
filter for the com.mycorp.test package, the com.mycorp.test package is profiled while other
classes in the com.mycorp. packages are not.
When clicking on the [Add] button, you also get the option to select filters in a package browser.
The package browser shows packages for
• Classes from the configured class path
if the application is not running yet. Since the class path may not be configured for some
session types, the package tree may be empty.
• Loaded classes that can be instrumented
if the application is already running. This includes attach sessions where the profiling agent
is not waiting for a connection on startup.
Next to each package node, the cumulated number of contained classes is displayed. The total
number of classes that will be included or excluded through your selection is indicated at the
bottom of the dialog.
83
Adjacent filter rules of the same type can be grouped together. Just select all filters that you wish
to group and select the appropriate action from the context menu. You are then prompted to
name the group. The name of a filter group is only informational. The context menu also offers
an action to ungroup selected groups. Filter rules in filter groups are sorted alphabetically, have
a gray background and cannot be moved. However,they can be deleted from the filter group.
To add a new filter rule to an existing filter group, you first have to ungroup the group and group
it again.
By default, the filter rules are configured to exclude a list of common framework classes. All
other classes are included. Whenever you find that the default list is not suitable, or if you would
like to profile classes that are in that list, you should delete the entire exclude group and add
your own inclusive filters. Alternatively, you can delete parts of the default exclude group.
If, at any later point, you wish to restore these default exludes, you can use the
reset filters
to default button on the right side. All current filter settings will be lost in that case.
To analyze the overall filter configuration, you can click on [Show filter tree] and bring up a
dialog [p. 84] that shows you all filter rules in a read-only package hierarchy.
Filter configurations can be saved to filter templates [p. 84] with the save button, the
button lets you replace the current filter configuration with a filter template.
open
On the session defaults [p. 119] tab of the general settings dialog [p. 117] you can change the
default filter template used for new sessions.
You can quickly bring up this tab by clicking on the [Global filters] button that is shown in the
bottom right corner of views that show call trees or time measurements of method calls.
B.3.3.3 View Filter Tree
In this dialog, you can inspect the filters for method call recording [p. 88] in a package hierarchy.
This dialog can be shown by clicking [Show filter tree] on the Define Filters [p. 83] tab of the
filter settings [p. 82] .
The tree shows
• excluded packages
these packages or classes will not be profiled, they are only shown if they are called directly
from profiled classes.
• included packages
these packages will be profiled.
• bridge packages
these packages are only shown because there's a filter rule for a descendant package. If
the first node in the tree is an "all other packages" inclusive node, they will be profiled,
otherwise not.
If the first filter rule on the Define Filters [p. 83] tab is exclusive, an "all other packages" inclusive
node is added as the first node in the tree. If the first filter rule is inclusive, there is no automatic
addition to the package tree.
Please note that this is a read-only representation of the filter configuration. For defining filter
rules, please return to the Define Filters [p. 83] tab.
B.3.3.4 Filters Templates
Filter templates can be saved from the Define Filters [p. 83] tab of the filter settings [p. 82]
84
A filter template captures all configured filter rules from a session configuration. When saving
a filter template, you have to assign a unique name to it. The filter template dialog allows you
to reorder, rename and remove existing filter templates.
The filter template dialog can also be invoked from the session defaults [p. 119] tab of the general
settings dialog [p. 117] where you can change the default filter template used for new sessions.
B.3.3.5 Exceptional Methods
On this tab of the filter settings [p. 82] , you define methods whose exceptionally slow invocations
will be shown separately in the call tree view [p. 195] .
By default, JProfiler splits invocation events on the AWT thread in that way. If you click on on the
Reset button, the default entries will be restored.
Exceptional methods can be used to investigate outliers in the performance of selected
methods. Often, certain methods are supposed to complete quickly, but occasionally an invocation
will take much longer than the median time. In the call tree view, you cannot analyze those
outliers, since all calls are cumulated.
When you register a method for exceptional method recording, a few of the slowest invocations
will be retained separately in the call tree. The other invocations will be merged into a single
method node as usual. The number of separately retained invocations can be configured in the
profiling settings [p. 89] , by default it is set to 5.
When discriminating slow method invocations, a certain thread state can be used for the time
measurement. By default, the wall clock time (all thread states) is used, but a different thread
status can be configured in the profiling settings [p. 89] . Note that the thread status selection
in the CPU views [p. 193] is not used in this case, but the separate setting in the profiling settings
is used.
Exceptional method runs are displayed differently in the call tree view [p. 195] . For the concerned
method nodes, icons are changed and text is appended:
•
[exceptional run]
Such a node contains an exceptionally slow method run. By definition, it will have an invocation
count of one. If many other method runs are slower later on, this node may vanish and be
added to the "merged exceptional runs" node depending on the configured maximum number
of separately recorded method runs [p. 89] .
•
[merged exceptional runs]
Method invocations which do not qualify as exceptionally slow are merged into this node. For
any call stack, there can only be one such node per exceptional method.
•
[current exceptional run]
If an invocation was in progress while the call tree view was transmitted to the JProfiler GUI,
it was not yet known whether the invocation was exceptionally slow or not. The "current
exceptional run" shows the separately maintained tree for the current invocation. After the
invocation completes, it will either be maintained as a separate "exceptional run" node or be
merged into the "merged exceptional runs" node.
To check the statistical properties of the distribution of call times of certain methods of interest,
please start with the method statistics view [p. 209] . It can show you the outlier coefficient and
a graph of call times versus frequency. This analysis allows you to assess whether an outlier is
significant or not. From the method statistics view you can use the
Add As Exceptional
85
Method action in the context menu to add the method to the list of exceptional methods. The
same context action is available in the call tree view [p. 195] .
Apart from removing previously configured exceptional methods, you can also add exceptional
methods directly on this tab of the filter settings. The following ways for selecting methods are
available:
• Search in configured classpath
A class chooser will be shown that shows all classes in the classpath configured in the
application settings [p. 77] . Finally you have to select a method from the selected class.
• Search in other JAR or class files
First, you can select a JAR or class file. If the selection is a JRE file, you then have to select a
class in a class chooser. After the selection you will be asked whether to expand the classpath
with the current selection. For remote sessions, the classpath is often not configured, so this
is a shortcut to make your selection permanent. Finally, you can select a method from the
selected class.
• Search in profiled classes
If the session is being profiled, a class chooser is displayed that shows all classes in the profiled
JVM. There may be classes in the classpath that have not been loaded. Those classes will not
be shown in the class chooser. Finally, you can to select a method from the selected class.
• Enter manually (advanced)
This option displays a dialog that allows you to enter class name, method name and method
signature in JNI format. The JNI format of the method signature is explained in the javadoc of
com.jprofiler.api.agent.probe.InterceptionMethod.
The context menu for the list of methods offers the option to edit existing entries.
B.3.3.6 Ignored Methods
On this tab of the filter settings [p. 82] , you see methods an classes that should be completely
ignored by JProfiler. The two main use cases for this feature are call site mechanisms of dynamic
languages such as Groovy, and methods that have been identified as overhead hot spots and
that you have accepted into the list of ignored methods.
By default, JProfiler ignores the call site mechanism of Groovy. If you click on on the
button, the default entries will be restored.
Reset
If the method call recording type [p. 88] is set to Dynamic instrumentation, all methods of
profiled classes [p. 83] are instrumented. This creates some overhead which is significant for
methods that have very short execution times. If such methods are called very frequently, the
measured time of those method will be far to high. Also, due to the instrumentation, the hot
spot compiler might be prevented from optimizing them. In extreme cases, such methods become
the dominant hot spots although this is not true for an uninstrumented run. An example is the
method of an XML parser that reads the next character. This method returns very quickly, but
may be invoked millions of times in a short time span.
This problem is not present when the method call recording type [p. 88] is set to Sampling.
However, sampling does not provide invocations counts, shows only longer method calls and
several view such as the method statistics view [p. 209] and the call tracer [p. 211] do not work
when sampling is used.
To alleviate the problem with dynamic instrumentation, JProfiler has a mechanism called
auto-tuning. From time to time, the profiling agent checks for such methods and transmits them
to the JProfiler GUI. In the status bar, an entry such as 3 overhead hot spots will be shown.
You can click on that status bar entry to review the detected overhead hot spots and choose to
86
accept them into the list of ignored methods. These ignored methods will then not be
instrumented. When a session is terminated, the same dialog is shown.
All ignored methods will be missing in the call tree. Their execution time will be added to the
inherent time of the calling method. If you find later on, that some ignored methods are
indispensable in the profiling views, you can activate this tab in the filter settings and delete
those methods.
In case that you do not want to see messages about auto-tuning, you can disable it in the profiling
settings [p. 89] . Also, several parameters can be adjusted to broaden or narrow the scope of
the methods that are considered as overhead hot spots.
You can also add ignored methods directly on this tab of the filter settings. The following ways
for selecting methods are available:
• Search in configured classpath
A class chooser will be shown that shows all classes in the classpath configured in the
application settings [p. 77] . Finally you have to select a method from the selected class.
• Search in other JAR or class files
First, you can select a JAR or class file. If the selection is a JRE file, you then have to select a
class in a class chooser. After the selection you will be asked whether to expand the classpath
with the current selection. For remote sessions, the classpath is often not configured, so this
is a shortcut to make your selection permanent. Finally, you can select a method from the
selected class.
Alternatively, you can choose all methods from the selected class by selecting the "All methods"
radio button at the top of the dialog.
• Search in profiled classes
If the session is being profiled, a class chooser is displayed that shows all classes in the profiled
JVM. There may be classes in the classpath that have not been loaded. Those classes will not
be shown in the class chooser. Finally, you can to select a method from the selected class.
Alternatively, you can choose all methods from the selected class by selecting the "All methods"
radio button at the top of the dialog.
• Enter manually (advanced)
This option displays a dialog that allows you to enter class name, method name and method
signature in JNI format. The JNI format of the method signature is explained in the javadoc of
com.jprofiler.api.agent.probe.InterceptionMethod.
The context menu for the list of methods offers the option to edit existing entries.
To select all methods from a class, enter * for the method name and the empty string for the
signature.
B.3.4 Profiling Settings
B.3.4.1 Profiling Settings
In the profiling settings section of the session settings dialog [p. 76] you can adjust a number
of settings that impact profiling detail and overhead. Please see the detailed discussion in the
help topic on profiling settings [p. 20] to get a background understanding of the various available
settings.
The profiling settings section displays a list of pre-configured profiling settings templates that
are targeted at a variety of situations. As different templates in the drop down list are selected,
the description box and the performance indicators below it are updated accordingly. Both
87
description and performance indicators should help you choose the best template for your task
at hand. If you click on the [Customize profiling settings] button below the drop down list, the
profiling settings dialog is opened.
If you customize the profiling settings, the text in the drop down list changes to "[Customized]".
You can save new profiling settings templates with the [Save as template] button. The profiling
settings template dialog [p. 94] is then displayed.
On the session defaults [p. 119] tab of the general settings dialog [p. 117] you can change the
default profiling settings template used for new sessions.
The profiling settings dialog is grouped into several tabs:
• Method call recording [p. 88]
Configure method call recording options for the session. These settings affect CPU views and
memory views with allocation information.
• CPU profiling [p. 89]
Configure options regarding CPU profiling. These settings affect CPU views only.
• Probes [p. 90]
Configure recording options for probes.
• Memory profiling [p. 91]
Configure options regarding memory profiling. These settings affect all memory views.
• Thread profiling [p. 92]
Configure options regarding thread profiling. These settings affect all views in the thread
section.
• Miscellaneous [p. 92]
Configure miscellaneous options for profiling.
Other settings, which concern the presentation of profiling data are called view settings and
are accessible from the main toolbar
as well as from context sensitive menus in each view.
View settings are persistent as well and are saved automatically for each session.
B.3.4.2 Adjusting Method Call Recording Options
On this tab of the profiling settings dialog [p. 87] , you can adjust all options related to method
call recording. These settings influence the detail level of CPU profiling data and the profiling
overhead.
The following options are available:
• Enable method call recording
When you record CPU data or allocations, JProfiler collects information about the call tree.
You might want to record allocations without the overhead of recording the allocation call
stacks: If you don't need the allocation view [p. 166] in the heap walker, the allocation call tree
[p. 145] and the stack trace information in the monitor usage views [p. 228] , you can switch off
method call recording. This will speed up profiling considerably and reduce memory usage.
• Method call recording type
Select the method call recording type for CPU profiling as one of
88
• Dynamic instrumentation
When dynamic instrumentation is enabled, JProfiler modifies filtered classes on the fly as
they are loaded by the JVM to include profiling hooks. Accuracy of non-timing related
stack information (like allocation information) is high, invocation counts are available
and Java EE payloads can be annotated in the call tree, but calls from Java core classes are
not resolved. The overhead and timing accuracy varies depending on what classes are
instrumented.
Java core classes (java.*) cannot be profiled this way and are filtered automatically.
• Sampling
When sampling is enabled, JProfiler inspects the call stacks of all threads periodically.
Sampling has extremely low overhead even without any filters. Accuracy of non-timing
related stack information (like allocation information) is low and invocation counts are not
available. Only methods that take longer than the sampling period or methods called
frequently are captured by sampling.
Sampling is ideally suited for use without any method call filters. To temporarily switch off
all filters, you can use the Disable all filters for sampling setting instead of
deleting all filters in your configuration. In that way you can create a profiling settings
template that ignores your filter configuration and alternate between using filters and using
no filters at all.
If sampling is enabled, the sampling frequency can be adjusted. The default value is 5 ms.
A lower sampling frequency incurs a slightly higher CPU overhead when profiling.
Note: allocations will be reported according to the call traces recorded by the sampling
procedure. This may lead to incorrect allocation spots.
• Request tracking
Request tracking [p. 214] can be started and stopped for selected tracking types in the JProfiler
GUI without changing the profiling settings. The Enable request tracking setting on this
tab allows you to completely disable request tracking for a session which will result in less
instrumentation in the profiled JVM.
• Line numbers
By default, JProfiler does not resolve line numbers in call trees. If you enable show line
numbers for sampling and dynamic instrumentation, line numbers will be recorded
and shown.
If the aggregation level is set to "methods" and a method calls another method multiple times
in different lines of code, line number resolution will show these invocations as separate
method nodes in the call tree [p. 195] and the allocation call tree [p. 145] . Backtraces in the hot
spots views will also show line numbers.
Note that a line number can only be shown if the call to a method originates in an unfiltered
class.
B.3.4.3 Adjusting CPU Profiling Options
On this tab of the profiling settings dialog [p. 87] , you can adjust all options related to CPU
profiling. These settings influence the detail level of CPU profiling data and the profiling overhead.
They only apply to the views in the CPU view section [p. 193] .
The following options are available:
89
• Auto-tuning settings
Here, you can disable auto-tuning [p. 86] . Furthermore you can configure the criteria for
determining an overhead hot spot. A method is considered an overhead hot spot if both of
the following conditions are met:
• the total time of all its invocations exceeds a threshold in per mille of the entire total time
in the thread
• its average time is lower than an absolute threshold in microseconds
• Time settings
Select whether you want times shown in the CPU view section [p. 193] to be measured in
• elapsed time
With elapsed time selected, the clock time difference between method entry and method
exit will be shown. Note that if the thread state selector [p. 193] is set to its standard setting
(Runnable). Waiting, blocking and Net IO thread states are not included in the displayed
times.
• estimated CPU time
With estimated CPU time selected, the CPU time used between method entry and method
exit will be shown. On Windows and Mac OS the system supplies CPU times with a 10 ms
resolution which are used to calculate the estimated CPU times. On Linux and Solaris the
VM does not supply a CPU time and the estimated CPU times are roughly estimated by
looking at the number of runnable threads.
• Settings for exceptional method run recording
Exceptional method run recording [p. 85] has the following configurable parameters:
• Maximum number of separately recorded method runs
The maximum number of the slowest invocations that are shown separately in the call tree
view [p. 195] . Increasing this value can increase memory overhead and visual clutter in the
call tree.
• Time type for determining exceptional method runs
The time measurement that is used for finding the slowest method invocations. Note that
this setting is not linked to the thread state selector in the CPU views [p. 193] .
B.3.4.4 Probes & JEE
On this tab of the profiling settings dialog [p. 87] , you can edit advanced options regarding Java
EE and probes.
The following options are available:
• Maximum recorded number of payloads per call stack
Probes [p. 102] can publish information into the call tree [p. 195] . For each call stack and payload
type, JProfiler keeps track of the invocation count and total execution times for each thread
status. To avoid excessive memory consumption, there is a cap on the number of different
retained payload names. If the maximum number is exceeded, the oldest payload is merged
into an "[earlier calls]" node. By default, this maximum value is set to 50. If you require more
detail, you can increase the value in the text field as needed.
90
• Record exact payload call stacks in sampling mode
If sampling is enabled, JProfiler still records the exact call stack of payloads in order to generate
useful back traces in the probe hot spots views [p. 241] . If you are not interested in these back
traces, you can deselect this option in order to reduce overhead.
• Maximum number of recorded events
Probes [p. 102] can record single events and show them in the probe events view [p. 243] . To
avoid excessive memory consumption, there is a cap on the maximum number of retained
events. If the maximum number is exceeded, the oldest events are discarded. By default, this
maximum value is set to 5000 per thread. If you require more history, you can increase the
value in the text field as needed.
• Detect Java EE components
JProfiler can detect the following Java EE component types:
servlets
JSPs
EJBs
The corresponding methods have a separate icon in the call tree. For JSPs, the name of the
JSP source file is displayed instead of the generated class and for EJBs the name of the interface
is displayed instead of the generated stub or proxy classes. In the "method" and the "class"
aggregation levels, the real class names are displayed in square brackets, too.
Based on this component information, JProfiler offers the Java EE components aggregation
level in all views with an aggregation level selector. If you would like to disable Java EE
component detection, you can deselect the checkbox labeled Detect Java EE components.
• Show request URLs without a recorded call stack
The servlet probe splits the call tree for each recorded request URL. Request URLs that do not
have an associated call stack are not shown by default. To display these request URLs at the
top level of the call tree you can select this option.
B.3.4.5 Memory Profiling Options
On this tab of the profiling settings dialog [p. 87] , you can adjust all options related to memory
profiling. These settings influence the detail level of memory profiling data and the profiling
overhead.
The following options are available:
• Recording type
The information depth of the allocation call tree [p. 145] and the allocation hot spots view [p.
150] is governed by this setting.
• Live objects
By default, only live objects can be displayed by the allocation views. Class-resolution is
enabled.
• Live and GCed objects without class resolution
Live and garbage collected objects can be displayed by the allocation views, depending on
the selection in the allocation options dialog [p. 157] . Class-resolution is disabled, i.e. class
selection [p. 157] in the allocation options dialog [p. 157] will not work in this setting, only
the cumulated allocations of all classes and array types can be displayed. This setting
91
consumes more memory than the first setting and adds a considerable performance
overhead.
• Live and GCed objects
Live and garbage collected objects can be displayed by the allocation views, depending on
the selection in the allocation options dialog [p. 157] . Class-resolution is enabled. This setting
consumes more memory than the other settings and adds adds a considerable performance
overhead.
• Allocation times
Select the Record object allocation time check box if you would like to be able to
• use the time view in the heap walker [p. 181]
• see allocation times in the references view [p. 171] of the heap walker and sort by those
times.
This setting leads to an increased memory consumption when recording objects.
B.3.4.6 Thread Profiling Options
On this tab of the profiling settings dialog [p. 87] , you can adjust all options related to thread
profiling. These settings influence the detail level of thread profiling data and the profiling
overhead.
The following options are available:
• Monitors
if you are not interested in monitor contention events, you can switch data collection off by
deselecting the Enable monitor recording check box. This lowers the memory consumption
of the profiled application. If monitor contention views are enabled, the following settings
govern the level of detail for the monitor contention views:
• Record java.util.concurrent events
JProfiler can insert itself into the locking facility in the java.util.concurrent package which
does not use monitors of objects but a different natively implemented mechanism. If you
do not wish to see this information, you can deselect this check box.
• Thread filter
By default, JProfiler does not show system threads where no user code can ever run. If you
would like to see all threads, please select the Show system threads check box.
B.3.4.7 Miscellaneous Options
On this tab of the profiling settings dialog [p. 87] , you can adjust uncategorized options for
profiling.
The following options are available:
• VM life cycle control
If you select the Keep VM alive check box, JProfiler keeps the VM alive until the JProfiler GUI
disconnects. This option allows you to profile code sections which are close to a forced
termination of the virtual machine.
92
Note: with the classic VM (e.g. IBM JVMs), this option installs a security manager which intercepts
your application's calls to System.exit() and executes them after JProfiler's GUI front end
disconnects. This can be a problem when you profile an application server which installs its
own security manager. If you use a classic VM and get security related exceptions when profiling
your applications, try unchecking this option.
• Dynamic views
Many views in JProfiler update their data automatically. There are several options for configuring
the update behavior of those dynamic views:
• Transmission periods
Based on the varying degree of computing expenses required for the different views, the
transmission periods for the dynamic views have been split into two separate settings:
• CPU views
This setting influences the update interval of the dynamic views in the CPU view section
[p. 193] .
• Tables and graphs
This setting influences the update interval of the
• all objects view [p. 140]
• recorded objects view [p. 142]
• dynamic views in the thread section [p. 217]
• VM telemetry view section [p. 231]
Note: The update frequency of the all objects view [p. 140] is adjusted automatically
according to the total number of objects on the heap.
To update any dynamic view in between two regular updates, you can click on the
icon in the status bar.
refresh
• Console Settings
JProfiler displays a console for locally launched programs. This includes application sessions,
applets, web start applications and remote sessions with a configured start command.
JProfiler offers two types of consoles:
• Java Console
This is a cross-platform console, that supports text input, sending CTRL-C to the profiled
application, text selection and clipboard operations. For the Java console you can set the
following options:
• Buffer size
The number of most recent lines of output that are held by the console. Default is 1000.
• Window size
The initial size (width x height) of the console in characters. Note that the console does
not wrap text. Default is 80 x 25.
This console integrates with JProfiler's Window menu.
93
• Native Console
On Microsoft Windows, you also have the option to use the native console. This console
does not integrate with JProfiler's Window menu.
• Profiling agent debug parameters
Here you can enter debugging parameters [p. 111] that can be passed to the profiling agent
on the command line. This text box is not visible for remote sessions, since you have to add
those parameters to the start script yourself in that case.
B.3.4.8 Profiling Settings Template Dialog
Profiling settings templates can be saved on the profiling settings [p. 87] section of the session
settings dialog [p. 76] .
A profiling template contains all profiling settings that can be configured in the profiling settings
dialog. When saving a profiling settings template, you have to assign a unique name to it. The
profiling settings template dialog allows you to reorder, rename and remove existing profiling
settings templates.
The profiling setting template dialog can also be invoked from the session defaults [p. 119] tab
of the general settings dialog [p. 117] where you can change the default profiling settings template
used for new sessions.
B.3.5 Trigger Settings
B.3.5.1 Trigger Settings
In the trigger settings section of the session settings dialog [p. 76] you can configure triggers
that allow you to respond to certain events in the JVM with a list of actions. For further background
information, please see the help topic on triggers and offline profiling [p. 29] .
The trigger settings section is grouped into several tabs:
• Triggers
Here, you define the list of triggers for your session. By default, no triggers are defined. To
add new triggers, click on the
add button to display the trigger wizard [p. 95] . The trigger
wizard is also used to
edit existing triggers.
Some triggers are only required occasionally, especially when the set of actions incurs a
considerable overhead, such as saving snapshots. JProfiler allows you to
disable and
enable triggers so you do not lose their configuration for the next time you need them. The
corresponding actions are also available from the context menu.
Note that you can select multiple triggers to quickly disable, enable or delete many triggers.
Trigger configurations can be saved to trigger sets [p. 101] with the
save button, with the
open button you can add a trigger set to the current list of triggers.
On the session defaults [p. 119] tab of the general settings dialog [p. 117] you can change the
default trigger set used for new sessions. By default, no triggers are added to a new session.
• Output options
The following actions print information when they are executed:
• Print message
• Print method invocation
94
On this tab you define where this output should be printed. The available options are:
• Print to stdout
• Print to stderr
• Print to file
For this option you have to enter a file name. The file will be saved relative to the working
directory of the profiled JVM on the machine where the profiled JVM is running.
B.3.5.2 Trigger Wizard
The trigger wizard is shown when you add a new trigger or when you edit an existing trigger in
the trigger section [p. 94] of the session settings [p. 76] .
The trigger wizard is also shown, when adding or editing triggers in the trigger settings [p. 94]
or when adding a trigger from a view that displays single methods [p. 102] .
The first step of the trigger wizard lets you choose the event type from the list of available trigger
event types [p. 95] .
The following steps in the wizard depend on this selection. Note that you can click with the mouse
on the index to quickly jump to a different step. This is especially useful when editing triggers.
After the event-specific steps in the wizard, you can configure the actions that should take place
when the trigger event occurs. JProfiler offers a fixed set of available actions [p. 98] . The actions
are configured directly in the list, the options associated with an action are shown when the
action is selected.
Actions are executed when the event occurs. For events that have a duration, such as the method
invocation event or the threshold events, you can use the "Wait for the event to finish" action
to separate actions that should be executed when the events starts from actions that should be
executed when the event finishes.
In the list of configured triggers [p. 94] , each trigger is represented by the trigger type and a
short summary of its most important parameters. If you have multiple triggers of the same type,
this might not be distinctive enough. On the "Description" step, you can configure a name that
is displayed in the list of triggers instead of the parameter summary.
You can enable and disable groups of triggers [p. 102] in a live session. To group triggers for this
feature, the "Group ID" step allows you to optionally assign a group ID to each trigger.
B.3.5.3 Trigger Event Types
The following trigger types are available in the trigger wizard [p. 95] for configuring triggers [p.
94] :
• Method invocation
Symbol:
This event occurs when a method is called. Several methods can be configured for the same
action sequence. Besides the standard actions, there are several special actions for this trigger
type.
The second step of the trigger wizard will then be the "Specify methods" step. Here you can
edit the list of methods for which this trigger will be activated. There are several ways to enter
new methods:
95
• Search in configured classpath
A class chooser will be shown that shows all classes in the classpath configured in the
application settings [p. 77] . Finally you have to select a method from the selected class.
• Search in other JAR or class files
First, you can select a JAR or class file. If the selection is a JRE file, you then have to select a
class in a class chooser. After the selection you will be asked whether to expand the classpath
with the current selection. For remote sessions, the classpath is often not configured, so
this is a shortcut to make your selection permanent. Finally, you can select a method from
the selected class.
• Search in profiled classes
If the session is being profiled, a class chooser is displayed that shows all classes in the
profiled JVM. There may be classes in the classpath that have not been loaded. Those classes
will not be shown in the class chooser. Finally, you can to select a method from the selected
class.
• Enter manually (advanced)
This option displays a dialog that allows you to enter class name, method name and method
signature in JNI format. The JNI format of the method signature is explained in the javadoc
of com.jprofiler.api.agent.probe.InterceptionMethod.
The context menu for the list of methods offers the option to edit existing entries.
In addition, all views with call trees [p. 102] offer the possibility to select methods for a method
trigger in the context menu.
By default, the method trigger event is not fired for recursive calls. This means that if a method
M is being called and later on in the call stack method M is called again, the event is only fired
for the first invocation of method M. If you deselect the check box Ignore recursive calls,
the event will be fired for all invocations of a method.
• Heap usage threshold
Symbol:
Requirements: Java 1.4+
This event occurs when the heap usage exceeds a certain threshold in percent of the maximum
heap size for a minimum period of time.
The second step of the trigger wizard will then be the "Threshold" step. Here you can configure
the
• Threshold
The trigger will be activated each time when the used heap size exceed the configured
percentage of the maximum heap size.
• Activation time
To avoid spurious trigger events, the activation time sets a minimum amount of time during
which the threshold must be exceeded. Only after the activation time has passed will the
trigger be activated.
• Deactivation time
Similar to the activation time, the trigger will only be deactivated after heap usage falls
below the threshold for a minimum amount of time. By default, the deactivation time is
the same as the activation time, however, you can configure a different time for it. Activation
and deactivation times determine the sensitivity of the trigger to the threshold value.
96
• Inhibition time
To avoid that too many trigger events are fired, you can set an inhibition time. After the
trigger has been deactivated, the trigger will not be activated again for the duration of the
inhibition time.
• CPU load threshold
Symbol:
Requirements: Java 1.5+
This event occurs when the CPU load exceeds a certain threshold in percent for a minimum
period of time.
The second step of the trigger wizard will then be the "Threshold" step which is explained
above for the "Heap usage threshold" trigger with the only difference that the threshold value
is the CPU load in percent.
• Out of memory exception
Symbol:
Requirements: Java 1.6+
This event occurs when an OutOfMemoryException is thrown. You can only save an HPROF
snapshot in this case since the trigger works by adding -XX:+HeapDumpOnOutOfMemoryError
to the VM options. Also, this trigger only works with a Java 6+ JVM. For 1.5.0_07+ and 1.4.2_12+,
this VM option is also supported, however, it cannot be added by the profiling agent, so you
have to add it manually to the VM options of the profiled application.
• Timer
Symbol:
With a timer trigger, you can periodically execute a certain set of actions, such as saving a
snapshot.
The second step of the trigger wizard will then be the "Timer" step where you can configure
the following properties of the timer:
• Timer type
A timer can either periodically either and unlimited number of times of a limited number
of times.
• Interval
The interval defines the period of time between two subsequent timer invocations.
• Offset
With the offset, you can specify how much time should pass between the start of the JVM
and the first invocation of the timer.
• JVM startup
Symbol:
With a JVM startup trigger, you can execute a certain set of actions right after the JVM is started
for profiling. The actual execution is performed right after the trigger subsystem has been
initialized in the profiling agent.
97
• JVM exit
Symbol:
With a JVM exit trigger, you can execute a certain set of actions right before the JVM is shut
down. This is implemented with a standard shutdown hook, so code in other shutdown hooks
may be executed after the associated actions.
B.3.5.4 Trigger Action Types
The following trigger action types are available in the trigger wizard [p. 95] for configuring triggers
[p. 94] :
• Start recording
Symbol:
Starts recording any of
• CPU data [p. 193]
With the "Reset" check box, you can choose whether the previously recorded CPU data
should be cleared or not.
• Allocation data [p. 139]
With the "Reset" check box, you can choose whether the previously recorded allocation
data should be cleared or not.
• Thread data [p. 217]
• VM telemetry data [p. 231]
• Method statistics [p. 209]
With the "Reset" check boxes for CPU data and allocation data, you can choose whether the
previously recorded data should be cleared or not.
• Stop recording
Symbol:
Stops recording any of
• CPU data [p. 193]
• Allocation data [p. 139]
• Thread data [p. 217]
• VM telemetry data [p. 231]
• Method statistics [p. 209]
• Start monitor recording
Symbol:
Starts recording monitor data. The monitor views [p. 223] that show historical data receive
new data when this action is executed. Please note that monitor recording adds a memory
overhead that grows linearly in time. You should execute the "stop monitor recording" action
at some point.
In the configuration, you can define blocking and waiting thresholds for monitor recording.
These settings are the same as those in the monitor history view settings dialog [p. 229] .
98
• Stop monitor recording
Symbol:
Stops recording monitor data.
• Start call tracer
Symbol:
Starts recording call traces. The call tracer view [p. 211] will receive new data once the "stop
call tracer" action is executed. Please note that call traces use a lot of memory. You should
execute the "stop call tracer" action after a short time.
In the configuration, you can define a cap on the number of recorded call traces and determine
if calls into filtered classes should be traced as well. These settings are the same as those in
the call tracer view settings dialog [p. 212] .
In addition, you can specify if previously recorded call traces should be reset or not. If you do
not clear previously recorded call traces, you can build up call traces over several trigger
events.
• Stop call tracer
Symbol:
Stops recording call traces. The call tracer view [p. 211] will be updated with the recorded data
as soon as this action is executed.
• Trigger heap dump
Symbol:
With this action you can trigger a heap dump as in the heap walker [p. 159] . Accordingly, you
can select whether to
• Select recorded objects only
Note that if you select this option and have not recorded any allocations, the heap walker
will show the empty object set.
• Remove unreferenced and weakly referenced objects
This is effectively like a full GC before taking the snapshots, just that the GC is performed
in the internal data structures of the profiling agent.
• Calculate retained sizes
To reduce the memory overhead and the time for heap snapshot processing you can
deselect this option. Retained sizes can only be calculated if the "Remove unreferenced
and weakly referenced objects" option is selected.
• Record primitive data
This has no effect with Java 1.5 where primitive data cannot be recorded.
• Trigger thread dump
Symbol:
With this action you can trigger a thread dump as in the thread dumps view [p. 222] . Please
note that frequently taking thread dumps will cause a linear growth in memory overhead.
• Start probe recording
Symbol:
99
With this action you can start probe recording [p. 233] for a single selected built-in probe.
Probes that do not have the "record at startup" option selected in the session settings can be
started this way
• Stop probe recording
Symbol:
With this action you can stop probe recording [p. 233] for a single selected built-in probe. If
probe recording should only be done for a specific use case, you can use this action to switch
off recording.
• Start probe tracking
Symbol:
With this action you can start probe tracking [p. 244] for a single selected built-in probe and
one or more control objects or hot spots.
• Stop probe tracking
Symbol:
With this action you can stop probe tracking [p. 244] for a single selected built-in probe and
one or more control objects or hot spots. This only has an effect if you have executed the Start
probe tracking" action first.
• Save snapshot
Symbol:
With this action you can save a JProfiler snapshot [p. 113] of all profiling data to disk.
In addition to the name of the snapshot file you can specify whether a number should be
appended to the file name to prevent old snapshot files from being overwritten. Note that
the path is relative to the working directory of the profiled JVM and that the snapshot is saved
on the remote machine if you profile remotely.
• Create an HPROF heap dump
Symbol:
Requirements: Java 1.6+
With this action you can save an HPROF heap snapshot [p. 113] of all profiling data to disk. For
the "Out of memory exception" [p. 95] event type, this is the only supported action.
In addition to the name of the snapshot file you can specify whether a number should be
appended to the file name to prevent old snapshot files from being overwritten. Note that
the path is relative to the working directory of the profiled JVM and that the snapshot is saved
on the remote machine if you profile remotely.
HPROF heap dumps also offer the option to only save referenced objects.
• Wait for the event to finish
Symbol:
For event types [p. 95] that have a duration, such as the method invocation event or the
threshold events, you can use this action to execute some actions not at the start of the event
but rather after the event is finished.
• Override thread status for current method
Symbol:
100
This action is only available for the method invocation [p. 95] event type and allows you to
change the thread status [p. 218] for the duration of the methods that are associated the the
trigger. The thread status is configurable.
• Print method invocation
Symbol:
This action is only available for the method invocation [p. 95] event type and allows you print
details about the current method invocation including parameters and return value to the
output stream configured in the trigger output options [p. 94] .
• Invoke interceptor
Symbol:
This action is only available for the method invocation [p. 95] event type and allows you to
invoke an interceptor when the methods associated the the trigger are invoked. Interceptors
can be developed with the JProfiler API and can also be added with VM parameters. Please
see the api directory for documentation and samples. The advantage of adding the interceptor
with a trigger is that you do not have to specify the methods and signatures in the interceptor
class.
You can enter the interceptor class manually or use the [...] button to scan the class path
configured in the application settings [p. 77]
for all classes extending
com.jprofiler.api.agent.interceptor.Interceptor.
• Add bookmark
Symbol:
With this action you can add a boookmark [p. 134] to the time-resolved views. You have to
enter a description for the bookmark.
• Sleep
Symbol:
With this action, you can sleep a specified amount of time until the next action in the list is
executed. Please note that this does not block the current thread in the JVM. For example,
you can use this action to start CPU recording, record 10 minutes, stop CPU recording and
save a snapshot.
• Print message
Symbol:
With his action you can print an arbitrary message to the output stream configured in the
trigger output options [p. 94] .
B.3.5.5 Trigger Sets
Trigger sets can be saved on the trigger settings [p. 94] section of the session settings dialog [p.
76] .
A trigger set contains all triggers that are currently defined for the session being edited. When
saving a trigger set, you have to assign a unique name to it. The trigger set dialog allows you to
reorder, rename and remove existing trigger sets.
The trigger set dialog can also be invoked from the session defaults [p. 119] tab of the general
settings dialog [p. 117] where you can change the default trigger set that is added to new sessions.
101
B.3.5.6 Method Selection For Triggers
Several views in JProfiler display call trees and back traces, such as the call tree [p. 195] , the hot
spots view [p. 200] , the allocation call tree [p. 145] and the allocation hot spots view [p. 150] .
In all these views, the context menu shows an
add method trigger action if the currently
selected node is a method. That action displays this dialog where you can choose whether to
add the method interception to an existing method trigger or whether to create a new method
trigger.
If you select "Add to existing method trigger", the list below which displays all existing method
triggers is enabled and you have to choose one of them. The select method is added to the
selected trigger and the trigger wizard [p. 95] is opened at the "Actions" step, so you can review
or modify the existing list of actions.
If you select "Create new method trigger", a new method trigger is created and the trigger wizard
[p. 95] is shown at the action step.
B.3.5.7 Enabling And Disabling Triggers
By default, triggers are active when the JVM is started for profiling. There are two ways to disable
triggers at startup:
• disable individually on startup
In the trigger configuration [p. 94] you can select single triggers and disable them. Those
triggers will be shown in gray.
• disable all on startup
In the session startup dialog [p. 107] there is a check box Enable triggers on startup.
If you deselect this check box, all triggers will be disabled when the JVM is started for profiling.
During a live session, you can enable or disable all triggers by choosing
Profiling->(Enable|Disable) Triggers from JProfiler's main menu. Bookmarks [p. 134]
will be added when triggers are enabled or disabled manually.
The trigger recording state is shown in the status bar with a
flag icon which is shown in gray
when triggers are not enabled. Clicking on the flag icon will toggle trigger recording.
Sometimes, you need to toggle trigger recording for groups of triggers at the same time. This
is possible by assigning the same group ID [p. 95] to the triggers of interest and invoking
Profiling->Enable Triggers Groups from JProfiler's main menu.
A dialog will be shown where you can select one or more group IDs. Furthermore, there are radio
buttons to control whether the selected trigger groups should be enabled or disabled.
Enabling or disabling trigger groups overrides the global trigger recording status as well as the
initial disabling of individual triggers.
B.3.6 Probe Settings
B.3.6.1 Probe Settings
The configuration of probes [p. 50] is divided into three parts:
• Databases [p. 103]
These are the database probes that are provided by JProfiler.
102
• Built-in probes [p. 104]
These are the probes that are provided by JProfiler, except for the database probes. The
configuration tab is on the "JEE & probes" section of the session settings dialog.
• Custom probes [p. 105]
These are probes that you define yourself directly in the JProfiler GUI. The configuration tab
is on the "JEE & probes" section of the session settings dialog.
Changing the configuration of probes requires that the new profiling settings are applied to the
profiled JVM. All previous recorded data will be cleared in that case.
B.3.6.2 Databases
All built-in database probes are described on the help page of the databases section [p. 233] .
Here, only configuration aspects of those probes are discussed. For general information on the
concepts behind probes, see the corresponding help topic [p. 50] .
Click on a probe to display the configuration panel. The following common configuration options
are available for each probe:
• Enabled or disabled
If a probe is disabled, the bytecode instrumentation required by that particular probe will not
be performed. Disabling a probe may be useful for trouble-shooting or minimization of
overhead. Note that the overhead of a probe that is enabled but not recording is very small.
• Record single events
Data in the probe events view [p. 243] is only available if this option is selected. Recording
single events may add noticeable overhead depending on the activities of the profiled
application. Other probe views are not affected by this setting.
• Annotate into call tree
Select this option, if you would like to see payload data from the probe hot spots view [p. 241]
in the call tree view [p. 195] . In this way, you get additional information in-place when analyzing
performance problems in the call tree view. You can deselect this option in order to minimize
overhead.
The following built-in probes have particular configuration options:
• JDBC
If required, you can choose to resolve parameters of prepared statements. By default, those
parameters are shown as question marks in the hot spots view [p. 241] and the event view [p.
243] . Resolving these parameters makes the hot spots view more cluttered, but can be useful
for debugging purposes.
• JPA/Hibernate
The JPA/Hibernate probe supports a number of providers, like Hibernate 3.x, Hibernate 4.x,
openJPA 2.1+ and eclipselink 2.3+. You can deselect providers in the probe configuration.
• MongoDB
By default, the MongoDB probe removes primitive data from JSON objects that are used in
queries and replaces them with question marks in the hot spots view [p. 241] and the event
view [p. 243] . This is necessary to be able to group similar queries and reduce memory
consumption. If required, you can choose to keep primitive data in the events view.
103
B.3.6.3 Built-in Probes
All built-in probes are described on the help page of the probes section [p. 233] . Here, only
configuration aspects of built-in probes are discussed. For general information on the concepts
behind probes, see the corresponding help topic [p. 50] .
Click on a probe to display the configuration panel. The following common configuration options
are available for each probe:
• Enabled or disabled
If a probe is disabled, the bytecode instrumentation required by that particular probe will not
be performed. Disabling a probe may be useful for trouble-shooting or minimization of
overhead. Note that the overhead of a probe that is enabled but not recording is very small.
• Record single events
Data in the probe events view [p. 243] is only available if this option is selected. Recording
single events may add noticeable overhead depending on the activities of the profiled
application. Other probe views are not affected by this setting.
This option is not available for the "Class Loaders" probe, where single events are always
recorded.
• Annotate into call tree
Select this option, if you would like to see payload data from the probe hot spots view [p. 241]
in the call tree view [p. 195] . In this way, you get additional information in-place when analyzing
performance problems in the call tree view. You can deselect this option in order to minimize
overhead.
This option is not available for the "Servlets" and "Class Loaders" probe.
The following built-in probes have particular configuration options:
• Servlets
The servlet probe splits the call tree for different URL invocations, so you can analyze different
requests separately. What constitutes a "different" request is governed by the "URL splitting"
setting of the servlet probe. By default, only the request path is retained, and all parameters
are discarded.
In reality, there may be certain request parameters that should be retained for URL splitting,
such as parameters that do not identify user input, but determine the type of the request.
For example, you may have a dispatcher servlet and a parameter "controller" that determines
the type of the request. In that case, you would probably like to retain the parameter
"controller". In the text field after the "Retain request parameters" radio button, a
comma-separated list of such parameters can be specified.
However, the structure of the URLs may be more complex than that. Maybe you want to
discard parts of the request path or conditionally retain request parameters. In that case, you
can use the "Resolve with script" option and define a script [p. 122] that returns the string
defining the URL displayed by JProfiler. The script is passed two parameters: uri for the
request path and queryString for the query parameters. Just returning uri would correspond
to the default "Request path only" setting.
For debugging purposes it may be useful to show the full URL in the events view regardless
of how the URL splitting is considered. Check the "Show full URLs in events" in this case.
104
• JMS
Since messages are custom objects, JProfiler does not know how to optimally display messages
in the hot spots and event views. By default, a message is only identified via the toString()
value of the destination returned by javax.jms.Message#getJMSDestination().
With the "message resolver script" you can display customized information on your messages.
The script [p. 122] receives a parameter "message" which is of type java.lang.Object. This
is because the JMS classes may not be available in the profiled JVM, so the JMS probe cannot
depend on them. You can cast the message to a subtype of javax.jms.Message, extract the
relevant information and return a string that will be displayed in the JProfiler GUI. That string
is the basis for the hot spots calculation in the hot spots view [p. 241] .
• RMI
RMI has two sides, the client side and the server side. You can separately enable recording of
client and server calls if you are only interested in one category.
For server calls, the call tree is split similar to the servlet probe. There are two splitting modes,
one that groups all calls from each IP address, and another that also splits for each port. The
latter option is useful if you have multiple clients on a single remote machine and you want
to separately see those calls in the call tree.
B.3.6.4 Custom Probes
For more information on custom probes, please see the corresponding help topic [p. 55] . Here,
only the configuration of custom probes in the JProfiler GUI is discussed.
If you add or edit a custom probe, the custom probe wizard is displayed. In several steps,
it leads you through the creation of a custom probe. You can directly jump to another step of
the wizard by clicking on the step in the index. The wizard is partitioned into the following steps:
• Name and description
Here, you provide a name and a description for the probe. The name is used in the call to
ProbeMetaData#create(String)
and
the
description
is
set
with
ProbeMetaData#description(String). This could be set in the meta data script in the
next step, but since JProfiler needs to display this information in the custom probe
configuration, it is entered separately outside the script and applied to the ProbeMetaData
object before it is passed to the meta data script.
• Meta data
The meta data of the probe is configured with a single script. The script [p. 122] is passed a
single parameter metaData of type ProbeMetaData and does not return anything. New
probes contain a non-functional example script that gives you a starting point for your own
configuration.
• Telemetry script
If the probe publishes telemetries, a telemetry script is called once a second and gives you
the chance to publish telemetry data. The script is passed a ProbeContext and an int-array
with the data to be filled. To retrieve data that was collected during interceptions, you have
to use the map returned by probeContext.getMap(). The n-th index in the int-array
corresponds to the n-th telemetry that was defined in the meta-data script.
• Method groups
The interception scripts later on operate on several methods of the same signature. If you
have to deal with methods of different signatures (which is common for more complex probes),
you have to define different method groups. Each method group can only contain methods
105
with the same signature. In subsequent steps, the method group can be selected from a
drop-down list in order to configure different method groups.
• Specify methods
If you want to intercept method to collect data (which most probes do), you can add those
methods in this step. Remember that all methods in a single method group must have the
same signature. There are several ways to enter new methods:
• Search in configured classpath
A class chooser will be shown that shows all classes in the classpath configured in the
application settings [p. 77] . Finally you have to select a method from the selected class.
• Search in other JAR or class files
First, you can select a JAR or class file. If the selection is a JRE file, you then have to select a
class in a class chooser. After the selection you will be asked whether to expand the classpath
with the current selection. For remote sessions, the classpath is often not configured, so
this is a shortcut to make your selection permanent. Finally, you can select a method from
the selected class.
• Search in profiled classes
If the session is being profiled, a class chooser is displayed that shows all classes in the
profiled JVM. There may be classes in the classpath that have not been loaded. Those classes
will not be shown in the class chooser. Finally, you can to select a method from the selected
class.
• Enter manually (advanced)
This option displays a dialog that allows you to enter class name, method name and method
signature in JNI format. The JNI format of the method signature is explained in the javadoc
of com.jprofiler.api.agent.probe.InterceptionMethod.
The context menu for the list of methods offers the option to edit existing entries.
• Interception scripts
The first two parameters passed to an interception script are the InterceptorContext
(which is an extension of ProbeContext) and the current object currentObject (which is
null for static method interceptions).
There are interception scripts for three points in the execution flow:
• Method entry
Called immediately after the intercepted method is entered. In addition to the common
parameters, all arguments of the intercepted method are passed to the script. As long as
the types of the arguments are in the configured class path of the session, method
completion is available in the script dialog.
• Method exit
Called just before the intercepted method is exited via a return call. No method arguments
are passed. If creating payload information, use the payload stack methods in the interceptor
context to retrieve information from the entry script.
• Exception exit
Called just before the intercepted method is exited after an exception has been thrown. In
addition to the common parameters, the Throwable t is passed as a parameter. The method
exit script will not be called in this case.
Interception scripts must be defined separately for each method group.
106
Custom probes can be organized into custom probe sets. You can add a saved custom probe
set to the current list of custom probes or save the current list of custom probes to a set. This
makes it easy to share custom probes between different sessions.
To automatically add a set of custom probe to new sessions, configure a saved custom probe
set on the session defaults tab [p. 119] of the general settings [p. 117] dialog.
To share a set of custom probes with a colleague, or to copy it to another JProfiler installation,
use the import/export feature [p. 115] .
B.3.7 Open Session Dialog
The open session dialog serves two functions:
• To open profiling sessions [p. 76] . Double click on an existing session or choose a session
and click [Open] to start a profiling session.
• To edit [p. 77] , copy and delete existing sessions.
The list of available session configurations displays the session name which can be changed
when editing [p. 77] a session. In addition, the associated icon to the left of the session name
show whether the session is
an "Attach to local JVM" session
an "Attach to profiled JVM
(local or remote)" session a launched application session, a launched applet session or a
launched Java Web Start session
The facility to open sessions is also embedded in JProfiler's start center [p. 62] .
B.3.8 Session Startup Dialog
Before a session is started, the session startup dialog is displayed. This dialog displays short
summaries for the
• Filter settings [p. 82]
• Profiling settings [p. 87]
• Trigger settings [p. 94]
• Database settings [p. 103]
• Probe settings [p. 102]
of the profiled session as well as [Edit] buttons that lead to the corresponding sections of the
session settings dialog [p. 76] .
When profiling, there is a general trade-off between profiling overhead and information depth.
Most likely your personal requirements will change from profiling run to profiling run, so these
settings are displayed every time before your application is started.
For IDE integration users, this is the dialog where session settings can be accessed and modified.
Session settings are persistent and are associated with the project name in the IDE.
In the Startup section dialog you can choose a recording profile [p. 108] that should be set on
startup. For many profiling use cases the startup phase of an application is not of interest. For
large applications servers, you can save a lot of memory and speed up the startup phase by not
recording any data from the beginning.
JProfiler provides a couple of default recording profiles. You can create new recording profiles
or change existing ones by clicking on [Configure] next to the recording profile drop-down list.
107
If you click on the "More" link next to the "Configure" button, additional options are shown for
adjusting request tracking settings [p. 214] and disabling triggers. By default, triggers are enabled
on startup. Triggers can also be enabled or disabled manually [p. 102] later on.
The performance indicator is set according to the selected profiling settings [p. 87] and recording
profile [p. 108] . Please note that this value is only approximate and that the filter settings influence
overhead as well.
When you click on [OK], the session will be started.
B.3.9 Recording Profiles
All views in JProfiler that have a recording action to start and stop recording of displayed data,
add a tool bar button to the view-specific section of the tool bar as well as a menu entry to the
View menu.
Sometimes, you want to toggle several recordings at the same time. The view-specific recording
buttons are not practical in this case, since you would have to visit all the concerned views one
after each other. To solve this problem, JProfiler offers recording profiles that can be activated
with a single click.
A recording profile can be activated by clicking on the
[Start recordings] tool bar button or
choosing Profiling->Start Recordings from the main menu. The displayed sub-menu
shows all available recording profiles with performance overhead indicators in front. The values
in these indicators are only approximate.
Once you select a recording profile,
• all recordings that are not contained in the selected recording profiles are stopped
• all recordings that are contained in the selected recording profiles are started if they were not
already running
• the "Stop recordings" tool bar button and the Profiling->Stop Recordings menu entry
are enabled if the selected recording profile is not empty
To create a new recording profile, you have two options. In both cases, first click on the "Start
recordings" tool bar button or choose Profiling->Start Recordings from the main menu
and then
• create a new profile from scratch by clicking on
clicking on the
[Add] button.
Configure Recording Profiles and
• save the current recording states by clicking on
Profile
Save Current Recordings As
Editing recording profiles is done by clicking on the "Start recordings" tool bar button or choosing
Profiling->Start Recordings from the main menu and then clicking on
Configure
Recording Profiles. In the recording profiles dialog, you can add, delete and recorder
recording profiles.
Clicking on a recording profile will show the edit panel inline. The available options include
recordings for:
• CPU recording
Records data for the invocations view [p. 195] , the hot spots view [p. 200] and the call graph
[p. 205] .
108
• Method statistics
Records data for the method statistics view [p. 209] . This option is only available if CPU recording
is selected.
• Call tracer
Records data for the call tracer view [p. 211] . This option is only available if CPU recording is
selected.
• Allocation call stack recording
Records data for the recorded objects view [p. 142] , the allocation tree [p. 145] as well as the
allocation hot spots [p. 145] views.
• Monitor recording
Records data for the locking history graph [p. 225] , the monitor history [p. 229] view and the
monitor statistics [p. 230] view.
• Databases
A drop-down selector lets you select a number of database probes [p. 233] that should be
recorded.
• Built-in probes
A drop-down selector lets you select a number of built-in probes [p. 236] that should be
recorded.
Recording introduces overhead for which an estimate is shown in form of a progress bar at the
bottom of the edit panel.
It is possible to rename recording profiles by clicking on the
to the profile name when then recording profile is selected.
[Edit] button that appears next
Equally important to quickly start a set of recordings is the ability to stop all recordings at the
same time, so JProfiler provides a [Stop recordings] tool bar button and a Profiling->Stop
Recordings menu entry for that purpose.
To check which recordings are currently active, hover the mouse over the "active recordings"
label in the status bar. A list of recordings will be displayed in a balloon.
B.3.10 Attaching To JVMs
JProfiler has the capability to profile any JVM that has a minimum version of 1.6, even if that JVM
was not started with the VM parameters for profiling [p. 111] . Through the use of the attach API
that is present in Oracle/Sun JVMs, JProfiler can load the profiling agent on the fly. There are two
scenarios for attaching to JVMs:
• Locally running JVMs
In this case, invoke Session->Quick Attach from the main menu and select the JVM from
a list of discovered JVMs [p. 79] .
When you close the session, you can save the session settings (filter, profiling and triggers
settings) so that you can reuse them for future use. When you attach to the same application
again, start the saved session [p. 107] instead of using "Quick attach". Of course you can also
start out by creating such a dedicated session in the first place.
• JVMs running on remote machines
In this case, extract a JProfiler archive from the download page on the remote machine. You
do not have to enter a license key there. Run the bin/jpenable command line application
on the remote machine. You will be able to select a JVM and load the profiling agent into it so
that is listens on a specific profiling port.
109
In your local JProfiler GUI, create an "Attach to profiled JVM (local or remote)" session [p. 79]
and enter the host name and the same profiling port that you specified in jpenable on the
remote machine.
When you start the session, it connects to the remote JVM and you can start profiling.
The displayed name of a JVM is the main class of the profiled JVM together with its arguments.
For launchers generated by exe4j or install4j, the executable name is displayed.
If you wish to set the displayed name yourself, for example because you have several processes
with the same main class that would otherwise be undistinguishable, you can set the VM
parameter -Djprofiler.displayName=[name]. If the name contains spaces, use single quotes:
-Djprofiler.displayName='My name with spaces' and quote the entire VM parameter
with double quotes if necessary. In addition to -Djprofiler.displayName JProfiler also
recognizes -Dvisualvm.display.name.
When the profiling agent is loaded for an attach session (either by the JProfiler GUI or by
jpenable, the profiling agent did not have the chance to instrument classes when they were
loaded. Instead, it has to reload them which puts a burden on the PermGem space of the heap.
Classes are not easily garbage collected and so the PermGem space has to support both old and
new versions of all reloaded classes. If the PermGen space is to small for a particular application,
you can increase it with the VM parameter -XX:MaxPermSize=128m.
When you choose "Dynamic instrumentation" as the method call recording type, it is important
to choose inclusive filters that focus on the classes of interest. In that way, relatively few classes
are instrumented. Alternatively, you can choose Sampling [p. 88] in the profiling settings.
If JProfiler detects that the PermGen space would be overloaded with the current filter settings,
it will warn you in the session startup dialog [p. 107] . You should then switch to sampling or define
narrow inclusive filters. Clicking on the hyperlinks in the warning message will quickly make these
changes. When selecting inclusive filters, the total amount of instrumented classes is monitored
and you are notified if you exceed the approximate maximum number of classes that can be
instrumented.
Views that show information on recorded objects, such as the Recorded objects view [p. 142] ,
the Allocation call tree [p. 145] or the heap walker allocations screen [p. 166] rely on
instrumentation of certain classes. Unfortunately, array allocations have to be instrumented at
all call sites. When the profiling agent is present at startup, this is not a problem, but in attach
mode, a large fraction of all classes has to be instrumented which might fail due to the limitations
of the PermGen space.
By default, array allocations are not recorded in attach mode, although the session startup dialog
[p. 107] gives you the possibility to do so for "non-client" JVMs (the "client" JVM has a bug that
prevents this from working successfully).
B.3.11 Starting Remote Sessions
In most cases, the integration of JProfiler with an application server is handled by the application
server integration wizards [p. 63] . If no GUI is available on the remote machine you can use the
jpintegrate executable in the bin directory for a console integration wizard.
If you want to quickly profile a JVM of version 1.6 or higher on a remote machine, extract a JProfiler
archive from the download page on the remote machine. You do not have to enter a license key
there. Run the bin/jpenable command line application on the remote machine. You will be
able to select a JVM and load the profiling agent into it so that is listens on a specific profiling
port.
110
In your local JProfiler GUI, create an "Attach to profiled JVM (local or remote)" session [p. 79]
and enter the host name and the same profiling port that you specified in jpenable on the
remote machine.
You can always profile a JVM by adding a VM parameter to the Java start command that loads
the JProfiler agent. In the JProfiler GUI, you then create a session of type "Attach to profiled JVM
(local or remote)" and connect to the profiled JVM.
See the help page on manually Adding The Profiling Agent [p. 111] for detailed instructions.
Please note that the profiling interface JVMTI only runs reliably with the standard garbage collector.
If you have VM parameters on your command line that change the garbage collector type such
as
• -Xincgc
• -XX:+UseParallelGC
• -XX:+UseConcMarkSweepGC
• -XX:+UseParNewGC
please make sure to remove them. It might be a good idea to remove all -XX options if you have
problems with profiling.
If you start your application from an ant build file, you can use the ant task [p. 269] to easily profile
your application.
B.3.12 Manually Adding The Profiling Agent
Please look at the help page on starting remote sessions [p. 110] for list of options on how to set
up remote profiling without manual modification of the Java start command. In case you need
to modify the Java command manually, please see the instructions below.
To permanently start your application or application server in such a way that you can connect
to it with a remote session from JProfiler's GUI front end, add a VM parameter to your startup
command that tells the VM to load the profiling agent:
-agentpath:[full path to JProfiler library]=[agent parameters]
or, without agent parameters:
-agentpath:[full path to JProfiler library]
For IBM JVMs, you also have to add the VM parameter -Xshareclasses:none.
The place holders [path to JProfiler library] and [agent parameters] are to be
replaced by:
• [full path to JProfiler library]
You have to specify the absolute path to the native JProfiler agent library. The path to the
agent library depends on the operating system and the architecture of the JVM (not the
architecture of the operating system). All agent libraries listed below are relative to the JProfiler
installation directory:
Windows, 32-bit
bin\windows\jprofilerti.dll
Windows, 64-bit
bin\windows-x64\jprofilerti.dll
Linux x86, 32-bit
bin/linux-x86/libjprofilerti.so
Linux x86, 64-bit
bin/linux-x64/libjprofilerti.so
111
Linux PPC, 32-bit
bin/linux-ppc/libjprofilerti.so
Linux PPC64, 64-bit
bin/linux-ppc64/libjprofilerti.so
Solaris SPARC,
32-bit
bin/solaris-sparc/libjprofilerti.so
Solaris SPARC,
64-bit
bin/solaris-sparcv9/libjprofilerti.so
Solaris x86, 32-bit
bin/solaris-x86/libjprofilerti.so
Solaris x86, 64-bit
bin/solaris-x64/libjprofilerti.so
Mac OS, 32 and
64-bit
bin/macos/libjprofilerti.jnilib
HP-UX PA_RISC,
32-bit
bin/hpux-parisc/libjprofilerti.sl
HP-UX PA_RISC,
64-bit
bin/hpux-parisc64/libjprofilerti.sl
HP-UX IA64, 32-bit
bin/hpux-ia64n/libjprofilerti.so
HP-UX IA64, 64-bit
bin/hpux-ia64w/libjprofilerti.so
AIX, 32-bit
bin/aix-ppc/libjprofilerti.so
AIX, 64-bit
bin/aix-ppc64/libjprofilerti.so
FreeBSD x86, 32-bit
bin/freebsd-x86/libjprofilerti.so
FreeBSD x86, 64-bit
bin/freebsd-x64/libjprofilerti.so
• [agent parameters]
If you immediately attach with a remote session from the JProfiler GUI on the default port,
you do not have to specify any agent parameters. For non-default ports, deferred profiling
and offline profiling, the following agent parameters are available:
• port=nnnnn chooses the port on which the agent listens for remote connections. Be sure
to use the same value in JProfiler's GUI front end.
• address=[IP address] chooses the IP address that the socket for the remote connection
should bind to. By default, the agent binds the socket to all network interfaces. If this is not
desirable for security reasons, you should use this option.
• nowait tells the profiling agent to let the JVM start up immediately. Usually, the profiled
JVM will wait for a connection from the JProfiler GUI before starting up. For 1.5 JVMs or IBM
JVMs, the parameters id has to be supplied as well. Optionally, you can also supply the
config parameter in that case.
• offline enables the offline profiling [p. 265] mode. You cannot connect with the GUI front
end when using the offline profiling mode. The parameters id has to be supplied as well.
Optionally, you can also supply the config parameter.
• id=nnnnn chooses the session used with the offline or nowait parameters. This is only
required for 1.5 JVMs or IBM JVMs.
112
• config=[path to JProfiler config file] supplies the path to JProfiler's configuration file. This
parameter is only relevant for offline profiling [p. 265] and profiling with the nowait
parameter (in the latter case only if the profiled JVM has a version of 1.5 or is an IBM JVM).
If config is not specified for those cases, the profiling agent will attempt to load the config
file from its standard location. Reading the config file is necessary to retrieve profiling
settings that have to be known at startup for the session that was selected with the id
parameter.
Multiple parameters are separated by commas such as in
"offline,id=172,config=~/.jprofiler8/config.xml".
In addition to the standard parameters above, there are the following trouble-shooting and
debugging parameters:
• verbose-instr prints the names of all instrumented classes to stderr. This is a debugging
parameter.
• jniInterception enables the detection of object allocations via JNI calls. This parameter is
only relevant for Java 1.5.0_00, 1.5.0_01 and 1.5.0_02. This feature is enabled by default
for Java 1.5.0_03 and higher. Due to a bug in Java 1.5.0_02 and lower, it is disabled when
profiling with those releases. Please make sure not to use -Xcheck:jni when you specify
this parameter for Java 1.5.0_02 and lower.
• stack=nnnnn sets the maximum stack size for dynamic instrumentation. Only change this
parameter when JProfiler emits corresponding warning messages. The default value is
10000.
• samplingstack=nnnnn sets the maximum stack size for sampling. Only change this
parameter when JProfiler emits corresponding warning messages. The default value is 200.
B.3.13 Saving Live Sessions To Disk
Snapshots of live profiling sessions can be saved to disk by selecting Session->Save Snapshot
from JProfiler's main menu or by clicking on the corresponding
tool bar entry in JProfiler's
main tool bar.
A file chooser will be brought up where you can select the name and directory of the snapshot
file to be written. The standard extension of JProfiler's snapshot files is *.jps. Once JProfiler has
finished writing the snapshot to disk, a message box informs you that the snapshot was saved.
A bookmarks [p. 134] will be added when a snapshot is saved manually.
Besides JProfiler snapshots, JProfiler can also open HPROF heap dump files as well as PHD files
(portable heap dump files created by IBM JVMs). Right from the JProfiler GUI you can save HPROF
snapshots with the Profiler->Save HPROF Snapshot. You will be asked to provide a file
name for the HPROF snapshot. The snapshot file will be given an .hprof extension and will be
saved on the computer where the profiled JVM is running. The path will be interpreted as relative
to the current directory of the profiled JVM.
In situations where physical memory is sparse, saving an HPROF snapshot can be preferable
compared to saving a full JProfiler snapshot. Also, there are alternative ways to save HPROF
snapshots:
113
• with -XX:+HeapDumpOnOutOfMemoryError
The -XX:+HeapDumpOnOutOfMemoryError VM parameter is supported by Sun 1.4.2_12+,
1.5.0_07+ and 1.6+ JVMs and is the basis of the "Out of memory exception" trigger type [p.
95] .
• with jmap
The jmap executable in the JDK can be used to extract an HPROF heap dump from a running
JVM. It is partially supported by Sun 1.5 JVMs and supported by all Sun 1.6 JVMs.
• with the command line utility jpdump provided by JProfiler
JProfiler includes a command line tool that is more versatile than jmap. It lets you select a
process, can connect to processes running as a service on Windows, has not problems with
mixed 32-bin/64-bit JVMs and auto-numbers HPROF snapshot files. If you execute it with the
-help option, you will get help on its usage:
Usage: jpdump [options]
jpdump saves an HPROF heap dump from a locally running JVM to a file.
The HPROF file can then be opened in the JProfiler GUI.
* if no argument is given, jpdump lists all locally running JVMs.
* with the following arguments you can partially or completely supply all
user input on the command line:
-p
--pid=PID
-a
--all
-f
--file=PATH
-h
--help
The PID of the JVM whose heap should be dumped
With a specified PID, no further questions will by asked.
Save all objects. If not specified, only live objects are
dumped
Path to the dump file. If not specified, the dump file
<VM name>.hprof is written in the current directory.
If the file already exists, a number is appended.
Show this help
Note that the JVM has to be running as the same user as jpdump, otherwise
JProfiler cannot connect to it.
An exception are Windows services running under the local system account if you
list them interactively with jpdump.
You can also save snapshots with the offline profiling [p. 265] API or use a trigger [p. 94] and the
"Save snapshot" and "Create a HPROF heapdump" actions [p. 98] to save snapshot in an exact
way. This is also useful for offline profiling [p. 265] .
Saved snapshots can be loaded
• by selecting Session->Open Snapshot from JProfiler's main menu.
• by selecting a file from the "Open snapshot" tab in JProfiler's start center [p. 62] .
The following restrictions apply when viewing snapshots:
• JProfiler snapshots
After a JProfiler snapshot has been loaded, the functionality of all views is identical to a live
profiling session with the exception of the heap walker view [p. 159] : The heap walker overview
will be shown if a heap snapshot was taken at the time of saving, otherwise the heap walker
will be unavailable.
• HPROF snapshots
When an HPROF snapshot is loaded, only the heap walker is available. Also, the "Allocations"
and "Time" views of the heap walker are not available.
114
• PHD snapshots
When a PHD snapshot is loaded, only the heap walker is available. Also, the "Allocations" and
"Time" views of the heap walker are not available. PHD files do not contain garbage collector
roots, so JProfiler simulates classes as roots. Finding class loader memory memory leaks may
be difficult with a PHD file.
The status bar indicates that a snapshot is being viewed by displaying the message
in its rightmost compartment.
Snapshot
B.3.14 Config Synchronization Options Dialog
This dialog is displayed when clicking on [config synchronization options] in the application
settings dialog [p. 77] of a remote session [p. 79] .
Note: These settings are only relevant if you are profiling a 1.5 JVM or an IBM JVM, and you have
specified the nowait option for the -agentpath... VM parameter. In that case, the config file needs
to be synchronized on the remote computer when the profiling settings are changed.
There are 3 possible actions when the config file has to by synchronized:
• manual synchronization
Nothing is done, you have to copy the config file yourself if you want the new settings to
become active for the next profiling run.
• copy to directory
The config file is copied to the specified directory. You can use the [...] chooser button to select
the directory with a file chooser.
• execute command
The specified command is executed. For example you could invoke ssh to copy the config file
to a remote computer.
No terminal window is shown during the execution. If you have to show a terminal window
on Windows, you can use
cmd.exe /C "start /WAIT cmd.exe /C [your command here]"
Please note that in all cases the profiled JVM has to be restarted in order for the changes to take
effect.
B.3.15 Importing And Exporting Sessions Settings
You can export session settings to an XML file and import them in a different JProfiler installation.
Also, the command line integration wizard [p. 63] produces config files with a remote session
that you can import in the JProfiler GUI.
For exporting sessions to an XML file, choose Session->Export Session Settings from
JProfiler's main menu. You will be asked for the following information:
• Sessions to export
Select one or more sessions to be exported. To select all sessions, press CTRL-A in the list
and hit SPACE for toggling the selection. The file format of the exported file is the same as
JProfiler's config file [p. 76] . Licensing information and general settings are omitted.
• Location of the exported file
The location can be a file path or a directory path. For a directory path the exported file will
be named config.xml. The text field that displays the location supports auto-completion.
115
For importing sessions from an XML file, choose Session->Import Session Settings from
JProfiler's main menu. In the file chooser, select the config file that should be imported. A dialog
will be shown that lists all sessions contained in the config file and allows you to select which
sessions to import. To select all sessions, press CTRL-A in the list and hit SPACE for toggling the
selection.
116
B.4 General Settings
B.4.1 General Settings
JProfiler's general settings are divided into several tabs:
• JDK and JREs [p. 117]
Configure JDKs for the code editor and JREs for launching profiling sessions.
• Session defaults [p. 119]
Configure some initial properties of a new session.
• Snapshots [p. 119]
Configure additional options for snapshots.
• IDE integrations [p. 120]
Install IDE integrations for JProfiler.
• Miscellaneous [p. 120]
Configure miscellaneous options for JProfiler.
B.4.2 Configuring JVMs In General Settings
JProfiler needs JDK and JRE configurations for two different purposes:
• JDKs for code completion and compiling scripts
A default JDK can be configured for sessions that do not explicitly set a JDK in their code editor
settings [p. 82] . The JDK configuration is used for code completion and compiling scripts [p.
122] .
When you click on the [Configure JDKs] button, the JDK configuration dialog is shown [p. 118]
.
If you do not define a default JDK, JProfiler will use the JRE that is used to run the JProfiler GUI.
In that case, code completion does not offer parameter names in the JRE and there is no
Javadoc for JRE classes.
• JREs for launching profiled JVMs
Profiling sessions where the profiled JVM is launched by JProfiler need a JRE configuration.
Here you can configure the default JRE for new sessions. It will be selected in the JRE drop-down
list in the application settings [p. 77] after you create a new session.
When you click on the [Configure JREs] button, the JRE configuration dialog is shown [p. 117]
.
B.4.3 JRE Configuration For Launched Sessions
The JRE configuration dialog is displayed when you click the [Configure JREs] button in the general
settings dialog [p. 117] , or the application settings [p. 77] .
JRE configurations are used by profiling sessions that are launched by JProfiler. Any changes
you make to an existing JRE configuration directly affect the sessions which already use it.
When you
add a new JRE in the JRE configuration dialog, a file chooser is brought up and
prompts you for the selection of the home directory of the JVM (e.g. c:\Program
Files\Java\jre or /usr/lib/java). The selected virtual machine will be checked for usability
by JProfiler and depending on success, a new entry in the JRE table is added.
The table that shows the configured JREs has several columns:
117
• Double-click on the "Name" column to change the name of the JRE configuration. This name
is used for JRE selection in the application settings dialog [p. 77] .
• Double-click on "Java home directory" and enter a directory manually or click on the button
labeled [...] to change the home directory of an existing JRE configuration. The new directory
will be accepted only if the directory contains a JVM which is usable by JProfiler.
• Choose the JVM Mode from the "JVM Mode" combo box. This setting is initially set to the
preferred value for the chosen JVM. See the remote session invocation table [p. 111] for details
on this option.
If you
delete an existing JRE configuration, all sessions which currently use the deleted JVM
will remain without an associated JVM and will be unusable until you assign them a new one in
the application settings dialog [p. 77] .
You can search for JREs by clicking the
search button on the right hand side of the dialog.
This invokes the search wizard which corresponds to the functionality found in JProfiler's setup
wizard. The search wizard shows all JREs found on your local fixed drives, but only new JREs will
be merged into the JRE table.
The default JRE for new sessions can be configured in the general settings [p. 117] .
B.4.4 JDK Configuration For Code Editor And Script Compilation
The JDK configuration dialog is displayed when you click the [Configure JDKs] button in the
general settings dialog [p. 117] , the editor settings dialog [p. 124] or the code editor session
settings [p. 82] .
In this dialog, you can add one or more JDKs that will be available for the purposes explained on
the script editor [p. 122] help page.
When you add a new JDK, you are asked for the home directory of the JDK that you want to enter.
Instead of a JDK, you can also select a JRE, in which case no parameter names will be available
in the code completion proposals of JDK methods. After you select the home directory, JProfiler
will check whether the directory contains a JDK or JRE and runs java -version to determine
the version of the selected JDK or JRE.
The table that shows the configured JDKs has several columns:
• Name
Double-click on the "Name" column to change the name of the JDK. This name is used for JDK
selection in drop-down lists.
When you add a JDK, the name "JDK [major version].[minor version]" will be suggested by
default. If the selection is a JRE, "JRE [major version].[minor version]" will be suggested instead.
The name of the JDK configuration must be unique.
• Java Home Directory
This is the Java home directory that you selected when you added the configuration. You can
change the Java home directory by editing this column. The Java version check will be performed
again and the version displayed in the "Java Version" column will be updated. The name of
the configuration will not be changed.
• Javadoc Directory
In this column, you can enter the location of the Javadoc that should be associated with this
JDK configuration. The Javadoc directory can remain empty in which case no context-sensitive
Javadoc help will be available for classes from the runtime library.
118
• Java Version
This uneditable column shows the version of the selected JDK configuration.
When you delete the JDK configuration that is currently used by a session, the session will still
reference the same configured name for the JDK. It will then be shown in red color with a [not
configured] message attached.
The default JDK for sessions that do not explicitly set a JDK in the can be configured in their
code editor settings [p. 82] can be configured in the general settings [p. 117] .
B.4.5 Session Defaults
When you create new session, some default settings can be pre-configured:
• Filter Settings
In the drop down list, you choose the template of filter rules [p. 83] that will be used for a
new session. By default, the built-in "[Default Excludes]" template is used.
The [Manage] button will bring up the filter template dialog [p. 84] .
• Profiling Settings
In the drop down list, you choose the profiling settings [p. 87] that will be used for a new
session. By default, the first built-in template is used.
The [Manage] button will bring up the profiling template dialog [p. 94] .
• Trigger Settings
In the drop down list, you choose the trigger set [p. 94] that will be used for a new session.
By default, no triggers are added to a session.
The [Manage] button will bring up the trigger set dialog [p. 101] .
• Custom Probes
In the drop down list, you choose the custom probe set [p. 105] that will be used for a new
session. By default, no custom probes are added to a session.
The [Manage] button will bring up the custom probe set dialog [p. 101] .
B.4.6 Snapshots
Here you can configure how the heap dump analysis is saved for snapshots.
Most of the time spent when loading snapshots is for the analysis of the raw data, the removal
of unreferenced objects and the retained size calculation. JProfiler stores the result of this analysis
next to the snapshot if possible. This means that opening a snapshot that has already been
analyzed is orders of magnitudes faster if a saved heap dump analysis can be found.
If the heap dump analysis takes up a too much disk space, you can switch off the heap dump
analysis saving altogether on this tab. The analysis will then be created each time you open the
snapshot. In general, if a heap dump analysis is missing or incorrect (e.g. from a different
snapshot) it will simply be recreated.
The storage format for the heap dump analysis is directory-based, e.g. if your snapshot is saved
to snapshot.jps, the analysis is stored in the directory snapshot.jps.analysis. In that
directory there are multiple files and further subdirectories that contain the entire analysis.
Snapshots taken with offline profiling do not have an existing heap analysis. If you're taking these
snapshots in an automated fashion, you can use the command line tool "jpanalyze" [p. 265] or
the corresponding "analyze" ant task [p. 269] in order to massively speed up the opening of these
snapshot in the JProfiler GUI.
119
B.4.7 IDE Integrations
JProfiler integrates seamlessly into most popular IDEs [p. 65] . See here [p. 65] for specific
explanations regarding each IDE integration.
Select the desired IDE from the drop down list and click on [Integrate]. After completing the
instructions, you can invoke JProfiler from the integrated IDE without having to specify class path,
main class, working directory, used JVM and other options again. Also, IDE integrations show
source code directly in the IDE.
JProfiler caches the location of integrated IDEs. If you repeat the installation of a particular
integration, JProfiler will ask you whether to reuse the known location of the IDE. This is useful
when updating to a newer version of JProfiler or for repairing a broken IDE integration.
B.4.8 Configuring Miscellaneous Options In General Settings
The following miscellaneous options are configurable:
• Look and feel
The look and feel of JProfiler can be chosen as one of
• Alloy look and feel
Alloy look and feel is a cross-platform look and feel which is developed by Incors GmbH.
This is the default setting on Linux/Unix.
• Java look and feel
Standard cross platform look and feel. Use this look and feel if you use JProfiler through a
VNC client or similar and want to reduce the transmitted data.
• Native look and feel
Native look and feel on your platform. This is the default setting on Windows and Mac OS
X.
When you switch to a different look and feel, you have to restart JProfiler for the new setting
to take effect.
Note: This setting is not available on Mac OS X.
• Tool bar icons
Tool bar icons in the main window and the script editor can be large with text, large without
text or small. This setting can also be changed by right-clicking the tool bar in a location without
buttons.
• Hidden messages
Warning messages can be disabled by clicking the Don't show this dialog again checkbox in
the warning dialog. To enable selected warning messages again, click the "Configure Hidden
Messages" button.
• Window sizes
By default, JProfiler remembers the sizes of important windows. You can disable this feature
or clear the cache of stored window sizes.
• External source viewer
The external source viewer command allows you to redirect all view source requests from the
JProfiler GUI to an external application. You can use the variables $FILE and $LINE to reference
the file and line number to be shown.
120
If you leave the text box empty, JProfiler will use its internal source viewer to show Java source
code. When JProfiler is started from an IDE integration, the source code is always shown in
the IDE itself.
121
B.5 Scripts
B.5.1 Scripts In JProfiler
JProfiler's built-in script editor allows you to enter custom logic in various places in the JProfiler
GUI, including custom probe configuration [p. 105] , heap walker filters [p. 171] and inspections
[p. 182] and the "Run interceptor script" trigger action [p. 98] .
The box above the edit area show the available parameters of the script as well as its return
type. If parameters or return type are classes (and not primitive types), they will be shown as
hyperlinks. Clicking on such a hyperlink opens the Javadoc in the external browser.
To get more information on classes from the com.jprofiler.api.* packages, please choose
Help->Show Javadoc Overview from the menu and read the the help topic on custom probes
[p. 55] .
A number of packages can be used without using fully-qualified class names. Those packages
are:
• java.util.*
• java.io.*
• com.jprofiler.api.*
• com.jprofiler.api.probes.*
You can put a number of import statements as the first lines in the text area in order to avoid
using fully qualified class names.
Scripts can be
• expressions
An expression doesn't have a trailing semicolon and evaluates to the required return type.
Example: object.toString().contains("test")
The above example would work as a filter script in the outgoing reference view of the heap
walker.
• scripts
A script consists of a series of Java statements with a return statement of the required return
type as the last statement.
E x a m p l e :
d a t a [ 0 ]
((Integer)probeContext.getMap().remove("myCount")).intValue();
=
The above example would work as the telemetry script in a custom probe configuration.
JProfiler detects automatically whether you have entered an expression or a script.
The Java editor offers the following code assistance powered by the eclipse platform:
• Code completion
Pressing CTRL-Space brings up a popup with code completion proposals. Also, typing a dot
(".") shows this popup after a delay if no other character is typed. While the popup is displayed,
you can continue to type or delete characters with Backspace and the popup will be updated
accordingly. "Camel-hump completion" is supported, i.e. typing NPE and hitting CTRL-Space
will propose NullPointerException among other classes. If you accept a class that is not
automatically imported, the fully qualified name will be inserted.
122
The completion popup can suggest:
•
variables and default parameters. Default parameters are displayed in bold font.
•
packages (when typing an import statement)
•
classes
•
fields (when the context is a class)
•
methods (when the context is a class or the parameter list of a method)
You can configure code completion behavior in the Editor Settings [p. 124] .
Parameter classes that are neither contained in the configured session class path [p. 77] nor
in the configured JDK [p. 82] are marked as [unresolved] and are changed to the generic
java.lang.Object type. To get code completion for these parameters, add the missing JAR
files to the session class path.
• Problem analysis
The code that you enter is analyzed on the fly and checked for errors and warning conditions.
Errors are shown as red underlines in the editor and red stripes in the right gutter. Warnings
(such as an unused variable declaration) are shown as a yellow backgrounds in the editor and
yellow stripes in the right gutter. Hovering the mouse over an error or warning in the editor
as well as hovering the mouse over a stripe in the gutter area displays the error or warning
message.
The status indicator at the top of the right gutter is
• green
if there are no warnings or errors in the code.
• yellow
if there are warnings but no errors in the code.
• red
if there are errors in the code. In this case the code will not compile and the session cannot
be started.
You can configure the threshold for problem analysis in the Editor Settings [p. 124] .
• Context-sensitive Javadoc
Pressing SHIFT-F1 opens the browser at the Javadoc page that describes the element at the
cursor position. If no corresponding Javadoc can be found, a warning message is displayed.
Javadoc for the Java runtime library can only be displayed if a JDK is configured for the session
[p. 82] and a valid Javadoc location is specified in the JDK settings [p. 117] .
All key bindings in the Java code editor are configurable. Choose Settings->Key Map to display
the Key map editor [p. 124] .
If the gutter icon in the top right corner of the dialog is green, your script is going to compile
unless you have disabled error analysis in the Editor Settings [p. 124] . In some situations, you
might want to try the actual compilation. Choosing Code->Test Compile from the menu will
compile the script and display any errors in a separate dialog. Saving your script with the [OK]
button will not test the syntactic correctness of the script unless the script is used right away.
Often you will want to reuse a script that you have entered previously. The script history
saves recently used scripts. If you click on the
script history tool bar button, a dialog will be
123
shown where you can see all scripts that have been used recently. Scripts are organized by script
signature and the current script signature is selected by default. When you confirm the script
history dialog, the current script in the editor is replaced.
B.5.2 Editor Settings
The editor settings dialog is shown when you select Settings->Java Editor Settings from
the menu in the script editor dialog [p. 122] .
In the code completion popup settings section, you can configure the following options:
• Auto-popup code completion after dot
If selected, each time you type a dot (".") in the script editor, the code completion popup will
be displayed after a certain delay unless you type another character in the meantime.
• Delay
The "Auto-popup code completion after dot" feature above uses a configurable delay. By
default, the delay is set to 1000 ms.
• Popup height
The height of the completion popup in number of entries is configurable.
In the display code problems section, you can configure the threshold for which code problems
are shown in the editor.
• None
No code problems are displayed at all.
• Errors only
Only problems that prevent code compilation are displayed. Errors show as red underlines
in the editor and red stripes in the right gutter.
• Errors and warnings
In addition to errors, warnings are displayed. Warnings cover all kinds of suspicious conditions
that could be sources of bugs such as an unused local variable. Warnings are displayed as
yellow backgrounds in the editor and yellow stripes in the right gutter.
In the Javadoc Settings section, there is an option to use the online documentation for the
JProfiler API instead of the bundled HTML files. Since Windows 7, it is not possible to use anchors
when showing URLs anymore, so JavaScript redirection files are used to navigate to anchors in
the Javadoc documentation. When Internet Explorer is used, two warnings are displayed each
time you invoke a show Javadoc action. By using the online documentation, these warnings are
eliminated.
The JDK for code editor section mirrors the session JDK configuration in the code editor settings
[p. 82] of the session settings dialog [p. 76] .
B.5.3 Key Map Editor
The key map editor is displayed by choosing Settings->Key Map from the menu in the script
editor dialog [p. 122] .
The active key map controls all key bindings in the editor. By default, the [Default] key map is
active. The default key map cannot be edited directly. To customize key bindings, you first have
to copy the default key map. Except for the default key map, the name of a key map can be edited
by double-clicking on it.
124
When assigning new keystrokes or removing existing key strokes from a copied map, the changes
to the base key map will be shown as "overridden" in the list of bindings.
The key map editor also features search functionality for locating bindings as well a conflict
resolution mechanism.
Key bindings are saved in the file $HOME/.jprofiler8/editor_keymap.xml. This file only
exists if the default key map has been copied. When migrating a JProfiler installation to a different
computer, you can copy this file to preserve your key bindings.
125
B.6 Profiling Views
B.6.1 Views Overview
JProfiler organizes profiling data into view sections which collect similar or connected views.
Each view section may contain a number of views. The view selector is located on the left side
of JProfiler's main window.
• Memory views [p. 139]
The memory view section contains views which are concerned with the details of object
allocations.
• Heap walker [p. 159]
The heap walker view section allows you to take a snapshot of the heap and analyze it in
detail.
• CPU views [p. 193]
The CPU view section contains views which are concerned with method calls and time
measurements.
• Thread views [p. 217]
The thread view section contains views which are concerned with the details of thread
statuses and the life cycle of threads.
• Monitor views [p. 223]
The monitor view section contains views which are concerned with the details of monitor
contentions and wait states.
• Telemetry views [p. 231]
The telemetry view section contains views which are concerned with historical characteristics
of cumulated virtual machine variables.
• Databases [p. 233]
The databases section contains views which record database operations for JDBC operations
as well as a number of NoSQL databases.
• JEE & Probes [p. 233]
The probes section contains views which record data from higher-level subsystems of the
JRE. You can define your own custom probes [p. 105] as well.
Note: It is possible to create and export views from a saved snapshot [p. 113] from the command
line [p. 273] or an ant build file [p. 280] . This is especially useful for an automated quality assurance
process.
The functionality of the various views is strongly dependent on the state of the current session
which is displayed on the right end of the status bar.
• If the session is
attached, the complete functionality of all views is available.
• If the session is
detached, the functionality of most views is incomplete. Any information
which is not already stored in JProfiler's GUI front end and would have to be queried from the
profiled application is unavailable.
• If a profiling snapshot [p. 113] is opened, the status bar displays Snapshot. The functionality
of all views is identical to the working state with the exception of the heap walker view [p.
126
159] : The heap walker overview will be shown if a heap snapshot was taken at the time of
saving, otherwise the heap walker will be unavailable.
Most views have specific view settings that can be edited by choosing View->View Settings
from the main menu or the corresponding
toolbar button when the view is active.
Common properties of profiling views include
• Exporting views to HTML, CSV and XML [p. 132]
• Undocking views from the main window [p. 132]
• Sorting tables [p. 133]
• Source and bytecode viewer [p. 136]
• Dynamic view filters [p. 136]
• Quick search capability [p. 132]
B.6.2 JProfiler's Menu
JProfiler's toolbar and menu contain actions applicable to all views as well as actions which are
view-sensitive or appear for certain views only. The common menu and toolbar entries fall into
six categories:
The session menu contains actions to create, open and close sessions and snapshots.
• Start center
(CTRL-O) Brings up JProfiler's start center [p. 62] . If there already is an open session in the
current window, it will be discarded once a new session is opened.
• New window
(CTRL-ALT-O) Opens a new instance of JProfiler's main window and brings up JProfiler's
start center [p. 62] .
• Compare snapshots in new window
Opens a new snapshot comparison window [p. 246] and shows the file chooser for selecting
multiple snapshots.
• Stop/Detach/Start/Attach current session
(F11)
•
Stops the current session (all session types [p. 76] except remote session), i.e. the process
is destroyed. In a stopped session, the profiling views are not fully functional [p. 126] (visible
if currently started and not remote session).
•
Detaches the current remote session [p. 76] . The profiled JVM will be detached from
JProfiler's front end and continues to run undisturbed. In a detached session, the profiling
views are not fully functional [p. 126] (visible if currently attached and remote session).
•
Starts the application configured in the current session if it is an application session,
applet session or Web Start session [p. 76] (visible if currently detached and not remote
session).
•
Attaches the current remote session [p. 76] to a remote application or reconnects to it.
(visible if currently detached and remote session).
127
• New session
(CTRL-N) Creates a new session and brings up the application settings dialog [p. 77] . The
new session will be started after leaving the dialog with [OK]. If there is already an open session
in the current window, it will be discarded.
• Quick attach
Opens a dialog that shows you all locally running JVMs. You can attach to a JVM [p. 109] and
profile it without the need for modifying the start command of the JVM.
• Integration wizards
This sub-menu contains the starting points for the application server integration wizards
[p. 63] , just like the "New session" tab on the start center [p. 62] .
• Conversion wizards
This sub-menu contains the starting points for the conversion wizards, just like the "Convert"
tab on the start center [p. 62] .
• Open session
Brings up the open session dialog [p. 107] . If there already is an open session in the current
window, it will be discarded once a new session is opened.
• Export session settings
Brings up a dialog where you can export settings for selected sessions [p. 115] to an external
config file.
• Import session settings
Brings up a dialog where you can import settings for selected sessions [p. 115] from an external
config file.
• Save snapshot
(CTRL-S) Brings up a file chooser to select a snapshot file [p. 113] to be written. A dialog
box informs about the successful completion of the operation.
• Open snapshot
Brings up a file chooser to select a snapshot file [p. 113] to be opened. If there already is
an open session in the current window, it will be discarded.
• Session settings
Brings up the session settings dialog [p. 76] .
• General settings
Brings up the general settings dialog [p. 117] .
• IDE integrations
Short cut to the IDE integrations tab of the general settings dialog [p. 120] where you can
integrate all supported IDEs.
• Close session
Closes the current session. If there is an open session in the current window, you will be
asked for confirmation. The window will be kept open and reverted to its original state.
• Close window
(CTRL-W) Closes the current window. If there is an open session in the current window, you
will be asked for confirmation.
128
• Exit JProfiler
(CTRL-ALT-X) After confirmation, closes all open main windows and exits JProfiler.
Selected actions from the session menu are added to the "session" section of the tool bar.
The view menu contains view-specific actions and gives access to the view settings dialog. View
specific actions are described in the help page of the corresponding views [p. 126] .
• Export view
(CTRL-R) Most views have the capability to export their contents [p. 132] as HTML, CSV or
XML.
• View settings
(CTRL-T) Brings up the view settings dialog for the corresponding view. If disabled, the
currently active view has no particular settings.
Selected actions from the view menu are added to the "view-specific" section of the tool bar.
The profiling menu contains actions which change the window or session as a whole.
• Start recordings
The sub-menu contains recording all configured recording profiles [p. 108] that allow you
to change the set of active recordings with a single click. In addition, it contains entries to
configure recording profiles and
save the current recordings to a new profile.
• Stop recordings
(F8) With this action you can stop all recordings with a single click.
• Start / Change request tracking
(CTRL-F8) Brings up the request tracking dialog [p. 214] . This action is also available from
JProfiler's status bar.
• Enable triggers
This action is also available from JProfiler's status bar and toggles the trigger execution state
[p. 102]
•
Enable triggers. (visible if triggers are currently not enabled). Adds a bookmark with a
solid line to all graph views with a time axis.
•
Disable triggers. (visible if triggers are currently disabled). Adds a bookmark with a dashed
line to all graph views with a time axis.
• Enable trigger groups
Brings up a dialog to enable or disable groups of triggers [p. 102] .
• Save HPROF snapshot
Brings up a dialog to select a path for an HPROF snapshot file [p. 113] to be saved. A dialog
box informs about the successful completion of the operation.
• Run garbage collector
Run the garbage collector in the profiled JVM.
129
• Add bookmark
Add a bookmark in all graph views with a time axis. Bookmarks can be renamed or deleted
by right-clicking them and choosing the appropriate action from the context menu. Bookmarks
can also be set programmatically from the profiling API.
• Edit bookmarks
Brings up a dialog where you can edit all existring bookmarks [p. 135] .
• Show global filters for method call recording
Show a dialog with a tree view of all exclusive or inclusive filters [p. 84] that JProfiler uses
when recording the method call tree. This action is also available at the bottom of several
views that show call trees.
Selected actions from the profiling menu are added to the "profiling" section of the tool bar.
The window menu allows you to keep track of all tops level windows created by JProfiler [p. 132]
.
• Undock/Dock view
(CTRL-E) This action is also available from the context menu when right clicking the view in
the tab selector at the bottom of the window.
•
Undocks the view and shows it in a separate top level window. (visible if the currently
active view is docked into the main window)
•
Docks the view and returns it to the main window. (visible if the currently active view is
undocked)
• Dock all floating views
Docks all currently undocked views into their main windows.
• Cycle to previous window
(CTRL-F2) Activate the previous window in the window list and bring it to the front.
• Cycle to next window
(CTRL-F3) Activate the next window in the window list and bring it to the front.
• Tile all undocked views
Tile the desktop with all undocked views.
• Stack all undocked views
Resize all undocked views to a standard size and stack them regularly on the desktop.
• Close unused console windows
Close all console windows that do not have an active process associated with them.
At the bottom of the window menu you can directly navigate to a window by selecting it from
the list.
The help menu gives access to help, web sites, and useful e-mail addresses for JProfiler.
• Help contents
(F1) Brings up context sensitive help. This action is also available from JProfiler's toolbar.
130
• Show quickstart dialog
(SHIFT-F1) Brings up the quickstart dialog [p. 60] .
• Screencasts for JProfiler
Opens the web page with screen casts for JProfiler in your browser.
• Check for update
Opens the updater which checks for a new JProfiler version in the same major series.
• Purchase JProfiler online
Opens the online shop for JProfiler in your browser.
• Contact sales
Brings up a sales contact form in your browser.
• Contact support
Brings up a support contact form in your browser.
• JProfiler on the web
Opens the main web site for JProfiler in your browser.
• Enter license key
Allows you to enter your license key [p. 64] .
• About JProfiler
Shows general information about your copy of JProfiler and its license status.
131
B.6.3 Common Topics
B.6.3.1 Exporting Views
All views can be exported to external formats by selecting Export from the View menu or context
menu or clicking on the corresponding
toolbar button. A file chooser will be brought up
allowing you to specify the output file and the export format.
The export format is chosen with the "file type" combo box in the file chooser. The following
export formats are available:
• HTML
Available for all views. The view will be exported to an HTML file. Besides the HTML file, several
image files might be written to a subdirectory jprofiler_images. If the option to open files
after export [p. 120] is enabled, the web browser configured in the general settings [p. 120] is
opened and the exported HTML file is displayed.
• CSV data
Available for tabular views, hot spots views and graphs with a time axis. CSV data suitable for
Microsoft Excel is written to a file. If the option to open files after export [p. 120] is enabled,
the registered application for CSV is opened and the exported CSV file is displayed.
Note: When using Microsoft Excel, CSV is not a stable format. Microsoft Excel on Windows
takes the separator character from the regional settings. JProfiler uses a semicolon as the
separator in locales that use a comma as a decimal separator and a comma in locales that
use a dot as a decimal separator. If you need to override the CSV separator character you can
do so by setting -Djprofiler.csvSeparator in bin/jprofiler.vmoptions.
• XML data
Available for tree views and hot spots views. XML data with a self-explanatory format is written
to a file. If the option to open files after export [p. 120] is enabled, the registered application
for XML is opened and the exported XML file is displayed.
If you export the same view multiple times to the same directory under the same name, a running
number will be appended to the filename. The export directory location is persistent and
remembered across restarts.
With the HTML export functionality you can print all views from JProfiler via your web browser.
B.6.3.2 Quick Search
All tables, trees and lists in JProfiler can be quick-searched by typing into the table or tree. The
search term will be displayed in a yellow dialog at the top of the searched element. If no match
is found, the search term is displayed in red. If a match is found, the search term is displayed in
black and the match is made visible. The matched portion is drawn inverted with a green
background.
To start the quick search, you can also choose View->Find where available or press ALT-F3 or
CTRL-F.
To navigate between matches, you can use the arrow keys or F3 and SHIFT-F3.
You can use wildcards in your search term, for example: Font*Handle.
B.6.3.3 Top-level Windows In JProfiler
All views in JProfiler can be undocked and promoted to a separate top level window by choosing
Window->Undock View from JProfiler's main menu
132
An undocked view has a reduced main menu that contains only the View and Window menus
from the main menu [p. 127] as well as a reduced toolbar. With Window->Show Main Window
For This Session (CTRL-H) the corresponding main window can be activated.
If a view has been undocked, a placeholder is shown in the corresponding tab in the main window.
An undocked view can be re-docked into its main window by
• choosing Window->Dock View from the main menu of the undocked view.
• closing the window.
• clicking the
dock button in the placeholder for the view.
• choosing Window->Dock View from JProfiler's main menu
Undocked views can be tiled or stacked with the Window->Tile All Undocked Views and
Window->Stack All Undocked Views menu entries. Note that undocked views of all main
windows are treated uniformly.
To dock all undocked views with a single action, please choose Window->Dock All Floating
Views. Note that undocked views of all main windows are docked.
JProfiler keeps track of all created top level windows in the window list available at the bottom
of the Window menu. These windows include
•
main windows
•
undocked views
•
console windows
•
source and bytecode viewers
This list does not include
• native console windows
• windows opened by the profiled application
To navigate to a window in the window list, click on it or use the Window->Cycle To Previous
Window (CTRL-F2) and Window->Cycle To Next Window (CTRL-F3) menu entries.
B.6.3.4 Sorting Tables In Profiling Views
Many of JProfiler's profiling views are displayed as tables. These tables can be sorted by any
column in three ways:
• Choose the sort column from the context menu.
• Choose the sort column from the View->Sort menu which appears for table views.
• Click on the column header of the sort column.
Performing one of these operations multiple times alternates between ascending and descending
sort order. The current sort column and sort order is indicated graphically in the column headers
as well as in the relevant menus.
Most numeric columns in JProfiler display only positive numbers. If negative negative numbers
can be present, you might want to sort using either absolute or the normal ordering. This choice
can be made in the view settings dialog of the relevant views.
133
B.6.3.5 Zooming And Navigating In Graphs
Some of JProfiler's profiling views are displayed as graphs.
The zoom level for these graphs can be adjusted in the following ways:
• Zoom in by rolling the mouse wheel toward you, clicking on the
choosing the corresponding entry from the context menu.
zoom in toolbar button or
• Zoom out by rolling the mouse wheel away from you, clicking on the
button or choosing the corresponding entry from the context menu.
• Zoom to 100% by clicking on the
entry from the context menu.
zoom out toolbar
zoom 100% toolbar button or choosing the corresponding
• Fit graph to window by clicking on the
corresponding entry from the context menu.
fit content toolbar button or choosing the
To zoom in on a particular object, you can select it first and then use the zoom in action
described above.
Besides using the scrollbars to navigate to other parts of the graph you can drag the graph with
the mouse to move it.
B.6.3.6 Bookmarks
All graph views with a time axis display bookmarks. Bookmarks are vertical lines at certain points
of the time axis. Every bookmark has a description. When you hover with the mouse above a
bookmark, the description will be displayed in a tooltip window. Bookmarks are global for all
views, i.e. a bookmark is displayed in all graphs and has the same description everywhere.
Bookmarks are created
• when starting and stopping allocation call stack recording [p. 139]
• when starting and stopping CPU recording [p. 193]
• when enabling or disabling triggers [p. 102]
• when starting and stopping method statistics recording [p. 209]
• when starting and stopping call tracing [p. 211]
• when saving a snapshot [p. 113]
• when taking a heap dump [p. 159]
• when profiling settings are updated [p. 76]
• when starting or stopping monitor recording [p. 223]
• when taking a thread dump [p. 222]
• when starting or stopping probe recording [p. 233]
• manually
You can manually add a bookmark at the current time by
• clicking on the
add bookmark button in the toolbar.
• choosing Profiler->Add Bookmark from the main menu.
You can add a bookmark at any past moment in time by moving the mouse to the desired
point on a graph view with a time axis and choose Add Bookmark Here here from the main
menu.
134
• from the profiling API
You can use the profiling API in order to add a bookmark programatically.
• with a trigger
You can also use a trigger [p. 94] and the "Add bookmark" action [p. 98] to add a bookmark.
This is also useful for offline profiling [p. 265] .
For the start event, the bookmark is a solid line, for the stop event, the bookmark is a dashed
line.
In graph views with a time axis you can
• edit the properties of a bookmark
by right-clicking it and choosing Edit Bookmark from the context menu. The dialog for editing
a single bookmark [p. 135] will be displayed.
• delete a bookmark
by right-clicking it and choosing Delete Bookmark from the context menu.
The list of bookmarks can be shown by choosing Profiling->Edit Bookmarks from JProfiler's
main menu. The bookmark dialog [p. 135] will be shown where you can edit, delete and export
the list of bookmarks.
B.6.3.7 Editing Bookmarks
The bookmark dialog is invoked by choosing Profiling->Edit Bookmarks from JProfiler's
main menu. It shows a list of all bookmarks [p. 134] . For each bookmark, the following properties
are displayed:
• Time
The time when the bookmark was set, relative to the start of the JVM.
• Line style and color
The line style (solid or dashed) and the color of the bookmark line as shown in the graph views
with a time axis is shown as a sample. For automatic bookmarks, solid lines indicate a start
event, while dashed lines indicate a stop event.
• Description
For automatic bookmarks, the description indicates the origin of the bookmark.
Bookmarks can be
• edited by selecting a single bookmark and clicking on the [Edit] button or by double-clicking
on a bookmark. A dialog will be shown where you can edit the description, the color and the
line style of the bookmark.
• deleted by selecting one or multiple bookmarks and clicking on the
hitting the DEL key.
[Remove] button or
• sorted by time or by description by clicking on the table columns.
• searched by typing into the table or choosing Find from the context menu.
• exported to HTML or CSV by clicking on the
the dialog.
135
[Export] button in the lower-right corner of
B.6.3.8 Integrated Source Code And Bytecode Viewer
Wherever applicable, JProfiler provides access to the source code as well as the bytecode of
profiled classes and displays them in a source and bytecode viewer frame. The source and
bytecode viewer has two tabs, one for source code and the other for bytecode. Both tabs display
the same class. Invoking the source and bytecode viewer through the
Show source action in
the View menu or context menu displays the frame with the source tab activated, the
Show
bytecode action activates the bytecode tab first.
To be able to show the source code of a class, the source must be available from the source path
[p. 77] of the session. To be able to jump directly to the chosen method in the source code
viewer and to display the bytecode of a class, the class file must be available from the class path
[p. 77] of the session. Changes in class path and source path for an active session are recognized
immediately by the source and bytecode viewer.
The source code tab has a method selector combo box displaying the file structure of the source
file, including inner classes and other top level classes. When selecting a method, the bytecode
viewer opens the class file tree at the corresponding position. The tool bar actions allow you to
copy text to the clipboard and search for text in the source file.
The bytecode of a class is displayed in a tree showing
• General information
• Constant pool
• Interfaces
• Fields
• Methods
• Class file attributes
If you look for the bytecode, select the "Code" child of the desired method. The bytecode viewer
is extensively hyperlinked, allowing you to navigate easily to constant pool entries or branch
targets and go back and forth in your navigation history with the
navigation controls at
the top of the tab.
Note: When JProfiler is started through an IDE integration [p. 65] , the integrated source code
viewer is not used and the source element is displayed in the IDE.
B.6.3.9 Dynamic View Filters
For many dynamic views and snapshot comparison views [p. 246] , view filters can be set at the
bottom of the view. Enter a comma separated list of packages into the combo box and hit enter
to dynamically filter the view.
You can specify exceptions, by adding a minus sign at the start of a package. Those packages
will then not be included. For example:
com.mycorp,-com.mycorp.parser
will resolve all calls to the com.mycorp package hierarchy except any calls to the
com.mycorp.parser sub-hierarchy. You can also start the filter list with exceptions, in that case
all calls will be resolved except for the specified packages.
In one JProfiler main window, all dynamic views with a view filter box at the bottom share the
same current view filter. To reset the view filter and show the entire content of the view again,
click on [Reset view filters] in the lower right corner of the view. The combo box holds view
filters that have been entered during the current session. Selecting an entry from the combo
box enables the view filter immediately.
136
View filters have an effect similar to the inclusive filters that are set for the session. These are
configured in the session settings dialog [p. 82] and are not adjustable without loss of recorded
data while the session is active. However, the active filter sets of the session strongly influence
the speed and memory consumption of the profiled application while the view filters don't. It is
therefore advisable to activate as many filter sets as possible in the filter settings [p. 83] and
use the view filters for dynamic drill down only.
B.6.3.10 Tree Maps
Tree maps are shown by the allocation call tree view [p. 145] , the allocation tree map in the heap
walker [p. 166] , the biggest objects view in the heap walker [p. 168] as well as the call tree view
[p. 195]
Please see the Wikipedia page on tree maps for more information on tree maps in general.
Tree maps in JProfiler are alternate visualizations of associated trees. Each rectangle in the
tree map represents a particular node in the tree. The area of the rectangle is proportional to
the length of the size bar in the tree view. In contrast to the tree, the tree map gives you a
flattened perspective of all leafs in the tree. If you are mostly interested in the dominant leafs
of the tree, you can use the tree map in order to find them quickly without having to dig into the
branches of the tree. Also, the tree map gives you an overall impression of the relative importance
of leaf nodes.
By design, tree maps only display values of leaf nodes. Branch nodes are only expressed in
the way the leaf nodes are nested. For non-leaf nodes which have significant inherent values,
JProfiler constructs synthetic child nodes. In the diagram below, you can see that node A has an
inherent value of 20% so that its child nodes have a sum of 80%. To show the 20% inherent value
of A in the tree map, a synthetic child node A' with a total value of 20% is created. It is a leaf node
and a sibling node of B1 and B2. A' will be shown as a colored rectangle in the tree map while A
is only used for determining the geometric arrangement of its child nodes B1, B2 and A'.
The actual information for tree map nodes is displayed in tool tips that are immediately shown
when you hover over the tree map. It corresponds to the information that is shown in the tree
view mode. If a tree map rectangle exceeds a certain size, its name is printed directly in the tree
map.
The tree map is shown up to a maximum nesting depth of 25 levels. The depth of the particular
leaf in the tree map is encoded in its color. The color scale blends blue into yellow, where blue
indicates a smaller and yellow a larger depth. The scale is always relative to all currently displayed
nodes. For example, if you zoom into a particular area of the tree map, the scale will be re-adjusted
so that that the depth of the parent node corresponds to blue. Below the tree map, a legend
presents all possible colors as well as the displayed maximum and minimum depths.
137
Double-clicking on any colored rectangle in the tree map will zoom to the parent node unless
the node is already a top-level node. There are tool bar actions for for
zooming in and
zooming out, as well as as context actions for showing the actual root of the associated tree.
In order to explore the hierarchical environment of a particular leaf in the tree map, there is a
context action "Show In Tree", that switches to the tree view mode and selects the same node
there.
B.6.3.11 Graphs With A Time Axis
There are many graphs with a time axis in JProfiler, such as the VM telemetry views [p. 231] , the
thread history view [p. 218] or the time view in the heapwalker [p. 181] .
Graphs with a time axis have two different display modes. The display mode is a persistent view
setting and is thus also accessible through the view settings dialog of each such view.
• fixed scale
If you are currently in the "scale to fit window" mode, you can switch to this mode by
• choosing the
scale mode selector button at the top of the graph.
• choosing Scale To Fit Window from the context menu.
• checking Scale to fit window in the view settings dialog.
In this mode, the time axis can be scrolled with the scroll bar on the bottom which appears if
the total extent of the axis does not fit into the current view size.
For dynamic views, if the current time is visible, the view is in auto-follow mode where the
time axis is scrolled automatically when new data arrives to always show the current time. If
you are not in auto-follow mode, because you scrolled back in time, just move the scroll bar
to the right end of the time scale to re-enable auto-following.
You can adjust the scale of the time axis by zooming in or out.
Zooming in increases the
level of detail while
zooming out decreases it. You change the zoom level by
• using the zoom controls at the top of the view.
• choosing Zoom In and Zoom Uut from the context menu.
• scale to fit window
If you are currently in the "fixed scale" mode, you can switch to this mode by
• choosing the
scale mode selector button in the lower right corner of the view.
• choosing Continue At Fixed Sscale from the context menu.
• deselecting Scale to fit window in the view settings dialog.
The time scale on the time axis is adjusted in order to show the total extent of the axis in the
current size of the view. Zooming is not possible in this mode.
Grid lines and background of the graph can be configured in the view settings dialog.
138
B.6.4 Memory Views
B.6.4.1 Memory View Section
The memory view section contains the
• All objects view [p. 140]
The all objects view shows the dynamic class-resolved statistics for the current heap usage.
• Recorded objects view [p. 142]
The recorded objects view shows the dynamic class-resolved statistics for the live and garbage
collected objects that have been recorded.
• Allocation call tree [p. 145]
The allocation call tree shows the allocation tree for the current heap usage and garbage
collected objects.
• Allocation hot spots view [p. 150]
The allocation hot spots view shows which methods are responsible for creating objects of a
selected class.
Unless a recording profile with allocation call stack recording has been selected in the Startup
section of the profiling settings dialog [p. 87] , data acquisition has to be started manually by
clicking on Record allocation data in the tool bar or by selecting View->Record Allocation
Data from JProfiler's main menu. Bookmarks [p. 134] will be added when recording is started or
stopped manually.
Allocation data acquisition can be stopped by clicking on
Stop recording allocation data in
the tool bar or by selecting View->Stop Recording Allocation Data from JProfiler's main
menu.
The allocation call stack recording state is shown in the status bar with a
memory icon which
is shown in gray when allocations are not recorded. Clicking on the memory icon will toggle
allocation call stack recording.
Restarting data acquisition resets all data in the the recorded objects view [p. 142] , the allocation
call tree [p. 145] and the allocation hot spots view [p. 150] . Only the all objects view [p. 140] is not
influenced by allocation call stack recording.
When you
stop recording allocations, the recorded objects will still be tracked for garbage
collection. For example, if all recorded objects are garbage collected, both the recorded objects
view and the allocation call tree will be empty in their default view mode (live objects only). You
can then still display all recorded objects if you switch to one of the other two view modes
(garbage collected only or both live and garbage collected).
Note that you can also use a trigger [p. 94] and the "Start recording" and "Stop recording" actions
[p. 98] to control allocation call stack recording in a fine-grained and exact way. This is also useful
for offline profiling [p. 265] .
The heap walker [p. 159] will be able to display allocation call stack information only for recorded
objects, otherwise the entire heap is displayed in the heap walker.
The memory views are integrated with the heap walker. The take heap snapshot with selection
[p. 159] action on the toolbar, in the View and context menus takes a heap snapshot and creates
an object set with the currently selected objects.
139
B.6.4.2 All Objects
B.6.4.2.1 All Objects
The all objects view shows the list of all loaded classes together with the number of instances
which are allocated on the heap. To see the objects allocated during a certain time period, and
to record allocation call stacks, please use the recorded objects view [p. 142] .
The all objects view has an aggregation level selector. It allows you to switch between
• Classes
Every row in the table is a single class. This is the default aggregation level.
• Packages
Every row in the table is a single package. Sub-packages are not included. In this aggregation
level, the table becomes a tree table. You can open each package by clicking on the tree node
on its left and see the contained classes directly beneath it.
• Java EE components
Every row in the table is a Java EE component [p. 90] . This aggregation level is like a filter for
the classes mode and enables you to quickly check the loaded Java EE components in your
profiled application.
There are three sortable columns shown in the table:
• Name
Depending on the aggregation level, this column shows different values:
• classes
shows the name of the class or the array type.
• package
shows the name of the package.
• Java EE
shows the display name of the Java EE component. If the display name is different from the
actual class name, the class name is displayed in square brackets.
• Instance count
Shows how many instances are currently allocated on the heap. This instance count is displayed
graphically as well.
• Size
Shows the total size of all allocated instances. Note that this is the shallow size which does
not include the size of referenced arrays and instances but only the size of the corresponding
pointers. The size is in bytes and includes only the object data, it does not include internal
JVM structures for the class, nor does it include class data or local variables.
The update frequency for the all objects view can be set on the miscellaneous tab [p. 92] in the
profiling settings dialog [p. 87] . The update frequency of the all objects view is adjusted
automatically according to the total number of objects on the heap. If there are many objects
on the heap, the calculation of the all objects view becomes more expensive, so the update
frequency is reduced. You can always retrieve the current data by clicking on the
refresh
button in the status bar.
140
You can add a selected class or package to the class tracker [p. 156] by bringing up the context
menu with a right click and choosing Add Selection To Class Tracker. If the class tracker
is not recording, recording will be started for all classes configured in the class tracker. If the
class tracker is recording with a different object type or liveness type, all recorded data will be
cleared after a confirmation dialog.
B.6.4.2.2 All Objects View Settings Dialog
The all objects view settings dialog is accessed by bringing the all objects [p. 140] to front and
choosing View->View Settings from JProfiler's main menu or clicking on the corresponding
toolbar button.
You can select a size scale mode for all displayed sizes:
• Automatic
Depending on the size value, it's displayed in MB, kB or bytes, in such a way that 3 significant
digits are retained.
• Megabytes (MB)
• Kilobytes (kB
• Bytes
The primary measure defines which measurement will be shown in the second column of the
all objects view. That column shows its values graphically with a histogram, is the default sort
column and is used for the difference column. By default, the primary measure is the instance
count. Alternatively, you can work with the shallow size, which is especially useful if you're looking
at arrays.
The sorting of the difference column can be toggled between absolute value ordering or
normal ordering.
141
B.6.4.3 Recorded Objects
B.6.4.3.1 Recorded Objects View
The recorded objects view shows the list of classes of all recorded objects and arrays together
with the number of instances which are allocated on the heap. Only recorded objects will be
displayed in this view. See the memory section overview [p. 139] for further details on allocation
call stack recording. The all objects view [p. 140] displays all objects, regardless of whether they
have been recorded.
The recorded objects view has an aggregation level selector. It allows you to switch between
• Classes
Every row in the table is a single class. This is the default aggregation level.
• Packages
Every row in the table is a single package. Sub-packages are not included. In this aggregation
level, the table becomes a tree table. You can open each package by clicking on the tree node
on its left and see the contained classes directly beneath it.
• Java EE components
Every row in the table is a Java EE component [p. 90] . This aggregation level is like a filter for
the classes mode and enables you to quickly check the loaded Java EE components in your
profiled application.
There are three sortable columns shown in the table:
• Name
Depending on the aggregation level, this column shows different values:
• classes
shows the name of the class or the array type.
• package
shows the name of the package.
• Java EE
shows the display name of the Java EE component. If the display name is different from the
actual class name, the class name is displayed in square brackets.
• Instance count
Shows how many instances are currently allocated on the heap. This instance count is displayed
graphically as well.
• Size
Shows the total size of all allocated instances. Note that this is the shallow size which does
not include the size of referenced arrays and instances but only the size of the corresponding
pointers. The size is in bytes and includes only the object data, it does not include internal
JVM structures for the class, nor does it include class data or local variables.
For a selected class or package, you can jump from the recorded objects view to the allocation
call tree [p. 145] as well as the allocation hot spots [p. 150] by bringing up the context menu with
a right click and choosing Show allocation tree for selection or Show allocation
hot spots for selection.
142
You can add a selected class or package to the class tracker [p. 156] by bringing up the context
menu with a right click and choosing Add Selection To Class Tracker. If the class tracker
is not recording, recording will be started for all classes configured in the class tracker. If the
class tracker is recording with a different object type or liveness type, all recorded data will be
cleared after a confirmation dialog.
The recorded objects view can filter objects according to their liveness status:
• Live objects
Only objects which are currently in memory are shown.
• Garbage collected objects
Only objects which have been garbage collected are shown.
• Live and garbage collected objects
All created objects are shown.
To switch between the three modes, you can click on the toolbar entry displaying the current
mode and chose the new desired mode. Also, JProfiler's main menu and the context menu allow
the adjustment of the view mode via View->Change View Mode.
If the garbage collected objects are shown, you can reset the accumulated data by clicking on
the
reset action in the toolbar or choosing the the Reset Garbage Collector History
menu item in the View or context menu. All garbage collector data will be cleared and the view
will be empty for the "Garbage collected objects" mode until further objects are garbage collected.
Note that you can force garbage collection by clicking on the garbage collector tool bar button
or by selecting Profiler->Run Garbage Collector from JProfiler's main menu.
The update frequency for the recorded objects view can be set on the miscellaneous tab [p. 92]
in the profiling settings dialog [p. 87] .
You can stop and restart allocation call stack recording [p. 139] to clear the recorded objects view.
B.6.4.3.2 Recorded Objects View Settings Dialog
The recorded objects view settings dialog is accessed by bringing the recorded objects [p. 142]
to front and choosing View->View Settings from JProfiler's main menu or clicking on the
corresponding
toolbar button.
You can select a size scale mode for all displayed sizes:
• Automatic
Depending on the size value, it's displayed in MB, kB or bytes, in such a way that 3 significant
digits are retained.
• Megabytes (MB)
• Kilobytes (kB
• Bytes
The primary measure defines which measurement will be shown in the second column of the
recorded objects view. That column shows its values graphically with a histogram, is the default
sort column and is used for the difference column. By default, the primary measure is the
instance count. Alternatively, you can work with the shallow size, which is especially useful if
you're looking at arrays.
143
The sorting of the difference column can be toggled between absolute value ordering or
normal ordering.
144
B.6.4.4 Allocation Call Tree
B.6.4.4.1 Allocation Call Tree
The allocation call tree shows a top-down call tree cumulated for all threads and filtered according
to the filter settings [p. 83] which is similar to the one shown in the call tree view [p. 195] in
JProfiler's CPU section [p. 193] except that it shows allocations of class instances and arrays
instead of time measurements.
In order to prepare an allocation call tree, you have to click on the
calculate toolbar button
or choose View->Calculate Allocation Call Tree from JProfiler's main menu. If an
allocation tree has already been calculated, the context sensitive menu also gives access to this
action.
Before the allocation call tree is calculated, the allocation options dialog [p. 157] is shown. The
class or package selection as well as the selected liveness mode are displayed at the top of the
allocation call tree view.
JProfiler automatically detects Java EE components [p. 90] and displays the relevant nodes in
the allocation call tree with special icons that depend on the Java EE component type:
servlets
JSPs
EJBs
For certain classes, JProfiler shows a display name:
• JSPs
the path of the JSP source file
• EJBs
the name of the EJB interface
• RMI proxies
the name of the remote interface
• Web service proxies
the QName of the end point
If URL splitting is enabled in the servlet probe [p. 104] each request URL creates a new node with
a
special icon and the prefix URL:, followed by the part of the request URL on which the
allocation call tree was split. Note that URL nodes group request by the displayed URL.
The allocation call tree view has an aggregation level selector. It allows you to switch between
• methods
Every node in the tree is a method call. This is the default aggregation level. Special Java EE
component methods have their own icon (see above) and display name, the real class name
is appended in square brackets.
• classes
Every node in the tree is a single class. Java EE component classes have their own icon (see
above) and display name, the real class name is appended in square brackets.
145
• packages
Every node in the tree is a single package. Sub-packages are not included.
• Java EE components
Every node in the tree is a Java EE component [p. 90] . If the component has a separate
display name, the real class names are omitted.
When you switch between two aggregation levels, JProfiler will make the best effort to preserve
your current selection. When switching to a a more detailed aggregation level, there may not
be a unique mapping and the first hit in the allocation call tree is chosen.
The allocation call tree doesn't display all method calls in the JVM, it only displays
• unfiltered classes
Classes which are unfiltered according to your configured filter sets [p. 83] are used for the
construction of the allocation call tree.
• first level calls into unfiltered classes
Every call into a filtered class that originates from an unfiltered class is used for the construction
of the allocation call tree. Further calls into filtered classes are not resolved. This means that
a filtered node can include information from other filtered calls. Filtered nodes are painted
with a red marker in the top left corner.
• thread entry methods
The methods Runnable.run() and the main method are always displayed, regardless of the
filter settings.
A particular node is a bridge node if it would normally not be displayed in the view, but has
descendant nodes that have to be displayed. The icons of bridge nodes are grayed out. For the
allocation call tree view this is the case if the current node has no allocations, but there are
descendant nodes that have allocations.
When navigating through the allocation call tree by opening method calls, JProfiler automatically
expands methods which are only called by one other method themselves.
To quickly expand larger portions of the allocation call tree, select a method and choose
View->Expand Multiple Levels from the main window's menu or choose the corresponding
menu item from the context menu. A dialog is shown where you can adjust the number of levels
(20 by default) and the threshold in per mille of the parent node's value that determines which
child nodes are expanded.
If you want to collapse an opened part of the allocation call tree, select the topmost method
that should remain visible and choose View->Collapse All from the main window's menu
or the context menu.
If a method node is selected, the context menu allows you to quickly add a method trigger [p.
94] for the selected method with the
add method trigger action. A dialog [p. 102] will be
displayed where you can choose whether to add the method interception to an existing method
trigger or whether to create a new method trigger.
Nodes in the allocation call tree can be hidden by selecting them and hitting the DEL key or by
choosing Hide Selected from the context menu. Percentages will be corrected accordingly as
if the hidden node did not exist. All similar nodes in other call stacks will be hidden as well.
146
When you hide a node, the toolbar and the context menu will get a
Show Hidden action.
Invoking this action will bring up a dialog where you can select hidden elements to be shown
again.
For method, class or package nodes, the context menu and the View menu have an Add Filter
From Selection entry. The sub-menu contains actions to add appropriate filters [p. 83] as well
as an action to add an ignored method entry [p. 86] .
If a node is excluded, you will get options to add an inclusive filter, otherwise you will get options
to add an exclusive filter. These actions are not available for classes in the "java." packages.
The tree map selector above the allocation call tree view allows you to switch to an alternate
visualization: A tree map that shows all call stacks as a set of nested rectangles. Please see the
help on tree maps [p. 137] for more information.
If enabled in the view settings [p. 148] , every node in the allocation call tree has a size bar whose
length is proportional to the total number of allocations including all descendant nodes and
whose light-red part indicates the percentage of allocations in the current node.
Every node in the allocation call tree has textual information attached that depends on the
allocation call tree settings [p. 148] and shows
• a percentage number which is calculated with respect to the root of the tree or calling node.
• a size measurement in bytes or kB which displays the shallow size of those objects which
were allocated here (depends on cumulation view setting, see below).
• an allocation count which shows how many instances of classes and arrays have been
allocated here (depends on cumulation view setting, see below).
• a name which depends on the aggregation level:
• methods
a method name that is either fully qualified or relative with respect to to the calling method.
• classes
a class name.
• packages
a package name.
• Java EE components
the display name of the Java EE component.
• a line number which is only displayed if
• the aggregation level is set to "methods"
• line number resolution has been enabled in the profiling settings [p. 88]
• the calling class is unfiltered
Note that the line number shows the line number of the invocation and not of the method
itself.
The size and the allocation count are either cumulated for all calls below the associated node or
not, depending on the corresponding cumulation view setting [p. 148] . Note that allocations
performed in calls to filtered classes are consolidated in the first call into a filtered class.
147
If garbage collected objects are shown, you can reset the accumulated data by clicking on the
reset action in the toolbar or choosing the the Reset Garbage Collector History menu
item in the View or context menu. All garbage collector data will be cleared and the view will be
empty for the "Garbage collected objects" mode until further objects are garbage collected and
a new allocation call tree or allocation hot spots are calculated. Note that you can force garbage
collection by clicking on the garbage collector tool bar button or by selecting Profiler->Run
Garbage Collector from JProfiler's main menu.
Only recorded objects will be displayed in the allocation call tree view. See the memory section
overview [p. 139] for further details on allocation call stack recording.
The View->Take Heap Snapshot For Selection menu item and the corresponding
toolbar entry take a new snapshot, switch to the heap walker view [p. 159] and create an object
set with the currently selected class and allocation spot.
B.6.4.4.2 Allocation Call Tree Settings
The allocation call tree view settings dialog is accessed by bringing the allocation call tree [p. 145]
to front and choosing View->View Settings from JProfiler's main menu or clicking on the
corresponding
toolbar button.
The view mode can be toggled with the cumulate allocations checkbox. This sets whether
allocations should be cumulated to show all allocations below any method or not.
You can select a size scale mode for all displayed sizes:
• Automatic
Depending on the size value, it's displayed in MB, kB or bytes, in such a way that 3 significant
digits are retained.
• Megabytes (MB)
• Kilobytes (kB
• Bytes
The node description options control the amount of information that is presented in the
description of each node.
• Show size bar
If this option is checked, a size bar will be displayed whose length is proportional to the number
of allocations including all descendant nodes and whose light-red part indicates the percentage
of allocations in the current node.
• Always show fully qualified names
If this option is not checked, class names are omitted in intra-class method calls which enhances
the conciseness of the display. This option is only relevant for the "methods" aggregation
level.
• Always show signature
If this option is not checked, method signatures are shown only if two methods with the same
name appear on the same level. This option is only relevant for the "methods" aggregation
level.
The percentage calculation determines against what allocation numbers percentages are
calculated.
148
• Absolute
Percentage values show the contribution to the total number of allocations.
• Relative
Percentage values show the contribution to the parent method.
Whether the contribution is cumulated or not depends on the Cumulate allocations setting
(see above).
149
B.6.4.5 Allocation Hot Spots View
B.6.4.5.1 Allocation Hot Spots View
The allocation hot spots view shows a list of methods where objects of a selected class have
been allocated. Only methods which contribute at least 0.1% of the total number of allocations
are included. The methods are filtered according to the filter settings [p. 83] . This view is similar
to the hot spots view [p. 200] in JProfiler's CPU section [p. 193] except that it shows allocations of
class instances and arrays instead of time measurements.
Note: The notion of a hot spot is relative. Hot spots depend on the filter sets that you have
enabled in the filter settings [p. 83] . Filtered methods are opaque, in the sense that they include
allocations performed in calls into other filtered methods. If you change your filter sets you're
likely to get different hot spots since you are changing your point of view. Please see the help
topic on hot spots and filters [p. 42] for a detailed discussion.
In order to prepare allocation hot spots, you have to click on the
calculate toolbar button or
choose View->Calculate Allocation Hot Spots from JProfiler's main menu. If allocation
hot spots have already been calculated, the context sensitive menu also gives access to this
action.
Before the allocation hot spots are calculated, the allocation options dialog [p. 157] is shown.
The class or package selection as well as the selected liveness mode are displayed at the top of
the allocation call tree view.
The combo box at the top-right corner of the view allows you to treat allocations of filtered
classes in two different ways:
• show separately
Filtered classes can contribute hot spots of their own. This is the default mode.
• add to calling class
Allocations of filtered classes are always added to the calling class. In this mode, a filtered
class cannot contribute a hot spot, except if it has a thread entry method (run and main
methods).
With these two modes you can change your viewpoint and the definition of a hot spot. Please
see the help topic on hot spots and filters [p. 42] for a detailed discussion of this topic.
Depending on your selection of the aggregation level, the method hot spots will change. They
and their hot spot backtraces will be aggregated into classes or packages or filtered for Java EE
component types.
Every hot spot is described in several columns:
• a name which depends on the aggregation level:
• methods
a method name that is either fully qualified or relative with respect to to the calling method.
• classes
a class name.
• packages
a package name.
• Java EE components
the display name of the Java EE component.
150
• the percentage of all allocations together with a bar whose length is proportional to this
value.
• the number of allocations.
The hot spot list can be sorted on all columns [p. 133] .
If you click on the
handle on the left side of a hot spot, a tree of backtraces will be shown.
Every node in the backtrace tree has textual information attached to it which depends on the
allocation hot spots view settings [p. 154] .
• the percentage of all allocations. This value is calculated with respect either to the parent hot
spot or the called method. The percentage base can be changed in the allocation hot spots
view settings [p. 154] .
• the number of allocations that are contributed to the hot spot along this call path. If enabled
in the view settings, every node in the hot spot backtraces tree has a size bar whose length
is proportional to this number.
Note: This is not the number of allocations in this method.
• a name which depends on the aggregation level:
• methods
a method name that is either fully qualified or relative with respect to to the calling method.
• classes
a class name.
• packages
a package name.
• Java EE components
the display name of the Java EE component.
• a line number which is only displayed if
• the aggregation level is set to "methods"
• line number resolution has been enabled in the profiling settings [p. 88]
• the calling class is unfiltered
Note that the line number shows the line number of the invocation and not of the method
itself.
JProfiler automatically detects Java EE components [p. 90] and displays the relevant nodes in
the hot spot backtraces tree with special icons that depend on the Java EE component type:
servlets
JSPs
EJBs
For certain classes, JProfiler shows a display name:
151
• JSPs
the path of the JSP source file
• EJBs
the name of the EJB interface
• RMI proxies
the name of the remote interface
• Web service proxies
the QName of the end point
If URL splitting is enabled in the servlet probe [p. 104] each request URL creates a new node with
a
special icon and the prefix URL:, followed by the part of the request URL on which the hot
spot backtraces tree was split. Note that URL nodes group request by the displayed URL.
The allocation hot spots view has an aggregation level selector. It allows you to switch between
• methods
Every node in the tree is a method call. This is the default aggregation level. Special Java EE
component methods have their own icon (see above) and display name, the real class name
is appended in square brackets.
• classes
Every node in the tree is a single class. Java EE component classes have their own icon (see
above) and display name, the real class name is appended in square brackets.
• packages
Every node in the tree is a single package. Sub-packages are not included.
• Java EE components
Every node in the tree is a Java EE component [p. 90] . If the component has a separate
display name, the real class names are omitted.
When you switch between two aggregation levels, JProfiler will make the best effort to preserve
your current selection. When switching to a a more detailed aggregation level, there may not
be a unique mapping and the first hit in the hot spot backtraces tree is chosen.
The hot spot backtraces tree doesn't display all method calls in the JVM, it only displays
• unfiltered classes
Classes which are unfiltered according to your configured filter sets [p. 83] are used for the
construction of the hot spot backtraces tree.
• first level calls into unfiltered classes
Every call into a filtered class that originates from an unfiltered class is used for the construction
of the hot spot backtraces tree. Further calls into filtered classes are not resolved. This means
that a filtered node can include information from other filtered calls. Filtered nodes are painted
with a red marker in the top left corner.
• thread entry methods
The methods Runnable.run() and the main method are always displayed, regardless of the
filter settings.
152
When navigating through the hot spot backtraces tree by opening method calls, JProfiler
automatically expands methods which are only called by one other method themselves.
To quickly expand larger portions of the hot spot backtraces tree, select a method and choose
View->Expand Multiple Levels from the main window's menu or choose the
corresponding menu item from the context menu. A dialog is shown where you can adjust the
number of levels (20 by default) and the threshold in per mille of the parent node's value that
determines which child nodes are expanded.
If you want to collapse an opened part of the hot spot backtraces tree, select the topmost
method that should remain visible and choose View->Collapse All from the main window's
menu or the context menu.
If a method node is selected, the context menu allows you to quickly add a method trigger [p.
94] for the selected method with the
add method trigger action. A dialog [p. 102] will be
displayed where you can choose whether to add the method interception to an existing method
trigger or whether to create a new method trigger.
Nodes in the hot spot backtraces tree can be hidden by selecting them and hitting the DEL key
or by choosing Hide Selected from the context menu. Percentages will be corrected accordingly
as if the hidden node did not exist.
When you hide a node, the toolbar and the context menu will get a
Show Hidden action.
Invoking this action will bring up a dialog where you can select hidden elements to be shown
again.
For method, class or package nodes, the context menu and the View menu have an Add Filter
From Selection entry. The sub-menu contains actions to add appropriate filters [p. 83] as well
as an action to add an ignored method entry [p. 86] .
If a node is excluded, you will get options to add an inclusive filter, otherwise you will get options
to add an exclusive filter. These actions are not available for classes in the "java." packages.
By marking the current state, you can follow the evolution of the allocation hot spots. This is
particularly useful for quickly finding the origin of memory leaks. Marking the current values can
be achieved by
• choosing View->Mark Current Values from JProfiler's main menu
• choosing the corresponding
toolbar entry
• choosing Mark Current Values from the context menu
Upon marking, a fourth column labeled Difference appears with all values initially set to zero.
With each subsequent calculation of the allocation hot spots, the column's values track the
difference of the allocation count with respect to the point in time where the mark was set. The
graphical representation of the percentage column shows the marked state in green and positive
differences in red.
By default, the difference column is sorted on the absolute values in it, this can be changed in
the allocation hot spots view settings dialog [p. 154] .
You can remove the mark by
• choosing View->Remove Mark from JProfiler's main menu
• choosing Remove Mark from the context menu
153
If garbage collected objects are shown, you can reset the accumulated data by clicking on the
reset action in the toolbar or choosing the the Reset Garbage Collector History menu
item in the View or context menu. All garbage collector data will be cleared and the view will be
empty for the "Garbage collected objects" mode until further objects are garbage collected and
a new allocation call tree or allocation hot spots are calculated. Note that you can force garbage
collection by clicking on the garbage collector tool bar button or by selecting Profiler->Run
Garbage Collector from JProfiler's main menu.
Only recorded objects will be displayed in the allocation hot spots view. See the memory section
overview [p. 139] for further details on allocation call stack recording.
The View->Take Heap Snapshot For Selection menu item and the corresponding
toolbar entry take a new snapshot, switch to the heap walker view [p. 159] and create an object
set with the currently selected class and allocation hot spot.
B.6.4.5.2 Allocation Hot Spots View Settings
The allocation hot spots view settings dialog is accessed by bringing the allocation hot spots [p.
150] to front and choosing View->View Settings from JProfiler's main menu or clicking on the
corresponding
toolbar button.
You can select a size scale mode for all displayed sizes:
• Automatic
Depending on the size value, it's displayed in MB, kB or bytes, in such a way that 3 significant
digits are retained.
• Megabytes (MB)
• Kilobytes (kB
• Bytes
The node description options control the amount of information that is presented in the
description of each node.
• Show size bar
If this option is checked, a size bar will be displayed whose length is proportional to the number
of allocations that was contributed to the hot spot along the particular call path.
• Always show fully qualified names
If this option is not checked, class name are omitted in intra-class method calls which enhances
the conciseness of the display. This option is only relevant for the "methods" aggregation
level.
• Always show signature
If this option is not checked, method signatures are shown only if two methods with the same
name appear on the same level. This option is only relevant for the "methods" aggregation
level.
The percentage calculation determines against what allocation numbers percentages are
calculated for the hot spot backtraces.
• Absolute
Percentage values show the contribution to the total number of allocations.
154
• Relative
Percentage values show the contribution relative to the called method.
The sorting of the difference column can be toggled between absolute value ordering or
normal ordering.
155
B.6.4.6 Class Tracker
B.6.4.6.1 Class Tracker View
The class tracker view can contain an arbitrary number of graphs that show instances of selected
classes and packages versus time.
In order to start tracking classes, you have to click on the
record toolbar button or choose
View->Record Class Tracker Data from JProfiler's main menu.
Before class tracking is started, the class tracker options dialog [p. 156] is shown. The selected
classes and packages are shown in a combo box, the object type (all objects or recorded objects)
and liveness mode (for recorded objects only) selections are shown at the top of the class tracker
view.
After class tracking is started, the record button becomes a
recording for all feeds.
stop button that allows to to end
Data display and zoom controls are equivalent to those in the VM telemetry views [p. 231] . Always
one class or package is displayed as a graph (a single "feed"), the combo box above the graph
allows you to switch between the recorded classes and packages. With the add and remove
buttons you can add and remove classes and package recordings without disrupting the recording
of other feeds. The graph for each feed always starts at the point in time when a feed has been
added. When you remove a feed, all associated data is deleted.
Stopping class tracking and re-starting it again at a later point does not delete previously recorded
data unless the object type or liveness mode (for recorded objects) are changed.
The selection of classes and packages for the class tracker as well as the selected object type (all
objects or recorded objects) and liveness type is persistent for a session, across restarts of
JProfiler.
B.6.4.6.2 Class Tracker Options Dialog
The class tracker options dialog is displayed if you execute the
record action for the class
tracker view [p. 156] . It allows you to specify parameters that determine the way the displayed
instance counts are calculated. Your selection will be displayed at the top of the class tracker.
The
add button brings up the class and package selection dialog [p. 157] that allows you to
select either a class or a package for addition to the list of classes and packages that should be
tracked. With the
remove button and the
reorder buttons you can change the contents
of that list before the tracking is started.
The class tracker view itself offers
add and
remove buttons in the top right corner as well.
You can select whether to use the total number of objects [p. 140] in the heap as the value for
the graph or only the recorded objects [p. 142] .
If you track recorded objects, you can select their liveness which is explained in the help for the
recorded objects view [p. 142] .
When you click on [OK], tracking is started on the selected classes and packages and the graph
for the first element in the list is displayed.
B.6.4.6.3 Class Tracker View Settings
The class tracker view settings dialog is accessed by bringing the class tracker [p. 156] to front
and choosing View->View Settings from JProfiler's main menu or clicking on the corresponding
toolbar button.
This view settings dialog is equivalent to the VM telemetry view settings dialog [p. 232] .
156
B.6.4.7 Allocation Options Dialog
The allocation options dialog is displayed if you execute the calculate action for the allocation
call tree view [p. 145] or the allocation hot spots view [p. 150] . It allows you to specify parameters
that determine the information contained in the call tree. Your selection will then be displayed
at the top of both views. The allocation call tree and the allocation hot spots are always calculated
together, so the settings in this dialog apply to both views.
The allocation call tree and allocation hot spots can display:
• Cumulated allocations for all classes
The allocation call tree and the allocation hot spots will show all allocations, regardless of the
class or array type.
• Allocations for a selected class or package
Use the [...] chooser button to select a class or package that should be displayed by the
allocation call tree and the allocation hot spots views. This brings up the class selection dialog
[p. 157] .
If the allocation recording mode [p. 91] is set to "Live and GCed objects without class resolution",
it is not possible to switch to select class for the "Allocations for a selected class or package"
mode and a corresponding warning message will be displayed.
The allocation call tree can show objects according to their liveness status:
• Live objects
Only objects which are currently in memory are shown.
• Garbage collected objects
Only objects which have been garbage collected are shown.
• Live and garbage collected objects
All created objects are shown.
If the allocation recording mode [p. 91] is set to "Live objects only", it is not possible to switch
to view modes with garbage collected objects and a corresponding warning message will be
displayed.
By default, the data in the allocation call tree and allocation hot spots views will not be updated
automatically. If you would like to periodically update the views with the current data, select the
Auto-update the allocation views check box. Please note that for large heaps this can
incur a significant performance overhead.
When you click on [OK], the allocation tree and the allocation hot spots are calculated. If you
have a large heap, this can take a few seconds. If you click cancel, no new allocation tree and
allocation hot spots will be calculated.
B.6.4.8 Class And Package Selection Dialog
The class and package selection dialog is shown when JProfiler prompts you to select a class or
package.
The tree view displays all arrays and classes in a hierarchical package tree. You can select
• Classes
A single class can be chosen by double-clicking on it or selecting it in the tree and clicking [OK]
or pressing the Enter key.
157
• Packages
An entire package and all its recursively contained sub-packages can be chosen by selecting
the desired package in the tree and clicking [OK] or pressing the Enter key.
• Arrays
An array type can be chosen by opening the <Arrays> top level node and double-clicking on
the desired array type or selecting it and clicking [OK] or pressing the Enter key.
You can leave the dialog by pressing Escape or clicking [Cancel].
158
B.6.5 Heap Walker
B.6.5.1 Heap Walker View Section
With the heap walker, you can find memory leaks, look at single instances and flexibly select and
analyze objects in several steps.
Important notions are
• the current snapshot
The heap walker operates on a static snapshot of the heap which is taken by
• clicking on the corresponding
toolbar button
• using the "Take heap snapshot for selection" action in the memory views [p. 139] .
If a snapshot has already been taken, it will be discarded after confirmation. If the current
session [p. 76] is detached [p. 126] , it is not possible to take a new snapshot, Taking a snapshot
may take from a few seconds to a few minutes depending on the heap size of the profiled
application.
A bookmark [p. 134] will be added when a heap snapshot is taken manually.
Note that you can also use a trigger [p. 94] and the "Trigger heap dump" action [p. 98] to
take a snapshot. This is especially useful for offline profiling [p. 265] .
• the initial object set
After a snapshot has been fully prepared, you are taken to the the classes view [p. 164] and
all objects in the snapshot are displayed. You can return to this view at any later point by
• choosing View->Heap Walker Start View from JProfiler's main menu
• clicking on the the corresponding
toolbar button
• the current object set
After each selection step a new object set is created which then becomes the current object
set. Starting with the initial object set, you add selection steps and change the current object
set to drill down toward your objective. The contents of the current object set (any number
of instances of classes and arrays) are described in the title area of the heap walker.
You can calculate the retained size and the deep size of the entire object set by clicking on
the "Calculate retained and deep sizes" hyperlink in the title area. Once the calculation is
finished, the hyperlink is replaced with the results. This action is not available for the initial
set of all objects where the shallow size is equivalent to the retained and deep sizes.
You can create a new object set with the objects that are retained by the current object set
by clicking on the "Use retained objects" hyperlink in the title area. Retained objects are all
objects that would be garbage collected if the entire current object set would be removed
from memory. This always includes the current object set itself. This action is not available
for the initial set of all objects where the set of retained objects and the current object set are
the same.
The history of your selection steps can be shown at the bottom by clicking on the the
corresponding
toolbar button
• the view on the current object set
All views share the same basic layout [p. 162] . There are 5 top-level views which show
information on the current object set:
159
• the classes view [p. 164]
• the allocation view [p. 166]
• the biggest objects view [p. 168]
• the reference view [p. 171]
• the time view [p. 181]
In addition there are two more views:
• the inspections view [p. 182] which shows inspection that operate on the current object
set
• the graph [p. 187] which does not show data from the current object set. You can add objects
from the reference and biggest objects views that are not cleared when you add selection
steps.
The view is chosen either
• using the view selector at the bottom of the heap walker.
• or from the view helper dialog [p. 191] that is displayed each time a new object set is created.
You can suppress this dialog in the heap walker view settings [p. 191] .
• the three types of size measurements
The title area of the heap walker displays several sizes for single objects or object sets. All
sizes include only the object data, they do not include internal JVM structures for classes, nor
do they include class data or local variables.
• shallow size
The shallow size does not include the size of referenced arrays and instances but only the
size of the corresponding pointers. Shallow sizes are trivially available for all objects and
object sets and are displayed in all views.
• retained size
The retained size is calculated as the shallow size plus total size of all objects that would
be garbage collected if the current object or object set were removed. This size tells you
how much memory is really behind an object or object set. Retained size calculation is done
for all objects when the heap dump is processed. Retained sizes are shown for single
instances in several views.
• deep size
The deep size is calculated as the shallow size plus total size of all referenced objects. In
extreme cases, this value may be a significant percentage of the entire heap. Deep size
calculation is only available for the current object set.
The
history controls of the heap walker in JProfiler's toolbar allow you to go backward and
forward in the history of your view changes. View changes where selection steps were
performed, as well as those performed through the view selector are recorded in the history.
Changing the current object set is done by clicking on the [Use selected] buttons in the heap
walker views. You first select objects of interest and then use this button to create a new object
set that contains only these objects. In many cases you can double click on an item to create a
new object set with it.
160
The heap walker can only display allocation call stack information for recorded objects. See the
memory section overview [p. 139] for further details.
B.6.5.2 Heap Snapshot Option Dialog
The heap snapshot options dialog is displayed each time before the actual heap snapshot [p.
159] is taken. The dialog has two tabs, grouping all overhead-related options on the second tab.
If the Select recorded objects option is checked, the heap walker will restrict the heap snapshot
to recorded objects only. In this way you can focus on the objects that have been created during
a selected time span. If the option is unchecked, all objects on the heap will be shown (excluding
any objects removed by the overhead options below).
The overhead options are:
• Remove unreferenced and weakly referenced objects
If this option is checked, JProfiler will remove all objects from the heap that are not strongly
referenced. These include:
• unreferenced objects that are eligible for garbage collection
• objects that are referenced only through soft, weak and phantom references
• objects that are in the finalizer queue and will be garbage collected as soon as the finalizers
have been run
For strongly referenced objects, the heap walker will not display soft, weak and phantom
references.
This mode is preferable for memory leak detection, and is especially helpful to obtain useful
information when showing the path to root [p. 179] for selected objects. Deselecting this option
reduces the time for processing the heap snapshot and allows you to analyze the heap "as-is".
Note: With Java >= 1.5.0, unreferenced objects are not shown by the heap walker. The dynamic
memory views like the all objects view [p. 140] and the recorded objects view [p. 142] can
therefore show higher instance counts.
• Calculate retained sizes
Calculating retained sizes adds memory overhead while the heap snapshot is processed and
can take some time for large heap snapshots. If you experience memory problems when
taking heap snapshot or if you want the heap snapshot processing to take less time, you can
deselect this option. In that case, no retained sizes will be available. Also, the biggest objects
view [p. 168] will not be available.
Retained sizes can only be calculated if the "Remove unreferenced and weakly referenced
objects" is selected.
• Record primitive data
Note: This option is only visible when you profile with Java 1.6+ (JVMTI 1.1). With Java 1.5 (JVMTI
1.0), primitive data is not recorded.
If this option is checked, the heap walker will record primitive data and display string values
and values of primitive fields in the reference views [p. 171] .
Deselecting this option will save memory and is advisable if you experience memory problems
when taking heap snapshot. If primitive data is not recorded, it will be requested on demand
in a live session, depending on whether the object still exists. The data may not be the same
as at the time of the heap snapshot in that case. These on-demand requests only work for
Java 1.5+. For Java 1.4, the outgoing references view [p. 171] will display N/A for primitive values.
161
B.6.5.3 Heap Walker View Layout
All heap walker views [p. 159] share the same basic layout:
The description of the current object set shows
• what kind of objects are in the current object set. If there is more than one class or array
type in the current object set, a cumulative count will be given separately for class instances
and arrays. As it is often the case, if all objects are of a single class or array type, the class
name or array type will be displayed.
• how many selection steps have occurred so far. This gives an idea of the complexity of the
current selection.
• how much space the current object set uses on the heap. Note that this is the shallow size
which does not include the sizes of referenced arrays and class instances.
Most screens in the heap walker have more than one view mode. The drop-down list in the
top-left corner give access to different related views. For example, the reference view has 4
different view mode, for outgoing and incoming references as well as for cumulated outgoing
and cumulated incoming references.
With the selection button you can add another selection step. A new object set that contains
only the currently selected objects will be created. Some views offer more than one way to add
a selection step in a drop-down menu.
The main portion of the screen displays the specific content of the current view.
The selection history shows all selection steps that have occurred so far. The selection history
pane is a vertical split pane and can be resized to the most convenient size. You can toggle the
visibility of the selection history window by
162
• choosing View->Show Selection Steps from JProfiler's main menu
• clicking on the corresponding
toolbar button
The view selector allows you to switch between the six different views without changing the
current object set. The views show
• the classes [p. 164] in the current object set
• the allocation spots [p. 166] of the current object set
• the biggest objects [p. 168] in the current object set
• the references [p. 171] of the current object set
• a graph of allocation times [p. 181] of the current object set
• a list of inspections [p. 182] that can be performed on the current object set
• the graph [p. 187] where objects from different object sets can be added. This view is different
from the others in that is does not only show data from the current object set.
163
B.6.5.4 Classes View
B.6.5.4.1 Heap Walker - Classes
The heap walker classes view conforms to the basic layout [p. 162] of all heap walker views. Also
see the help on key concepts [p. 159] for the entire heap walker.
The functionality of the classes view is identical to that of the all objects view [p. 140] and the
recorded objects view [p. 142] except that it is static with respect to the current snapshot and
only instances of classes and arrays in the current object set are shown.
If you have multiple classes with the same name from different classloaders and want to
differentiate between those classes, you have to navigate to a specific instance, go to the
references view [p. 171] of the heap walker and continue with the class selection as described
there.
No specific view settings apply to the classes view.
The classes view has an aggregation level selector. It allows you to switch between
• Classes
Every row in the table is a single class. This is the default aggregation level.
• Packages
Every row in the table is a single package. Sub-packages are not included. In this aggregation
level, the table becomes a tree table. You can open each package by clicking on the tree node
on its left and see the contained classes directly beneath it.
• Java EE components
Every row in the table is a Java EE component [p. 90] . This aggregation level is like a filter for
the classes mode and enables you to quickly check the loaded Java EE components in your
profiled application.
There are three sortable columns shown in the table:
• Name
Depending on the aggregation level, this column shows different values:
• classes
shows the name of the class or the array type.
• package
shows the name of the package.
• Java EE
shows the display name of the Java EE component. If the display name is different from the
actual class name, the class name is displayed in square brackets.
• Instance count
Shows how many instances are currently allocated on the heap. This instance count is displayed
graphically as well.
• Size
Shows the total size of all allocated instances. Note that this is the shallow size which does
not include the size of referenced arrays and instances but only the size of the corresponding
pointers. The size is in bytes and includes only the object data, it does not include internal
JVM structures for the class, nor does it include class data or local variables.
164
By default, the classes view only shows the shallow size of the selected objects for each class.
To calculate the retained size on a per-class basis, click on the "Calculate estimated retained
sizes" link above the table. A new column for the retained sizes will be added.
Apart from the values for primitive arrays, all retained sizes are lower bounds. The algorithm is
much faster than for a precise calculation and good enough in most cases. If you need the exact
retained size on a per-class basis, make a new object set with the class of interest and click on
the "Calculate retained and deep sizes" link in the object set description at the top.
To add a selection step from this view you can select one or multiple rows from the table and
click on the [Use ...] button above the table. In the drop-down menu you can decide whether to
use the
• Selected instances
The new object set will consist of all objects of the selected classes. For a single class, you can
also double-click on a row in the table.
• Selected java.lang.Class objects
The new object set will consist of all java.lang.Class objects of the selected classes.
• Retained objects
The new object set will consist of all objects that are retained by the current object set. Retained
objects are all objects that would be garbage collected if the entire current object set would
be removed from memory. This always includes the current object set itself.
After your selection, the view helper dialog [p. 191] will assist you in choosing the appropriate
view for the new object set.
Next to the [Use ...] button, a button [Group by Class Loaders] is shown. This button invokes
the group by class loaders inspection [p. 182] and is just a convenience that emphasizes the
importance of that inspection for solving class loader memory leaks.
After the inspection completes, the classes view will be shown again, with a class loader grouping
at the top. You can select each class loader and see the loaded classes immediately in the classes
table. By right-clicking a class loader row, you can select the class loader object and create a new
object set with it.
165
B.6.5.5 Allocation View
B.6.5.5.1 Heap Walker - Allocations
The heap walker allocation view conforms to the basic layout [p. 162] of all heap walker views.
Also see the help on key concepts [p. 159] for the entire heap walker.
The allocation view of the heap walker offers four view modes that can be changed in the
drop-down list at in the top-left corner:
• Cumulated allocation tree [p. 166]
Shows the allocation tree for the current object set. Each method node includes the allocations
from all descendant method nodes.
• Allocation tree [p. 166]
Shows the allocation tree for the current object set. Each method node only includes the
allocations in that particular method.
• Allocation tree map [p. 166]
Shows the allocation tree map for the current object set.
• Allocation hot spots [p. 167]
Shows the allocation hot spots for the current object set.
B.6.5.5.2 Heap Walker Allocation View - Allocation Tree
The contents and functionality of the allocation tree view mode correspond to those of the
allocation call tree [p. 145] in the memory view section [p. 139] . Contrary to the allocation call
tree, only allocations in the current object set are shown. You can customize this view through
the heap walker view settings [p. 191] .
The heap walker will be able to display allocation information only for recorded objects,
unrecorded objects are summed up in a top-level entry called unrecorded objects. See the
memory section overview [p. 139] for further details.
To add a selection step from this view you can select one or multiple allocation spots from the
table and click the [Use selected] button above the table.
A new object set will be created that contains
• all instances of classes and arrays allocated in the selected allocation spots and in allocation
spots below for the "cumulated allocation tree" view mode.
• only the instances of classes and arrays allocated in the selected allocation spots for the
"allocation tree" view mode.
After your selection, the view helper dialog [p. 191] will assist you in choosing the appropriate
view for the new object set.
Note: If you wish to see the allocations performed in a node regardless on what call sequence
has lead to this node, you can switch to the allocation hot spots view mode [p. 167] .
B.6.5.5.3 Heap Walker Allocation View - Allocation Tree Map
The contents of the allocation tree map is an alternate visualization of the allocation tree [p. 166]
. The tree map shows all call stacks as a set of nested rectangles. Please see the help on tree
maps [p. 137] for more information.
166
The heap walker will be able to display allocation information only for recorded objects,
unrecorded objects are summed up in a top-level rectangle called unrecorded objects. See
the memory section overview [p. 139] for further details.
To add a selection step from this view you can select one or multiple allocation spots in the tree
map and click the [Use selected] button above the tree map.
A new object set will be created that contains all instances of classes and arrays allocated in the
selected allocation spots. After your selection, the view helper dialog [p. 191] will assist you in
choosing the appropriate view for the new object set.
B.6.5.5.4 Heap Walker Allocation View - Allocation Hot Spots
The contents and functionality of the allocation hot spots list are similar to those of the allocation
hot spots view [p. 150] in the memory view section [p. 139] . Contrary to that view, only allocations
in the current object set are shown. You can customize this view through the heap walker view
settings [p. 191] .
The heap walker will be able to display allocation information only for recorded objects,
unrecorded objects are summed up in a top-level entry called unrecorded objects. See the
memory section overview [p. 139] for further details.
To add a selection step from this view you can select one or multiple allocation hot spots or parts
of their back traces from the table and click the [Use selected] button above the table.
A new object set will be created that contains all instances of classes and arrays allocated in the
selected hot spots. If nodes in back traces are selected, all objects that contribute to the hot spot
along the selected paths are included. After your selection, the view helper dialog [p. 191] will
assist you in choosing the appropriate view for the new object set.
167
B.6.5.6 Biggest Objects View
B.6.5.6.1 Heap Walker - Biggest Objects View
The heap walker biggest objects view conforms to the basic layout [p. 162] of all heap walker
views. Also see the help on key concepts [p. 159] for the entire heap walker.
The biggest objects view shows a list of the biggest objects in in the current object set. The table
shows the following information:
• The first column shows the name of the object's class and the ID of the object
• The second column shows the object's retained size together with a bar visualizing the relative
importance of that number with the respect to all the objects that are shown. Also, a percentage
number is shown that indicates how much of the total used heap size is retained by this object.
Please see the key concepts of the heap walker [p. 159] for an explanation of retained size.
Each object can be expanded to show outgoing references to other objects that are retained by
this object. In this way, you can recursively expand the tree of retained objects (also called a
"dominator tree") that would be garbage collected if the one of the parents were to be removed.
The information displayed for each object in this tree is similar to the outgoing reference view
[p. 171] , except that only dominating references are displayed.
Not all dominated objects are directly referenced by their dominators. For example, consider
the references in the following figure:
Object A dominates objects B1 and B2, it does not have a direct reference to object C. Both B1
and B2 reference C. Neither B1 nor B2 dominates C, but A does. In this case, B1, B2 and C are
listed as direct children of A in the dominator tree, and C will not be listed a child of B1 and B2.
For B1 and B2, the field names in A by which they are held are displayed. For C, [transitive
reference] is displayed on the reference node.
At the left side of each reference node in this tree, a size bar shows how many percent of the
retained size of the top-level object heap are still retained by the target object. The numbers will
decrease as you drill down further into the tree. In the view settings [p. 191] , you can change the
percentage base to the total heap size.
The dominator tree has a built-in cutoff that eliminates all objects that have a retained size that
is lower than 0.5% of the retained size of the parent object. This is to avoid excessively long lists
of small dominated objects that distract from the important objects. If such a cutoff has been
performed, a
cutoff child node will be shown that notifies you about the number of objects
that are not shown on this level, their total retained size and the maximum retained size of the
single objects.
The view mode selector above the biggest objects view allows you to switch to an alternate
visualization: A tree map that shows all dominated objects as a set of nested rectangles. Please
see the help on tree maps [p. 137] for more information.
168
Each rectangle represents a dominated object. The area of the rectangle is proportional to its
retained size. In contrast to the tree, the tree map gives you a flattened perspective of all leafs
in the dominator tree. If you're mostly interested in big arrays, you can use the tree map in
order to find them quickly without having to dig into the branches of the tree. Also, the tree map
gives you an overall impression of the relative importance of dominated objects and the object
size distribution in the heap.
At the bottom right of the tree map you can see the total percentage of the entire heap that is
represented by the tree map. If you have not zoomed in, the remaining part of the heap is
dominated by objects that have not made it into the list of biggest objects due to the internal
threshold for retained sizes.
To analyze both incoming and outgoing references and to explore the relationship between
objects of interest, use the [Show in graph] button at the top of the view. The selected instances
will be then be added to the graph [p. 187] . The graph is not cleared when you choose a new
object set or go back in the history, so you can add objects from different object sets to the graph.
If you're profiling in live mode, the
[Show toString() values] button at the top of the view is
active. When you click it, JProfiler invokes toString() on all expanded references in the view
and shows the results. If you open more references or add more references with the hyperlink
at the bottom of the table, those objects will not have their toString() values displayed. You
will have to click the button again in order to show the missing values.
The reason why this operation is not performed automatically is that calculating toString() values
is an expensive operation that invokes Java code in the profiled JVM and may even have unwanted
side effects in buggy implementations.
To add a selection step from this view you can select one or multiple objects and click the [Use
...] button above the graph and choose in the popup menu. Multiple objects are selected by
keeping the SHIFT or CTRL keys pressed during selection. The following selection modes are
available:
• Selected Objects
A new object set will be created that contains only the selected instances.
• Selected java.lang.Class Objects
The new object set will consist of all java.lang.Class objects of the selected instances.
• Items in Selected Collection
This option is only enabled if you select an array of objects or a standard collection from the
java.util package. A new object set will be created that contains the objects in the array or
collection. If you select a map collection, you are prompted whether you want to include the
key objects as well.
• Loaded Instances By Selected Class Loader
This option is only enabled if you select one or more instances of java.lang.ClassLoader.
A new object set will be created that contains the objects whose classes have been loaded by
the selected class loaders.
• Retained Objects
A new object set will be created that contains all objects that would be garbage collected if
the selected objects did not exist on the heap. This always includes the selected objects.
After your selection, the view helper dialog [p. 191] will assist you in choosing the appropriate
view for the new object set.
169
B.6.5.6.2 Dependency Of The Biggest Objects View On Retained Size Calculation
If "Calculate retained sizes" has not been enabled for the heap dump, the biggest objects view
[p. 168] will not be available. For the "Calculate retained sizes" option to be effective, the "Remove
unreferenced and weakly referenced" option has to be enabled for the heap dump as well.
Both these options are "overhead options" intended to speed up the heap dump and use less
memory. The cost of this lower overhead includes the loss of the biggest objects view. By default,
both options are are enabled.
The "Calculate retained sizes" option can be enabled in the
• heap walker options dialog [p. 161] , if the heap dump is taken manually.
• the configuration of the "Trigger heap dump" [p. 98] action, if the heap dump is taken by a
trigger.
• the parameters passed to the triggerHeapDump method of the Controller class in the
profiling API, if the heap dump is taken programatically.
170
B.6.5.7 Reference View
B.6.5.7.1 Heap Walker - Reference View
The heap walker reference view conforms to the basic layout [p. 162] of all heap walker views.
Also see the help on key concepts [p. 159] for the entire heap walker.
The reference view of the heap walker offers three view modes that can be changed in the
combo box at the top of the view:
• Outgoing references [p. 171]
Shows a tree of the outgoing references separately from all objects in the current object set.
• Incoming references [p. 173]
Shows a tree of the incoming references separately to all objects in the current object set.
• Cumulated incoming references [p. 176]
Shows a tree-table of the cumulated references that hold the objects in the current object set.
• Cumulated outgoing references [p. 178]
Shows a tree-table of the cumulated references that originate from objects in the current
object set.
The reference view helps you to find memory leaks. Please note the "Show path to GC root"
functionality in the incoming references [p. 173] for this purpose.
Incoming references in the reference view show compact paths for for some well-known
collections with an internal reference structure. For linked lists, the "collection content" reference
shown in the screen shot points directly from the linked list to the list item. If you search for
paths to garbage collector roots, the found paths can be interpreted much more clearly that
way.
Compact paths are also shown for hash maps and tree maps>. This is especially important in
the cumulated incoming reference view, because the internal reference structure of those
collections could fragment collection content into many blocks, thereby preventing a
comprehensive analysis of the incoming references. Also, hash maps are very common in
reference chains and the "map key" and "map value" nodes are much more descriptive than the
internal structure.
B.6.5.7.2 Heap Walker Reference View - Outgoing References
The outgoing references view shows instances in the current object set. Each instance can be
opened to show outgoing references as well as primitive data.
The table only concerns the top-level instances and shows the following sortable columns:
• Retained size
The amount of memory that would be freed if the object were removed from the heap.
• Shallow size
The amount of memory directly used by the object.
• Allocation time
The time when the object was allocated. This information is only available if allocation time
recording is enabled in the profiling settings [p. 91] .
171
The number of top-level objects that are shown is limited to 100 by default. You can add more
objects with the hyperlink after the last row in the table. The default number of objects can be
adjusted in the view settings [p. 191] .
Each reference node consists of three parts:
• Field name
The field name of the object in the parent node that holds the referenced object
• Reference icon
The reference icon separates the holder from the referenced object. The icon is one of
•
•
A regular reference.
A reference from an object that is already present as an ancestor node. This indicates a
reference cycle. Cycles are more conveniently analyzed in the graph view [p. 187]
• Referenced object
This is the object referenced by the outgoing reference. Direct child references below this
node refer to this object.
Each object is optionally annotated with an object ID. With this ID, you can check whether two
objects are the same or not. The display of IDs can be switched off the the context menu and
the view settings [p. 191] .
The [Apply filter ...] menu at the top of the view allows you to filter the current object set.
Filters are always applied to the top-level objects, i.e. the objects that are actually part of the
current object set.
When you open outgoing references and select a reference or a primitive value, the filter uses
the selected node as the criterion. Top-level objects that do not have a path of outgoing references
such as the selected path, are discarded by the filter.
If a non-primitive value is selected, and you are profiling in live mode, you can apply a filter with
a code snippet. In the script, you can use the object parameter to write your filter expression.
The objects that are passed to your script are on the same level as the one that you have selected.
Return true if the associated top-level object should be retained, otherwise it will be discarded.
If you want to filter repeatedly with the same expression, don't forget the script history feature
of the script editor [p. 122] .
If you have selected a top-level object, the parameter is only typed if all objects in the current
object set have the same class. Also, in that case the result is equivalent to running the custom
filter inspection [p. 182] on the current object set.
Alternatively, you can apply a filter by restricting the selected value. If you are profiling in live
mode, you can perform a match against the result of the toString() method of the selected
objects. If you have selected a reference which is not at the top level, you can also filter by null
references or non-null references. For primitive values, you can restrict the value by settings
bounds or testing for equality. All text fields where you can enter values have a drop down list
with a history that is persistent across sessions.
To analyze both incoming and outgoing references and to explore the relationship between
objects of interest, use the [Show in graph] button at the top of the view. The selected instances
will be then be added to the graph [p. 187] . The graph is not cleared when you choose a new
object set or go back in the history, so you can add objects from different object sets to the graph.
172
If you're profiling in live mode, the
[Show toString() values] button at the top of the view is
active. When you click it, JProfiler invokes toString() on all expanded references in the view
and shows the results. If you open more references or add more references with the hyperlink
at the bottom of the table, those objects will not have their toString() values displayed. You
will have to click the button again in order to show the missing values.
The reason why this operation is not performed automatically is that calculating toString() values
is an expensive operation that invokes Java code in the profiled JVM and may even have unwanted
side effects in buggy implementations.
To add a selection step from this view you can select one or multiple objects and click the [Use
...] button above the graph and choose in the popup menu. Multiple objects are selected by
keeping the SHIFT or CTRL keys pressed during selection. The following selection modes are
available:
• Selected Objects
A new object set will be created that contains only the selected instances.
• Selected java.lang.Class Objects
The new object set will consist of all java.lang.Class objects of the selected instances.
• Items in Selected Collection
This option is only enabled if you select an array of objects or a standard collection from the
java.util package. A new object set will be created that contains the objects in the array or
collection. If you select a map collection, you are prompted whether you want to include the
key objects as well.
• Loaded Instances By Selected Class Loader
This option is only enabled if you select one or more instances of java.lang.ClassLoader.
A new object set will be created that contains the objects whose classes have been loaded by
the selected class loaders.
• Retained Objects
A new object set will be created that contains all objects that would be garbage collected if
the selected objects did not exist on the heap. This always includes the selected objects.
After your selection, the view helper dialog [p. 191] will assist you in choosing the appropriate
view for the new object set.
B.6.5.7.3 Heap Walker Reference View - Incoming References
The incoming references view shows instances in the current object set. Each instance can be
opened to show incoming references.
The table only concerns the top-level instances and shows the following sortable columns:
• Retained size
The amount of memory that would be freed if the object were removed from the heap.
• Shallow size
The amount of memory directly used by the object.
• Allocation time
The time when the object was allocated. This information is only available if allocation time
recording is enabled in the profiling settings [p. 91] .
173
The number of top-level objects that are shown is limited to 100 by default. You can add more
objects with the hyperlink after the last row in the table. The default number of objects can be
adjusted in the view settings [p. 191] .
Each reference node has one or two icons. The first icon is one of
•
a regular reference.
•
a reference expanded by the search to garbage collector root (see below).
•
a reference from an object that is already present as an ancestor node. This indicates a
reference cycle. Cycles are more conveniently analyzed in the graph view [p. 187]
The second icon is either not present or one of
•
a reference from a class.
In most circumstances, classes are the last step on the path to the GC root that you are
interested in. Classes are not garbage collector roots, but in all situations where no custom
classloaders are used it is appropriate and easier to treat them as such. This is JProfiler's
default mode when searching for garbage collector roots, you can change this in the path to
root options dialog [p. 179] .
Class objects have references to
• all implemented interfaces
• their classloader unless they were loaded by the bootstrap classloader
• all references in their constant pool
Note that class objects have no reference to their super class.
Classes are garbage collected together with their classloader when
• there is no class loaded by that classloader that has any live instances
• the classloader is unreferenced except by its classes (this is a JVM level reference and not
visible in the source of java.lang.Class).
• None of the java.lang.Class objects is referenced except by the classloader and other
classes of that classloader.
•
a garbage collector root.
A garbage collector root is an entity in the JVM that itself is not garbage collected and pins
other objects or classes. There are the following types of garbage collector roots:
• JNI references
Native code can request references from the JNI (local or global)
• stack
Local variables all current stack frames
• sticky class
The JVM itself can flag certain classes as non-garbage collectable
• thread block
Live threads are not garbage collected
174
• monitor used
A monitor that is held by someone cannot be garbage collected
• other GC root
The JVM can pin objects by attaching this unspecified GC root to them
For classes there is a special condition that prevents garbage collection: Since each instance
has an implicit reference to its class, any live instance prevents a class from being garbage
collected. This construct groups all such instances for reasons of conciseness. In this way you
can also select all instances of a specific class (rather than a specific class name).
Each object is optionally annotated with an object ID. With this ID, you can check whether two
objects are the same or not. The display of IDs can be switched off the the context menu and
the view settings [p. 191] .
To check why an instance is not garbage collected, you can select it and click the [Show paths
to GC root] button at the top of the view. The options dialog [p. 179] allows you to configure the
way JProfiler performs the search.
After the search has completed, the tree is expanded up to the garbage collector roots that were
found. If the object is not referenced by a garbage collector root, a message box will be displayed.
Note that this case is only possible if the "Remove unreferenced and weakly referenced objects"
option in the heap walker option dialog [p. 161] is unchecked.
Newly expanded nodes on the path to the GC root have a red reference icon. To highlight the
found path without any distractions, no sibling references are shown on that level. To show all
sibling references, you can either choose the Show All Incoming References action from
the context menu or View menu or collapse and expand the parent node.
To analyze both incoming and outgoing references and to explore the relationship between
objects of interest, use the [Show in graph] button at the top of the view. The selected instances
will be then be added to the graph [p. 187] . The graph is not cleared when you choose a new
object set or go back in the history, so you can add objects from different object sets to the graph.
If you're profiling in live mode, the
[Show toString() values] button at the top of the view is
active. When you click it, JProfiler invokes toString() on all expanded references in the view
and shows the results. If you open more references or add more references with the hyperlink
at the bottom of the table, those objects will not have their toString() values displayed. You
will have to click the button again in order to show the missing values.
The reason why this operation is not performed automatically is that calculating toString() values
is an expensive operation that invokes Java code in the profiled JVM and may even have unwanted
side effects in buggy implementations.
To add a selection step from this view you can select one or multiple objects and click the [Use
...] button above the graph and choose in the popup menu. Multiple objects are selected by
keeping the SHIFT or CTRL keys pressed during selection. The following selection modes are
available:
• Selected Objects
A new object set will be created that contains only the selected instances.
• Selected java.lang.Class Objects
The new object set will consist of all java.lang.Class objects of the selected instances.
175
• Items in Selected Collection
This option is only enabled if you select an array of objects or a standard collection from the
java.util package. A new object set will be created that contains the objects in the array or
collection. If you select a map collection, you are prompted whether you want to include the
key objects as well.
• Loaded Instances By Selected Class Loader
This option is only enabled if you select one or more instances of java.lang.ClassLoader.
A new object set will be created that contains the objects whose classes have been loaded by
the selected class loaders.
• Retained Objects
A new object set will be created that contains all objects that would be garbage collected if
the selected objects did not exist on the heap. This always includes the selected objects.
After your selection, the view helper dialog [p. 191] will assist you in choosing the appropriate
view for the new object set.
B.6.5.7.4 Heap Walker Reference View - Cumulated Incoming References
The cumulated incoming references show the list of all reference types through which the
instances of classes and arrays in the current object set are held. This view has two display modes
that determine how the "Object count" and the "Size" column have to be interpreted:
• Show counts and sizes of reference holders
The "Object count" and the "Size" columns refer to the objects that reference any objects in
the current object set through a certain reference type.
In this mode, the cumulated incoming reference view shows object counts, sizes and
percentages that refer to the top level entry. This makes it easy to analyze what percentage
of the current object set is held through a particular chain of references.
• Show counts and sizes of referenced objects
The "Object count" and the "Size" columns refer to the objects in the current object set that
are referenced through a certain reference type.
In this mode, each level is treated like a new independent object set.
There are three columns shown in the table, which can be sorted [p. 133] :
• Reference type
Shows the type of the incoming reference which is one of
• field
some of the objects or arrays in the current object set are held in the indicated field of an
instance of the indicated class.
• static field
some of the objects or arrays in the current object set are held in the indicated static field
of the indicated class.
• constant
some of the objects or arrays in the current object set are held in the constant pool of the
indicated class. These references mostly stem from constants declared as private static
final.
176
• object array content
some of the objects in the current object set are held in an array of instances of classes.
The arrays are of types or supertypes of the held objects. A further distinction is not possible
due to the nature of Java bytecode.
• JNI global/local reference
some of the objects or arrays in the current object set are held through the Java Native
Interface. Generally global references are persistent across a number of native calls which
local references are only valid for the duration of one native call. These references are of
interest to JNI programmers only. If you do not use any extra native libraries and encounter
these reference types nonetheless, they can be attributed to the internal state of the JVM.
In that case, there won't be any accessible objects behind these references and the Size
column will show a zero value.
• java stack
some of the objects in the current object set are held in a stack frame of a thread. Thread
and method information are shown if available.
• sticky class, thread block, unknown type
internal references in the JVM.
Note that for static fields, constants, java stack references and the internal references in the
JVM the origin of the reference do not belong to accessible objects. The Size column shows
a zero value and a filter selection is not possible for these incoming reference types.
• Object count
Depending on the display mode, shows
• Show counts and sizes of reference holders
How many objects are holding on to any object in the current object set through this
reference type and along the selected chain of references.
• Show counts and sizes of referenced objects
How many objects in the current object set are referenced through this reference type.
The reference count is displayed graphically as well.
• Size
Depending on the display mode, shows
• Show counts and sizes of reference holders
The total size of all objects that are holding on to any object in the current object set through
this reference type.
• Show counts and sizes of referenced objects
The total size of all objects in the current object set that are referenced through this reference
type.
Note that this is the shallow size which does not include the size of referenced arrays and
instances but only the size of the corresponding pointers.
No specific view settings apply to the cumulated incoming references.
The cumulated reference view is a tree table, you can open single references and view cumulated
reference chains. Multiple selection is only possible on the same level in the tree.
177
The lengths of the bars in the object count column are adjusted for the sibling nodes in the tree
(not the top level) and the colors of the bars alternate between dark and light red for descending
tree levels.
To add a selection step from this view you can
• select one or multiple references from the table and click the [Use ...] button above the table
and choose Reference Holders in the popup menu. A new object set will be created that
contains all objects that hold any object in the current object set by way of the selected
reference types.
• select one or multiple references from the table and click the [Use ...] button above the table
and choose Referenced Objects in the popup menu. A new object set will be created that
contains all objects in the current set that are held by a reference of one of the the selected
types.
• double click on a reference. Depending on the display mode, either the reference holders or
the referenced objects are selected as the new object set.
All reference types in your selection that do not lead to selectable objects are removed for the
selection step. If no selectable objects are contained in your selection, the corresponding action
will be disabled.
A new object set will be created that contains all instances of classes and arrays that reference
objects in the current object set via the selected references. After your selection, the view helper
dialog [p. 191] will assist you in choosing the appropriate view for the new object set.
B.6.5.7.5 Heap Walker Reference View - Cumulated Outgoing References
The cumulated outgoing references show the list of all reference types which originate from the
instances of classes and arrays in the current object set.
There are three columns shown in the table, which can be sorted [p. 133] :
• Reference type
Shows the type of the outgoing reference which is one of
• field
the referenced object or array is held in the indicated field of an instance of the indicated
class.
• static field
the referenced object or array is held in the indicated static field of the indicated class.
• constant
the referenced object or array is held in the constant pool of the indicated class. These
references mostly stem from constants declared as private static final.
• object array content
the referenced object or array is held in an array of instances of classes (e.g. the array might
be of type String[] or Object[]).
• Object count
Shows how many references of this outgoing reference type are present in the current object
set. The reference count is displayed graphically as well.
178
• Size
Shows the total size of the object set which would result if this reference type was added as
a filter step. Note that this is the shallow size which does not include the size of referenced
arrays and instances but only the size of the corresponding pointers.
No specific view settings apply to the cumulated outgoing references.
The cumulated reference view is a tree table, you can open single references and view cumulated
reference chains. Multiple selection is only possible on the same level in the tree.
The lengths of the bars in the object count column are adjusted for the sibling nodes in the tree
(not the top level) and the colors of the bars alternate between dark and light red for descending
tree levels.
To add a selection step from this view you can
• select one or multiple references from the table and click the [Use selected] button above
the table.
• double click on a reference.
A new object set will be created that contains all instances of classes and arrays that are referenced
by objects in the current object set via the selected references. After your selection, the view
helper dialog [p. 191] will assist you in choosing the appropriate view for the new object set.
B.6.5.7.6 Path To Root Option Dialog
The path to root option dialog is displayed after clicking the
[Show path to GC root] button
in the graph view [p. 187] and the incoming references view [p. 173] of the heap walker.
The path to root analysis can calculate:
• a single root
Only a single garbage collector root will be found. When searching for a memory leak, this
option is often appropriate since any path to a garbage collector root will prevent the instance
from being garbage collected.
• up to a certain number of roots
A specified maximum number of roots will be found and displayed. If a single root is not
sufficient, try displaying one root more at a time until you get a useful result.
• all roots
All paths to garbage collector roots will be found and displayed. This analysis takes much
longer than the single root option and can us a lot of memory.
By default, the path to root search does not follow weak references. If you would like to show
garbage collector roots that are only reachable through a weak reference, you can check the
Include weak references option.
By default the path to root search uses classes as garbage collector roots. This is not strictly
correct but valid in most situations and makes the path to root search much more usable. For
example, a static field of a class is technically not a garbage collector root, but in practice any
information about why a class is not garbage collected is not interesting. The only case were you
need a different behavior is when searching for classloader-related memory leaks. In that case,
you can deselect "Use classes as roots" to use the true garbage collector roots exclusively.
After completing the dialog with the [OK] button, the analysis will be calculated and the result
will be shown in the reference view.
179
With the [Cancel] button, the path to root option dialog is closed and no analysis is performed.
B.6.5.7.7 Restricted Availability Of The Reference View
If the initial data set of the heap walker [p. 159] is displayed, the reference view is not available.
You have to perform one selection step first. This can be one of
• selection of one or several classes [p. 164]
• selection of one or several allocation spots [p. 166]
• selection of one or several biggest objects [p. 168]
After such a selection step, the reference view will be available.
180
B.6.5.8 Time View
B.6.5.8.1 Heap Walker - Time View
The heap walker time view conforms to the basic layout [p. 162] of all heap walker views. Also
see the help on key concepts [p. 159] for the entire heap walker.
The time view shows a time-resolved histogram of object allocations. The bin size depends on
the zoom level.
This view can only be used if the "Record object allocation times" feature is activated on the
"Memory Profiling" tab [p. 91] of the profiling settings dialog [p. 87] . Allocation times are only
available for recorded objects. The number of unrecorded objects is displayed above the graph.
When you move the mouse across the time view, the time at the position of the mouse cursor
will be shown in JProfiler's status bar.
Please see the help on graphs with a time axis [p. 138] for help on common properties of graph
views.
You can select multiple time intervals by
• clicking and dragging with the mouse on the graph in the horizontal direction.
• choosing the
select up to here action from the context menu.
• choosing the
select from here action from the context menu.
• choosing the
select between bookmarks action from the tool bar right above the view or
the context menu. A dialog will be shown that allows you to select a range of bookmarks. All
objects allocated between the first selected and the last selected bookmark are selected in
the view.
You can clear your selections by clicking on the
clear selections button at the top of the view
or by selecting the corresponding action from the context menu.
To add a selection step from this view you can select one or more time intervals and click the
[Use selected] button above the graph.
A new object set will be created that contains only the instances of the selected objects. After
your selection, the view helper dialog [p. 191] will assist you in choosing the appropriate view for
the new object set.
B.6.5.8.2 Restricted Availability Of The Time View
If the initial data set of the heap walker [p. 159] is displayed, the time view is not available. You
have to perform one selection step first. This can be one of
• selection of one or several classes [p. 164]
• selection of one or several allocation spots [p. 166]
• selection of one or several biggest objects [p. 168]
After such a selection step, the time view will be available.
181
B.6.5.9 Inspections View
B.6.5.9.1 Heap Walker - Inspections View
The heap walker reference view conforms to the basic layout [p. 162] of all heap walker views.
Also see the help on key concepts [p. 159] for the entire heap walker.
The inspections view of the heap walker does not show any information on the current object
set. Rather, it displays a number of operations that will analyze the current object set in some
way. As a result of any inspection, a new object set will be created.
All available inspections [p. 182] are shown in a tree on the left side, for better usability they are
ordered into several categories. On the right side, the property panel explains the inspection,
offers configuration options for the selected inspection and shows a button to calculate it.
Since inspections can be expensive to calculate for large heaps, the results are cached. In this
way, you can go back in the history and look at the results of previously calculated inspections
without waiting. Inspections with cached results have a
special symbol in the tree and a
"Calculated" status in the property panel.
After an inspection has been calculated, the view change dialog [p. 191] will be shown. By default,
the reference view [p. 171] is recommended.
An inspection can partition the calculated object set into groups. Groups are shown in a table
at the top of the heap walker. Initially, the first row in the group table is selected. By changing
the selection, you change the current object set. For example, the "Duplicate strings" inspection
shows the duplicate string values as groups. If you are in the reference view, you can then see
the java.lang.String instances with the selected string value below.
Beside the group name column in the group table there are the following sortable columns:
• Priority
Each inspection that creates groups decides which groups are most important in the context
of the inspection. Since this does not always correspond to a sort order of one of the other
columns, the priority column contains a numeric value that enforces that sort order. By default,
the group table is sorted by this column.
• Instance Count
The number of objects that are contained in the group. If you select the group, the current
object set below will have this number of objects.
• Shallow Size
The combined shallow size of the objects that are contained in the group. If you select the
group, the current object set below will have this shallow size. For an explanation of sizes of
object sets, please see the heap walker overview [p. 159] .
You can search in the group table by typing into it or right-clicking it and selecting the Find
action from the context menu. The group table can be exported to HTML or CSV, by choosing
Export View from its context menu. Note that the group table will not be exported when you
export the current heap walker view with the export action in the tool bar.
The group selection is not a separate selection step in the heap walker, but it becomes part of
the selection step made by the inspection. You can see the group selection in the selection step
pane at the bottom. When you change the group selection, the selection step pane is updated
immediately.
B.6.5.9.2 Heap Walker - List Of Inspections
The following inspections are provided by JProfiler:
182
• Custom filter [Custom inspections]
Filter all objects in the current object set with a code snippet. Return <tt>true</tt> if an object
should be added to the new object set and <tt>false</tt> if it should be discarded.<p><b>Note:
In the reference view, you can apply a filter to a selected outgoing chain of references.</b>
Configuration options:
• Filter script
The script that decides whether an object should be part of the new object set or not. The
script is passed a <tt>currentObject</tt> parameter. If you return <tt>true</tt>, the object
will be retained, otherwise it will be discarded.
• Custom grouping [Custom inspections]
Group the current object set with a code snippet. Return the key for each object as a
<tt>java.lang.String</tt> object. Objects with the same key will be in the same group.<p>After
the inspection is calculated, you will see a statistics table at the top of all heap walker view
where you can select each group and analyze its members separately.
Configuration options:
• Grouping script
The script that returns the group name of the group that the object should be part of. The
script is passed a <tt>currentObject</tt> parameter. If all objects in the current object set
are of the same class, the parameter is typed, so you will get code completion for the
parameter. If you return <tt>null</tt>, the object will be retained, otherwise it will be added
to the group with the name of the returned string value.
• Duplicate strings [Duplicate objects]
Find duplicate <tt>java.lang.String</tt> objects in the current object set.<p>After the inspection
is calculated, you will see a statistics table at the top of all heap walker view where you can
select each duplicate string value and analyze the corresponding string objects
separately.<p>Note: If no <tt>java.lang.String</tt> objects are contained in the current object
set, the inspection will return the empty object set.
Configuration options:
• Minimum length
The minimum size as an integer value. The default size is 20.
• Duplicate primitive wrappers [Duplicate objects]
Find duplicate primitive wrapper objects like <tt>java.lang.Integer</tt> in the current object
set.<p>After the inspection is calculated, you will see a statistics table at the top of all heap
walker view where you can select each duplicate primitive value and analyze the corresponding
wrapper objects separately.<p>Note: If no wrapper objects of the selected type are contained
in the current object set, the inspection will return the empty object set.
Configuration options:
• Primitive wrapper type
The primitive type for which the inspection will
"Boolean,Byte,Character,Double,Float,Integer,Long,Short".
183
be
calculated.
One
of
• Duplicate arrays [Duplicate objects]
Find duplicate arrays in the current object set.<p>After the inspection is calculated, you will
see a statistics table at the top of all heap walker view where you can select each duplicate
array value and analyze the corresponding arrays separately.<p>Note: If no arrays of the
selected type are contained in the current object set, the inspection will return the empty
object set.
Configuration options:
• Minimum shallow size in bytes
The minimum size as an integer value. The default size is 100.
• Array type
The array type for which the inspection will be calculated.
"Object,Boolean,Byte,Character,Double,Float,Integer,Long,Short".
One
of
• Sparse arrays [Collections & Arrays]
Find object arrays that contain a high percentage of <tt>null</tt> values.<p>After the inspection
is calculated, the object group table will group arrays according to their percentage of null
values. There is a cutoff below which no arrays are included in the object set.<p>Note: If no
arrays of the selected type are contained in the current object set, the inspection will return
the empty object set.
Configuration options:
• Minimum shallow size in bytes
The minimum size as an integer value. The default size is 100.
• Arrays with zero length [Collections & Arrays]
Find object arrays whose length is zero. This may be an opportunity to use a <tt>null</tt>
value in order to reduce memory consumption.<p>Note: If no arrays of the selected type are
contained in the current object set, the inspection will return the empty object set.
Configuration options:
• Array type
The array type for which the inspection will be calculated.
"Object,Boolean,Byte,Character,Double,Float,Integer,Long,Short".
One
of
• Hash maps with bad key distribution [Collections & Arrays]
Find hash maps with a bad distribution of keys. This may be an opportunity to improve the
<tt>hasCode()</tt> method of objects in order to speed up lookups in the map.<p>After the
inspection is calculated, the object group table will group hash maps according to their
distribution quality. There is a cutoff below which no hash maps are included in the object
set. The objects with the highest hash map distribution quality will be at the top.
Configuration options:
• Minimum map size
The minimum size as an integer value. The default size is 20.
184
• Null fields [Reference & field analysis]
Find objects with fields that have a high percentage of null values. These fields could be moved
to derived classes or aggregated objects.
• Weakly referenced objects [Reference & field analysis]
Find objects that are (transitively) referenced through a weak, soft of phantom reference.<p>To
analyze the reference paths, go to the "Reference" view after the inspection is calculated and
show the path to the garbage collector root for selected objects.
Configuration options:
• Reference type
The type of the reference for which the inspection will be calculated, one of "Weak
reference,Soft reference,Phantom reference".
• Objects retained by inner class [Reference & field analysis]
Find objects that only referenced implicitly by one of their non-static inner classes. Sometimes
this can be the cause of a memory leak.
• Objects with many incoming references [Reference & field analysis]
Find objects that have many incoming references.<p>After the inspection is calculated, the
object group table will group instances according to their incoming reference count. There is
a cutoff below which no instances are included in the object set. The objects with the most
incoming references will be at the top.
• Objects that reference themselves [Reference & field analysis]
Find objects that reference themselves directly. This may be an opportunity to remove a
field.<p>After the inspection is calculated, the object group table will group instances and
classes according to how many of their (static) fields reference itself. The objects with the most
self-references will be at the top.
• Classes with identical names [Classes & Class loaders]
Find classes with the same name that are loaded by different class loaders.<p>After the
inspections is calculated, the object group table will show the class names and the counts of
how many classes were loaded under that name. The inspection selects <tt>java.lang.Class</tt>
objects, not instances. If you are interested in instances of a particular class,switch to the
"Incoming references" view and use the "live instances" reference to select all instances.
• Instances grouped by class loaders [Classes & Class loaders]
Partition all instances by the class loaders that loaded them.<p>After the inspection is
calculated, the object group table shows the list of class loaders with their loaded instance
counts. If you are interested in seeing the classes rather than the instances, switch to the
"Classes" view after the inspection has completed.
• Instances of classes derived from specific base class [Classes & Class loaders]
Find instances that are derived from a selected class or that implement a selected
interface.<p>If you are interested in seeing the classes rather than the instances, switch to
the "Classes" view after the inspection has completed.
Configuration options:
• Class name
The class name for which the inspection will be calculated.
185
• HTTP session objects [Classes & Class loaders]
Find
all
HTTP
session
objects.
These
are
instances
that
implement
<tt>javax.servlet.http.HttpSession</tt>.<p>This is a convenience inspection and has the same
effect as running the "Instances of classes derived from specific base class" inspection with
the above interface.
186
B.6.5.10 Graph
B.6.5.10.1 Heap Walker - Graph
The heap walker graph does not automatically show any objects from the current object set, nor
is it cleared when you change the current object set. You manually add selected objects to the
graph in the outgoing references view [p. 171] , the incoming references view [p. 173] or the biggest
objects view [p. 168] .
In the graph, you can explore the incoming and outgoing references of the selected objects and
find paths between objects or paths to garbage collector roots.
The graph has the following properties:
• Instances are painted as rectangles with the class name of the instance written inside the
rectangle.
• References are painted as arrows, the arrowhead points from the holder toward the holdee.
If you move the mouse over the reference, a tooltip window will be displayed that shows
details for the particular reference.
• Instances that were manually added from the reference views have a blue background. The
more recently an instance has been added, the darker the background color.
• Garbage collector roots have a red background.
A garbage collector root is an entity in the JVM that itself is not garbage collected and pins
other objects or classes. There are the following types of garbage collector roots:
• JNI references
Native code can request references from the JNI (local or global)
• stack
Local variables all current stack frames
• sticky class
The JVM itself can flag certain classes as non-garbage collectable
• thread block
Live threads are not garbage collected
• monitor used
A monitor that is held by someone cannot be garbage collected
• other GC root
The JVM can pin objects by attaching this unspecified GC root to them
For classes there is a special condition that prevents garbage collection: Since each instance
has an implicit reference to its class, any live instance prevents a class from being garbage
collected. This construct groups all such instances for reasons of conciseness. In this way you
can also select all instances of a specific class (rather than a specific class name).
A set of live instances that reference a yellow class object (see above) has a green background.
• Classes (objects of java.lang.Class) have a yellow background.
In most circumstances, classes are the last step on the path to the GC root that you are
interested in. Classes are not garbage collector roots, but in all situations where no custom
classloaders are used it is appropriate and easier to treat them as such. This is JProfiler's
default mode when searching for garbage collector roots, you can change this in the path to
root options dialog [p. 179] .
187
Class objects have references to
• all implemented interfaces
• their classloader unless they were loaded by the bootstrap classloader
• all references in their constant pool
Note that class objects have no reference to their super class.
Classes are garbage collected together with their classloader when
• there is no class loaded by that classloader that has any live instances
• the classloader is unreferenced except by its classes (this is a JVM level reference and not
visible in the source of java.lang.Class).
• None of the java.lang.Class objects is referenced except by the classloader and other
classes of that classloader.
• String values are shown directly in the java.lang.String instance rectangle.
By default, the reference graph only shows the direct incoming and outgoing references of the
current instance. You can expand the graph by double clicking on any object. This will expand
either the direct incoming or the outgoing references for that object, depending on the direction
you're moving in. Selective actions for expanding the graph are available in the view-specific
toolbar and the context menu:
•
Show outgoing references
•
Show incoming references
If applicable, an instance has plus signs at the left and the right side to show or hide incoming
and outgoing references. The controls at the left side are for incoming, the controls at the right
side for outgoing references. The plus signs have the same effect as the
Show outgoing
references and the
Show incoming references actions. If there is no plus sign, all references
have been expanded.
Each object is optionally annotated with an object ID. With this ID, you can check whether two
objects are the same or not. The display of IDs can be switched off the the context menu and
the view settings [p. 191] .
You can
hide nodes by selecting them and pressing the delete key. You can select multiple
nodes by holding the with the CTRL or SHIFT key and delete them together.
The graph may contain a number of unconnected branches. To clean up the graph, select a
node on the branch that should be retained and select the remove unconnected items action
from the graph toolbar or the context menu.
To remove all objects from the graph to its original state, you can choose Clear Graph from
the context menu.
The reference graph offers a number of navigation and zoom options [p. 134] .
To check why an instance is not garbage collected, you can select it and click the [Show paths
to GC root] button at the top of the view. The options dialog [p. 179] allows you to configure the
way JProfiler performs the search.
188
After the search has completed, the graph is expanded up to the garbage collector roots that
were found. If the object is not referenced by a garbage collector root, a message box will be
displayed. Note that this case is only possible if the "Remove unreferenced and weakly referenced
objects" option in the heap walker option dialog [p. 161] is unchecked.
The garbage collector roots themselves are displayed with a red background.
Another kind of path that can be interesting is the path between two selected objects. The [Find
path between two selected nodes] button at the top of the graph becomes active once you
select exactly two nodes in the graph. The path search options dialog [p. 190] allows you to select
the type of the path and the stopping points of the search.
Any found path will be highlighted in red along the edges of the path. When you search for
another path, the old highlighted path displayed in black again.
There are four layout strategies for showing the reference graph which can be chosen by clicking
on
in the toolbar or choosing the layout strategy from the context menu.
• Hierarchic layout
Standard layout that tries to layout the graph from left to right. This is suitable for most
purposes.
• Hierarchic layout (Top to Bottom)
Like above, only that the layout axis is vertical. This can be suitable for viewing long chains of
references.
• Organic layout
Layout that tries to layout instances for optimal proximity. This layout is suitable for complex
situations and can visualize clusters.
• Orthogonal layout
Layout that tries to layout instances on a rectangular grid. This layout is suitable if your objects
form a matrix.
To add a selection step from this view you can select one or multiple objects and click the [Use
...] button above the graph and choose in the popup menu. Multiple objects are selected by
keeping the SHIFT or CTRL keys pressed during selection. The following selection modes are
available:
• Selected Objects
A new object set will be created that contains only the selected instances.
• Selected java.lang.Class Objects
The new object set will consist of all java.lang.Class objects of the selected instances.
• Items in Selected Collection
This option is only enabled if you select an array of objects or a standard collection from the
java.util package. A new object set will be created that contains the objects in the array or
collection. If you select a map collection, you are prompted whether you want to include the
key objects as well.
• Loaded Instances By Selected Class Loader
This option is only enabled if you select one or more instances of java.lang.ClassLoader.
A new object set will be created that contains the objects whose classes have been loaded by
the selected class loaders.
189
• Retained Objects
A new object set will be created that contains all objects that would be garbage collected if
the selected objects did not exist on the heap. This always includes the selected objects.
After your selection, the view helper dialog [p. 191] will assist you in choosing the appropriate
view for the new object set.
B.6.5.10.2 Path Search Options Dialog
The path search options dialog is displayed after clicking the
nodes] button in the heap walker graph view [p. 187] .
[Find path between two selected
There are three optional consecutive passes when searching for a path:
• Directed path from first to second object
Find a path of outgoing references from the first object that you have selected to the second
object that you have selected.
• Directed path from second to first object
Find a path of outgoing references from the second object that you have selected to the first
object that you have selected.
• Undirected path
Find any kind of connection between the two selected objects even if the direction of the
path changes in between. This works well for objects that are closely related, for example
objects that have a common holder that references them both through a low number of
outgoing references.
If the two objects are not closely related, a found path will likely involve class objects and stack
frames and may be of little practical use. That is why this option is not selected by default.
JProfiler starts the search for the first selected path type and stops as soon as it finds a path. For
large heaps the search can take a long time, so if you know that there is no direct path between
the objects or that you are only interest in one direction, you can disable the other options in
order to save time. If no path could be found, an error message is displayed.
Similar to the path to GC root search [p. 179] , the search stops at class objects by default. Deselect
the Stop search at classes check box only if you have class loader problems, otherwise
the found paths can cross classes arbitrarily for undirected paths. Also, weak references are not
searched be default. If you are interested in paths along weak references, you can enable them
in this option dialog.
190
B.6.5.11 Heap Walker View Helper Dialog
The view helper dialog is displayed each time when a new object is created. New object sets are
created by choosing objects in the heapwalker views [p. 159] and clicking on the [Use selected]
buttons.
The view helper dialog is intended to assist you in choosing the view that is most interesting for
the new object set. You can switch to desired view by selecting the corresponding radio button
and closing the dialog with the [OK] button. On the right hand side of the dialog a short description
of the selected view is displayed.
The view helper dialog automatically suggest a view based on the contents of the new object
set.
To discard the new object set you can leave the dialog with the [Cancel] button. You will then
be returned to the previous heap walker view.
You can suppress this dialog by clicking the Do not show this dialog again checkbox at
the bottom of the dialog. In this case the view change to the automatically suggested view will
be performed without confirmation.
To show the dialog again at a later time, you can adjust this setting in the heap walker view
settings [p. 191] .
B.6.5.12 Heap Walker View Settings Dialog
The heap walker view settings dialog is accessed by bringing the heap walker [p. 159] to front
and choosing View->View Settings from JProfiler's main menu or clicking on the corresponding
toolbar button.
The General tab of the view settings dialog controls aspects which apply to all heap walker views.
• Show selection steps
If checked, the selection history window at the bottom of the heap walker is shown.
• Show view helper dialog for new object sets
If checked, the view helper dialog [p. 191] will be displayed when a new object set is created.
The Classes tab applies to the classes view [p. 164] only. It is analogous to the recorded objects
view settings [p. 143] .
The Allocations tab applies to the allocation view [p. 166] only. It is analogous to the allocation
call tree settings [p. 148] .
Note: Unlike for the allocation call tree, there is no "cumulate allocations" option since the view
mode combo box in the allocations view of the heap walker offers both an "allocation tree" and
a "cumulated allocation tree".
The Biggest objects tab applies to the biggest objects view [p. 168] only.
• Size scale
You can select a size scale, just like in the recorded object view settings [p. 143] .
• Show object IDs
If checked, all objects are annotated with object IDs. This can help you to check if an object is
the same as one displayed in another view.
• Show retained size bar for dominator tree
If checked, a size bar will be shown in from of each outgoing reference node. The size base
can be configured as
191
• Top level object
The percentages refer to the retained size of the top level object. This is the default setting.
• Total heap
The percentages show how much of the total heap is retained by this reference. The lengths
of all size bars are always comparable with this option.
The References tab applies to the references view [p. 171] only.
• Size scale
You can select a size scale, just like in the recorded object view settings [p. 143] .
• Show object IDs
If checked, all objects are annotated with object IDs. This can help you in checking if two objects
in two different reference graphs are the same or not.
• Show declaring class if different from actual class
In the incoming and outgoing reference tree views, the declaring class of a field will be displayed
as well if it is different from the actual class or the object (i.e. the field has been declared in a
super-class). Since this can add a lot of potentially distracting information to the reference
trees, you can switch it off with this setting. In the reference graph, the declaring class is always
displayed in the tool tip on the reference arrows.
• Instance block size
The reference view only show a capped number of instances. This cap which is configurable
here, has a default value of 100. Note that you can easily add more objects with the hyperlinks
at the bottom of the reference tables.
The Time tab applies to the time view [p. 181] only. It is analogous to the VM telemetry view
settings dialog [p. 232] .
The Graph tab applies to the graph [p. 187] only.
• Show object IDs
If checked, all objects are annotated with object IDs. This can help you in checking if two objects
in two different reference graphs are the same or not.
• Warning threshold for opening references
If an object has a lot of incoming or outgoing references, the graph can be visually overwhelmed
with new objects. That's why JProfiler asks you if you really want to open a large number of
references. The default threshold which is configurable here is set to 100.
B.6.5.13 Restricted Availability For HPROF And PHD Snapshots
When viewing HPROF or PHD snapshots, the allocations view [p. 166] and the time view [p. 181]
of the heap walker are not available.
192
B.6.6 CPU Views
B.6.6.1 CPU View Section
The CPU view section contains several views which are thread resolved. Directly above those
views you can see the current selection of thread and thread state.
The thread selection can be one of
•
thread groups
•
active threads
•
dead threads
Next to the thread selector you find information about the thread state which is one of
• All states
No filtering is performed.
• Runnable
Only runnable thread states will be shown. This is the standard setting.
• Waiting
Only waiting thread states will be shown.
• Blocked
Only blocked thread states will be shown.
• Net I/O
Only blocking network operations of the java library will be shown.
When you switch between two thread states, JProfiler will make the best effort to preserve your
current selection.
Below the thread selector you find information about the aggregation level which is one of
• methods
• classes
• packages
• Java EE components
The call tree is always recorded on the method level. If you switch to a higher aggregation level,
the information contained in the method call tree is aggregated accordingly into a new tree from
which the current view is calculated. Java EE components can only be shown if component
recording has been enabled in on the Probes tab [p. 90] of the profiling settings dialog [p. 87]
.
In the dynamic views thread selection, thread state and aggregation level are displayed in combo
boxes. After changing the selection in the thread selector or the thread state selector, the dynamic
views are updated immediately with the new settings. The thread selector applies to all dynamic
views simultaneously. Initially it is set to All thread groups and may be switched to specific
threads or thread groups as soon as they come into existence.
Please turn to the thread view section [p. 217] for more detailed information on threads.
193
The update frequency can be set on the miscellaneous tab [p. 92] in the profiling settings dialog
[p. 87] for all dynamic views of the CPU view section.
Unless a recording profile with CPU data recording has been selected in the Startup section of
the profiling settings dialog [p. 87] , data acquisition has to be started manually by clicking on
Record CPU data in the tool bar or by selecting View->Record CPU Data from JProfiler's
main menu. Bookmarks [p. 134] will be added when recording is started or stopped manually.
CPU data acquisition can be stopped by clicking on
Stop recording CPU data in the tool bar
or by selecting View->Stop Recording CPU Data from JProfiler's main menu.
The CPU recording state is shown in the status bar with a
CPU icon which is shown in gray
when CPU is not recorded. Clicking on the CPU icon will toggle CPU recording.
Restarting data acquisition resets the CPU data in all dynamic views of the CPU view section.
Note that you can also use a trigger [p. 94] and the "Start recording" and "Stop recording" actions
[p. 98] to control CPU recording in a fine-grained and exact way. This is also useful for offline
profiling [p. 265] .
The CPU view section contains the
• Call tree view [p. 195]
The call tree view shows top down call trees for the selected thread or thread group.
• Hot spots view [p. 200]
The hot spots view shows the methods where most of the time is spent in the profiled
application.
• Call graph [p. 205]
The call graph shows call graphs for selected threads or thread groups.
• Method statistics [p. 209]
The method statistics view shows information on the distribution of calls to the same method.
• Call tracer [p. 211]
The call tracer shows a multi-threaded chronological sequence of method calls.
194
B.6.6.2 Call Tree View
B.6.6.2.1 Call Tree View
The call tree view shows a thread resolved [p. 193] top-down call tree which is shows method
detail according to the configured filters [p. 82] .
JProfiler automatically detects Java EE components [p. 90] and displays the relevant nodes in
the call tree with special icons that depend on the Java EE component type:
servlets
JSPs
EJBs
For certain classes, JProfiler shows a display name:
• JSPs
the path of the JSP source file
• EJBs
the name of the EJB interface
• RMI proxies
the name of the remote interface
• Web service proxies
the QName of the end point
If URL splitting is enabled in the servlet probe [p. 104] each request URL creates a new node with
a
special icon and the prefix URL:, followed by the part of the request URL on which the call
tree was split. Note that URL nodes group request by the displayed URL.
The call tree view has an aggregation level selector. It allows you to switch between
• methods
Every node in the tree is a method call. This is the default aggregation level. Special Java EE
component methods have their own icon (see above) and display name, the real class name
is appended in square brackets.
For methods that have been configured for exceptional method run recording, different icons
will be shown. Please see the help on exceptional method run recording [p. 85] for more
information.
• classes
Every node in the tree is a single class. Java EE component classes have their own icon (see
above) and display name, the real class name is appended in square brackets.
• packages
Every node in the tree is a single package. Sub-packages are not included.
• Java EE components
Every node in the tree is a Java EE component [p. 90] . If the component has a separate
display name, the real class names are omitted.
195
When you switch between two aggregation levels, JProfiler will make the best effort to preserve
your current selection. When switching to a a more detailed aggregation level, there may not
be a unique mapping and the first hit in the call tree is chosen.
The call tree doesn't display all method calls in the JVM, it only displays
• unfiltered classes
Classes which are unfiltered according to your configured filter sets [p. 83] are used for the
construction of the call tree.
• first level calls into unfiltered classes
Every call into a filtered class that originates from an unfiltered class is used for the construction
of the call tree. Further calls into filtered classes are not resolved. This means that a filtered
node can include information from other filtered calls. Filtered nodes are painted with a red
marker in the top left corner.
• thread entry methods
The methods Runnable.run() and the main method are always displayed, regardless of the
filter settings.
A particular node is a bridge node if it would normally not be displayed in the view, but has
descendant nodes that have to be displayed. The icons of bridge nodes are grayed out. For the
call tree view this is the case if the inherent time of the current node is below the defined threshold
[p. 198] , but there are descendant nodes that are above the threshold.
When navigating through the call tree by opening method calls, JProfiler automatically expands
methods which are only called by one other method themselves.
To quickly expand larger portions of the call tree, select a method and choose View->Expand
Multiple Levels from the main window's menu or choose the corresponding menu item from
the context menu. A dialog is shown where you can adjust the number of levels (20 by default)
and the threshold in per mille of the parent node's value that determines which child nodes are
expanded.
If you want to collapse an opened part of the call tree, select the topmost method that should
remain visible and choose
View->Collapse All from the main window's menu or the
context menu.
If a method node is selected, the context menu allows you to quickly add a method trigger [p.
94] for the selected method with the
add method trigger action. A dialog [p. 102] will be
displayed where you can choose whether to add the method interception to an existing method
trigger or whether to create a new method trigger.
You can use this view as a starting point for determining which methods are candidates for
exceptional method run recording [p. 85] . Once you have identified methods of interest, you
can right-click them in the table and choose Add As Exceptional Method from the context
menu.
Nodes in the call tree can be hidden by selecting them and hitting the DEL key or by choosing
Hide Selected from the context menu. Percentages will be corrected accordingly as if the
hidden node did not exist. All similar nodes in other call stacks will be hidden as well.
When you hide a node, the toolbar and the context menu will get a
Show Hidden action.
Invoking this action will bring up a dialog where you can select hidden elements to be shown
again.
196
For method, class or package nodes, the context menu and the View menu have an Add Filter
From Selection entry. The sub-menu contains actions to add appropriate filters [p. 83] as well
as an action to add an ignored method entry [p. 86] .
If a node is excluded, you will get options to add an inclusive filter, otherwise you will get options
to add an exclusive filter. These actions are not available for classes in the "java." packages.
The tree map selector above the call tree view allows you to switch to an alternate visualization:
A tree map that shows all call stacks as a set of nested rectangles. Please see the help on tree
maps [p. 137] for more information.
If enabled in the view settings [p. 198] , every node in the call tree has a size bar whose length is
proportional to the total time spent in the current node including all descendant nodes and
whose light-red part indicates the percentage of the inherent time of the current node.
Every entry in the call tree has textual information attached which depends on the call tree view
settings [p. 198] and shows
• a percentage number which is calculated with respect to either the root of the tree or the
calling node.
• a total time measurement in ms or µs. This is the total time that includes calls into other
nodes.
• an inherent time measurement in ms or µs. This is the inherent time that does not include
calls into unfiltered classes.
• an invocation count which shows how often the node has been invoked on this path.
• a name which depends on the aggregation level:
• methods
a method name that is either fully qualified or relative with respect to to the calling method.
• classes
a class name.
• packages
a package name.
• Java EE components
the display name of the Java EE component.
• a line number which is only displayed if
• the aggregation level is set to "methods"
• line number resolution has been enabled in the profiling settings [p. 88]
• the calling class is unfiltered
Note that the line number shows the line number of the invocation and not of the method
itself.
You can set change the root of the call tree to any node by selecting that node and choosing
View->Set As Root from the main window's menu or by choosing the corresponding menu
item from the context menu. Percentages will now be calculated with respect to the new root if
the percentage base has been set to "total thread time" in the view settings dialog [p. 198] . To
return to the full view of all nodes called in the current thread or thread group, select
View->Show All from the main window's menu or the context menu.
197
You can stop and restart CPU data acquisition [p. 193] to clear the call tree.
B.6.6.2.2 Show Hidden Elements Dialog
The show hidden elements dialog is displayed when choosing Hide Selected from the context
menu or hitting the DEL key in a call tree or hot spots view.
The dialog shows a list of all the elements that you have previously hidden. You can select multiple
elements from the list and press [OK] to show these elements again.
The list of hidden elements is persistent across multiple recordings on the same run. It is cleared
when the session is restarted.
B.6.6.2.3 Call Tree View Settings Dialog
The call tree view settings dialog is accessed by bringing the call tree [p. 195] to front and choosing
View->View Settings from JProfiler's main menu or clicking on the corresponding toolbar
button.
The node description options control the amount of information that is presented in the
description of the node (methods, classes, packages or Java EE components, depending on the
selected aggregation level).
• Show size bar
If this option is checked, a size bar will be displayed whose length is proportional to the time
spent in this node including all descendant nodes and whose light-red part indicates the
percentage of the inherent time of the current node.
• Show time
Show the total time that was spent in the node.
• Show inherent time
Show the inherent time (excluding calls to unfiltered methods) that was spent in the node.
• Show invocation count
Show how many times the node was called in this particular call sequence.
• Always show fully qualified names
If this option is not checked (default), class name are omitted in intra-class method calls which
enhances the conciseness of the display.
Only applicable if the aggregation level has been set to "methods".
• Always show signature for method calls
Only applicable if the aggregation level has been set to "methods". If this option is not checked,
method signatures are shown only if two methods with the same name appear on the same
level.
Only applicable if the aggregation level has been set to "methods".
• Show average time values in brackets
Show the total time divided by the number of invocations for each node in brackets. Is not
displayed if the invocation count is 0, e.g. if an invocation has not completed yet or if sampling
is chosen as the call tree collection method.
You can select a time scale mode for all displayed times:
198
• Automatic
Depending on the time value, it's displayed in seconds, millseconds or microseconds, in such
a way that 3 significant digits are retained.
• Seconds
• Millseconds
• Microseconds
The display threshold below which nodes are ignored is entered in percent. Calls whose inherent
time makes up less than that percentage are not shown in the call tree except for the case where
they are part of a call sequence which leads to a node with an inherent time above the given
threshold. Those nodes are indicated by a grayed out icon.
To activate the threshold, you have to select the "Hide calls with less than ..." check box.
This option allows you to trim down the call tree to the most important parts.
The percentage base determines against what time span percentages are calculated.
• Absolute
Percentage values show the contribution to the total time.
• Relative
Percentage values show the contribution to the calling node.
199
B.6.6.3 Hot Spot View
B.6.6.3.1 Hot Spots View
The hot spots view shows a list of calls of a selected type. The list is truncated at the point where
calls use less than 0.1% of the total time of all calls. See the help on the estimated CPU
time/elapsed time setting [p. 92] and take into account the selection of the thread state selector
[p. 193] to properly assess the meaning of these time measurements. By opening a hot spot
node, the tree of backtraces leading to that node are calculated and shown.
The type of the hot spots can be selected in the combo box above the table labeled "hot spot
type". The available types fall into two categories:
1. method calls
• method calls (show filtered classes separately)
The displayed hot spots are calculated from method calls. Filtered classes can contribute
hot spots of their own. This is the default mode.
• method calls (add filtered classes to calling class)
The displayed hot spots are are calculated from method calls. Calls to filtered classes are
always added to the calling class. In this mode, a filtered class cannot contribute a hot spot,
except if it has a thread entry method (run and main methods).
Depending on your selection of the aggregation level, the method hot spots will change.
They and their hot spot backtraces will be aggregated into classes or packages or filtered for
Java EE component types.
Note: The notion of a method hot spot is relative. Method hot spots depend on the filter sets
that you have enabled in the filter settings [p. 83] . Filtered methods are opaque, in the sense
that calls into other filtered methods are attributed to their own time. If you change your filter
sets you're likely to get different method hot spots since you are changing your point of view.
Please see the help topic on hot spots and filters [p. 42] for a detailed discussion.
Every hot spot is described in several columns:
• The hot spot column shows a name which depends on the aggregation level:
• methods
a method name that is either fully qualified or relative with respect to to the calling method.
• classes
a class name.
• packages
a package name.
• Java EE components
the display name of the Java EE component.
• the inherent time, i.e. how much time has been spent in the hot spot together with a bar
whose length is proportional to this value. All calls into this method are summed up regardless
of the particular call sequence.
If the method belongs to an unfiltered class, this time does not include calls into other methods.
If the method belongs to a filtered class, this time includes calls into other filtered methods.
200
• the average time, i.e. the inherent time (see above) divided by the invocation count (see
below).
• the invocation count of the hot spot. If "Sampling" is selected as the method call recording
type [p. 88] , the invocation count is not available.
If you click on the
handle on the left side of a hot spot, a tree of backtraces will be shown.
Every entry in the backtrace tree has textual information attached to it which depends on the
view settings.
• a percentage number which is calculated with respect either to the total time or the called
method.
• a time measurement in ms or µs of how much time has been contributed to the parent hot
spot on this path. If enabled in the view settings, every node in the hot spot backtraces tree
has a size bar whose length is proportional to this number.
• an invocation count which shows how often the hot spot has been invoked on this path.
Note: This is not the number of invocations of this method.
• a name which depends on the aggregation level:
• methods
a method name that is either fully qualified or relative with respect to to the calling method.
• classes
a class name.
• packages
a package name.
• Java EE components
the display name of the Java EE component.
• a line number which is only displayed if
• the aggregation level is set to "methods"
• line number resolution has been enabled in the profiling settings [p. 88]
• the calling class is unfiltered
Note that the line number shows the line number of the invocation and not of the method
itself.
JProfiler automatically detects Java EE components [p. 90] and displays the relevant nodes in
the hot spot backtraces tree with special icons that depend on the Java EE component type:
servlets
JSPs
EJBs
For certain classes, JProfiler shows a display name:
201
• JSPs
the path of the JSP source file
• EJBs
the name of the EJB interface
• RMI proxies
the name of the remote interface
• Web service proxies
the QName of the end point
If URL splitting is enabled in the servlet probe [p. 104] each request URL creates a new node with
a
special icon and the prefix URL:, followed by the part of the request URL on which the hot
spot backtraces tree was split. Note that URL nodes group request by the displayed URL.
The hot spots view has an aggregation level selector. It allows you to switch between
• methods
Every node in the tree is a method call. This is the default aggregation level. Special Java EE
component methods have their own icon (see above) and display name, the real class name
is appended in square brackets.
• classes
Every node in the tree is a single class. Java EE component classes have their own icon (see
above) and display name, the real class name is appended in square brackets.
• packages
Every node in the tree is a single package. Sub-packages are not included.
• Java EE components
Every node in the tree is a Java EE component [p. 90] . If the component has a separate
display name, the real class names are omitted.
When you switch between two aggregation levels, JProfiler will make the best effort to preserve
your current selection. When switching to a a more detailed aggregation level, there may not
be a unique mapping and the first hit in the hot spot backtraces tree is chosen.
The hot spot backtraces tree doesn't display all method calls in the JVM, it only displays
• unfiltered classes
Classes which are unfiltered according to your configured filter sets [p. 83] are used for the
construction of the hot spot backtraces tree.
• first level calls into unfiltered classes
Every call into a filtered class that originates from an unfiltered class is used for the construction
of the hot spot backtraces tree. Further calls into filtered classes are not resolved. This means
that a filtered node can include information from other filtered calls. Filtered nodes are painted
with a red marker in the top left corner.
• thread entry methods
The methods Runnable.run() and the main method are always displayed, regardless of the
filter settings.
202
When navigating through the hot spot backtraces tree by opening method calls, JProfiler
automatically expands methods which are only called by one other method themselves.
To quickly expand larger portions of the hot spot backtraces tree, select a method and choose
View->Expand Multiple Levels from the main window's menu or choose the
corresponding menu item from the context menu. A dialog is shown where you can adjust the
number of levels (20 by default) and the threshold in per mille of the parent node's value that
determines which child nodes are expanded.
If you want to collapse an opened part of the hot spot backtraces tree, select the topmost
method that should remain visible and choose View->Collapse All from the main window's
menu or the context menu.
If a method node is selected, the context menu allows you to quickly add a method trigger [p.
94] for the selected method with the
add method trigger action. A dialog [p. 102] will be
displayed where you can choose whether to add the method interception to an existing method
trigger or whether to create a new method trigger.
Nodes in the hot spot backtraces tree can be hidden by selecting them and hitting the DEL key
or by choosing Hide Selected from the context menu. Percentages will be corrected accordingly
as if the hidden node did not exist.
When you hide a node, the toolbar and the context menu will get a
Show Hidden action.
Invoking this action will bring up a dialog where you can select hidden elements to be shown
again.
For method, class or package nodes, the context menu and the View menu have an Add Filter
From Selection entry. The sub-menu contains actions to add appropriate filters [p. 83] as well
as an action to add an ignored method entry [p. 86] .
If a node is excluded, you will get options to add an inclusive filter, otherwise you will get options
to add an exclusive filter. These actions are not available for classes in the "java." packages.
You can stop and restart CPU data acquisition [p. 193] to clear the hot spots view.
B.6.6.3.2 Hot Spots View Settings Dialog
The hot spots view settings dialog is accessed by bringing the hot spots [p. 200] to front and
choosing View->View Settings from JProfiler's main menu or clicking on the corresponding
toolbar button.
The node description options control the amount of information that is presented in the
description of the node.
• Show size bar
If this option is checked, a size bar will be displayed whose length is proportional to the time
that was contributed to the hot spot along the particular call path.
• Show time
Show the total time that was spent in the method call.
• Show invocation count
Show how many time the method was called in this particular call sequence.
• Always show fully qualified names
If this option is not checked, class name are omitted in intra-class method calls which enhances
the conciseness of the display.
203
• Always show signature
If this option is not checked, method signatures are shown only if two methods with the same
name appear on the same level.
• Show average time values in brackets
Show the total time spent in the hot spot divided by the number of hot spot invocations for
each node in brackets. Is not displayed if the invocation count is 0, e.g. if an invocation has
not completed yet or if sampling is chosen as the call tree collection method. This setting only
applies to the back traces, the average time for the hot spot itself is always displayed in a
separate column.
You can select a time scale mode for all displayed times:
• Automatic
Depending on the time value, it's displayed in seconds, millseconds or microseconds, in such
a way that 3 significant digits are retained.
• Seconds
• Millseconds
• Microseconds
The percentage calculation determines against what time span percentages are calculated.
• Absolute
Percentage values show the contribution to the total recorded time.
• Relative
Percentage values shows the contribution to the invoked method.
204
B.6.6.4 Call Graph
B.6.6.4.1 Call Graph
The call graph shows a statically calculated thread resolved [p. 193] call graph for selected nodes.
The nodes are methods, classes, packages, or Java EE components, depending on the selected
aggregation level.
To calculate a call graph, click
Generate graph in the tool bar or select View->Generate
Graph from JProfiler's main menu. If a graph has been calculated, the context menu also provides
access to this action.
Before a graph is calculated, the call graph wizard [p. 206] is brought up. The resulting graph is
static and can be re-calculated be executing
Generate graph again. The call graph wizard
remembers your last selection.
The call graph has the following properties:
• Nodes are painted as rectangles. The rectangle includes information about
• The node name (method name, class name, package name or or Java EE component name).
For methods, no parameters are displayed. In order to see the parameters of a method,
switch on signature tooltips in the call graph view settings [p. 207] or select the
corresponding check item in the context menu.
• The total time (including calls into unfiltered classes)
• The inherent time (excluding calls into unfiltered classes)
• The number of calls into this node
• The node rectangles have a background coloring which - depending on the call graph view
settings [p. 207] is taken from a gray to red scale for increasing
• inherent time
• or total time
The percentage base is
• the time spent in the displayed nodes only
205
• or the time spent in all nodes
• Calls are painted as arrows, the arrowhead points from the caller toward the callee. If you
move the mouse over the call arrow, a tooltip window will be displayed that shows details
for the particular call.
• Call arrows have a color which is taken from a black to red scale for an increasing percentage
in execution time. In this way you can spot the most important calls of a node without checking
their tooltips one by one.
By default, the call graph only shows the direct incoming and outgoing calls of the initially selected
nodes. You can expand the graph by double clicking on any node. This will expand the direct
incoming and outgoing calls for that node. Selective actions for expanding the graph are available
in the toolbar, the View menu and the context menu:
•
Show calling nodes
•
Show called nodes
•
Add nodes to graph, to add other unrelated nodes to the graph. The node selection dialog
[p. 207] will then be displayed.
If applicable, an node has plus signs at the left and the right side to show or hide calling and
called nodes. The controls at the left side are for calling, the controls at the right side for called
nodes. The plus signs have the same effect as the Show calling nodes and the Show called
nodes actions. Additionally, the plus signs give you the indication that there might be nodes to
display and that you have not yet tried to expand them.
You can hide nodes by selecting them and pressing the delete key. You can select multiple nodes
and delete them together. Alternatively, you can select the
remove nodes from graph action
from the graph toolbar or the context menu.
If you delete methods, the call graph may contain a number of unconnected branches. To clean
up the graph, select a method on the branch that should be retained and select the
cleanup
unconnected methods action from the graph toolbar or the context menu. The "remove all but
selected nodes" action in the context method allows you to trim the graph to a few selected
nodes.
The call graph offers a number of navigation and zoom options [p. 134] .
B.6.6.4.2 Call Graph Wizard
The call graph wizard is displayed before a call graph [p. 205] is calculated and sets parameters
for the call graph.
1. Graph Options
Similar to the the dynamic views of the CPU view section [p. 193] , you can select a thread or
thread group and a thread state for which the call graph will be calculated.
The aggregation level selector allows you to calculate a call graph for
• methods
Every node in the graph is a method call. This is the default aggregation level.
• classes
Every node in the graph is a single class. Java EE component classes have their own display
name, the real class name is appended in square brackets.
206
• packages
Every node in the graph is a single package. Sub-packages are not included.
• Java EE components
Every node in the graph is a Java EE component [p. 90] . If the component has a separate
display name, the real class names are omitted.
2. Initially displayed nodes
The call graph initially displays a number of selected nodes and their immediate call
environment. Select one or multiple nodes in this step. The node table shows
• node name
• inherent time
• total time
• invocations
and can be sorted [p. 133] on all columns. Initially it is sorted by inherent time to show the
most interesting hot spots at the top of the table.
You can add further nodes later on with the node selection dialog [p. 207] .
After you click [Finish] in the last step, the call graph will be calculated, if you leave the wizard
with [Cancel], you are returned to the old call graph.
B.6.6.4.3 Node Selection Dialog
The node selection dialog is displayed when adding new nodes to the call graph [p. 205] .
The node selection dialog offers a list of nodes similar to step 2 in the call graph wizard [p. 206]
. If you leave the dialog with [OK], the selected nodes and their immediate call environments will
be shown in the call graph. If you leave the dialog with [Cancel], the call graph will not be changed.
B.6.6.4.4 Call Graph View Settings Dialog
The call graph view settings dialog is accessed by bringing the call graph [p. 205] to front and
choosing View->View Settings from JProfiler's main menu or clicking on the corresponding
toolbar button.
• Show signature tooltips
If checked, the signature of a method will be shown in a tooltip window when you move the
mouse over it.
• Color information
This setting determines the meaning of the gray to red scale of the background color of node
rectangles. It can be one of
• Inherent time
• Total time
• Color scale base
This setting determines the percentage base for calculating the background color of node
rectangles. It can be one of
207
• Displayed nodes only. If this setting is checked, the coloring of nodes changes as new nodes
are expanded or added.
• All nodes. If this setting is checked, the coloring stays the same as new nodes are expanded
or added.
• display threshold
The display threshold below which nodes are ignored is entered in percent. Calls whose
inherent time makes up less than that percentage are not shown in the method graph. If you
raise the threshold, none of the currently displayed nodes are hidden. If you lower the
threshold, nodes who do not have plus signs for expanding incoming and outgoing calls may
get them again.
To activate the threshold, you have to select the "Hide calls with less than ..." check box.
This option allows you to trim down the call graph to the most important parts.
208
B.6.6.5 Method Statistics
B.6.6.5.1 Method Statistics
The method statistics view shows information on the distribution of calls to the same method.
Recording method statistics is a memory intensive operation, so it is split from regular CPU
recording. To record method statistics, click Record method statistics in the tool bar or select
View->Record Method Statistics from JProfiler's main menu. If you have previously recorded
method statistics, the old recorded data will be lost. Bookmarks [p. 134] will be added when
recording is started or stopped manually.
If CPU recording [p. 193] is not enabled, it will be enabled when you start recording method
statistics. Note that CPU recording will not be stopped when you stop recording method statistics.
The method statistics view shows a table with all methods from profiled classes [p. 82] that were
invoked during method statistics recording. The following columns are shown in the table:
• Method
The name of the method and its parameters.
• Total Time
The total time spent in the method.
• Invocations
The number of times a method was called.
• Average Time
The average time spent in a method. This is equal to the total time divided by the invocation
count.
• Median Time
The median time is the time for which half of the method calls were shorter and half were
longer.
• Minimum Time
The minimum time of a single method invocation.
• Maximum Time
The maximum time of a single method invocation.
• Standard Deviation
The standard deviation measures the breadth of the distribution of method call times. If all
method call times are nearly equal, the value will be close to zero, the more spread-out the
call times are, the higher the standard deviation will be.
• Outlier Coefficient
The outlier Coefficient is calculated as (maximum time - median time) / median time. It
measures how significant the maximum time deviates from the median time. Outliers with
small times are not considered. Methods with high outlier coefficients are suitable candidates
for exceptional method run measurements in the call tree view [p. 195] .
You can sort [p. 133] the table on all columns. Double-clicking on a table row will show the source
code of the selected method.
You can use this view as a starting point for determining which methods are candidates for
exceptional method run recording [p. 85] . Once you have identified methods with a high outlier
coefficient, you can right-click them in the table and choose
Add As Exceptional Method
from the context menu.
209
Below the method table, a graph with the distribution of invocation counts versus call times is
shown. The graph is always shown for the currently selected method in the method table.
By default, the graph shows invocation counts on a linear scale. However, in order to identify
outliers with a low relative frequency, it is useful to switch to a logarithmic axis. This can be done
in the view settings [p. 210] or in the context menu.
The graph can be exported to HTML or CSV by right-clicking into the graph area and selecting
Export from the context menu. The export action in the tool bar and in the context menu of
the method table export the method table without the currently shown graph.
Please see the help on graphs with a time axis [p. 138] for help on common properties of graph
views. The time axis in this case is the call duration axis.
B.6.6.5.2 Method Statistics View Settings Dialog
The method statistics view settings dialog is accessed by bringing the method statistics [p. 209]
to front and choosing View->View Settings from JProfiler's main menu or clicking on the
corresponding
toolbar button.
The following options are available:
• Scale to fit window
Determines whether the view operates in the "fixed time scale" or "scale to fit window" mode.
These modes are described in the VM telemetry view help page [p. 231] .
• Grid lines for time axis
Controls on what ticks grid lines will be shown along the time axis.
• Grid lines for vertical axis
Controls on what ticks grid lines will be shown along the vertical axis.
• Logarithmic Display of Invocation Counts
If this option is selected, the invocation counts are plotted on a logarithmic axis. This makes
it easier to find outliers with a low relative frequency.
210
B.6.6.6 Call Tracer
B.6.6.6.1 Call Tracer
The call tracer shows a multi-threaded chronological sequence of method calls.
To record call traces, click
Record call traces in the tool bar or select View->Record Call
Traces from JProfiler's main menu. If you have previously recorded call traces, the old recorded
data will be lost. Bookmarks [p. 134] will be added when recording is started or stopped manually.
Please note that recording call traces can generate massive amounts of data in a very short
time. To avoid problems with excessive memory consumption, a cap is set on the maximum
number of collected call traces. That cap is configurable in the view settings [p. 212] . The amount
of collected traces heavily depends on your filter settings [p. 82] . Also see the help topic on
method call filters [p. 25] for background information.
By default, calls into filtered classes are recorded, similarly to the default behavior of the hot
spots view [p. 200] . Calls into filtered classes can be excluded in the view settings [p. 212] .
Call tracing only works when the method call recording type [p. 88] is set to "dynamic
instrumentation". Sampling does not keep track of single method calls, so it is technically not
possible to collect call traces with sampling.
To facilitate navigation, all method calls are grouped in a tree on three levels:
• Threads
Every time the executing thread changes in the call sequence, a new
thread node is created.
• Packages
Every time the Java package changes in the call sequence, a new
package node is created.
• Classes
Every time the class changes in the call sequence, a new
class node is created.
At the lowest level there are method entry and method exit nodes. If call traces into other
methods have been recorded from the current method or if another thread interrupts the current
method, the entry and exit nodes for the that method will not be adjacent. Initially, all nodes are
collapsed, so you see a sequence of thread nodes after the traces have been recorded.
You can navigate on the method level only by using the skip to next method trace (Alt-Down)
and
skip to previous method trace (Alt-Up) actions.
Each node displays the following information:
• Name
For thread nodes, this is the thread name, for package nodes this is the package name and
for class nodes this is the fully qualified class name. By default, method nodes show the
method name and the method signature. In the view settings [p. 212] , you can decide to drop
the signature or add the fully qualified class name. The latter can be useful when using the
quick search feature.
• Trace count
Thread, package and class nodes display the number of method call traces that are contained
in them.
• Trace time
The trace time on the right side is one of
211
• Relative to first trace
The displayed time is the difference between the current call trace and the first displayed
call trace. This is the default setting.
• Relative to previous node
The displayed time is the difference between the current call trace and the previous node.
If the previous node is the parent node, that difference will be zero.
• Relative to previous node of the same type
The displayed time is the difference between the current call trace and the previous node
of the same type. For example, if the current node is a class node, the previous node of the
same type is the previous class node in the tree.
The time display type can be configured in the view settings [p. 212] .
Below the table with the call traces, a stack trace list shows you the stack trace of the currently
selected method trace. You can double-click on the stack trace element to show the source code.
The context menu gives you access to source and bytecode navigation.
A huge number of traces can be collected in a very short time. To eliminate traces that are of no
interest, the call tracer allows you to quickly trim the displayed data. For example, traces in
certain threads might not be interesting or traces in certain packages or classes might not be
relevant. Also, recursive method invocations can occupy a lot of space and you might want to
eliminate those single methods only.
You can hide nodes by selecting them and pressing the delete key. All other instances of the
selected nodes and all associated child nodes will be hidden as well. You can select multiple
nodes and delete them together. Alternatively, you can select the hide selected nodes action
from the toolbar or the context menu.
To show hidden nodes again, you can click on the show hidden button or select View->Show
Hidden from the main menu to show the show hidden elements dialog [p. 212] .
B.6.6.6.2 Show Hidden Elements Dialog
The show hidden elements dialog is displayed when clicking on the
show hidden button or
selecting View->Show Hidden from the main menu when the call tracer view [p. 211] is visible.
The dialog shows a list of all the elements that you have previously hidden with the hide button
or the DELETE key. Hidden elements can be threads, packages, classes and methods.
You can select multiple elements from the list and press [OK] to show these elements again in
the call tracer view. Note that some elements can be subsets of others, so unhiding an element
might not make it visible. For example, if you have hidden the class com.mycorp.MyClass and
then the package com.mycorp, unhiding the class com.mycorp.MyClass will not make it visible
again, you also have to unhide the package com.mycorp for that.
The list of hidden elements is persistent across multiple trace recordings on the same run. It is
cleared when the session is restarted.
B.6.6.6.3 Call Graph View Settings Dialog
The call tracer view settings dialog is accessed by bringing the call tracer [p. 211] to front and
choosing View->View Settings from JProfiler's main menu or clicking on the corresponding
toolbar button.
The trace recording options control the amount of recorded call traces:
212
• Maximum number of recorded call traces
To avoid excessive memory consumption, the profiling agent stops collecting call traces after
this threshold has been reached.
• Record calls into filtered classes
If selected, calls into filtered classes are traced as well. Please see help topic on method call
filters [p. 25] for background information.
The time display options control the displayed trace time. The time display can be one of
• Relative to first trace
• Relative to previous node
• Relative to previous node of the same type
The above settings are explained on the help page for the call tracer view [p. 211] .
The method display options determine the presentation of method nodes. The following options
are available:
• Show signature
If selected, each method node shows the signature of the method.
• Show class names in method nodes
If selected, the fully qualified class name is prepended to each method node.
213
B.6.6.7 Request Tracking
Request tracking connects call sites with execution sites in asynchronous execution flows by
adding hyperlinks into the call tree view [p. 195] . For an explanation of the underlying concepts,
please see the corresponding help topic [p. 45] .
Request tracking can be changed with the
tool bar button or via the [Request Tracking]
button in the startup dialog [p. 107] . In the latter case, the selected request tracking settings are
active immediately after JProfiler connects to the profiled JVM.
For remote tracking types, the hyperlink leads into a different JVM. That JVM must be profiled
at the time of the remote call and it must be open in a separate JProfiler window. JProfiler will
activate that window and show the corresponding execution site in the call tree.
Remote tracking works with live sessions as well as snapshots. For execution sites that are called
from a remote VM, JProfiler adds a VM ID to the execution site node in the call tree. Internally,
that VM ID is a UUID, but to make it easier to interpret, JProfiler translates it to a small number,
starting at #1. While the JProfiler GUI is open, that number remains unique. After a restart, the
VM ID may be different, depending on the order in which the VMs are opened.
For easier orientation, the VM ID is displayed in the status bar. This ID does not only help you in
remote tracking scenarios, it is also useful to know if two snapshots were taken from the same
VM run.
For remote call sites, JProfiler always adds a hyperlink to the call tree because it cannot know if
the call is also profiled on the remote site. If you click on such a link without having the
corresponding remote VM open in JProfiler, you will get a warning message.
In principle, a remote call site or execution site could be available in multiple windows. This would
happen if you open multiple snapshots from the remote VM at the same time. In that case,
JProfiler shows a dialog requiring you to select a target window for the hyperlink when you click
on it.
In the request tracking dialog you can switch request tracking on and off separately for the
following supported request tracking types:
• Executors
The call site is the last profiled method before a task is handed off to an executor service
from the java.util.concurrent package. The execution site is in the thread that executes
the task.
For example, if you call
Executors.newSingleThreadExecutor().submit(new Runnable() {
public void run() {
// your code
}
});
the enclosing method that calls submit is the call site, and the code below // your code is
the execution site.
Executors are used by many higher-level libraries for managing asynchronous executions,
those libraries are implicitly supported by this request tracking type.
• AWT
The call site is last profiled method before a deferred action is posted to the AWT event queue
with EventQueue.invokeLater(...) or similar. The execution site is always in the event
dispatch thread.
For example, if you call
214
EventQueue.invokeLater(new Runnable() {
public void run() {
// your code
}
});
the enclosing method that calls invokeLater is the call site, and the code below // your
code is the execution site.
Together with the default entry in the exceptional method configuration [p. 85] , this feature
provides a way to comprehensively analyze long-running AWT events.
• SWT
The call site is the last profiled method before a deferred action is posted on the UI thread
with Display.getDefault().asyncExec(...) or similar. The execution site is always in
the UI thread.
For example, if you call
Display.getDefault().asyncExec(new Runnable() {
public void run() {
// your code
}
});
the enclosing method that calls asyncExec is the call site, and the code below // your code
is the execution site.
• Thread start
The call site is the last profiled method before Thread.start() is called. The execution
site is a a top-level node in the started thread. If multiple threads are merged, each recorded
execution site is still displayed separately.
For example, if you call
new Thread() {
public void run() {
// your code
}
}.start();
the enclosing method that calls start is the call site, and the code below // your code is
the execution site.
Request tracking for threads can add a lot of nodes into your call trees that may be hard to
interpret, because threads are started by the JRE in ways that are not immediately obvious.
It is recommended to use thread start request tracking only in the case of a related problem.
• RMI
The call site is the origin of the RMI call, the execution site is where the server handles the
call. Both the client as well as the server VM must be profiled and opened in JProfiler, either
live or as a snapshot.
Multiple RMI calls may be handled by different threads on the remote side, each of which will
create its own execution site for the call.
• Remote EJB
The call site is the origin of the remote EJB call, the execution site is in the implementation
in the EJB server. Both the client as well as the server VM must be profiled and opened in
JProfiler, either live or as a snapshot. JBoss 7.1+ and Weblogic 11+ are supported for remote
EJB tracking.
215
Multiple remote EJB calls may be handled by different threads on the remote side, each of
which will create its own execution site for the call.
• Web services
The call site is where the web service call is made, the execution site is where the server
handles the call. Both the client as well as the server VM must be profiled and opened in
JProfiler, either live or as a snapshot. The same web service implementations as for the web
service probe [p. 236] are supported.
Multiple web service calls may be handled by different threads on the remote side, each of
which will create its own execution site for the call.
Since the call tree can merge several invocation of a method, one call site can be related to
several execution sites, for example an executor invocation can use different threads in a thread
pool for different invocations. In this case, the execution site dialog is shown which allows you
select the desired execution site. by looking at the displayed thread names and back traces. Call
sites are assigned numeric IDs by JProfiler starting with #1, so you can recognize the same call
site when browsing call trees for different threads.
On the other hand, a execution site can only by called by a single call site. A hyperlink that leads
to the call site is shown in the tree. If more than one call site start a task in the same call stack,
multiple execution sites are created side by side.
When jumping between call sites and execution sites, the call tree history is useful to move
back and forth in your selection history. This is a general feature of the call tree view [p. 195]
which also works for changes in thread, thread status and aggregation level selection. The history
always remains within the same window and does not follow remote calls.
Note that following a hyperlink will select the explicit thread of the call site or execution site. If
you're starting in the "All threads" thread selection, the call tree will always change to that of a
single thread. You can subsequently choose the parent thread group or "All threads" again and
the current selection will be preserved.
216
B.6.7 Threads Views
B.6.7.1 Thread View Section
The thread view section contains the
• Threads history view [p. 218]
The threads history view shows detailed historic information about the status of all threads
in the JVM.
• Threads monitor view [p. 220]
The threads monitor view shows dynamic information about the currently running threads.
• Threads dumps view [p. 222]
The threads dumps view shows manually taken thread dumps with stack traces for all active
threads.
217
B.6.7.2 Thread History View
B.6.7.2.1 Thread History View
The thread history view shows the list of all threads in the JVM in the order they were started.
On the left hand side of the view, the names of the threads appear as a fixed column, the rest
of the view is filled with a scrollable measuring tool which shows time on its horizontal axis. The
origin of the time axis coincides with the starting time of the first thread in the JVM. Each alive
thread is shown as a colored line which starts when the thread is started and ends when the
thread dies. The color indicates a certain thread status and is one of
• green
Green color means that the thread is runnable and eligible for receiving CPU time by the
scheduler. This does not mean that the thread has in fact consumed CPU time, only that the
thread was ready to run and was not blocking or sleeping. How much CPU time a thread is
allotted, depends on various other factors such as general system load, the thread's priority
and the scheduling algorithm.
• orange
Orange color means that the thread is waiting. The thread is sleeping and will be woken
up either by a timer or by another thread.
• red
Red color means that the thread is blocking. The thread has is trying to enter a
synchronized code section or a synchronized method whose monitor is currently held by
another thread.
• blue
Light blue color means that the thread is in Net I/O. The thread is waiting for a network
operation of the java library to complete. This thread state occurs if a thread is listening for
socket connections or if it is waiting to read or write data to a socket.
Note: If you are color-blind, you can edit bin/jprofiler.vmoptions and set
-Djprofiler.highContrastMode=true. The above colors will then have an optimal contrast.
At the top of the view, there is a thread filter selector. You can use it to filter the displayed threads
by
• liveness status
From the combo box you can choose if you wish to display
• Both alive and dead threads
• Alive threads only
• Dead threads only
• name
In the text box you can enter the full name of a thread or only a part of it. Only threads whose
names begin with this fragment are displayed. You can also use wildcards ("*" and "?") to select
groups of threads. Please note that if you use wildcards, you have to manually append a
trailing "*" if desired. You can display the union of multiple filters at the same time by separating
multiple filter expressions with commas, e.g. AWT-, MyThreadGroup-*-Daemon.
218
The selection is performed once you press the enter key. The combo box contains all entries
performed during the current session. The [Reset filters] button can be used to remove all
filters.
When you move the mouse across the thread history view, the time at the position of the mouse
cursor will be shown in JProfiler's status bar. If you have recorded monitor events [p. 223] , a tool
tip with the stack trace and links into the locking history graph [p. 225] and the monitor history
view [p. 229] will be displayed. The link to the locking history graph points to the time that the
event has started, the linked entry in the monitor history view shows the entire event. If the
event has not yet completed, the link into the monitor history view is not available.
When you right-click a thread name on the left side of the view, a context menu will be displayed
that allows you to jump to the Call tree view [p. 195] or the Hot spots view [p. 200] and display
the single selected thread there.
Please see the help on graphs with a time axis [p. 138] for help on common properties of graph
views.
Grid lines and background of the thread history view can be configured in the thread history
view settings dialog [p. 219] .
B.6.7.2.2 Thread History View Settings Dialog
The thread history view settings dialog is accessed by bringing the thread history [p. 218] to front
and choosing View->View Settings from JProfiler's main menu or clicking on the corresponding
toolbar button.
• Scale to fit window
Determines whether the view operates in the "fixed time scale" or "scale to fit window" mode.
These modes are described in the thread history view help page [p. 218] .
• Show bookmarks
Controls where bookmarks will be shown, one of
• None
No bookmarks will be shown in the thread history view.
• In time scale
The vertical bookmark line will only be drawn in the time scale at the top of the view.
• In entire view
The vertical bookmark line will be drawn in the time scale and in the view itself.
• Grid lines for time axis
Controls on what ticks grid lines will be shown along the time axis.
• Background
Controls the appearance of the background of the thread history view.
219
B.6.7.3 Thread Monitor View
B.6.7.3.1 Thread Monitor View
The thread monitor view shows the filtered list of all threads in the JVM together with associated
information on times and status. There are a maximum of six columns shown in the table, which
can be sorted [p. 133] .
• Name
Shows the name of the thread. If the thread has not been named explicitly, the name is
provided by the JVM. To make most use of this view, name your threads according to their
function by invoking the setName() method on all threads created by you.
• Group
Shows the name of the thread group associated with this thread.
• Start time
Shows the time when the thread has been started. This time is calculated relative to the start
time of the first thread in the JVM.
• End time
This column is only visible when show dead threads is enabled in the view settings dialog
[p. 220] . It shows the time when the thread has died and is empty if the thread is still alive.
This time is calculated relative to the start time of the first thread in the JVM.
• CPU time
Shows the CPU time which has been consumed by the thread.
Note: The CPU time column is only visible if the CPU time type is set to Estimated CPU
times on the Miscellaneous [p. 92] tab of the profiling settings [p. 87] . In addition, the CPU
time is only measured when you record CPU data [p. 193] . Otherwise the CPU time column is
always empty.
This column may also be empty if your system and JVM do not support thread specific CPU
time reporting.
• Creating thread
Shows the name of the thread and its thread group that created this thread.
This column may also be empty if your system and JVM do not support thread specific CPU
time reporting.
• Status
Shows the status of the thread which corresponds to the status reported in the thread history
view [p. 218] .
In the lower part of the split pane, the filtered stack trace of the thread creation of the currently
selected thread is displayed. Stack traces can only be displayed if CPU data was being recorded
[p. 193] when the thread was created.
You can decide which threads are shown in the thread monitor view by checking the desired
filters in the thread monitor view settings dialog [p. 220] . If Show dead threads is not enabled,
the End time column will not be visible.
B.6.7.3.2 Thread Monitor View Settings Dialog
The thread monitor view settings dialog is accessed by bringing the thread monitor [p. 220] to
front and choosing View->View Settings from JProfiler's main menu or clicking on the
corresponding
toolbar button.
220
• Show runnable threads
• Show waiting threads
• Show blocking threads
• Show threads in net I/O
• Show dead threads
These options determine the filter for the thread monitor view [p. 220] . See the thread history
help page [p. 218] for a detailed explanation of the different types of thread status.
221
B.6.7.4 Thread Dumps View
B.6.7.4.1 Thread Dumps View
In the thread dumps view you can take thread dumps that show the current stack traces of all
threads that can be displayed in the thread history view [p. 218] .
A new thread dump is taken by clicking on the
[Thread dump] tool bar button. This button
is also present for the thread history view [p. 218] and the thread monitor view [p. 220] . A bookmark
[p. 134] will be added to the time-resolved views.
The new thread dump will by added to the list of thread dumps and it will be selected
automatically. The two lists to the right show the threads that are contained in the currently
selected thread dump as well as the stack trace of the currently selected thread.
The list of threads is organized according to thread groups, similar to the thread selector in the
CPU views [p. 193] .
The stack traces in thread dumps are not filtered, i.e. the filter settings [p. 82] in the session
settings do not apply. The context menu gives access to source and byte code navigation.
Double-clicking on a stack trace element shows the selected method.
Thread dumps can be copied to the clipboard with the [Copy To Clipboard] button at the top
of the list of thread dumps. The entire selected thread dump is copied as plain text to the
clipboard.
To copy a single thread only, choose the Copy Selected Thread To Clipboard menu item
from the context menu of the list of threads.
When exporting [p. 132] the thread dumps view to HTML, the file chooser offers a combo box
for exporting the selected thread dump only, or all thread dumps to the same file.
Thread dumps can also be taken with the trigger thread dump [p. 98] trigger action or via the
API.
222
B.6.8 Monitor Views
B.6.8.1 Monitor View Section
The monitor view section contains the
• Current locking graph [p. 225]
The current locking graph visualizes the current locking situation in the JVM.
• Current monitors view [p. 228]
The current monitors view shows monitors that are currently involved in a waiting or blocking
operation.
• Locking history graph [p. 225]
The locking history graph visualizes the recorded locking situations in the JVM.
• Monitor history view [p. 229]
The monitor history view shows waiting and blocking operations on monitors.
• Monitor usage statistics [p. 230]
The statistics view shows statically calculated statistics for monitor usage.
For all views that are not only showing current events, you have to record monitor events in
order to see data. Recording is started by clicking
Record monitor events in the tool bar.
Bookmarks [p. 134] will be added when recording is started or stopped manually.
Monitor event recording can be stopped by clicking on
the tool bar.
Stop recording monitor events in
Restarting data acquisition resets the monitor data in all historical views of the monitor view
section.
In most applications, a large number of short events is generated continuously and would be
unmanageable to navigate. Because of this, JProfiler applies minimum thresholds for recording
and waiting events below which events are discarded. The thresholds are displayed on the locking
history graph [p. 225] and the monitor history view [p. 229] together with a hyperlink to open the
view settings dialog where the thresholds can be changed. Changes are effective immediately.
Note that you can also use a trigger [p. 94] and the "Start recording" and "Stop recording" actions
[p. 98] to control monitor event recording in a fine-grained and exact way. This is also useful
for offline profiling [p. 265] .
The update frequency can be set on the miscellaneous tab [p. 92] in the profiling settings dialog
[p. 87] for all dynamic views of the monitor view section.
223
B.6.8.2 Locking Graphs
B.6.8.2.1 Common Properties Of Locking Graphs
Locking graphs show single locking situations in the JVM. In contrast to the monitor views [p. 228]
, the locking graphs focus on the entire set of relationships of all involved monitors and threads
rather than the duration of isolated monitor events.
There are two locking graphs:
• Current locking graph [p. 225]
The current locking graph visualizes the current locking situation in the JVM.
• Locking history graph [p. 225]
The locking history graph visualizes the recorded locking situations in the JVM.
The following elements are shown in locking graphs:
• Threads which participate in a locking situation are painted as blue rectangles. The rectangle
includes information about
• The thread name
• The thread group (in brackets)
• Monitors which participate in the locking situation are painted as gray rectangles. The rectangle
includes information about
• The class of the monitor
• The monitor id which can be used to get further information about the monitor in the
monitor views [p. 228]
• The ownership of monitors which participate in a locking situation is painted as a solid black
arrow. The arrowhead points from the thread to the monitor. To see details about where the
monitor was entered, move the mouse over the arrow and see the information in the tool
tip window.
• The blocking of threads which participate in a locking situation is painted as a dashed red
arrow. The arrowhead points from the blocked thread to the monitor that the thread wants
to enter. To see details about where the thread is blocking, move the mouse over the arrow
and see the information in the tool tip window.
• The waiting of threads which participate in a locking situation is painted as a solid yellow
arrow with a hollow arrowhead. The arrowhead points from the waiting thread to the monitor
that the thread is waiting on. To see details about where the thread is waiting, move the mouse
over the arrow and see the information in the tool tip window.
• Threads or monitors that are part of a deadlock are painted in red.
The tool tip window shows a stack trace in a scrollable list whose context menu allows you to
navigate to the source code or show the selected method in the byte code viewer. You can pin
the tool tip window by toggling the
pin button in the top right corner of the tool tip window.
Locks are analyzed for
• the primitive synchronization mechanism that's built into the Java platform, i.e. when using
the synchronized keyword.
224
• the locking facility in the java.util.concurrent package which does not use monitors of objects
but a different natively implemented mechanism.
You can show any monitor in the heap walker [p. 159] by selecting the monitor node and choosing
Show Selection In Heap Walker from the context menu. If a heap dump was already taken,
you can choose to select the object in the current heap dump, otherwise a new heap dump will
be taken.
Note that the selected monitor might not exist in the heap dump because the heap dump might
have been taken before the monitor was allocated or after the monitor was garbage collected.
B.6.8.2.2 Current Locking Graph
The current monitor graph shows monitors that are currently involved in a waiting or blocking
operation. Data in this view is available even if monitor events are not being recorded [p. 223] .
Otherwise, this view is explained by the common properties of locking graphs [p. 224] .
B.6.8.2.3 Locking History Graph
The locking history graph visualizes the recorded locking situations in the JVM. Only recorded
monitor events [p. 223] are shown.
Please see the common properties of monitor views [p. 228] for an explanation of the locking
graph.
There are two sets of events that you step through with the navigation buttons at the top of the
view:
• All events
All monitor events that have been recorded. Next to the navigation buttons you see the current
position and the total event count as well as the time of the currently shown event. If a time
spam has been cumulated (see below), that time span as well as the number of events before
and after the currently selected time span are shown.
• Events of interest
Monitor events that involve a thread or monitor that you have marked as being of interest to
you. You can mark nodes as being of interest by selecting them and choosing Mark Node Of
Interest from the context menu. Multiple nodes can be selecting by holding down the Shift
key. Marked nodes are painted in a different color.
Next to the navigation buttons you see the current position and the total event count involving
nodes of interest or the number of events if an event of interest is currently shown. If the
current event is not an event of interest, you see the number of events of interest before and
after the current event.
Events of interest do not necessarily have to contain a node of interest. For example, if a
thread that has been marked as a node of interest releases a lock, the associated event does
not contain that thread node anymore, but the event is still an event of interest.
To change your selection of nodes of interest, simply select new nodes of interest or choose
Remove Mark from the context menu.
The tool tips that appear when you hover of the arrows in the graph contain several navigation
options:
225
• Origin time
For blocking and waiting relationships, the tool tip contains a hyperlink to the event where
the arrow first appeared.
• Monitor history
To analyze the duration of an event, it can be useful to show it in the monitor history view [p.
229] . At the bottom of the tool tip, a corresponding hyperlink is available.
At the bottom of the view, you see a time line, where all recorded events are shown as blue lines.
The currently shown event is surrounded with a green marker while events of interest are shown
in red.
When you hover with the mouse over event lines, you can see the number of associated events
in the status bar. When you click on an event line, the first event associated with that event line
is shown in the graph. When a new event is selected with the navigation buttons or a hyperlink
in the tool tip window, the timeline is scrolled so that the selected event is visible.
You can cumulate multiple events by clicking an dragging the mouse in the time line. The
selected area will be shown with a green background and all events in the selected time span
will be shown together in the graph. If you have marked nodes of interest, only the events of
interest in the selection will be cumulated.
In a cumulated graph, each arrow can contain multiple events of the same type. In that case, the
tool tip window shows the number of events as well as the total time of all contained events. A
drop-down list in the tool tip window lets you switch between the stack traces of the different
events and the navigation hyperlinks in the tool tip window refer to the currently selected event.
Please see the help on graphs with a time axis [p. 138] for help on common properties of graph
views.
B.6.8.2.4 Locking History Graph View Settings Dialog
The locking history graph view settings dialog is accessed by bringing the locking history graph
[p. 225] to front and choosing View->View Settings from JProfiler's main menu or clicking on
the corresponding
toolbar button.
On the Recording tab, the following options are available:
• Monitor blocking threshold
Select the minimum time threshold in microseconds (µs) for which a monitor contention (i.e.
when a thread is blocking) is displayed in the locking history graph [p. 225] .
• Monitor waiting threshold
Select the minimum time threshold in microseconds (µs) for which a monitor wait state (i.e.
when a thread is waiting) is displayed in the locking history graph [p. 225] .
On the Time Line tab, rhe following options are available:
• Scale to fit window
Determines whether the view operates in the "fixed time scale" or "scale to fit window" mode.
These modes are described in the VM telemetry view help page [p. 231] .
• Show bookmarks
Controls where bookmarks will be shown, one of
226
• None
No bookmarks will be shown in the VM telemetry view.
• In time scale
The vertical bookmark line will only be drawn in the time scale at the top of the view.
• In entire view
The vertical bookmark line will be drawn in the time scale and in the view itself.
• Grid lines for time axis
Controls on what ticks grid lines will be shown along the time axis.
227
B.6.8.3 Monitor Views
B.6.8.3.1 Common Properties Of Monitor Views
Monitor views show a table where every row corresponds to a waiting or blocking event on a
monitor. There are two monitor views:
• current monitors view [p. 228]
The current monitors view shows monitors that are currently involved in a waiting or blocking
operation.
• monitor history view [p. 229]
The monitor history view shows the sequence of waiting and blocking operations on monitors.
The monitor views show the following 6 columns: sortable [p. 133] .
• Time
The start time of the event.
• Duration
The duration of the event. The event may still be in progress.
• Type
The type of the event, one of "waiting" or "blocked".
• Monitor ID
The ID of the monitor for identifying multiple events on a particular monitor instance.
• Monitor class
The class of the monitor. If no Java object is associated with this monitor [raw monitor] is
displayed.
• Waiting thread
The thread that is or was waiting during the event.
• Owning thread
The thread holding the monitor which is blocking the waiting thread is displayed. The owning
thread is only relevant for the "blocked" event type.
In the lower part of the split pane, the stack traces of the waiting thread and - if applicable - of
the owning thread are displayed. Stack traces can only be displayed if CPU data is being recorded
[p. 193] .
You can show any monitor in the heap walker [p. 159] by selecting the table row and choosing
Show Selection In Heap Walker from the context menu. If a heap dump was already taken,
you can choose to select the object in the current heap dump, otherwise a new heap dump will
be taken.
Note that the selected monitor might not exist in the heap dump because the heap dump might
have been taken before the monitor was allocated or after the monitor was garbage collected.
B.6.8.3.2 Current Monitors View
The current monitors view shows monitors that are currently involved in a waiting or blocking
operation. Data in this view is available even if monitor events are not being recorded [p. 223] .
Otherwise, this view is explained by the common properties of monitor views [p. 228] .
228
B.6.8.3.3 Monitor History View
The monitor history view shows the sequence of waiting and blocking operations on monitors.
Only recorded monitor events [p. 223] are shown.
Otherwise, this views is explained by the common properties of monitor views [p. 228] .
You can navigate from any row in the table to the corresponding event in the locking history
graph [p. 225] by choosing Show Selection In Locking History Graph from the context
menu. This will show the starting point of the selected monitor usage.
In the lower part of the split pane, the stack trace of the waiting thread and the owning thread
are displayed. Stack traces can only be displayed if CPU data is being recorded [p. 193] .
B.6.8.3.4 Monitor History View Settings Dialog
The monitor history view view settings dialog is accessed by bringing the monitor history view
[p. 229] to front and choosing View->View Settings from JProfiler's main menu or clicking on
the corresponding
toolbar button.
The following options are available:
• Monitor blocking threshold
Select the minimum time threshold in microseconds (µs) for which a monitor contention (i.e.
when a thread is blocking) is displayed in the monitor history view [p. 229] .
• Monitor waiting threshold
Select the minimum time threshold in microseconds (µs) for which a monitor wait state (i.e.
when a thread is waiting) is displayed in the monitor history view [p. 229] .
229
B.6.8.4 Monitor Usage Statistics
B.6.8.4.1 Monitor Usage Statistics
The monitor usage statistics view shows statically calculated statistics for monitor usage. Monitor
usage statistics can only be calculated if monitor events have been recorded [p. 230] .
To calculate a statistics, click Calculate statistics in the tool bar or select View->Calculate
Statistics from JProfiler's main menu. If a statistics has been calculated, the context menu
also provides access to this action.
Before a statistics is calculated, the monitor usage statistics options dialog [p. 230] is brought up.
The resulting statistics table is static and can be re-calculated be executing Calculate statistics
again. The statistics options dialog remembers your last selection.
The package level statistics table displays five columns:
• Monitors/Threads/Classes
Displays the grouping criterion selected in the statistics dialog [p. 230] ,
• Block count
Shows how often a block operation has been performed on the monitors grouped in this row.
• Block duration
Shows the cumulative duration of all block operations performed on the monitors grouped
in this row.
• Wait count
Shows how often a waiting operation has been performed on the monitors grouped in this
row.
• Wait duration
Shows the cumulative duration of all waiting operations performed on the monitors grouped
in this row.
B.6.8.4.2 Monitor Usage Statistics Options
The monitor usage statistics options dialog sets parameters for the output of the monitor usage
statistics view [p. 230] . Select the criterion for which monitors will be cumulated, one of
• Monitors
• Threads
• Classes of monitors
230
B.6.9 VM Telemetry Views
B.6.9.1 Telemetry View Section
The telemetry view section shows a number of historic graphs which display cumulated
information about the profiled JVM.
There are several views in this section:
• Memory
Shows the maximum heap size and the amount of used and free space in it. This view can be
displayed as a line graph or area graph.
When you profile a Java 1.5+ JVM, the drop down list at the top offers all available memory
pools. Please see the article on tuning garbage collection for more information on heap
memory pools. In addition, there are several memory pools for non-heap data structures. The
drop down list shows all available memory pools in a tree-like structure, so you can display
the sum of all heap pools (the default selection) or the sum of all non-heap pools in the graph.
• Recorded objects
Shows the total number of objects on the heap, divided into arrays and non-arrays. This view
can be displayed as a line graph or area graph. Note that this view only displays recorded
objects [p. 139] and is unavailable if no objects have been recorded so far. Objects that have
been recorded are tracked even after recording has been stopped.
• Recorded throughput
Shows how many objects are garbage collected and created. The plotted values are time rates,
so the total numbers in a time interval are given by the area under the respective lines. Note
that this view only displays recorded objects [p. 139] and is unavailable if no objects have been
recorded so far. Objects that have been recorded are tracked even after recording has been
stopped.
• GC activity
Shows the garbage collector activity in percent of the elapsed time. This view is only available
when profiling with a Java 1.5+ JVM. The combo box at the top allows you to show the activity
for specific GC types. Sun JVMs implement a "Copy" and a "MarkSweepCompact" that apply
to different object generations.
• Classes
Shows the total number of classes loaded by the JVM, divided into CPU-profiled and
non-CPU-profiled [p. 82] classes. This view can be displayed as a line graph or area graph.
• Threads
Shows the total number of alive threads in the JVM, divided into the different thread states
[p. 218] . This view can be displayed as a line graph or area graph.
• CPU load
Shows the CPU load of the profiled process in percent of the elapsed time. This view is only
available when profiling with a Java 1.5+ JVM.
Telemetries whose measurements are summable can be shown as a line graph and as an area
graph. To change the graph type, choose Line Graph or Area Graph from the context or view
menu. The graph type is a persistent view setting separate for each view and is also accessible
through the view settings dialog.
When a view is shown as an area graph, the line which shows the total value is given by the upper
bound of the filled area while the single contributions are shown as stacked area segments.
231
When you move the mouse across a telemetry view, the time at the position of the mouse cursor
and the corresponding value on the vertical axis will be shown in JProfiler's status bar. The
current value of each data line is always shown next to the corresponding legend entry.
Horizontal and vertical grid lines of the VM telemetry views can be configured in the view settings
dialog.
Please see the help on graphs with a time axis [p. 138] for help on common properties of graph
views.
Note that you can use a trigger [p. 94] and the "Start recording" and "Stop recording" actions
[p. 98] to control VM telemetry recording for offline profiling [p. 265] .
B.6.9.2 VM Telemetry View Settings Dialog
The VM telemetry view settings dialog is accessed by bringing any VM telemetry [p. 231] to front
and choosing View->View Settings from JProfiler's main menu or clicking on the corresponding
toolbar button.
View settings are saved separately for each VM telemetry.
The following options are available:
• Scale to fit window
Determines whether the view operates in the "fixed time scale" or "scale to fit window" mode.
These modes are described in the VM telemetry view help page [p. 231] .
• Show bookmarks
Controls where bookmarks will be shown, one of
• None
No bookmarks will be shown in the VM telemetry view.
• In time scale
The vertical bookmark line will only be drawn in the time scale at the top of the view.
• In entire view
The vertical bookmark line will be drawn in the time scale and in the view itself.
• Grid lines for time axis
Controls on what ticks grid lines will be shown along the time axis.
• Grid lines for vertical axis
Controls on what ticks grid lines will be shown along the vertical axis.
• Graph type
This option is only visible for telemetry view which allow the area graph display mode [p. 231]
. Choose between Line graph and Area graph.
232
B.6.10 Probes
B.6.10.1 Probes
There are two probe sections in JProfiler that show data for both built-in probes and custom
probes:
• Databases [p. 233]
• JEE & probes [p. 236]
For background information on probes, see the corresponding help topic [p. 50] . Probes are
configured on the probes tab [p. 102] of the session settings [p. 76] .
Custom probes can be defined in the session settings [p. 105] or registered on the command line
with a reference to a com.jprofiler.api.agent.probe.ProbeProvider. All custom probes
are added as separate views to the "JEE & Probes" section.
Unless you have activated a recording profile to record probe data at startup, you have to start
recording data manually with the probe recording button in the view-specific tool bar. Recording
is switched on and off separately for each probe.
The tab-like view selector at the top provides access to the various views provided by the probe.
The available views depend on what data is published by the selected probe. The following views
are available:
• Time line [p. 239]
Shows the life-time of control objects on a time-axis as horizontal bars colored with sampled
control object states.
• Control objects [p. 239]
Shows a table with information on control objects.
• Hot spots [p. 241]
Shows a list of payload hot spots together with expandable back traces.
• Telemetries [p. 242]
Shows telemetries published by the probe.
• Events [p. 243]
Shows the single events that are recorded by the probe.
• Tracker [p. 244]
Allows you to track selected control objects or hot spots and show their average times, counts
and throughputs as graphs.
B.6.10.2 Databases
The JEE & Probes is one of two probe sections [p. 233] in JProfiler. This section features the
following built-in probes:
•
JDBC
The control objects are database connections which can be in the following active states:
• Statement execution
A statement created via one of the java.sql.Connection#createStatement(...)
methods is being executed.
233
• Prepared statement execution
A statement created via one of the java.sql.Connection#prepareStatement(...)
or java.sql.Connection#prepareCall(...) methods is being executed.
• Batch execution
java.sql.Statement#executeBatch() is being executed on a statement.
The probe annotates the SQL strings of statements into the call tree and shows them in the
hot spots view. Bound values are not shown for prepared statements. This can be changed
in the probe settings [p. 103] .
The following telemetries are provided:
• Executed statements
The number of executed statements per second.
• Average statement execution time
The average execution time in seconds for statements that completed in the last second.
• Recorded open connections
The number of open database connections at any time.
•
JPA/Hibernate
There are no control objects for this view, so the probe does not have time line and control
objects views.
The probe annotates the SQL strings of persistence operations into the call tree and shows
them in the hot spots view.
The following telemetries are provided:
• Entity Operation Count
The number of entity operations per second.
• Query Count
The number of executed queries per second.
• Query Duration
The average duration of queries in the last second.
•
MongoDB
There are no control objects for this view, so the probe does not have time line and control
objects views.
The probe annotates MongoDB operations into the call tree and shows them in the hot spots
view.
The detected MongoDB operation types are
• Query
• Retrieve data
• Update
• Insert
• Delete
234
• Other
The probe replaces primitive data with question marks. This can be changed in the probe
settings [p. 103] .
The following telemetries are provided:
• Executed operations
The number of executed operations per second.
• Average operations execution time
The average execution time in seconds for operations that completed in the last second.
•
Cassandra
There are no control objects for this view, so the probe does not have time line and control
objects views.
The probe annotates Cassandra CQL queries into the call tree and shows them in the hot
spots view.
Two query types are distinguished:
• Statements
• Prepared statements
Bound values for prepared statements are not displayed.
The following telemetries are provided:
• Executed operations
The number of executed operations per second.
• Average operations execution time
The average execution time in seconds for operations that completed in the last second.
•
HBase
There are no control objects for this view, so the probe does not have time line and control
objects views.
The probe annotates HBase commands into the call tree and shows them in the hot spots
view.
The detected HBase operation types are
• Scanner open
• Scanner fetch
• Query
• Modify
• Map-reduce
• Aggregation
The following telemetries are provided:
235
• Executed operations
The number of executed operations per second.
• Average operations execution time
The average execution time in seconds for operations that completed in the last second.
B.6.10.3 JEE & Probes
The JEE & Probes is one of two probe sections [p. 233] in JProfiler. This section features the
following built-in probes:
•
Servlets
There are no control objects for this view, so the probe does not have time line and control
objects views.
The probe splits the call the for each detected request URL so you can analyze request
separately in the call tree view [p. 195] . The URLs are also shown in the probe hot spots view.
The way how distinct request URLs are determined can be customized [p. 104] .
•
JNDI
There are no control objects for this view, so the probe does not have time line and control
objects views.
The probe annotates JNDI query strings into the call tree and shows them in the hot spots
view. Query strings are prepended with "[NAME]" and optionally have a "[FILTER]" part at the
end for JNDI searches.
•
JMS
There are no control objects for this view, so the probe does not have time line and control
objects views. There are two event types: "Synchronous message" and "Asynchronous
message".
The probe annotates JMS message descriptions into the call tree and shows them in the hot
spots view. The displayed JMS message description can be customized [p. 104] .
•
RMI
There are no control objects for this view, so the probe does not have time line and control
objects views. There are two event types: "Server call" and "Client call".
The probe annotates RMI server calls into the call tree and shows RMI server and client calls
in the hot spots view. RMI proxy classes are shown with their interface name in the call tree
and their methods are shown with a
special icon if the RMI probe is enabled.
The following telemetries are provided:
• Client calls
How many outbound RMI calls were made by second.
• Server calls
How many inbound RMI calls were handled by second.
• Average client call duration
• Average server call duration
•
Web services
236
There are no control objects for this view, so the probe does not have time line and control
objects views. There are two event types: "Synchronous" and "Asynchronous". Most web
service calls are synchronous.
The probe shows web service client calls from JAX-WS-RI, Axis 2 and Apache CXF in the hot
spots view. Web service proxy classes are shown with their interface name in the call tree and
their methods are shown with a
special icon if the web services probe is enabled.
The following telemetries are provided:
• Web service calls
How many outbound web service calls were made per minute.
• Call duration
The average duration of web service client calls.
•
Files The control objects are files of the following types:
• RandomAccessFile
A random access file which can be both read from and written to.
• FileInputStream
A file input stream which can only be read from.
• FileOutputStream
A file output stream which can only be written to.
They can be in the following active states:
• Read
Data is being read from the file via the java.io package.
• Write
Data is being written to the file via the java.io package.
• Channel read
Data is being read from the
(java.nio.channels.FileChannel).
file
via
the
java.nio
package
file
via
the
java.nio
package
• Channel write
Data is being written to the
(java.nio.channels.FileChannel).
If configured, the probe annotates the file names into the call tree and shows them in the hot
spots view. The parent path of a file can be inspected in the nested property table in the
control objects view.
The following telemetries are provided:
• Invocation count
How many read and write operations were performed per second.
• Throughput
How many bytes were read and written per second.
237
• Open files
The number of open files at any time.
•
Sockets The control objects are sockets of the following types:
• Socket
A socket from the java.io package.
• SocketChannel
A socket channel from the java.nio package.
They can be in the following active states:
• Read
Data is being read from the socket.
• Write
Data is being written to the socket.
If configured, the probe annotates the toString() values of the associated
java.net.SocketAddress objects into the call tree and shows them in the hot spots view.
The following telemetries are provided:
• Invocation count
How many read and write operations were performed per second.
• Throughput
How many bytes were read and written per second.
• Open sockets
The number of open sockets at any time.
•
Processes The control objects are processes which can be in the following active states:
• Read
Data is being read from the input stream provided by the java.lang.Process object.
• Write
Data is being written to the output stream provided by the java.lang.Process object.
If configured, the probe annotates the full paths to the executables into the call tree and shows
them in the hot spots view. Command line arguments, working directory, special environment
variables and the exit code can be inspected in the nested property table in the control objects
view.
The following telemetries are provided:
• Live Processes
The number of live processes at any time.
• Process stream operations
How many read and write operations were made to the process streams per second.
238
• Process stream throughput
How many bytes were read from and written to the process streams per second.
B.6.10.4 Probes Time Line
The time-line view is conceptually similar to the thread history view [p. 218] . The role of the
threads is taken by the control objects and thread states are replaced by the active states of the
control object. For example, the file probe has files as control objects and the available states
describe if the file is being read or written. The
orange default state signifies that the control
object is idle and no special action is being performed. For more information on control objects
and states, see the probes overview [p. 233] .
At the top of the view, there is a filter selector. You can use it to restrict the displayed control
objects by
• Status
From the combo box you can choose if you wish to display open, closed or both open and
closed control objects.
• Name
In the text box you can enter the full name of a control object or only a part of it. Only control
objects whose names begin with this fragment are displayed. You can also use wildcards ("*"
and "?") to select groups of control objects. Please note that if you use wildcards, you have to
manually append a trailing "*" if desired. You can display the union of multiple filters at the
same time by separating multiple filter expressions with commas, e.g. test-, MyTest-*-123.
When you right-click a control-object name on the left side of the view, a context menu will be
displayed that allows you to jump to the control objects view [p. 239] or the events view [p. 243]
and display the single selected control object there.
Please see the help on graphs with a time axis [p. 138] for help on common properties of graph
views.
Grid lines and background of the time line view can be configured in the view settings dialog.
B.6.10.5 Probe Control Objects
The control objects view shows tabular information on the control objects published by the
selected probe. For built-in probes, the name of view reflects the name of the control object, for
example "Connections" or "Files". Please see the probes overview [p. 233] for more information
on the probe-specific control objects.
The available columns depend on the probe, the following columns are available for all probes:
• ID
The numeric ID of the control object as assigned by JProfiler. This is is also displayed in the
time line view [p. 239] and the events view [p. 243] and can be used there to filter for a specific
control object.
• Name
The name column contains the description of the control object, which depends on the probe.
For built-in probes, the column is named more specifically, for example "File name" or
"Command line".
239
• Start time
This is the time when the control object was opened and corresponds to an "open" event in
the events view [p. 243] . In the time line view [p. 239] , this is the beginning of the displayed
horizontal bar for the control object.
• End time
This is the time when the control object was closed and corresponds to a "close" event in the
events view [p. 243] . In the time line view [p. 239] , this is the end of the displayed horizontal
bar for the control object.
A probe can determine that certain properties are published in a nested table. This is done to
reduce the information overload in the main table and give more space to table columns. If a
nested table is present, such as for the file and process probes, each row has an expansion
handle at the left side. If you click on is a property-value table will be expanded in-place. All
properties in that table are also available in the filter selector described below.
If a probe publishes several types of control objects, such as the files and socket probes, a "Type"
column is added that shows the type of the control object. Please see the probe overview [p. 233]
for the probe-specific types. If a nested table is present, the type will be added to the nested
table.
Most probes publish summary information on measurements that are available on a per-event
basis. For example, the number of bytes that are read or written for a socket event is summed
for all events and published as columns in the control objects view. This information is also
available if single event recording is disabled.
In general, for each available state
• a count column is added
• for each summable numeric column in the events view, a corresponding column is added
In addition, each probe can publish additional columns that describe the control object and its
state, but are not part of its name. Please see the probe overview [p. 233] for more probe-specific
information.
At the bottom the of the table, there is a special total row that sums all summable columns in
the table, such as durations, counts and throughputs. Together with the filter selector described
below, you can analyze the collected data for selected subsets of control objects.
At the top of the view, there is a filter selector. You can use it to restrict the displayed control
objects by
• Status
From the combo box you can choose if you wish to display open, closed or both open and
closed control objects.
• Name
In the text box you can enter the full name of a control object or only a part of it. Only control
objects whose names begin with this fragment are displayed. You can also use wildcards ("*"
and "?") to select groups of control objects. Please note that if you use wildcards, you have to
manually append a trailing "*" if desired. You can display the union of multiple filters at the
same time by separating multiple filter expressions with commas, e.g. test-, MyTest-*-123.
240
By default, the filter works on all available columns. In order to be more specific, you can select
a particular column from the "Filter by" drop-down list. This is useful, for example, to show a
control object with a particular ID without getting spurious matches from other columns.
When you right-click a control-object row, the context menu contains a
"Show events for
selected control object" action that allows you to jump to the events view [p. 243] and display all
events for the selected control object there.
The
"Add Selection To Tracker" action creates a tracker graph in the probe tracker view [p.
244] . You can select multiple control objects to create a single tracker graph for the sum of their
operations.
B.6.10.6 Probe Hot Spots
The hot spots view is conceptually similar to the CPU hot spots view [p. 200] . Instead of showing
method hot spots, it shows payload names published by the selected probe. Payload names
(such as the SQL string of a statement for the JDBC probe) have an associated duration, and the
ones that take the most time result as the top hot spots.
Payloads are also connected with particular call stacks, so the hot spots view can show a merged
tree of back traces. Even if sampling is enabled, JProfiler records the exact call traces for probe
payloads by default. If you want to avoid this overhead, you can switch it off in the profiling
settings [p. 90] .
For more information on the payload concept, please see the corresponding help topic [p. 50]
Every hot spot is described in several columns:
• The hot spot column shows the payload name. For an explanation of probe-specific payloads,
please see the probe overview [p. 233] .
• the inherent time, i.e. how much time has been spent in the hot spot together with a bar
whose length is proportional to this value.
• the average time, i.e. the inherent time (see above) divided by the invocation count (see
below).
• the invocation count of the hot spot. In contrast to CPU profiling, this is also available if
"Sampling" is selected as the method call recording type [p. 88] .
If you click on the
handle on the left side of a hot spot, a tree of backtraces will be shown.
Every entry in the backtrace tree has textual information attached to it which depends on the
view settings.
• a percentage number which is calculated with respect either to the total time or the called
method.
• a time measurement in ms or µs of how much time has been contributed to the parent hot
spot on this path. If enabled in the view settings, every node in the hot spot backtraces tree
has a size bar whose length is proportional to this number.
• an invocation count which shows how often the hot spot has been invoked on this path.
Note: This is not the number of invocations of this method.
• a name which depends on the aggregation level:
• methods
a method name that is either fully qualified or relative with respect to to the calling method.
241
• classes
a class name.
• packages
a package name.
• Java EE components
the display name of the Java EE component.
• a line number which is only displayed if
• the aggregation level is set to "methods"
• line number resolution has been enabled in the profiling settings [p. 88]
• the calling class is unfiltered
Note that the line number shows the line number of the invocation and not of the method
itself.
For certain probes, such as the "JPA/Hibernate" probe, the top-level elements in the backtraces
are
containers for
secondary hot spots (JDBC statements in the JPA/Hibernate case) and
nodes for
direct and
deferred operations.
The back traces below a "deferred operations" node are not directly associated with the actual
execution of the hot spot. They show
• where the entity has been acquired, if it already existed
• where the entity has been persisted, if it is newly created
In the view filter at the bottom of the tree you can enter the full name of a payload or only a
part of it. Only payloads whose names begin with this fragment are displayed. You can also use
wildcards ("*" and "?") to select groups of payloads. Please note that if you use wildcards, you
have to manually append a trailing "*" if desired. You can display the union of multiple filters at
the same time by separating multiple filter expressions with commas, e.g. test-, MyTest-*-123.
The
"Add Selection To Tracker" action in the context menu and the tool bar creates a tracker
graph in the probe tracker view [p. 244] . You can select multiple control objects to create a single
tracker graph for the sum of their operations.
B.6.10.7 Probe Telemetries
The telemetries view is conceptually similar to the VM telemetry views [p. 231] . Each probe can
publish one or more telemetries with one or more measurements that are shown in in the same
telemetry. The telemetry selector drop-down list at the top offers all available telemetries for
the selected probe. Please see the probe overview [p. 233] for more information on the
probe-specific telemetries.
When you move the mouse across a telemetry view, the time at the position of the mouse cursor
and the corresponding value on the vertical axis will be shown in JProfiler's status bar. The
current value of each data line is always shown next to the corresponding legend entry.
Horizontal and vertical grid lines of the VM telemetry views can be configured in the view settings
dialog.
Please see the help on graphs with a time axis [p. 138] for help on common properties of graph
views.
242
B.6.10.8 Probe Tracker
The events view shows the raw measurements that form the basis for the more high-level
probe views. Each measurement is called an "event" and is shown as a separate row in the table.
Except for the JEE probes, single event recording is disabled by default. While the probe always
processes all events, in this mode it discards them immediately after updating the higher-level
measurements in order to minimize overhead. For example, a non-trivial compound file operation
will quickly accumulate several hundred thousand single events.
For built-in probes, you can enable single event recording in the probe settings [p. 104] . For
custom probes, call metaData.events(true) in the meta data script [p. 105] to enable event
recording.
Each event is described by several columns which are common for all probes:
• Start time
The time that marks the start of the selected event.
• Event type
The type of the event. This includes all control object states as described in the probes overview
[p. 233] as well as "open" and "close" events if the probe publishes control objects.
• Duration
The duration of the event.
• Control object ID
If the probe publishes control objects, this column contains the ID of the associated control
object.
• Description
The description of the event. If the probe publishes payload data, this is the same as the
payload name displayed in the hot spots view.
• Thread
The thread on which the event takes place. An event always takes place on a single thread.
Probes can publish additional columns in the events view. However, no built-in probes in JProfiler
currently use this feature.
At the bottom the of the table, there is a special total row that sums all summable columns in
the table. For the default columns this only includes the "Duration" column, Together with the
filter selector described below, you can analyze the collected data for selected subsets of events.
Below the main table, the call stack of the selected event is shown. This is the call stack of the
payload and forms the basis of the hot spot calculation.
For certain probes, such as the "JPA/Hibernate" probe, events can contain secondary events
(JDBC statements in the JPA/Hibernate case) that can be opened with an expand control at the
left side of the table row.
Some probes, such as the "JPA/Hibernate" probe have "deferred" and "direct" operations, this
is indicated in the call stack with a top-level direct or deferred entry. See the probe hot spot
[p. 241] view for more on this topic.
At the top of the view, there is a filter selector. You can use it to restrict the displayed control
objects by
243
• Status
From the combo box you can choose the event type that should be shown. Please see the
probe overview [p. 233] for the probe-specific event types.
• Name
In the text box you can enter the full name of a control object or only a part of it. Only control
objects whose names begin with this fragment are displayed. You can also use wildcards ("*"
and "?") to select groups of control objects. Please note that if you use wildcards, you have to
manually append a trailing "*" if desired. You can display the union of multiple filters at the
same time by separating multiple filter expressions with commas, e.g. test-, MyTest-*-123.
By default, the filter works on all available columns. In order to be more specific, you can select
a particular column from the "Filter by" drop-down list. This is useful, for example, to show a
control object with a particular ID without getting spurious matches from other columns.
When you right-click an event row, the context menu contains a "Show control object for selected
event" action that allows you to jump to the control objects view [p. 239] and display the associated
control object, if available.
B.6.10.9 Probe Tracker
This view allows you to track selected elements from other views and show graphs with a time
axis to follow the chronological evolution of selected measurements.
When you click on the
[Record probe tracker data] button, a dialog is shown that offers to
track the following element types:
• Control objects
If the current probe has control objects, you can select one or more control objects to create
a graph in the tracker. The graph will show separate feeds for the average execution times of
all different event types. For example, the "file" probe will show "Read", "Write", "Channel
read" and "Channel write" feeds. The following measurements can be tracked:
• Event Times
The average duration of events for the selected control objects per second.
• Event Counts
The average event counts for the selected control objects per second.
• Event Throughputs
The average throughput for the selected control objects per second in bytes. This is only
available for selected probes, e.g. for the "Files", "Sockets" and "Processes" probe.
• Hot Spots
If the current probe has hot spots, you can select one or more hot spots to create a graph in
the tracker. The graph will show separate feeds for the different time types:
• Runnable
• Waiting
• Blocked
• Net IO
The following measurements can be tracked:
244
• Hot Spot Times
The average time for the execution of the selected hot spots per second.
• Hot Spot Counts
The average invocation counts for the execution of the selected hot spots per second.
Once you have at least one graph in the probe tracker view, you can use the
[Add] button to
show the selection dialog again and add more tracker graphs. The
[Remove] button stops
tracking for the currently displayed graph and removes the graph from the tracker view.
The drop-down list at the top allows you to switch between all tracker graphs that have been
added in this profiling session.
Rather than selecting tracked elements directly in the tracker view, you can use the "add to
tracker" actions in the control objects view [p. 239] and the probe hot spots view [p. 241] to add
selected elements to the tracker. The actions are available in the tool bar, the View menu as well
as the context menu.
Probe tracking can also be started programatically, either with
• the corresponding probe tracker trigger actions in a trigger [p. 98]
• the corresponding methods in the controller API
Please see the help on graphs with a time axis [p. 138] for help on common properties of graph
views.
245
B.7 Snapshot Comparisons
B.7.1 Snapshot Comparisons Overview
In JProfiler, you can save profiling data to disk,
• either with the
save action [p. 113] in JProfiler's main window [p. 126]
• or with the offline profiling API [p. 265]
To compare one or several of these snapshots, JProfiler offers a separate comparison window
that you can access by
• Choosing Compare multiple snapshots from the Snapshots tab of the start center [p.
62] and clicking [OK]. If the current window is already used for a profiling session, you will be
prompted whether a new frame should be opened, otherwise the current window will be
exchanged with the snapshot comparison window.
• Choosing
Session->Compare Snapshots in New Window from JProfiler's main menu.
Menu and toolbar of the snapshot window are focused on snapshot comparisons, you can access
all other parts of JProfiler from a snapshot window by choosing File->Show Start Center
from the main menu or clicking on the corresponding toolbar button. This can be necessary if
you close all other windows. File->New Window opens a new JProfiler window with the start
center displayed.
Note: It is possible to create and export comparisons from the command line [p. 282] or an ant
build file [p. 287] . This is especially useful for an automated quality assurance process.
The snapshot window contains a snapshot selector at the left side that lets you configure the
snapshots which are available for creating a comparison. Before you create a comparison, you
have to add the involved snapshots to the snapshot selector. If you open the snapshot comparison
window without having saved any snapshots during the current JProfiler session, you will be
prompted to select snapshot files.
The order of the snapshot files in the list is significant since all comparisons will assume that
snapshots further down in the list have been recorded later.
Note: Snapshots are always compared to other snapshots, if you wish to compare a snapshot
to a currently running profiling session, please save a snapshot first. The saved snapshot will
automatically be shown in the snapshot selector.
The snapshot selector offers the following operations as toolbar buttons and context menu
items:
•
add a new snapshot file (INS). In the following file chooser select one or more *.jps files
to add to the snapshot selector. New snapshots are always appended to the end of the list.
•
sort snapshot files. In the following popup dialog, you can select whether to sort the
snapshot files by creation time (i.e. the file modification time) or by name. Note that this is a
one-time operation, new snapshots are always appended to the end of the list.
•
open snapshot files. The selected snapshot files are opened in new windows, just like
when you open them from the start center [p. 62] or with
Session->Open Snapshot
from JProfiler's main menu.
•
remove snapshot files (DEL). The currently selected snapshot files are removed from the
snapshot selector. If any of the snapshot files to be removed are used in an existing comparison,
those comparison will be closed as well after a confirmation dialog.
246
•
move snapshot files up in the list (ALT-UP). If your selection is a single interval, the whole
block of snapshot files will be moved.
•
move snapshot files down in the list (ALT-DOWN). If your selection is a single interval, the
whole block of snapshot files will be moved.
After you've added the involved snapshots, you can create comparisons with the comparison
wizards. There are several comparison wizards that group comparisons in analogy to the view
sections [p. 126] in the profiling window:
•
the memory comparison wizard [p. 249]
•
the CPU comparison wizard [p. 255]
•
the telemetry comparison wizard [p. 259]
•
the probe comparison wizard [p. 261]
The comparison wizards can be invoked from the File menu, from the toolbar as well as from
the context menu of the snapshot selector.
If you wish to perform the comparison on a subset of the displayed snapshot files, it is easiest
to first select the involved snapshots before invoking a comparison wizard. However, all snapshot
wizards allow you to change this selection.
Comparisons are displayed as new tabs in the snapshot comparison window. They can be
• renamed by choosing View->Rename from the main menu while the view is active.
• closed by choosing View->Close from the main menu while the view is active. You can also
click the tab with the middle mouse button to close it.
The above actions are also available in the context menu on the bottom of the tab.
The comparison wizards are optimized to quickly let you create new comparisons that are similar
to previous comparisons. The wizards remember all previous parameters, so to create another
comparison with the same parameters but different snapshots, just select new new snapshots
in the snapshot selector on the left, invoke the wizard and click on "Finish".
To create another comparison with the same snapshots but different parameters, just invoke
the wizard, click on "Next" to confirm the comparison type, then click on the step in the index
where you wish to make a change and finally click on "Finish".
Most of the parameters that can be adjusted on the fly in the normal profiling views [p. 126] are
selected in the comparison wizards and are fixed once the snapshot comparison has been
created. These parameters are displayed in the comparison header which has the same layout
for every comparison: In the first line you see the name of the comparison, the following lines
are name value pairs of the selected parameters.
All comparisons have specific view settings that can be edited by choosing View->View
Settings from the main menu or the corresponding
toolbar button when the comparison
is active.
Common properties of comparisons include
• Exporting comparisons to HTML, CSV and XML [p. 132]
• Undocking comparisons from the main window [p. 132]
• Sorting tables [p. 133]
247
• Source and bytecode viewer [p. 136]
• Quick search capability [p. 132]
248
B.7.2 Memory Comparisons
B.7.2.1 Memory Snapshot Comparisons Overview
All memory snapshot comparisons are created by invoking the memory comparison wizard. For
more information on snapshot comparisons, please see the snapshot comparison overview [p.
246] .
In the first step of the memory comparison wizard, you select the desired comparison type:
• Objects comparison [p. 249]
• Allocation hot spot comparison [p. 251]
• Allocation tree comparison [p. 252]
The additional steps are described on the help pages linked above.
B.7.2.2 Objects Comparison
B.7.2.2.1 Objects Comparison
The objects comparison is one of the memory comparisons [p. 249] . It is created by invoking the
memory comparison wizard. For more information on snapshot comparisons, please see the
snapshot comparison overview [p. 246] .
The wizard has the following additional steps:
• Select snapshots
The objects comparison compares two snapshot files. In this step, you select the first and the
second snapshot file for the comparison. The combo boxes contain all snapshot files that
have been added to the snapshot selector [p. 246] . The first and second snapshot files must
be different.
• Recording type
In this step, you choose whether you want to compare
• All objects
All objects [p. 140] on the heap will be compared.
• Recorded objects
Only objects that were recorded [p. 139] will be compared when this option is selected.
• Heap snapshot objects
All objects that were captured in a heap snapshot taken in the heap walker [p. 159] will be
compared when this option is selected. Heap snapshot must be present in both selected
snapshots to yield meaningful results. This is the only option that works for HPROF heap
dumps.
• View parameters
In this steps you can select aggregation and liveness mode (only for recorded objects), just as
for the all objects view [p. 140] and the recorded objects view [p. 142] .
Each row in the objects comparison has the following columns:
• the name of the class
• the size in the second snapshot file minus the size in the first snapshot file
249
• the instances in the second snapshot file minus the instances in the first snapshot file
The second column incorporates a bidirectional bar chart. Increases are painted in red and to
the right, while decreases are painted in green and to the left. In the view settings dialog [p. 250]
you can choose whether you want this bar chart to display absolute changes or the percentage
of the change. The other value is displayed in parentheses. This setting also determines how this
column is sorted.
The second column can show either size or instances. This is configurable in the view settings
dialog [p. 250] and is called the primary measure.
By default, only classs that have changed from one snapshot file to the other are displayed. You
can change this behavior in the view settings dialog [p. 250] .
At the bottom of the objects comparison is a view filter selector [p. 136] that filters data for specific
package or class names.
The context menu and the View menu provide actions for creating an allocation call tree
comparison [p. 252] or an allocation hot spot comparison [p. 251] for the selected class.
Please note that if the current comparison compares "All objects" (see above), the numbers will
likely not correspond with the object comparison since the allocation comparisons only compare
recorded objects.
At the bottom of the objects comparison is a view filter selector [p. 136] that filters data for specific
package or class names.
B.7.2.2.2 Objects Comparison View Settings Dialog
The objects comparison view settings dialog is accessed by bringing any objects comparison [p.
249] to front and choosing View->View Settings from JProfiler's main menu or clicking on the
corresponding
toolbar button.
You can select a size scale mode for all displayed sizes:
• Automatic
Depending on the size value, it's displayed in MB, kB or bytes, in such a way that 3 significant
digits are retained.
• Megabytes (MB)
• Kilobytes (kB
• Bytes
The primary measure defines which measurement will be shown in the second column of the
objects view. That column shows its values graphically with a histogram, has percentages attached
and is the default sort column. By default, the primary measure is the instance count. Alternatively,
you can work with the shallow size, which is especially useful if you're looking at arrays.
The differences of primary measure options determine how differences in the primary measure
column are displayed and how that column is sorted.
• Sort and display type
The sort and display type can be one of
• Sort by values
The bar chart in the primary measure column displays absolute differences. When this
column is sorted, it is sorted by absolute differences. Percentages are displayed in
parentheses.
250
• Sort by percentages
The bar chart in the primary measure column displays percentages. When this column is
sorted, it is sorted by absolute percentages. Absolute differences are displayed in
parentheses.
• Show zero difference values
If this option is not checked, the objects comparison does not display hot spots that have not
changed between the first and the second snapshot.
B.7.2.3 Allocation Hot Spot Comparison
B.7.2.3.1 Allocation Hot Spot Comparison
The allocation hot spot comparison is one of the memory comparisons [p. 249] . It is created by
invoking the memory comparison wizard. For more information on snapshot comparisons, please
see the snapshot comparison overview [p. 246] .
The wizard has the following additional steps:
• Select snapshots
The allocation hot spot comparison compares two snapshot files. In this step, you select the
first and the second snapshot file for the comparison. The combo boxes contain all snapshot
files that have been added to the snapshot selector [p. 246] . The first and second snapshot
files must be different.
• Class selection
In this step, you choose for which class or package the comparison should be made. By default
all classed are selected, you can restrict the class selection to a single class or a single package.
• View parameters
In this steps you can select aggregation level, liveness mode and filtered classes handling, just
as for the allocation hot spots view [p. 150] .
Each row in the allocation hot spot comparison has the following columns:
• the name of the allocation hot spot
• the size in the second snapshot file minus the size in the first snapshot file
• the allocations in the second snapshot file minus the allocations in the first snapshot file
The second column incorporates a bidirectional bar chart. Increases are painted in red and to
the right, while decreases are painted in green and to the left. In the view settings dialog [p. 252]
you can choose whether you want this bar chart to display absolute changes or the percentage
of the change. The other value is displayed in parentheses. This setting also determines how this
column is sorted.
By default, only allocation hot spots that have changed from one snapshot file to the other are
displayed. You can change this behavior in the view settings dialog [p. 252] .
At the bottom of the allocation hot spot comparison is a view filter selector [p. 136] that filters
data for specific package or class names.
251
B.7.2.3.2 Allocation Hot Spot Comparison View Settings Dialog
The allocation hot spot comparison view settings dialog is accessed by bringing any allocation
hot spot comparison [p. 251] to front and choosing View->View Settings from JProfiler's main
menu or clicking on the corresponding
toolbar button.
You can select a size scale mode for all displayed sizes:
• Automatic
Depending on the size value, it's displayed in MB, kB or bytes, in such a way that 3 significant
digits are retained.
• Megabytes (MB)
• Kilobytes (kB
• Bytes
The node description options control the amount of information that is presented in the
description of the call.
• Always show signature
If this option is not checked, method signatures are shown only if two methods with the same
name appear in the hot spot list.
Only applicable if the aggregation level has been set to "methods".
The size differences options determine how differences in the allocated memory column are
displayed and how that column is sorted.
• Sort and display type
The sort and display type can be one of
• Sort by values
The bar chart in the allocated memory column displays absolute differences. When this
column is sorted, it is sorted by absolute differences. Percentages are displayed in
parentheses.
• Sort by percentages
The bar chart in the allocated memory column displays percentages. When this column is
sorted, it is sorted by absolute percentages. Absolute differences are displayed in
parentheses.
• Show zero difference values
If this option is not checked, the hot spot comparison does not display hot spots that have
not changed between the first and the second snapshot.
B.7.2.4 Allocation Tree Comparison
B.7.2.4.1 Allocation Tree Comparison
The allocation tree comparison is one of the memory comparisons [p. 249] . It is created by
invoking the memory comparison wizard. For more information on snapshot comparisons, please
see the snapshot comparison overview [p. 246] .
The wizard has the following additional steps:
252
• Select snapshots
The allocation tree comparison compares two snapshot files. In this step, you select the first
and the second snapshot file for the comparison. The combo boxes contain all snapshot files
that have been added to the snapshot selector [p. 246] . The first and second snapshot files
must be different.
• Class selection
In this step, you choose for which class or package the comparison should be made. By default
all classed are selected, you can restrict the class selection to a single class or a single package.
• View parameters
In this steps you can select aggregation level and liveness mode, just as for the allocation tree
view [p. 145] .
Each node in the tree has the same format as in the allocation tree view [p. 145] , except that the
size and allocations are the differences between the second and the first snapshot.
Each node has an optional bar chart at the beginning, Increases are painted in red, while decreases
are painted in green. In the view settings dialog [p. 253] you can choose whether you want this
bar chart to display absolute changes or the percentage of the change. The other value is displayed
in parentheses. This setting also determines how sibling nodes are sorted.
By default, only call stacks that are present in both snapshot files and that have changed from
one snapshot file to the other are displayed. You can change this behavior in the view settings
dialog [p. 253] .
At the bottom of the allocation tree comparison is a view filter selector [p. 136] that filters data
for specific package or class names.
B.7.2.4.2 Allocation Tree Comparison View Settings Dialog
The allocation tree comparison view settings dialog is accessed by bringing any allocation tree
comparison [p. 252] to front and choosing View->View Settings from JProfiler's main menu
or clicking on the corresponding
toolbar button.
The view mode can be toggled with the cumulate allocations checkbox. This sets whether
differences should be calculated of the allocations cumulated for all descendant nodes or just
for the current node.
You can select a size scale mode for all displayed sizes:
• Automatic
Depending on the size value, it's displayed in MB, kB or bytes, in such a way that 3 significant
digits are retained.
• Megabytes (MB)
• Kilobytes (kB
• Bytes
The node description options control the amount of information that is presented in the
description of the call.
• Show size bar
If this option is checked, a size bar will be displayed whose length is proportional to the size
difference of objects allocated in this node including all descendant nodes. Depending on the
sort and display type view setting (see below), these differences are either absolute differences
253
or percentages. Positive differences are painted in red, while negative differences are painted
in green.
• Always show fully qualified names
If this option is not checked (default), class name are omitted in intra-class method calls which
enhances the conciseness of the display.
Only applicable if the aggregation level has been set to "methods".
• Always show signature
If this option is not checked, method signatures are shown only if two methods with the same
name appear on the same level.
Only applicable if the aggregation level has been set to "methods".
The size differences options determine how size differences are displayed and how sibling
nodes are sorted.
• Sort and display type
The sort and display type can be one of
• Sort by values
The bar chart on each node displays absolute differences. Sibling nodes are sorted by
absolute differences. Percentages are displayed in parentheses.
• Sort by percentages
The bar chart on each node displays percentages. Sibling nodes are sorted by absolute
percentages. Absolute differences are displayed in parentheses.
• Show zero difference values
If this option is not checked, the call tree view does not display call stacks that have not changed
between the first and the second snapshot.
• Only show call stacks that appear in both snapshots
If this option is not checked, the allocation tree comparison does not display call stacks that
appear in only one of the compared snapshots.
254
B.7.3 CPU Comparisons
B.7.3.1 CPU Snapshot Comparisons Overview
All CPU snapshot comparisons are created by invoking the CPU comparison wizard. For more
information on snapshot comparisons, please see the snapshot comparison overview [p. 246] .
In the first step of the CPU comparison wizard, you select the desired comparison type:
• Hot spot comparison [p. 255]
• Call tree comparison [p. 257]
The additional steps are described on the help pages linked above.
B.7.3.2 Hot Spot Comparison
B.7.3.2.1 Hot Spot Comparison
The hot spot comparison is one of the CPU comparisons [p. 255] . It is created by invoking the
CPU comparison wizard. For more information on snapshot comparisons, please see the snapshot
comparison overview [p. 246] .
The wizard has the following additional steps:
• Select snapshots
The hot spot comparison compares two snapshot files. In this step, you select the first and
the second snapshot file for the comparison. The combo boxes contain all snapshot files that
have been added to the snapshot selector [p. 246] . You can use the same snapshot file for the
first and second snapshot file, in which case the thread selections in the next step must be
different.
• Thread selection
In this step, you choose for which threads the comparison should be made. By default all
threads are selected, you can restrict the thread selection to single thread groups or single
threads.
• View parameters
In this steps you can select thread status, aggregation level and filtered classes handling, just
as for the hot spots view [p. 200] . In addition, you can choose whether to calculate differences
of total call times or of average call times (total time divided by invocation count). Note that
if "Sampling" was used as the method call recording type [p. 88] , the invocation count is not
available and this setting will not have any effect.
Each row in the hot spot comparison has the following columns:
• the name of the hot spot
• the inherent time in the second snapshot file minus the inherent time in the first snapshot
file
• the invocations in the second snapshot file minus the invocations in the first snapshot file
The second column incorporates a bidirectional bar chart. Increases are painted in red and to
the right, while decreases are painted in green and to the left. In the view settings dialog [p. 256]
you can choose whether you want this bar chart to display absolute changes or the percentage
of the change. The other value is displayed in parentheses. This setting also determines how this
column is sorted.
255
By default, only hot spots that have changed from one snapshot file to the other are displayed.
You can change this behavior in the view settings dialog [p. 256] .
At the bottom of the hot spot comparison is a view filter selector [p. 136] that filters data for
specific package or class names.
B.7.3.2.2 Hot Spot Comparison View Settings Dialog
The hot spot comparison view settings dialog is accessed by bringing any hot spot comparison
[p. 255] to front and choosing View->View Settings from JProfiler's main menu or clicking on
the corresponding
toolbar button.
You can select a time scale mode for all displayed times:
• Automatic
Depending on the time value, it's displayed in seconds, millseconds or microseconds, in such
a way that 3 significant digits are retained.
• Seconds
• Millseconds
• Microseconds
The node description options control the amount of information that is presented in the
description of the call.
• Always show signature
If this option is not checked, method signatures are shown only if two methods with the same
name appear in the hot spot list.
Only applicable if the aggregation level has been set to "methods".
The time differences options determine how differences in the inherent time column are
displayed and how that column is sorted.
• Sort and display type
The sort and display type can be one of
• Sort by values
The bar chart in the inherent time column displays absolute differences. When this column
is sorted, it is sorted by absolute differences. Percentages are displayed in parentheses.
• Sort by percentages
The bar chart in the inherent time column displays percentages. When this column is sorted,
it is sorted by absolute percentages. Absolute differences are displayed in parentheses.
• Show zero difference values
If this option is not checked, the hot spot comparison does not display hot spots that have
not changed between the first and the second snapshot.
256
B.7.3.3 Call Tree Comparison
B.7.3.3.1 Call Tree Comparison
The call tree comparison is one of the CPU comparisons [p. 255] . It is created by invoking the
CPU comparison wizard. For more information on snapshot comparisons, please see the snapshot
comparison overview [p. 246] .
The wizard has the following additional steps:
• Select snapshots
The call tree comparison compares two snapshot files. In this step, you select the first and
the second snapshot file for the comparison. The combo boxes contain all snapshot files that
have been added to the snapshot selector [p. 246] . You can use the same snapshot file for the
first and second snapshot file, in which case the thread selections in the next step must be
different.
• Thread selection
In this step, you choose for which threads the comparison should be made. By default all
threads are selected, you can restrict the thread selection to single thread groups or single
threads.
• View parameters
In this steps you can select thread status and aggregation level, just as for the call tree view
[p. 195] . In addition, you can choose whether to calculate differences of total call times or of
average call times (total time divided by invocation count). Note that if "Sampling" was used
as the method call recording type [p. 88] , the invocation count is not available and this setting
will not have any effect.
Each node in the tree has the same format as in the call tree view [p. 195] , except that the time
and invocations are the differences between the second and the first snapshot.
Each node has an optional bar chart at the beginning, Increases are painted in red, while decreases
are painted in green. In the view settings dialog [p. 257] you can choose whether you want this
bar chart to display absolute changes or the percentage of the change. The other value is displayed
in parentheses. This setting also determines how sibling nodes are sorted.
By default, only call stacks that are present in both snapshot files and that have changed from
one snapshot file to the other are displayed. You can change this behavior in the view settings
dialog [p. 257] .
At the bottom of the call tree comparison is a view filter selector [p. 136] that filters data for
specific package or class names.
B.7.3.3.2 Call Tree Comparison View Settings Dialog
The call tree comparison view settings dialog is accessed by bringing any call tree comparison
[p. 257] to front and choosing View->View Settings from JProfiler's main menu or clicking on
the corresponding
toolbar button.
You can select a time scale mode for all displayed times:
• Automatic
Depending on the time value, it's displayed in seconds, millseconds or microseconds, in such
a way that 3 significant digits are retained.
• Seconds
• Millseconds
257
• Microseconds
The node description options control the amount of information that is presented in the
description of the call.
• Show size bar
If this option is checked, a size bar will be displayed whose length is proportional to the time
difference spent in this node including all descendant nodes. Depending on the sort and
display type view setting (see below), these differences are either absolute differences or
percentages. Positive differences are painted in red, while negative differences are painted
in green.
• Always show fully qualified names
If this option is not checked (default), class name are omitted in intra-class method calls which
enhances the conciseness of the display.
Only applicable if the aggregation level has been set to "methods".
• Always show signature
If this option is not checked, method signatures are shown only if two methods with the same
name appear on the same level.
Only applicable if the aggregation level has been set to "methods".
The time differences options determine how time differences are displayed and how sibling
nodes are sorted.
• Sort and display type
The sort and display type can be one of
• Sort by values
The bar chart on each node displays absolute differences. Sibling nodes are sorted by
absolute differences. Percentages are displayed in parentheses.
• Sort by percentages
The bar chart on each node displays percentages. Sibling nodes are sorted by absolute
percentages. Absolute differences are displayed in parentheses.
• Show zero difference values
If this option is not checked, the call tree view does not display call stacks that have not changed
between the first and the second snapshot.
• Only show call stacks that appear in both snapshots
If this option is not checked, the call tree comparison does not display call stacks that appear
in only one of the compared snapshots.
258
B.7.4 VM Telemetry Comparisons
B.7.4.1 VM Telemetry Comparisons Overview
All telemetry snapshot comparisons are created by invoking the telemetry comparison wizard.
For more information on snapshot comparisons, please see the snapshot comparison overview
[p. 246] .
The wizard has the following steps:
• Choose comparison type
In the first step of the telemetry comparison wizard, you select the desired comparison type,
which compares values from the corresponding VM telemetry view [p. 231] :
• Heap comparison
• Recorded objects comparison
• Classes comparison
• Threads comparison
• Select snapshots
The telemetry comparisons compare two or more snapshot files. In this step, you select
whether you want to compare the snapshots that you have selected in the snapshot selector
[p. 246] , or whether all snapshot files should be compared. The default selection depends on
whether you have selected more than one snapshot in the snapshot selector.
• Memory type
This screen is only shown for the "Heap comparison" and lets you choose a memory pool for
comparison as explained on the help page of the VM telemetry views [p. 231] . Only memory
pools are shown that are contained in all compared snapshots.
• Comparison type
Each snapshot file contributes one value to the comparison graph. That value can be the
• current value
This is the value when the snapshot was saved, i.e. the rightmost point in the telemetry
view and the value that is displayed next to the legend entries there.
• maximum value
This is the maximum value during the entire time that the telemetry view was recording
data. The maximum value is evaluated separately for each snapshot file.
• value at a bookmark
In JProfiler, you can set bookmarks [p. 134] for specific points in time. In addition, there are
automatic bookmarks for recording events. If all compared snapshots contain a bookmark
with the same name, you can compare values at those times. If you choose this option you
have to select a bookmark from the combo box below. Only bookmarks that are contained
in all snapshots are displayed.
• Compared measurements
In this step you select which of the measurements from the corresponding VM telemetry view
[p. 231] should be compared. You can select any combination of measurements, for each
telemetry comparison there's one preferred measurement that's compared by default. The
available measurements are:
259
• Heap comparison
Maximum, free and used heap size (default)
• Recorded objects comparison
Total number of objects (default), non-arrays, arrays
• Classes comparison
Total number of classes (default), filtered classes, unfiltered classes
• Threads comparison
Total number of threads (default), inactive threads, active threads
Any telemetry comparison behaves similarly to the VM telemetry views [p. 231] themselves, on
the horizontal axis you see the snapshot numbers from the snapshot selector, the vertical axis
remains the same. Effectively, the time axis from the VM telemetry views is replaced by an ordinal
snapshot file axis.
There are several view settings [p. 260] that influence the display of the comparison. Please see
the help on the VM telemetry views [p. 231] for more information.
B.7.4.2 VM Telemetry Comparisons View Settings Dialog
The VM telemetry comparison view settings dialog is accessed by bringing any VM telemetry
comparison [p. 259] to front and choosing View->View Settings from JProfiler's main menu
or clicking on the corresponding
toolbar button.
The following settings are configurable:
• Scale to fit window
Determines whether the view operates in the "fixed time scale" or "scale to fit window" mode
described in the help on graphs with a time axis [p. 138] .
• Grid lines for vertical axis
Controls on what ticks grid lines will be shown along the vertical axis.
• Symbol for snapshot point
Controls which symbol is painted for each measurement of a snapshot file. Choose between
None, Hollow rectangle and Filled circle (default).
260
B.7.5 Probe Comparisons
B.7.5.1 Probe Comparisons Overview
All memory snapshot comparisons are created by invoking the memory comparison wizard. For
more information on snapshot comparisons, please see the snapshot comparison overview [p.
246] .
In the first step of the probe comparison wizard, you select the desired comparison type:
• Probe hot spot comparison [p. 261]
• Probe telemetry comparison [p. 263]
The additional steps are described on the help pages linked above.
B.7.5.2 Hot Spot Comparison
B.7.5.2.1 Probe Hot Spot Comparison
The probe hot spot comparison is one of the probes comparisons [p. 261] . It is created by invoking
the probes comparison wizard. For more information on snapshot comparisons, please see the
snapshot comparison overview [p. 246] .
The wizard has the following additional steps:
• Select snapshots
The probe hot spot comparison compares two snapshot files. In this step, you select the first
and the second snapshot file for the comparison. The combo boxes contain all snapshot files
that have been added to the snapshot selector [p. 246] . You can use the same snapshot file
for the first and second snapshot file, in which case the thread selections in the next step
must be different.
• Probe selection
In this step, you choose for which probe the comparison should be made. If you select the
"custom probe" option, all snapshots are analyzed to find out which custom probe are present
in all snapshots.
• Thread selection
In this step, you choose for which threads the comparison should be made. By default all
threads are selected, you can restrict the thread selection to single thread groups or single
threads.
• View parameters
In this steps you can select thread status and aggregation level, just as for the probe hot spots
view [p. 241] . In addition, you can choose whether to calculate differences of total call times
or of average call times (total time divided by invocation count).
Each row in the probe hot spot comparison has the following columns:
• the name of the payload hot spot
• the inherent time in the second snapshot file minus the inherent time in the first snapshot
file
• the invocations in the second snapshot file minus the invocations in the first snapshot file
The second column incorporates a bidirectional bar chart. Increases are painted in red and to
the right, while decreases are painted in green and to the left. In the view settings dialog [p. 262]
261
you can choose whether you want this bar chart to display absolute changes or the percentage
of the change. The other value is displayed in parentheses. This setting also determines how this
column is sorted.
By default, only payload hot spots that have changed from one snapshot file to the other are
displayed. You can change this behavior in the view settings dialog [p. 262] .
At the bottom of the probe hot spot comparison is a view filter selector [p. 136] that filters data
for specific package or class names.
B.7.5.2.2 Probe Hot Spot Comparison View Settings Dialog
The probe hot spot comparison view settings dialog is accessed by bringing any probe hot spot
comparison [p. 261] to front and choosing View->View Settings from JProfiler's main menu
or clicking on the corresponding
toolbar button.
You can select a time scale mode for all displayed times:
• Automatic
Depending on the time value, it's displayed in seconds, millseconds or microseconds, in such
a way that 3 significant digits are retained.
• Seconds
• Millseconds
• Microseconds
The node description options control the amount of information that is presented in the
description of the call.
• Always show signature
If this option is not checked, method signatures are shown only if two methods with the same
name appear in the hot spot list.
Only applicable if the aggregation level has been set to "methods".
The time differences options determine how differences in the inherent time column are
displayed and how that column is sorted.
• Sort and display type
The sort and display type can be one of
• Sort by values
The bar chart in the inherent time column displays absolute differences. When this column
is sorted, it is sorted by absolute differences. Percentages are displayed in parentheses.
• Sort by percentages
The bar chart in the inherent time column displays percentages. When this column is sorted,
it is sorted by absolute percentages. Absolute differences are displayed in parentheses.
• Show zero difference values
If this option is not checked, the probe hot spot comparison does not display hot spots that
have not changed between the first and the second snapshot.
262
B.7.5.3 Telemetry Comparison
B.7.5.3.1 Probe Telemetry Comparison
The probe telemetry comparison is one of the probes comparisons [p. 261] . It is created by
invoking the probes comparison wizard. For more information on snapshot comparisons, please
see the snapshot comparison overview [p. 246] .
The wizard has the following steps:
• Select snapshots
The telemetry comparisons compare two or more snapshot files. In this step, you select
whether you want to compare the snapshots that you have selected in the snapshot selector
[p. 246] , or whether all snapshot files should be compared. The default selection depends on
whether you have selected more than one snapshot in the snapshot selector.
• Probe selection
In this step, you choose for which probe the comparison should be made. If you select the
"custom probe" option, all snapshots are analyzed to find out which custom probe are present
in all snapshots.
• Telemetry group
In this step, you choose for which telemetry group the comparison should be made. Probes
can publish one or more telemetry groups with multiple measurements each.
• Comparison type
Each snapshot file contributes one value to the comparison graph. That value can be the
• current value
This is the value when the snapshot was saved, i.e. the rightmost point in the telemetry
view and the value that is displayed next to the legend entries there.
• maximum value
This is the maximum value during the entire time that the telemetry view was recording
data. The maximum value is evaluated separately for each snapshot file.
• value at a bookmark
In JProfiler, you can set bookmarks [p. 134] for specific points in time. In addition, there are
automatic bookmarks for recording events. If all compared snapshots contain a bookmark
with the same name, you can compare values at those times. If you choose this option you
have to select a bookmark from the combo box below. Only bookmarks that are contained
in all snapshots are displayed.
• Compared measurements
In this step you select which of the measurements from the selected telemetry group that
should be compared. You can select any combination of measurements.
Any telemetry comparison behaves similarly to the probe telemetry views [p. 242] themselves,
on the horizontal axis you see the snapshot numbers from the snapshot selector, the vertical
axis remains the same. Effectively, the time axis from the VM telemetry views is replaced by an
ordinal snapshot file axis.
There are several view settings [p. 264] that influence the display of the comparison. Please see
the help on the probe telemetry views [p. 242] for more information.
263
B.7.5.3.2 Probe Telemetry Comparisons View Settings Dialog
The probe telemetry comparison view settings dialog is accessed by bringing any probe telemetry
comparison [p. 263] to front and choosing View->View Settings from JProfiler's main menu
or clicking on the corresponding
toolbar button.
The following settings are configurable:
• Scale to fit window
Determines whether the view operates in the "fixed time scale" or "scale to fit window" mode
described in the help on graphs with a time axis [p. 138] .
• Grid lines for vertical axis
Controls on what ticks grid lines will be shown along the vertical axis.
• Symbol for snapshot point
Controls which symbol is painted for each measurement of a snapshot file. Choose between
None, Hollow rectangle and Filled circle (default).
264
B.8 Offline Profiling
B.8.1 Offline Profiling
JProfiler's offline profiling capability allows you to run profiling sessions from the command line
without the need for starting JProfiler's GUI front end. Offline profiling makes sense if you want
to
• perform profiling runs from a scripted environment (e.g. an ant build file)
• save snapshots on a regular basis for QA work
• profile server components on remote machines via slow network connections
Performing an offline profiling run for your application is analogous to remote profiling [p. 110]
with special library parameters passed to the profiling agent VM parameter -agentpath:[path
to jprofilerti library]:
• offline switch
Passing offline as a library parameter enables offline profiling. In this case, a connection
with JProfiler's GUI is not possible.
• session ID
In order for JProfiler to set the correct profiling settings, a corresponding session has to be
configured in JProfiler's GUI front end. The ID of that session has to passed as a library
parameter: id=nnnn. Your settings in the profiling settings dialog [p. 87] are used for offline
profiling. The session ID can be seen in the top right corner of the application settings dialog
[p. 77] .
• config file location (optional)
The config file that is read for extracting the session with the specified ID has to be passed
via config={path to config.xml}. The config file is located in the .jprofiler8 directory
in your user home directory (on Windows, the user home directory is typically c:\Documents
and Settings\$USER). If you leave out this parameter, JProfiler will try to detect the config
file location automatically.
A summary of all library parameters is available in the remote session invocation table [p. 111] .
If you profile on a machine where JProfiler is not installed, you will need to transfer the contents
of the bin/{your platform} directory as well as the JAR file bin/agent.jar and the config
file {User home directory}/.jprofiler8/config.xml.
Example:
A typical invocation for offline profiling will look like this:
java "-agentpath:C:\Program
Files\jprofiler7\bin\windows\jprofilerti.dll=offline,id=109,config=C:\Users\bob\.jprofiler8\config.xml"
"-Xbootclasspath/a:C:\Program Files\jprofiler7\bin\agent.jar"
-classpath myapp.jar com.mycorp.MyApp
Please study the remote session invocation table [p. 111] to generate the correct invocation for
your JVM. Also, please don't forget that the platform-specific native library path has to be modified,
just like for remote profiling [p. 110] .
With the command line utility bin/jpenable, you can start offline profiling in any running JVM
with a version of 1.6 or higher. With command line arguments you can automate the process so
that it requires no user input. The supported arguments are:
265
Usage: jpenable [options]
jpenable starts the profiling agent in a selected local JVM, so you can connect
to it from a different computer. If the JProfiler GUI is running locally, you
can attach directly from the JProfiler GUI instead of running this executable.
* if no argument is given, jpenable attempts to discover local JVMs that
are not being profiled yet and asks for all required input on the command
line.
* with the following arguments you can partially or completely supply all
user input on the command line:
-d
-n
--pid=PID
--noinput
The PID of the JVM that should be profiled
Do not ask for user input under any circumstances
GUI mode: (default)
-g --gui
The JProfiler GUI will be used to attach to the JVM
-p --port=nnnnn
The port no which the profiling agent should listen for a
connection from the JProfiler GUI
Offline mode:
-o --offline
-c --config=PATH
-i --id=ID
The JVM will be profiled in offline mode
Path to the config file that holds the profiling settings
ID of the session in the config file. Not required, if
the config file holds only a single session.
Note that the JVM has to be running as the same user as jpenable, otherwise
JProfiler cannot connect to it.
An exception are Windows services running under the local system account if you
list them interactively with jpenable.
If you just need a heap snapshot, consider using the jpdump [p. 113] command line tool that
saves an HPROF dump without loading the profiling agent into the VM.
If the generated snapshots have heap dumps in them, you can use the jpanalyze executable
to prepare the heap dump analysis in advance [p. 119] . Opening the snapshot in the JProfiler GUI
will then be very fast. The executable is named jpanalyze.exe on Windows and jpanalyze
on Unix-based operating systems and is located in the bin directory of a JProfiler installation. If
you execute it with the -help option, you will get help on its usage:
Usage: jpanalyze [options] "snapshot file" ["snapshot file" ...]
where "snapshot file" is a snapshot file with one of the extensions:
.jps, .hprof, .hpz, .phd
[options] is a list of options in the format -option=value
Options:
-obfuscator=none|proguard|yguard
Deobfuscate for the selected obfuscator. Defaults to "none", for other
values the mappingFile option has to be specified.
-mappingfile=[file]
The mapping file for the selected obfuscator.
-removeUnreferenced=true|false
If unreferenced or weakly referenced objects should be removed.
-retained=true|false
Calculate retained sizes (biggest objects). removeUnreferenced will be
set to true.
The removeUnreferenced and the retained command line options correspond to the options
in the heap walker options dialog [p. 161] .
If you start your application from an ant build file, you can use the ant task [p. 269] to easily profile
your application in offline mode.
266
If you already have a launched "Application" session defined, you can generate a start script for
offline profiling with the local to offline conversion wizard on the "Convert" tab of the start
center [p. 62] or by selecting Session->Conversion Wizards->Convert Application
Session To Offline from the main menu.
To control CPU profiling, triggering of heap dumps and saving of snapshots during an offline
profiling session, you can use the
• Profiling API
JProfiler's profiling API [p. 271] allows you to control the profiling agent from your own code.
An example on how to use the offline profiling API is available in the
$JPROFILER_HOME/api/samples/offline directory.
• Triggers
With triggers [p. 94] , you can define all profiling actions in the JProfiler GUI.
• JProfiler MBean
On Java 1.5+, the profiling agent registers an MBean that gives access to all profiling actions.
MBeans are configurable in jconsole:
267
Most methods of the com.jprofiler.api.agent.Controller are reflected in the MBean.
For documentation of the MBean operations, please see the javadoc of
com.jprofiler.api.agent.mbean.RemoteControllerMBean.
The MBean may also be accessible via configuration facilities of an application server or other
tools.
• Command line controller
With Java 1.5+, you can use the command line controller tool [p. 268] to interactively record
profiling data and save snapshots in a convenient way without having to use a separate MBean
viewer.
If wish to analyze profiling information at run-time, you can use the profiling platform that is
part of JProfiler. Please see the javadoc in $JPROFILER_HOME/api/javadoc and the sample in
$JPROFILER_HOME/api/samples/platform for more information.
B.8.2 Command Line Controller
For offline profiling [p. 265] , JProfiler also offers the possibility to attach to the profiled JVM with
a command line application in order to interactively start and stop recording and save snapshots.
All operations that are supported by the JProfiler MBean, are also supported by this command
line tool. Since MBean technology is used, this command line application does not work with 1.4
JVMs.
When you start the jpcontroller executable without arguments, it attempts to connect to a
profiled JVM on the local machine. If multiple profiled JVMs were discovered, you can select one
from a list. Since the discovery mechanism uses the attach API of the Sun/Oracle JVM, this only
works for Sun/Oracle JVMs 1.6 and above.
For 1.5 JVMs and other JVM vendors, you have to pass the VM parameter
-Djprofiler.jmxServerPort=[port] to the profiled JVM. An MBean server will be published
on that port and you can specify the chosen port as an argument to jpcontroller. With the
additional VM parameter -Djprofiler.jmxPasswordFile=[file] you can specify a properties
file with key value pairs of the form user=password to set up authentication. Note that these
268
VM parameters are overridden by the default com.sun.management.jmxremote.port VM
parameter.
With the explicit setup of the JMX server, you can use the command line controller to connect
to a remote server. Invoking jpcontroller host:port will try to make a connection to the
remote host host. If the remote computer is only reachable via an IP address, please add
-Djava.rmi.server.hostname=[IP address] as a VM parameter to the remote VM, otherwise
the connection cannot be established.
The supported arguments of jpcontroller are described below:
Usage: jpcontroller [host:port] | [pid]
* if no argument is given, jpcontroller attempts to discover local JVMs that
are being profiled
* if a single number is specified, jpcontroller attempts to connect to the JVM
with process ID [pid]. If that JVM is not profiled, jpcontroller cannot
connect. In that case, use the jpenable utility first.
* otherwise, jpcontroller connects to "host:port", where port is the value
that has been specified in the VM parameter -Djprofiler.jmxServerPort=[port]
for the profiled JVM.
B.8.3 Using JProfiler With Ant
Integrating JProfiler with your ant script (read about ant at ant.apache.org) is easy. Just use the
profile task that is provided in {JProfiler installation directory}/bin/ant.jar
instead of the java task. The profile task drop in replacement for the the java as it supports all
its attributes and nested tasks. In addition, it has a number of additional attributes that govern
how the application is profiled.
Note: At least ant 1.6.3 is required for the profile task to work.
To make the profile task available to ant, you must first insert a taskdef element that tells
ant where to find the task definition. Here is an example of using the task in an ant build file:
<taskdef name="profile"
classname="com.jprofiler.ant.ProfileTask"
classpath="C:\Program Files\jprofiler7\bin\ant.jar"/>
<target name="profile">
<profile classname="MyMainClass" offline="true" sessionid="80">
<classpath>
<fileset dir="lib" includes="*.jar" />
</classpath>
</profile>
</target>
The taskdef definition must occur only once per ant-build file and can appear anywhere on the
top level below the project element.
Note: it is not possible to copy the ant.jar archive to the lib folder of your ant distribution.
You have to reference a full installation of JProfiler in the task definition.
Besides the attributes of the java task, the profile task supports the following additional
attributes:
Attribute
offline
Description
Required
Whether the profiling run should be in offline mode [p. 265] .
Corresponds to the offline library parameter [p. 111] . Either
true or false.
No, offline and
nowait cannot
both be true
269
nowait
Whether profiling should start immediately or whether the
profiled JVM should wait for a connection from the JProfiler
GUI. Corresponds to the nowait library parameter [p. 111] .
Either true or false.
sessionid
Defines the session id from which profiling settings should be
taken. Has no effect if neither nowait nor offline are set
because in that case the profiling session is selected in the
GUI. Corresponds to the id library parameter [p. 111] .
Required if
• offline is set
• nowait is set
and
the
profiled JVM
has a version
of 1.5 or earlier
configfile
Defines the config file from which the profiling settings should
be read. If not set or empty, the default config file location will
be taken ($HOME/.jprofiler8/config.xml). Has no effect if
neither nowait nor offline are set because in that case the
profiling session is selected in the GUI. Corresponds to the
config library parameter [p. 111] .
No
port
Defines the port number on which the profiling agent should
listen for a connection from the JProfiler GUI. This must be
the same as the port configured in the remote session
configuration. If not set or zero, the default port (8849) will be
used. Has no effect if offline is set because in that case there's
no connection from the GUI. Corresponds to the port library
parameter [p. 111] .
No
If the generated snapshots have heap dumps in them, you can then use the analyze ant task
to prepare the heap dump analysis in advance [p. 119] . This is an alternative to calling the
jpanalyze executable directly as described for offline profiling [p. 265] .
Here is an example of using the task in an ant build file:
<taskdef name="analyze"
classname="com.jprofiler.ant.AnalyzeTask"
classpath="C:\Program Files\jprofiler7\bin\ant.jar"/>
<target name="analyze">
<analyze>
<fileset dir="output" includes="*.jps" />
</analyze>
</target>
This will prepare heap dump analyses for all snapshot files in the "output" directory.
Besides the file set for the snapshot files to by analyzed, the analyze task supports the following
additional attributes:
Attribute
format
Description
Required
One of "dir", "tar" or "tgz". By default, the directory format
is used. These options correspond to the heap dump
analysis saving options [p. 119] in the general settings.
No
270
removeunreferenced
Corresponds to the "Remove unreferenced and weakly
referenced objects" option in the heap walker options
dialog [p. 161] . Either true or false.
No
retained
Corresponds to the "Calculate retained sizes" option in
the heap walker options dialog [p. 161] . Either true or
false. If set to true, removeunreferenced will be set
to to true as well.
No
B.8.4 Profiling API
JProfiler provides a profiling API that allows you to control certain aspects of profiling at run time.
The profiling API is contained in bin/agent.jar in your JProfiler installation. If the profiling API
is used during a normal execution of your application, the API calls will just quietly do nothing.
For offline profiling [p. 265] , you will need to save a snapshot at some point in order to evaluate
the data of the profiling run with JProfiler's GUI front end later on. The saveSnapshot and
saveSnapshotOnExit methods in JProfiler's profiling API do that job. For interactive use, these
method calls will do nothing.
In addition, you can optionally switch on CPU profiling a a suitable point and trigger heap dumps
with the profiling API.
271
B.9 Command Line Export
B.9.1 Snapshots
B.9.1.1 Command Line Export
JProfiler's command line export facility allows you to take a saved snapshot and export a number
of views as HTML, CSV or XML. This is especially convenient if you use offline profiling [p. 265]
and wish to generate reports in an automated fashion. Views with an interactive selection process
like the heap walker or the method graph cannot be exported with this method.
There are two ways to use the command line export:
• with the special command line executable [p. 273]
• with the ant task [p. 280]
In both cases you specify a number of view names together with a set of options. Each view has
its own set of options. The options can be used to adjust the presentation and the displayed
data. For each GUI component in JProfiler that lets you choose the displayed data, like aggregation
level or thread selection, an option is provided that allows you to perform the same selection
for the command line export.
Most views in JProfiler support multiple output formats. By default, the output format is deduced
from the extension of the output file:
• .html
export as HTML file. Note that a directory named jprofiler_images will be created that
contains images used in the HTML page.
• .csv
export as CSV data, the first line contains the column names.
Note: When using Microsoft Excel, CSV is not a stable format. Microsoft Excel on Windows
takes the separator character from the regional settings. JProfiler uses a semicolon as the
separator in locales that use a comma as a decimal separator and a comma in locales that
use a dot as a decimal separator. If you need to override the CSV separator character you can
do so by setting -Djprofiler.csvSeparator in bin/export.vmoptions.
• .xml
export as XML data. The data format is self-descriptive.
If you would like to use different extensions, you can use the format option to override the
choice of the output format.
When you save a snapshot, the session configuration is saved in the snapshot file. The snapshot
loses the connection to the session configuration under which is was recorded. For this reason,
you cannot edit the view settings in the original session to change presentation aspects of the
HTML export. With the global session option, you can specify a session id whose view settings
should be used for the export. The session id can be found in the application settings next to
the session name.
The export will fail if
• the specified snapshot file does not exist
• you specify an unrecognized option
• you specify an unrecognized view name
272
• the output file cannot be written
• an option has an invalid value
• an option leads to an invalid selection in JProfiler, e.g. if a class cannot be found
You can choose to ignore errors by using the global ignoreerrors option.
B.9.1.2 Command Line Export Executable
The command line export executable can be used to export views from a saved snapshot. For
more information please consult the overview [p. 272] .
The export executable is named jpexport.exe on Windows and jpexport on Unix-based
operating systems and is located in the bin directory of a JProfiler installation. If you execute it
with the -help option, you will get help on the available view names and view options:
Usage: jpexport "snapshot file" [global options]
"view name" [options] "output file"
"view name" [options] "output file" ...
where "snapshot file" is a snapshot file with one of the extensions:
.jps, .hprof, .hpz, .phd
"view name" is one of the view names listed below
[options] is a list of options in the format -option=value
"output file" is the output file for the export
Global options:
-obfuscator=none|proguard|yguard
Deobfuscate for the selected obfuscator. Defaults to "none", for other
values the mappingFile option has to be specified.
-mappingfile=[file]
The mapping file for the selected obfuscator.
-outputdir=[output directory]
Base directory to be used when the output file for a view is a
relative file.
-ignoreerrors=true|false
Ignore errors that occur when options for a view cannot be set and
continue with the next view. The default value is "false", i.e. the
export is terminated, when the first error occurs.
-session=[session id]
An alternate session from which the view settings should be taken. The
session id can be found in the application settings next to the
session name. By default, the view settings are taken from the session
that is embedded inside the snapshot file.
Available view names and options:
* AllObjects
options:
-format=html|csv
Determines the output format of the exported file. If not present, the
export format will be determined from the extension of the output
file.
-viewfilters=[comma-separated list]
Sets view filters for the export. If you set view filters, only the
specified packages and their sub-packages will be displayed by the
exported view.
-aggregation=class|package|component
Selects the aggregation level for the export. The default value is
classes.
-expandpackages=true|false
Expand package nodes in the package aggregation level to show
contained classes. The default value is "false". Has no effect for
other aggregation levels.
273
* RecordedObjects
options:
-format=html|csv
Determines the output format of the exported file. If not present, the
export format will be determined from the extension of the output
file.
-viewfilters=[comma-separated list]
Sets view filters for the export. If you set view filters, only the
specified packages and their sub-packages will be displayed by the
exported view.
-aggregation=class|package|component
Selects the aggregation level for the export. The default value is
classes.
-expandpackages=true|false
Expand package nodes in the package aggregation level to show
contained classes. The default value is "false". Has no effect for
other aggregation levels.
-liveness=live|gc|all
Selects the liveness mode for the export, i.e. whether to display live
objects, garbage collected objects or both. The default value is live
objects.
* AllocationTree
options:
-format=html|xml
Determines the output format of the exported file. If not present, the
export format will be determined from the extension of the output
file.
-viewfilters=[comma-separated list]
Sets view filters for the export. If you set view filters, only the
specified packages and their sub-packages will be displayed by the
exported view.
-aggregation=method|class|package|component
Selects the aggregation level for the export. The default value is
methods.
-viewmode=tree|treemap
Selects the view mode for the export. The default value is "tree".
-width=[number of pixels]
Minimum width of the tree map in pixels. The default value is 800.
Only relevant if "viewmode" is set to "tree".
-height=[number of pixels]
Minimum height of the tree map in pixels. The default value is 600.
Only relevant if "viewmode" is set to "tree".
-class=[fully qualified class name]
Specifies the class for which the allocation data should be
calculated. If empty, allocations of all classes will be shown. Cannot
be used together with the package option.
-package=[fully qualified package name]
Specifies the package for which the allocation data should be
calculated. If empty, allocations of all packages will be shown.
Cannot be used together with the class option.
-liveness=live|gc|all
Selects the liveness mode for the export, i.e. whether to display live
objects, garbage collected objects or both. The default value is live
objects.
* AllocationHotSpots
options:
-format=html|csv|xml
Determines the output format of the exported file. If not present, the
export format will be determined from the extension of the output
file.
-viewfilters=[comma-separated list]
Sets view filters for the export. If you set view filters, only the
specified packages and their sub-packages will be displayed by the
274
exported view.
-aggregation=method|class|package|component
Selects the aggregation level for the export. The default value is
methods.
-class=[fully qualified class name]
Specifies the class for which the allocation data should be
calculated. If empty, allocations of all classes will be shown. Cannot
be used together with the package option.
-package=[fully qualified package name]
Specifies the package for which the allocation data should be
calculated. If empty, allocations of all packages will be shown.
Cannot be used together with the class option.
-liveness=live|gc|all
Selects the liveness mode for the export, i.e. whether to display live
objects, garbage collected objects or both. The default value is live
objects.
-filteredclasses=separately|addtocalling
Selects if filtered classes should be shown separately or be added to
the calling class. The default value is to show filtered classes
separately.
-expandbacktraces=true|false
Expand backtraces in HTML or XML format. The default value is "false".
* ClassTracker
options:
-format=html|csv
Determines the output format of the exported file. If not present, the
export format will be determined from the extension of the output
file.
-minwidth=[number of pixels]
Minimum width of the graph window in pixels. The default value is 800.
-minheight=[number of pixels]
Minimum height of the graph window in pixels. The default value is
600.
* CallTree
options:
-format=html|xml
Determines the output format of the exported file. If not present, the
export format will be determined from the extension of the output
file.
-viewfilters=[comma-separated list]
Sets view filters for the export. If you set view filters, only the
specified packages and their sub-packages will be displayed by the
exported view.
-aggregation=method|class|package|component
Selects the aggregation level for the export. The default value is
methods.
-viewmode=tree|treemap
Selects the view mode for the export. The default value is "tree".
-width=[number of pixels]
Minimum width of the tree map in pixels. The default value is 800.
Only relevant if "viewmode" is set to "tree".
-height=[number of pixels]
Minimum height of the tree map in pixels. The default value is 600.
Only relevant if "viewmode" is set to "tree".
-threadgroup=[name of thread group]
Selects the thread group for the export. If you specify thread as well
, the thread will only be searched in this thread group, otherwise the
entire thread group will be shown.
-thread=[name of thread]
Selects the thread for the export. By default, the call tree is merged
for all threads.
-threadstatus=all|running|waiting|blocking|netio
Selects the thread status for the export. The default value is the
275
runnable state.
* HotSpots
options:
-format=html|csv|xml
Determines the output format of the exported file. If not present, the
export format will be determined from the extension of the output
file.
-viewfilters=[comma-separated list]
Sets view filters for the export. If you set view filters, only the
specified packages and their sub-packages will be displayed by the
exported view.
-aggregation=method|class|package|component
Selects the aggregation level for the export. The default value is
methods.
-threadgroup=[name of thread group]
Selects the thread group for the export. If you specify thread as well
, the thread will only be searched in this thread group, otherwise the
entire thread group will be shown.
-thread=[name of thread]
Selects the thread for the export. By default, the call tree is merged
for all threads.
-threadstatus=all|running|waiting|blocking|netio
Selects the thread status for the export. The default value is the
runnable state.
-expandbacktraces=true|false
Expand backtraces in HTML or XML format. The default value is "false".
-filteredclasses=separately|addtocalling
Selects if filtered classes should be shown separately or be added to
the calling class. The default value is to show filtered classes
separately.
* MethodStatistics
options:
-format=html|csv
Determines the output format of the exported file. If not present, the
export format will be determined from the extension of the output
file.
-threadstatus=all|running|waiting|blocking|netio
Selects the thread status for the export. The default value is the
runnable state.
-viewfilters=[comma-separated list]
Sets view filters for the export. If you set view filters, only the
specified packages and their sub-packages will be displayed by the
exported view.
* ThreadHistory
options:
-format=html
Determines the output format of the exported file. If not present, the
export format will be determined from the extension of the output
file.
-minwidth=[number of pixels]
Minimum width of the graph window in pixels. The default value is 800.
-minheight=[number of pixels]
Minimum height of the graph window in pixels. The default value is
600.
* ThreadMonitor
options:
-format=html|csv
Determines the output format of the exported file. If not present, the
export format will be determined from the extension of the output
file.
276
* CurrentMonitorUsage
options:
-format=html|csv
Determines the output format of the exported file. If not present, the
export format will be determined from the extension of the output
file.
* MonitorUsageHistory
options:
-format=html|csv
Determines the output format of the exported file. If not present, the
export format will be determined from the extension of the output
file.
* MonitorUsageStatistics
options:
-format=html|csv
Determines the output format of the exported file. If not present, the
export format will be determined from the extension of the output
file.
-type=monitors|threads|classes
Selects the entity for which the monitor statistics should be
calculated. The default value is "monitors".
* TelemetryHeap
options:
-format=html|csv
Determines the output format of the exported file. If not present, the
export format will be determined from the extension of the output
file.
-minwidth=[number of pixels]
Minimum width of the graph window in pixels. The default value is 800.
-minheight=[number of pixels]
Minimum height of the graph window in pixels. The default value is
600.
* TelemetryObjects
options:
-format=html|csv
Determines the output format of the exported file. If not present, the
export format will be determined from the extension of the output
file.
-minwidth=[number of pixels]
Minimum width of the graph window in pixels. The default value is 800.
-minheight=[number of pixels]
Minimum height of the graph window in pixels. The default value is
600.
* TelemetryThroughput
options:
-format=html|csv
Determines the output format of the exported file. If not present, the
export format will be determined from the extension of the output
file.
-minwidth=[number of pixels]
Minimum width of the graph window in pixels. The default value is 800.
-minheight=[number of pixels]
Minimum height of the graph window in pixels. The default value is
600.
* TelemetryGC
options:
-format=html|csv
Determines the output format of the exported file. If not present, the
export format will be determined from the extension of the output
277
file.
-minwidth=[number of pixels]
Minimum width of the graph window in pixels. The default value is 800.
-minheight=[number of pixels]
Minimum height of the graph window in pixels. The default value is
600.
* TelemetryClasses
options:
-format=html|csv
Determines the output format of the exported file. If not present, the
export format will be determined from the extension of the output
file.
-minwidth=[number of pixels]
Minimum width of the graph window in pixels. The default value is 800.
-minheight=[number of pixels]
Minimum height of the graph window in pixels. The default value is
600.
* TelemetryThreads
options:
-format=html|csv
Determines the output format of the exported file. If not present, the
export format will be determined from the extension of the output
file.
-minwidth=[number of pixels]
Minimum width of the graph window in pixels. The default value is 800.
-minheight=[number of pixels]
Minimum height of the graph window in pixels. The default value is
600.
* TelemetryCPU
options:
-format=html|csv
Determines the output format of the exported file. If not present, the
export format will be determined from the extension of the output
file.
-minwidth=[number of pixels]
Minimum width of the graph window in pixels. The default value is 800.
-minheight=[number of pixels]
Minimum height of the graph window in pixels. The default value is
600.
* Bookmarks
options:
-format=html|csv
Determines the output format of the exported file. If not present, the
export format will be determined from the extension of the output
file.
* ProbeTimeLine
options:
-probeid=[id]
The internal ID of the probe that should be exported. Run "jpexport
--listProbes" to list all available built-in probes and for an
explanation of custom probe names.
-format=html
Determines the output format of the exported file. If not present, the
export format will be determined from the extension of the output
file.
-minwidth=[number of pixels]
Minimum width of the graph window in pixels. The default value is 800.
-minheight=[number of pixels]
Minimum height of the graph window in pixels. The default value is
600.
278
* ProbeControlObjects
options:
-probeid=[id]
The internal ID of the probe that should be exported. Run "jpexport
--listProbes" to list all available built-in probes and for an
explanation of custom probe names.
-format=html|csv
Determines the output format of the exported file. If not present, the
export format will be determined from the extension of the output
file.
* ProbeHotSpots
options:
-probeid=[id]
The internal ID of the probe that should be exported. Run "jpexport
--listProbes" to list all available built-in probes and for an
explanation of custom probe names.
-format=html|csv|xml
Determines the output format of the exported file. If not present, the
export format will be determined from the extension of the output
file.
-viewfilters=[comma-separated list]
Sets view filters for the export. If you set view filters, only the
specified packages and their sub-packages will be displayed by the
exported view.
-aggregation=method|class|package|component
Selects the aggregation level for the export. The default value is
methods.
-threadgroup=[name of thread group]
Selects the thread group for the export. If you specify thread as well
, the thread will only be searched in this thread group, otherwise the
entire thread group will be shown.
-thread=[name of thread]
Selects the thread for the export. By default, the call tree is merged
for all threads.
-threadstatus=all|running|waiting|blocking|netio
Selects the thread status for the export. The default value is the
runnable state.
-expandbacktraces=true|false
Expand backtraces in HTML or XML format. The default value is "false".
* ProbeTelemetry
options:
-probeid=[id]
The internal ID of the probe that should be exported. Run "jpexport
--listProbes" to list all available built-in probes and for an
explanation of custom probe names.
-telemetrygroup
Sets the one-based index of the telemetry group that should be
exported. This refers to the the entries that you see in the drop-down
list above the probe telemetry view. The default value is "1".
-format=html|csv
Determines the output format of the exported file. If not present, the
export format will be determined from the extension of the output
file.
-minwidth=[number of pixels]
Minimum width of the graph window in pixels. The default value is 800.
-minheight=[number of pixels]
Minimum height of the graph window in pixels. The default value is
600.
* ProbeEvents
options:
-probeid=[id]
279
The internal ID of the probe that should be exported. Run "jpexport
--listProbes" to list all available built-in probes and for an
explanation of custom probe names.
-format=html|csv|xml
Determines the output format of the exported file. If not present, the
export format will be determined from the extension of the output
file.
* ProbeTracker
options:
-probeid=[id]
The internal ID of the probe that should be exported. Run "jpexport
--listProbes" to list all available built-in probes and for an
explanation of custom probe names.
-format=html|csv
Determines the output format of the exported file. If not present, the
export format will be determined from the extension of the output
file.
-minwidth=[number of pixels]
Minimum width of the graph window in pixels. The default value is 800.
-minheight=[number of pixels]
Minimum height of the graph window in pixels. The default value is
600.
-index=[number]
Sets the zero-based index of the drop-down list that contains the
tracked elements. The default value is 0.
Examples of using the export executable are:
jpexport test.jps TelemetryHeap heap.html
jpexport test.jps RecordedObjects -aggregation=package -expandpackages=true objects.html
jpexport test.jps -ignoreerrors=true -outputdir=/tmp/export
RecordedObjects objects.csv
AllocationTree -class=java.lang.String allocations.xml
B.9.1.3 Export Ant Task
The export ant task can be used to export views from a saved snapshot. For more information
please consult the overview [p. 272] .
You can integrate the command line export with your ant script (read about ant at ant.apache.org)
by using the export task that is provided in {JProfiler
installation
directory}/bin/ant.jar.
To make the export task available to ant, you must first insert a taskdef element that tells ant
where to find the task definition. Here is an example of using the task in an ant build file:
<taskdef name="export"
classname="com.jprofiler.ant.ExportTask"
classpath="C:\Program Files\jprofiler4\bin\ant.jar"/>
<target name="export">
<export snapshotfile="c:\home\ingo\test.jps">
<view name="CallTree" file="calltree.html"/>
<view name="HotSpots" file="hotspots.html">
<option name="expandbacktraces" value="true"/>
<option name="aggregation" value="class"/>
</view>
</export>
</target>
The taskdef definition must occur only once per ant-build file and can appear anywhere on the
top level below the project element.
280
Note: it is not possible to copy the ant.jar archive to the lib folder of your ant distribution.
You have to reference a full installation of JProfiler in the task definition.
The export task supports the following attributes:
Attribute
Description
Required
snapshotfile
The path to the snapshot file. This must be a file with a .jps
extension.
Yes
session
An alternate session from which the view settings should be taken.
The session id can be found in the application settings next to the
session name. By default, the view settings are taken from the
session that is embedded inside the snapshot file.
No
ignoreerrors
Ignore errors that occur when options for a view cannot be set and
continue with the next view. The default value is "false", i.e. the
export is terminated, when the first error occurs.
No
The export task contains a list of view elements with the following attributes:
Attribute
Description
Required
name
The view name. For a list of available view names, please see the help
page on the command line executable [p. 273] . extension.
Yes
file
The output file name. The process for the output format selection is
described in the overview [p. 272] .
Yes
The view element can optionally contain a list of option elements with the following attributes:
Attribute
Description
Required
name
The option name. Each view has its own set of options. For a list of
available view names and the corresponding options, please see the
help page on the command line executable [p. 273] .
Yes
value
The value of the option.
Yes
B.9.2 Comparisons
B.9.2.1 Command Line Comparisons
JProfiler's command line comparison facility allows you to export a number of snapshot
comparisons as HTML, CSV or XML. This is especially convenient if you use offline profiling [p.
265] and wish to generate comparisons in an automated fashion.
There are two ways to programmatically generate comparisons:
• with the special command line executable [p. 282]
• with the ant task [p. 287]
In both cases you specify a number of snapshots and a number of comparison names together
with a set of options for each comparison. Each comparison has its own set of options. The
options can be used to adjust the presentation and the displayed data. For each selection step
in the comparison wizards, an option is provided that allows you to perform the same selection
for the command line comparison.
281
Most comparisons in JProfiler support multiple output formats. By default, the output format is
deduced from the extension of the output file:
• .html
export as HTML file. Note that a directory named jprofiler_images will be created that
contains images used in the HTML page.
• .csv
export as CSV data, the first line contains the column names.
Note: When using Microsoft Excel, CSV is not a stable format. Microsoft Excel on Windows
takes the separator character from the regional settings. JProfiler uses a semicolon as the
separator in locales that use a comma as a decimal separator and a comma in locales that
use a dot as a decimal separator. If you need to override the CSV separator character you can
do so by setting -Djprofiler.csvSeparator in bin/export.vmoptions.
• .xml
export as XML data. The data format is self-descriptive.
If you would like to use different extensions, you can use the format option to override the
choice of the output format.
The export will fail if
• one of the specified snapshot files does not exist
• you specify an unrecognized option
• you specify an unrecognized comparison name
• the output file cannot be written
• an option has an invalid value
• an option leads to an invalid selection in JProfiler, e.g. if a class cannot be found
You can choose to ignore errors by using the global ignoreerrors option.
B.9.2.2 Command Line Comparison Executable
The command line comparison executable can be used to generate comparisons from a number
of saved snapshot. For more information please consult the overview [p. 281] .
The comparison executable is named jpcompare.exe on Windows and jpcompare on Unix-based
operating systems and is located in the bin directory of a JProfiler installation. If you execute it
with the -help option, you will get help on the available comparison names and comparison
options:
Usage: jpcompare "snapshot file"[,"snapshot file",...] [global options]
"comparison name" [options] "output file"
"comparison name" [options] "output file" ...
where "snapshot file" is a snapshot file with one of the extensions:
.jps, .hprof, .hpz, .phd
"comparison name" is one of the comparison names listed below
[options] is a list of options in the format -option=value
"output file" is the output file for the export
Global options:
-outputdir=[output directory]
Base directory to be used when the output file for a comparison is a
relative file.
282
-ignoreerrors=true|false
Ignore errors that occur when options for a comparison cannot be set
and continue with the next comparison. The default value is "false",
i.e. the export is terminated, when the first error occurs.
-sortbytime=false|true
Sort the specified snapshot files by modification time. The default
value is false.
-listfile=[filename]
Read a file that contains the paths of the snapshot files, one
snapshot file per line.
Available comparison names and options:
* Objects
options:
-format=html|csv
Determines the output format of the exported file. If not present, the
export format will be determined from the extension of the output
file.
-viewfilters=[comma-separated list]
Sets view filters for the export. If you set view filters, only the
specified packages and their sub-packages will be displayed by the
exported view.
-objects=all|recorded|heapwalker
Compare all objects (JVMTI only) or recorded objects, or objects in
the heap walker. The default is all objects for .jps files and
heapwalker for HPROF files.
-liveness=live|gc|all
Selects the liveness mode for the export, i.e. whether to display live
objects, garbage collected objects or both. The default value is live
objects.
-aggregation=class|package|component
Selects the aggregation level for the export. The default value is
classes.
* AllocationHotSpots
options:
-format=html|csv
Determines the output format of the exported file. If not present, the
export format will be determined from the extension of the output
file.
-viewfilters=[comma-separated list]
Sets view filters for the export. If you set view filters, only the
specified packages and their sub-packages will be displayed by the
exported view.
-classselection
Calculate the comparison for a specific class or package. Specify a
package with a wildcard, like 'java.awt.*'.
-liveness=live|gc|all
Selects the liveness mode for the export, i.e. whether to display live
objects, garbage collected objects or both. The default value is live
objects.
-aggregation=method|class|package|component
Selects the aggregation level for the export. The default value is
methods.
-filteredclasses=separately|addtocalling
Selects if filtered classes should be shown separately or be added to
the calling class. The default value is to show filtered classes
separately.
* AllocationTree
options:
-format=html|xml
Determines the output format of the exported file. If not present, the
export format will be determined from the extension of the output
file.
283
-viewfilters=[comma-separated list]
Sets view filters for the export. If you set view filters, only the
specified packages and their sub-packages will be displayed by the
exported view.
-classselection
Calculate the comparison for a specific class or package. Specify a
package with a wildcard, like 'java.awt.*'.
-liveness=live|gc|all
Selects the liveness mode for the export, i.e. whether to display live
objects, garbage collected objects or both. The default value is live
objects.
* HotSpots
options:
-format=html|csv
Determines the output format of the exported file. If not present, the
export format will be determined from the extension of the output
file.
-viewfilters=[comma-separated list]
Sets view filters for the export. If you set view filters, only the
specified packages and their sub-packages will be displayed by the
exported view.
-firstthreadselection
Calculate the comparison for a specific thread or thread group.
Specify thread groups like 'group.*' and threads in specific thread
groups like 'group.thread'. Escape dots in thread names with
backslashes.
-secondthreadselection
Calculate the comparison for a specific thread or thread group. Only
available if 'firstthreadselection' is set. If empty, the same value
as for 'firstthreadselection' will be used. Specify thread groups like
'group.*' and threads in specific thread groups like 'group.thread'.
Escape dots in thread names with backslashes.
-threadstatus=all|running|waiting|blocking|netio
Selects the thread status for the export. The default value is the
runnable state.
-aggregation=method|class|package|component
Selects the aggregation level for the export. The default value is
methods.
-differencecalculation=total|average
Selects the difference calculation method for call times. The default
value is total times.
-filteredclasses=separately|addtocalling
Selects if filtered classes should be shown separately or be added to
the calling class. The default value is to show filtered classes
separately.
* CallTree
options:
-format=html|xml
Determines the output format of the exported file. If not present, the
export format will be determined from the extension of the output
file.
-viewfilters=[comma-separated list]
Sets view filters for the export. If you set view filters, only the
specified packages and their sub-packages will be displayed by the
exported view.
-firstthreadselection
Calculate the comparison for a specific thread or thread group.
Specify thread groups like 'group.*' and threads in specific thread
groups like 'group.thread'. Escape dots in thread names with
backslashes.
-secondthreadselection
Calculate the comparison for a specific thread or thread group. Only
available if 'firstthreadselection' is set. If empty, the same value
284
as for 'firstthreadselection' will be used. Specify thread groups like
'group.*' and threads in specific thread groups like 'group.thread'.
Escape dots in thread names with backslashes.
-threadstatus=all|running|waiting|blocking|netio
Selects the thread status for the export. The default value is the
runnable state.
-aggregation=method|class|package|component
Selects the aggregation level for the export. The default value is
methods.
-differencecalculation=total|average
Selects the difference calculation method for call times. The default
value is total times.
* TelemetryHeap
options:
-format=html|csv
Determines the output format of the exported file. If not present, the
export format will be determined from the extension of the output
file.
-minwidth=[number of pixels]
Minimum width of the graph window in pixels. The default value is 800.
-minheight=[number of pixels]
Minimum height of the graph window in pixels. The default value is
600.
-valuetype=current|maximum|bookmark
Type of the value that is calculated for each snapshot. Default is the
current value.
-bookmarkname
If valuetype is set to 'bookmark', the name of the bookmark for which
the value should be calculated.
-measurements=maximum,free,used
Measurements that are shown in the comparison graph. Concatenate
multiple values with commas. The default value is 'used'.
-memorytype=heap|nonheap
Type of the memory that should be analyzed. Default is 'heap'.
-memorypool
If a special memory pool should be analyzed, its name can be specified
with this parameter. The default is empty, i.e. no special memory
pool.
* TelemetryObjects
options:
-format=html|csv
Determines the output format of the exported file. If not present, the
export format will be determined from the extension of the output
file.
-minwidth=[number of pixels]
Minimum width of the graph window in pixels. The default value is 800.
-minheight=[number of pixels]
Minimum height of the graph window in pixels. The default value is
600.
-valuetype=current|maximum|bookmark
Type of the value that is calculated for each snapshot. Default is the
current value.
-bookmarkname
If valuetype is set to 'bookmark', the name of the bookmark for which
the value should be calculated.
-measurements=total,nonarrays,arrays
Measurements that are shown in the comparison graph. Concatenate
multiple values with commas. The default value is 'total'.
* TelemetryClasses
options:
-format=html|csv
Determines the output format of the exported file. If not present, the
285
export format will be determined from the extension of the output
file.
-minwidth=[number of pixels]
Minimum width of the graph window in pixels. The default value is 800.
-minheight=[number of pixels]
Minimum height of the graph window in pixels. The default value is
600.
-valuetype=current|maximum|bookmark
Type of the value that is calculated for each snapshot. Default is the
current value.
-bookmarkname
If valuetype is set to 'bookmark', the name of the bookmark for which
the value should be calculated.
-measurements=total,filtered,unfiltered
Measurements that are shown in the comparison graph. Concatenate
multiple values with commas. The default value is 'total'.
* TelemetryThreads
options:
-format=html|csv
Determines the output format of the exported file. If not present, the
export format will be determined from the extension of the output
file.
-minwidth=[number of pixels]
Minimum width of the graph window in pixels. The default value is 800.
-minheight=[number of pixels]
Minimum height of the graph window in pixels. The default value is
600.
-valuetype=current|maximum|bookmark
Type of the value that is calculated for each snapshot. Default is the
current value.
-bookmarkname
If valuetype is set to 'bookmark', the name of the bookmark for which
the value should be calculated.
-measurements=total,runnable,waiting,netio,waiting
Measurements that are shown in the comparison graph. Concatenate
multiple values with commas. The default value is 'total'.
* ProbeHotSpots
options:
-format=html|csv
Determines the output format of the exported file. If not present, the
export format will be determined from the extension of the output
file.
-viewfilters=[comma-separated list]
Sets view filters for the export. If you set view filters, only the
specified packages and their sub-packages will be displayed by the
exported view.
-firstthreadselection
Calculate the comparison for a specific thread or thread group.
Specify thread groups like 'group.*' and threads in specific thread
groups like 'group.thread'. Escape dots in thread names with
backslashes.
-secondthreadselection
Calculate the comparison for a specific thread or thread group. Only
available if 'firstthreadselection' is set. If empty, the same value
as for 'firstthreadselection' will be used. Specify thread groups like
'group.*' and threads in specific thread groups like 'group.thread'.
Escape dots in thread names with backslashes.
-threadstatus=all|running|waiting|blocking|netio
Selects the thread status for the export. The default value is the
runnable state.
-aggregation=method|class|package|component
Selects the aggregation level for the export. The default value is
methods.
286
-differencecalculation=total|average
Selects the difference calculation method for call times. The default
value is total times.
-probeid=[id]
The internal ID of the probe that should be exported. Run "jpexport
--listProbes" to list all available built-in probes and for an
explanation of custom probe names.
* ProbeTelemetry
options:
-format=html|csv
Determines the output format of the exported file. If not present, the
export format will be determined from the extension of the output
file.
-minwidth=[number of pixels]
Minimum width of the graph window in pixels. The default value is 800.
-minheight=[number of pixels]
Minimum height of the graph window in pixels. The default value is
600.
-valuetype=current|maximum|bookmark
Type of the value that is calculated for each snapshot. Default is the
current value.
-bookmarkname
If valuetype is set to 'bookmark', the name of the bookmark for which
the value should be calculated.
-measurements
The one-based indices of the measurements in the telemetry group that
are shown in the comparison graph. Concatenate multiple values with
commas, like "1,2". The default value is to show all measurements.
-probeid=[id]
The internal ID of the probe that should be exported. Run "jpexport
--listProbes" to list all available built-in probes and for an
explanation of custom probe names.
-telemetrygroup
Sets the one-based index of the telemetry group that should be
exported. This refers to the the entries that you see in the drop-down
list above the probe telemetry view. The default value is "1".
Examples of using the comparison executable are:
jpcompare test1.jps,test2.jps,test3.jps TelemetryHeap heap.html
jpcompare test1.jps,test2.jps -sortbytime Objects -objects=recorded -aggregation=package
objects.html
jpcompare -listfile=snapshots.txt -ignoreerrors=true -outputdir=/tmp/export
Objects objects.csv
AllocationTree -class=java.lang.String allocations.xml
B.9.2.3 Comparison Ant Task
The comparison ant task can be used to generate comparisons from a number of saved snapshots.
For more information please consult the overview [p. 281] .
You can integrate the command line comparison with your ant script (read about ant at
ant.apache.org) by using the compare task that is provided in {JProfiler installation
directory}/bin/ant.jar.
To make the compare task available to ant, you must first insert a taskdef element that tells
ant where to find the task definition. Here is an example of using the task in an ant build file:
<taskdef name="compare"
classname="com.jprofiler.ant.CompareTask"
classpath="C:\Program Files\jprofiler7\bin\ant.jar"/>
<target name="compare">
287
<compare sortbytime="true">
<fileset dir=".">
<include name="*.jps" />
</fileset>
<comparison name="TelemetryHeap" file="heap.html"/>
<comparison name="TelemetryThreads" file="threads.html">
<option name="measurements" value="inactive,active"/>
<option name="valuetype" value="bookmark"/>
<option name="bookmarkname" value="test"/>
</comparison>
</compare>
</target>
The taskdef definition must occur only once per ant-build file and can appear anywhere on the
top level below the project element.
Note: it is not possible to copy the ant.jar archive to the lib folder of your ant distribution.
You have to reference a full installation of JProfiler in the task definition.
The compare task supports the following attributes:
Attribute
Description
Required
listfile
An file that contains a list of snapshot files that should be
compared, one snapshot per line. The snapshot from a
nested fileset will be prepended.
Only if no nested
fileset is specified
sortbytime
Sort all supplied snapshot files by their file modification
time.
No
ignoreerrors
Ignore errors that occur when options for a comparison
cannot be set and continue with the next comparison. The
default value is "false", i.e. the export is terminated, when
the first error occurs.
No
The compare task can contain nested fileset elements to specify the snapshots that should be
compared. If no fileset is specified, the listfile attribute of the compare task must be set.
The compare task contains a list of comparison elements with the following attributes:
Attribute
Description
Required
name
The comparison name. For a list of available comparison names,
please see the help page on the command line executable [p. 282] .
extension.
Yes
file
The output file name. The process for the output format selection is
described in the overview [p. 281] .
Yes
The comparison element can optionally contain a list of option elements with the following
attributes:
Attribute
Description
Required
name
The option name. Each comparison has its own set of options. For a
list of available comparison names and the corresponding options,
please see the help page on the command line executable [p. 282] .
Yes
value
The value of the option.
Yes
288


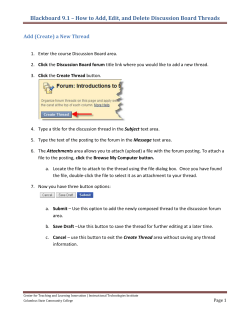


© Copyright 2026