
The metabolic signature associated with the Open Access
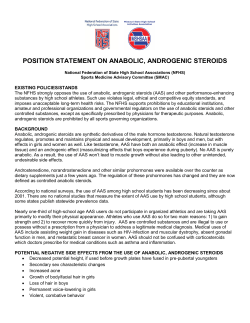
Bouchard-Mercier et al. Nutrition Journal 2013, 12:158
http://www.nutritionj.com/content/12/1/158
RESEARCH
Open Access
The metabolic signature associated with the
Western dietary pattern: a cross-sectional study
Annie Bouchard-Mercier1,2,3, Iwona Rudkowska1,3, Simone Lemieux1,2, Patrick Couture1,3 and Marie-Claude Vohl1,2,3*
Abstract
Background: Metabolic profiles have been shown to be associated to obesity status and insulin sensitivity. Dietary
intakes influence metabolic pathways and therefore, different dietary patterns may relate to modifications in metabolic
signatures. The objective was to verify associations between dietary patterns and metabolic profiles composed of amino
acids (AAs) and acylcarnitines (ACs).
Methods: 210 participants were recruited in the greater Quebec City area between September 2009 and December 2011.
Dietary patterns had been previously derived using principal component analysis (PCA). The Prudent dietary pattern was
characterised by higher intakes of vegetables, fruits, whole grain products, non-hydrogenated fat and lower intakes
of refined grain products, whereas the Western dietary pattern was associated with higher intakes of refined grain
products, desserts, sweets and processed meats. Targeted metabolites were quantified in 37 participants with the
Biocrates Absolute IDQ p150 (Biocrates Life Sciences AG, Austria) mass spectrometry method (including 14 amino
acids and 41 acylcarnitines).
Results: PCA analysis with metabolites including AAs and ACs revealed two main components explaining the most
variance in overall data (13.8%). PC1 was composed mostly of medium- to long-chain ACs (C16:2, C14:2, C14:2-OH,
C16, C14:1-OH, C14:1, C10:2, C5-DC/C6-OH, C12, C18:2, C10, C4:1-DC/C6, C8:1 and C2) whereas PC2 included certain
AAs and short-chain ACs (xLeu, Met, Arg, Phe, Pro, Orn, His, C0, C3, C4 and C5). The Western dietary pattern
correlated negatively with PC1 and positively with PC2 (r = −0.34, p = 0.05 and r = 0.38, p = 0.03, respectively),
independently of age, sex and BMI.
Conclusion: These findings suggest that the Western dietary pattern is associated with a specific metabolite
signature characterized by increased levels of AAs including branched-chain AAs (BCAAs) and short-chain ACs.
Trial registration: NCT01343342
Keywords: Dietary pattern, Western dietary pattern, Prudent dietary pattern, Acylcarnitine, Amino acids,
Branched-chain amino acids, Metabolites
Background
Single nutrients or single food components have been
frequently studied in order to achieve a better understanding of their impact on health and on the development of chronic diseases. Many studies have also observed
the effects of global diets or dietary patterns such as the
Mediterranean diet on chronic diseases. Studying the effects of dietary patterns takes into account the interactions
* Correspondence: [email protected]
1
Institute of Nutrition and Functional Foods (INAF), Laval University, 2440
Hochelaga Blvd., Quebec G1V 0A6, Canada
2
Department of Food Science and Nutrition, Laval University, 2425 de
l’Agriculture St, Quebec G1K 7P4, Canada
Full list of author information is available at the end of the article
between nutrients [1]. Dietary patterns derived by principal component analysis (PCA) depict a portrait of the
foods that are mainly consumed together within a population [1]. Dietary patterns, such as the Prudent (or Healthy
pattern) and the Western dietary patterns have been associated positively or inversely with cardiovascular disease
risk factors and mortality, as well as with certain types of
cancer such as colorectal cancer [2-4]. Dietary patterns
have also been associated with type 2 diabetes or related
metabolic parameters. Schulze et al. [5] observed an association between the risk of type 2 diabetes and a dietary pattern high in foods such as sugar-sweetened soft
drinks, refined grains as well as processed meats and
© 2013 Bouchard-Mercier et al.; licensee BioMed Central Ltd. This is an Open Access article distributed under the terms of the
Creative Commons Attribution License (http://creativecommons.org/licenses/by/2.0), which permits unrestricted use,
distribution, and reproduction in any medium, provided the original work is properly cited. The Creative Commons Public
Domain Dedication waiver (http://creativecommons.org/publicdomain/zero/1.0/) applies to the data made available in this
article, unless otherwise stated.
Bouchard-Mercier et al. Nutrition Journal 2013, 12:158
http://www.nutritionj.com/content/12/1/158
low vegetable intake. In addition, Heidemann et al. [6]
reported a decreased risk of type 2 diabetes with a dietary
pattern characterised by high intakes of fruits and low intakes of foods such as high-caloric soft drinks and meats.
These results have been confirmed by Esposito et al. [7] in
a recent systematic review which observed that dietary
patterns characterized by high intakes of fruit and vegetables, whole grains, fish, and poultry, and low intakes of red
meat, processed foods, sugar-sweetened beverages, and
starchy foods were associated with a reduced risk and a
later development of type 2 diabetes.
Obesity pandemic represents a major health burden.
In Canada, 26% of the adults were considered obese
according to their body mass index (BMI) and when
considering waist circumference, 37% were abdominally
obese [8]. Obesity is closely related to insulin resistance
[9]. However, the link between these two conditions is
not well understood. Studying metabolites may help in
further understanding the effects of diets, drugs and
diseases at the cellular level and enhance our comprehension of the development of complex diseases such as
type 2 diabetes (or insulin resistance) [10]. A few studies
have investigated metabolic signatures in relation to
insulin sensitivity or obesity [11-14]. For example,
Newgard et al. [12] have observed a metabolic signature including branched-chain amino acids (BCAA)
and short-chain acylcarnitines (ACs) among obese and
insulin resistant individuals. These observations have
also been replicated in Chinese and Asian-Indian individuals where a metabolic signature characterised by
higher concentrations of amino acids (AAs) such as
leucine/isoleucine, phenylalanine, tyrosine and methionine was also associated with insulin resistance [13].
Other studies observed the effects of dietary variables
on metabolic signatures including ACs. For example,
the effects of a lactovegetarien diet versus an omnivorous
diet, the intake of fruits and vegetables, coffee and garlic
intakes and hypocaloric dieting were studied [15-17]. Dietary patterns derived from cluster analysis have also been
associated with specific metabolites [18].
To our knowledge, the metabolic signatures associated
with the Western and the Prudent dietary patterns have
never been studied. Therefore, the objective of this study
was to investigate the metabolic signatures, composed of
AAs and ACs derived from PCA, associated with the
Western and the Prudent dietary patterns in a sample of
overweight men and women. Associations between the
Western dietary pattern and principal components (PCs)
were observed.
Methods
Subjects
A total of 254 subjects were recruited to participate in this
clinical trial from the greater Quebec City metropolitan
Page 2 of 9
area between September 2009 and December 2011 through
advertisements in local newspapers as well as by electronic messages sent to university students/employees.
To be eligible, subjects had to be non-smokers and free
of any thyroid or metabolic disorders requiring treatment
such as diabetes, hypertension, severe dyslipidemia,
and coronary heart disease. Participants had to be aged
between 18 and 50 years with a BMI between 25 and
40 Kg/m2. The subjects who had taken n-3 polyunsaturated fatty acid supplements during the six months
preceding the study were excluded. A total of 210 subjects completed the study protocol which is described
elsewhere [19] and were included in this cross-sectional
study. All participants gave written informed consent and
the experimental protocol was approved by the ethics
committees of Laval University Hospital Research Center
and Laval University. This trial was registered at clinicaltrials.gov as NCT01343342.
Dietary assessment and food grouping
Dietary assessment and food grouping has been previously described [20]. Briefly, dietary intake of the past
month was determined by a 91-items validated food frequency questionnaire (FFQ) [21] based on food habits
of Quebecers, administered by a registered dietitian (RD).
All the information was compiled and similar food items
from the FFQ were grouped, as previously described [22].
Three criteria were used to form these groups: first, the
similarity of nutrient profiles, second, the culinary usage
of different types of food (similar to groups used in a previous study [23]) and third, the consideration of groups
utilized in other studies to maintain consistency [1]. Food
items from only thirty-five food groups were consumed by
the participants in the present study. From these thirtyfive food groups, eight were not normally distributed even
after logarithmic transformation and were excluded as
well. Consequently, twenty-seven foods groups were used
for PCA to generate dietary patterns as described previously [20]. Briefly, two main dietary patterns were derived
from PCA analysis. The Prudent dietary pattern, characterized by higher intakes of vegetables, fruits, whole
grain products, non-hydrogenated fat and lower intakes
of refined grain products, and the Western dietary pattern, associated with higher intakes of refined grain
products, desserts, sweets and processed meats [20].
Metabolite profiling
The Biocrates Absolute IDQ p150 (Biocrates Life Sciences
AG, Austria) mass spectrometry method was used to
quantify 163 metabolites for the first 40 of the 254 participants. Three participants were excluded because of
extreme values (standard out of range), resulting in 37
participants. For this study ACs and AAs were the main
focus thus, 41 ACs (ACx:y, where x denotes the number
Bouchard-Mercier et al. Nutrition Journal 2013, 12:158
http://www.nutritionj.com/content/12/1/158
of carbons in the side chain and y the number of double
bonds) and 14 AAs (proteinogenic + ornithine) were
studied. Assays used 10 μL of plasma from each subject.
The metabolite profiling was carried out according to the
manufacturer's instructions at CHENOMX (Edmonton,
AL, Canada). For all analyzed metabolites the concentrations are reported in μM. Furthermore, metabolites with
standard out of range and/or for which more than half
of the values were below the limit of detection were
excluded. Thus, 29 ACs and 13 AAs were included in
the analyses.
Statistical analyses
Variables which were not normally distributed were logarithmically transformed. The distribution of glutaconyl-Lcarnitine (C5_1_DC) was still not normally distributed
after logarithmic transformation and thus was excluded
from further analyses. The FACTOR procedure from
Statistical Analysis Software (SAS) using PCA method
was used to derive PCs describing metabolite signatures. Newgard et al. [11] described two main PCs when
studying ACs and AAs which explained most of the
variance in their data. In the present study, in order to
determine the number of factors to retain, components
with eigenvalue > 1, values at Scree test, variance explained (%) and the interpretability were considered. It
was noticed that PC1 and PC2 had eigenvalues much
higher (~8 and ~6, respectively) than the other PCs
(<~3). Thus, the NFACTORS statement was added in
the proc FACTOR procedure in order to retain only 2
main PCs and explain a maximum of variance. Metabolites with absolute factor loadings ≥ 0.50 were regarded
as significant contributors to the PC. Using the SCORE
procedure of SAS, each participant was given a score
for each PC. These scores are calculated from the sum
of metabolic signature groups multiplied by their respective factor loading. These scores reflect the degree
of each participant’s metabolic signature conforming
to PC1 and PC2.
Pearson correlations were used to detect associations
between the Prudent and the Western dietary pattern
scores with PC1 and PC2 scores. To further understand
the relationships with PC1 and PC2 scores and dietary
variables, partial correlations were performed with individual food groups (only the food groups which contributed
to Prudent and Western dietary patterns) and macronutrients (expressed as energy percentages) adjusted for age,
sex, BMI and energy intakes (only for the food groups).
To facilitate interpretation, Prudent and Western dietary
pattern scores as well as with food groups and macronutrients intakes were divided according to tertiles and associations with PC1 and PC2 were tested using the General
Linear Model procedure implemented in SAS. A p-value
<0.05 was considered significant. All statistical analyses
Page 3 of 9
were performed using SAS statistical software version 9.3
(SAS Institute, Inc., Cary, NC, USA).
Results
Descriptive characteristics and dietary patterns
Descriptive characteristics of the study participants are
presented in Table 1. As described previously, there were
two dietary patterns derived in this cohort, the Prudent
and the Western dietary patterns [20]. The Prudent
dietary pattern was characterised by high intakes of vegetables, fruits, whole grain products, non-hydrogenated
fats and inversely associated with refined grain products
food group and the Western dietary pattern by high
intakes of refined grain products, desserts, sweets and
processed meats [20]. In Table 2, dietary intakes, AC
and AA concentrations according to dietary pattern
score (low ≤ 0 or high > 0) are shown respectively for the
Prudent and the Western dietary patterns. Individuals
with high scores for the Prudent dietary pattern had lower
saturated fat intakes than individuals with low scores. The
opposite was observed for the Western dietary pattern
scores. Regarding the associations between dietary patterns and cardiovascular disease risk factors, only a trend
was observed for lower fasting insulin levels with higher
scores for the Prudent dietary pattern (r = −0.32, p = 0.07).
A positive association between fasting glucose levels
and the Western dietary pattern was observed (r = 0.38,
p = 0.03).
Principal component analysis of the metabolites
PC1 explained 7.97% of the variance in the data and PC2,
5.81%. As presented in Figure 1, PC1 was composed
mostly of medium- to long-chain ACs (C16:2, C14:2,
C14:2-OH, C16, C14:1-OH, C14:1, C10:2, C5-DC/C6-OH,
Table 1 Descriptive characteristics of the study
participants
Variables
Age (years)
Sex (men/women)
All participants (n = 37)
34.59 ± 9.16
16/21
BMI (Kg/m2)
29.69 ± 4.17
Waist circumference (cm)
93.46 ± 11.89
Systolic blood pressure (mmHg)
108.03 ± 8.67
Diastolic blood pressure (mmHg)
71.89 ± 8.57
Fasting glucose (mmol/L)
5.01 ± 0.74
Fasting insulin (pmol/L)
84.57 ± 34.78
Total-C (mmol/L)
5.29 ± 1.35
LDL-C (mmol/L)
3.18 ± 1.13
HDL-C (mmol/L)
1.46 ± 0.48
Triglycerides (mmol/L)
1.43 ± 0.93
ApoB (g/L)
0.96 ± 0.30
Means ± SD.
Bouchard-Mercier et al. Nutrition Journal 2013, 12:158
http://www.nutritionj.com/content/12/1/158
Page 4 of 9
Table 2 Dietary intakes and plasma AC and AA according to dietary pattern score
Low Prudent (≤0)
(n = 20)
High Prudent (>0)
(n = 17)
P-value1
Low Western (≤0)
(n = 16)
High Western (>0)
(n = 21)
P-value1
Dietary intakes
Carbohydrate (%)
49.38 ± 5.99
50.48 ± 6.37
0.35
51.91 ± 7.21
48.35 ± 4.73
0.35
Protein (%)
17.14 ± 2.78
18.46 ± 2.26
0.20
18.20 ± 2.66
17.40 ± 2.58
0.43
Total fat (%)
32.57 ± 6.15
31.93 ± 4.19
0.56
30.52 ± 5.89
33.61 ± 4.45
0.29
Saturated fat (%)
11.41 ± 1.83
9.55 ± 2.11
0.004
9.11 ± 2.08
11.65 ± 1.47
0.0006
Monounsaturated fat (%)
13.24 ± 3.06
13.48 ± 2.04
0.92
12.83 ± 2.98
13.75 ± 2.28
0.81
Polyunsaturated fat (%)
5.30 ± 1.53
6.24 ± 1.30
0.07
5.97 ± 1.57
5.55 ± 1.44
0.17
329.88 ± 167.61
357.86 ± 188.90
0.84
263.76 ± 167.15
402.92 ± 160.78
0.07
19.38 ± 4.83
30.43 ± 7.03
<0.0001
25.71 ± 7.53
23.51 ± 8.54
0.31
C0
25.16 ± 5.07
27.50 ± 7.09
0.24
23.78 ± 6.73
28.10 ± 4.97
0.24
C2
5.55 ± 1.36
5.20 ± 1.55
0.57
5.33 ± 1.48
5.44 ± 1.44
0.76
C3
0.36 ± 0.14
0.29 ± 0.10
0.04
0.30 ± 0.12
0.34 ± 0.13
0.95
C4
0.18 ± 0.06
0.16 ± 0.07
0.44
0.16 ± 0.08
0.18 ± 0.05
0.46
C4:1-DC/C6
0.05 ± 0.01
0.06 ± 0.02
0.08
0.05 ± 0.02
0.05 ± 0.02
0.39
C5
0.11 ± 0.04
0.11 ± 0.03
0.64
0.10 ± 0.03
0.12 ± 0.04
0.39
C5-DC/C6-OH
0.01 ± 0.00
0.02 ± 0.00
0.01
0.01 ± 0.01
0.01 ± 0.00
0.62
C8:1
0.14 ± 0.08
0.12 ± 0.06
0.63
0.12 ± 0.08
0.13 ± 0.07
0.83
C10
0.16 ± 0.07
0.22 ± 0.13
0.07
0.17 ± 0.09
0.20 ± 0.11
0.47
C10:2
0.02 ± 0.01
0.03 ± 0.01
0.11
0.02 ± 0.01
0.03 ± 0.01
0.12
C12
0.06 ± 0.03
0.08 ± 0.03
0.06
0.06 ± 0.03
0.08 ± 0.03
0.31
Cholesterol (mg)
Total fiber (g)
Acylcarnitines (ACs)
C14:1
0.17 ± 0.03
0.21 ± 0.09
<0.05
0.19 ± 0.08
0.19 ± 0.07
0.95
C14:1-OH
0.01 ± 0.00
0.01 ± 0.01
0.54
0.01 ± 0.01
0.01 ± 0.01
0.41
C14:2
0.03 ± 0.01
0.04 ± 0.02
0.02
0.03 ± 0.02
0.03 ± 0.02
0.89
C14:2-OH
0.01 ± 0.00
0.01 ± 0.01
0.19
0.01 ± 0.00
0.01 ± 0.00
0.63
C16
0.08 ± 0.02
0.08 ± 0.04
0.37
0.07 ± 0.03
0.08 ± 0.03
0.45
C16:2
0.01 ± 0.00
0.01 ± 0.01
0.19
0.01 ± 0.00
0.01 ± 0.01
0.65
C18:2
0.04 ± 0.01
0.05 ± 0.01
0.002
0.04 ± 0.01
0.04 ± 0.01
0.42
Amino acids
xleucine
183.95 ± 46.81
161.29 ± 26.70
0.03
152.94 ± 21.48
189.24 ± 44.08
0.03
Methionine
28.37 ± 5.14
26.54 ± 4.32
0.05
24.25 ± 4.23
30.02 ± 3.60
0.0004
Arginine
99.91 ± 32.87
95.81 ± 23.14
0.64
93.54 ± 27.05
101.44 ± 29.76
0.79
Phenylalanine
48.18 ± 8.10
46.56 ± 4.91
0.31
43.86 ± 4.55
50.16 ± 7.02
0.007
Proline
167.32 ± 58.74
157.68 ± 39.76
0.47
154.47 ± 44.03
169.30 ± 55.06
0.89
Ornitine
49.06 ± 17.18
52.61 ± 15.80
0.48
45.44 ± 17.75
54.69 ± 14.51
0.33
Histidine
93.59 ± 20.35
93.79 ± 13.96
0.94
93.55 ± 16.26
93.78 ± 17.74
0.65
Means ± SD.
1
P-values of the GLM models are adjusted for age, sex and BMI.
P-values in bold were considered significantly different.
C12, C18:2, C10, C4:1-DC/C6, C8:1 and C2) whereas PC2
was mainly composed of AAs and short-chain ACs (xLeu,
Met, Arg, Phe, Pro, Orn, His, C0, C3, C4 and C5).
The Prudent dietary pattern was not correlated neither to PC1 nor to PC2 (r = −0.19, p = 0.26 and r = −0.21,
p = 0.21, respectively). The Western dietary pattern, was
correlated with PC2 (r = 0.34, p = 0.04). When further adjusted for the effects of age, sex and BMI, both PCs were
associated with the Western dietary pattern. The Western
dietary pattern correlated negatively with PC1 and positively with PC2 (r = −0.34, p = 0.05 and r = 0.38, p = 0.03,
respectively). To further explore the association between
Bouchard-Mercier et al. Nutrition Journal 2013, 12:158
http://www.nutritionj.com/content/12/1/158
Page 5 of 9
C9
Thr
C16:2
1
C14:2
Gly
C14:2-OH
C16
C18
C14:1-OH
Tyr
C14:1
0.5
Trp
C10:2
Val
C5-DC/C6-OH
C5
C12
0
C0
C18:2
His
C10
-0.5
Orn
C4:1-DC/C6
Pro
C8:1
Phe
C2
C4
C18:1-OH
Arg
C18:1
Met
C5:1
C3
C6:1
xLeu
Ser
C5-M-DC
C3-DC/C4-OH
C3:1
C4:1
Figure 1 ACs and AAs associated with PC1 and PC2. Metabolites with absolute factor loadings ≥ 0.50 were regarded as significant
contributors to the PC. The blue line and squares represent PC1 and the red line and squares represent PC2.
the Western dietary pattern and PCs, subjects were divided into tertiles according to the Western dietary
pattern score. The relationships between tertiles of the
Western dietary pattern and PC1 and PC2 scores were
not significant (p = 0.10 and p = 0.15, respectively).
In order to achieve a better understanding of the impact of dietary variables on the metabolic signature, the
possible correlations between each dietary variable
(food groups contributing either to Prudent or Western
dietary pattern and macronutrient intake (expressed in
energy percentages)) and the scores for each PC were
tested (adjusted for age, sex, BMI and energy intakes
(only for food groups)), as presented in Table 3. Briefly,
PC1 was not correlated with any food groups. PC2 was
negatively correlated with fruit intake and positively associated with dessert intake (r = −0.38, p = 0.03 and r = 0.37,
p = 0.04, respectively) adjusted for age, sex, BMI and energy intakes. For the macronutrients, expressed as energy
percentages, a positive association for PC2 with total fat
and saturated fat intakes was observed (r = 0.39, p = 0.02
and r = 0.50, p = 0.003, respectively). Interestingly, when
dietary total fat, saturated fat, fruit and dessert were divided into tertiles, only saturated fat intake tertiles were
different according to PC2 scores (Figure 2) (p = 0.01). As
shown in Figure 2, saturated fat intakes ≤ 11.30% had
negative PC2 scores, which indicate that their metabolic
signature was not corresponding to PC2 characterised by
higher concentrations of ACs and short-chain AAs. PC1
did not correlate with any macronutrients. In Table 4, partial correlations between dietary pattern scores and each
AC and AA (only the metabolites which were associated
with a PC) are shown. The Prudent dietary pattern score
was positively associated with concentrations of C5-DC/
C6-OH (glutaryl-L-carnitine) and C18:2 (octadecadienylL-carnitine). The Western dietary pattern score was positively associated with methionine and phenylalanine.
Dietary intakes and individual metabolites
To further explore the impact of dietary intakes on metabolites, partial correlations were tested for each metabolite.
Briefly, intakes of vegetables and fruits were positively associated with C18:2 (octadecadienyl-L-carnitine) (r = 0.49,
p = 0.004, for both) and inversely associated with xleucine
(r = −0.35, p = 0.05, for both). Fruit intakes were also inversely associated with methionine (r = −0.40, p = 0.02).
The intakes of non-hydrogenated fats were positively associated with C14:1 (tetradecadienyl-L-carnitine) and C18:2
(octadecadienyl-L-carnitine) (r = 0.39, p = 0.02 and r =
0.46, p = 0.007, respectively) and inversely with histidine
(r = −0.42, p = 0.01). The intakes of dessert were positively
associated with three AAs, methionine, phenylalanine and
xleucine (r = 0.49, p = 0.004, r = 0.40, p = 0.02 and r = 0.38,
p = 0.03, respectively). The intake of sweets also was associated with methionine concentrations (r = 0.41, p = 0.02)
and with C18:1-OH (hydroxyoctadecenoyl-L-carnitine)
and C5:1-DC (glutaconyl-L-carnitine) (r = 0.37, p = 0.04
Bouchard-Mercier et al. Nutrition Journal 2013, 12:158
http://www.nutritionj.com/content/12/1/158
Page 6 of 9
Table 3 Partial correlations between metabolite PCs and
dietary pattern scores, food groups and macronutrient
intakes
Dietary variables
PC1
PC2
r
−0.18
−0.25
p1
0.31
0.15
r
−0.34
0.38
p1
0.05
0.03
r
−0.14
−0.12
p2
0.45
0.52
r
−0.13
−0.27
p
0.46
0.13
1.2
0.8
Dietary patterns
Western dietary pattern
0.6
Food groups
Processed meats
Vegetables
Whole grain products
Non-hydrogenated fats
Refined grain products
Desserts
Sweets
r
−0.10
−0.38
p2
0.59
0.03
r
−0.21
−0.24
p2
0.23
0.18
r
−0.02
−0.17
p2
0.93
0.34
r
−0.14
0.04
p2
0.43
0.85
r
−0.09
0.37
p2
0.60
0.04
r
−0.18
0.25
p2
0.32
0.16
r
0.23
0.39
p
0.20
0.02
r
0.11
0.50
p
0.52
0.003
r
0.28
0.28
p
0.10
0.10
r
0.06
0.07
Macronutrient intakes
Total fat (%)
1
Saturated fat (%)
1
Monounsaturated fat (%)
1
Polyunsaturated fat (%)
1
Protein (%)
Carbohydrate (%)
0.4
0.2
0
-0.2
-0.4
2
Fruits
PC2 score
Prudent dietary pattern
B
1
p
0.74
0.70
r
−0.00
−0.14
p1
0.99
0.42
r
−0.00
−0.29
p1
0.99
0.10
1
P-values are adjusted for age, sex and BMI.
2
P-values are adjusted for age, sex, BMI and energy intakes.
P-values in bold were considered significantly different.
and r = 0.42, p = 0.01, respectively). When observing macronutrient intakes, saturated fat intakes expressed as
energy percentages were positively associated with C5
(valeryl-L-carnitine) (r = 0.36, p = 0.04) and inversely with
C18:2 (octadecadienyl-L-carnitine) (r = −0.46, p = 0.006).
Monounsaturated fat intakes were positively associated
-0.6
A
AB
Tertile 1
Tertile 2
-0.8
Tertile 3
Figure 2 PC2 scores according to tertiles of saturated fat
intake. PC2 scores and tertile of saturated fat intake (means ± SE).
Means with different letters are significantly different. Means of
saturated fat intake according to tertiles: tertile 1 (4.72-10.13%, n = 12),
tertile 2 (10.29-11.30%, n = 13) and tertile 3 (11.51-14.72%, n = 12).
Tertile 1 versus tertile 3: p = 0.005. Tertile 1 versus tertile 2: p = 0.40.
Tertile 2 versus tertile 3: p = 0.05.
with C8:1 (octenoyl-L-carnitine) (r = 0.50, p = 0.003) and
inversely with C5-M-DC (methylglutaryl-L-carnitine)
(r = −0.42, p = 0.01). Polyunsaturated fat intakes were
also inversely associated with C5-M-DC (methylglutarylL-carnitine) (r = −0.35, p = 0.04) but as well with proline
concentrations (r = −0.35, p = 0.04) and positively associated with C10:2 (decadienyl-L-carnitine) (r = 0.37,
p = 0.03). Protein intakes expressed as energy percentages were associated with ornithine and histidine (r = 0.44,
p = 0.009 and r = 0.42, p = 0.01, respectively). The opposite
was observed for carbohydrate intakes which correlated inversely with ornithine concentrations (r = −0.55,
p = 0.0008).
Discussion
The Prudent and the Western dietary patterns from this
study had many similarities with the dietary patterns
described in the literature. The Prudent dietary pattern
is usually associated with high consumption of vegetables,
fruits and whole grain products whereas the Western dietary pattern relates to higher intakes of red and processed
meats, refined grain products and sweets [24]. In this
study, an association with higher fasting glucose was
observed among individuals with high scores for the
Western dietary pattern. Associations between dietary
patterns and type 2 diabetes have been frequently
observed and have been reviewed recently by Alhazmi
et al. [25].
PC1 was composed mainly of medium- to long-chain
ACs whereas PC2 was composed of short-chain ACs
and AAs including the BCAA xleucine and the aromatic
AA phenylalanine. Recent studies have shown a link
Bouchard-Mercier et al. Nutrition Journal 2013, 12:158
http://www.nutritionj.com/content/12/1/158
Page 7 of 9
Table 4 Partial correlations between dietary pattern
scores, ACs and AAs
Table 4 Partial correlations between dietary pattern
scores, ACs and AAs (Continued)
Acylcarnitines
Phenylalanine
C0
C2
C3
C4
C4:1-DC/C6
C5
C5-DC/C6-OH
C8:1
C10
C10:2
C12
C14:1
C14:1-OH
C14:2
C14:2-OH
C16
C16:2
C18:2
Prudent dietary pattern
Western dietary pattern
r
0.09
r
0.18
p
0.60
p
0.32
r
−0.05
r
0.07
p
0.76
p
0.68
r
−0.23
r
−0.02
p
0.20
p
0.92
r
−0.15
r
0.15
p
0.41
p
0.41
r
0.26
r
0.13
p
0.14
p
0.46
r
−0.26
r
−0.02
p
0.14
p
0.91
r
0.35
r
−0.06
p
0.04
p
0.74
r
−0.20
r
−0.10
p
0.25
p
0.56
r
0.16
r
0.22
p
0.36
p
0.20
r
0.19
r
0.30
p
0.29
p
0.08
r
0.18
r
0.32
p
0.32
p
0.07
r
0.27
r
0.06
p
0.12
p
0.73
r
0.07
r
0.11
p
0.69
p
0.52
r
0.28
r
0.08
p
0.11
p
0.67
r
0.20
r
0.05
p
0.27
p
0.78
r
0.18
r
0.13
p
0.30
p
0.47
r
0.15
r
0.09
p
0.39
p
0.62
r
0.51
r
−0.17
p
0.002
p
0.34
r
−0.33
r
0.30
p
0.06
p
0.08
r
−0.30
r
0.55
p
0.08
p
0.0008
r
−0.22
r
0.22
p
0.21
p
0.21
Amino acids
xleucine
Methionine
Arginine
Proline
Ornitine
Histidine
−0.13
r
0.39
p
0.46
p
0.02
r
−0.26
r
0.03
p
0.14
p
0.87
r
0.16
r
−0.02
p
0.37
p
0.92
r
−0.25
r
−0.17
p
0.16
p
0.34
r
P-values are all adjusted for age, sex and BMI.
P-values in bold were considered significantly different.
between plasma levels of certain AAs and the risk of
insulin resistance. Newgard et al. [12] have observed a
metabolic signature among obese individuals characterised
by a combination of BCAA, methionine, aromatic AAs
and short-chain ACs (C3 and C5) which was related to insulin resistance. It has also been observed that increased
levels of BCAA and aromatic AAs were associated with
the risk of developing future type 2 diabetes [26]. Laferrère
et al. [11] have studied the impact on ACs and AAs of
weight-loss induced by gastric bypass surgery or by a
hypocaloric diet. In their study, the first PC (mostly
medium- to long-chain ACs) was associated with improved insulin sensitivity and the second PC (mostly AAs
and short-chain ACs) was associated with an increase in
insulin resistance. The gastric bypass surgery was associated with a decrease in short-chain ACs: C3, C4-DC and
C5 ACs and AAs: alanine, leucine/isoleucine, phenylalanine and tyrosine. The ACs C3 and C5 have been
demonstrated to be, at least partly, the products of AAs
catabolism, especially BCAA (leucine/isoleucine and
valine), possibly indicating an increase in enzymes related to BCAA catabolism [12]. In this study, no correlations were observed between PCs and fasting insulin
or glucose levels. This could be due to the fact that the
individuals from this cohort were healthy as well as only
slightly overweight. Thus, their metabolic profile was
not deteriorated leading to too subtle differences to be
detected according to PCs scores.
Interestingly, scores for the Western dietary pattern
were inversely associated with PC1 (medium- to longchain ACs) and positively with PC2 (short-chain ACs
and AAs including the BCAA xleucine). Xu et al. [15]
compared the metabolite profile between a lactovegetarian diet with an omnivorous diet. Among the most different metabolites, there was glycine which was higher
among lactovegeterians and phenylalanine which was
lower among lactovegeterians compared to omnivorous
controls. The authors hypothesised that phenylalanine
concentrations may have been higher among the omnivorous group due to the intakes of animal proteins
Bouchard-Mercier et al. Nutrition Journal 2013, 12:158
http://www.nutritionj.com/content/12/1/158
which contain more phenylalanine than proteins from
vegetal sources. In our study, higher AAs levels in PC2
was not associated to an increase in total protein, animal
protein or vegetal protein intakes (data not shown). In
addition, protein intakes correlated positively with the Prudent dietary pattern and negatively with the Western dietary pattern. Thus, changes may be due to a modification
in rates of protein turnover or AA catabolism. Differences
in the expression of the enzyme responsible for BCAA
catabolism (branched-chain α-ketoacid dehydrogenase
(BCKD) complex) have been reported among obese rats
compared to their lean counterparts [27]. BCKD’s activity was reduced among obese rats and also among diet
induced obese mice, which were fed a diet containing
from 45% to 60% energy from fat [27]. May et al. [16]
have studied the effects on urine metabolomic profiles
of a diet devoid of fruits and vegetables compared to a
diet high in fruits and vegetables. They observed for the
group deprived with fruits and vegetables, higher concentrations of short- to medium-chain ACs and higher
concentrations of AAs and tricarboxylic cycle intermediates. They also hypothesised that these alterations could
be due to a shift from glucose utilisation to fatty acid betaoxidation. In our study, the Western dietary pattern was
inversely associated with vegetable consumption (data not
shown) and with a PC (PC2) characterised by higher concentrations of four short-chain ACs and seven AAs. In
addition, an inverse association between fruit consumption
and PC2 was observed in the present study. Thus, it seems
that low fruit and vegetable intakes may be associated with
a metabolic signature characterised by higher levels of
shorter chain ACs and AAs.
When further examining the relationships between
food groups and PCs, the most important correlation
was observed between saturated fat intakes and PC2.
Mechanisms behind these relations are unknown. Saturated fat intakes have been shown to be less potent activators than polyunsaturated fatty acids of an important
transcription factor regulating fatty acid beta-oxidation,
peroxisome proliferator-activated receptor alpha (PPARA)
[28]. It has also been observed that oleate, compared to
palmitate, the main saturated fat from the diet, increased
mitochondrial fatty acid beta-oxidation [29]. However,
other studies have reported the opposite. Stephenson et al.
[30] have observed that among rats fed a «Western» diet
(higher in fat, saturated fat and sucrose intakes) the activity of several mitochondrial enzymes involved in fatty
acid beta-oxidation was increased. These discrepancies
may be dependent of the overall effect of diet. Saturated
fat alone may not have the same effect on fuel selection
than when consumed in conjunction with higher intakes
of sugary foods. In rat models, it has been observed
that in long term, the rats fed a diet high in saturated
fat and sucrose developed more severe symptoms of
Page 8 of 9
the metabolic syndrome than rats fed diets either high
in saturated fat or high in sucrose alone [31].
Even though this cohort was generally healthy, differences in metabolic signatures have been observed and
may be indicative of a higher or lower risk of future cardiometabolic diseases. A strength of this study is the
analysis of dietary intakes grouped in dietary patterns
from FFQ which represents real life intakes. Obviously,
functional analyses are needed to understand underlying mechanisms behind these associations between
dietary patterns and ACs and AAs concentrations in the
plasma. One limitation of this study could come from
the use of PCA. Results could be sample specific and
strongly affected by subjective analytic decisions [1].
Nevertheless, to minimize subjectivity and allow data to
be used in other studies, eigenvalue, Scree test and the
literature were examined before selecting the number of
PCs and for the dietary patterns, data from previous
studies were also considered for food grouping.
Conclusion
In conclusion, the results of the present study indicate a relationship between the Western dietary pattern and saturated fat intakes with a metabolic signature characterised
by higher levels of short-chain ACs and AAs including
BCAA and an aromatic AA. Individuals eating according
to the Western dietary pattern or with high saturated fat
intakes may increase their long term risk of cardiometabolic diseases possibly via small metabolic alterations.
Abbreviations
AA: Amino acid; AC: Acylcarnitine; Arg: Arginine; BCAA: Branched-chain amino
acid; BCKD: Branched-chain α-ketoacid dehydrogenase; BMI: Body mass index;
FFQ: Food frequency questionnaire; His: Histidine; Met: Methionine;
Orn: Ornitine; PC: Principal component; PCA: Principal component analysis;
Phe: Phenylalanine; PPARA: Peroxisome proliferator-activated receptor;
Pro: Proline; RD: Registered dietitian; SAS: Statistical analysis software;
xLeu: xleucine.
Competing interests
The authors declare that they have no competing interest.
Authors’ contributions
IR, SL, PC, and MCV designed research; ABM conducted research with the
research professionals; IR, SL, PC and MCV provided essential reagents or
provided essential materials; ABM analyzed data and performed statistical
analysis; ABM wrote paper; ABM, IR, SL, PC and MCV had primary responsibility
for final content; All authors read and approved the final manuscript.
Acknowledgments
This research would not have been possible without the excellent
collaboration of the participants. We would like to thank Hubert Cormier,
Véronique Garneau, Alain Houde, Catherine Ouellette, Catherine Raymond,
Élisabeth Thifault and the nurses, Danielle Aubin and Steeve Larouche, for
their participation in the recruitment of the participants, the study
coordination and the data collection.
ABM is supported by a studentship from the Fonds de recherche en santé
du Quebec (FRQS) and by a Canadian Institutes of Health Research (CIHR)
Frederick Banting and Charles Best Canada Graduate Scholarships Doctoral
Awards (201210GSD-304012-190387), and MCV is Tier 1 Canada Research
Chair in Genomics Applied to Nutrition and Health. This work was supported
by a grant from CIHR - MOP-110975.
Bouchard-Mercier et al. Nutrition Journal 2013, 12:158
http://www.nutritionj.com/content/12/1/158
Author details
1
Institute of Nutrition and Functional Foods (INAF), Laval University, 2440
Hochelaga Blvd., Quebec G1V 0A6, Canada. 2Department of Food Science
and Nutrition, Laval University, 2425 de l’Agriculture St, Quebec G1K 7P4,
Canada. 3Endocrinology and Nephrology, CHU de Québec Research Center,
2705 Laurier Blvd., Québec G1V 4G2, Canada.
Received: 16 September 2013 Accepted: 6 December 2013
Published: 11 December 2013
References
1. Newby PK, Tucker KL: Empirically derived eating patterns using factor or
cluster analysis: a review. Nutr Rev 2004, 62:177–203.
2. Bhupathiraju SN, Tucker KL: Coronary heart disease prevention: nutrients,
foods, and dietary patterns. Clin Chim Acta 2011, 412:1493–1514.
3. Yusof AS, Isa ZM, Shah SA: Dietary patterns and risk of colorectal cancer:
a systematic review of cohort studies (2000–2011). Asian Pac J Cancer
Prev 2012, 13:4713–4717.
4. Esmaillzadeh A, Kimiagar M, Mehrabi Y, Azadbakht L, Hu FB, Willett WC:
Dietary patterns, insulin resistance, and prevalence of the metabolic
syndrome in women. Am J Clin Nutr 2007, 85:910–918.
5. Schulze MB, Hoffmann K, Manson JE, Willett WC, Meigs JB, Weikert C, et al:
Dietary pattern, inflammation, and incidence of type 2 diabetes in
women. Am J Clin Nutr 2005, 82:675–684.
6. Heidemann C, Hoffmann K, Spranger J, Klipstein-Grobusch K, Mohlig M,
Pfeiffer AF, et al: A dietary pattern protective against type 2 diabetes in
the European Prospective Investigation into Cancer and Nutrition
(EPIC)–Potsdam Study cohort. Diabetologia 2005, 48:1126–1134.
7. Esposito K, Kastorini CM, Panagiotakos DB, Giugliano D: Prevention of type
2 diabetes by dietary patterns: a systematic review of prospective
studies and meta-analysis. Metab Syndr Relat Disord 2010, 8:471–476.
8. Janssen I: The public health burden of obesity in Canada. Can J Diabetes
2013, 37:90–96.
9. Abbasi F, Brown BW Jr, Lamendola C, McLaughlin T, Reaven GM:
Relationship between obesity, insulin resistance, and coronary heart
disease risk. J Am Coll Cardiol 2002, 40:937–943.
10. Ceglarek U, Leichtle A, Brugel M, Kortz L, Brauer R, Bresler K, et al:
Challenges and developments in tandem mass spectrometry based
clinical metabolomics. Mol Cell Endocrinol 2009, 301:266–271.
11. Laferrere B, Reilly D, Arias S, Swerdlow N, Gorroochurn P, Bawa B, et al:
Differential metabolic impact of gastric bypass surgery versus dietary
intervention in obese diabetic subjects despite identical weight loss.
Sci Transl Med 2011, 3:80re2.
12. Newgard CB, An J, Bain JR, Muehlbauer MJ, Stevens RD, Lien LF, et al:
A branched-chain amino acid-related metabolic signature that differentiates
obese and lean humans and contributes to insulin resistance. Cell Metab
2009, 9:311–326.
13. Tai ES, Tan ML, Stevens RD, Low YL, Muehlbauer MJ, Goh DL, et al:
Insulin resistance is associated with a metabolic profile of altered
protein metabolism in Chinese and Asian-Indian men. Diabetologia 2010,
53:757–767.
14. Newgard CB: Interplay between lipids and branched-chain amino acids
in development of insulin resistance. Cell Metab 2012, 15:606–614.
15. Xu J, Yang S, Cai S, Dong J, Li X, Chen Z: Identification of biochemical
changes in lactovegetarian urine using 1H NMR spectroscopy and
pattern recognition. Anal Bioanal Chem 2010, 396:1451–1463.
16. May DH, Navarro SL, Ruczinski I, Hogan J, Ogata Y, Schwarz Y, et al:
Metabolomic profiling of urine: response to a randomised, controlled
feeding study of select fruits and vegetables, and application to an
observational study. Br J Nutr 2013, 110:1760-1770.
17. Menni C, Zhai G, Macgregor A, Prehn C, Romisch-Margl W, Suhre K, et al:
Targeted metabolomics profiles are strongly correlated with nutritional
patterns in women. Metabolomics 2013, 9:506–514.
18. O'Sullivan A, Gibney MJ, Brennan L: Dietary intake patterns are reflected in
metabolomic profiles: potential role in dietary assessment studies.
Am J Clin Nutr 2011, 93:314–321.
19. Rudkowska I, Paradis AM, Thifault E, Julien P, Tchernof A, Couture P, et al:
Transcriptomic and metabolomic signatures of an n-3 polyunsaturated
fatty acids supplementation in a normolipidemic/normocholesterolemic
Caucasian population. J Nutr Biochem 2012, 24:54–61.
Page 9 of 9
20. Bouchard-Mercier A, Paradis AM, Rudkowska I, Lemieux S, Couture P, Vohl MC:
Associations between dietary patterns and gene expression profiles of
healthy men and women: a cross-sectional study. Nutr J 2013, 12:24.
21. Goulet J, Nadeau G, Lapointe A, Lamarche B, Lemieux S: Validity and
reproducibility of an interviewer-administered food frequency
questionnaire for healthy French-Canadian men and women.
Nutr J 2004, 3:13.
22. Paradis AM, Godin G, Perusse L, Vohl MC: Associations between dietary
patterns and obesity phenotypes. Int J Obes (Lond) 2009, 33:1419–1426.
23. Hu FB, Rimm E, Smith-Warner SA, Feskanich D, Stampfer MJ, Ascherio A,
et al: Reproducibility and validity of dietary patterns assessed with a
food-frequency questionnaire. Am J Clin Nutr 1999, 69:243–249.
24. Sherzai A, Heim LT, Boothby C, Sherzai AD: Stroke, food groups, and
dietary patterns: a systematic review. Nutr Rev 2012, 70:423–435.
25. Alhazmi A, Stojanovski E, McEvoy M, Garg ML: The association between
dietary patterns and type 2 diabetes: a systematic review and
meta-analysis of cohort studies. J Hum Nutr Diet 2013. Epub ahead of print.
26. Wang TJ, Larson MG, Vasan RS, Cheng S, Rhee EP, McCabe E, et al:
Metabolite profiles and the risk of developing diabetes. Nat Med 2011,
17:448–453.
27. Lackey DE, Lynch CJ, Olson KC, Mostaedi R, Ali M, Smith WH, et al:
Regulation of adipose branched-chain amino acid catabolism enzyme
expression and cross-adipose amino acid flux in human obesity. Am J
Physiol Endocrinol Metab 2013, 304:E1175–E1187.
28. Xu HE, Lambert MH, Montana VG, Parks DJ, Blanchard SG, Brown PJ, et al:
Molecular recognition of fatty acids by peroxisome proliferator-activated
receptors. Mol Cell 1999, 3:397–403.
29. Coll T, Eyre E, Rodriguez-Calvo R, Palomer X, Sanchez RM, Merlos M, et al:
Oleate reverses palmitate-induced insulin resistance and inflammation in
skeletal muscle cells. J Biol Chem 2008, 283:11107–11116.
30. Stephenson EJ, Camera DM, Jenkins TA, Kosari S, Lee JS, Hawley JA, et al:
Skeletal muscle respiratory capacity is enhanced in rats consuming an
obesogenic Western diet. Am J Physiol Endocrinol Metab 2012,
302:E1541–E1549.
31. Pranprawit A, Wolber FM, Heyes JA, Molan AL, Kruger MC: Short-term and
long-term effects of excessive consumption of saturated fats and/or
sucrose on metabolic variables in Sprague Dawley rats: a pilot study.
J Sci Food Agric 2013, 93:3191–3197.
doi:10.1186/1475-2891-12-158
Cite this article as: Bouchard-Mercier et al.: The metabolic signature
associated with the Western dietary pattern: a cross-sectional study.
Nutrition Journal 2013 12:158.
Submit your next manuscript to BioMed Central
and take full advantage of:
• Convenient online submission
• Thorough peer review
• No space constraints or color figure charges
• Immediate publication on acceptance
• Inclusion in PubMed, CAS, Scopus and Google Scholar
• Research which is freely available for redistribution
Submit your manuscript at
www.biomedcentral.com/submit


© Copyright 2026